Embed Size (px)
Citation preview
If Low-Income Blacks Are Given a Chance to Live in White Neighborhoods, Will They Stay?Examining Mobility Patterns in a Quasi-Experimental Program with Administrative Data
Stefanie DeLucaJohns Hopkins University
James E. RosenbaumNorthwestern University
Abstract
After describing the distinctive features of various policy models of residential mobility,we examine the long-term outcomes of the Gautreaux program. Administrative recordsprovide baseline characteristics for all participants, and we located recent addresses forover 99 percent of a random sample of 1,506 participants an average of 14 years afteroriginal placement.
Although 84 percent of the families made subsequent moves, the racial composition ofthe current address is strongly related to program placement, even among movers, andafter family attributes and premove neighborhood characteristics are controlled. Com-bined with our prior findings, these results suggest that residential mobility has anenduring, long-term impact on the residential locations of these families. Contrary tomodels that assume that families’ enduring preferences will quickly erase these moves,these results suggest the need for further research to consider whether mobility alterspreferences or structural barriers.
Keywords: Families and children; Mobility; Neighborhood
Given the many social problems associated with racial and economicsegregation, residential mobility has attracted considerable interestamong policy makers (Bobo 1989; Massey and Denton 1993; Wilson1987), and research has suggested some processes by which neighbor-hoods might affect individual outcomes (Briggs 1997; Galster andKillen 1995; Kleit 2001). While traditional project-based housing assis-tance programs tend to cluster large numbers of poor families in thesame location (Newman and Schnare 1997), residential mobility pro-grams move families from areas of concentrated poverty to placeswhere there is less poverty and where resources, role models, andopportunities may be better. Residential mobility has been seen as avaluable strategy for strengthening welfare policy and supporting work-ing families (Sard and Waller 2002).
Housing Policy Debate · Volume 14, Issue 3 305© Fannie Mae Foundation 2003. All Rights Reserved. 305
DeLuca_HPD_14_3.qxd 11/6/03 9:49 AM Page 305
306 Stefanie DeLuca and James E. Rosenbaum
Research on the early outcomes of residential mobility programs hasbeen very promising. However, the durability of residential mobility hasbeen questioned. Critics contend that disadvantaged families would beuncomfortable in more integrated locations and would not remainthere, that seeking to be with their own kind—other low-incomeblacks—they would move away from integrated areas, especially wherethey are a small minority (Clark 1991). Critics are not the only oneswith such concerns. One of the authors has repeatedly heard high-levelfederal government administrators and top executives at public housingagencies voice concern that such outcomes would occur.
This study examines the long-term outcomes of a residential mobilityprogram that began in 1976. Between 1976 and 1990, in Chicago’sGautreaux Assisted Housing Program, low-income black families wereassigned to various neighborhoods in the city or suburbs by a quasi-random procedure. This study examines the long-term effects of thesemoves on families’ residential location an average of 14 years after theywere originally placed.
This study is also distinctive in using administrative records. Previousresearch on the Gautreaux program used mailed surveys and in-personinterviews. While these surveys had response rates that are generallyconsidered acceptable (67 percent), anything short of a perfect responseraises potential ambiguities. By tracking down recent addresses of fam-ilies through a variety of sources and merging Gautreaux programrecords with this information, we can examine more recent neighbor-hood locations with a better response rate than most surveys and withfewer risks of mistaken reports.
Prior research
Most research on neighborhoods and residential mobility to datefocuses primarily on two topics: the neighborhood factors that affectwhere people choose to live and statistical analyses of the relationshipbetween neighborhood attributes and many life outcomes (Brooks-Gunn et al. 1997; Crane 1991). However, even after extensive statisticalcontrols, one cannot be certain what the direction of causality is orwhether unmeasured factors might influence observed relationships.The best way to separate these effects is through social programs inwhich families are assigned to neighborhoods, such as the long-termGautreaux program and the more recent multicity Moving to Opportu-nity (MTO) program. While housing mobility programs have been donein New York, North Carolina, Ohio, Tennessee, Texas, California, andmany other places (Peterson and Williams 1995), few locations have
Fannie Mae Foundation
DeLuca_HPD_14_3.qxd 11/6/03 9:49 AM Page 306
Will Low-Income Blacks Stay in White Neighborhoods? 307
offered the possibility for appropriate comparison groups that approxi-mate a social experiment.
As a result of a 1976 Supreme Court decision, the Gautreaux programallowed Chicago public housing residents (and those on the waiting list)to receive Section 8 housing certificates (or vouchers) and move to pri-vate-sector apartments either in mostly white suburbs or within thecity of Chicago. Between 1976 and 1998, over 7,000 families partici-pated, and more than half moved to the suburbs. Because of its design,the Gautreaux program presents an unusual opportunity to examinethe outcomes associated with helping low-income families move to bet-ter neighborhoods with better labor markets and better schools. Socio-economic and racial integration of neighborhoods is rare in the UnitedStates, so we generally do not know about the experiences of low-income blacks in middle-income white neighborhoods. Even when suchintegration exists, we suspect that low-income families that move intomiddle-income neighborhoods are exceptional people, so their subse-quent attainments reflect more about themselves than about the neigh-borhood effects.
Gautreaux participants circumvented the typical barriers to living inthe suburbs, not by their jobs, personal finances, or values, but by theiracceptance into the program and their quasi-random assignment to thesuburbs. The program assigned them to neighborhoods in a quasi-random fashion and gave them rent subsidies that allowed them to livein suburban apartments for the same cost as public housing, but didnot provide them with employment or transportation assistance. More-over, unlike the usual case of black suburbanization—working-classblacks living in working-class suburbs—Gautreaux permitted low-income blacks to live in middle-income white suburbs. Participantsmoved to more than 115 suburbs throughout the six counties surround-ing Chicago. Suburbs with a population that was more than 30 percentblack were excluded by the consent decree, and a few very high rentsuburbs were excluded by the funding limitations of Section 8certificates.
Prior research on the Gautreaux program comparing outcomes for fam-ilies moving to mostly white suburbs and outcomes for those moving tomostly black city neighborhoods has shown a significant relationshipbetween placement neighborhoods and subsequent employment andeducational attainment. A study of children found that by the time theywere young adults, those children who moved to the suburbs weremuch more likely to graduate from high school, attend college, attendfour-year versus two-year colleges, and (if they were not in college) tobe employed and to have jobs with better pay and with benefits
Housing Policy Debate
DeLuca_HPD_14_3.qxd 11/6/03 9:49 AM Page 307
308 Stefanie DeLuca and James E. Rosenbaum
(Rosenbaum 1995). Another study of 330 Gautreaux mothers foundthat suburban movers had higher employment rates than city moversand that the difference was especially large for adults who were unem-ployed before entering the program (Rosenbaum 1997).
According to a former high-level administrator at the U.S. Departmentof Housing and Urban Development (HUD), “The encouraging evi-dence from Gautreaux led to national legislation calling on HUD to testhousing mobility strategies further” (Turner 1998, 376). This led to theMTO program, which randomly assigned low-income families to low-poverty areas, to an open-choice Section 8 group, or to a control groupthat remained in high-poverty areas. MTO was explicitly designed asan experiment, with random assignment and pre- and postmove datacollection.
The long-term durability of such residential moves is not known. Thisarticle examines whether people placed in predominantly white sub-urbs stay there or move back to more racially homogenous areas simi-lar to the ones they lived in before. Even though residents are initiallyplaced in neighborhoods that are safer and provide more employmentand educational opportunities, they may not stay if they experiencetransition difficulties. After initially being placed in mostly white sub-urbs, do families return to city neighborhoods similar to those fromwhich they came?
In addition, we can ask whether the racial composition of the place-ment neighborhood has an effect on the later moves of these families.Prior studies have assumed that people have a set of endogenous pref-erences that make one neighborhood more desirable than another (Far-ley et al. 1978). For instance, Clark (1986, 1988, 1989, 1991) found thatboth blacks and whites wished to live in neighborhoods where theywere the predominant race and concluded that residential segregationwould remain high even if fair housing laws or other integrative hous-ing policies were in effect. More recent work suggests that whites stillprefer to live in neighborhoods with low minority concentrations(Emerson, Yancey, and Chai 2002).
Farley et al. (1994) explored residential segregation as a function of thepreferences of both blacks and whites in the “hypersegregated” city ofDetroit in 1976 and 1994. They found that in 1976, while most whiteswere uncomfortable in areas with more than a few black families, mostblacks said they would prefer to live in racially mixed areas, specificallythose in which there were at least 50 percent black residents. In fact,racially mixed neighborhoods appeared to be more popular with blacksthan all-black areas. However, despite the fact that white racial
Fannie Mae Foundation
DeLuca_HPD_14_3.qxd 11/6/03 9:49 AM Page 308
Will Low-Income Blacks Stay in White Neighborhoods? 309
residential preferences became more liberal between 1976 and 1992,black racial preferences shifted away from integration. Farley et al.’s(1978) early findings implied that people could be characterized as hav-ing certain fixed preferences. His later findings (Farley et al. 1994) indi-cate that preferences gradually change over a very long period, but thateven then, people can still be characterized as having certain durablepreferences. This approach does not consider the possibility that if fam-ilies are assigned to radically different neighborhoods, their preferencesmight change. While this study cannot explicitly examine preferences,it does examine whether subsequent moves are related to initial place-ments. Unlike research that focuses on self-expressed attitudes aboutlocational preference (Emerson, Yancey, and Chai 2002; Farley et al.1994), this study examines families’ actual behavior.
Another consideration is whether families’ suburban placement neigh-borhoods (and their more recent suburban locations) are actually com-parable to inner-city neighborhoods, rather than the “idyllic escapesfrom the stresses of urban life” we usually imagine them to be (Harris1999a, 2). Harris (1999a) contends that much of the academic rhetoricabout the success of minorities moving to the suburbs should be takenwith a grain of salt. His work shows that suburbs vary greatly withregard to socioeconomic status and that when minorities (specificallyHispanics and blacks) do live in the suburbs, more than 40 percent endup in suburbs with low socioeconomic status.1 These areas are not onlyconsiderably less advantaged than the middle or high suburbs, but onmany indicators, they are less advantaged than their central cities.
Besides focusing on racial preferences of blacks and whites, discussionsof the causes of residential segregation have also focused on structuralbarriers, particularly racial discrimination against blacks in the hous-ing market (Clark 1986; DeMarco and Galster 1993; Galster 1986,1992; Galster and Kenney 1988). For instance, Massey and Denton(1993) argue that blacks often experience discrimination in the housingmarket and that this leads to structural barriers, so they end up in pre-dominantly black locations (of course, anticipated discrimination mayalso alter preferences). Cronin and Rasmussen’s (1981) study of thenational voucher program shows that, when given a housing voucherallowing them to move to a wide variety of locations, low-income blackfamilies were more likely to move to places that closely resembled theirprevious disadvantaged, segregated neighborhoods, perhaps because ofsuch structural barriers.
Housing Policy Debate
1 Harris (1999a) uses several indicators of socioeconomic status to characterize suburbs,with “low suburbs” defined as areas where 25 percent of families are headed by a singlefemale, 18.3 percent are poor, 65 percent are high school graduates, 9.7 percent are col-lege graduates, and there is a mean family income of $40,272 (1996 dollars).
DeLuca_HPD_14_3.qxd 11/6/03 9:49 AM Page 309
310 Stefanie DeLuca and James E. Rosenbaum
The unique design of the Gautreaux program provides the opportunityto examine whether people’s subsequent residential moves (and per-haps their preferences) differ as a function of quasi-randomly assignedplacements. If people initially overcome structural barriers (and per-haps their own initial preferences), does that alter their subsequentmobility? We can explore whether these low-income black familiesmake later moves reverting to their original types of neighborhoods orwhether they end up in neighborhoods similar to those in which theprogram placed them. While we cannot study preferences, we canassume that if people become comfortable with the kind of neighbor-hood in which they grow up, they may develop segregated preferences;if these preferences are fixed attributes, then we would expect consider-able “regression to the mean.” Even after being quasi-randomly placedin new neighborhoods, families coming from mostly black urban neigh-borhoods may subsequently return to such areas, and structural con-straints will also contribute to these outcomes. However, it is possiblethat once families are exposed to areas they would have previouslyavoided because of fear or prejudice, they might change their prefer-ences and thus change their residential choices.
On the basis of the above considerations, we ask the followingquestions:
1. Where do Gautreaux program participants currently reside? Dosuburban movers remain in suburban neighborhoods, or do theyreturn to the city, as might be predicted by some prior research?
2. In terms of racial composition and other census characteristics, howdo the areas in which participants currently live compare with pre-move and placement neighborhoods? Are these suburban areasreally different from the inner-city neighborhoods they left?
3. To what extent do these families revert to areas with predominantlyblack residents?
4. Is the racial composition of placement neighborhoods related to thatof their recent neighborhoods, after previous individual attributesand premove neighborhood characteristics are controlled?
Since this residential mobility program aimed to move families to thesuburbs and to predominantly white areas, we will focus on whethertheir initial placements accomplished these goals in the long run orwhether families’ subsequent moves tended to reduce these efforts.
Fannie Mae Foundation
DeLuca_HPD_14_3.qxd 11/6/03 9:49 AM Page 310
Will Low-Income Blacks Stay in White Neighborhoods? 311
The Gautreaux program as a social experiment
Unlike MTO, the Gautreaux program was not designed as a socialexperiment, and it only approximates the required conditions for one.It has been criticized on three grounds.
First, families’ neighborhood assignments were quasi-random, but notexplicitly random. Apartment availability was determined by housingagents who did not deal with clients. Counselors offered clients units asthey became available according to clients’ position on a waiting list—regardless of location preference. Although clients could refuse an offer,only 5 percent did so, since they were unlikely to get another soon andhad only six months of program eligibility. As a result, placements canbe considered quasi-random. All studies have shown that familiesplaced in suburbs and cities were very similar in initial attributes,although they were not identical (Mendenhall, Duncan, and DeLuca2003; Rosenbaum 1995). While our analyses indicate a few statisticallysignificant suburb-city differences, we cannot be sure that they are sub-stantively important differences.2
Second, the program has been criticized as being selective. It tried toavoid overcrowding, late rent payments, and building damage by notadmitting families with more than three children, large debts, or unac-ceptable housekeeping. We have estimated that these three criteriaeliminated about one-third of housing project residents (Rosenbaum1995).
Housing Policy Debate
2 While Mendenhall, Duncan, and DeLuca (2003) find differences on three out of eightvariables, they use a restricted sample. Our best description of the program, using allfamilies for which we have geocoded census information (up to 1,472 families), allowscomparison of families placed in city and suburbs on nine variables. The differencesbetween the city and suburban movers are statistically significant on only two of thenine variables: premove violent crime and premove public housing. The differences onthese variables are 2.4 percent and 5.9 percent, respectively. In addition, the year-of-move variable is statistically significant (p = 0.043), which indicates that the programshifted to emphasize suburban placements over time, but says nothing about assign-ment procedures in any given year. When we restrict our sample to the research sub-sample (the 1,171 cases that we can locate many years after placement and that remainin the Chicago vicinity), we get two more significant differences, but limiting our exam-ination of program placement–related characteristics by what happens to families afterplacement is not the best test for whether the two groups were similar at placement.Such mixed findings make inferences ambiguous. Even MTO, which is explicitly randomassignment, shows similar mixed differences across assignment groups. For instance,the well-implemented Boston MTO study compared the personal attributes of experi-mental and control groups and finds 8 of 11 differences of 3 percent or larger (the ratiois over 9 percent in 5 of 11 variables [24 percent for one variable]; see table 7.1 in Goer-ing and Feins 2003). In sum, Gautreaux data indicate a few suburb-city differences. Incase these attributes indicate meaningful departures from random assignment, we con-trol for them in the multivariate analyses.
DeLuca_HPD_14_3.qxd 11/6/03 9:49 AM Page 311
312 Stefanie DeLuca and James E. Rosenbaum
Some critics have mistakenly inferred that the program lost 80 percentof applicants through attrition. Although only about 20 percent of the eligible applicants ended up moving through the program, self-selection appears to have been a small part of the attrition (Petersonand Williams 1995).3 Rather than self-selecting themselves not to par-ticipate in the program, many families were not offered a housing unitand thus were not given a chance to participate. There is no evidence toindicate that housing counselors were selective in making offers amongeligible families, and if they were, they would have violated the consentdecree.
Third, research on this program has been criticized as studying smallnumbers of cases and lacking indicators of premove attributes (Turner1998). That is true for the early studies before Turner’s (1998) review.The earliest study followed 163 families and a later one examined 330families, and neither had premove information (Rosenbaum 1995).Since then, one recent study merged Gautreaux program records withIllinois public aid administrative data. That study had premove familyinformation and could analyze 1,500 families out of a random sample of1,506 records (Rosenbaum and DeLuca 2000).4
The present study responds to this third criticism and adopts the samestrategy of using administrative data. These data also allow us to con-trol for baseline neighborhood data, in addition to family characteris-tics, and to analyze pre- and postmove information, with almost perfectresponse rates on large numbers of cases and little risk of nonresponseor response error.
Fannie Mae Foundation
3 As Peterson and Williams (1995) state, “A household could reject two units withoutlosing its certificate, but ninety-five percent of participating households accepted thefirst unit offered to them”(29). The major constraint contributing to this 20 percentwas the limited number of housing units available. Between 1976 and 1990, the pro-gram promised that housing units would be provided, but the program had difficulty in finding enough units for all eligible families, and many eligible families were notoffered units (Rubinowitz and Rosenbaum 2000).
4 According to this study, families that moved to neighborhoods with higher socioeco-nomic status were significantly less likely to be on public aid many years after mov-ing—public-aid rates went from 26 percent to 39 percent for families placed in thehighest- and lowest-quintile neighborhoods, with respect to the education level of thetract. Multivariate analyses find that the difference remains very strong and significanteven after controlling for years in the program, age, and premove public aid. Thisanalysis suggests that initial placement has a long-term effect on family outcome (pub-lic aid receipt) and that, at least for this outcome, the suburb/city distinction was notthe influence, but the underlying social composition of suburban and city neighbor-hoods was (Rosenbaum and DeLuca 2000).
DeLuca_HPD_14_3.qxd 11/6/03 9:49 AM Page 312
Will Low-Income Blacks Stay in White Neighborhoods? 313
Distinctive features of the Gautreaux model: Distant moves, littlechoice, race mix
Until recently, the Gautreaux program provided the main source of evi-dence about the effects of residential mobility. The MTO program wascreated based on this research (Turner 1998). Because MTO is explic-itly designed as a social experiment, recent research has rightly focusedon this program. In fact, however, Gautreaux and MTO represent dif-ferent models of residential mobility, which may have different out-comes, can operate by different processes, and may be affected bydifferent historical influences (e.g., labor market cycles). An experimentwith one form of residential mobility in one historical period is highlydesirable, but its findings may not always generalize to other models orperiods. Moreover, even though MTO is a superior social experiment,Gautreaux still offers some distinctive strengths for research. Distin-guishing between the two programs is useful to understand theresearch and policy contributions of each.
These two programs represent different models of neighborhoodeffects, and we can learn from each of them. First, while the Gautreauxtreatment group moved to distant suburbs that limit interaction withformer neighbors, the MTO treatment group often moved to city neigh-borhoods, sometimes clustered together or near poor neighborhoods.Second, while Gautreax assigned families to specific addresses, MTOassigned them to specific census tracts, and families could live any-where in those tracts. Maps of MTO placements appear to suggest thatsome moves occur near tract boundaries, perhaps to get affordablerents or to be closer to low-income neighbors (Goering 1997). Third,while Gautreaux creates both racial and income integration (suburbanmovers went to areas averaging 90 percent white populations), MTO isa program for income, not race, integration: 32 percent of MTO moversto low-poverty areas went to areas with a black majority. If families areaffected by attributes of places besides “low poverty” (e.g. race compo-sition, job opportunities), MTO does not systematically test thoseeffects.
Although these three factors—shorter moves, a family’s self-selection of addresses within tracts, and mixing of income, but not race—makeMTO more feasible than Gautreaux, they may allow families to beaffected by former or nearby low-income neighbors, possibly creatingsmaller neighborhood effects and underestimating the effects of otherkinds of residential mobility. Other models are also possible. InYonkers, NY, an explicit enclave model was implemented: Residents livein separate housing developments, but potentially benefit from theirmiddle-class community (Briggs 1997, 1998). “Gautreaux II,” a new
Housing Policy Debate
DeLuca_HPD_14_3.qxd 11/6/03 9:49 AM Page 313
314 Stefanie DeLuca and James E. Rosenbaum
program that has recently begun extending Gautreaux, providesanother model that requires racial integration, but allows more choiceand fewer distant moves. Each model has advantages and disadvan-tages (e.g., political feasibility, applicability, etc.), and researchers needto examine various models in order to understand the dynamics ofneighborhood effects.
Gautreaux and MTO also have distinctive features in research design.First, MTO was designed as an experiment, with random assignment,a no-change control group, and pre- and postmove data collection. Evi-dence suggests that Gautreaux approximates random selection, but itmay not be perfectly random, so it leaves uncertainties about the ini-tial comparability of suburban and city-mover groups. Second, whileMTO studies have focused on quantitative outcomes, not on mecha-nisms (Sampson, Morenoff, Gannon-Rowley 2002), Gautreaux researchhas included qualitative observations about the ways social contextaffects individual behaviors (Rosenbaum, DeLuca, and Tuck 2002;Rosenbaum, Reynolds, and DeLuca 2002). Third, while MTO is anewer program that allows the study of short-term outcomes,Gautreaux studies like ours can examine long-term effects 14 yearsafter placement.
Despite these distinctions, research has found similar results in the twoprograms. As mentioned earlier, prior research comparing outcomes forGautreaux families moving to mostly white suburbs versus those mov-ing to mostly black city neighborhoods has shown significant and posi-tive relationships between placement neighborhoods and subsequentemployment and educational attainment (Rosenbaum 1995, 1997;Rubinowitz and Rosenbaum 2000). The early results of the MTO pro-gram suggest that moves to low-poverty neighborhoods have led tosome important gains in some outcomes, including mother’s and chil-dren’s feelings of safety, mental and physical health, and children’sbehavior and education (e.g. Goering and Feins 2003; Hanratty,McLanahan, and Pettit 1997; Katz, Kling, and Liebman 1997; Ladd andLudwig 1997). MTO did not begin until the 1990s, so only short-termoutcomes are available.
The clearest conflicting findings are the absence of effects on employ-ment and public aid receipt in most MTO studies. While the Gautreauxsurvey found significant effects of moves on employment rates fiveyears after moving and on welfare receipt six years after moving, MTOresearch using control-group comparisons finds little difference be-tween experimental and control groups in employment, earnings, orwelfare receipt in three out of four cities (Goering and Feins 2003). It ishard to know whether the discrepancy is due to a different model of
Fannie Mae Foundation
DeLuca_HPD_14_3.qxd 11/6/03 9:49 AM Page 314
Will Low-Income Blacks Stay in White Neighborhoods? 315
residential mobility, a different economy, or a different time span.5 Inany case, no studies of either program have looked at long-term pat-terns of mobility, which are the focus here.
Data and methods
Family and baseline measures
We use a random sample of all female-headed families that moved withthe program between 1976 and 1990 (N = 1,506). We examine onlyfamilies moving before 1990 because after that, program rules changed;families searched for their own units and could no longer be consideredas allocated to their placement address in a quasi-random manner. Allfamily background measures are taken directly from program intakerecords gathered by the Leadership Council for Open MetropolitanCommunities. These include whether the head of household was receiv-ing Aid to Families with Dependent Children (AFDC) at the time ofprogram placement (dummy indicator), the number of family membersin the household (continuous variable), the year of the move between1976 and 1989 (continuous variable), the child’s age at the move (con-tinuous variable), and an indication of whether the family expressed apreference for a city or a suburban placement at program entry.6 Miss-ing data for the age of the youngest child was recoded to the mean, anda dummy indicator is included in the analyses to adjust for these cases.In addition to the family-level measures, program records included pre-move and placement street address as described next.
Housing Policy Debate
5 Some unexpected trends were evident in the MTO results: very large reductions inwelfare receipt and unemployment for all groups, including the control group (Balti-more, Boston, Los Angeles, and New York). One rarely sees low-income populationsshowing such dramatic improvements in employment, particularly in a “no-change”control group. These control group gains were probably the result of the extraordinar-ily strong labor market of the late 1990s and the new national welfare reform programTemporary Assistance to Needy Families (TANF). Since the labor market has cooled inrecent years, control group gains may subside, and residential mobility effects may bemore evident in later studies (unless TANF and labor market experience have anenduring impact).
6 Premove preferences are listed as dummy indicators interacting stated preference(city, suburb, or neither) and placement (city or suburb), with “no preference, cityplacement” as the reference group. Although program records indicate participants’“preference for city or suburb,” this variable is difficult to interpret. Given the limitednumber of housing units available in certain locations, participants’ reported prefer-ences might be distorted by their perceptions of what it takes to get a housing unit at a particular time (perhaps with a lag). We cannot know what preferences they wouldhave stated in different circumstances. We include this variable as a control, but wewould not know how much credibility to give to it if it turned out to be a significantinfluence, which mostly it did not.
DeLuca_HPD_14_3.qxd 11/6/03 9:49 AM Page 315
316 Stefanie DeLuca and James E. Rosenbaum
Premove neighborhood characteristics
We supplement program data with three continuous variables to char-acterize the neighborhoods indicated by premove address (percentblack in the census tract, mean family income in the census tract (perthousand dollars), and level of violent crime in the neighborhood7). Forcases missing data on premove neighborhood characteristics, the valueswere recoded to the mean, and dummy indicators are included in theanalyses to adjust for these cases. We also included data from theChicago Housing Authority to indicate whether the premove addresswas in a public housing project or whether it was not clear whether theaddress represented a public housing unit (dummy indicators with thereference group as premove address not in public housing).8
Racial composition of the placement neighborhood
To characterize the placement neighborhood, we matched the address toits 1980 census tract and interpolated the racial composition of this areabetween the 1970 and 1980 and 1980 and 1990 censuses, depending onthe year of the move (see appendix A).9 Although census tracts are
Fannie Mae Foundation
7 The crime data used to characterize premove and placement neighborhoods comefrom two sources, one for city neighborhoods and one for suburban neighborhoods,since these respective areas collect their data on different geographic units. Chicagocrime data come from the Chicago Police Department yearly reports and include thetotal number of murders, aggravated assaults, and criminal sexual assaults/rapesreported in each year. These data are collected for “community areas,” which had to becoded to roughly match census tract boundaries (the authors thank Ruby Mendenhall,Micere Keels, and Greg Duncan for this work). Crime data for areas of Illinois outsideof Chicago come from the Federal Bureau of Investigation’s Uniform Crime Reporting(UCR) records. UCR data are organized by reporting agencies and roughly correspondto towns and cities. We identified the names of the suburban towns and cities that par-ticipants lived in by using their ZIP codes.
8 The premove addresses were hand-coded to match the street address ranges for publichousing projects in Chicago. A portion of these addresses (7 percent) fall just outsidethe unit range or appear very close to public housing addresses. It is possible that thesefamilies were on the waiting list for public housing or living in disadvantaged non–public housing units in the surrounding area. Either way, we coded them separately.The reference group for this variable is “not in public housing premove”; these familieshad to be on the list and eligible for public housing to be qualified for the program.Often, such families were staying with family or friends in the interim. The authorsthank Brian Jacob for the public housing address data.
9 In the process of interpolating the data between 1980 and 1990, we lost many cases(10.7 percent) because some areas exist in one census period and not in another, a prob-lem that was especially relevant for the quickly growing suburban areas into which manyfamilies were placed. To deal with this issue, we used the 1980 data for the 1990 tractboundaries of those areas and indicated these cases with a dummy flag in the analyses.
DeLuca_HPD_14_3.qxd 11/6/03 9:49 AM Page 316
Will Low-Income Blacks Stay in White Neighborhoods? 317
somewhat larger and potentially more heterogeneous than what mostfamilies might consider a neighborhood, they are a reasonable indicatorfor area characteristics and vary a great deal over the six-county area inand around Chicago. The analyses are presented with the continuousplacement neighborhood black percent variable broken into six cate-gories (with the corresponding approximate sample percentage in paren-theses): 0 to 2 percent (28.3 percent, and used as the reference group inthe multivariate analyses), 2.1 to 5 percent (17.9 percent), 5.1 to 15 per-cent (18.2 percent), 15.1 to 50 percent (15.9 percent), 50.1 to 97 percent(9.0 percent), and 97.1 to 100 percent (10.8 percent). These categorieswere selected to meet two criteria—one statistical, one substantive. Thefirst four categories are close to quintiles, providing reasonable numbersof cases for analyses. The last quintile is split in half, to examine the dif-ferences that may result from placement in mostly black neighborhoodsversus highly segregated black neighborhoods (mostly city placements).By design, the program placed families into highly white and highlyblack areas, thus yielding a bimodal distribution on this variable. Thesecategories are sensitive to that distribution at both ends of the spectrum.
Most recent address and racial composition
Using a variety of sources, we located recent addresses on 1,504 of our1,506 families (99.9 percent), an average of 14 years since the move; of these, we could geocode 97.8 percent (1,472/1,504) (see appendix Bfor details on data collection procedures). We coded these addresses for census tract and merged information from the 1990 census for79.1 percent (1,165/1,472) of these. Thus, for most analyses, we wereable to examine the current locations of 98 percent of the people placedoriginally. It should be noted that 72 percent of those addresses are1996 to 1999, and 94 percent are 1993 or later (10 years after 1983, theaverage year of the move for the sample). This gives a broad period inwhich families could evidence residential change. Current neighbor-hood percent black is broken into five categories (with rounded relativesample distributions in parentheses): 0 to 30 percent (47.5 percent),30.1 to 50 percent (8.1 percent), 50.1 to 70 percent (5.8 percent), 70.1 to97 percent (12.5 percent), 97.1 to 100 percent (26.0 percent). Since theGautreaux consent decree defined areas with less than 30 percent blackcomposition as the integration goal, these breakdowns allow us toexamine how well that outcome was preserved over a long period (with70 percent chosen as the mirror image).10
Housing Policy Debate
10 While any distinction may seem arbitrary, there are few differences between lessthan 30 percent black and less than 50 percent black in our analyses, since only 8 percent of the sample ends up in the 30 to 50 percent range.
DeLuca_HPD_14_3.qxd 11/6/03 9:49 AM Page 317
318 Stefanie DeLuca and James E. Rosenbaum
Results
Descriptive analyses11
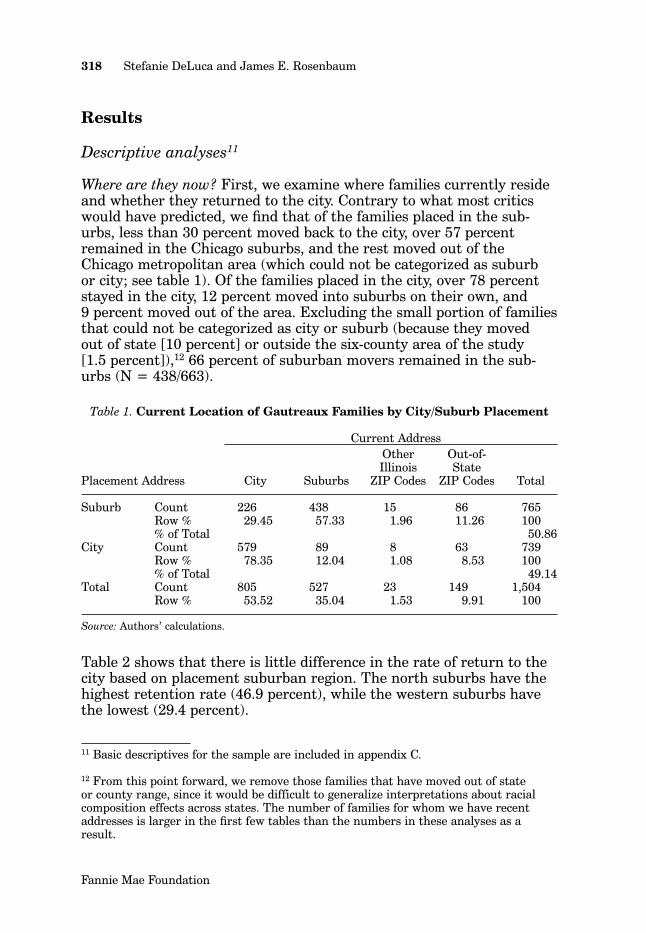
Where are they now? First, we examine where families currently resideand whether they returned to the city. Contrary to what most criticswould have predicted, we find that of the families placed in the sub-urbs, less than 30 percent moved back to the city, over 57 percentremained in the Chicago suburbs, and the rest moved out of theChicago metropolitan area (which could not be categorized as suburb or city; see table 1). Of the families placed in the city, over 78 percentstayed in the city, 12 percent moved into suburbs on their own, and 9 percent moved out of the area. Excluding the small portion of familiesthat could not be categorized as city or suburb (because they moved out of state [10 percent] or outside the six-county area of the study [1.5 percent]),12 66 percent of suburban movers remained in the sub-urbs (N = 438/663).
Table 1. Current Location of Gautreaux Families by City/Suburb Placement
Current AddressOther Out-of-Illinois State
Placement Address City Suburbs ZIP Codes ZIP Codes Total
Suburb Count 226 438 15 86 765Row % 29.45 57.33 1.96 11.26 100% of Total 50.86
City Count 579 89 8 63 739Row % 78.35 12.04 1.08 8.53 100% of Total 49.14
Total Count 805 527 23 149 1,504Row % 53.52 35.04 1.53 9.91 100
Source: Authors’ calculations.
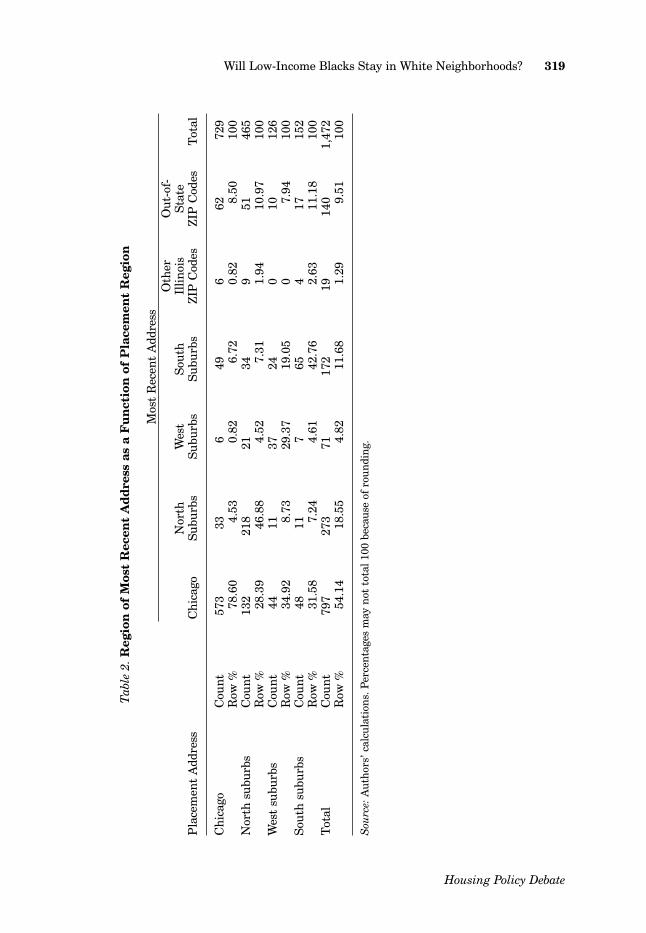
Table 2 shows that there is little difference in the rate of return to thecity based on placement suburban region. The north suburbs have thehighest retention rate (46.9 percent), while the western suburbs havethe lowest (29.4 percent).
Fannie Mae Foundation
11 Basic descriptives for the sample are included in appendix C.
12 From this point forward, we remove those families that have moved out of state or county range, since it would be difficult to generalize interpretations about racialcomposition effects across states. The number of families for whom we have recentaddresses is larger in the first few tables than the numbers in these analyses as aresult.
DeLuca_HPD_14_3.qxd 11/6/03 9:49 AM Page 318
Will Low-Income Blacks Stay in White Neighborhoods? 319
Tab
le 2
.Reg
ion
of
Mos
t R
ecen
t A
dd
ress
as
a F
un
ctio
n o
f P
lace
men
t R
egio
n
Mos
t R
ecen
t A
ddre
ssO
ther
Out
-of-
Nor
thW
est
Sout
hIl
linoi
sSt
ate
Pla
cem
ent
Add
ress
Chi
cago
Subu
rbs
Subu
rbs
Subu
rbs
ZIP
Cod
esZI
P C
odes
Tot
al
Chi
cago
Cou
nt
573
336
496
6272
9R
ow %
78.6
04.
530.
826.
720.
828.
5010
0N
orth
sub
urbs
Cou
nt
132
218
2134
951
465
Row
%28
.39
46.8
84.
527.
311.
9410
.97
100
Wes
t su
burb
sC
oun
t44
1137
240
1012
6R
ow %
34.9
28.
7329
.37
19.0
50
7.94
100
Sout
h su
burb
sC
oun
t48
117
654
1715
2R
ow %
31.5
87.
244.
6142
.76
2.63
11.1
810
0T
otal
Cou
nt
797
273
7117
219
140
1,47
2R
ow %
54.1
418
.55
4.82
11.6
81.
299.
5110
0
Sou
rce:
Aut
hors
’ cal
cula
tion
s. P
erce
nta
ges
may
not
tot
al 1
00 b
ecau
se o
f ro
undi
ng.
Housing Policy Debate
DeLuca_HPD_14_3.qxd 11/6/03 9:49 AM Page 319
320 Stefanie DeLuca and James E. Rosenbaum
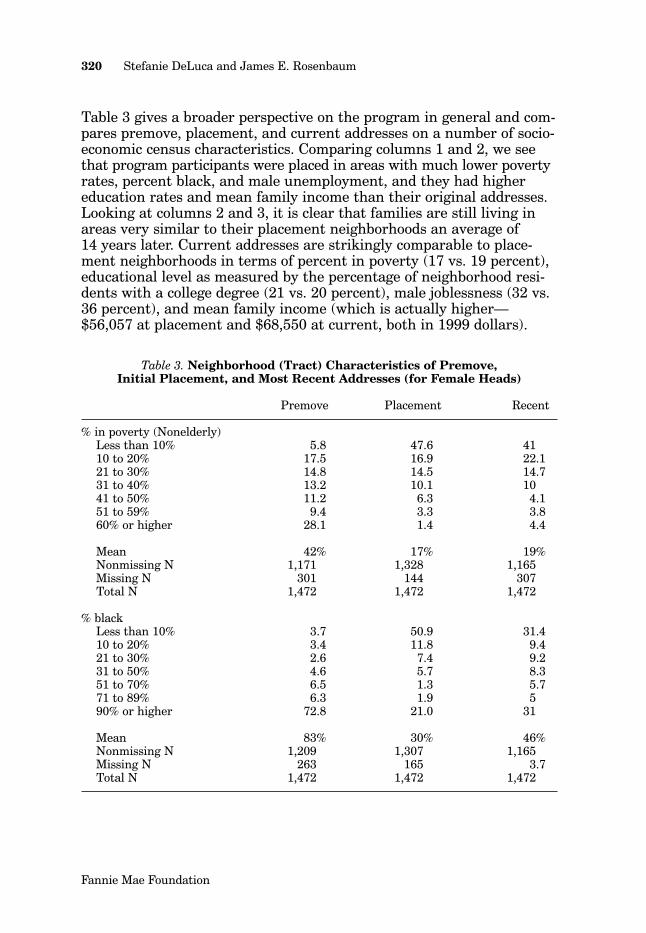
Table 3 gives a broader perspective on the program in general and com-pares premove, placement, and current addresses on a number of socio-economic census characteristics. Comparing columns 1 and 2, we seethat program participants were placed in areas with much lower povertyrates, percent black, and male unemployment, and they had highereducation rates and mean family income than their original addresses.Looking at columns 2 and 3, it is clear that families are still living inareas very similar to their placement neighborhoods an average of 14 years later. Current addresses are strikingly comparable to place-ment neighborhoods in terms of percent in poverty (17 vs. 19 percent),educational level as measured by the percentage of neighborhood resi-dents with a college degree (21 vs. 20 percent), male joblessness (32 vs.36 percent), and mean family income (which is actually higher—$56,057 at placement and $68,550 at current, both in 1999 dollars).
Table 3. Neighborhood (Tract) Characteristics of Premove, Initial Placement, and Most Recent Addresses (for Female Heads)
Premove Placement Recent
% in poverty (Nonelderly)Less than 10% 5.8 47.6 4110 to 20% 17.5 16.9 22.121 to 30% 14.8 14.5 14.731 to 40% 13.2 10.1 1041 to 50% 11.2 6.3 4.151 to 59% 9.4 3.3 3.860% or higher 28.1 1.4 4.4
Mean 42% 17% 19%Nonmissing N 1,171 1,328 1,165Missing N 301 144 307Total N 1,472 1,472 1,472
% blackLess than 10% 3.7 50.9 31.410 to 20% 3.4 11.8 9.421 to 30% 2.6 7.4 9.231 to 50% 4.6 5.7 8.351 to 70% 6.5 1.3 5.771 to 89% 6.3 1.9 590% or higher 72.8 21.0 31
Mean 83% 30% 46%Nonmissing N 1,209 1,307 1,165Missing N 263 165 3.7Total N 1,472 1,472 1,472
Fannie Mae Foundation
DeLuca_HPD_14_3.qxd 11/6/03 9:49 AM Page 320
Will Low-Income Blacks Stay in White Neighborhoods? 321
Table 3. Neighborhood (Tract) Characteristics of Premove, Initial Placement, and Most Recent Addresses (for Female Heads) (continued)
Premove Placement Recent
% of adults with college degreesLess than 10% 78.8 31.1 36.110 to 20% 8.2 17.8 23.421 to 30% 4.6 26.2 1731 to 40% 2.8 13.8 14.341 to 50% 1.3 4.6 4.151 to 59% 1.9 3.5 2.860% or higher 2.3 3.0 2.2
Mean 10% 21% 20%Nonmissing N 1,206 1,330 1,165Missing N 266 142 307Total N 1,472 1,472 1,472
Joblessness (% of males employedless than 6 months in past year)
Less than 20% 0.8 25.9 20.220 to 30% 4.4 24.5 22.131 to 40% 20.2 25.2 21.541 to 50% 19.8 9.2 16.351 to 59% 16.1 8.2 11.260% or higher 38.5 7.0 8.8
Mean 54% 32% 36%Nonmissing N 1,196 1,330 1,165Missing N 276 142 307Total N 1,472 1,472 1,472
Mean family income*Mean $26,765 $56,057 $68,550Standard deviation $15,424 $34,045 $31,023Nonmissing N 1,253 1,329 1,165Missing N 219 143 307Total N 1,472 1,472 1,472
Source: Authors’ calculations. Percentages may not total 100 because of rounding.*Numbers reflect 1999 dollars.
The only characteristic that differs substantially between the place-ment and current addresses is the mean percent black of each neigh-borhood. Given the program’s consent decree, families that were placedin suburban neighborhoods had to be placed in areas with no morethan 30 percent black residents (mean percent black was actually 10 percent in suburban placements). City movers went to places with a much higher percent black (mean city percent black 56 percent). Inthe current period, although the mean percent black of neighborhoodsincreases from placement, it is still only about half what it was at the
Housing Policy Debate
DeLuca_HPD_14_3.qxd 11/6/03 9:49 AM Page 321
322 Stefanie DeLuca and James E. Rosenbaum
original address. So while there is some evidence that postplacementfamilies moved to areas that had a slightly higher black composition,these areas are still far more integrated than their premove areas.
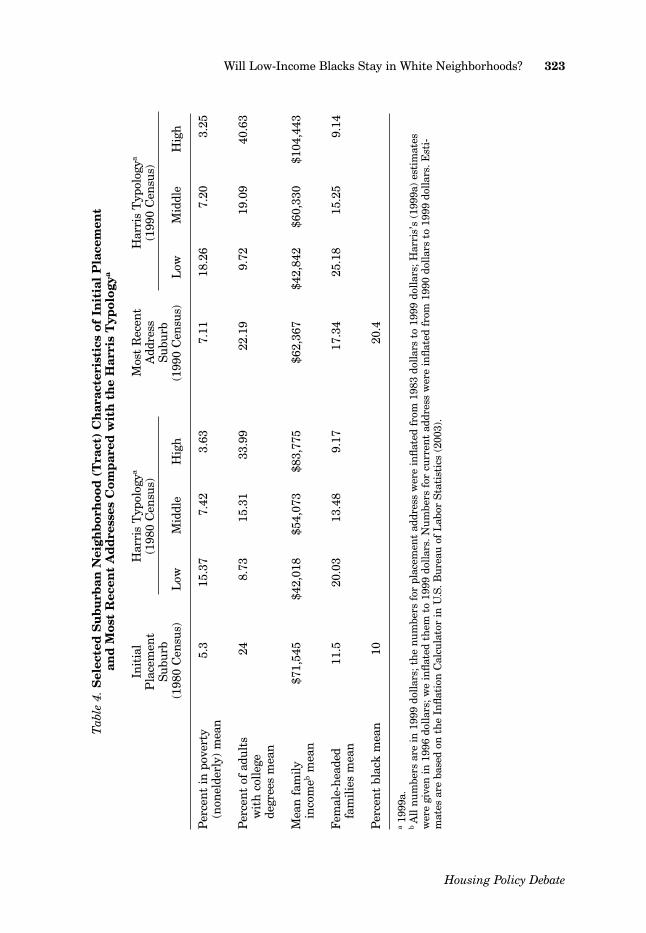
A suburb is a suburb. In addition, we test the hypothesis that most ofthe families that moved to or remained in the suburbs would end up inareas classified as “low” according to Harris’s (1999a) typology of allsuburbs in the nation. We used selected census characteristics to com-pare with those Harris used (1999a).13 As noted earlier, he cautionsagainst the city/suburb distinction, since over the past few decades,many suburbs have come to resemble central cities with regard tosocioeconomic disadvantage. Therefore, we examined the suburbanneighborhoods into which families were placed, as well as the addressesfor those currently living in the suburbs, according to an adaptation of the typology. This analysis tests Harris’s (1999a) claim that manyminorities who end up in suburban neighborhoods reside in the leastadvantaged ones.
Table 4 shows census characteristics for both the initial suburban place-ment neighborhood and the current suburban neighborhood.14 Along-side each of these are the corresponding neighborhood characteristicmeans from Harris (1999a). We compare our estimates for placementneighborhood with his estimates for the 1980 census period, and ourestimates for current neighborhood with his estimates from the 1990census period. At placement, suburban families were overwhelminglyassigned to suburban neighborhoods that would be classified as high to middle according to the typology, with most characteristics actuallycloser to high suburb values than middle. For example, Harris (1999a)classifies high suburbs as those with a poverty rate of 3.6 percent (lowsuburbs with 15.4 percent); on average, our sample was placed into sub-urban neighborhoods with 5.3 percent of the residents in poverty. Withregard to the percentage of female-headed families, his high suburbshave only 9.2 percent, and our sample was placed into suburban neigh-borhoods with 11.5 percent female-headed families.
Fannie Mae Foundation
13 We chose four out of the seven variables in the Harris (1999a) paper because thosewere variables for which we were confident we had comparable census measures. Thepaper does not include an appendix documenting which census variables he chose bynumber, so we used those that were the least ambiguous and the clearest indicators ofsocioeconomic status.
14 To obtain the means for placement neighborhood census characteristics, we interpo-lated data across the 1980 and 1990 censuses, according to the year of the move. Seeappendix A for more details.
DeLuca_HPD_14_3.qxd 11/6/03 9:49 AM Page 322
Will Low-Income Blacks Stay in White Neighborhoods? 323
Tab
le 4
.Sel
ecte
d S
ub
urb
an N
eigh
bor
hoo
d (
Tra
ct)
Ch
arac
teri
stic
s of
In
itia
l P
lace
men
t an
d M
ost
Rec
ent
Ad
dre
sses
Com
par
ed w
ith
th
e H
arri
s T
ypol
ogya
Init
ial
Har
ris
Typ
olog
yaM
ost
Rec
ent
Har
ris
Typ
olog
ya
Pla
cem
ent
(198
0 C
ensu
s)A
ddre
ss(1
990
Cen
sus)
Subu
rbSu
burb
(198
0 C
ensu
s)L
owM
iddl
eH
igh
(199
0 C
ensu
s)L
owM
iddl
eH
igh
Per
cen
t in
pov
erty
5.
315
.37
7.42
3.63
7.11
18.2
67.
203.
25(n
onel
derl
y) m
ean
Per
cen
t of
adu
lts
248.
7315
.31
33.9
922
.19
9.72
19.0
940
.63
wit
h co
llege
de
gree
s m
ean
Mea
n f
amily
$7
1,54
5$4
2,01
8$5
4,07
3$8
3,77
5$6
2,36
7$4
2,84
2$6
0,33
0$1
04,4
43in
com
ebm
ean
Fem
ale-
head
ed
11.5
20.0
313
.48
9.17
17.3
425
.18
15.2
59.
14fa
mili
es m
ean
Per
cen
t bl
ack
mea
n10
20.4
a19
99a.
b A
ll n
umbe
rs a
re in
199
9 do
llars
; the
num
bers
for
pla
cem
ent
addr
ess
wer
e in
flate
d fr
om 1
983
dolla
rs t
o 19
99 d
olla
rs; H
arri
s’s
(199
9a)
esti
mat
esw
ere
give
n in
199
6 do
llars
; we
infla
ted
them
to
1999
dol
lars
. Num
bers
for
cur
ren
t ad
dres
s w
ere
infla
ted
from
199
0 do
llars
to
1999
dol
lars
. Est
i-m
ates
are
bas
ed o
n t
he I
nfla
tion
Cal
cula
tor
in U
.S. B
urea
u of
Lab
or S
tati
stic
s (2
003)
.
Housing Policy Debate
DeLuca_HPD_14_3.qxd 11/6/03 9:49 AM Page 323
324 Stefanie DeLuca and James E. Rosenbaum
Although 84 percent of families had made some move since beingplaced, they are currently still in areas that fall above middle suburbson some attributes and much closer to the middle category than low onothers. Current suburban addresses have a mean of 7.11 percent forpercent poor, as compared with Harris’s (1999a) middle suburb value of 7.20 percent (low is 18.26 percent). Mean family income at currentaddress ($62,367) and percent college degrees (22.19 percent) also falljust above the typology value of $60,330 and 19.09 percent, respectively,for a mean middle suburb. Current address mean percent on female-headed families (17.34 percent) falls just above but close to the cut-offfor middle suburbs (15.25 percent). Overall, it appears that familieswere placed in suburbs that closely resemble “high” to “middle” sub-urbs according to the typology, although there has been more move-ment into the middle suburbs over time.
Most recent neighborhoods. Next, we examine whether the black com-position of placement neighborhoods predicts whether families willreturn to city neighborhoods (table 5). Among those placed in the sub-urbs and excluding the two highest categories (which have few casesand presumably violate program rules), we find a weak U-shaped rela-tionship. Just as previous research (Clark 1991) suggests, families thatmove to areas with the lowest percentage of blacks are somewhat morelikely to return to the city than the families placed in the next two cate-gories, but then the rate increases for the next higher category (15.1 to50 percent black). However, analyses of variance contrasting these cate-gories indicate that these are not significant differences. Overall, rela-tive to their city counterparts, the suburban movers appear much lesslikely to have a recent address in the city at any placement racial com-position level. Among those placed in the city and excluding the lowestcategory (which has few cases), we again find a weak U-shaped rela-tionship, but again, contrast analyses of variance do not suggest signifi-cant differences according to composition level.
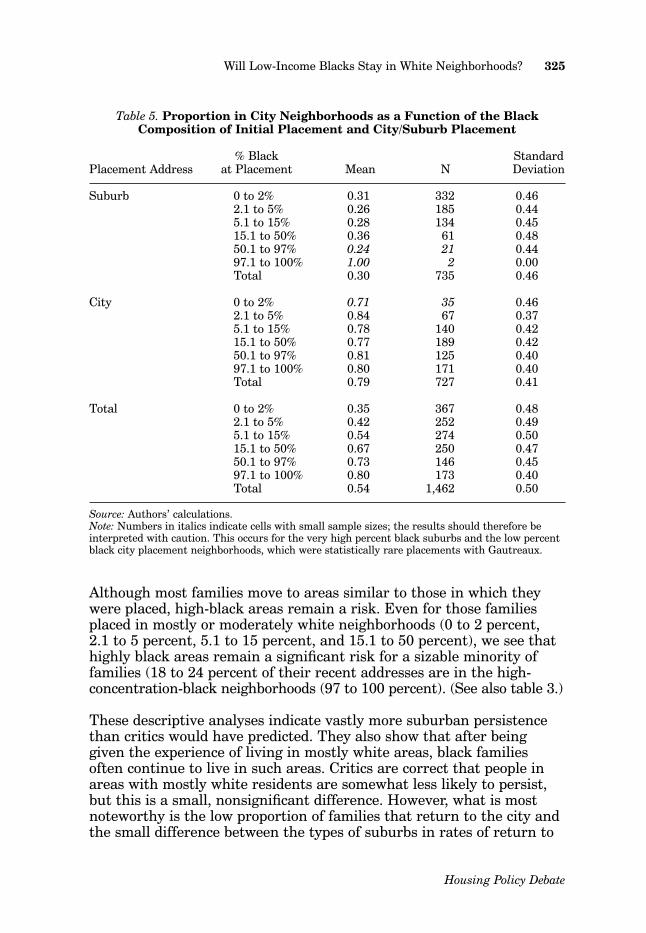
The following analyses examine the relationship between the racialcomposition of the placement address and the recent address. We elimi-nate families that remained in the same location; this choice maymerely reflect inertia. This provides a conservative test, since includingnonmovers would strengthen the relationship between placement andrecent neighborhood. Among movers, the black composition of theplacement address is strongly related to the black composition of therecent address (table 6; chi square = 135.96; p < 0.001). For example,while over 60 percent of the families placed in neighborhoods withinthe two lowest black composition categories ended up in low (0 to 30 percent) black neighborhoods an average of 14 years later, over 67 percent of families placed in mostly black neighborhoods (the toptwo categories) ended up in over 70 percent black areas much later.
Fannie Mae Foundation
DeLuca_HPD_14_3.qxd 11/6/03 9:49 AM Page 324
Will Low-Income Blacks Stay in White Neighborhoods? 325
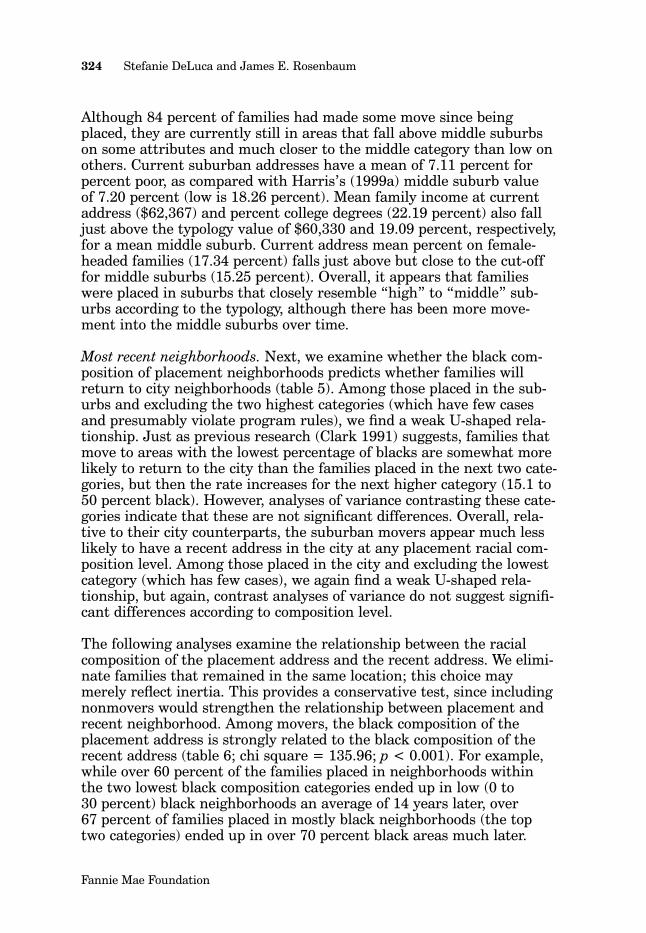
Table 5. Proportion in City Neighborhoods as a Function of the BlackComposition of Initial Placement and City/Suburb Placement
% Black StandardPlacement Address at Placement Mean N Deviation
Suburb 0 to 2% 0.31 332 0.462.1 to 5% 0.26 185 0.445.1 to 15% 0.28 134 0.4515.1 to 50% 0.36 61 0.4850.1 to 97% 0.24 21 0.4497.1 to 100% 1.00 2 0.00Total 0.30 735 0.46
City 0 to 2% 0.71 35 0.462.1 to 5% 0.84 67 0.375.1 to 15% 0.78 140 0.4215.1 to 50% 0.77 189 0.4250.1 to 97% 0.81 125 0.4097.1 to 100% 0.80 171 0.40Total 0.79 727 0.41
Total 0 to 2% 0.35 367 0.482.1 to 5% 0.42 252 0.495.1 to 15% 0.54 274 0.5015.1 to 50% 0.67 250 0.4750.1 to 97% 0.73 146 0.4597.1 to 100% 0.80 173 0.40Total 0.54 1,462 0.50
Source: Authors’ calculations.Note: Numbers in italics indicate cells with small sample sizes; the results should therefore beinterpreted with caution. This occurs for the very high percent black suburbs and the low percentblack city placement neighborhoods, which were statistically rare placements with Gautreaux.
Although most families move to areas similar to those in which theywere placed, high-black areas remain a risk. Even for those familiesplaced in mostly or moderately white neighborhoods (0 to 2 percent, 2.1 to 5 percent, 5.1 to 15 percent, and 15.1 to 50 percent), we see thathighly black areas remain a significant risk for a sizable minority offamilies (18 to 24 percent of their recent addresses are in the high-concentration-black neighborhoods (97 to 100 percent). (See also table 3.)
These descriptive analyses indicate vastly more suburban persistencethan critics would have predicted. They also show that after beinggiven the experience of living in mostly white areas, black familiesoften continue to live in such areas. Critics are correct that people inareas with mostly white residents are somewhat less likely to persist,but this is a small, nonsignificant difference. However, what is mostnoteworthy is the low proportion of families that return to the city andthe small difference between the types of suburbs in rates of return to
Housing Policy Debate
DeLuca_HPD_14_3.qxd 11/6/03 9:49 AM Page 325
326 Stefanie DeLuca and James E. Rosenbaum
Tab
le 6
.Bla
ck C
omp
osit
ion
: P
lace
men
t A
dd
ress
by
Mos
t R
ecen
t A
dd
ress
(M
over
s O
nly
)
% B
lack
of
Mos
t R
ecen
t N
eigh
borh
ood
% B
lack
of
Pla
cem
ent
Nei
ghbo
rhoo
d0
to 3
0%30
.1 t
o 50
%50
.1 t
o 70
%70
.1 t
o 97
%97
.1 t
o 10
0%T
otal
0 to
2%
N
162
1219
2450
267
Row
%60
.67
4.49
7.12
8.99
18.7
310
02.
1 to
5%
N
104
97
1732
169
Row
%61
.54
5.33
4.14
10.0
618
.93
100
5.1
to 1
5%
N70
1717
1740
161
Row
%43
.48
10.5
610
.56
10.5
624
.84
100
15.1
to
50%
N
6118
420
3313
6R
ow %
44.8
513
.24
2.94
14.7
124
.26
100
50.1
to
97%
N
168
324
3182
Row
%19
.51
9.76
3.66
29.2
737
.80
100
97.1
to
100%
N
159
312
4887
Row
%17
.24
10.3
43.
4513
.79
55.1
710
0T
otal
N
428
7353
114
234
902
Row
%47
.45
8.09
5.88
12.6
425
.94
100
Sou
rce:
Aut
hors
’ cal
cula
tion
s. P
erce
nta
ges
may
not
tot
al 1
00 b
ecau
se o
f ro
undi
ng.
Not
es:C
hi s
quar
e =
135
.96;
p<
0.0
01.
Fannie Mae Foundation
DeLuca_HPD_14_3.qxd 11/6/03 9:49 AM Page 326
Will Low-Income Blacks Stay in White Neighborhoods? 327
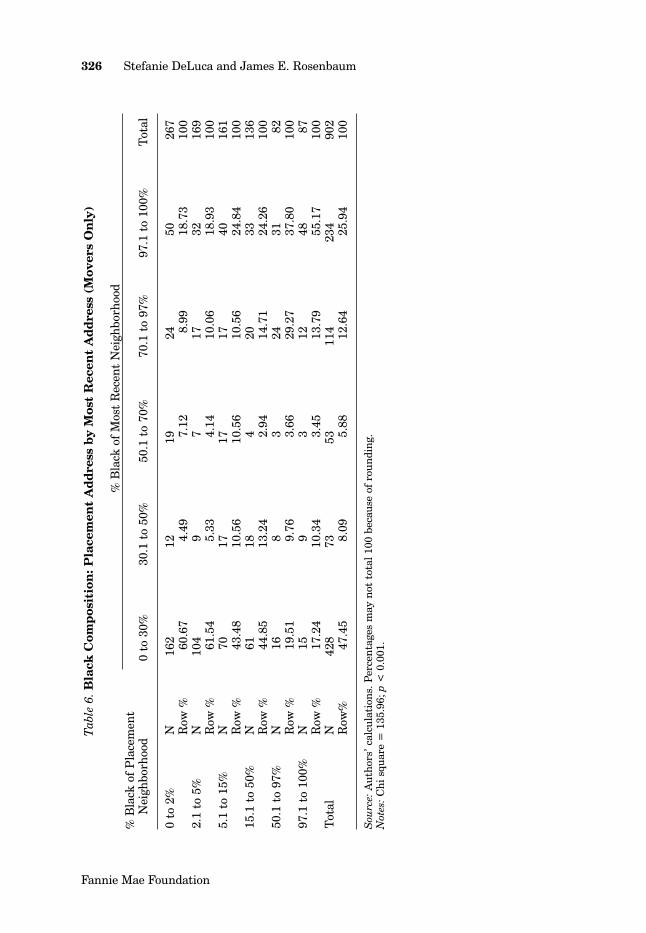
the city. The dominant conclusion is that most moves persist and thatthey have long-term effects on whether families are in integratedneighborhoods many years after their initial moves.
Multivariate analyses. This section uses multivariate analyses that con-trol for baseline individual and premove neighborhood attributes to testthe relationships described earlier (examining only the 84 percent offamilies that moved from their placement address). Given the pro-gram’s quasi-random design, we can be relatively confident that fami-lies assigned to different areas are similar; this is corroborated byempirical analyses (Mendenhall, Duncan, and DeLuca 2003). However,these multivariate analyses allow us to control for several importantattributes and adjust for the possibility of nonrandom differencesamong families.
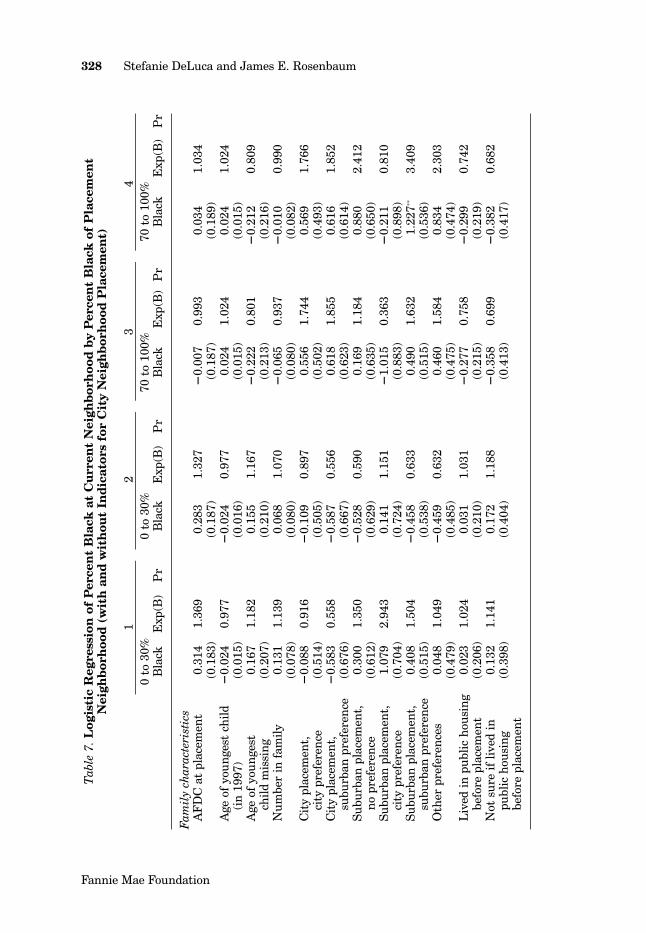
The following models examine whether the racial composition of thecurrent neighborhood is related to the racial composition of the place-ment neighborhood, controlling for many factors: premove neighbor-hood violent crime, mean family income, percent black, and publichousing residence; placement preferences; placement in a city neigh-borhood; years since placement; AFDC use by the household head atprogram entry; the youngest child’s age at the most recent period; andthe number of people in the family. Table 7, columns 1 and 2, showlogistic regression analyses with the dependent variable as currentneighborhood containing 30 percent or less black residents, whilecolumns 3 and 4 show analyses predicting current neighborhood ascontaining 70 percent or more black residents.15 Columns 1 and 3 showestimates without controlling for city placements, while columns 2 and4 show estimates including the indicator for city placement.16 Place-ment neighborhood percent black dummy variables allow the model to show nonlinear influences, with the lowest percent black (0 to 2 percent) left out as the reference category.
Housing Policy Debate
15 We ran the same analyses with “current address in city” as the dependent outcomein a logistic regression and found no significant results. It seems that the major out-come for which percent black at placement has an effect is not city versus suburb, butrather the racial composition of the current address.
16 The interpretation of the city placement variable is unavoidably ambiguous. It mayreflect structural, political, or geographic differences between the city and suburbanplacement neighborhoods, or it may reflect only variations in black composition withinthe ranges in our dummy variables.
DeLuca_HPD_14_3.qxd 11/6/03 9:49 AM Page 327
328 Stefanie DeLuca and James E. Rosenbaum
Tab
le 7
.Log
isti
c R
egre
ssio
n o
f P
erce
nt
Bla
ck a
t C
urr
ent
Nei
ghb
orh
ood
by
Per
cen
t B
lack
of
Pla
cem
ent
Nei
ghb
orh
ood
(w
ith
an
d w
ith
out
Ind
icat
ors
for
Cit
y N
eigh
bor
hoo
d P
lace
men
t)
12
34
0 to
30%
0 to
30%
70 t
o 10
0%70
to
100%
Bla
ckE
xp(B
)P
rB
lack
Exp
(B)
Pr
Bla
ckE
xp(B
)P
rB
lack
Exp
(B)
Pr
Fam
ily
char
acte
rist
ics
AF
DC
at
plac
emen
t0.
314
1.36
90.
283
1.32
7�
0.00
70.
993
0.03
41.
034
(0.1
83)
(0.1
87)
(0.1
87)
(0.1
89)
Age
of
youn
gest
chi
ld
�0.
024
0.97
7�
0.02
40.
977
0.02
41.
024
0.02
41.
024
(in
199
7)(0
.015
)(0
.016
)(0
.015
)(0
.015
)A
ge o
f yo
unge
st
0.16
71.
182
0.15
51.
167
�0.
222
0.80
1�
0.21
20.
809
child
mis
sin
g(0
.207
)(0
.210
)(0
.213
)(0
.216
)N
umbe
r in
fam
ily0.
131
1.13
90.
068
1.07
0�
0.06
50.
937
�0.
010
0.99
0(0
.078
)(0
.080
)(0
.080
)(0
.082
)C
ity
plac
emen
t,�
0.08
80.
916
�0.
109
0.89
70.
556
1.74
40.
569
1.76
6ci
ty p
refe
ren
ce(0
.514
)(0
.505
)(0
.502
)(0
.493
)C
ity
plac
emen
t,�
0.58
30.
558
�0.
587
0.55
60.
618
1.85
50.
616
1.85
2su
burb
an p
refe
ren
ce(0
.676
)(0
.667
)(0
.623
)(0
.614
)Su
burb
an p
lace
men
t,
0.30
01.
350
�0.
528
0.59
00.
169
1.18
40.
880
2.41
2n
o pr
efer
ence
(0.6
12)
(0.6
29)
(0.6
35)
(0.6
50)
Subu
rban
pla
cem
ent,
1.
079
2.94
30.
141
1.15
1�
1.01
50.
363
�0.
211
0.81
0ci
ty p
refe
ren
ce(0
.704
)(0
.724
)(0
.883
)(0
.898
)Su
burb
an p
lace
men
t,
0.40
81.
504
�0.
458
0.63
30.
490
1.63
21.
227**
3.40
9su
burb
an p
refe
ren
ce(0
.515
)(0
.538
)(0
.515
)(0
.536
)O
ther
pre
fere
nce
s0.
048
1.04
9�
0.45
90.
632
0.46
01.
584
0.83
42.
303
(0.4
79)
(0.4
85)
(0.4
75)
(0.4
74)
Liv
ed in
pub
lic h
ousi
ng
0.02
31.
024
0.03
11.
031
�0.
277
0.75
8�
0.29
90.
742
befo
re p
lace
men
t(0
.206
)(0
.210
)(0
.215
)(0
.219
)N
ot s
ure
if li
ved
in
0.13
21.
141
0.17
21.
188
�0.
358
0.69
9�
0.38
20.
682
publ
ic h
ousi
ng
(0.3
98)
(0.4
04)
(0.4
13)
(0.4
17)
befo
re p
lace
men
t
Fannie Mae Foundation
DeLuca_HPD_14_3.qxd 11/6/03 9:49 AM Page 328
Will Low-Income Blacks Stay in White Neighborhoods? 329
Tab
le 7
.Log
isti
c R
egre
ssio
n o
f P
erce
nt
Bla
ck a
t C
urr
ent
Nei
ghb
orh
ood
by
Per
cen
t B
lack
of
Pla
cem
ent
Nei
ghb
orh
ood
(w
ith
an
d w
ith
out
Ind
icat
ors
for
Cit
y N
eigh
bor
hoo
d P
lace
men
t) (
cont
inue
d)
12
34
0 to
30%
0 to
30%
70 t
o 10
0%70
to
100%
Bla
ckE
xp(B
)P
rB
lack
Exp
(B)
Pr
Bla
ckE
xp(B
)P
rB
lack
Exp
(B)
Pr
Year
s si
nce
mov
e 0.
016
1.01
60.
030
1.03
1�
0.03
10.
969
�0.
044
0.95
7(i
n 1
997)
(0.0
33)
(0.0
34)
(0.0
34)
(0.0
34)
Pre
mov
e ne
ighb
orho
od
char
acte
rist
ics
Ori
gin
nei
ghbo
rhoo
d �
0.00
30.
997
�0.
003
0.99
70.
006
1.00
60.
006
1.00
6vi
olen
t cr
ime
(0.0
04)
(0.0
04)
(0.0
04)
(0.0
04)
Ori
gin
nei
ghbo
rhoo
d �
0.00
20.
998
�0.
004
0.99
4�
0.00
70.
993
�0.
006
0.99
4m
ean
fam
ily(0
.006
)(0
.006
)(0
.006
)(0
.007
)in
com
e/1,
000
Ori
gin
nei
ghbo
rhoo
d �
0.00
9**
0.99
1�
0.01
0**
0.99
00.
012*
*1.
012
0.01
2**
1.01
3%
bla
ck(0
.003
)(0
.003
)(0
.004
)(0
.004
)M
issi
ng
1+ o
rigi
n0.
030
1.03
00.
025
1.02
5�
0.09
00.
914
�0.
099
0.90
6n
eigh
borh
ood
(0.2
85)
(0.2
89)
(0.2
94)
(0.2
98)
char
acte
rist
ics
Pla
cem
ent
neig
hbor
hood
ch
arac
teri
stic
sP
erce
nt
blac
k at
pl
acem
ent+
+
Very
low
(2.
1 to
5%
)0.
079
1.08
30.
869
0.22
51.
252
0.13
80.
046
1.04
70.
307
�0.
089
0.91
50.
908
(0.2
21)
(0.2
27)
(0.2
39)
(0.2
45)
Mod
erat
ely
low
�
0.77
1**
0.46
20.
739
�0.
430
0.65
00.
077
0.42
21.
525
0.39
30.
086
1.08
90.
922
(5.1
to
15%
)(0
.222
)(0
.236
)(0
.235
)(0
.251
)
Housing Policy Debate
DeLuca_HPD_14_3.qxd 11/6/03 9:49 AM Page 329
330 Stefanie DeLuca and James E. Rosenbaum
Tab
le 7
.Log
isti
c R
egre
ssio
n o
f P
erce
nt
Bla
ck a
t C
urr
ent
Nei
ghb
orh
ood
by
Per
cen
t B
lack
of
Pla
cem
ent
Nei
ghb
orh
ood
(w
ith
an
d w
ith
out
Ind
icat
ors
for
Cit
y N
eigh
bor
hoo
d P
lace
men
t) (
cont
inue
d)
12
34
0 to
30%
0 to
30%
70 t
o 10
0%70
to
100%
Bla
ckE
xp(B
)P
rB
lack
Exp
(B)
Pr
Bla
ckE
xp(B
)P
rB
lack
Exp
(B)
Pr
Mod
erat
e (1
5.1
to 5
0%)
�0.
662*
*0.
516
0.76
0�
0.17
20.
842
0.09
70.
637*
1.89
00.
445
0.16
81.
183
0.92
8(0
.245
)(0
.269
)(0
.255
)(0
.279
)H
igh
(50.
1 to
97%
)�
1.72
9**
0.17
80.
521
�1.
157*
*0.
314
0.03
81.
630*
*5.
103
0.68
41.
083*
*2.
952
0.97
0(0
.333
)(0
.358
)(0
.301
)(0
.330
)H
yper
segr
egat
ed
�1.
726*
*0.
178
0.52
2�
1.03
8**
0.35
40.
043
1.63
7**
5.14
00.
685
1.00
5**
2.73
20.
967
(97.
1 to
100
%)
(0.3
50)
(0.3
80)
(0.3
15)
(0.3
47)
Cit
y pl
acem
ent
�1.
206*
*0.
299
1.09
6**
2.99
3(0
.244
)(0
.249
)D
umm
y fo
r �
0.05
70.
945
�0.
321
0.72
60.
084
1.08
70.
333
1.39
6n
onin
terp
olat
ed
(0.2
78)
(0.2
84)
(0.2
91)
(0.3
01)
data
at
plac
emen
tC
onst
ant
0.62
91.
876
1.52
94.
612
�1.
905*
0.14
9�
2.65
5**
(0.8
86)
(0.9
13)
(0.9
07)
(0.9
29)
N83
183
183
183
1�
2 lo
g-lik
elih
ood
1,02
5.34
41,
000.
079
993.
158
973.
279
Chi
squ
are
122.
059
147.
323
108.
815
128.
693
Sign
ifica
nce
0.00
00.
000
0.00
00.
000
Sou
rce:
Aut
hors
’ cal
cula
tion
s.N
ote:
++
Ref
eren
ce c
ateg
ory
is 0
to
2%; t
here
fore
, col
umn
“P
r” d
enot
es t
he p
roba
bilit
y th
at m
ost
rece
nt
addr
ess
in t
he n
eigh
borh
ood
will
cor
re-
spon
d to
tha
t de
pen
den
t va
riab
le, r
elat
ive
to t
his
refe
ren
ce g
roup
.*
p<
0.0
5. *
* p<
0.0
1.
Fannie Mae Foundation
DeLuca_HPD_14_3.qxd 11/6/03 9:49 AM Page 330
Will Low-Income Blacks Stay in White Neighborhoods? 331
Family-level effects. Since families that begin on AFDC are more likelyto continue to receive benefits after placement, we expected that thesefamilies would be more likely to move back to high-black urban areas,where the welfare infrastructure is better articulated and more com-mon. We also expected that the age of the youngest child (at the mostrecent address) might be important, since mothers might choose to stayin certain neighborhoods that are better suited for their children untilthey are grown, at which time they might choose to live in the city withother friends and relatives. Families with several children might alsomake differential mobility decisions. We expected that years sinceplacement might have a positive effect on the percent black of therecent neighborhood, especially if regression to higher-black neighbor-hoods or city neighborhoods is expected to occur. Finally, we expectedfamilies with addresses in public housing before placement (even morethan those on the waiting list) would be more likely to end up in higherpercent black neighborhoods, perhaps to reconnect disrupted social net-works and families. There does not appear to be any evidence to sup-port these hypotheses across any of the model specifications, so we omita discussion of these factors from this point on. We also hypothesizedthat the preferences families report as to their placement destinationsbefore their move might represent some unobserved factors that arelikely to affect the racial composition of their recent neighborhood.However, there is only one significant baseline result, which appears in column 4. It appears as though those families that evidenced a pref-erence for suburban placements and were granted one were more likely to end up in highly concentrated black neighborhoods (70 to 100 percent) compared with families that were placed in the city andevidenced no preference (reference group), a finding we cannotexplain.17
Baseline neighborhood
The next set of variables represents the conditions in premove neigh-borhoods. We include these as a control against the possibility of non-random differences among the city and suburban movers (these are inessence differences between families placed in primarily white versus
Housing Policy Debate
17 Although program records indicate participants’ “preference for city or suburb,” thisvariable is difficult to interpret. Given the limited number of housing units available incertain locations, participants’ stated preferences might be distorted by their percep-tions of what it takes to get a housing unit at a particular time (perhaps with a lag). Wecannot know what preferences they would have stated under different circumstances.We include this variable as a control, but we do not know how much credibility to giveto it. In any case, it is significant only once in these analyses, and that finding is diffi-cult to explain.
DeLuca_HPD_14_3.qxd 11/6/03 9:49 AM Page 331
332 Stefanie DeLuca and James E. Rosenbaum
primarily black neighborhoods). The only premove neighborhood char-acteristic that reaches significance across the models is premove neigh-borhood percent black. This indicates that those families living in thehighest percent black neighborhoods before placement are less likely to be in primarily white neighborhoods (0 to 30 percent) at the mostrecent period (columns 1 and 2) and more likely to be in neighborhoodswith high concentrations of black residents (70 to 100 percent)(columns 3 and 4).
Placement neighborhood effects
However, despite these family and premove neighborhood controls, theracial composition of the placement neighborhood significantly predictsthe racial composition of the most recent neighborhood. Table 7, col-umn 1, shows the effect of placement neighborhood percent black onthe likelihood that families will end up in neighborhoods that are rela-tively integrated, at 30 percent black or less.
It is interesting to note that the results show a step pattern, with thefirst two successive levels at the same magnitude, the next two at a sig-nificantly higher plateau, and the next two at an even higher plateau.Relative to those families placed in the lowest percent black neighbor-hoods (0 to 2 percent, the reference group), families placed in areas 2.1to 5 percent black are no more likely to be in integrated neighborhoods,but those families placed in neighborhoods above 5.1 percent black areall less likely to reside in integrated neighborhoods at the most recentaddress. However, the effects are not linear with each categoricalincrease in placement percent black. Rather, there appear to be thresh-old effects resembling steps. After the initial plateau, the shift fromplacement in neighborhoods from 2.1 to 5 percent to 5.1 to 15 percentblack leads to a significant increase in the odds that the currentaddress is in 30 percent black or less areas (Exp(B)= 1.083 to 0.462),but the shift from 5.1 to 15 percent to 15.1 to 50 percent yields anotherplateau (odds that are similar in magnitude). This suggests that thereis little difference in the likelihood of ending up in relatively integratedneighborhoods for families placed in these two categories.18
However, the next shift (between 15.1 to 50 percent black and 50.1 to97 percent black placement in neighborhoods), increases the odds thatthe current address will be in an area that is 30 percent black or less by
Fannie Mae Foundation
18 Coefficient comparisons within the model were done by alternating reference groupsand find that the “plateau” coefficients are not significantly different from each otherand that the “step gaps” were significantly different from the level before them.
DeLuca_HPD_14_3.qxd 11/6/03 9:49 AM Page 332
Will Low-Income Blacks Stay in White Neighborhoods? 333
a factor of almost three (Exp(B) = 0.516 and 0.178, respectively).Another plateau occurs in the change from placement neighborhoodswith 50.1 to 97 percent to 97.1 to 100 percent black, given the almostidentical coefficients for these categories. The higher the percent blackof the placement neighborhood, the less likely a family is to be in arecent neighborhood that is integrated, but the increases occur in steps and only at certain points. These findings are captured in theestimated probabilities for each placement percent black category, rela-tive to the reference group, with other variables at the mean (columnslabeled “Pr”). We see that the probability that the current address willbe in a 30 percent or less black neighborhood, relative to the referencegroup at 0 to 2 percent black, is closer in magnitude for the very lowblack (2.1 to 5 percent) and moderate black (5.1 to 15 percent) place-ment neighborhoods than it is for the predominantly black placementneighborhoods.
Column 2 shows the same estimates, but controls for city placements.The pattern of results is similar, but there is only one threshold effect(in the shift to majority black neighborhoods [50.1 percent or more]).This indicates that even after controlling for city placements, the varia-tion in placement neighborhood percent black still affects where peopleend up. Even holding city placement constant, we see that the probabil-ity of ending up in a relatively integrated neighborhood is higher forthose families placed in low percent black (2.1 to 5 percent) neighbor-hoods than it is for all others, but that placement in the highest per-cent black neighborhoods (50 percent or more) still significantly lowersthat probability.
Table 7, column 3, shows results predicting the likelihood that familieswill end up in highly segregated black neighborhoods, which we char-acterize as 70 percent black or more at the most recent period. Theresults suggest that after adjusting for premove neighborhood and fam-ily characteristics, percent black at placement significantly predictswhether families will reside in highly segregated neighborhoods in thelong run. The effect sizes are similar to those for the previous models,except that they are in the expected opposite direction. Again, we seethe same step shape, except that moderately low black compositionplacements (5.1 to 15 percent) are not quite significant. However, at thenext step (once the placement black composition shifts to 15.1 to 50 percent), we see that the odds of families ending up in primarilyblack recent neighborhoods increases by 89 percent compared with thereference category. For families placed in neighborhoods containing50.1 to 97 percent black residents, the odds are 2.7 times higher thanthose for the previous category (ExpB = 5.103 vs. 1.890). As we saw in
Housing Policy Debate
DeLuca_HPD_14_3.qxd 11/6/03 9:49 AM Page 333
334 Stefanie DeLuca and James E. Rosenbaum
the previous models, there is another plateau at the next highest category, indicating that families placed into neighborhoods above 97 percent black are no more likely to end up in highly segregatedneighborhoods than those placed in neighborhoods at 50.1 to 97 per-cent black (Exp(B) = 5.103 vs. 5.140). The corresponding probabilitiesshow that those placed in predominantly black neighborhoods aremuch more likely to end up in such neighborhoods than those placed in mostly white areas.
Controlling for city neighborhood placement in column 4 has an effectsimilar to that seen in column 2, creating a single step, reducing theeffect of moderate (15.1 to 50 percent) percent black placement neigh-borhoods to insignificance, and reducing the size of the coefficients athigher levels. The relative probabilities reflect the smaller differencesafter adjusting for city placement, but show the higher probabilities ofending up in a segregated black neighborhood for those placed intosimilar areas.
Overall, these multivariate logistic regressions indicate that initial resi-dential placement strongly predicts recent neighborhood composition,even after extensive controls. Even though most families move afterplacement, their later address is significantly related to the kind ofneighborhood into which they were placed by the program. Familiesplaced in neighborhoods with higher black percentages were morelikely to currently reside in similar neighborhoods, and inversely, thoseplaced in less black areas were more likely to currently live in suchareas.
Conclusions
One critique from a conservative viewpoint holds that many social pro-grams are trying to achieve social engineering, but the changes theyimplement are likely to disappear over time as human nature over-comes their influence. In other words, racially integrated moves mayhave appeal, but people will soon move back to areas where they aremore comfortable. Even if residential mobility programs managed tomove families and have positive early effects on life outcomes, they ulti-mately will have little importance if families do not remain in theseareas and move back to segregated low-income neighborhoods wherethey feel more comfortable.
The present findings clearly refute those expectations. First, we foundthat the majority of low-income black families that were placed in sub-urban, low-black composition neighborhoods did not move back to the
Fannie Mae Foundation
DeLuca_HPD_14_3.qxd 11/6/03 9:49 AM Page 334
Will Low-Income Blacks Stay in White Neighborhoods? 335
city, as previous research might have predicted (Clark 1991; Farley etal. 1978). Rather, suburban placements had long-term effects on wherefamilies ended up. Even when we detected a modest increase in returnsto the city from the lowest percent black suburbs (0 to 2 percent), therate was still only 31 percent and was not significantly different fromthat of other categories.
Our analyses also show that families in our sample ended up in bettersuburbs than expected, even if they made subsequent moves. Our com-parison with Harris (1999a) showed that most families were not onlyplaced in middle- to high-socioeconomic-status suburbs, but also stilllive in similar areas. This allays the fears that these minority familieswould end up in areas that were suburbs in name, but just as disadvan-taged as the inner-city neighborhoods they tried to leave.
Finally, even though 84 percent of the families made subsequent movesafter placement, the racial composition of their current residence isstrongly related to program placement. These findings clearly indicatethat similar groups of families quasi-randomly placed in areas with fewblacks are much more likely to end up in another such neighborhoodthan families placed in mostly black areas.
The interpretation of these relationships is not clear. They may implythat preferences, rather than being inherent attributes of people, areaffected by the kinds of neighborhoods people have experienced. Alter-natively, they may indicate that structural barriers, having been bro-ken, permit families to follow new courses of action.
It may also be noteworthy that the relationship seems to take a stepshape. Some increases in categories lead to incremental changes in out-comes, and some do not. While other researchers have asserted suchthreshold effects for neighborhood preferences (Farley et al. 1978),structural factors could also have threshold effects. In any case, theseparticular thresholds are intriguing, but they may not generalize toother settings. As always, we caution against overgeneralizing from asingle study.
While this article has explored the extent to which the racial composi-tion of the placement neighborhood can explain the racial compositionof a family’s more recent neighborhood, we have begun additionalresearch to examine the multiple dimensions of neighborhoods, in addi-tion to racial composition, that might help explain residential out-comes. Other work has begun to explore the effects of related correlatesof neighborhood desirability, such as crime levels, income, educationlevel, percent unemployed, and percent in poverty, on the racial
Housing Policy Debate
DeLuca_HPD_14_3.qxd 11/6/03 9:49 AM Page 335
336 Stefanie DeLuca and James E. Rosenbaum
composition of later neighborhoods (DeLuca et al. 2001). There aremany individual and contextual reasons why low-income black familieswould choose to remain in or move to suburban neighborhoods withfew blacks. Although race may be the driving causal factor in determin-ing where families end up, either because of family preferences or socialstructural barriers, it is likely that related neighborhood attributes playa part and may even explain portions of the race effect (Frey 1979;Harris 1999b). Many integrated or primarily white areas are rich inother resources that affect family outcomes, such as active neighbor-hood groups, quality schools, and engaged public officials.
In addition, it is possible that some of the effects of the placementneighborhood operate within census tracts, at the block group level.Since census tracts can be quite large, it is likely that some interactionbetween the block group and tract-level attributes characterizes place-ment experiences for some families. For example, families living inrelatively integrated census tracts but more segregated block groups(enclaves) may fare better or worse than families placed into segregatedblock groups within segregated tracts (Briggs 1998). In current work,we are exploring the extent to which racial composition at thesedifferent levels can help predict long-term family and neighborhoodoutcomes.
This article also has policy implications. Prior research has focused onwhether residential moves affect mothers’ and children’s outcomes.Some prior studies have shown remarkably strong effects, sometimesstronger than the outcomes of programs targeted at the outcome itself,such as job training programs (Bloom et al. 1992; Cave and Doolittle1991). Such findings raise the possibility that residential mobility maysometimes be a better way of improving families’ well-being than directservice programs. However, as we have noted, residential mobility pro-grams can take many forms, and different forms may have differentconsequences. We have offered a typology for some of the salient dis-tinctions among existing mobility programs, and we encourage carefulanalysis of the distinctive features and consequences of each type ofprogram. Moreover, some of these findings may depend on the persist-ence of the moves, and critics have raised doubts about that issue.
If creating more racially integrated neighborhoods is a goal for society,available evidence suggests that merely giving out housing voucherswill not be sufficient; this approach often leads families to chooseneighborhoods like the ones in which they already reside (Cronin andRasmussen 1981). Multiple models of residential mobility are available(Gautreaux, MTO, and Yonkers), and such programs may be neededdifferentially, depending on the context. However, again, it is of the
Fannie Mae Foundation
DeLuca_HPD_14_3.qxd 11/6/03 9:49 AM Page 336
Will Low-Income Blacks Stay in White Neighborhoods? 337
utmost importance to know whether residential moves persist overtime. Our results clearly inform this question.
Finally, researchers have been impressed with prior findings about thefears low-income black families have about living in areas with lowpercent black composition. Although early research on neighborhoodpreferences showed a tendency for whites and blacks to prefer neigh-borhoods in which they were a majority and research on housingvouchers showed that low-income black families tend to choose areassimilar to the ones in which they began (Cronin and Rasmussen 1981),our findings indicate that quasi-randomly assigned placements haveenduring effects, either because of changes in preferences or structuralcircumstances (landlord discrimination, search difficulties, and trans-portation). Having once circumvented the usual barriers to residing inthe suburbs or in low percent black areas, most of the low-income blackfamilies that moved to the suburbs remained in the suburbs, and mostfamilies that moved to low percent black areas remained in such areasan average of 14 years later.
Appendix AInterpolation between 1970 and 1980, and 1980 and 1990 censuses
To obtain appropriate time frames for premove addresses, census datawere interpolated across the 1970, 1980, and 1990 censuses by sub-tracting 1 from the year of move and weighting the number of years forwhich the more recent census applied. For example, to calculate thepremove neighborhood population count for a family that moved in1980, we first subtract 1 from 1980, which gives us 1979 as the lastyear in the premove neighborhood. We then subtract the populationcount for the 1970 census from the population count for the 1980 cen-sus, divide by 10 years, multiply by 9 (the number of years for whichthe 1970 census applies to the premove address), and then add the1970 population count. The equation looks like this:
IF (year of move = 1980, population count of premove address) = (9*(popcount1980 census � popcount 1970 (1)census)/10) + popcount 1970 census
IF (year of move = 1987), population count of premove address) = (6*(popcount1990 census � popcount 1980 (2)census)/10) + popcount 1980 census
For placement address interpolation, the calculation is the same, exceptthat we do not subtract 1 from the year of placement. If a family was
Housing Policy Debate
DeLuca_HPD_14_3.qxd 11/6/03 9:49 AM Page 337
338 Stefanie DeLuca and James E. Rosenbaum
placed in 1982, for example, the interpolation for placement neighbor-hood population count would look like this:
IF (year of move = 1982, population count of placement address) = (2*(popcount 1990 census � popcount 1980 (3)census)/10) + popcount 1980 census
The same calculations were done to obtain appropriate race counts ateach time period, since we know that many urban and suburban neigh-borhoods in the Chicago metropolitan area experienced shifts in racialcomposition between 1980 and 1990. These shifts are likely to affectour observations, so we include these interpolated counts to adjust forthis phenomenon.
Appendix BPremove, placement, most recent address, and census matching
While program records provide previous address and placement desti-nation, “most recent” participant address, which we define as the par-ticipant’s address between 1993 and 2000, is more complicated todocument. It came about as the result of decision rules and a combina-tion of address sources. We used three sources to obtain a currentaddress for the head of household:
1. Illinois Department of Human Services (DHS). AFDC records from1989 to 1996, matched to the sample by Bong Joo Lee
2. Illinois DHS Integrated Client Database Records (AFDC, TANF,Medicaid, Food Stamps) from February 1989 to September 1999, anupdated monthly match to our sample, done by Bong Joo Lee andBob Goerge
3. TransUnion Corporation consumer credit information recordsthrough July 2000, matched to our sample by Social Security num-ber traces and last known address re-traces
The most recent address of these three combined sources was used. In the case of two sources claiming the same date for discrepantaddresses, or the choice between a TransUnion address and an addressgiven by one of the Illinois DHS matches, the latter was used. This wasdone because the DHS databases contained addresses and names towhich checks were sent, so we assumed that these were probably moreaccurate than the addresses people might use for other credit purposes.
Fannie Mae Foundation
DeLuca_HPD_14_3.qxd 11/6/03 9:49 AM Page 338
Will Low-Income Blacks Stay in White Neighborhoods? 339
In a small number of cases (N = 50, or 3.3 percent), the most recentaddress we obtained was “uncodable” according to the interactivegeocoding software we used. These addresses were usually post officeboxes or out-of-range street addresses. For these cases, we chose thenext most recent address from our sources (N = 19, or 1.3 percent), sothat we could match a recent address to area census characteristics.For 34 cases (2% percent), we could not get any recent codable streetaddress, but we did obtain a most recent ZIP code for descriptiveanalyses.
To obtain information about the neighborhoods at the three differenttime periods, we matched census tracts within counties to data fromthe 1970, 1980, and 1990 censuses. The address-to-census-tractmatches were done using Matchmaker, an online interactive geocodingservice from Geographic Data Technology. Addresses that were rejectedby the software as uncodable were cleaned by hand using postal servicelistings or maps and rerun through the software. If this method wasunsuccessful for the most recent address data, the above algorithm wasused, and the next best addresses were rerun.
Housing Policy Debate
DeLuca_HPD_14_3.qxd 11/6/03 9:49 AM Page 339
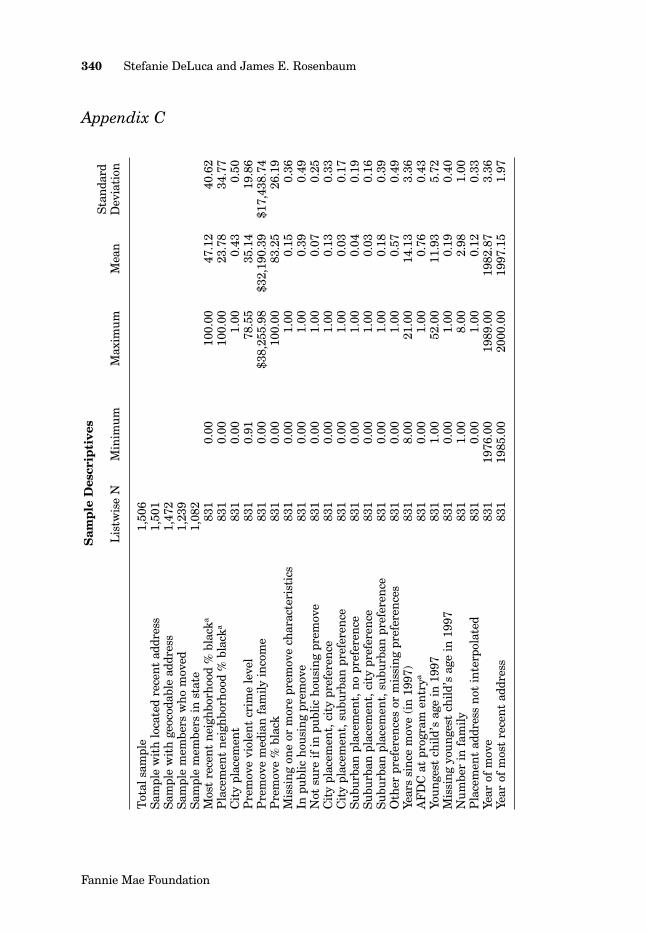
340 Stefanie DeLuca and James E. Rosenbaum
Appendix C
Sam
ple
Des
crip
tive
sSt
anda
rdL
istw
ise
NM
inim
umM
axim
umM
ean
Dev
iati
on
Tot
al s
ampl
e 1,
506
Sam
ple
wit
h lo
cate
d re
cen
t ad
dres
s1,
501
Sam
ple
wit
h ge
ocod
able
add
ress
1,47
2Sa
mpl
e m
embe
rs w
ho m
oved
1,23
9Sa
mpl
e m
embe
rs in
sta
te1,
082
Mos
t re
cen
t n
eigh
borh
ood
% b
lack
a83
10.
0010
0.00
47.1
240
.62
Pla
cem
ent
nei
ghbo
rhoo
d %
bla
cka
831
0.00
100.
0023
.78
34.7
7C
ity
plac
emen
t83
10.
001.
000.
430.
50P
rem
ove
viol
ent
crim
e le
vel
831
0.91
78.5
535
.14
19.8
6P
rem
ove
med
ian
fam
ily in
com
e 83
10.
00$3
8,25
5.98
$32,
190.
39$1
7,43
8.74
Pre
mov
e %
bla
ck83
10.
0010
0.00
83.2
526
.19
Mis
sin
g on
e or
mor
e pr
emov
e ch
arac
teri
stic
s83
10.
001.
000.
150.
36In
pub
lic h
ousi
ng
prem
ove
831
0.00
1.00
0.39
0.49
Not
sur
e if
in p
ublic
hou
sin
g pr
emov
e 83
10.
001.
000.
070.
25C
ity
plac
emen
t, c
ity
pref
eren
ce83
10.
001.
000.
130.
33C
ity
plac
emen
t, s
ubur
ban
pre
fere
nce
831
0.00
1.00
0.03
0.17
Subu
rban
pla
cem
ent,
no
pref
eren
ce83
10.
001.
000.
040.
19Su
burb
an p
lace
men
t, c
ity
pref
eren
ce83
10.
001.
000.
030.
16Su
burb
an p
lace
men
t, s
ubur
ban
pre
fere
nce
831
0.00
1.00
0.18
0.39
Oth
er p
refe
ren
ces
or m
issi
ng
pref
eren
ces
831
0.00
1.00
0.57
0.49
Year
s si
nce
mov
e (i
n 1
997)
831
8.00
21.0
014
.13
3.36
AF
DC
at
prog
ram
en
trya
831
0.00
1.00
0.76
0.43
Youn
gest
chi
ld’s
age
in 1
997
831
1.00
52.0
011
.93
5.72
Mis
sin
g yo
unge
st c
hild
’s a
ge in
199
783
10.
001.
000.
190.
40N
umbe
r in
fam
ily83
11.
008.
002.
981.
00P
lace
men
t ad
dres
s n
ot in
terp
olat
ed83
10.
001.
000.
120.
33Ye
ar o
f m
ove
831
1976
.00
1989
.00
1982
.87
3.36
Year
of
mos
t re
cen
t ad
dres
s83
119
85.0
020
00.0
019
97.1
51.
97
Fannie Mae Foundation
DeLuca_HPD_14_3.qxd 11/6/03 9:49 AM Page 340
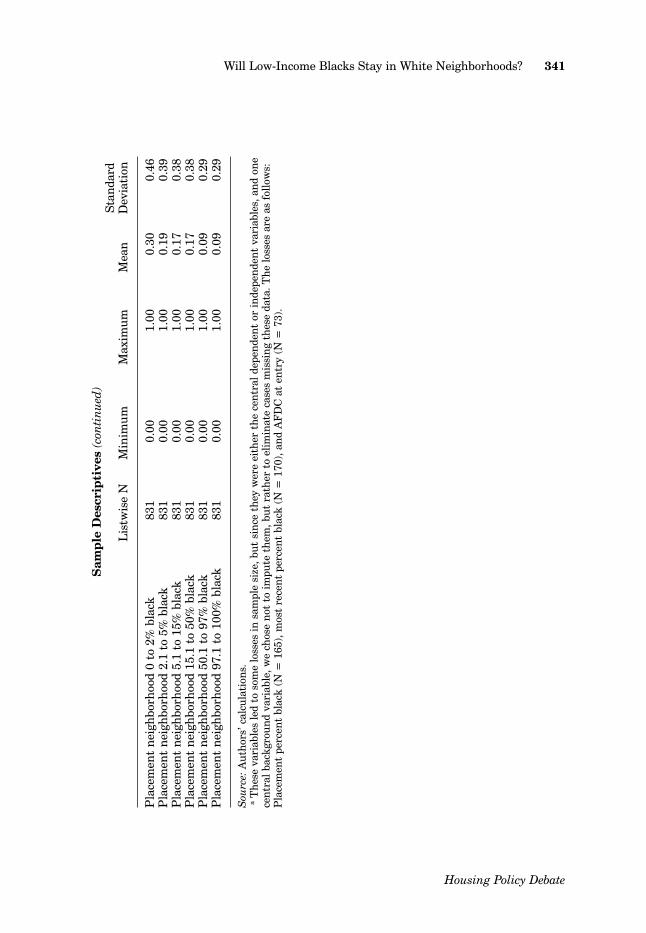
Will Low-Income Blacks Stay in White Neighborhoods? 341
Sam
ple
Des
crip
tive
s (c
onti
nued
)St
anda
rdL
istw
ise
NM
inim
umM
axim
umM
ean
Dev
iati
on
Pla
cem
ent
nei
ghbo
rhoo
d 0
to 2
% b
lack
831
0.00
1.00
0.30
0.46
Pla
cem
ent
nei
ghbo
rhoo
d 2.
1 to
5%
bla
ck83
10.
001.
000.
190.
39P
lace
men
t n
eigh
borh
ood
5.1
to 1
5% b
lack
831
0.00
1.00
0.17
0.38
Pla
cem
ent
nei
ghbo
rhoo
d 15
.1 t
o 50
% b
lack
831
0.00
1.00
0.17
0.38
Pla
cem
ent
nei
ghbo
rhoo
d 50
.1 t
o 97
% b
lack
831
0.00
1.00
0.09
0.29
Pla
cem
ent
nei
ghbo
rhoo
d 97
.1 t
o 10
0% b
lack
831
0.00
1.00
0.09
0.29
Sou
rce:
Aut
hors
’ cal
cula
tion
s.a
The
se v
aria
bles
led
to s
ome
loss
es in
sam
ple
size
, but
sin
ce t
hey
wer
e ei
ther
the
cen
tral
dep
ende
nt
or in
depe
nde
nt
vari
able
s, a
nd
one
cen
tral
bac
kgro
und
vari
able
, we
chos
e n
ot t
o im
pute
the
m, b
ut r
athe
r to
elim
inat
e ca
ses
mis
sin
g th
ese
data
. The
loss
es a
re a
s fo
llow
s:P
lace
men
t pe
rcen
t bl
ack
(N =
165
), m
ost
rece
nt
perc
ent
blac
k (N
= 1
70),
an
d A
FD
C a
t en
try
(N =
73)
.
Housing Policy Debate
DeLuca_HPD_14_3.qxd 11/6/03 9:49 AM Page 341
342 Stefanie DeLuca and James E. Rosenbaum
Authors
Stefanie DeLuca is an Assistant Professor in the Department of Sociology and the Cen-ter for Social Organization of Schools, both at Johns Hopkins University. James E.Rosenbaum is a Professor of Sociology, Education, and Social Policy at NorthwesternUniversity.
The authors thank Greg Duncan, Ruby Mendenhall, Micere Keels, Xavier de SouzaBriggs, Brian Jacob, Shazia Miller, Robert Goerge, Bong Joo Lee, and Emily Rosen-baum for their invaluable comments and Amy Claessens, Jonathan Glick, KatherineBennett, and Kristine Zeabart for their research assistance. The authors also thank the Institute for Policy Research, the Foundation for Child Development, the SpencerFoundation, and the Joint Center for Poverty Research at Northwestern University andthe University of Chicago for providing research support for this project. Earlier ver-sions of this article were presented at the 2001 meeting of the Population Association of America and at the London School of Economics in July 2000.
References
Bloom, Howard S., Larry Laurence Orr, George Cave, Sam H. Bell, and Fred Doolittle.1992. The National JTPA Study: Title II–A Impacts on Earnings and Employment atEighteen Months. Bethesda, MD: Abt Associates, Inc.
Bobo, Lawrence. 1989. Keeping the Linchpin in Place: Testing the Multiple Sources ofOpposition to Residential Integration. Revue Internationale de Psychologie Sociale2:306–23.
Briggs, Xavier de Souza. 1997. Moving Up versus Moving Out: Neighborhood Effects inHousing Mobility Programs. Housing Policy Debate 8(1):195–234.
Briggs, Xavier de Souza. 1998. Brown Kids in White Suburbs: Housing Mobility andSocial Capital. Housing Policy Debate 9(1):177–221.
Brooks-Gunn, Jeanne, Greg J. Duncan, Tama Leventhal, and J. Lawrence Aber, eds.1997. Neighborhood Poverty. Vol. 1. Context and Consequences for Children. New York:Russell Sage.
Cave, George, and Fred Doolittle. 1991. Assessing Jobstart: Interim Impacts of a Pro-gram for School Dropouts. New York: Manpower Demonstration Research Corporation.
Clark, William A.V. 1986. Residential Segregation in American Cities. PopulationResearch and Policy Review 5:95–127.
Clark, William A.V. 1988. Understanding Residential Segregation in American Cities:Interpreting the Evidence (Reply to Galster). Population Research and Policy Review7:113–21.
Clark, William A.V. 1989. Residential Segregation in American Cities: Common Groundand Differences in Interpretation. Population Research and Policy Review 8:193–97.
Fannie Mae Foundation
DeLuca_HPD_14_3.qxd 11/6/03 9:49 AM Page 342
Will Low-Income Blacks Stay in White Neighborhoods? 343
Clark, William A. V. 1991. Residential Preferences and Neighborhood Racial Segrega-tion: A Test of the Schelling Segregation Model. Demography 28(1):1–19.
Crane, Jonathan. 1991. Effects of Neighborhoods on Dropping Out of School andTeenaged Childbearing. In The Urban Underclass, ed. Christopher Jencks and Paul E.Petersen, 299–320. Washington, DC: Brookings Institution.
Cronin, Francis J., and David W. Rasmussen. 1981. Mobility. In Housing Vouchers forthe Poor: Lessons from a National Experiment, ed. Raymond J. Struyk and Marc Ben-dick Jr., 107–28. Washington, DC: Urban Institute Press.
DeLuca, Stefanie, Micere Keels, Ruby Mendenhall, and James E. Rosenbaum. 2001.The Long-Term Effects of Residential Mobility on Subsequent Neighborhood Qualityand Income: New Analyses of Administrative Data from the Quasi-ExperimentalGautreaux Program. Presented at the annual meeting of the Population Association ofAmerica, Washington, DC, March.
DeMarco, Donald L., and George C. Galster. 1993. Prointegrative Policy: Theory andPractice. Journal of Urban Affairs 15(2):141–60.
Emerson, Michael O., George Yancey, and Karen Chai. 2002. Does Race Matter in Resi-dential Segregation? Exploring the Preferences of White Americans. American Socio-logical Review 66:922–35.
Farley, Reynolds, Howard Schuman, Suzanne Bianchi, Diane Colasanto, and ShirleyHatchett. 1978. Chocolate City, Vanilla Suburbs: Will the Trend toward Racially Sepa-rated Communities Continue? Social Science Research 7:319–44.
Farley, Reynolds, Charlotte Steeh, Maria Krysan, Tara Jackson, and Keith Reeves.1994. Stereotypes and Segregation: Neighborhoods in the Detroit Area. American Jour-nal of Sociology 100(3):750–80.
Frey, William H. 1979. Central-City White Flight: Racial and Non-Racial Causes. Amer-ican Sociological Review 44:425–48.
Galster, George. 1986. More Than Skin Deep: The Effect of Discrimination on theExtent and Pattern of Racial Residential Segregation. In Housing Desegregation andFederal Policy, ed. John Goering, 165–75. Chapel Hill, NC: University of North Car-olina Press.
Galster, George C. 1992. Research on Discrimination in Housing and Mortgage Mar-kets: Assessment and Further Directions. Housing Policy Debate 3(2):639–83.
Galster, George C., and Mark Kenney. 1988. Race Residence, Discrimination, and Eco-nomic Opportunity. Urban Affairs Quarterly 14:87–117.
Galster, George C., and Sean Killen. 1995. The Geography of Metropolitan Opportunity:A Reconnaissance and Conceptual Framework. Housing Policy Debate 6(1):7–43.
Goering, John. 1997. Choosing a Better Life? How Public Housing Tenants Selected aHUD Experiment to Improve Their Lives and Those of Their Children. Paper pre-sented at the U.S. Department of Housing and Urban Development’s Moving to Oppor-tunity Research Conference, Washington, DC, November 20–21.
Housing Policy Debate
DeLuca_HPD_14_3.qxd 11/6/03 9:49 AM Page 343
344 Stefanie DeLuca and James E. Rosenbaum
Goering, John, and Judith D. Feins. 2003. Choosing a Better Life? Evaluating the Mov-ing to Opportunity Social Experiment. Washington, DC: Urban Institute Press.
Hanratty, Maria, Sara McLanahan, and Elizabeth Pettit. 1997. The Impact of the LosAngeles Moving to Opportunity Program on Residential Mobility: Neighborhood Char-acteristics, and Early Child and Parent Outcomes. Paper presented at the U.S. Depart-ment of Housing and Urban Development’s Moving to Opportunity ResearchConference, Washington, DC, November 20–21.
Harris, David R. 1999a. All Suburbs Are Not Created Equal: A New Look at Racial Dif-ferences in Suburban Location. Research report. University of Michigan, Institute forSocial Research, Population Studies Center.
Harris, David R. 1999b. “Property Values Drop When Blacks Move in Because…”:Racial and Socioeconomic Determinants of Neighborhood Desirability. American Socio-logical Review 64:461–79.
Katz, Lawrence F., Jeffrey Kling, and Jeffrey Liebman. 1997. Moving to Opportunity inBoston: Early Impacts of a Housing Mobility Program. Paper presented at the U.S.Department of Housing and Urban Development’s Moving to Opportunity ResearchConference, Washington, DC, November 20–21.
Kleit, Rachel Garshick. 2001. The Role of Neighborhood Social Networks in Scattered-Site Public Housing Residents’ Search for Jobs. Housing Policy Debate 12(3):541–73.
Ladd, Helen F., and Jens Ludwig. 1997. The Effects of MTO on Educational Opportuni-ties in Baltimore. Paper presented at the U.S. Department of Housing and UrbanDevelopment’s Moving to Opportunity Research Conference, Washington, DC, Novem-ber 20–21.
Massey, Douglas S., and Nancy A. Denton, 1993. American Apartheid: Segregation andthe Making of the Underclass. Cambridge, MA: Harvard University.
Mendenhall, Ruby, Greg Duncan, and Stefanie DeLuca. 2003. Neighborhood Resourcesand Economic Mobility: Results from the Gautreaux Program. Unpublished.
Newman, Sandra J., and Ann B. Schnare. 1997. “…And a Suitable Living Environ-ment: The Failure of Housing Programs to Deliver on Neighborhood Quality. HousingPolicy Debate 8(4):703–41.
Peterson, George, and Kale Williams. 1995. Housing Mobility: What Has It Accom-plished and What Is Its Promise? In Housing Mobility: Promise or Illusion? ed. Alexan-der Polikoff, 7–102. Washington, DC: Urban Institute.
Rosenbaum, James E. 1995. Changing the Geography of Opportunity by ExpandingResidential Choice: Lessons from the Gautreaux Program. Housing Policy Debate6(1):231–69.
Rosenbaum, James E. 1997. Residential Mobility: Effects on Education, Employment,and Racial Interaction. In Legal and Social Changes in Racial Integration in the U.S.,ed. J. C. Bolger and J. Wegner, 231–70. Chapel Hill, NC: University of North CarolinaPress.
Fannie Mae Foundation
DeLuca_HPD_14_3.qxd 11/6/03 9:49 AM Page 344
Will Low-Income Blacks Stay in White Neighborhoods? 345
Rosenbaum, James E., and Stefanie DeLuca. 2000. Is Housing Mobility the Key to Wel-fare Reform? Lessons from Chicago’s Gautreaux Program. Survey Series. Washington,DC: Brookings Institution, Center on Urban and Metropolitan Policy.
Rosenbaum, James E., Stefanie DeLuca, and Tammy Tuck. 2002. Moving and Chang-ing: How Places Change People Who Move into Them. Working Paper WP–02–09. Insti-tute for Policy Research.
Rosenbaum, James E., Lisa Reynolds, and Stefanie DeLuca. 2002. How Do Places Mat-ter? The Geography of Opportunity, Self-Efficacy, and a Look inside the Black Box ofResidential Mobility. Housing Studies 17:71–82.
Rubinowitz, Leonard S., and James E. Rosenbaum 2000. Crossing the Class and ColorLines: From Public Housing to White Suburbia. Chicago: University of Chicago Press.
Sampson, Robert J., Jeffrey D. Morenoff, and Thomas Gannon-Rowley. 2002. Assessing“Neighborhood Effects”: Social Processes and New Directions in Research. AnnualReview of Sociology 28:443–78.
Sard, Barbara, and Margy Waller. 2002. Housing Strategies to Strengthen Welfare Policyand Support Working Families. Survey Series. Washington, DC: Brookings Institution,Center on Urban and Metropolitan Policy.
Turner, Marjorie Austin. 1998. Moving Out of Poverty: Expanding Mobility and Choicethrough Tenant-Based Housing Assistance. Housing Policy Debate 9(2):373–94.
Wilson, William Julius. 1987. The Truly Disadvantaged: The Inner City, the Underclass,and Public Policy. Chicago: University of Chicago Press.
U.S. Bureau of Labor Statistics. 2003. Inflation Calculator. World Wide Web page<http://stats.bls.gov> (accessed August 12, 2003).
Housing Policy Debate
DeLuca_HPD_14_3.qxd 11/6/03 9:49 AM Page 345

DeLuca_HPD_14_3.qxd 11/6/03 9:49 AM Page 346