Embed Size (px)
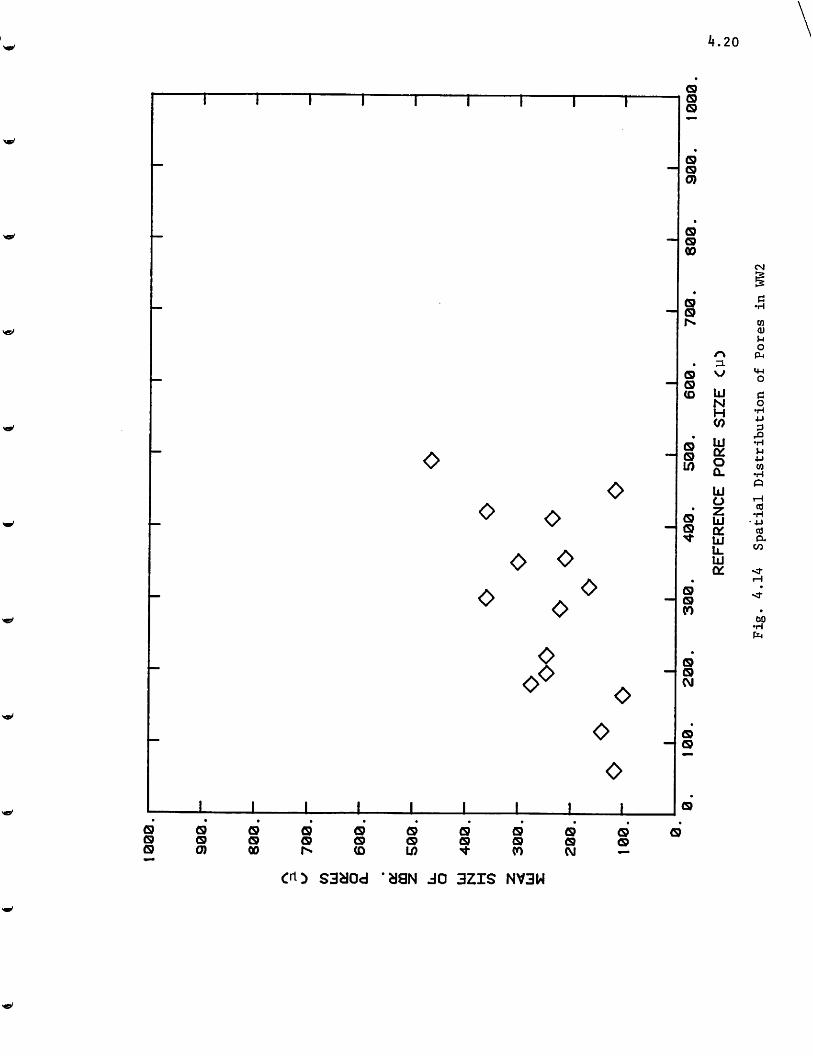
Citation preview

c•7^ 2^
[iffff©(g&@ off [?®iP© @ft[i=oo®feDDiP© ODD MQaflOD® Add@flDD(§]D©°IF'DD@@© [H]Q@€fl[^l]@ [SlO@|pI]@@@OgD@DD(^@
bjf
Robert Michael Specter
Submitted to the Factalty of the Graduate School of theNev Mexico Institute of Mining and Technology
in Partial Fulfillment of the Requirements for the Degree ofMaster of Science in Geology
July 1984

EFFECTS OF PORE STRUCTURE ON MIXING IN
STABLE, SINGLE-PHASE MISCIBLE DISPLACEMENTS
ABSTRACT
Phase compositions strongly influence the ability ofCO2 to extract hydrocarbons during a CO2 flood. Fluidcompositions which occur are the result of mixing of CO2,oil and water as they flow through porous reservoir rock.Mixing is influenced by diffusion and dispersion within porenetworks in the rocks. Quantifiable features of porestructure which seem to influence mixing most are pore sizeand pore connectivity. Pore shape, coordination number,aspect ratio, flowpath tortuosity and permeability are alsofactors which must influence displacement results, but do soin less obvious and quantifiable ways. To examine therelationship between pore structure and mixing, fourcarbonate and three sandstone cores were examined in thinsection and with electron microscopy. Complete petrographicanalysis was performed on each sample, includingdetermination of pore size distributions and connectivitypatterns. Stable, single-phase miscible displacementsperformed in the cores were interpreted using a mixing modelproposed by Coats and Smith (1964). Pore structure data arerelated to Coats-Smith parameters to determine the effectsof pore structure on mixing phenomena. Average mixingbehavior on the scale of short laboratory cores isqualitatively consistent with observations of pore structurein thin section. Small-scale heterogeneity of porestructure is responsible for mixing effects which result inearly breakthrough of the displacing fluid and a flowingfraction less than one. A wide distribution of pore sizesis necessary but not in itself sufficient to produce a lowflowing fraction. Also required are pore connections whichresult in the generation of preferential flow paths.Dispersion coefficients are significantly higher for thecarbonates than for the sandstones. Large dispersioncoefficients are associated with wide pore sizedistributions.
®1984 Robert M. Specter

This thesis is accepted on behalf of the faculty
of the Institute by the following committee:
dviser
-/f
Av (QwY-.
July 31, 1984Date

parems

TABLE OF CONTENTS
Acknowledgements v
List of Figures vi
List of Tables viii
Key to Symbols ix
1. Background, Previous Work and Purpose 1.1
2. Mixing During Single-Phase MiscibleDisplacements in Reservoir Cores 2.1
Single-Phase Displacements 2.1Mixing in Rocks 2.5
3. Sample Examination Methods 3.1
Whole Core Analysis 3.1Thin Section Preparation 3.1Thin Section Petrography 3.2SEM and EDX Analysis 3.5X-ray Diffraction of Clay Minerals 3.5Flowpath Vector Analysis 3.6Spatial Distribution of Pores 3.8Single-Phase Displacements 3.11
U. Petrologic Elements Related toPorosity and Permeability Development ^1.1
Pore Development in the Sandstone Samples ... ^.1Petrology and Pore Structure of
the Sandstone Cores M.3Pore Development in the Carbonate Samples ... i|.l6Petrology and Pore Structure of
the Carbonate Cores M.17
5. Relation of Pore StructureObservations to Displacement Results 5.1
Sandstone Cores 5.1Carbonate Cores 5.8Summary of Results 5.17Discussion of Methodology 5.18Questions of Scale 5.23Future Work 5.26
6. Summary and Conclusions 6.1
References Cited R.1
Appendix A: Petrographic Data A.I

ACKNOWLEDGEMENTS
I am indebted to Dr. Franklin M. Orr, Jr. for
supervising my research program and for providing
enthusiastic support of this work. Working with Lynn has
shown me that the traditional Geologist vs. Engineer
conflict may be overcome when each keeps an open mind and
ideas are exchanged.
Dr. David B. Johnson acted as my major advisor and Dr.
John R. MacMillan also served on ray thesis committee. Both
of them assisted in planning the research program,
interpreting data and editing this manuscript. Their
efforts are greatly appreciated.
Financial support for this work was provided by the New
Mexico Petroleum Recovery Research Center, the New Mexico
Energy Research and Development Institute, the United States
Department of Energy, and a consortium of corporations
including the Abu Dhabi Reservoir Research Foundation,
American Cyanimid, AMOCO Foundation, ARCO Oil & Gas, CONOCO,
Marathon, Mobil, Shell Development, SOHIO, Sun Exploration &
Development, and TENNECO.
Dr. Robert E. Bretz, Stephen L. Welch, Mary L. Graham
and Michael P. Mayer collected the miscible displacement data
Heidi L. Miller edited the manuscript. Janet E. Golding
typed tables and figure captions, and M. David McKallip made
available his Macintosh computer and graphics software.
My parents have been very supportive and very, very
patient.
vi
LIST OF FIGURES
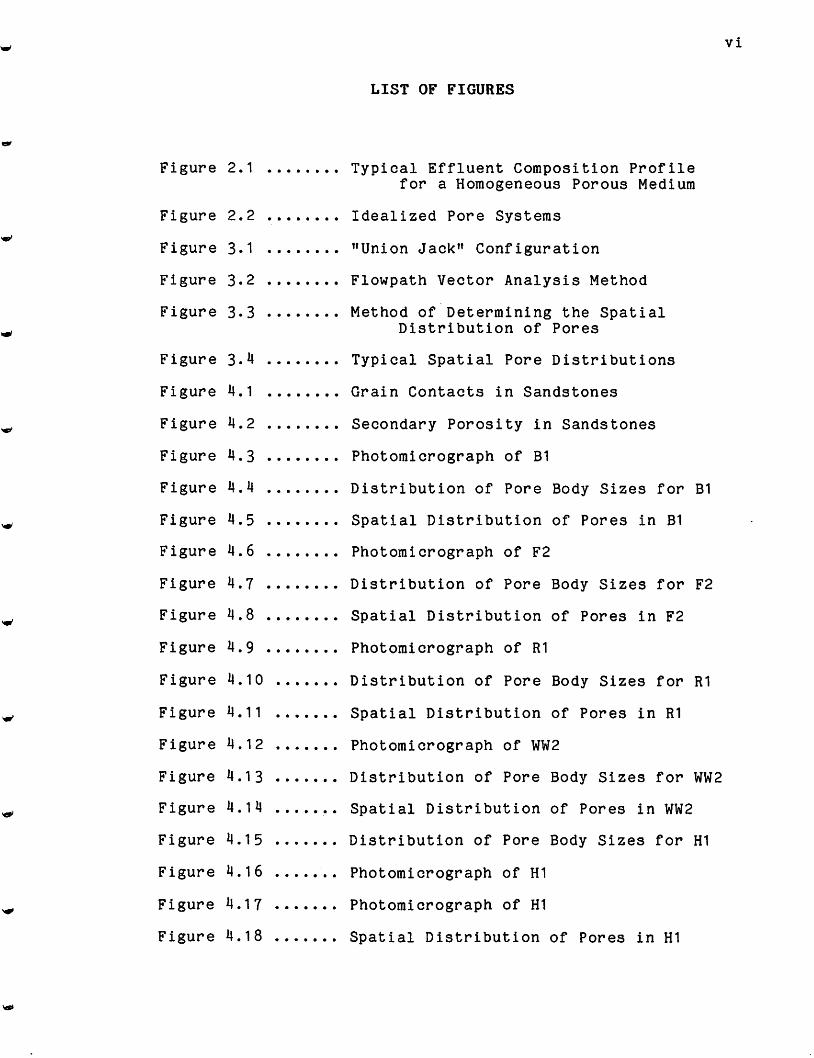
Figure 2.1 Typical Effluent Composition Profilefor a Homogeneous Porous Medium
Figure 2.2 Idealized Pore Systems
Figure 3.1 "Union Jack" Configuration
Figure 3.2 Flowpath Vector Analysis Method
Figure 3.3 Method of Determining the SpatialDistribution of Pores
Figure 3.^ Typical Spatial Pore Distributions
Figure U.I Grain Contacts in Sandstones
Figure M.2 Secondary Porosity in Sandstones
Figure 4.3 Photomicrograph of B1
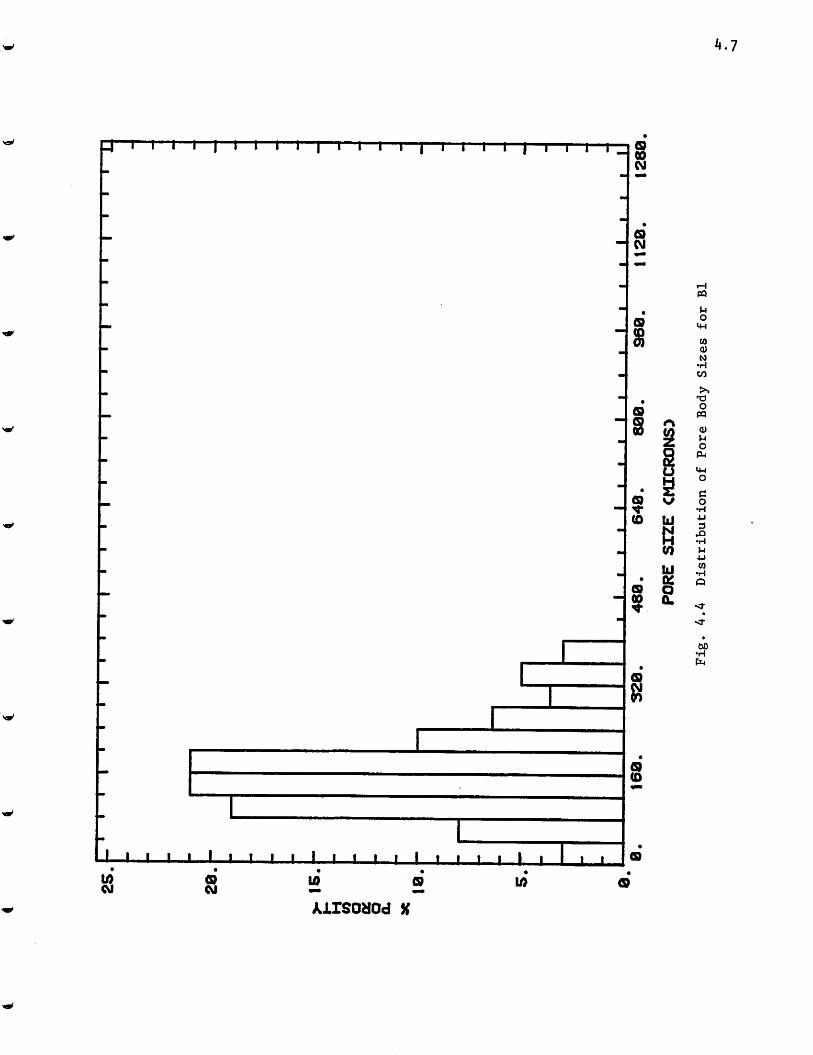
Figure 4.4 Distribution of Pore Body Sizes for B1
Figure 4.5 Spatial Distribution of Pores in B1
Figure 4.6 Photomicrograph of F2
Figure 4.7 Distribution of Pore Body Sizes for F2
Figure 4.8 Spatial Distribution of Pores in F2
Figure 4.9 Photomicrograph of R1
Figure 4.10 Distribution of Pore Body Sizes for R1
Figure 4.11 Spatial Distribution of Pores in R1
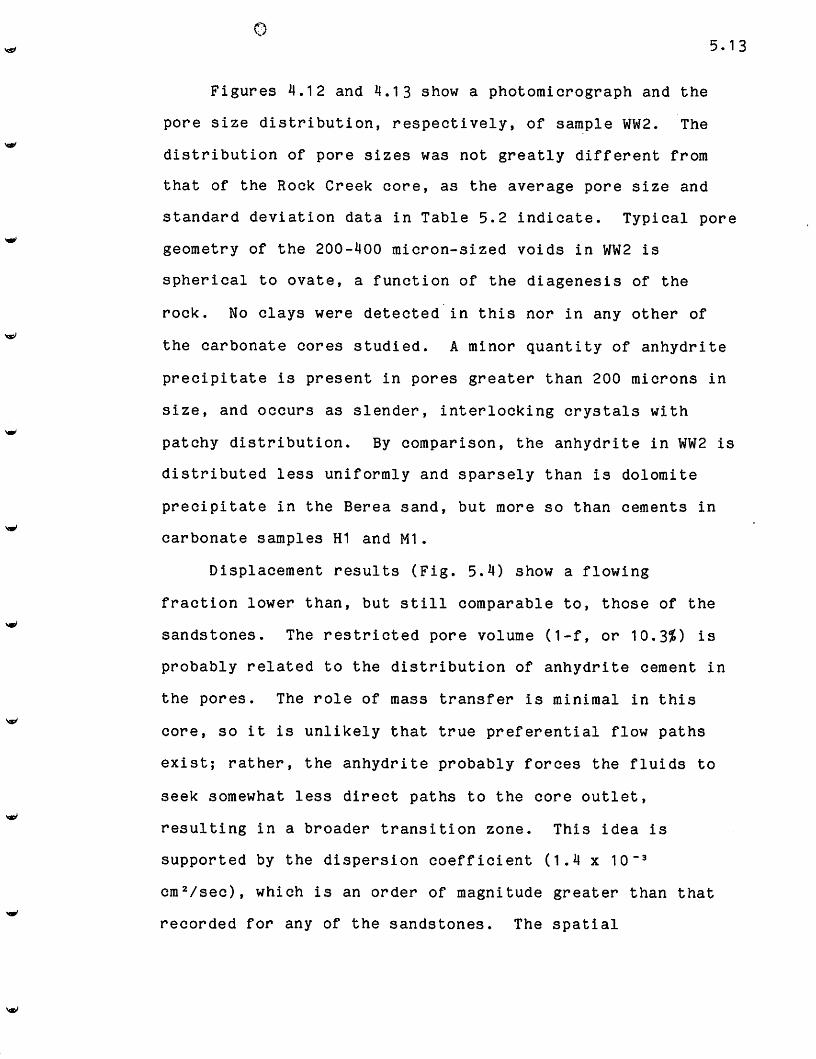
Figure 4.12 Photomicrograph of WW2
Figure 4.13 Distribution of Pore Body Sizes for WW2
Figure 4.14 Spatial Distribution of Pores in WW2
Figure 4.15 Distribution of Pore Body Sizes for HI
Figure 4.16 Photomicrograph of HI
Figure 4.17 Photomicrograph of HI
Figure 4.18 Spatial Distribution of Pores in HI

Figure
Figure
Figure
Figure
Figure
Figure
Figure
Figure
Figure
Figure
Figure
Figure
Figure
Figure
Figure
Figure
Figure
Figure
Vll
LIST OF FIGURES - Continued
4.19 Photomicrograph of SAO
4.20 Distribution of Pore Body Sizes for SAO
4.21 Photomicrograph of SAO
4.22 Spatial Distribution of Pores in SAO
4.23 Photomicrograph of Ml
4.24 Photomicrograph of Ml
4.25 Distribution of Pore Body Sizes forthe Lower 84^ of Porosity in Ml
4.26 Distribution of Pore Body Sizes for Ml
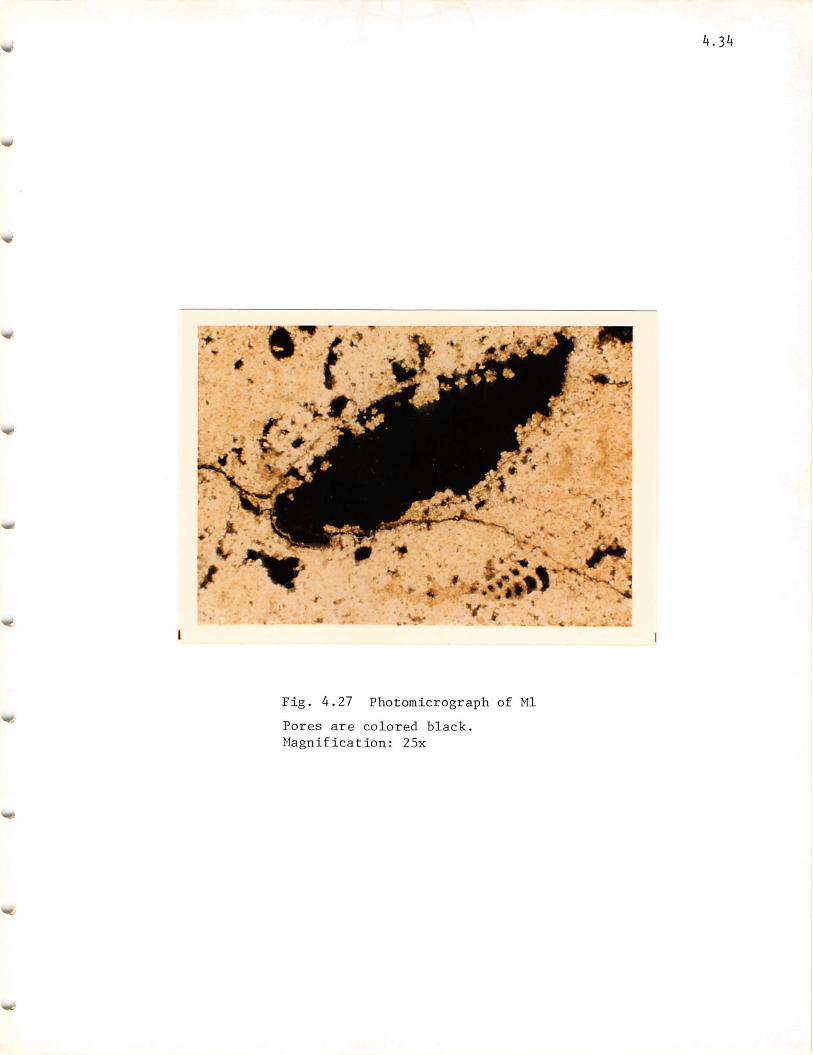
4.27 Photomicrograph of Ml
4.28 Spatial Distribution of Pores in Ml
5.1 Effluent Composition Curve for B1
5.2
5.3
5.4
5.5
5.6
5.7
F2
R1
WW2
SAO
HI
Ml
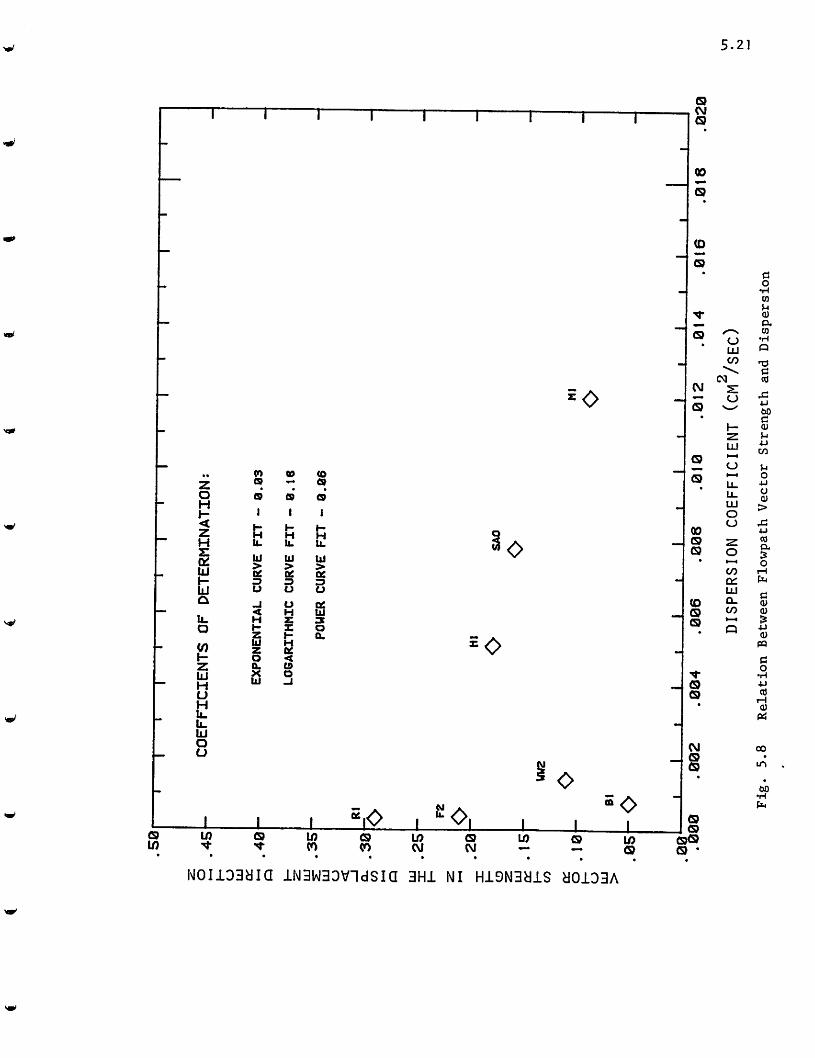
5.8 Relation Between Flowpath VectorStrength and Dispersion
Figure 5.9 Relation Between Flowpath VectorStrength and Flowing Fraction

viii
LIST OF TABLES
Table 3.1 Mean Pore Sizes Used in Constructionof Spatial Pore Distributions
Table 5.1 Summary of Miscible Displacement Results
Table 5.2 Summary of Pore Space Data
Table 5.3 Summary of Flowpath Vector Analysis Data
Table A.I Summary of Core Properties
Table A.2a Petrographic Data for Sandstone Cores
Table A.2b Petrographic Data for Carbonate Cores
Table A.3 Identification of Clay Minerals byX-ray Diffraction
ix
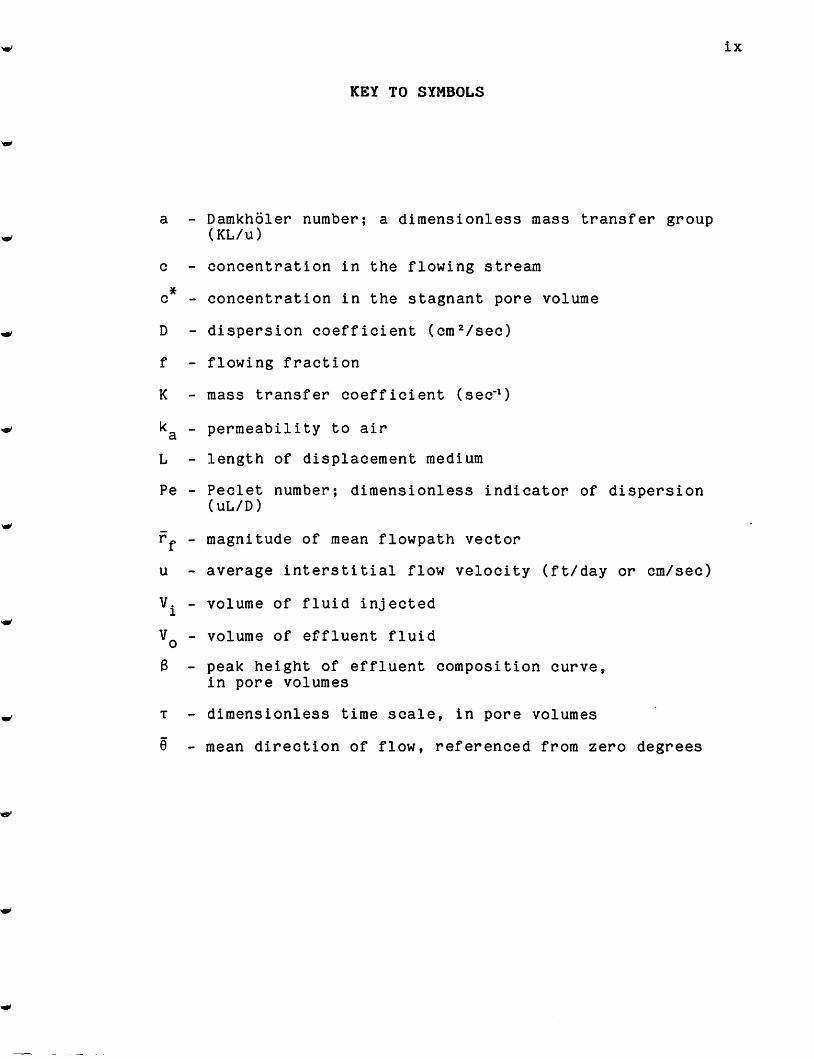
KEY TO SYMBOLS
a - Damkholer number; a diraensionless mass transfer group(KL/u)
0 - concentration in the flowing stream
c - concentration in the stagnant pore volume
D - dispersion coefficient (cm^/sec)
f - flowing fraction
K - mass transfer coefficient (sec*)
- permeability to air
L - length of displacement medium
Pe - Peclet number; dimensionless indicator of dispersion(uL/D)
r^ - magnitude of mean flowpath vector
u - average interstitial flow velocity (ft/day or cm/sec)
- volume of fluid injected
Vq - volume of effluent fluid
3 - peak height of effluent composition curve,in pore volumes
T - dimensionless time scale, in pore volumes
0 - mean direction of flow, referenced from zero degrees

1.1
CHAPTER 1
BACKGROUND, PREVIOUS WORK AND PURPOSE
Phase compositions which occur in CO2 displacements are
the result of mixing of 00^, oil and water as they flow
through porous reservoir rock. Chemical engineers have
created a substantial body of literature which is concerned
with the phase behavior of fluids under a variety of
physical and chemical conditions. Likewise, geologists have
long been examining characteristics of pore structure, not
only for determining levels of petroleum production from
established fields but also in developing predictive
exploration models for undiscovered resources. An
increasing number of workers are concentrating on bridging
the gap between the two disciplines, because it is apparent
that an understanding of how fluids move, mix and interact
within a reservoir requires such interdisciplinary study.
' Displacement of oil by CO2 in reservoirs is a
complicated process both from the phase behavior and
reservoir pore structure points of view (Spence and Watkins,
1980, Gardner et al., 1981, Orr and Taber, 1984). Phase
compositions strongly influence the ability of CO2 to
extract hydrocarbons in a CO^ flood, and hence they
determine the efficiency of a flood. Fluid compositions
that occur are the result of mixing within the pore
structure of the reservoir; mixing is influenced by
diffusion and dispersion.

1 .2
Though much work has been done to describe flow
behavior in displacements, few studies have been undertaken
to examine the effects of pore structure on mixing in
natural porous media. Mathematical modeling of
displacements is a convenient method of predicting flow
behavior. Many investigators have attempted to model the
mixing that occurs as fluids flow. Taylor (1953) described
the mixing that occurs by simple radial diffusion across a
velocity profile in a capillary tube. Perkins and Johnston
(1963) wrote a comprehensive discussion of diffusion and
dispersion in porous media. They examined the model of a
porous medium as a network of flow chambers with random size
and flow conductivity, connected by openings of smaller
size; flow behavior in this uniform system could be modeled
by simple dispersion alone. Further, Perkins and Johnston
discussed factors affecting mixing such as particle size
distribution, particle shape and packing heterogeneities in
unconsolidated grain packs.
To describe flow in heterogeneous pore systems, Deans
(1963) devised a two-parameter flow model which divides the
pore system into two components: the flowing stream in which
mixing does not occur, and stagnant pores in which fluids
are exchanged with those in the flowing stream by diffusion.
Coats and Smith (196^1) refined Deans* model into a
three-parameter model which assumes dispersion in the
flowing stream and diffusion from the stagnant pore volume.
The Coats-Smith model is discussed further in Chapter 2; it

1 .3
is this model of flow which is used for the determination of
the displacement results examined in this study. Yellig and
Baker (1980) considered the physical significance of the
Coats-Smith model and determined that the parameters do not
individually have physical significance. They suggested use
of an "effective dispersion coefficient" which encorporates
the three Coats-Smith parameters into one term. Yellig and
Baker further pondered the difficulty of scaling up
laboratory displacements to the reservoir level. They
showed that as system length increases, mixing in
heterogeneous media can be described by a simple dispersion
model which features the effective dispersion coefficient.
The present study is concerned with mixing behavior in
very complicated porous media, specifically, natural
reservoir rocks. Due to the complexity of rock pore
systems, it is desirable to begin with simple fluids and
develop an understanding of how they mix before advancing to
more complicated multiphase systems. To this end, this
thesis examines the composition and pore system character of
four carbonate and three sandstone cores. Data describing
pore structure are related to results of single-phase, unit-
mobility-ratio miscible displacements in the cores.
While a number of efforts have been made to examine
complex fluids in very simple porous media (Simon and
Kelsey, 1971, 1972, Morrow, 1979, Orr, Silva and Lien, 1983,
and others), very few workers have previously attempted to
relate mixing parameters to pore structure in reservoir

1 .4
cores. Spence and Watkins (1980) commented on the relation
between low flowing fractions and wide pore size
distributions,
Related geological studies of reservoir cores have
addressed the classification of porosity and permeability,
development and destruction of pores within strata, and
morphology of pore structure in rocks. For example, a
method of classifying pore space in carbonates, devised by
Archie (1952), is purely descriptive and is designed to
infer information on pore structures too small to be
observed under the petrographic microscope. Choquette and
Pray (1970) developed a morphogenic classification of pore
space for geologic facies interpretation. Lucia (1983)
classified pore space in carbonates according to size and
inter-connectivity.
Murray (I960) discussed formation of porosity in
carbonate rocks due to both depositional and diagenetic
processes, specifically the formation of dolomite. Longman
(1980) related climate to preservation of both primary and
secondary porosity in carbonates. Pittman (1971) examined
the factors which influence microporosity development in
carbonate rocks. Donath et al. (1980) experimentally
produced secondary porosity in a limestone core by
pressuring the core while injecting an acidic solution.
Cussey and Friedman (1977) related pressure solution to
porosity preservation in ooid reservoirs of France. Enos
and Sawatsky (1981) related porosity and permeability to

1 .5
particle size and degree of cementation in carbonate
sediments. Wardlaw (1980) examined the effects of pore
structure on multiphase displacement efficiency, both in
rocks and in glass micromodels. No previous studies have
been done which relate mixing of even the simplest fluids to
pore structure in cores.
The program of research described here was designed to
investigate the following questions.
1 . What is the nature of the relationship between porestructure and fluid mixing?
2. Which characteristics of reservoir rocks affect
displacement efficiency?
3. Can the Coats-Smith model parameters be related topore structure in rocks?
Chapter 2 describes the principles which underlie
displacement theory, reviews the Coats-Smith model, examines
the petrophysical properties of pore systems and discusses
their influence on mixing. In Chapter 3, a description of
the methods used to analyze the sample cores is presented
along with an explanation of data manipulation. Chapter M
discusses the geological processes responsible for pore
system development in the studied samples, and their
resulting pore structure. Idealized physical models of pore
systems and predicted flow behavior of fluids in them are
also discussed. A discussion of results is given in Chapter
5, which also includes comparison of displacement results
with pore structure of each studied sample. Conclusions of
this work are presented in Chapter 6. Petrographic and other
core data are found in Appendix A.

CHAPTER 2
MIXING DURING SINGLE-PHASE MISCIBLE
DISPLACEMENTS IN RESERVOIR CORES
2.1
Single-Phase Displacements
The following discussion of single-phase displacements
is condensed from Orr and Taber (1984). In miscible
displacements, a transition zone develops between the
displaced and displacing fluids. As the displacement
progresses, the transition zone grows due to molecular
diffusion, to mixing caused by variable flow velocities
within individual pores (Taylor, 1953) and to mixing which
results from non-uniform flowpath length caused by
pore-scale heterogeneities in the porous medium.
In miscible displacement experiments, the composition
profile cannot be easily measured at a fixed time. Instead,
the compositions of fluids passing a fixed point, the core
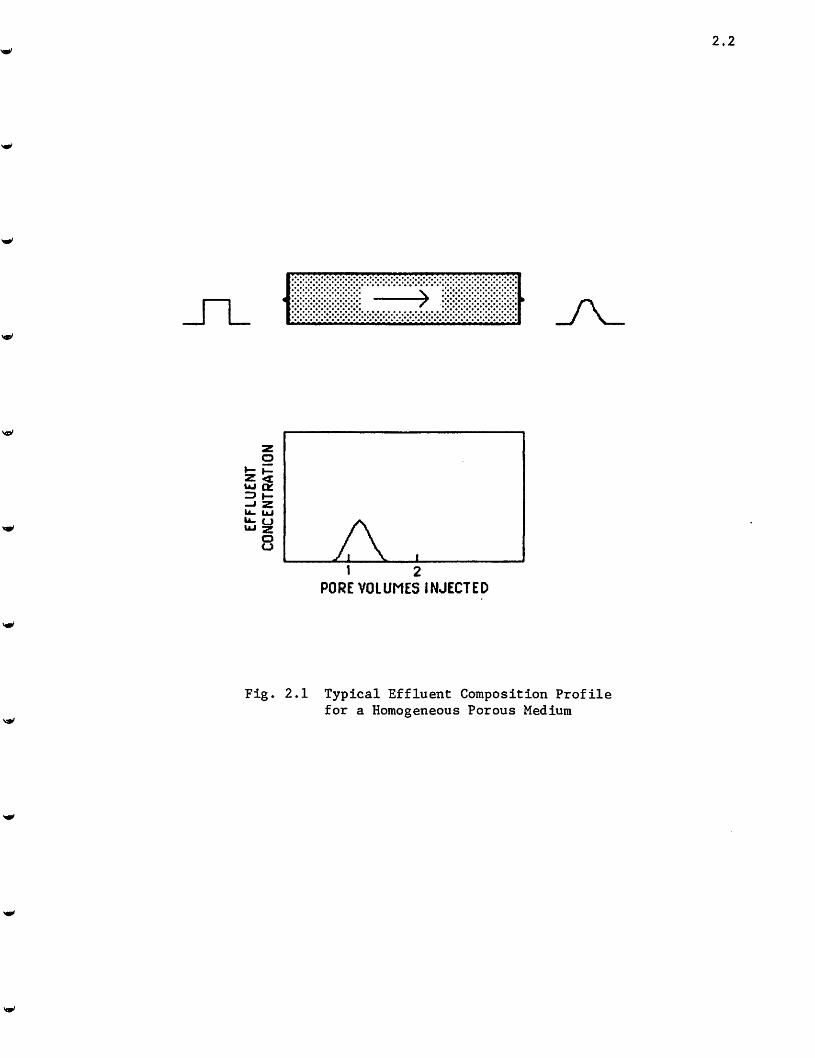
outlet, are measured. In a typical experiment, a core is
saturated with one fluid, then a pulse of a second
(displacing) fluid is injected. A plot of effluent
concentrations against time (Figure 2.1) for a displacement
in a homogeneous medium will be slightly asymmetric since
the transition zone continues to expand during the time
period in which it is produced.
A simple diffusion model is used to show the
symmetric expansion of the transition zone. The model uses
1 2
PORE VOLUMES INJECTED
Fig. 2.1 Typical Effluent Composition Profilefor a Homogeneous Porous Medium
2.2
2.3
one diraensionless parameter, the Peclet number (Pe). The
Peclet number is related to the flow velocity, dispersion
coefficient and length of the mixing chamber as defined in
Equation 2.1.
3t 35 Pe 35^
Pe =
= 0
(2.1)
where: c = concentration in the flowing stream= dimensionless length scale= dimensionless time scale in pore volumes
Pe = Peclet number
u = velocity of intersitial flowD = dispersion coefficient (core-scale)
or diffusion coefficient (pore-scale)L = length of mixing chamber
The higher the Peclet number, the lower the effect of
dispersion in the displacement process. The length of the
"mixing chamber" previously referred to is a critical factor
when considering Peclet values. When L is scaled to the
order of a pore diameter, a "microscopic" Peclet number
results, which describes the role of diffusion at the pore
level. When L is considered to be the length of the
displacement core, a "macroscopic" Peclet number which
describes dispersion over the length of the core results.
In many displacements, observed effluent composition
profiles are more asymmetric than can be explained by
transition zone growth alone. Deans (1963) and Coats and
Smith (196M) proposed models to account for the asymmetry.
Both models hypothesized that some portion of the porous

medium might be stagnant, so that fluid present in such
"dead-end pore volume" (DEPV) would be recovered only by
mass transfer into the flowing stream. Deans* model
considered mass transfer from DEPV by means of a "flowing
fraction" parameter and a mass transfer coefficient.
Flowing fraction (f) is defined by Deans (1963) as the
fraction of total pore volume in a porous medium which is
occupied by mobile fluid. Deans* model has the form
r 9c , r\ 9c" . 9c _ ^
2.4
(2.2)
= a(c-c*)
where: f^ = flowing fractionc = concentration in DEPV
a = dimensionless mass transfer coefficient(Damkohler number, KL/u)
K = mass transfer coefficient (sec M
The model proposed by Coats and Smith, called the
differential capacitance model, accounted for mass transfer from
DEPV as well as longitudinal dispersion. Their model has the
form
f ^ H. (1-f) M^l£--L^=o3t 8t Pe 3? ^ °
(2.3)
(1-f) ^ = a(c-c*)
By using the flowing fraction (f), the Peolet number (Pe)

2.5
and the mass transfer group (a) to describe flow, the
Coats-Smith model attempts to represent small-scale
heterogeneity of the porous medium.
Unfortunately, there is no simple method to measure f
and a independently; rather, a "best fit" of displacement
parameters f, Pe and a is determined by parameter
estimation techniques applied to effluent composition data.
A comprehensive discussion of the precision of
Coats-Smith parameter measurements, parameter sensitivity,
and dependency of the parameters on flow velocity is given
by Orr and Taber (198U). The remainder of this thesis is an
attempt to relate observations of pore structure to the
values of f, Pe and a.
Mixing in Rocks
Mixing during displacements in a reservoir core must be
strongly influenced by the structure of the pore network.
The structure of the pore network, in turn, is determined by
the composition and distribution of constituent rock
components. Development of pore system structure in a rock,
then, is ultimately controlled by a combination of depositional
and diagenetic processes which occur over geologic time (see
Chapter ^1).
Features of reservoir pore structure which influence
mixing occur in a wide range of sizes; at the interwell scale
facies changes, fractures and less common features such as
cavernous porosity affect displacement performance. On the

2.6
microscopic level, mixing is affected by local
heterogeneities of pore structure. In the discussion that
follows, petrophysical factors which affect mixing at the
pore level are examined. Though large-scale reservoir
features are not considered here, this study represents a
first step toward relating flow behavior to reservoir
petrology.
In traditional petrophysical analysis of pore systems,
properties such as porosity, permeability, pore size and
shape, coordination number (the number of pores connected to
a reference pore) and aspect ratio (the ratio of pore body
size to pore throat size) are considered. While it is clear
that each of these properties exerts some influence on flow
phenomena, individually, none of them seems likely to
control mixing behavior. For instance, it is easy to
envision two rocks which have approximately equivalent
values of porosity and permeability but exhibit totally
different mixing behavior. Pore size alone also seems
unlikely to strongly influence mixing. Consider two
geometrically similar pore systems differing only in average
pore size. It is likely that miscible displacements in
these systems would produce similar effluent composition
profiles as long as the flow velocity was low enough to
allow diffusion to equalize concentrations within typical
pores (Orr and Taber, 1984). Pore shape and pore wall
roughness must play some role in fluid mixing, but if pores,
on average, are small enough, or flow is slow enough, that

2.7
diffusion can equalize concentrations within them, it is not
clear that convoluted, polyhedral pores would produce
results very different from those of smooth, spherical
pores.
Aspect ratio and pore coordination number have been
shown to strongly affect fluid distribution when capillary
forces are important (Wardlaw, 1980, Chatzis et al., 1982),
but it is not clear how they influence mixing in
single-phase miscible displacements.
Carman (1939) reasoned that for a porous rock, the
average flowpath is ^5° to the direction of displacement.
Flowpath tortuosity has an influence on transition zone
development during a displacement (Orr and Taber, 1984). It
is hypothesized, then, that a relation exists between the
dispersion coefficient (a reflection of the size of the
transition zone) and the mean flowpath orientation, as
determined by vector analysis of pore structure in thin
section. An inherent assumption here is that a mean
flowpath normal to the direction of displacement would
produce a higher dispersion coefficient than one resulting
from a mean flowpath parallel to the longest axis of the
core.
One property which clearly does influence mixing is the
pore size distribution. Spence and Watkins (1980) found
that displacements in samples with wide pore size
distributions resulted in flowing fractions of less than
one. It is useful here to reconsider the definition of

2.8
flowing fraction in order to better understand the
significance of the pore size distribution.
Flowing fraction (f) is defined by Coats and Smith
(1964) to be the fraction of total pore volume in a porous
medium which is occupied by mobile fluid. This idealization
implies that some of the pore volume contains immobile
fluid, but this is not necessarily the case. Spence and
Watkins (1980) argued that fluid need not be strictly
stagnant to be included in the nonflowing fraction.
Instead, it need only flow significantly more slowly than
fluid in other protions of the pore space. The distinction
to be made here is that fluids which comprise the "main
flowing stream" in a displacement are considered to be the
fluids which move at relatively high velocities through
large, well-connected pores and fractures. "Dead-end pore
volume" (Coats and Smith, 1964) is actually restricted pore
volume in which fluids move slower due to smaller pore size,
greater flowpath tortuosity, and constrictions or
obstructions between pores.
It follows, then, that a flowing fraction of less than
one may indicate the existence of preferential flowpaths in
the rock. If true, then a wide distribution of pore sizes
may be associated, at least loosely, with preferential flow
channels. It seems likely, however, that a wide pore size
distribution does not guarantee a flowing fraction of less
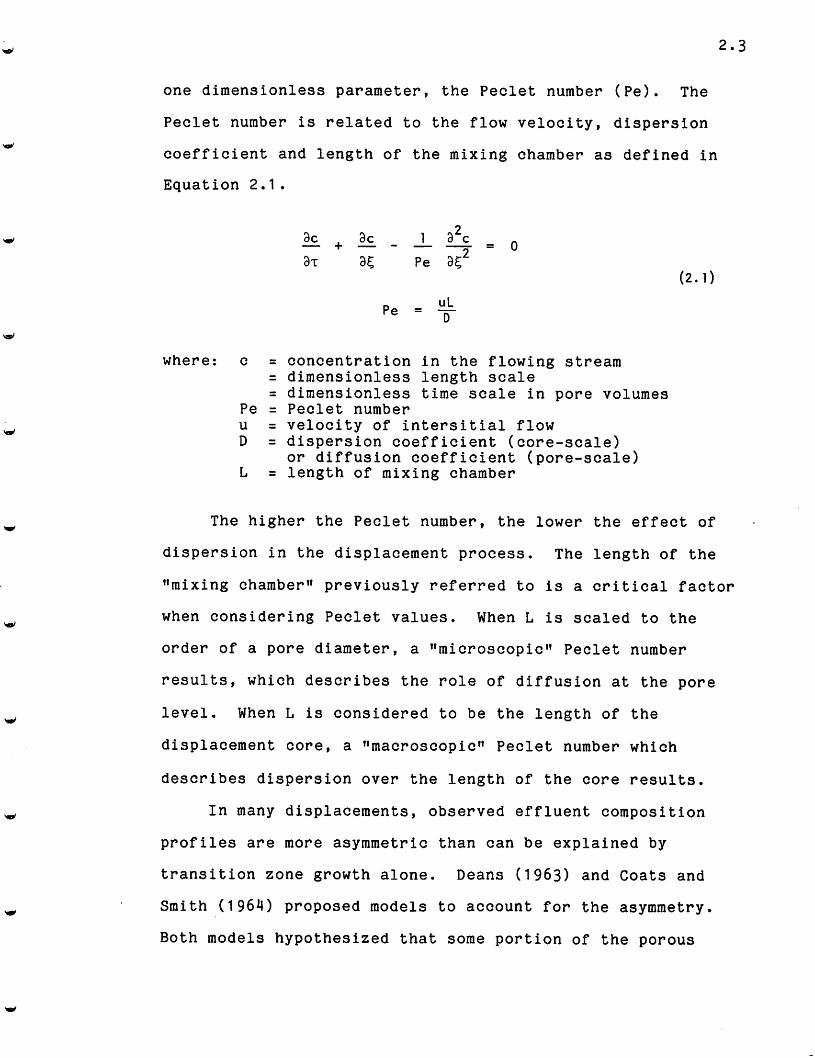
than one. Figure 2.2 shows four idealized pore systems with
the same pore size distribution but very different flow
f/diMi^4S9QM%^iRANDOM DISTRIBUTION OF
LARGE AND SMALL PORES
b. RANDOM DISTRIBUTION OF
CLUSTERS OF LARGE AND
SMALL PORES
0^3^:
^e>dr 6<
c. NONRANDOM DISTRIBUTION
OF CLUSTERS OF LARGE
AND SMALL PORES
d. FRACTURES AND VUGS
tu cr
Fig. 2.2 Idealized Pore Systems
f~ I , D sma
f~ I, D large
f < I . a >0

2.10
behavior. In Figure 2.2a, the large and small pores are
randomly distributed. Flow in such a system would be
characterized by a flowing fraction of one and a dispersion
coefficient greater than that of a system of totally
homogenous pores, but still relatively low. Figure 2.2b
shows pores with the same size distribution, but a varied
spacial distribution. The large and small pores are
arranged in clusters, and the clusters themselves are
randomly distributed so that no preferential flow paths
exist for samples which are large compared to the scale of
the clusters. Such a pore system would also have a flowing
fraction of one, since local variations in flow would
average out over a large-enough flow distance. The
dispersion coefficient would be larger here compared to the
previous case, a reflection of greater mixing due to the
local flow variations.
In Figure 2.2c, another pore system containing clusters
of large and small pores is shown. In this case, the
distribution of clusters is not random. Preferential flow
paths exist, and slower-moving fluids in smaller, restricted
pores exchange by diffusion into these paths. Results of a
displacement performed in this pore system can be
characterized by a flowing fraction of less than one,
dispersion in the main flowing stream, and mass transfer
between restricted and flowing streams. The fourth
idealization (Fig. 2.2d) represents a variation of the
preceeding pore system. The pore structure contains

2.11
fractures, vugs, and matrix micropores. Again, this system
leads to very early breakthrough of the displacing fluid and
therefore a value of f which is much less than one. This
configuration most closely approximates the pore structure
envisioned in the Coats-Smith model.
These idealized pore systems suggest that a wide pore
size distribution alone is not sufficient to produce low
flowing fractions. The pore space must also be connected in
ways which result in preferential flow paths on the scale of
the displacement.

3.1
CHAPTER 3
SAMPLE EXAMINATION METHODS
This chapter presents the methods of core examination
and data collection employed in this study. Seven core
samples were examined: three sandstones of various ages from
Ohio, Wyoming and West Virginia, and four San Andres
Formation (Permian) dolomites from New Mexico and West
Texas. All of the samples were studied in hand sample,
thin section, and by X-ray diffraction. Insoluble residue
analysis was performed on the four carbonates; selected
samples were examined on the SEM. A number of techniques
were employed to study pore structure and are described
below.
Whole Core Analysis
Core samples were examined with a hand lens to
determine presence of sedimentary structures, stylolites,
and the general character of the rock. Porosity and
permeability-to-air were reported by Orr and Taber (198U).
Thin Section Preparation
At least three thin sections of each sample were
examined under the petrographic microscope. Limited
availability of certain samples required such a minimum;
additional thin sections were cut from larger samples. One

3.2
thin section of each sample was cut normal to the assumed
bedding plane to establish the presence or absence of
sedimentary structures and vertical changes in grain-size
distribution. The other two thin sections were cut parallel
to the axis of the core used in the displacement experiment.
Displacement cores were horizontal plugs taken from
standard, vertical borehole cores. One of these sections
was impregnated with colored epoxy to accentuate pore
structure under the microscope.
Thin Section Petrography
Thin section microscopy provided information on types
of constituent grains, cement and matrix, including
mineralogy, size, shape, habit (crystals) and packing
structure. The diagnostic stain Alizarin Red-S was used to
identify calcite in the samples. Three-hundred-point counts
were done on the slides; the results are tabulated in
Appendix A.
Data which characterize pore system structure were
obtained from photomicrographs of the samples and from
direct observation under the microscope. Pore size
distributions were determined by a previously undescribed
method of point counting, herein named the "Union Jack"
method. Using a very fine lead, a series of lines were
drawn across the face of a thin section, resulting in a
pattern resembling that of the British flag (Figure 3.1),
hence the name. During a traverse of these lines under the

3.3
Fig. 3.1 "Union Jack" Configuration

3.4
microscope, between three-hundred and five-hundred pores
were measured and catagorized by size. This method offers
no distinct advantages over other point-counting methods;
it was adopted for convenience in lieu of an automated
microscope stage.
Pore size was defined to be the diameter of the
smallest circumscribing circle which can be drawn around a
pore. This definition was adopted for simplicity in view of
the number of measurements required per thin section. This
method of pore measurement exaggerates the diameter and
volume of the pore somewhat, because it is based on the
longest dimension of the pore. Measurement of pore sizes in
thin section partly compensates for this exaggeration
because a random slice through a rock shows only a few pores
which have been cut through their longest dimension.
Further limitations lie in the failure to account for
convoluted pore geometries, the attempt to describe
3-dimensional pore structure with essentially 2-diraensional
thin sections, and in the subjectivity of the observer in
determining the bounds of each pore measured. Every effort
was made to measure pore sizes of each of the samples in a
consistent manner.
Pore size distribution histograms were constructed by
plotting the percent of total porosity contained in pores of
a given size against that pore size. The histograms were
constructed using the same scale of pore size for ease in
comparison of results between samples. In the case of
dolomite sample Ml, an additional, larger-scale histogram
was necessary due to the very wide distribution of pore
sizes in that sample.
Scanning Electron Microscopy (SEM)and
Energy-Dispersive X-Ray Analysis (EDX)
3.5
The SEM was used to characterize the nature of pore-
throat structure and identify pore-lining clay minerals.
The EDX was employed to identify mineralogies of unknown
grains and crystals. Tiny (~1.0 cm) chips of sample were
glued onto disc-shaped steel mounts with epoxy. The samples
were coated with silver to enhance electrical conductivity
and then run on the SEM at 20.0 kV over a variety of
magnifications. Due to operational problems with the SEM,
only half of the samples studied were examined with this
analytical tool.
X-Ray Diffraction of Clay Minerals
Identification of clay minerals in the samples was
accomplished by use of X-ray diffraction. Clays occur in
all of the studied sandstones but in none of the carbonates.
A detailed treatment of the X-ray diffraction techniques
employed is found in Grim (1968). X-ray diffraction
data are found in Appendix A.

3.6
Flowpath Vector Analysis
Some measure of the tortuosity of a pore network may be
determined by examining the average flowpath orientation
within the system. Mean flowpath orientation might be
related to dispersion coefficient, as discussed in Chapter 2.
The procedure for determining mean flowpath vectors is
identical for both sandstones and carbonates. Two 8" x 10"
photomicrographs of each sample were oriented with respect
to the direction of displacement (0®). Each sample was
photographed at a constant magnification to permit
comparison of results. After placing a photo on a table, a
brad was dropped onto the print to randomly determine which
pore was to be examined. When the brad landed on a pore,
the path from the reference pore center to the center of a
connected, nearest-neighbor pore was described by means of a
series of vectors measured relative to the direction of
displacement. In cases where more than one pore was
connected to a reference pore, pores which connected
toward the displacement direction were measured (Fig. 3.2).
Fifty flowpath orientations were recorded from each
photograph, giving a total of one-hundred flowpath
orientations per rock sample. Mean flowpath orientations
(0) and vector strengths (r^) are tabulated in Table 5.3.
One limitation of this method is that 2-dimensional
pore representations were used to infer 3-dimensional pore
structure in the rock samples. This probably causes a
significant amount of measurement error.

DISPLACEMENT
DIRECTION
Fig. 3.2 Flowpath Vector Analysis Method
3.7

3.8
Spatial Distribution of Pores
Photomicrographs described in the preceeding discussion
of vector analysis were re-examined in an effort to
determine if spatial pore distributions, that is, the manner
in which pores of a given size are connected to similarly-
or variably-sized pores, show trends which are useful in the
interpretation of miscible displacement results.
The procedure involves random selection of a reference
pore in the same manner as was done for the vector
measurements. A semicircle with diameter (base) equal to
three times the mean pore size of the sample was drawn on
the photo (Fig. 3.3). Table 3.1 contains the mean pore
sizes of the samples used in the construction of the
semicircles. Three times the mean pore size was chosen as
the diameter of the semicircle with the hope that a
representative sample of proximal pores could be obtained.
The center of the base of the semicircle was passed through
the center of the reference pore; the base was drawn normal
to the direction of displacement, and the arc was oriented
in the displacement direction.
All pores within the semicircular area were counted and
their diameters measured whether or not they appeared to be
directly connected to the reference pore. A mean size of
these neighboring pores was then determined. The above
procedure was repeated for fifteen randomly chosen reference
pores measured from photos of each sample. Fifteen was

f • ® ^ U^ 0 tr g V /ao ^Oq ' oiafeplS'Crg^-n'O
AB = 3x MEAN PORE SIZE
REFERENCE PORE
Q
PJc»oo
DISPLACEMENT VDIRECTION
Fig. 3.3 Method of Determining the Spatial Distribution of Pores
3.9

3.10
TABLE 3.1 Mean Pore Sizes Used in Construction of Spatial Pore Distributions
Sample Mean Pore Size (y) 3x Mean Pore Size (p)
B1 169.44 508.32
F2 108.48 325.44
R1 259.80 779.40
WW2 343.23 1029.69
HI 471.91 1415.73
SAO 440.29 1320.87
Ml 1131.58 3394.74

3.11
chosen as the number of reference pores to be examined
because it seemed sufficiently large to adequately represent
the pore structure of the the samples while not requiring
excessive time for measurement. The reference pore sizes
were then plotted against the mean size of neighboring
pores. The results are presented in Chapter 4. If such
distributions are random (Fig. 3.4a), where pores of any
size are proximal to pores of many other sizes, than the
existence of preferential flowpaths in the core is unlikely,
since preferential flow is assumed to occur primarily in
large, well-connected pores, though some small pores may
participate also. If a trend exists in which small pores
are connected primarily to small pores and large pores to
other large pores (Fig 3.4b), preferential flow is a likely
possibility.
Single-Phase Displacements
Single-phase displacements reported by Orr and Taber
(1984) were performed at a nominal 10 ft/day rate in three
sandstone and four carbonate cores. Miscible fluids of
matched density and viscosity were used to minimize the
effects of variable fluid properties on the development of
the transition zones within the cores. A detailed treatment
of the experimental procedure is given in Orr and Taber
(1984). Briefly summarized, a core of known pore volume is
initially saturated with a fluid. Injection of a slug of
displacing fluid is achieved using a Teflon sample loop of

3.12
a. RANDOM DISTRIBUTION OF PORE CONNECTIONS
REFERENCE PORE SIZE
b. CONNECTIONS BETWEEN LIKE-SIZED PORES
REFERENCE PORE SIZE
Fig. 3.4 Typical Spatial Pore Distributions

3.13
known volume. The displacing fluid differs from the
displaced fluid by the addition of a tracer, typically
sucrose. The effluent fluid mixture passes through an
on-line refractive index detector which produces a linear
response to sucrose concentration. The concentration of one
fluid with respect to the second fluid can be determined for
any point in time during the displacement. Data is plotted
as concentration vs. pore volumes injected; a typical curve
would be similar to that shown in Figure 2.1. Since the
pump (flow) rate is held constant during the experiment, the
"pore volumes injected" axis is equivalent to a "time" axis.
Results of these displacements are tabulated in Table 5.1.

CHAPTER 4
PETROLOGIC ELEMENTS RELATED TOPOROSITY AND PERMEABILITY DEVELOPMENT
M.1
The structure of pore systems in reservoir rocks is
related to the composition and structure of the rocks
themselves. Pore network development is controlled by a
complex interaction of physical and chemical processes which
operate over geologic time. This chapter discusses the
development of porosity types which occur in the sandstones
and carbonates studied.
Geologists loosely group reservoir porosity into two
types. Primary porosity refers to voids which are present
at the time of sediment deposition. Secondary porosity
indicates voids which exist as the result of diagenetic
processes, such as fracturing and dissolution.
Pore Development in the Sandstone Samples
In sandstones, primary porosity occurs primarily as
intergranular voids, but also as micropores between detrital
clays, if they are present. The structure of intergranular
pores is dependent on the shape, size, sorting and packing
of the grains. Well-developed primary porosity (Fig. 4.1a),
if not destroyed during diagenesis, is often associated with
high permeability.
Diagenetic processes which reduce porosity and
permeability include compaction, pressure solution and


^.3
cementation. Figure ii.lb is a schematic sketch of the
combined effects of compaction and pressure solution on
intergranular porosity. Regular intergranular pore texture,
characterized by point contacts between grains, alters to a
texture with line and concavo-convex contacts, and lower
porosity and permeability.
Other diagenetic processes serve to enhance porosity.
These include dissolution of grains and cements, chemical
alteration of grains (i.e. feldspar altered to clay
minerals), and fracturing. Dissolution of detrital grains,
authigenic cements and replacement minerals (Figs. U.2a-c)
is common and individual sandstones often contain a
combination of dissolution-pore types (Pittman, 1979).
Micropores occur in sandstones among clay mineral
interstices or at pore-throat constrictions. Authigenic
clays may precipitate directly from pore fluids or as a
result of chemical destruction of Ui situ feldspar grains.
Fracturing (diagenetic or artificially induced)
provides additional permeable flow paths. In rocks with
well-developed primary porosity and permeability, the effect
of fractures on flow is small compared to rocks with lower
initial permeability (Fig. U.2d).
Petrology and Pore Structure of the Sandstone Cores
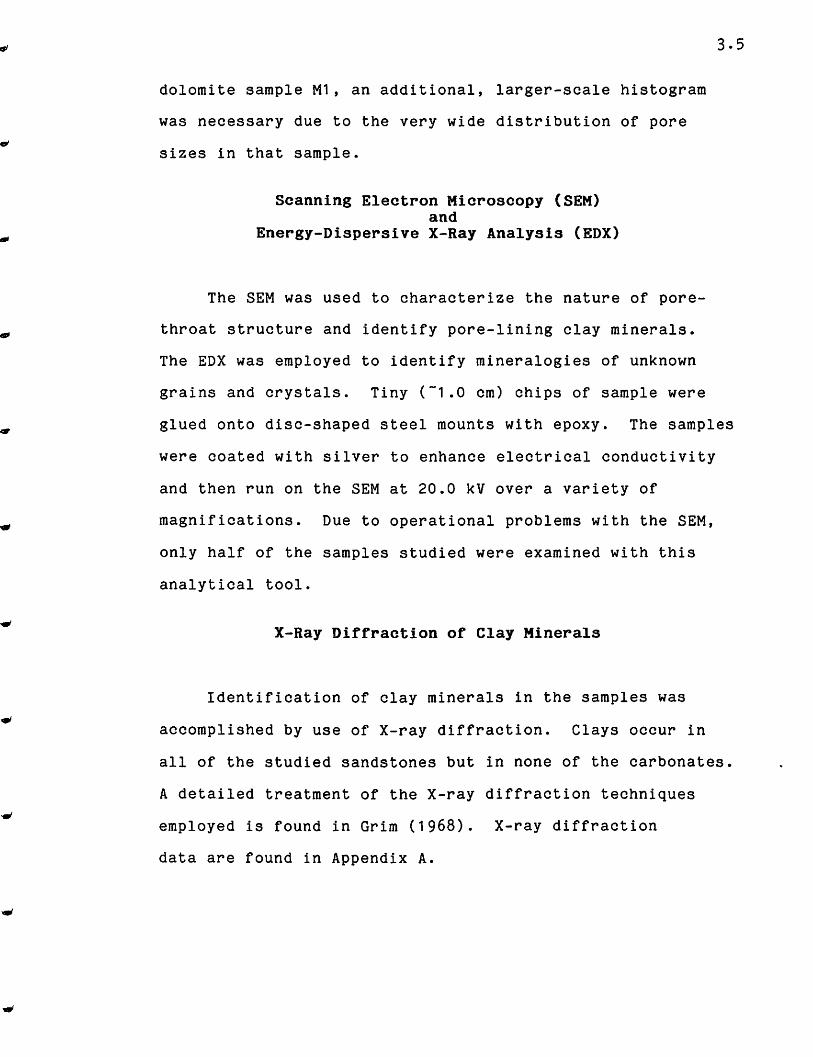
The Berea sandstone (sample B1, Figure 4.3) is a
very-well-sorted sublitharenite of Mississippian age. The
mean grain size lies on the boundary between medium and fine

8. DISSOLUTION OF SEDIMENTARY MATERIAL
b. DISSOLUTION OF AUTHIGENIC CEMENT
ir^ii
fiiil
kl'i*
C. DISSOLUTION OF AUTHIGENIC REPLACEMENT
' iir yv/o.
X \ ^4
d. FRACTURING
i 'l|f k f
f'Ai
Quartz grains PorosityCarbonateor suifate
Matrix Soluable replacement material
Fig. 4.2 Secondary Porosity in Sandstones
(after Schmidt and McDonald, 1979)
If
I
Fig. 4.3 Photomicrograph of B1
Pores are colored blue.
Magnif icat ion: 2 5x
^.5


![Ł×¨×Ł×€×fl 11.3.20 [Read-Only] - motnet.proj.ac.il•ירוס-הקורונה.pdf · ¤ ¬ § ® ¤ © ° © ® ± º ¸ ¶ ¥ · ¬ ¥ ² © ¹ ¥ § º ² ´ ¹ © ° ©](https://img.pdfslide.net/doc/110x75/6075b52d03d2632f600d255f/afl-11320-read-only-pdf-.jpg)