Embed Size (px)
Citation preview
MPRAMunich Personal RePEc Archive
Health cost in Indonesia: evidences fromIFLS and Susenas data
Sanjaya, M Ryan
Jurnal Ekonomi dan Bisnis Indonesia, Faculty of Economics
and Business, Gadjah Mada University
January 2007
Online at http://mpra.ub.uni-muenchen.de/13986/
MPRA Paper No. 13986, posted 11. March 2009 / 11:17
Health cost in Indonesia: evidences from IFLS and Susenas data
Muhammad Ryan Sanjaya *
Abstract
This paper is using statistical approach to measure health cost and to understand the pattern of health expenditure in Indonesia by utilizing raw data from Susenas and
IFLS. From the Susenas data it was found that most households use their own income to finance health expenditure, rather than by utilizing, for example, health card or
health insurance. In general, urban health expenditure in Indonesia was significantly different with their counterparts in rural areas, with average health cost is higher in
urban rather than in rural. It was found also that health expenditure was moving positively in line with household expenditure. While from the Indonesia Family Life
Survey (IFLS) data, it was found that the share of health expenditure to total expenditure is less than those exhibited in Susenas. Transportation cost to medical
facilities adds the health cost, especially to rural villagers for they had limited access to these facilities. Despite using two databases in conducting the research, results obtained should not be compared directly, for each has different methods and time
period where the surveys conducted.
Keywords: health economics, economic development, Susenas, Indonesia Family Life Survey
* Graduated from Department of Economics Gadjah Mada University undergraduate program in 2005 and currently working as economic and business analyst in an agribusiness-based company in Jakarta. The author would like to thanks to Dharendra Wardhana for its valuable support on the data and to Rimawan Pradiptyo for its inspiring insight.
Introduction The popularity of health economics within economic theory is still lagged behind
those of more well-known subjects such as monetary issue and international trade.
The cause of this unpopularity can be attributed to limited data availability and the
inexistence of robust building blocks that uniquely differentiate it with other branches
of economics. For this reason, there are quite a small number of researches
concerning health economics in Indonesia. This paper is an attempt to fill the gap.
In Indonesia, formulation of health policy must considering the capacity of
households (or individuals) in obtaining health facility. The capacity includes cost to
obtain medical benefit/assistance, which induce to the willingness to pay for those
benefits, and underlying factors of household/individual behavior toward health
benefits. One of an excellent study was from Pradhan et al. (2004) that utilize Susenas
data to measure the effectiveness of health card program in Indonesia during
economic crisis. By knowing the exact nature and structure of health awareness of
Indonesian, a better health-related policy can be proposed.
This paper will focused on the statistical aspect rather than on
causal/regression method of health issue in Indonesia. Designed as a continuing study,
this paper is limited to certain aspect of health economics for the case of Indonesia.
Future studies will be performed by introducing more advanced methodologies and
might be inherent with current paper. The study will employ and analyze micro-level
data taken from latest raw datasets of National Socio-Economic Survey (Susenas) and
the Indonesia Family Life Survey (IFLS).
Health issue in Indonesia There are several studies concerning health-related issue in Indonesia such as those of
Pradhan et al. (2004) study that tried to analyze the impact of the health card program
operated under the Social Safety Net (SSN) by employing Susenas data. Their
findings concluded that the health card program was pro-poor in a sense that those
who are poor are having greater probability to obtain health card, thus increase the use
of health services. However, since one of the health-related SSN program induced
higher public sector spending for health (supply impulse in health services), it was not
only the poor who benefited from the program. Since the poor were less sensitive to
change in public spending on health, it was the non-poor that receive some of the
benefit from the program. In the end, it was the non-poor who captured most of the
benefits of the overall program.
Another study was from Thomas and Frankenberg (2005) that deeply use the
IFLS data to analyze the longitudinal response of household, concerning not only
health issue but also to poverty, resources, and well-being. While they have already
conduct deep descriptive statistical method in analyzing each health-related issue
within IFLS (nutrition, psycho-social health, and general health), an indirect
comparison between results from IFLS and Susenas are not yet been explored.
Research methodology In this paper we purely use statistics to measure health expenditure in Indonesia. To
calculate household expenditure in Susenas data we count the mean of expenditure
data for each household weighted by the already built-in (made by BPS) weight
measure, so that the number can be justified for the whole Indonesia. While for IFLS,
we do not perform such weighted measure since there was no built-in weight within
IFLS. Thus, the consequence is that the result from IFLS can be over- or undervalued.
Total expenditure will be measured as a sum of food and non-food expenditure.
Following is the standard conversion basis used by BPS within Susenas
employed to the data:
Value of 1 year = 12 x value of 1 month
Value of 1 month = (30/4) x value of 1 week
Household expenditure categorization will be conducted based on a priori
judgment after considering the data scope. Several data were converted into binary
number to simplify and to create more statistical sense of the data. The conversions
were used for questions that only had two mutually exclusive answers—“1” for “yes”
answer and “2” for “no” answer—by changing the “2” into “0”. Thus the average
value from the newly converted data can be used as an approximate of proportion of
sample answering “yes” or “no”.
Significance test were also applied for some part of this paper that used to
know whether the pattern is statistically similar or different between urban and rural
areas. Since the data are unpaired (urban and rural sample size is not equal) and
coming from different population characteristics suggest that the appropriate t-test is
for two samples with unequal variance.
Within this research, we used raw data to analyze the statistical aspect of
health expenditure. Stata/SE 8.0 was used to conduct statistical measures of the raw
data. It is important to acknowledge the importance of utilizing such raw datasets for
they contain large amount of data which provide broad room for data analyses and
manipulations.
The data Household and individual type data were employed to capture the micro-level pattern
of health expenditure in Indonesia. There are currently two available data resources
which provide a relatively complete measure of health issues, especially on health
expenditure, namely Indonesia’s National Socio-Economic Survey (Susenas) and
Indonesia Family Life Survey (IFLS).
The first data be employed is National Socio-Economic Survey that
interviewed hundred of thousand individuals and published annually. Despite its large
sample, respondents interviewed were different each year, thus can not be used for
panel study purpose. The Susenas data is divided into core and module questionnaires.
Core questionnaire consists of nine areas of developments that collected in yearly
basis. While on the other hand, there are currently three kinds of module
questionnaires (Surbakti, 1995):
1. Income and expenditure
2. Welfare, socio-culture, criminality, and tourism
3. Health, nutrition, education cost, and home environment
Each of these modules is repeated every three years. The latest raw data
available for public audiences is Susenas 2004 which we will use thoroughly within
this paper.
The other dataset is Indonesia’s Family Life Survey, also known as Survey
Aspek Kehidupan Rumah Tangga Indonesia (Sakerti). The IFLS is a longitudinal
survey for Indonesian household initially conducted by RAND, Lembaga Demografi
of Universitas Indonesia, and UCLA in 1993/4. The survey covered extensive
information including lives of the respondents, their households, their families, and
the community they live. Representing about 83% of Indonesia population, the survey
conducted interview of more than 30,000 individuals. The IFLS were performed in
“waves”: the first (IFLS1) wave was conducted in 1993/4 period, followed by IFLS2
(1997/8), specially-purposed IFLS2+ (late 1998), IFLS3 (2000), and IFLS4 scheduled
to be launched next 2007. RAND and UGM collaborate in the latest survey (IFLS3).
Since these waves were completed by interviewing the same individual over different
span of time, these longitudinal data then can be used for panel study which captured
not only vast data coverage but also considering the time dimension. Much of the
issues within IFLS were deeply explored if compared to Susenas.
In this research, we were using Susenas 2004 and IFLS3 (2000) as our datasets
because these two datasets are the most updated data available for public audiences.
The impact of using these datasets is that they can not be compared directly due to
different time period implying different socio-economic circumstances. Susenas 2004
surveyed more than one million individuals and more than 250 thousand households
for the core questionnaire. While for the module, the survey interviewed more than 66
thousand households. On the other hand, there were more than 70 thousand
households interviewed from 13 provinces covering about 83% of total population in
IFLS3 that answered the health-cost-related questions. Expenditures in IFLS are
expressed in 1994 base price and adjusted by regional price deflators to the price level
of Jakarta (Cogneau and Grimm, 2004).
The advantages of using both IFLS and Susenas data is that we can analyze
the health cost issue from two different point of view, though they can not be
compared indirectly. It is reasonable not only because the methodologies are almost
completely different, but also due to the fact that these two datasets are bearing
different stress. Susenas is mainly concern on the general aspect of household life, but
IFLS tend to be more detailed on touching the household issue and even reached the
community level.
It should clearly bear in mind that the research does not meant to compare
directly the result of Susenas and IFLS since both are different in methodologies, year
of survey conducted, and characteristics. The results then must be analyzed
separately.
Results Results from Susenas data
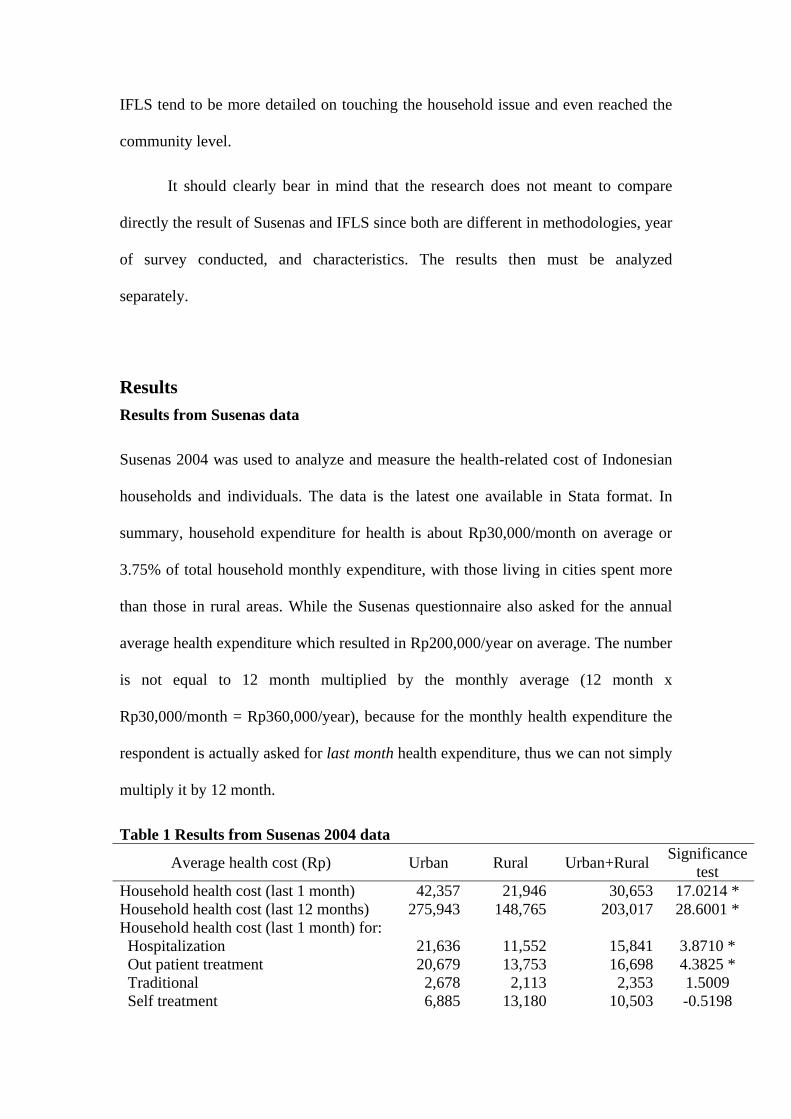
Susenas 2004 was used to analyze and measure the health-related cost of Indonesian
households and individuals. The data is the latest one available in Stata format. In
summary, household expenditure for health is about Rp30,000/month on average or
3.75% of total household monthly expenditure, with those living in cities spent more
than those in rural areas. While the Susenas questionnaire also asked for the annual
average health expenditure which resulted in Rp200,000/year on average. The number
is not equal to 12 month multiplied by the monthly average (12 month x
Rp30,000/month = Rp360,000/year), because for the monthly health expenditure the
respondent is actually asked for last month health expenditure, thus we can not simply
multiply it by 12 month.
Table 1 Results from Susenas 2004 data
Average health cost (Rp) Urban Rural Urban+Rural Significance test
Household health cost (last 1 month) 42,357 21,946 30,653 17.0214 * Household health cost (last 12 months) 275,943 148,765 203,017 28.6001 * Household health cost (last 1 month) for: Hospitalization 21,636 11,552 15,841 3.8710 * Out patient treatment 20,679 13,753 16,698 4.3825 * Traditional 2,678 2,113 2,353 1.5009 Self treatment 6,885 13,180 10,503 -0.5198
Others 3,470 1,272 2,206 7.2796 * Household health expenditure for hospitalization (excluding for insurance or to other party) (Rp per year) 2,604,282 2,255,300 2,443,506 0.3376 Average household monthly expenditure (Rp) 1,091,510 613,619 817,481 112.7953 * Notes: Significance test measure the independent t-test for unequal variance between urban and rural household health and total expenditure. Value displayed with significant t-value (*) indicates that the mean between urban and rural is significantly different at 1% level. Source: calculated from Susenas 2004 data
Significance test showed that there were clear differences in health
expenditure pattern between urban and rural, with exception for traditional and self
treatment health expenditure where the two populations share a relatively common
pattern. In general, urban population spent more money for health needs than those
living in rural areas. It is still unknown whether the health cost, access to medical
facilities, or other factors that generate such pattern. A mixed result, however,
occurred for hospitalization expenditure where population in urban areas is
significantly paid out more money for in-patient treatment than those in rural for the
last one month but not in a year as a whole.
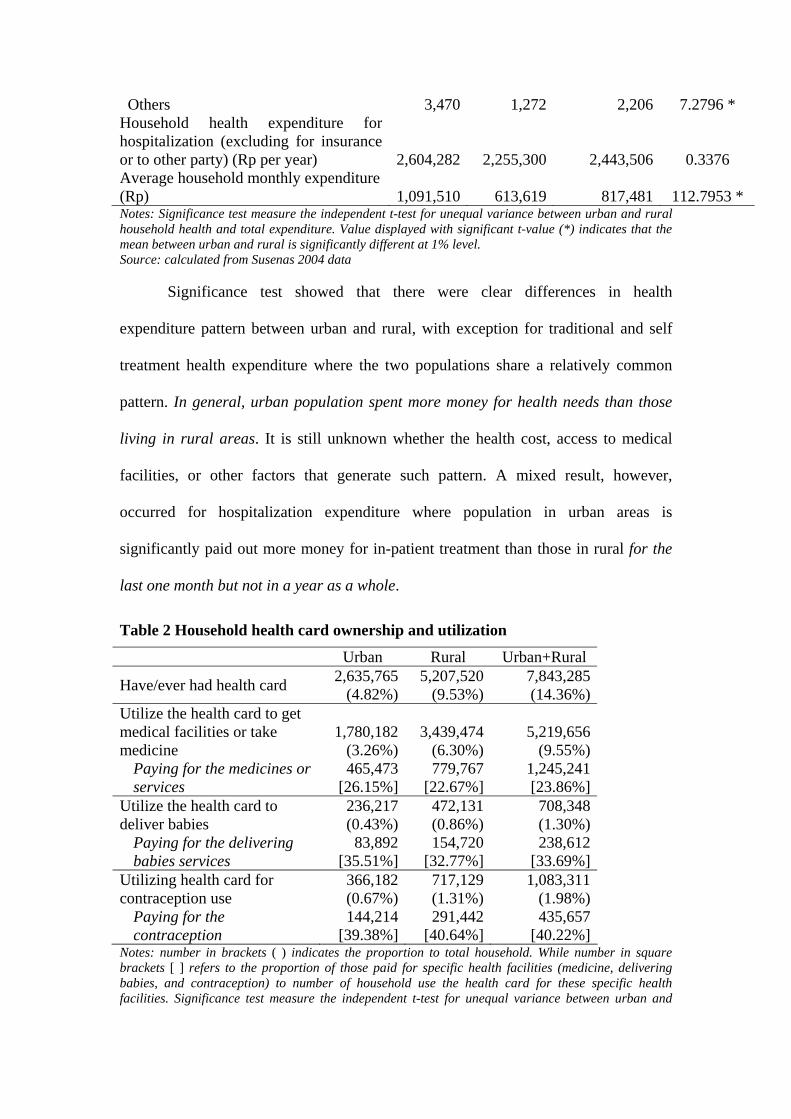
Table 2 Household health card ownership and utilization
Urban Rural Urban+Rural
Have/ever had health card 2,635,765(4.82%)
5,207,520(9.53%)
7,843,285 (14.36%)
Utilize the health card to get medical facilities or take medicine
1,780,182(3.26%)
3,439,474(6.30%)
5,219,656 (9.55%)
Paying for the medicines or services
465,473[26.15%]
779,767[22.67%]
1,245,241 [23.86%]
Utilize the health card to deliver babies
236,217(0.43%)
472,131(0.86%)
708,348 (1.30%)
Paying for the delivering babies services
83,892[35.51%]
154,720[32.77%]
238,612 [33.69%]
Utilizing health card for contraception use
366,182(0.67%)
717,129(1.31%)
1,083,311 (1.98%)
Paying for the contraception
144,214[39.38%]
291,442[40.64%]
435,657 [40.22%]
Notes: number in brackets ( ) indicates the proportion to total household. While number in square brackets [ ] refers to the proportion of those paid for specific health facilities (medicine, delivering babies, and contraception) to number of household use the health card for these specific health facilities. Significance test measure the independent t-test for unequal variance between urban and
rural household health card utilization. Value displayed with significant t-value (*) indicates that the mean between urban and rural is significantly different at 1% level. Source: calculated from Susenas 2004 data
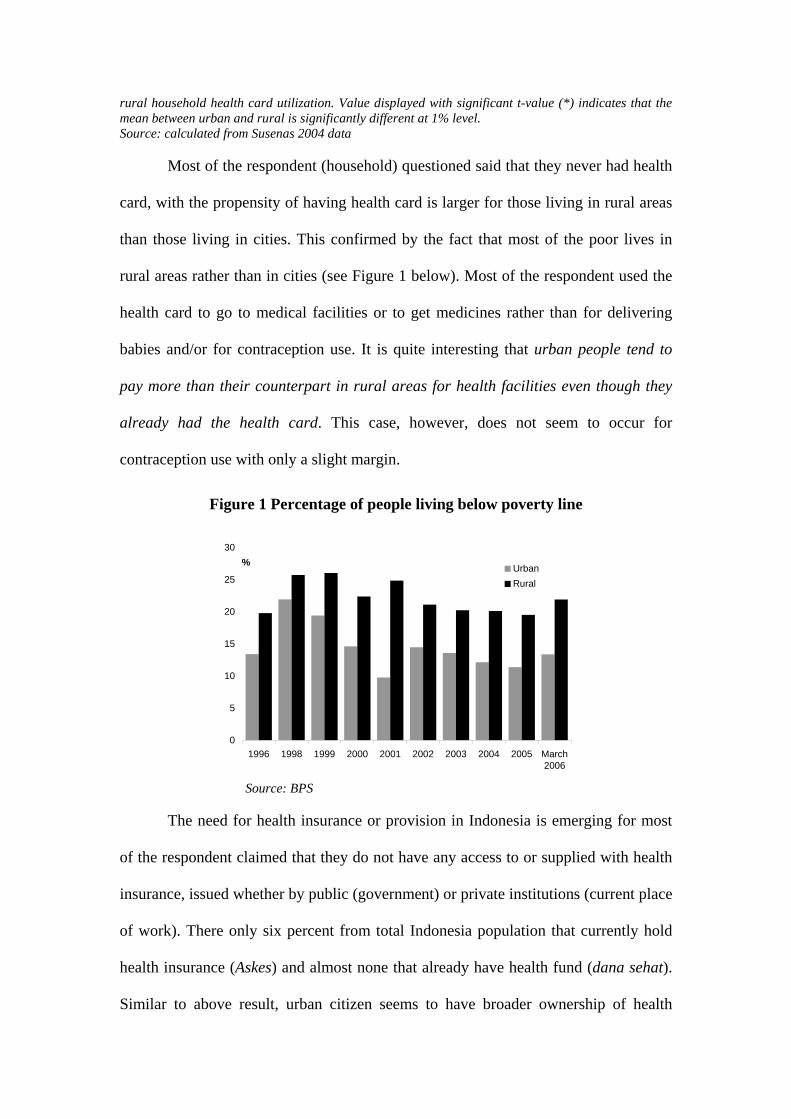
Most of the respondent (household) questioned said that they never had health
card, with the propensity of having health card is larger for those living in rural areas
than those living in cities. This confirmed by the fact that most of the poor lives in
rural areas rather than in cities (see Figure 1 below). Most of the respondent used the
health card to go to medical facilities or to get medicines rather than for delivering
babies and/or for contraception use. It is quite interesting that urban people tend to
pay more than their counterpart in rural areas for health facilities even though they
already had the health card. This case, however, does not seem to occur for
contraception use with only a slight margin.
Figure 1 Percentage of people living below poverty line
0
5
10
15
20
25
30
1996 1998 1999 2000 2001 2002 2003 2004 2005 March2006
% UrbanRural
Source: BPS
The need for health insurance or provision in Indonesia is emerging for most
of the respondent claimed that they do not have any access to or supplied with health
insurance, issued whether by public (government) or private institutions (current place
of work). There only six percent from total Indonesia population that currently hold
health insurance (Askes) and almost none that already have health fund (dana sehat).
Similar to above result, urban citizen seems to have broader ownership of health
insurance/financing rather than rural villagers, with exceptions in JKPM and health
card ownership.
Table 3 Health financing/insurance ownership
Urban Rural Urban+Rural
Health insurance (Askes) 0.04 0.02 0.06
[0.23]
Labor insurance (Astek/Jamsostek) 0.02 0.01 0.03
[0.16]
Office/company 0.02 0.00 0.02
[0.14]
JPKM 0.00 0.01 0.01
[0.09]
Health fund (dana sehat) 0.00 0.00 0.00
[0.05]
Health card 0.03 0.06 0.08
[0.28]
Others 0.01 0.01 0.02
[0.13] Notes: Value is “1” if respondent said “yes”, “0” if “no”. Number in square brackets [ ] indicate standard deviation from the mean Source: calculated from Susenas 2004 data
The module questionnaire of Susenas 2004 is fortunately embraces the same
scope with this research, which is for health, education, and home environment issues.
Somewhat contrary to those of above core results, households in module data were
posing higher monthly health expenditure at about Rp47,000 for national average.
Cost for hospitalization for the last one year is about Rp2.4 million on average.
Most of the respondent said that they financed health expenditure by their own
income, and only small fraction financed through other means such by using their
saving deposit or by utilizing health card. This might be explained by the low
ownership of (ever have or currently hold) health card that just owned by 14% of total
Indonesian household. Pradhan et al. (2004) also confirmed that after the 1997/1998
crisis there was a sharp decrease in the utilization of modern health care which was
largely due to declining utilization of public sector providers. The second highest
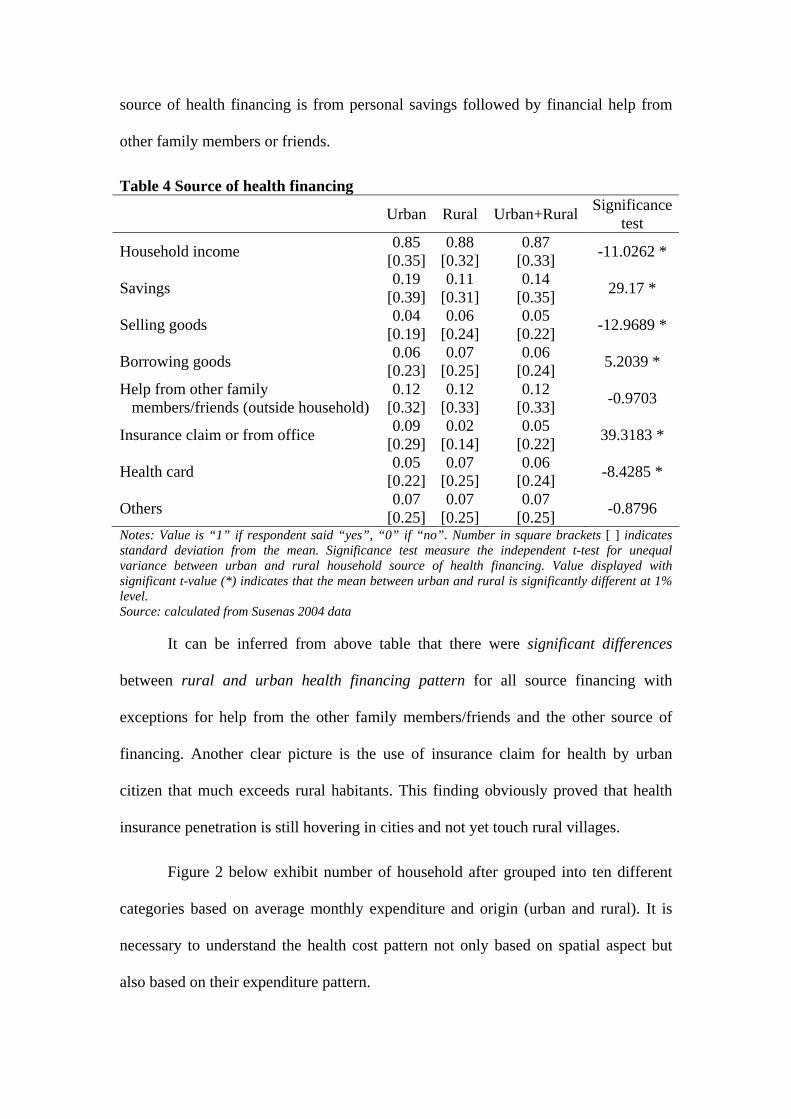
source of health financing is from personal savings followed by financial help from
other family members or friends.
Table 4 Source of health financing
Urban Rural Urban+Rural Significance test
Household income 0.85 [0.35]
0.88 [0.32]
0.87 [0.33] -11.0262 *
Savings 0.19 [0.39]
0.11 [0.31]
0.14 [0.35] 29.17 *
Selling goods 0.04 [0.19]
0.06 [0.24]
0.05 [0.22] -12.9689 *
Borrowing goods 0.06 [0.23]
0.07 [0.25]
0.06 [0.24] 5.2039 *
Help from other family members/friends (outside household)
0.12 [0.32]
0.12 [0.33]
0.12 [0.33] -0.9703
Insurance claim or from office 0.09 [0.29]
0.02 [0.14]
0.05 [0.22] 39.3183 *
Health card 0.05 [0.22]
0.07 [0.25]
0.06 [0.24] -8.4285 *
Others 0.07 [0.25]
0.07 [0.25]
0.07 [0.25] -0.8796
Notes: Value is “1” if respondent said “yes”, “0” if “no”. Number in square brackets [ ] indicates standard deviation from the mean. Significance test measure the independent t-test for unequal variance between urban and rural household source of health financing. Value displayed with significant t-value (*) indicates that the mean between urban and rural is significantly different at 1% level. Source: calculated from Susenas 2004 data
It can be inferred from above table that there were significant differences
between rural and urban health financing pattern for all source financing with
exceptions for help from the other family members/friends and the other source of
financing. Another clear picture is the use of insurance claim for health by urban
citizen that much exceeds rural habitants. This finding obviously proved that health
insurance penetration is still hovering in cities and not yet touch rural villages.
Figure 2 below exhibit number of household after grouped into ten different
categories based on average monthly expenditure and origin (urban and rural). It is
necessary to understand the health cost pattern not only based on spatial aspect but
also based on their expenditure pattern.
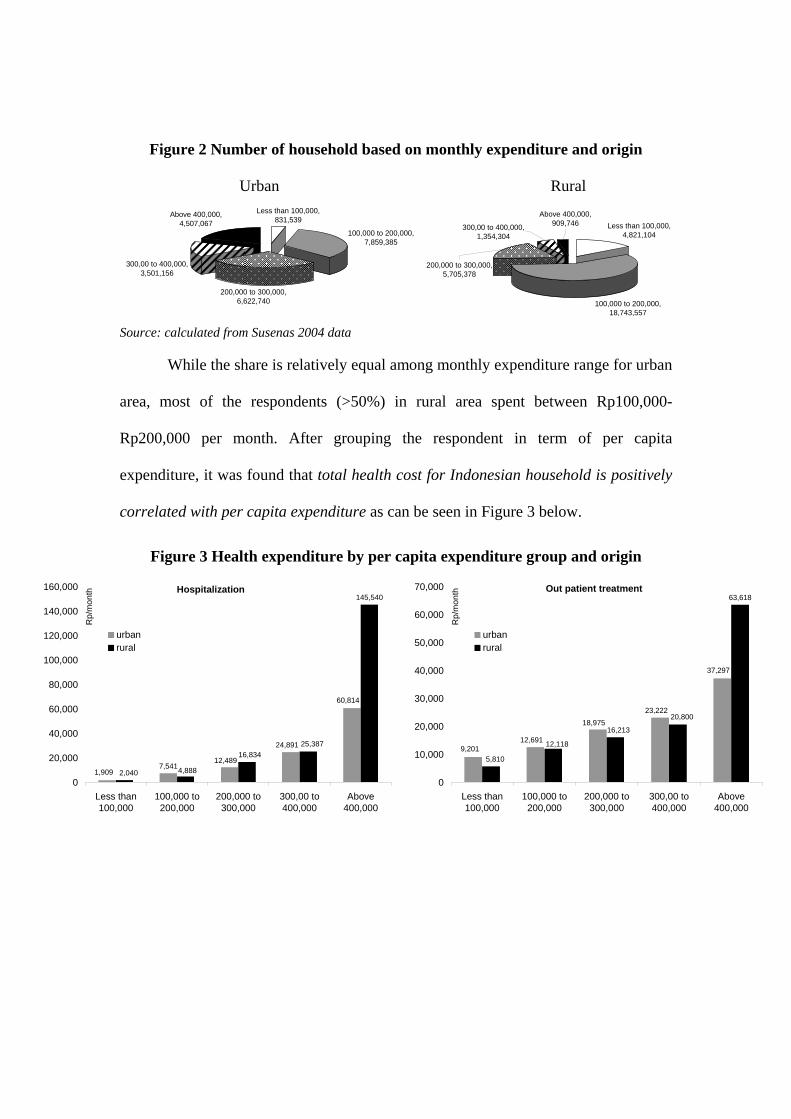
Figure 2 Number of household based on monthly expenditure and origin
Urban Rural Less than 100,000,
831,539
100,000 to 200,000, 7,859,385
200,000 to 300,000, 6,622,740
300,00 to 400,000, 3,501,156
Above 400,000, 4,507,067
Less than 100,000, 4,821,104
100,000 to 200,000, 18,743,557
Above 400,000, 909,746300,00 to 400,000,
1,354,304
200,000 to 300,000, 5,705,378
Source: calculated from Susenas 2004 data
While the share is relatively equal among monthly expenditure range for urban
area, most of the respondents (>50%) in rural area spent between Rp100,000-
Rp200,000 per month. After grouping the respondent in term of per capita
expenditure, it was found that total health cost for Indonesian household is positively
correlated with per capita expenditure as can be seen in Figure 3 below.
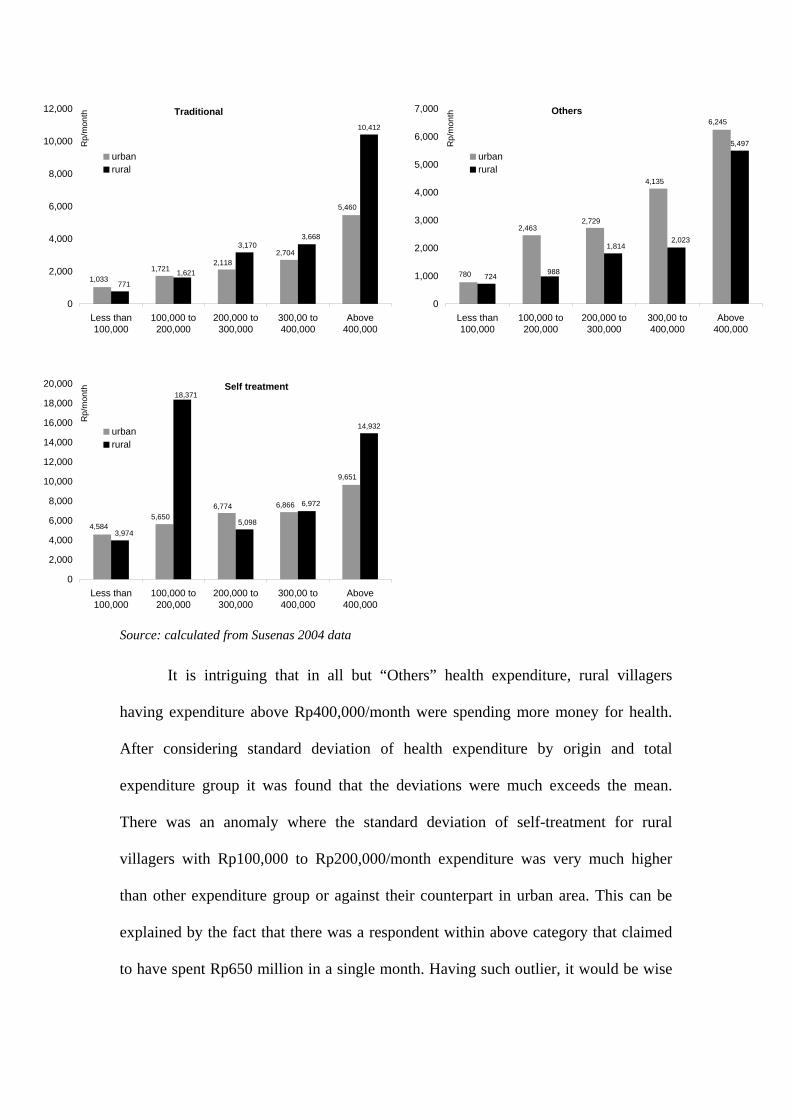
Figure 3 Health expenditure by per capita expenditure group and origin
7,541
145,540
60,814
24,891
12,4891,909
25,38716,834
4,8882,0400
20,000
40,000
60,000
80,000
100,000
120,000
140,000
160,000
Less than100,000
100,000 to200,000
200,000 to300,000
300,00 to400,000
Above400,000
urbanrural
Rp/
mon
th Hospitalization
63,618
12,691
37,297
23,22218,975
9,201
20,800
16,213
12,118
5,810
0
10,000
20,000
30,000
40,000
50,000
60,000
70,000
Less than100,000
100,000 to200,000
200,000 to300,000
300,00 to400,000
Above400,000
urbanrural
Rp/
mon
th Out patient treatment
10,412
1,721
5,460
2,7042,118
1,033
3,6683,170
1,621771
0
2,000
4,000
6,000
8,000
10,000
12,000
Less than100,000
100,000 to200,000
200,000 to300,000
300,00 to400,000
Above400,000
urbanrural
Rp/
mon
th Traditional
14,932
5,650
9,651
6,8666,774
4,584
6,972
5,098
18,371
3,974
0
2,000
4,000
6,000
8,000
10,000
12,000
14,000
16,000
18,000
20,000
Less than100,000
100,000 to200,000
200,000 to300,000
300,00 to400,000
Above400,000
urbanrural
Rp/
mon
th Self treatment
5,497
2,463
6,245
4,135
2,729
780
2,0231,814
988724
0
1,000
2,000
3,000
4,000
5,000
6,000
7,000
Less than100,000
100,000 to200,000
200,000 to300,000
300,00 to400,000
Above400,000
urbanrural
Rp/
mon
th Others
Source: calculated from Susenas 2004 data
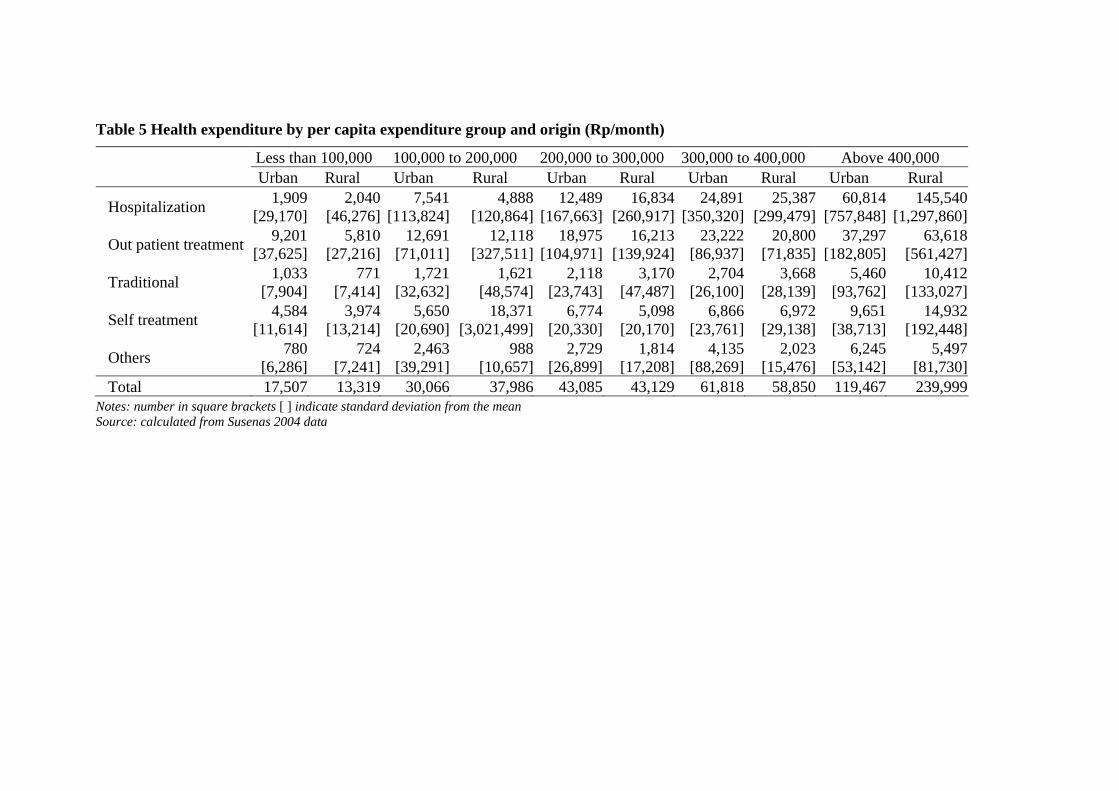
It is intriguing that in all but “Others” health expenditure, rural villagers
having expenditure above Rp400,000/month were spending more money for health.
After considering standard deviation of health expenditure by origin and total
expenditure group it was found that the deviations were much exceeds the mean.
There was an anomaly where the standard deviation of self-treatment for rural
villagers with Rp100,000 to Rp200,000/month expenditure was very much higher
than other expenditure group or against their counterpart in urban area. This can be
explained by the fact that there was a respondent within above category that claimed
to have spent Rp650 million in a single month. Having such outlier, it would be wise

for future research to perform trimming method or any other means such that this kind
of anomaly is not repeated.
Less than 100,000 100,000 to 200,000 200,000 to 300,000 300,000 to 400,000 Above 400,000 Urban Rural Urban Rural Urban Rural Urban Rural Urban Rural
Hospitalization 1,909 [29,170]
2,040[46,276]
7,541[113,824]
4,888[120,864]
12,489[167,663]
16,834[260,917]
24,891[350,320]
25,387[299,479]
60,814[757,848]
145,540[1,297,860]
Out patient treatment 9,201 [37,625]
5,810[27,216]
12,691[71,011]
12,118[327,511]
18,975[104,971]
16,213[139,924]
23,222[86,937]
20,800[71,835]
37,297[182,805]
63,618[561,427]
Traditional 1,033 [7,904]
771[7,414]
1,721[32,632]
1,621[48,574]
2,118[23,743]
3,170[47,487]
2,704[26,100]
3,668[28,139]
5,460[93,762]
10,412[133,027]
Self treatment 4,584 [11,614]
3,974[13,214]
5,650[20,690]
18,371[3,021,499]
6,774[20,330]
5,098[20,170]
6,866[23,761]
6,972[29,138]
9,651[38,713]
14,932[192,448]
Others 780 [6,286]
724[7,241]
2,463[39,291]
988[10,657]
2,729[26,899]
1,814[17,208]
4,135[88,269]
2,023[15,476]
6,245[53,142]
5,497[81,730]
Total 17,507 13,319 30,066 37,986 43,085 43,129 61,818 58,850 119,467 239,999
Table 5 Health expenditure by per capita expenditure group and origin (Rp/month)
Notes: number in square brackets [ ] indicate standard deviation from the mean Source: calculated from Susenas 2004 data
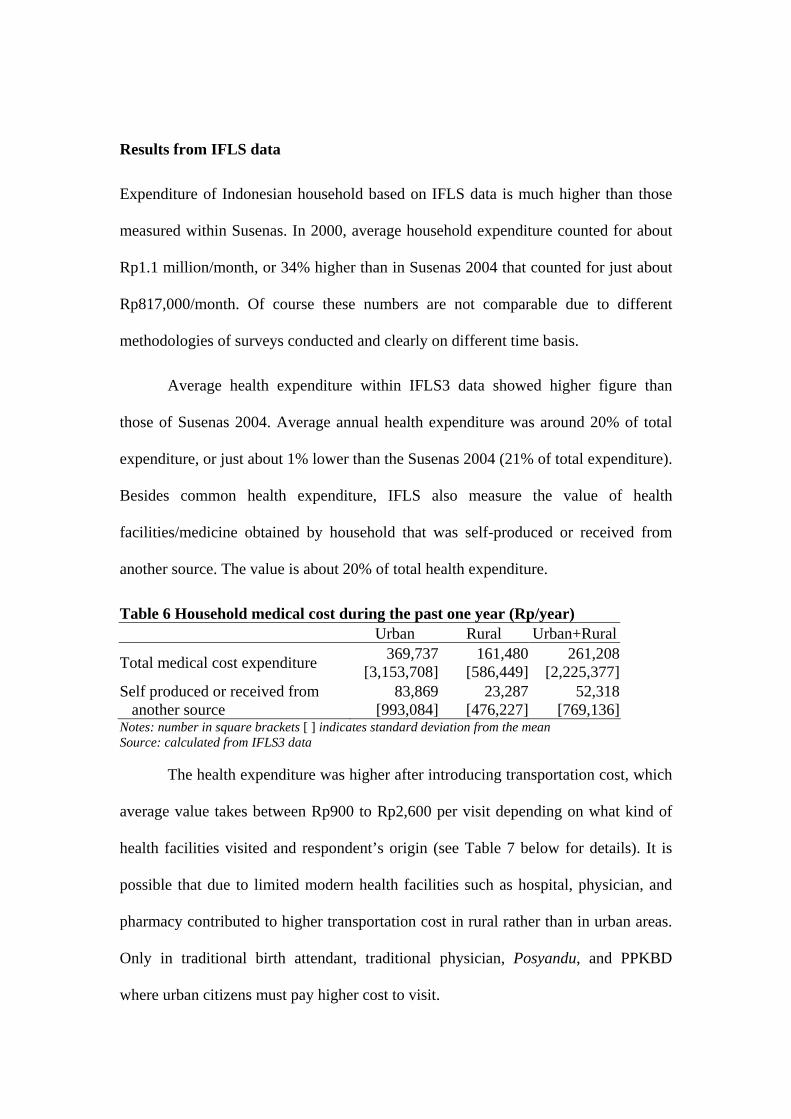
Results from IFLS data
Expenditure of Indonesian household based on IFLS data is much higher than those
measured within Susenas. In 2000, average household expenditure counted for about
Rp1.1 million/month, or 34% higher than in Susenas 2004 that counted for just about
Rp817,000/month. Of course these numbers are not comparable due to different
methodologies of surveys conducted and clearly on different time basis.
Average health expenditure within IFLS3 data showed higher figure than
those of Susenas 2004. Average annual health expenditure was around 20% of total
expenditure, or just about 1% lower than the Susenas 2004 (21% of total expenditure).
Besides common health expenditure, IFLS also measure the value of health
facilities/medicine obtained by household that was self-produced or received from
another source. The value is about 20% of total health expenditure.
Table 6 Household medical cost during the past one year (Rp/year) Urban Rural Urban+Rural
Total medical cost expenditure 369,737[3,153,708]
161,480[586,449]
261,208 [2,225,377]
Self produced or received from another source
83,869[993,084]
23,287[476,227]
52,318 [769,136]
Notes: number in square brackets [ ] indicates standard deviation from the mean Source: calculated from IFLS3 data
The health expenditure was higher after introducing transportation cost, which
average value takes between Rp900 to Rp2,600 per visit depending on what kind of
health facilities visited and respondent’s origin (see Table 7 below for details). It is
possible that due to limited modern health facilities such as hospital, physician, and
pharmacy contributed to higher transportation cost in rural rather than in urban areas.
Only in traditional birth attendant, traditional physician, Posyandu, and PPKBD
where urban citizens must pay higher cost to visit.
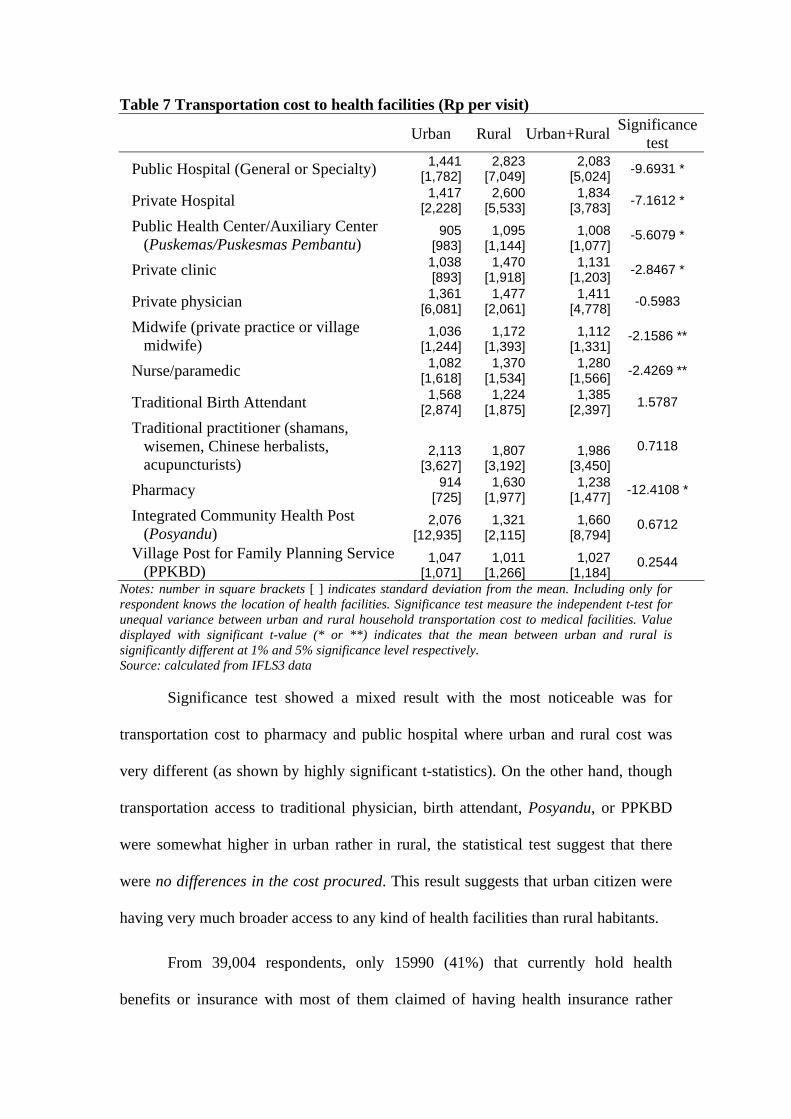
Table 7 Transportation cost to health facilities (Rp per visit)
Urban Rural Urban+Rural Significance test
Public Hospital (General or Specialty) 1,441[1,782]
2,823[7,049]
2,083 [5,024] -9.6931 *
Private Hospital 1,417[2,228]
2,600[5,533]
1,834 [3,783] -7.1612 *
Public Health Center/Auxiliary Center (Puskemas/Puskesmas Pembantu)
905[983]
1,095[1,144]
1,008 [1,077]
-5.6079 *
Private clinic 1,038[893]
1,470[1,918]
1,131 [1,203] -2.8467 *
Private physician 1,361[6,081]
1,477[2,061]
1,411 [4,778] -0.5983
Midwife (private practice or village midwife)
1,036[1,244]
1,172[1,393]
1,112 [1,331]
-2.1586 **
Nurse/paramedic 1,082[1,618]
1,370[1,534]
1,280 [1,566] -2.4269 **
Traditional Birth Attendant 1,568[2,874]
1,224[1,875]
1,385 [2,397] 1.5787
Traditional practitioner (shamans, wisemen, Chinese herbalists, acupuncturists)
2,113[3,627]
1,807[3,192]
1,986 [3,450]
0.7118
Pharmacy 914[725]
1,630[1,977]
1,238 [1,477] -12.4108 *
Integrated Community Health Post (Posyandu)
2,076[12,935]
1,321[2,115]
1,660 [8,794]
0.6712
Village Post for Family Planning Service (PPKBD)
1,047[1,071]
1,011[1,266]
1,027 [1,184]
0.2544
Notes: number in square brackets [ ] indicates standard deviation from the mean. Including only for respondent knows the location of health facilities. Significance test measure the independent t-test for unequal variance between urban and rural household transportation cost to medical facilities. Value displayed with significant t-value (* or **) indicates that the mean between urban and rural is significantly different at 1% and 5% significance level respectively. Source: calculated from IFLS3 data
Significance test showed a mixed result with the most noticeable was for
transportation cost to pharmacy and public hospital where urban and rural cost was
very different (as shown by highly significant t-statistics). On the other hand, though
transportation access to traditional physician, birth attendant, Posyandu, or PPKBD
were somewhat higher in urban rather in rural, the statistical test suggest that there
were no differences in the cost procured. This result suggests that urban citizen were
having very much broader access to any kind of health facilities than rural habitants.
From 39,004 respondents, only 15990 (41%) that currently hold health
benefits or insurance with most of them claimed of having health insurance rather
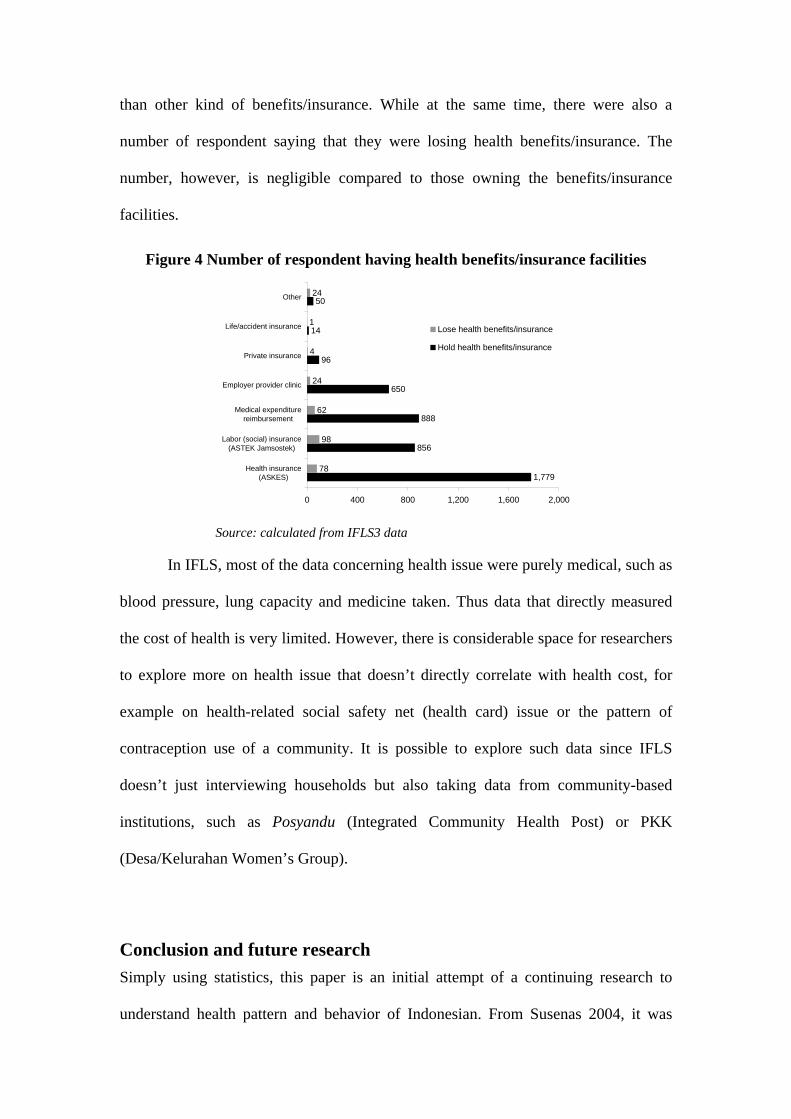
than other kind of benefits/insurance. While at the same time, there were also a
number of respondent saying that they were losing health benefits/insurance. The
number, however, is negligible compared to those owning the benefits/insurance
facilities.
Figure 4 Number of respondent having health benefits/insurance facilities
1,779
856
888
650
96
14
50
78
98
62
24
4
1
24
0 400 800 1,200 1,600 2,000
Health insurance(ASKES)
Labor (social) insurance(ASTEK Jamsostek)
Medical expenditurereimbursement
Employer provider clinic
Private insurance
Life/accident insurance
Other
Lose health benefits/insurance
Hold health benefits/insurance
Source: calculated from IFLS3 data
In IFLS, most of the data concerning health issue were purely medical, such as
blood pressure, lung capacity and medicine taken. Thus data that directly measured
the cost of health is very limited. However, there is considerable space for researchers
to explore more on health issue that doesn’t directly correlate with health cost, for
example on health-related social safety net (health card) issue or the pattern of
contraception use of a community. It is possible to explore such data since IFLS
doesn’t just interviewing households but also taking data from community-based
institutions, such as Posyandu (Integrated Community Health Post) or PKK
(Desa/Kelurahan Women’s Group).
Conclusion and future research Simply using statistics, this paper is an initial attempt of a continuing research to
understand health pattern and behavior of Indonesian. From Susenas 2004, it was
found that most households use their own source of income to finance health
expenditure, rather than by utilizing another measures such as health card or health
insurance. Health card utilization is relatively low with just 7.8 million households
(14.36% of total household) claimed to have or ever had it to finance health
expenditure. In general, urban health expenditure in Indonesia was significantly
different with their counterparts in rural areas, with average health cost is higher in
urban rather than in rural. It was found also that health expenditure was moving
positively in line with household expenditure. From IFLS3 data, the share of health
expenditure to total expenditure is less than those exhibited in Susenas. However,
transportation cost to medical facilities adds the health cost, especially to rural
villagers since they had limited access to those facilities (especially modern health
facilities).
Even though the comparison is not apple-to-apple, but these two data are the
latest available resource datasets that employ deep survey on health issues in
Indonesia. Thus the results should not be directly compared, rather they should be
analyzed separately as both having different and unique characteristics.
Room for future research in this issue is very wide. Analyzing the usefulness
of health card, measuring demand for health facilities, and introducing better health
provision within welfare state framework can be the next researches. Thus the issue of
health economics can be push ahead further and touch wider angle of economic
analyses.
References Cogneau, D. and M. Grimm. 2004. “The Measurement of Income Distribution
Dynamics when Demographics are correlated with Income” Document de travail DIAL/Unité de Recherche CIPRÉ.
Pradhan et al.. 2004. “Did the Healthcard Program ensure Access to Medical Care for the Poor during Indonesia’s Economic Crisis? (Revised version September 2004)” Tinbergen Institute Discussion Paper TI 2003-016/2.
Surbakti, Pajung. 1995. Indonesia’s National Socio-Economic Survey – A continual data source for analysis on welfare development. Jakarta: Central Bureau of Statistics.
Thomas, D. and E. Frankenberg. 2005. “Household responses to the financial crisis in Indonesia: Logitudinal evidence on poverty, resources and well-being” California Center for Population Research – On-Line Working Paper Series CCPR-056-05.
The raw data for IFLS (IFLS1, IFLS2, IFLS2+, and IFLS3) can be freely downloaded from http://www.rand.org/labor/FLS/IFLS/


![SUSENAS [sURVEI sosIAL EKONOMI NASIONAL] 1995](https://img.pdfslide.net/doc/110x75/58790c9c1a28abf6238ba4d3/susenas-survei-sosial-ekonomi-nasional-1995.jpg)