Embed Size (px)
Citation preview

DISPOSITION FORM ~~iL ~~IFor us* of this form, See AR 340.15, the proponent agency is TAGO,A~EFERENCE OR OFFICE SYMBOL SUBJECT
i SGRD-UE -HP Request for Clearance of Technical Paper (USARIEM)
TO Commander. USARIEM FROM Dir, H&P Div DATE 29 July 1988 CMT1
O ce USARIEM Memo 360-1, request clearance of attached [Dmanuscript, Cabstract, [presentation,o d, report, CD review article. Report Documentation Page, DD Form 1473 (is)(is not) attached.CI Field-dependence, Judgment of Weights by Females and an Appeal for a More
M' Complex Approach to the Study of Individual Differences0) s) Bernard J. Fine
J for publication in Personality and Individual Differences
(~ I for presentation before __________________________________
________________ Location _________________ Date ____________
2. Budget Project No. 3M161102BS15 Cost Code 8480082101046
3. Attached contains no classified material. It meets acc an ds for scientifi accuracy and propriety. It
contains no potentially sensitive or controversial item
End ,MDirector, Healt &PrformanceDvso
SGRD-UEZ()
THRU Chief, Admin Svc Br FROM Commander DATE /L 4 ~CMT 2
TO Q kP Div D\/, 'Clearance is granted. ftLE T
Clearance is not granted. S%% -98 USThis document must be forwarded to USAMRDC for clearance. H
End - DISTRIBU -TION SAA DAVID D. SCHNAKENBERnc IColonel, MS
Distibuion i12*edCommanding
CLEARANCE NO. M66-88
NATICK FL 883 V (1 Jun 36 EDITION OF I DEC 34IS OBSOLETE.
DA AFOPm 2496 PRUVIOUS EDITIONS VWLL bit USED smi Of
Field-Dependence, Judgment of Weights by Females and an Appeal
for a More Complex Approach to the Study of Individual Differences
Bernard J. Fine
US Army Research Institute of Environmental Medicine, Natick, MA
Fine (1972a) has presented evidence of a strong, non-linear relationship
between field-dependence-independence MOIE aft'ter -referred to as "field-
dependence;" Witkin, 1964, 19651 Witkin, Dyk,-Faterson, 'oodenough and Karp,
1962)- introversion-extraversion (hereinafter referred to as "extraversion;"
Eysenck, 1967) and neuroticism (Eysenck, 1967). In the context of that
relationship, he suggested that differences between individuals in
field-dependence might be conceptualized profitably as at least partially
genetically-based differences in "sensitivity," as contrasted with "strength"
(Eysenck, 1967), of the nervous system.
Differences in "sensitivity" were assumed to depend upon the extent to
which the nervous system becomes "differentiated" as an individual develops.
"Differentiation" differed from the use of the term by Witkin et al. (1962) in
that it was considered in its biological sense as being referable to physical
characteristics of components of the nervous system or of the nervous system
as a whole, e.g., size, number and/or distribution of specific types of
receptors, elaborateness or complexity of neural networks, quality or quantity
of neural transmitter substances, with these ultimately reducible to
differences in the molecular structure of enzymes and proteins ,(Fine, 1972a,
1973). (Witkin's concern with "differentiation" primarily was with reference
to the socio-psychological rather than the physical aspects of development,
and focussed on broad areas such as ego development and independence of self
and the influence of environment.)
2
From this conceptual base, it was reasoned that "sensitivity" of the
nervous system should be related to ability to discriminate among stimuli, the
more differentiated and, hence, the more "sensitive" the system, the better
the ability to discriminate. Because of his specific interest in
field-dependence at the time, Fine postulated that individuals with highly
"sensitive" nervous systems should be those who are most proficient on spatial
perception tests such as the Hidden Figures Test (HFT; Witkin, et al. 1962)
or the Gottschaldt Hidden Shapes Test (HST; Cattell, et al., 1955) from which
the HFT was derived, i.e., individuals who, in Witkin's schema, had come to be
called "field-independent." Conversely, individuals with the least "sensitive"
nervous systems were postulated as being those who are least proficient on
tests of spatial perception, and who had come to be referred to as "field-
dependent." Thus, Witkin's concept, field-dependence, became a construct which
was thought to be both a behavioral manifestation of and an indirect
approximation of the level of development of aspects of the nervous system.
To test the generality of the "sensitivity" hypothesis, a number of
studies of the relationship between field-dependence and other types of
complex sensory discrimination have been carried out. To date, the hypothesis
j has been tested and very strongly supported with respect to both the
discrimination of colors (Fine, 1973) and contrast sensitivity (Fine &
Kobrick, 1987), and, to a lesser extent, with discrimination of weights (Fine,
1973). The color discrimination results now have been replicated many times
with male subjects [Fine & Kobrick, 1980, 1983 (color test given, but results
not reported), 1987 (p.781)) and also in a study specifically focussed on
females (Fine, 1983a). In all of the studies of the discrimination of colors :7
and in the contrast sensitivity study, the performance of field-independent
groups was markedly superior to that of field-dependent groups. L *'loli
Av'l~PbUlltY ?cd,5
Avt-ii and/orLi1st Spocial
A major shortcoming of the weight discrimination study (Fine, 1973) was
that the test used to measure weight discrimination ability was not very
sensitive. There also was evidence in that study that weight discrimination
was related to extraversion as well as to field-dependence. No relationship
with extraversion had been found in any of the color discrimination studies or
the contrast sensitivity study.
Accordingly, the study presented here was designed specifically to
re-examine the relationship between field-dependence and the ability to judge
weights, using a more sensitive test, and to inquire further into a possible
relationship between extraversion and discrimination of weight.
To further verify the relationship between field-dependence and the
discrimination of colors, a color discrimination test also was given.
Consistent with the "sensitivity" hypothesis, it was predicted that
field-independent persons would be significantly better than field-dependent
persons at both weight and color discrimination. No predictions were made
regarding a possible relationship between extraversion and weight
discrimination.
Method
Subjects
Subjects (Ss) were 17 female soldier volunteers, ages 20-34 (median=22)
who had been screened by a physician to insure that they were in good health
for participation in a larger study of which this one was a part (Fine, 1987).
Informed consent was obtained from each S. The research conformed to US Army
Medical Research & Development Command Regulation 70-25 on Use of Volunteers
in Research.
24
Measures
(a) The weight discrimination task consisted of 15 white plastic
cylinders, each 3.4 cm. in diameter and topped with a black plastic cap, 4 cm.
in diameter. Cylinders with caps were 5.3 cm. tall. They were filled with tiny
metal bearings to specific weights. Empty space in each cylinder was filled
with cotton. The weight of the cylinders ranged from 75 to 145 grams in 5 gram
increments +/- .1 gram. Each cylinder was numbered on the bottom with its
appropriate rank, in increasing order of heaviness, from 1 to 15.
(b) Field-dependence was assessed by the HST (Cattell, et al., 1955).
Participants were categorized on the basis of norms established from test
scores of 154 female soldiers previously tested with the HST. Persons with
scores in the lower third of that distribution (18 or below; N=6) were
classified as field-dependent, those scoring in the upper third (26 or higher;
N=5) as field-independent and the remainder (N=6) as "field-central."
(c) Extraversion was measured with the Maudsley Personality Inventory
(MPI; Eysenck, 1959) rather than with later inventories by the Eysencks, since
norms from a large soldier population (N=600+) were available for the MPI from
our past research. Ss were divided into three groups based on these norms
(male and female norms were identical). Persons scoring in the lower third of
the distribution (26 or below; N=3) were classified as introverts, those in
the upper third (34 and higher; N=9) as extraverts, and the remainder of the
group (N=5) constituted a "middle" category.
d) Color discrimination ability was measured by the Farnsworth-Munsell
100-Hue Test (Farnsworth, 1957), which was designed to separate persons with
normal color vision into classes of superior, average and low color
discrimination ability and to measure zones of color confusion of color
defective persons. A detailed description of the test and its scoring can be
5
found in Fine (1973).
Design and procedure
Each S was tested with the weight test at the same time on two successive
days, three trials per day. A five-minute time limit was allowed for each
trial. Inter-trial intervals also were of five minutes duration to allow for
recovery from fatigue induced by the demanding task.
S was instructed to use her preferred hand to arrange the cylinders from
lightest to heaviest using any method of comparison she desired. Ss were
monitored carefully to insure that they did not invert the cylinders. After
each trial, the ordered cylinders were turned over and the order of
arrangement was recorded. Ss were allowed to see how well they had done.
During the ensuing rest period, cylinders were returned to the starting
position and thoroughly shuffled for the next trial.
The color discrimination test was taken the day prior to the weight
discrimination test. Two trials were given, separated by a five-minute
interval. Persons administering the weight test had no idea of Ss' levels of
performance on the color test.
Results
The score for a given cylinder in the weight discrimination test was the
sum of the difference between the number of that cylinder, i.e., its r~rk, and
the numbers of the cylinders immediately above and below it in the ordering
that had been established by the S. Thus, correct placement of all cylinders
in the series resulted in each cylinder receiving a score of 2. Incorrect
placement of cylinders resulted in individual cylinder scores in excess of 2,
herein termed "error scores." For example, a two-cylinder transposition
(...49,5,7,6,8,9...) resulted in an error score of 4; a three-cylinder
transposition (...4,5,7,8,6,9,10...) resulted in an error score of 8, etc.
6
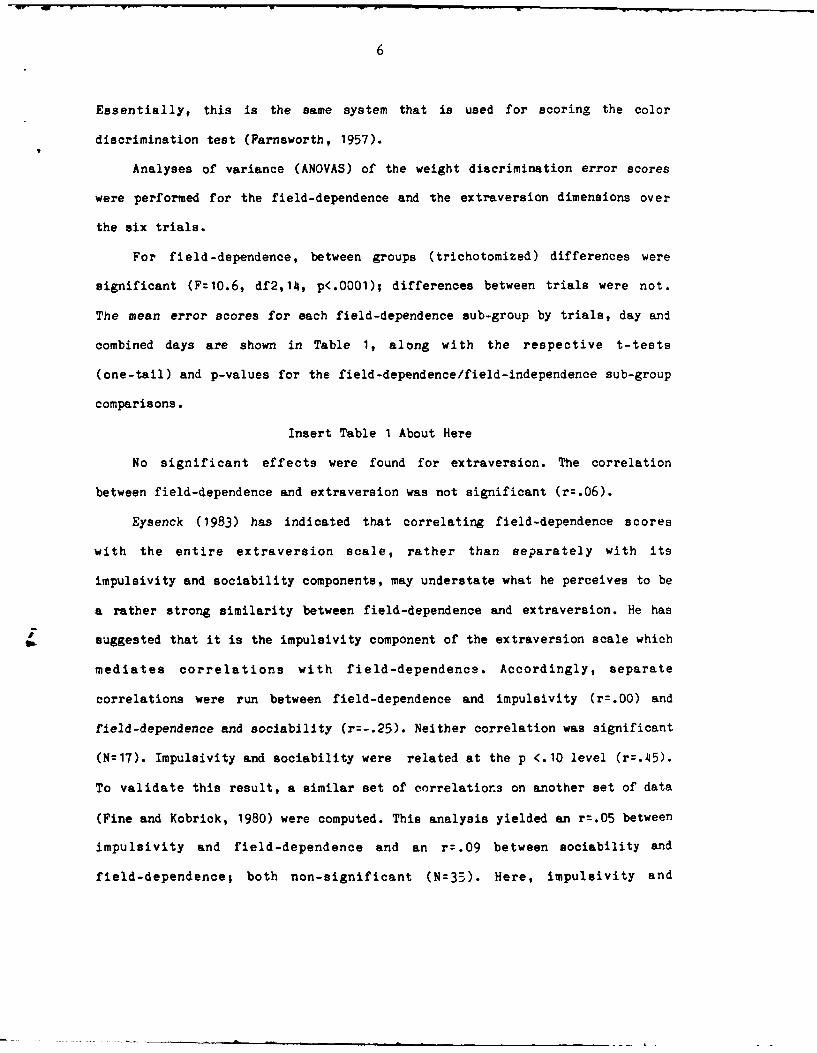
Essentially, this is the same system that is used for scoring the color
discrimination test (Farnsworth, 1957).
Analyses of variance (ANOVAS) of the weight discrimination error scores
were performed for the field-dependence and the extraversion dimensions over
the six trials.
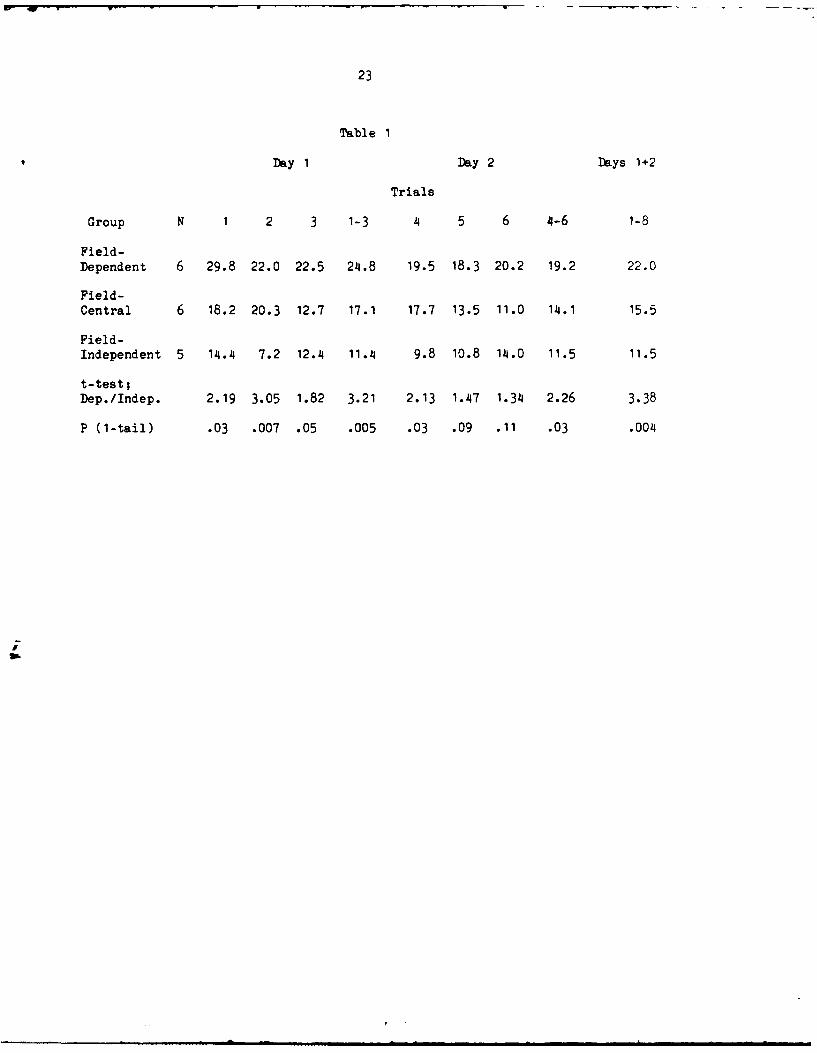
For field-dependence, between groups (trichotomized) differences were
significant (F=10.6, df2,14, p<.0001); differences between trials were not.
The mean error scores for each field-dependence sub-group by trials, day and
combined days are shown in Table 1, along with the respective t-tests
(one-tail) and p-values for the field-dependence/field-independence sub-group
comparisons.
Insert Table 1 About Here
No significant effects were found for extraversion. The correlation
between field-dependence and extraversion was not significant (r=.06).
Eysenck (1983) has indicated that correlating field-dependence scores
with the entire extraversion scale, rather than separately with its
impulsivity and sociability components, may understate what he perceives to be
a rather strong similarity between field-dependence and extraversion. He has
W suggested that it is the impulsivity component of the extraversion scale which
mediates correlations with field-dependence. Accordingly, separate
correlations were run between field-dependence and impulsivity (r=.00) and
field-dependence and sociability (r=-.25). Neither correlation was significant
(N=17). Impulsivity and sociability were related at the p <.10 level (r=.45).
To validate this result, a similar set of correlations on another set of data
(Fine and Kobrick, 1980) were computed. This analysis yielded an r=.05 between
impulsivity and field-dependence and an r=.09 between sociability and
field-dependence; both non-significant (N=35). Here, impulsivity and
7
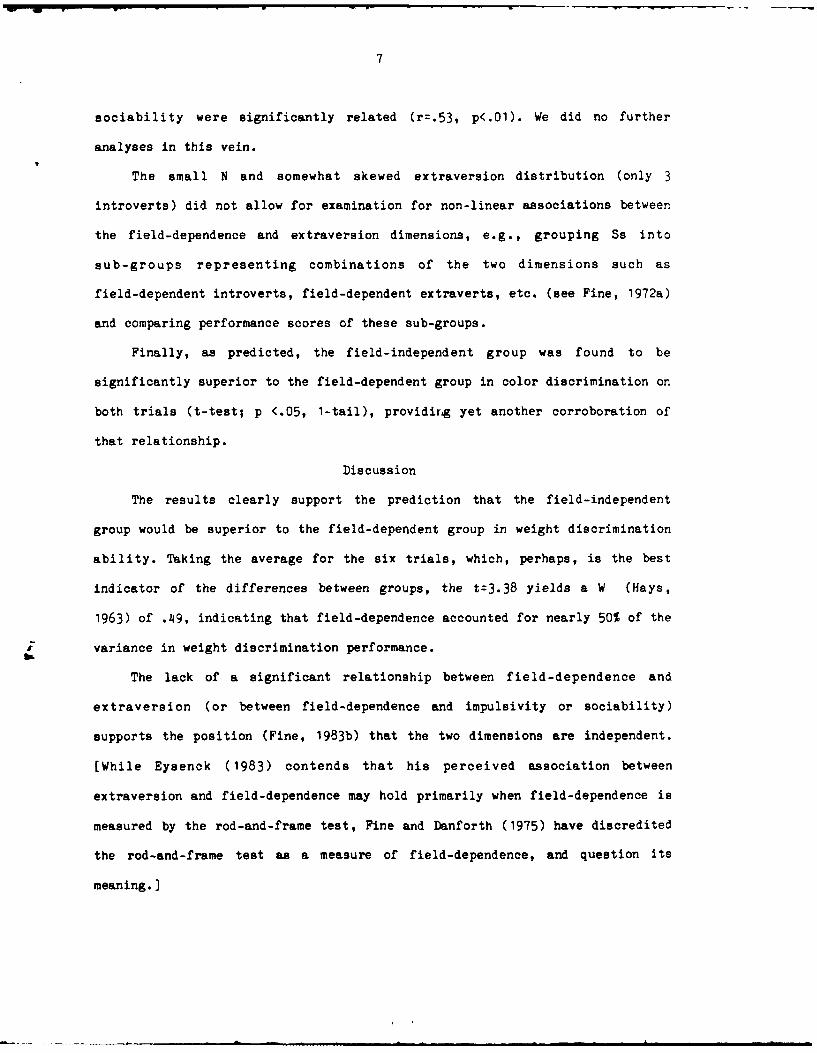
sociability were significantly related (r=.53, p<.Ol). We did no further
analyses in this vein.
The small N and somewhat skewed extraversion distribution (only 3
introverts) did not allow for examination for non-linear associations between
the field-dependence and extraversion dimensions, e.g., grouping Ss into
sub-groups representing combinations of the two dimensions such as
field-dependent introverts, field-dependent extraverts, etc. (see Fine, 1972a)
and comparing performance scores of these sub-groups.
Finally, as predicted, the field-independent group was found to be
significantly superior to the field-dependent group in color discrimination on
both trials (t-test; p <.05, 1-tail), providirg yet another corroboration of
that relationship.
Discussion
The results clearly support the prediction that the field-independent
group would be superior to the field-dependent group in weight discrimination
ability. Taking the average for the six trials, which, perhaps, is the best
indicator of the differences between groups, the t:3.38 yields a W (Hays,
1963) of .49, indicating that field-dependence accounted for nearly 50% of the
variance in weight discrimination performance.
The lack of a significant relationship between field-dependence and
extraversion (or between field-dependence and impulsivity or sociability)
supports the position (Fine, 1983b) that the two dimensions are independent.
[While Eysenck (1983) contends that his perceived association between
extraversion and field-dependence may hold primarily when field-dependence is
measured by the rod-and-frame test, Fine and Danforth (1975) have discredited
the rod-and-frame test as a measure of field-dependence, and question its
meaning.]
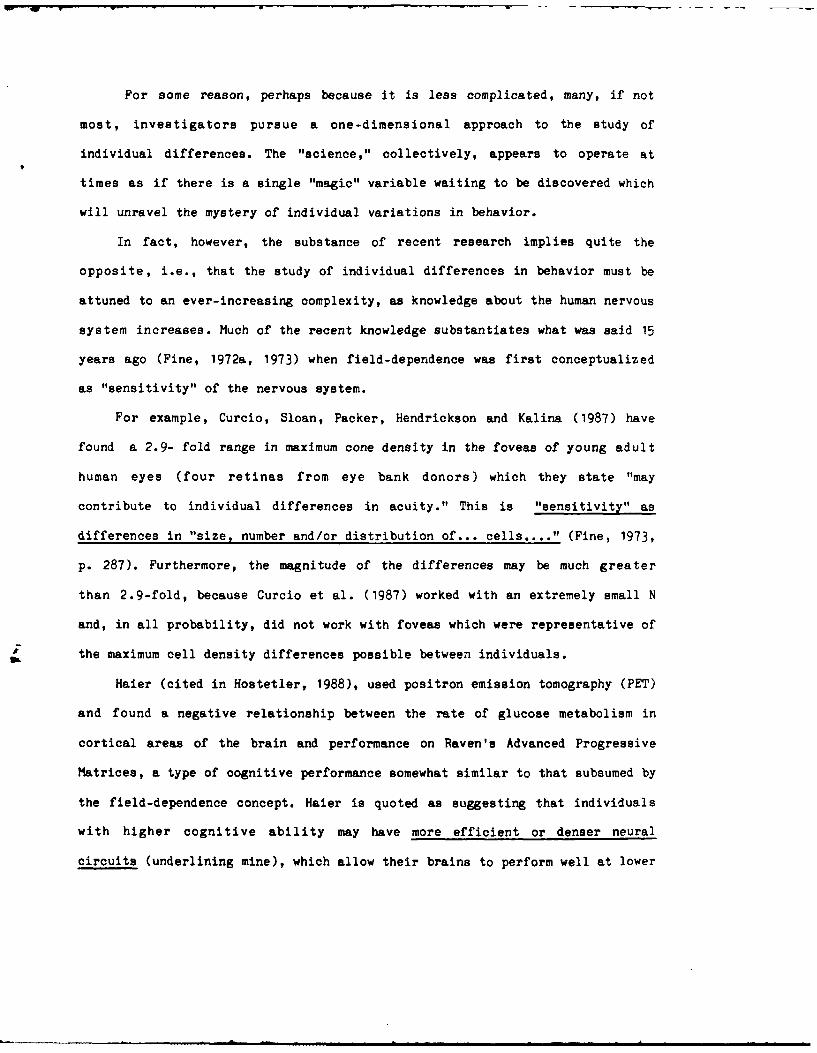
For some reason, perhaps because it is less complicated, many, if not
most, investigators pursue a one-dimensional approach to the study of
individual differences. The "science," collectively, appears to operate at
times as if there is a single "magic" variable waiting to be discovered which
will unravel the mystery of individual variations in behavior.
In fact, however, the substance of recent research implies quite the
opposite, i.e., that the study of individual differences in behavior must be
attuned to an ever-increasing complexity, as knowledge about the human nervous
system increases. Much of the recent knowledge substantiates what was said 15
years ago (Fine, 1972a, 1973) when field-dependence was first conceptualized
as "sensitivity" of the nervous system.
For example, Curcio, Sloan, Packer, Hendrickson and Kalina (1987) have
found a 2.9- fold range in maximum cone density in the foveas of young adult
human eyes (four retinas from eye bank donors) which they state "may
contribute to individual differences in acuity." This is "sensitivity" as
differences in "size, number and/or distribution of... cells...." (Fine, 1973,
p. 287). Furthermore, the magnitude of the differences may be much greater
than 2.9-fold, because Curcio et al. (1987) worked with an extremely small N
and, in all probability, did not work with foveas which were representative of
the maximum cell density differences possible between individuals.
Haier (cited in Hostetler, 1988), used positron emission tomography (PET)
and found a negative relationship between the rate of glucose metabolism in
cortical areas of the brain and performance on Raven's Advanced Progressive
Matrices, a type of cognitive performance somewhat similar to that subsumed by
the field-dependence concept. Haier is quoted as suggesting that individuals
with higher cognitive ability may have more efficient or denser neural
circuits (underlining mine), which allow their brains to perform well at lower
9
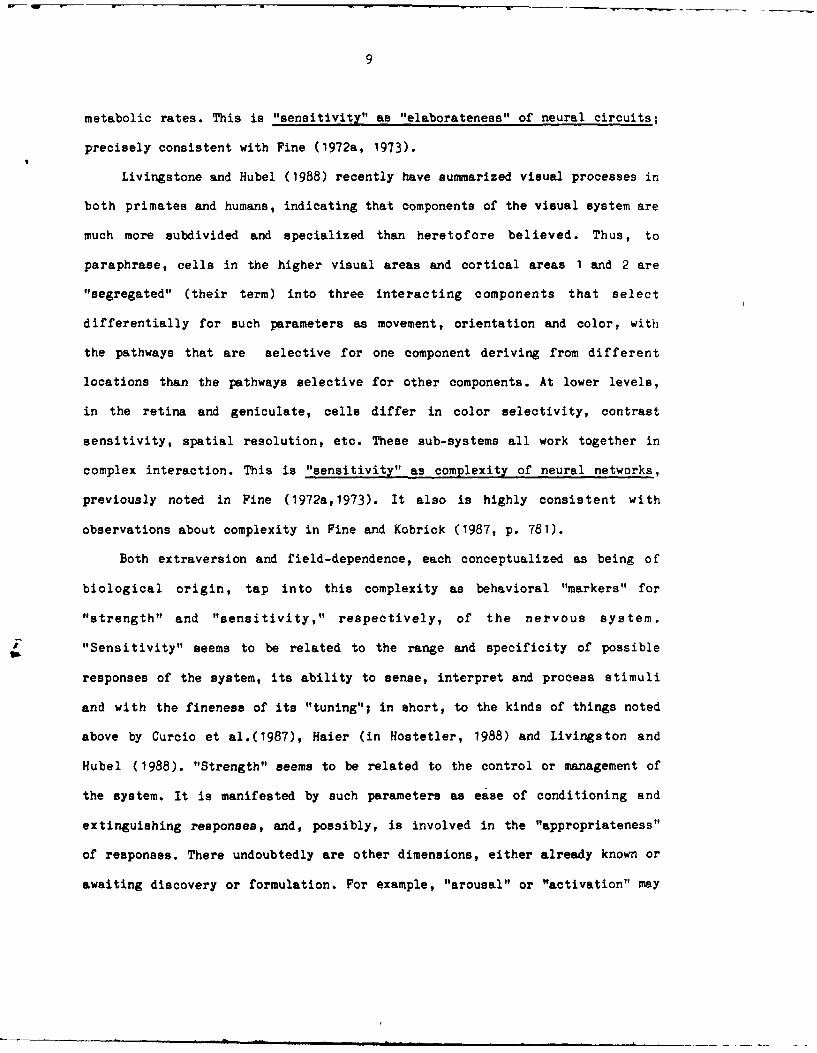
metabolic rates. This is "sensitivity" as "elaborateness" of neural circuits;
precisely consistent with Fine (1972a, 1973).
Livingstone and Hubel (1988) recently have summarized visual processes in
both primates and humans, indicating that components of the visual system are
much more subdivided and specialized than heretofore believed. Thus, to
paraphrase, cells in the higher visual areas and cortical areas 1 and 2 are
"segregated" (their term) into three interacting components that select
differentially for such parameters as movement, orientation and color, with
the pathways that are selective for one component deriving from different
locations than the pathways selective for other components. At lower levels,
in the retina and geniculate, cells differ in color selectivity, contrast
sensitivity, spatial resolution, etc. These sub-systems all work together in
complex interaction. This is "sensitivity" as complexity of neural networks,
previously noted in Fine (1972a,1973). It also is highly consistent with
observations about complexity in Fine and Kobrick (1987, p. 781).
Both extraversion and field-dependence, each conceptualized as being of
biological origin, tap into this complexity as behavioral "markers" for
"strength" and "sensitivity," respectively, of the nervous system.
"Sensitivity" seems to be related to the range and specificity of possible
responses of the system, its ability to sense, interpret and process stimuli
and with the fineness of its "tuning"; in short, to the kinds of things noted
above by Curcio et al.(1987), Haier (in Hostetler, 1988) and Livingston and
Hubel (1988). "Strength" seems to be related to the control or management of
the system. It is manifested by such parameters as ease of conditioning and
extinguishing responses, and, possibly, is involved in the "appropriateness"
of responses. There undoubtedly are other dimensions, either already known or
awaiting discovery or formulation. For example, "arousal" or "activation" may
10
represent a "mobilization" dimension intermediate to "sensitivity" and
"strength."
Since most investigators in the areas in question have worked only with
field-dependence or only with extraversion, the "power" of what appears to be
a very strong and frequently occurring non-linear association between the two
virtually has gone unnoticed.
The potential of this "power" may be appreciated by considering the
following empirical examples taken from some of my previously published and
unpublished research (the data from some of which were re-analyzed for this
paper).
(1) In a study which retrospectively examined the relationship between
field-dependence, extraversion and neuroticism (see Fine, 1972a for
background), it was predicted that the combination of field-dependence and
extraversion, as manifested specifically in field-dependent introverts would
yield a higher incidence of neuroticism than would any other combination of
the two dimensions. This prediction was substantiated in each of four
independent studies, all using the MPI (Eysenck, 1959) and the HST (Cattell et
al., 1955) and in several other studies using other measures. In the studies
in which the MPI and the HST were used, trichotomization was based on norms
derived from a data base of over 600 military Ss.
Table 6 from Fine (1972a), shown below as Table 2, summarizes the
combined results of the field-dependence, extraversion, neuroticism
inter-relationship for the four studies in which the MPI and HST were used.
Insert Table 2 about here
Clearly, the combination of the two dimensions in this predicted
non-linear relationship contributed something greater than either dimension
separately. Moreover, the correlations between extraversion and
11
field-dependence in each of the four studies were .00 (N:54), -.02 (N=53), .18
(N:54) and .01 (N=17; this r was not stated in the published article), all
non-significant.
(2) Another example can be found in Fine (1972b). (The Ss in this study
were the same as in one of the four groups combined in Table 2.) This research
related intrinsic motivation, intelligence and personality to cognitive and
motor performance. Results from two tasks are of interest here. One was a
purely cognitive task, solving anagram puzzles, and the other was a motor
performance task with a cognitive component, sorting five different kinds of
screws (differing in shape and color) into five appropriately labelled
containers. Both tasks were performed under "self-paced" conditions, i.e. the
task was assigned for a specific period of time, to be done without anyone but
S present. Each task was performed once in the morning and once in the
afternoon of the same day.
Since the N (54) was too small to divide the group into 3rds on the basis
of field-dependence and extraversion combinations, medians, were used. These
were based on norms from a larger military population. No predictions were
made in this retrospective analysis.
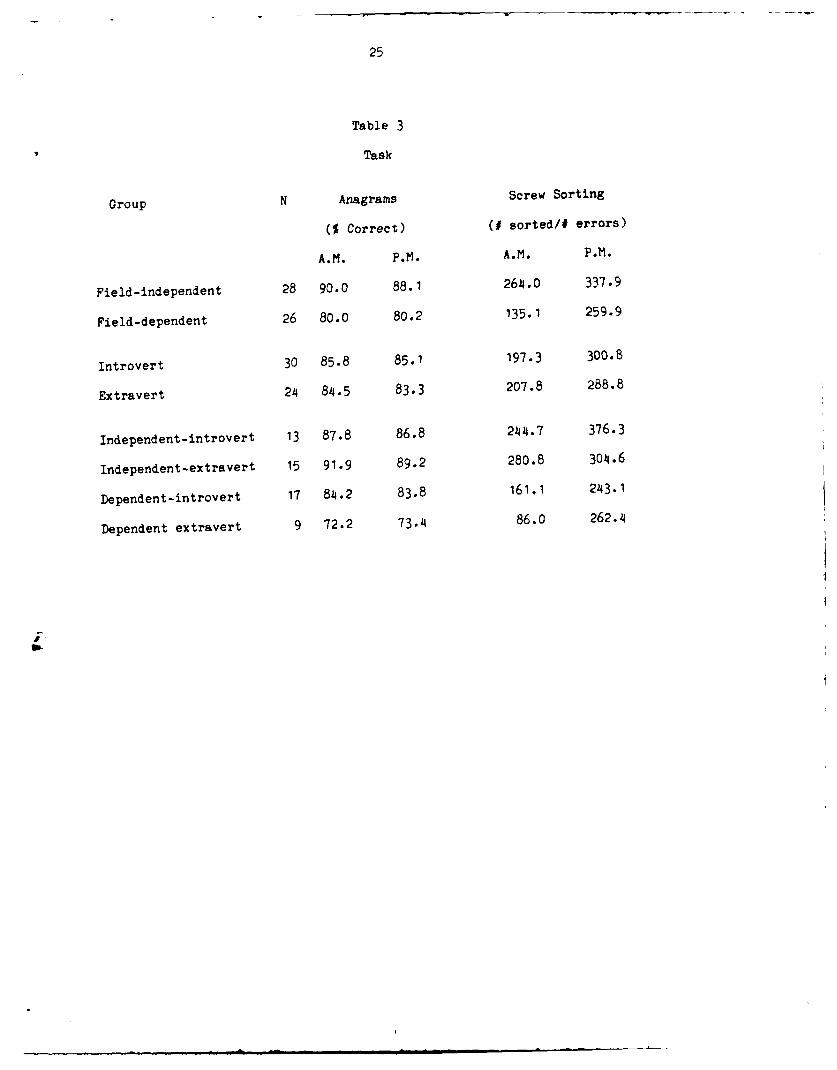
For the anagram task, considering morning performance only (see means in
Table 3), it was found that the field-independent Ss, as a group, were
significantly superior (3 correct) to the field-dependent Ss (p <.01). No
differences were found between introverts and extraverts. However, further
analysis (ANOVA and t-tests) of the interaction between field-dependence and
extraversion revealed that the field-dependent extravert sub-group had a mean
performance score that was significantly poorer than each of the other three
sub-groups representing combinations of field-dependence and extraversion
(vs. independent extraverts, p:.01; vs. independent introverts, p=.06; vs.
12
dependent introverts, p=.09). Also, despite there being no overall differences
between extraverts and introverts, field-independent extraverts were found to
be superior to field-dependent introverts (p.0O4). Clearly, the combination of
field-dependence and extraversion elucidated more specific sources of poor
performance than either dimension separately.
Insert Table 3 About Here
Similar results were found with the morning performance of the
screw-sorting task (see Table 3). Over-all, the field-independent group
performed significantly better than the field-dependent group (p< .01),
whereas no significant differences were found between extraverts and
introverts. However, ANOVA and t-tests indicated that poorest performance was
centered in the field-dependent extravert sub-group which had significantly
poorer performance than the other three sub-groups (vs. independent
extraverts, p:.01; vs. independent introverts, p=.02; vs. dependent
introverts, p=.09).
Thus, while extraversion ordinarily would not have been considered as a
significant factor in the performance of these tasks, it was shown to be an
extremely important factor, since it interacted with field-dependence to
0describe the poorest performing sub-group, field-dependent extravert. This
would not have been determined by simple correlational analysis, since no
significant relationships were found between extraversion and performance or
extraversion and field-dependence.
In passing, it should be noted ( Table 3) that afternoon performance for
the anagram task was virtually unchanged from moining performance. However,
all groups, but particularly the field-dependent extraverts, improved on the
screw sorting task in the afternoon, to the extent that the field-dependent
extraverts no longer were the poorest performing group. Whether this diurnal
13
variation in performance is particularly meaningful with regard to
field-dependent extraverts has yet to be examined.
(3) Fine and Danforth (1975) examined the relationship between
field-dependence, extraversion and performance on the rod-and-frame test.
Based on the literature at the time, they predicted that field-dependent
extraverts would be poorest on the rod-and-frame test. This prediction proved
to be correct. Mean rod deviations (degrees) from true vertical over 12 trials
were 5.9 for the dependent extraverts (N=15), 3.7 for dependent introverts
(N=13) and 2.3 for both the independent extraverts (N=15) and independent
introverts (N=13). The correlation between field-dependence and extraversion
was not determined for this group of Ss because they represented extremes of
field-dependence and extraversion selected specifically for this study from a
larger group; correlations without the middle section of each distribution
would be misleading.
Here, again, the combination of the field-dependence and extraversion
dimensions yielded something that each dimension taken separately did not. The
relationship was non-linear and, in terms of rod-and-frame performance,
- brought extraversion ("strength") into what, at the time, was primarily
thought to be the domain of field-dependence ("sensitivity"), even though,
prior to that, Taft and Coventry (1958) and Fine and Cohen (1963) had
demonstrated that extraverts, in fact, were poorer than introverts on the
rod-and-frame. [It was partially because of the Fine and Cohen (1963) study
that Eysenck concluded that field-dependence and extraversion were one and the
same thing (Eysenck, 1967, p. 117, and, again, 1982), which has been disputed
(Fine, 1983b). It is apparent now that the earlier results of Taft and
Coventry (1958) and Fine and Cohen (1963) probably reflected a
disproportionate influence of field-dependent extraverts in their samples.]
11
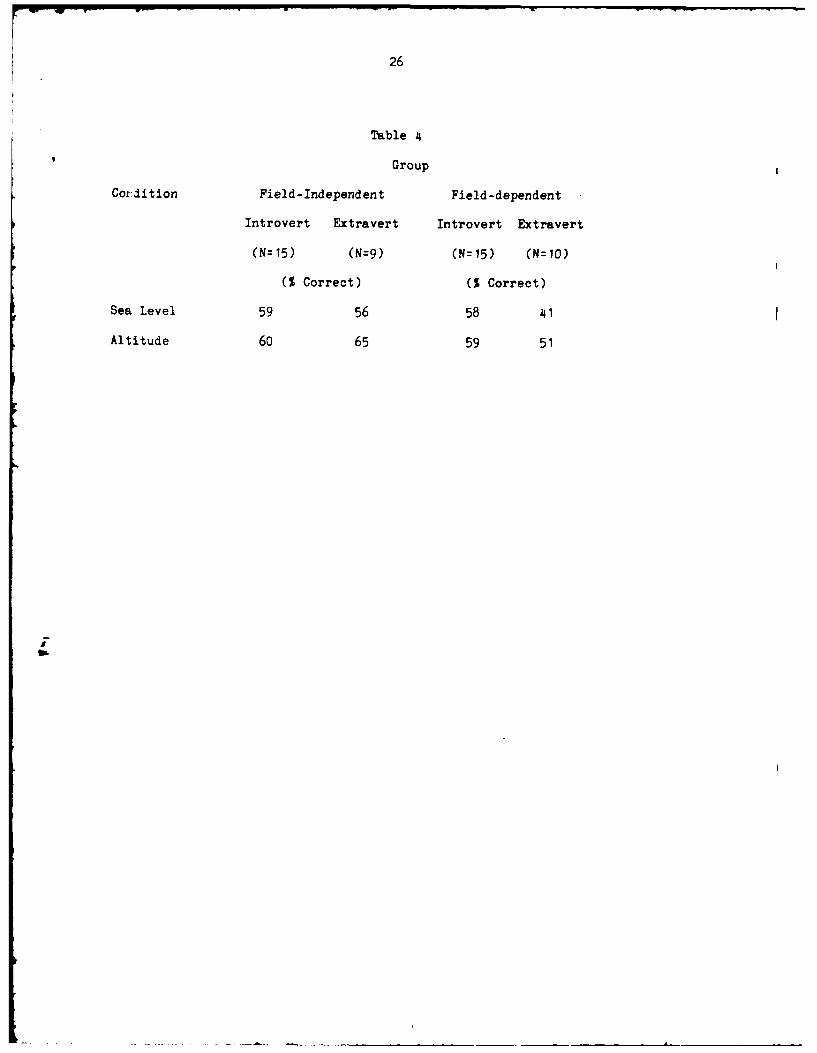
(4) Fine and Kobrick (1976) had 49 soldiers view 40 slides (at sea level
and at altitude) in which a stimulus soldier (in camouflage uniform) was
identically posed in a constant background but with different viewing
distances and viewing angles from the observer. Accuracy of target detection
was analyzed for field-dependence and extraversion separately and in
combination, using the same median split as in prior examples. Data were
pooled across 40 trials and collapsed across distance and viewing angle. The
results are summarized in Table 4.
Insert Table 4 About Here
At sea level, the field-independent group generated proportionally more
correct target detections (57.8%) than did the field-dependent group (50.5%;
p<.01) and the introvert group (58.2%) more correct detections than the
extravert group (47.9%; p<.001). However, the poorest performance was shown to
be in the field-dependent extravert group (41%; comparisons with other three
sub-groups all yield p<.001). It was quite obvious (see Table 4) that the
differences between the field-independent and field-dependent groups and
between introverts and extraverts primarily were due to the poorer
performance of the field-dependent extravert sub-group. Although their
performance improved, field-dependent extraverts also were least accurate at
altitude (P <.01, all comparisons). Bear in mind that these are not the sameSs as in the previously cited study wherein the field-dependent extraverts
The correlation between field-dependence and extraversion here was -.32,
significant at P <.05, but hardly a robust enough association to account for
the large divergent pattern of the field-dependent extraverts, particularly
when viewed in the context of the other examples noted above.
(5) Finally, data from two unpublished experiments gathered from 60 Ss,
15
56 of whom were the basis of Fine (1973; relating field-dependence to color
discrimination) and Fine and Danforth (1975; relating field-dependence and
extraversion to performance on the rod-and-frame test), were re-analyzed for
this paper.
Based on the norms from a larger population previously referred to, the
60 Ss, 15 in each of four categories (field-independent extraverts,
field-independent introverts, field-dependent extraverts and field-dependent
introverts) had been selected as extremes (upper or lower thirds of each
distribution) from a larger group of 170 Ss on the basis of scores on the MPI
and HST.
In the first experiment, Ss performed a simple vigilance task, alone, for
two hours, under optimal, non-stressful conditions. The task, in a military
context, involved monitoring a video display of symbols representing friendly
and hostile objects, e.g., tanks, trucks. Periodically, a new, "unknown"
symbol would appear (according to a random schedule) embedded among the
complex array of symbols, and the S had to press a button upon perceiving it.
His responses were timed and errors of omission and commission were recorded.
The only stimulation S received during the two hours was from the video screen
or whatever was generated in his own mind. One would expect field-dependent
Ss to do less well on this task because of their poorer disembedding ability.
ANOVA of the response latency scores yielded a significant groups effect,
due to the slower performance of only the field-dependent introverts. This
sub-group, with a mean of 2.07 seconds differed significantly from each of the
other three groups whose means were very tightly clustered, ranging from 1.17
to 1.28 seconds. The field-dependent introvert sub-group also committed
significantly more errors of omission, with approximately 5% of their possible
judgments missed. The groups' poorer performance primarily was due to four Ss
16
actually falling asleep during the experiment. No Ss in any other sub-group
fell asleep! This is the same group of Ss in which field-dependent extraverts
were found to be poorest on the rod-and-frame, so it is not as if it is one
"set" of people who are just poorer overall on all tasks. It also should be
noted that field-dependent introverts was the category shown to be most
neurotic in a previous study (Fine, 1972a) cited above.
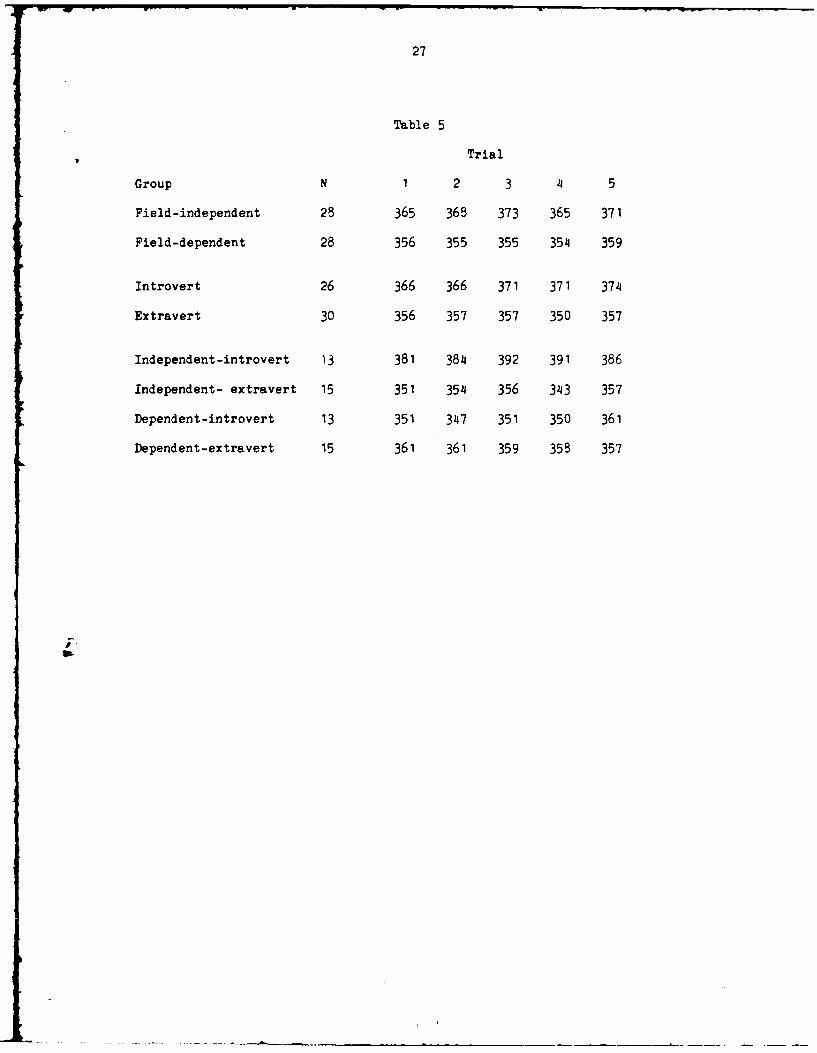
In a second experiment, the same Ss performed individually on a tapping
task, designed to induce motor fatigue. Under constant exhortation from E to
perform at maximum speed, S tapped a telegraph key as rapidly as possible for
five one-minute periods, each separated by a 30-second rest interval. The
results are shown in Table 5. Based on theory, we expected introverts to
perform better than extraverts, which they did (p<.10) in three of the five
trials (trials 3,4,5). Field-independent Ss, as a group, performed better than
field-dependent Ss in two of the five trials (trials 2,3). However, of
significance here, we found that field-independent introverts consistently
performed significantly (p<.06 or less) better than the other three sub-groups
(I4 of 15 comparisons, i.e., 5 trials x 3 comparisons each trial), which did
not differ from one another. Again, the two personality dimensions in
non-linear interaction revealed performance differences not discernible using
each dimension separately.
Insert Table 5 About Here
It would be very presumptuous to try to explain all of these results in
terms of "strength" and "sensitivity" of the nervous system, or to indicate
that all is clearly understood. Also, it must be pointed out that in certain
instances in our retrospective analyses, no relationships were found or
relationships only with field-dependence or only with extraversion occurred.
And, certainly, we have not covered all of the research that previously has
17
been done. However, explaining everything is not our point at this early
stage. What is important and what has been illustrated is that it appears that
a combination of field-dependence and extraversion frequently has yielded much
more "powerful" and specific results than either dimension by itself.
Of the hundreds, perhaps even thousands, of studies done by followers of
Eysenck and Witkin, only a small fraction (probably much less than 1%) appear
to have dealt with both dimensions, and then only with linear relationships.
(It is my observation that "Eysenckians" rarely ever cite Witkin and
"Witkinites" rarely ever cite Eysenck.) Furthermore, in nearly every study,
regardless of which dimension was used, classification of Ss into
personality categories has been based only on within study test scores rather
than on norms from larger data bases, a documentably erroneous and misleading
procedure.
Since the KPI or its later versions only takes about 15-20 minutes to
complete and the HST no longer than 5 minutes, it seems terribly wasteful not
to use both measures, given the suggestive material we have presented above.
It is strongly recommended that both be used, and that norms based on large
groups be used for determining within-study sub-group classifications so that
studies can be directly compared. Where possible, N's should be large enough
to permit the upper and lower thirds of the personality score distributions to
be used for classifying Ss; the use of medians allows centrally scoring Ss to
"contaminate" the results.
Finally, neither the complexity nor the apparent genetic basis of each
dimension can or should be ignored. How we look at human behavior determines
how we proceed in our research. While biology continues to elucidate new and
wondrously complex relationships between the molecular and the molar, most of
psychology seems to proceed on the molar level only, either blissfully
18
ignorant of what is transpiring below or hoping that it will go away.
But it simply cannot be ignored, and it most certainly will not go away.
Rather, it is going to get even more complex. Somewhere in the beautifully
mysterious and complicated RNA/DNA chains of enzymes and proteins and their
precursors are markers for very complicated later neurological and other
events- structural and functional- which, themselves, then become transformed
into specific sub-units of behavior and, thence, into collections of
increasingly complex sub-units and, ultimately, into clusters of behaviors
which perceptive psychologists.., the Eysencks and the Witkins... then label
as extraversion or field-dependence.
To better understand this, one should study the article by Livingstone
and Hubel (1988) and overlay upon it the virtual certainty that each
individual has a distinctly unique combination of all of the complex factors
those authors discuss. Thus, individuals may differ markedly from one another
in the accuracy of their perception of edges, of slants, of color, contrast
and form and the differences between individuals may be at any level, from
receptors to highest areas of the cortex. Furthermore, if we look at
consistency of perception within an individual, it becomes readily
understandable why a person can score very high on one test involving the
perception of geometric shapes, the HST, for example, and yet do considerably
poorer on what, at a molar level, appears to be a very similar test, e.g., the
EFT; the two tests may require different degrees of sensitivity for edges,
slants, form, etc. However, tests never have been compared at so basic a
level. And it should be obvious that Livingstone and Hubel (1988) are
discussing only perception; similar complexity probably obtains in all other
systems.
Only through a very deep appreciation of this rather overwhelming
19
complexity and a dedication to systematically "picking it apart" can we hope
to arrive at an understanding of individual differences in human behavior and
an explanation for the seeming contradictions that we observe when viewing
that behavior solely from the molar level.
20
References
Cattell R.B., et al. (1955) The Objective-Analytic Personality Factor
Batteries. Institute for Personality and Ability Testing, Champaign, IL.
Curcio C.A., Sloan (Jr) K.R., Packer 0., Hendrickson A.E. and Kalina R.E.
(1987) Distribution of cones in human and monkey retina: individual
variability and radial asymmetry. Science 236, 579-582.
Eysenck H.J. (1959) The Maudsley Personality Inventory. Univer. London Press,
London.
Eysenck H.J. (1967) The Biological Basis of Personality. Charles C. Thomas,
Springfield, IL.
Eysenck H.J. (1982) Review of Cognitive Styles: Essence and Origins by H.A.
Witkin and D.R. Goodenough. Person. individ. Diff. 3, 103.
Eysenck H.J. (1983) A reply to Fine. Person. individ. Diff. 4, 361.
Farnsworth D. (1957) Manual for the Farnsworth-Munsell 100-Hue Test for the
Examination of Color Discrimination. Munsell Color Co., Baltimore.
Fine B.J. (1972a) Field-dependent introvert and neuroticism: Eysenck and
Witkin united. Psychol. Rep. 31, 939-956.
Fine B.J. (1972b) Intrinsic motivation, intelligence and personality as
related to cognitive and motor performance. Percept. mot. Skills 34,
319-329.
Fine B.J. (1973) Field-dependence-independence as "sensitivity" of the nervous
system: supportive evidence with color and weight discrimination.
Percept. mot. Skills 37, 287-295.
Fine B.J. (1983a) Field-dependence and color discrimination ability in
females. Percept. mot. Skills 57, 983-986.
21
Pine B.J. (1983b) Field-dependence, extraversion, Eysenck and autarky. Person.
individ. Diff. 4, 359-360.
Fine B.J. (1987) The effect of heat and chemical protective clothing on the
ability of a group of female soldiers to sustain performance of military
cognitive tasks. Tech. Rept. (T7-88) U.S. Army Research Institute of
Environmental Med., Natick, MA.
Fine B.J. and Cohen A. (1963) Internalization ratio, accuracy, and variability
of judgments of the vertical. Percept. mot. Skills 16, 138.
Fine B.J. and Danforth A.V. (1975) Field-dependence, extraversion and
perception of the vertical: empirical and theoretical perspectives of the
rod-and-frame test. Percept. mot. Skills 40, 683-693.
Fine B.J. and Kobrick J.L. (1976) Note on the relationship between
introversion-extraversion, field-dependence-independence and accuracy
of visual target detection. Percept. mot. Skills 42, 763-766.
Fine B.J. and Kobrick J.L. (1980) Field-dependence, practice and low
illumination as related to the Farnsworth-Munsell 100-Hue Test. Percept.
mot. Skills 51, 1167-1177.
Pine B.J. and Kobrick J.L. (1983) Individual differences in distance
estimations comparison of judgments in the field with those from
projected slides of the same scenes. Percept. mot. Skills 57, 3-14.
Pine B.J. and Kobrick J.L. (1987) Cigarette smoking, field-dependence and
contrast sensitivity. Aviat. Space and Environ. Med. August, 777-782.
Hays W.L. (1963) Statistics for Psychologists. Holt, Rinehart and Winston,
New York, Pp. 327-329.
Hostetler A.J. (1988) 'Smart' brains work better, not harder. APA Monitor
19, 15.
22
Livingstone M. and Hubel D. (1988) Segregation of form, color, movement, and
depth: anatomy, physiology, and perception. Science 240, 740-749.
Taft R. and Coventry J. (1958) Neuroticism, extraversion and the perception
of the vertical. J. abnorm.soc. Psychol. 56, 139-141.
Witkin H.A. (1964) Origins of cognitive style. In Cognition: Theory, Research
Promise. (Edited by Scheerer C.) Harper and Row, New York, Pp. 172-205.
Witkin H.A. (1965) Psychological differentiation and forms of pathology.
J. abnorm. Psychol. 70, 317-336.
Witkin H.A., Dyk R.B., Paterson H.F., Goodenough, D.R. and Karp S.A. (1962)
Psychological Differentiation. Wiley, New York.
$
23
Table 1
Day 1 Day 2 Days 1+2
Trials
Group N 1 2 3 1-3 4 5 6 1-8
Field-Dependent 6 29.8 22.0 22.5 24.8 19.5 18.3 20.2 19.2 22.0
Field-Central 6 18.2 20.3 12.7 17.1 17.7 13.5 11.0 14.1 15.5
Field-Independent 5 14.4 7.2 12.4 11.4 9.8 10.8 14.0 11.5 11.5
t-test;
Dep./Indep. 2.19 3.05 1.82 3.21 2.13 1.47 1.34 2.26 3.38
P (l-tail) .03 .007 .05 .005 .03 .09 .11 .03 .004
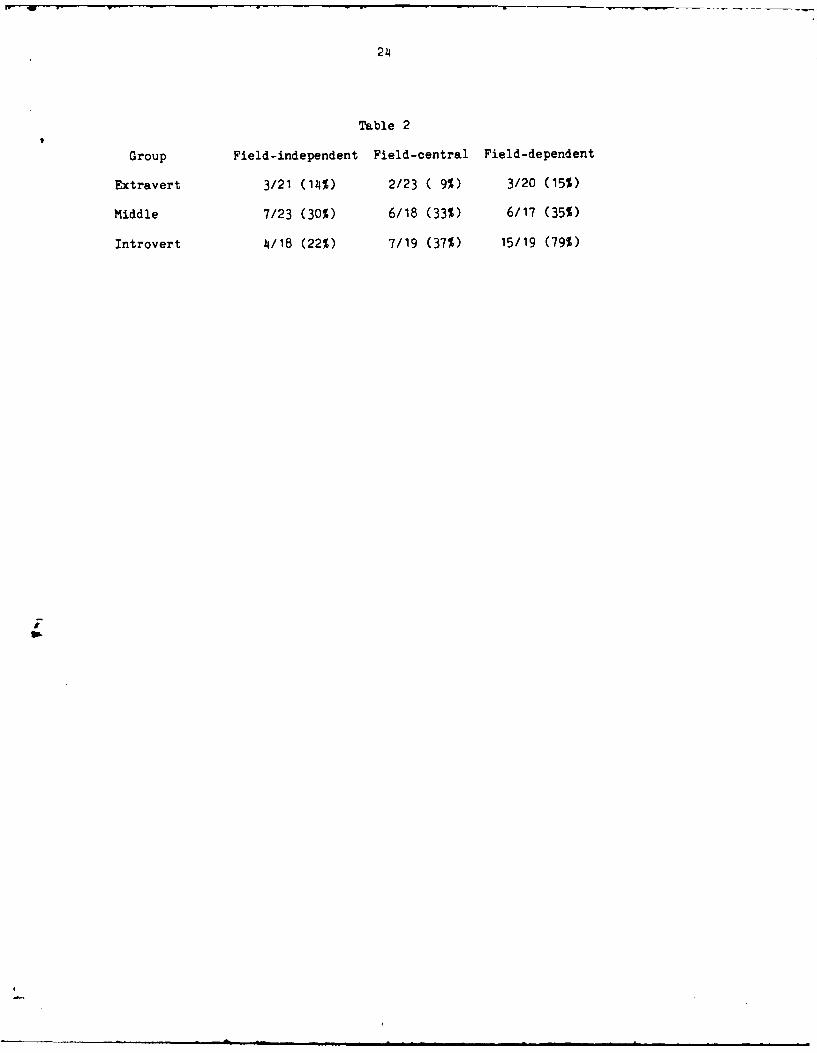
Table 2
Group Field-independent Field-central Field-dependent
Extravert 3/21 (1J4%) 2/23 ( 9%) 3/20 (15%)
Middle 7/23 (30%) 6/18 (33%) 6/17 C35%)
Introvert 4~/18 (22%) 7/19 (37%) 15/19 (79%)
0-
25
Table 3
Task
Group N Anagrams Screw Sorting
(% Correct) (f sorted/# errors)
A.M. P.M. A.M. P.M.
Field-independent 28 90.0 88.1 264.0 337.9
Field-dependent 26 80.0 80.2 135.1 259.9
Introvert 30 85.8 85.1 197.3 300.8
Extravert 24 84.5 83.3 207.8 288.8
Independent-introvert 13 87.8 86.8 244.7 376.3
Independent-extravert 15 91.9 89.2 280.8 304.6
Dependent-introvert 17 84.2 83.8 161.1 243.1
Dependent extravert 9 72.2 73.4 86.0 262.4
26
Table 4i
Group
Co::dition Field-Independent Field-dependent
Introvert Extravert Introvert Extravert
(N=15) (N=9) (N=15) (N=10)
(% Correct) (% Correct)
Sea Level 59 56 58 41
Altitude 60 65 59 51
27
Table 5
Trial
Group N 1 2 3 4 5
Field-independent 28 365 368 373 365 371
Field-dependent 28 356 355 355 354 359
Introvert 26 366 366 371 371 374
Extravert 30 356 357 357 350 357
Independent-introvert 13 381 384 392 391 386
Independent- extravert 15 351 354 356 343 357
Dependent-introvert 13 351 347 351 350 361
Dependent-extravert 15 361 361 359 358 357
28
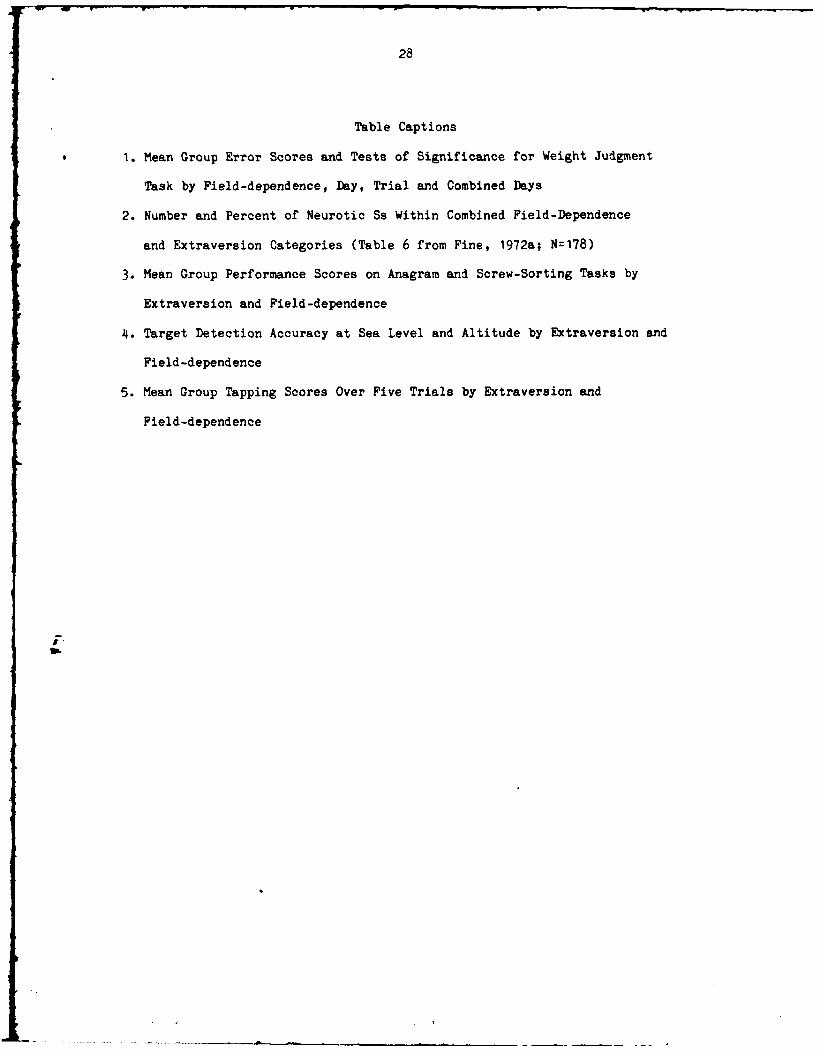
Table Captions
1. Mean Group Error Scores and Tests of Significance for Weight Judgment
Task by Field-dependence, Day, Trial and Combined Days
2. Number and Percent of Neurotic Ss Within Combined Field-Dependence
and Extraversion Categories (Table 6 from Fine, 1972a; N=178)
3. Mean Group Performance Scores on Anagram and Screw-Sorting Tasks by
Extraversion and Field-dependence
4. Target Detection Accuracy at Sea Level and Altitude by Extraversion and
Field-dependence
5. Mean Group Tapping Scores Over Five Trials by Extraversion and
Field-dependence
I.
29
Acknowledgements
The assistance of Ms. Edith A. Crohn and SP4 Linda S. Gowenlock in
administering the weight and color discrimination tests is most gratefully
acknowledged.
I