Embed Size (px)
Citation preview

© ABB Group September 27, 2010 | Slide 1
ABB Measurement Products – Analytical Solutions Standard Solutions for QbD and Real Time Release in the Pharmaceutical Industry
IFPAC conference – Sept 2010 – Daniel keogh

© ABB Group September 27, 2010 | Slide 2
What are Standard Solutions for QbD and Real Time Release in the Pharmaceutical Industry?
Application Product Picture
Laboratory FT-IR spectrometer MB3000-PH
FT-NIR tablet analyser - QC FTLA2000-PH60
Laboratory and at-line FT-NIR analyser MB3600-PH
Process FT-NIR platform FTPA2000-260PH
Pre-configured PAT FT-NIR analyser FTPA2000-PH40
Scalable PAT data integration solution xPAT

© ABB Group September 27, 2010 | Slide 3
Pharmaceutical applications: drug substance

© ABB Group September 27, 2010 | Slide 4
Laboratory reaction monitoringReal-time determination of reaction end point and intermediate products or contaminants concentration using in-situ probes
Technical choice for reaction monitoring: MIR versus NIRTechnology Advantages Challenges
MIR - Lower limits of detection (ppm level)- Ease of interpretation- Simple calibrations- Specificity of ATR probes for liquid phase in crystallisation reactions- Very good for qualitative applications
- Light pipe design not robust and reproducible for process- Expensive fibers and limited length- Often requires Sterling-cooled or liquid nitrogen cooled MCT- In crystallisation, coating of ATR may require ultrasonic cleaning
NIR - Allows use of long fiber optics (easier zoning)- Mature technology for process- No ultrasonic cleaning required
- Higher LOD than MIR- Problems with transmission probes in presence of particles/crystals- Small signal of NIR ATR --> Requires high S/N instrument- Requires chemometrics expertise

© ABB Group September 27, 2010 | Slide 5
Process reaction monitoringExample: Real time monitoring of the second step of a ring closure reaction used for synthesis of an active pharmaceutical ingredient. As the reaction is very long (~100 hrs), an ABB FTPA2000-260PH process analyser with insertion transmission probe was used to trend absorption bands characteristic of the target product in first derivative spectra. A second degree polynomial equation was fitted based on several training runs and this equation was subsequently used for the early prediction of reaction end-point.

© ABB Group September 27, 2010 | Slide 6
Solvent recovery The solvent recovery process involves the distillation of a “feed” or “crude”solvent from a low purity (e.g. 60%) to a pure product that can be re-used in the manufacturing process. Pharmaceutical and chemical companies face growing pressure from environmental groups and regulators to adopt sustainable manufacturing and green chemistry practices. It is critical for them to have a way of monitoring accurately and in real time the solvent recovery process, in order to avoid excessive water concentration in solvent and reduce the fees charged for incineration.
Example: real-time monitoring of water content in ethyl acetate/etanol solvent feed during distillation using an FTPA2000-260PH process analyser with insertion transmission probe (3 mm pathlength), 85m fiber optics length
© ABB Group September 27, 2010 | Slide 7
Solvent recovery Background
Service engineer installed the full system with IQ/OQ in 3 days ( a week before the start of a new campaign)
The lab pre-calibration gave good results within the first day (14 samples)
Model development and training were finished in 4 days (lab model enriched with 30 process samples). Model was updated once after 1 month, and alarms lined to F-ratios
A new reference spectrum is collected at the start of a new campaign (every 10-14 weeks)
System has been accepted by an internal validation committee after 8 months of operation
, ( ), ( )
Actual Concentration ( C1 )Actual Concentration ( C1 )
Pred
icte
d Co
ncen
tratio
n ( F
5 C1
)Pr
edic
ted
Conc
entra
tion
( F5
C1 )
1
2
345
6
7
89
10
1112
13
14
15
161718
19
20
2122
23
2425
26
27
2829 30
31
32
33
3435
36
3738
39
40
41
42 43
44
45
46
4748
49
5051
52
-.2
.4
1
1.6
2.2
-.2 .4 1 1.6 2.2
0
.5
1
9000 8000 7000 6000 5000 (Wavenumber (cm )
Abs
orba
nce
-1
2nd CH Overtone1st Overtone OH + Water
Water
FT-NIR Spectra of Water/Ethyl-Acetate-Ethanol
0
.5
1
9000 8000 7000 6000 5000 (Wavenumber (cm )
Abs
orba
nce
-1
2nd CH Overtone1st Overtone OH + Water
Water
FT-NIR Spectra of Water/Ethyl-Acetate-Ethanol
Range: 0-2%Temperature: 8-25 ºCSEP=0.045% w/w

© ABB Group September 27, 2010 | Slide 8
Crystallization Properties of active pharmaceutical ingredients (API) such as solubility, dissolution rate, density, physical stability and melting point change depending on the type of crystalline forms. The various polymorphs of a given pharmaceutical compound will exhibit different drug release characteristics and biological activity upon inhalation or injection
Crystallization is usually the final stage in the manufacture of a bulk API. The rising demands for product quality are imposing to process engineers to have, not only a better process understanding (e.g. process dynamics, polymorphism) but also on-line monitoring techniques for quality assurance and control during this critical operation.
Absorbance spectra changes throughout crystallization
experiment

© ABB Group September 27, 2010 | Slide 9
Crystallization Example: real-time monitoring of an API crystallisation process at industrial scale. The use of an in-situ transflectance probe (2 mm pathlength) connected to an ABB FT-NIR analyzer proved an accurate and reliable approach for:
1. Qualitative monitoring of the runs Detection of beginning of supersaturation in the crystallization experiment to decide on the on-set of reagent feeding
2. Quantitative characterization of the liquid phase Determination of residual API concentration in the mother liquor and prediction of crystal mass formed
PC1 score, 4 runs. (A) High feed rate, (B) Low feed rate.
A B
API crystals resulting from 2 different rates of reactant addition.
Magnification: 300x (A) High feed rate, (B) Low feed rate

© ABB Group September 27, 2010 | Slide 10
Drying• Inferential dryer measurements rely on parameters like airflow, pressure
or inlet/outlet air or product temperature. Output variables do not always reflect exactly the critical quality attribute (moisture or solvent level), leading to long cycle times and risks of product degradation (e.g. dehydration).
• Alternatively, off-line analyses (loss on drying, Karl-Fisher titrations, gas chromatography) are more accurate but significantly increase cycle time. They require manual sampling of wet products during the drying phase, which leads to potential safety and industrial hygiene issues such as operator exposure to potent drugs. Moreover, manually collected samples are subject to physical effects like atmospheric humidity absorption or segregation that may alter the analytical determination. In addition, the delay associated with off-line analyses (from 15 min to several hours) makes them unpractical for efficient and accurate process control.

© ABB Group September 27, 2010 | Slide 11
DryingExample: use of multi-channel FTPA2000-PH40 process analyser for real time monitoring of moisture content during drying of API (Range 30% to 4% w/w)
In-line probes inserted flush in the walls of 3 agitated pan dryers (~2mm from agitators)Water content displayed on operator terminalLong drying cycles (>24 hours)Reference method: Karl FisherFT-NIR showed that drying cycle could be reduced by 30%Also used for maintenance and early detection of process upsets
H2O DR1 (%w/w)
0
5
10
15
20
25
30
35
40
45
50
3/18/2003 9:36 3/18/2003 14:24 3/18/2003 19:12 3/19/2003 0:00 3/19/2003 4:48 3/19/2003 9:36 3/19/2003 14:24 3/19/2003 19:12 3/20/2003 0:00 3/20/2003 4:48
Calibration results
2
6
10
14
18
2 6 10 14 18
Reference value
FTIR
Static repeatability ( ) 0.004%Dynamic repeatability ( ) 0.04%SEC 0.19%SECV 0.22%SEP 0.10%r2 0.99

© ABB Group September 27, 2010 | Slide 12
Pharmaceutical applications:drug product
© ABB Group September 27, 2010 | Slide 13
.1
.2
.3
.4
1200 1100 1000 900 800
Fréquence (cm )
Abso
rban
ce
BomemAnalyseur FT-IR
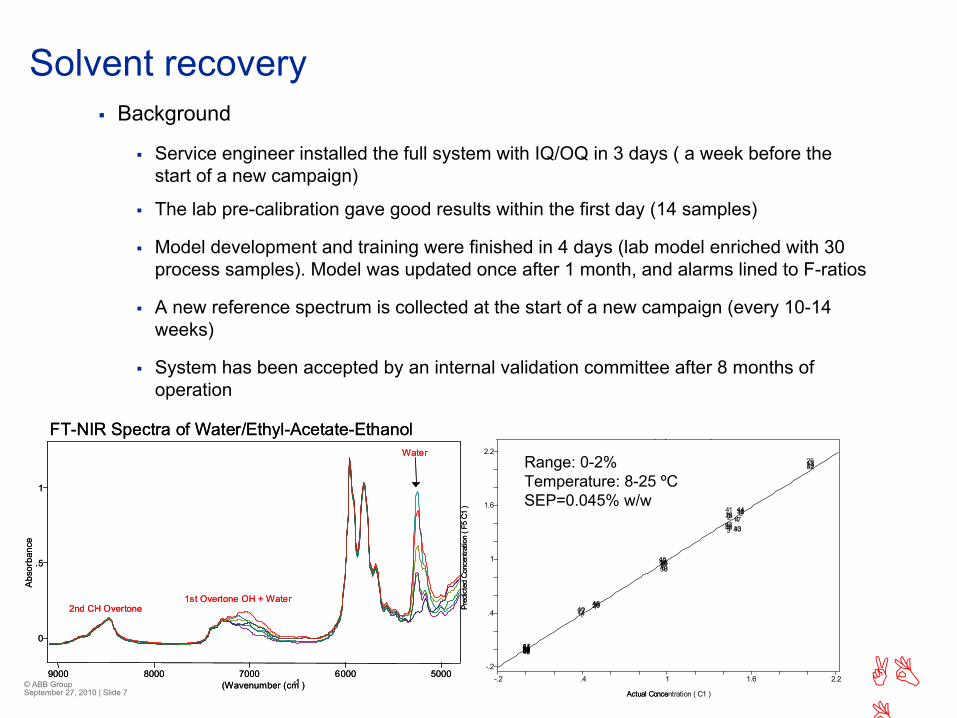
Figure 2: Région phosphate des spectres ATR des échantillons
Contramid 3.25
Amidon (Hylon VII), Contramid 2.0 et 3.25
Amidon (Hylon VII)
-1
Contramid 2.0
Formulation
Deformulation
Example: Determination of the degree of cross-linking in a high amylose starch powder drug delivery matrix, using ATR spectroscopy. The drug release profile will be related to the level of cross-linking obtained in the starch matrix. It can be tailored to the drug being administered or even to the user.
Influence of the degree of cross-linking on spectra
Laboratory FT-IR

© ABB Group September 27, 2010 | Slide 14
Laboratory FT-IRMaterial identification (raw materials or finished products)
Example: discrimination of active pharmaceutical ingredients, using a laboratory FT-IR spectrometer with diffuse reflectance accessory and Kubelka-Munk correction to account for the diffuse light scattering effect in powders
0
.5
1
1.5
2
2.5
3
3.5
5000 4500 4000 3500 3000 2500 2000 1500 1000 500
Kubelka-Munk / Wavenumber (cm-1) Paged X-Zoom CURSOR
File # 1 = AMP02KM 23/08/1995 08:53 Res=4 cm-1
MB102 \DTGS \ DRIFT \ Ampicillin sodium ~ 40% in CsI \ 20 scans
0
1
2
3
4
5
6
5000 4500 4000 3500 3000 2500 2000 1500 1000 500
Kubelka-Munk / Wavenumber (cm-1) Paged X-Zoom CURSOR
File # 2 = PIPER2KM 23/08/1995 09:21 Res=4 cm-1
MB102 \DTGS \ DRIFT \ Piperacillin Sodium ~ 40% in CsI \ 20 scans
0
5
10
15
5000 4500 4000 3500 3000 2500 2000 1500 1000 500
Kubelka-Munk / Wavenumber (cm-1) Paged X-Zoom CURSOR
File # 2 : SULB1KM 23/08/1995 09:37 Res=4 cm-1
MB102 \DTGS \ DRIFT with pure Sulbactam Sodium \ 20 scans
Ampicillin sodium Piperacillin sodium Sulbactam sodium

© ABB Group September 27, 2010 | Slide 15
Impurity and foreign materials detection in products
Quality Analysis (QA) / Quality Control (QC)
Example: QC check of the content of ranitidine (API for gastric diseases) and phenol (preservative) in an injection formulation using FT-IR spectrometer with Horizontal ATR accessory. Objective: decrease the time per analysis with respect to chromatography in order to increase the number of samples tested by the Quality Control laboratory
% Ranitidine in injection Formulation of Zantac
2.3
2.35
2.4
2.45
2.5
2.55
2.6
2.65
2.7
2.3 2.35 2.4 2.45 2.5 2.55 2.6 2.65 2.7
Laboratory FT-IR
© ABB Group September 27, 2010 | Slide 16
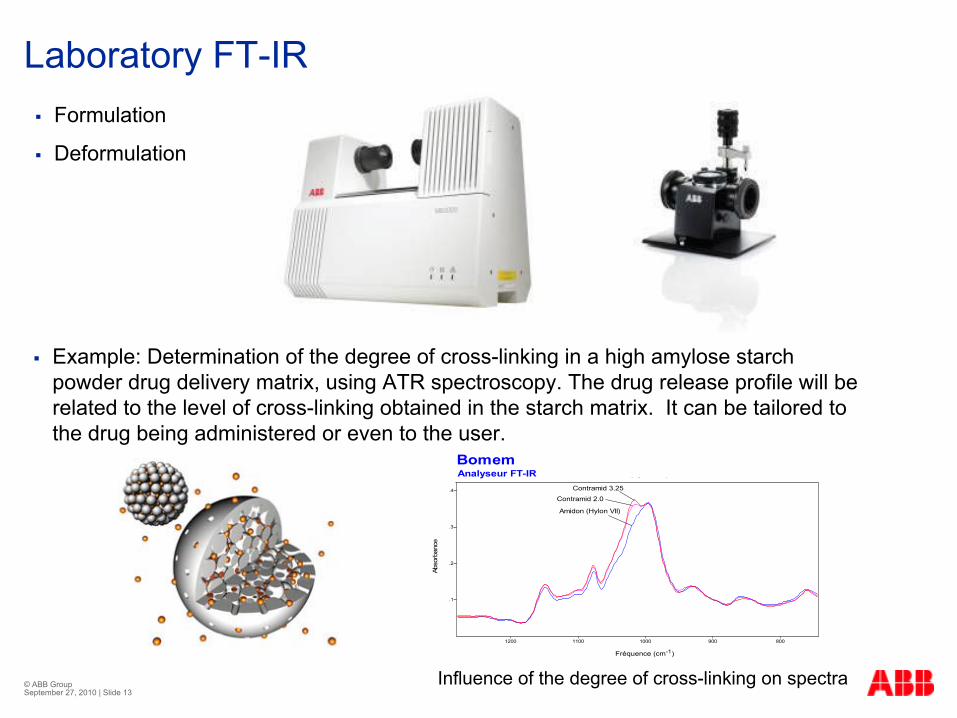
At-line analysis
PAT method development
Example: Quantitative determination of moisture content in lactose powder using a laboratory FT-NIR analyser with fiber optics launcher and diffuse reflectance probe
Laboratory FT-NIR
© ABB Group September 27, 2010 | Slide 17
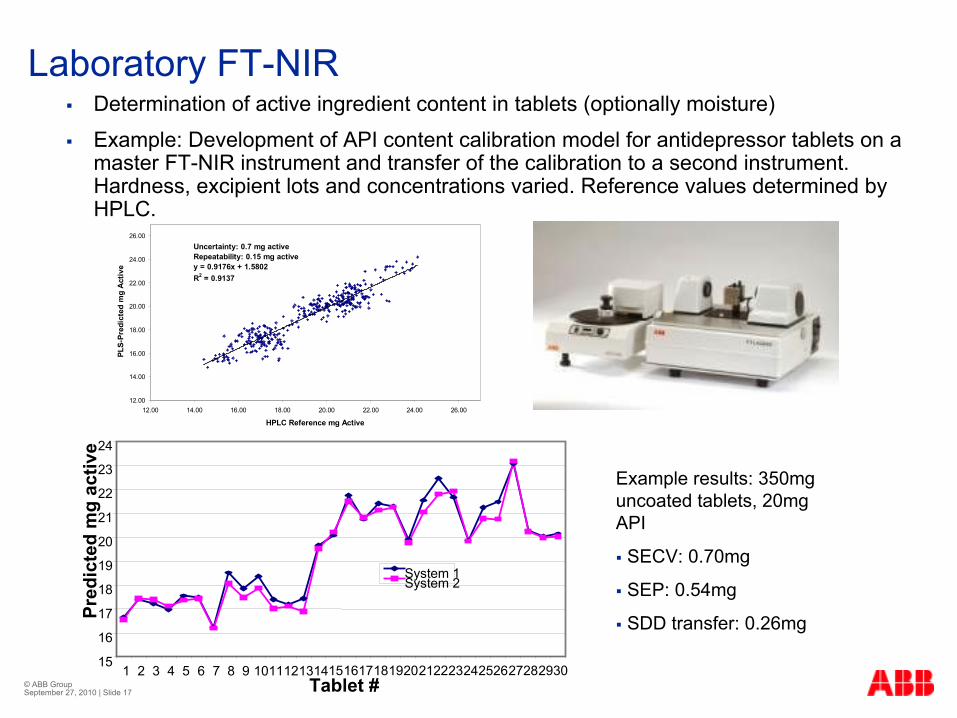
Laboratory FT-NIRDetermination of active ingredient content in tablets (optionally moisture)
Example: Development of API content calibration model for antidepressor tablets on a master FT-NIR instrument and transfer of the calibration to a second instrument. Hardness, excipient lots and concentrations varied. Reference values determined by HPLC.
Uncertainty: 0.7 mg activeRepeatability: 0.15 mg activey = 0.9176x + 1.5802R2 = 0.9137
12.00
14.00
16.00
18.00
20.00
22.00
24.00
26.00
12.00 14.00 16.00 18.00 20.00 22.00 24.00 26.00
HPLC Reference mg Active
PLS-
Pred
icte
d m
g A
ctiv
e
15
16
17
18
19
20
21
22
23
24
1 2 3 4 5 6 7 8 9 101112131415161718192021222324252627282930Tablet #
Pred
icte
d m
g ac
tive
System 1System 2
Example results: 350mg uncoated tablets, 20mg API
SECV: 0.70mg
SEP: 0.54mg
SDD transfer: 0.26mg

© ABB Group September 27, 2010 | Slide 18
Counterfeit drug detection
Example: Detection of counterfeit tablets. Straightforward detection using FT-NIR laboratory analyser in diffuse reflection mode.
Laboratory FT-NIR
FT-NIR spectra showing signatures of original ED drug and 3 counterfeits
PCA score plot showing discrimination between orginal and counterfeit drugs
original
CF2
CF 1
CF3

© ABB Group September 27, 2010 | Slide 19
Deformulation / competition analysis
Example: Discrimination of paracetamol tablets between 4 suppliers (2 branded, 2 generics) using FT-NIR laboratory analyser in diffuse transmission mode. Tablets have similar size, shape, and color with API as the main component.
Laboratory FT-NIR
Overlaid FT-NIR diffuse transmission spectra of tabets from the 4 suppliers
PCA score plot showing discrimination between the 4 suppliers
B2
G1
G2
B1

© ABB Group September 27, 2010 | Slide 20
Granulation - DryingDetermination of residual moisture content and product uniformity during granulation and drying
Example: Use of multi-channel FT-NIR process analyser for real-time monitoring of moisture content during drying (Range 5 to 1% w/w). In-line probes inserted in the dollies of 2 fluid bed dryers. Short drying cycles (30mn)
A c t u a l v s p re d ic te d
y = 0 . 9 9 8 9 x
1
1 .5
2
2 .5
3
3 .5
1 1 .5 2 2 .5 3 3 .5
Ac t u a l c o n c e n t r a t i o n
Pre
dic
ted
conc
entr
atio
n
S e r ie s1L i n e a r ( S e r ie s1 )
Legend
Beige: Continuous line: % moisture
Red: Outlet air temperature
White with big jumps: air flow
Green: Inlet Air Temperature
SEP (w/w) Dynamic repeatability (w/w)0.09% 0.02%

© ABB Group September 27, 2010 | Slide 21
Blend uniformityAPI level and ribbon tensile strength during roller compaction
API level and blend uniformity during high shear mixing
API level and blend uniformity during compression feed frame analysis
Example: FT-NIR real time measurements of ibuprofen in flowing powder formulation in a hopper at the entrance of a compression unit. A process analyser coupled to a non-contact probe has been used to understand the effect of the flow level and initial active ingredient concentration on the homogeneity of the blends, using designed experiments.
R2 = 0.97Uncertainty = 4.2%
40
60
80
100
120
140
160
40 60 80 100 120 140 160
Reference Concentration (%)
Con
cent
ratio
n pr
edic
ted
by P
LS (%
)

© ABB Group September 27, 2010 | Slide 22
Extrusion In pharmaceutical industry hot-melt extrusion (HME) can be used to extrude combinations of drugs, polymers and plasticizers into various solid dosage forms (tablets, transdermal patches, granules, capsules, etc.). It offers a number of advantages over traditional pharmaceutical processing techniques:
No solvents and water required less processing steps than wet granulation and no drying required
Ability to mass large volume units requires less energy than high-shear granulation
Intense mixing results in uniform dispersion
Continuous process more efficient than batch processes
Anhydrous nature of the process eases formulation for the increasing number of molecular entities (>40%) that have poor aqueous solubility and target lipophilicreceptors.
Usual control parameters for HME processes are torque, drive motor amperage and melt pressure. However, for direct measurements of the Critical Quality Attibutes such as API, excipients or contaminants content, FT-NIR is the technology of choice as it allows real-time and non-destructive analysis of the extrudate with specially designed extruder probes inserted in the die.

© ABB Group September 27, 2010 | Slide 23
Extrusion Example: Use of FTPA2000-260PH process analyser for monitoring residual water content in the hot melt of a sustained release pharmaceutical formulation, using a diffuse reflectance probe inserted in extruder die.
H2O Combination Region
1
2
1 = No water added startup condition
2 = 1.8, 1.9, 2.0, 2.1, 2.2 wt% water added
High absorbance due to different gains settings for re ference and sample
All spectra from run
H2O Combination Region
1
2
1 = No water added startup condition
2 = 1.8, 1.9, 2.0, 2.1, 2.2 wt% water added
High absorbance due to different gains settings for re ference and sample
All spectra from run
© ABB Group September 27, 2010 | Slide 24
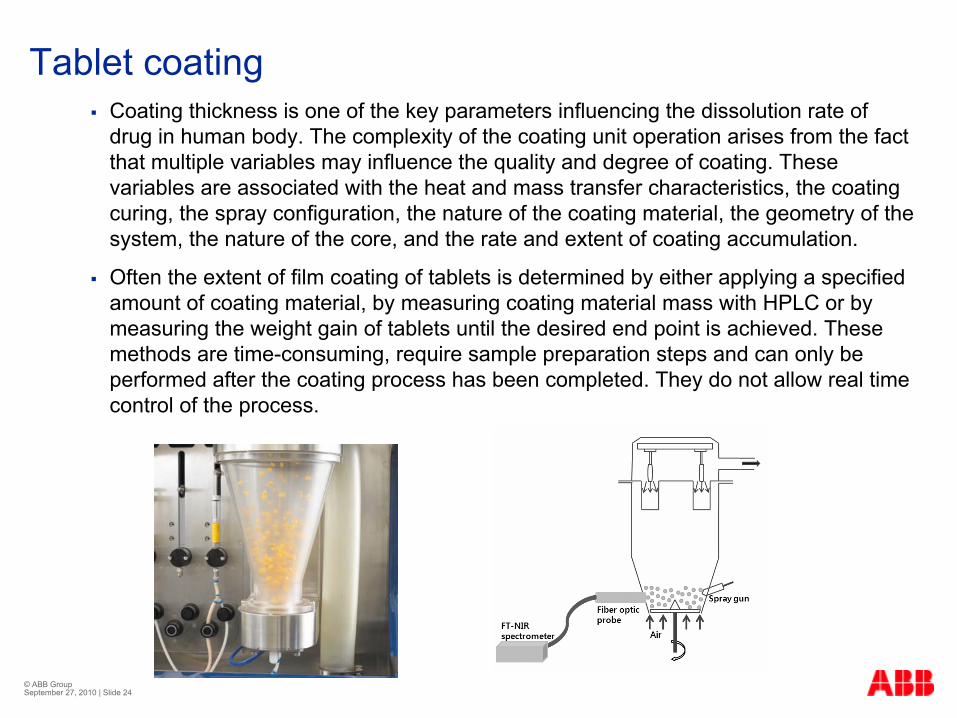
Tablet coating Coating thickness is one of the key parameters influencing the dissolution rate of drug in human body. The complexity of the coating unit operation arises from the fact that multiple variables may influence the quality and degree of coating. These variables are associated with the heat and mass transfer characteristics, the coating curing, the spray configuration, the nature of the coating material, the geometry of the system, the nature of the core, and the rate and extent of coating accumulation.
Often the extent of film coating of tablets is determined by either applying a specified amount of coating material, by measuring coating material mass with HPLC or by measuring the weight gain of tablets until the desired end point is achieved. These methods are time-consuming, require sample preparation steps and can only be performed after the coating process has been completed. They do not allow real time control of the process.

© ABB Group September 27, 2010 | Slide 25
Tablet coating Example 1: Use of a FTPA2000-260PH process analyzer with transflectanceprobe to monitor the homogeneity of tablet coating solutions in a hold tank before transfer to fluid-bed coater. Three calibration models were built for % solids, % hydroxypropyl methylcellulose and % ethyl cellulose. The three modelsallowed real-time monitoring of homogeneity of the coating solutions beforestarting the coating process.
Real-time monitoring of solution homogeneity
Example spectra and calibration curve

© ABB Group September 27, 2010 | Slide 26
PAT in biopharmaceutical manufacturing

© ABB Group September 27, 2010 | Slide 27
FT-NIR features for biomanufacturingFast Allows real-time measurements
FlexibleFiber optics allows in-situ analysis
Different sampling options allow to accommodate different fermentation media (clear, opaque) Multiplex instruments
No sample preparation required
Accurate Can be used as an alternative method to laboratory at-line measurements
Information richDetermination of chemical and physical characteristics of samples can be used for in-line qualitative and quantitative analysis (nutrients, products, by-products)
Can pick-up information on the complete matrix (not chemically characterized)
For R&D, can screen a large number of fermentation process attributes
For manufacturing, can monitor critical quality attributes
NIR spectroscopy applied to fermentation

© ABB Group September 27, 2010 | Slide 28
FT-NIR spectra: in-line monitoring of Saccharomyces Cerevisiae yeast growth on malt extract (ethanol production)
NIR spectroscopy applied to fermentation

© ABB Group September 27, 2010 | Slide 29
NIR for fermentation – Technical aspectsProbe optimisation
Transflectance probesCan accommodate clear (transmission) and optically dense (reflectance) media Useful for exploratory R&D work from lag phase to exponential and stationary phases (alternative: multiplex measurement)Adjustable pathlength useful for method development but issues in manufacturing (cleaning, reproducibility and stray light issues)
Transmission probesUseful for most fermentation processes except filamentous fermentations (e.g. antibiotic production)Require aseptic design
Reflectance probesUseful for some filamentous fermentationsNon-contact versions available
Important constraints related to sterility regardless of probe typeSurface finish of wetted partsSpecial fiber and connector design if autoclaving requiredSpecial window design if CIP/SIP required (temperature gradient)

© ABB Group September 27, 2010 | Slide 30
Monitoring of the fermentation or cell culture process
Determination of fermentation analytes concentration (nutrients, metabolites, by-products)
Example: monitoring of total sugars and ethanol from FT-NIR spectra during very-high-gravity corn mash fermentation (NCSU-BTEC)
NIR spectroscopy applied to fermentation processes

© ABB Group September 27, 2010 | Slide 31
Monitoring of the fermentation process
Cell density and biomass content
Example: determination of biomass growth by correlation of FT-NIR spectra with cell density during very-high-gravity corn mash fermentation (NCSU-BTEC)
NIR spectroscopy applied to fermentation processes

© ABB Group September 27, 2010 | Slide 32
Monitoring of downstream purification process
Example: Monitor the elution process and fraction collection to reduce loss of API through ionic exchange column (9 cycles, alternative to assay that takes 10 minutes)3
NIR spectroscopy applied to downstream processes
Eluted samples
© ABB Group September 27, 2010 | Slide 33
Data Management xPAT

© ABB Group September 27, 2010 | Slide 34
What are the Data Handling Challenges ? Managing Analyzers
Analyzer integration for solutions such as the Process Analytical Technology (PAT) Initiative presents a unique set of integrationchallenges for data exchange and control.
There is a large variety of analyzers types, from various vendors with many different types of data, including complex arrays and structures.
There are many different ways to integrate analyzers and execute control from external systems.
New process optimization opportunities exist that require unit and system level coordination and control of multiple analyzers from different vendors.
Open Standards are required to streamline integration and remove requirement for purpose-built integration.
Standard interfaces drive down the validation costs for project implementation in the pharmaceutical industry.

© ABB Group September 27, 2010 | Slide 35
What are the Data Handling Challenges ?Analyzers produce multiple disparate formats e.g. Spectra, Bar Graphs, Chromatographs, Images etc.
An analyzer model can be used to predict many different properties.
Not all analyzer measurements are in real time.
In order to interpret data from multiple analyzers the measurements need to be correlated.
Sensor data needs to be correlated
Process Data required
Data collected needs to be made available to various offline platforms e.g. modelling packages, LIMS, EBRS etc

© ABB Group September 27, 2010 | Slide 36
Integration at Integration at Process Controller is Process Controller is expensive and expensive and proprietaryproprietary
Limited data types Limited data types from analyzer from analyzer controller to process controller to process controller in noncontroller in non--standard formatstandard formatHot Air
Granules
Filters
FBRM Analyzer
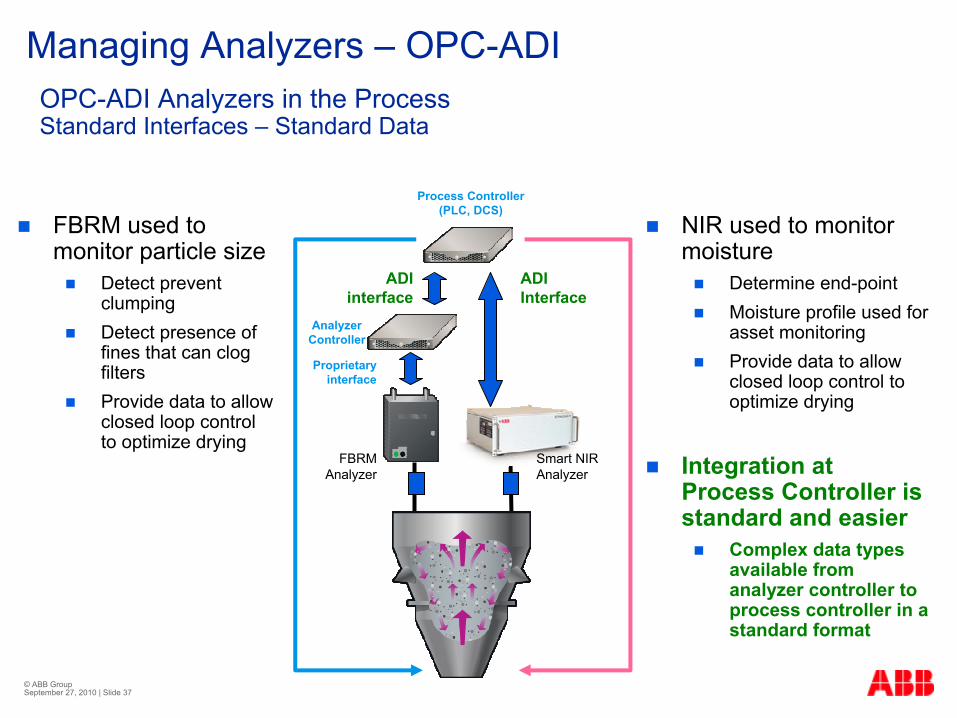
NIR used to monitor moisture
Determine end-pointMoisture profile used for asset monitoringProvide data to allow closed loop control to optimize drying
FBRM used to monitor particle size
Detect prevent clumpingDetect presence of fines that can clog filtersProvide data to allow closed loop control to optimize drying
Proprietary interface
Proprietary Interface
Current Analyzers in the ProcessProprietary Interfaces – Non Standard Data
NIR Analyzer
AnalyzerController
AnalyzerController
Process Controller(PLC, DCS)
ProprietaryProprietaryinterfaceinterface
ProprietaryProprietaryInterfaceInterface
© ABB Group September 27, 2010 | Slide 37
Integration at Process Controller is standard and easier
Complex data types available from analyzer controller to process controller in a standard format
Hot Air
Granules
Filters
FBRM Analyzer
NIR used to monitor moisture
Determine end-pointMoisture profile used for asset monitoringProvide data to allow closed loop control to optimize drying
FBRM used to monitor particle size
Detect prevent clumpingDetect presence of fines that can clog filtersProvide data to allow closed loop control to optimize drying
Proprietary interface
OPC-ADI Analyzers in the ProcessStandard Interfaces – Standard Data
Smart NIRAnalyzer
AnalyzerController
Process Controller(PLC, DCS)
ADI interface
ADI Interface
Managing Analyzers – OPC-ADI

© ABB Group September 27, 2010 | Slide 38
Managing Process and Analytical Data
Granulator Fluid Bed Dryer Tablet Press Coater
NIR : Monitoring end point predication of moisture content for drying phase.
FBRM : Measures particle sizes.
NIR : Monitoring coating thickness
PVM: Particle Size
RAMAN: API Concentration
xPAT System

© ABB Group September 27, 2010 | Slide 39
Managing Process and Analytical Data – Data Access
Data rich Information available and compatible with many chemometric PackagesModelling for continuous manufacturing
BatchManager
SCADAHistorian
SCADAOPC Server
SCADAPLC
SCADA I/O Analogs & Digitals
•Time Based Trends • Alarm & Event
OPC/DA (Analogs & Dig.)
Dryer
NIR Analyzer
VisualizationClients
Analyzer DataAcquisition
PaticleAnalyzer
Particle Size Model Moisture Model
PATData Manager
Combined Particle / Moisture Model
Data By “Batch ID”
ChemometricAnalysisWorkstations
Hot Air
Granules
Filters

© ABB Group September 27, 2010 | Slide 40
Control Network
xPAT Data Manager
BatchManager
SCADAOPC Server
SCADAHistorian
OtherServer Visualization
Clients &Chemometric tools
ABB or 3rd Party Analyzer
xPAT Analyzer Controller
Unit 1
Unit 1
(Wireless link)
PAT and network architectureFrom small …

© ABB Group September 27, 2010 | Slide 41
Router
/ Firewall
Batch
Manager
SCADA
Historian
Other
Server
Batch
Manager
SCADA
OPC Server
SCADA
Historian
Other
Server
Visualization
Client &
Chemometric tools
ABB or 3rd Party Analyzer
xPAT Analyzer Controller
Unit 1ABB or 3rd Party Analyzer
xPAT Analyzer Controller
Unit 6
…………
Visualization
Client &
Chemometric tools
ABB or 3rd Party Analyzer
xPAT Analyzer Controller
Unit 1ABB or 3rd Party Analyzer
xPAT Analyzer Controller
Unit 6
…………SCADA
OPC Server
PAT and network architecture… To large
Corporate Network
Additional
Visualization Clients &
Chemometric tools
xPAT Data
Manager
Control NetworkControl Network
xPAT Data
Manager

© ABB Group September 27, 2010 | Slide 42
BatchManager
SCADAHistorian
SCADAOPC Server
SCADAPLC
SCADA I/O Analogs & Digitals
•Time Based Trends
• Alarm & EventOPC/DA (Analogs & Dig.)
Fermentor
FT-NIR Analyser
Operator workplace
FTSW800
PAT Data Manager
Data Stored by Batch ID or other unique identifierRemote Client SupportData Accessible by Open Interfaces (OPC, ODBC etc)Multi Analyzer Model Support Time based, A&E, Spectral & method data Stored & archivedCentralized analyzer control
Data By “Batch ID”
The ABB PAT Data Manager is used to manage, store and serve up the data derived from and the configurations for all the instrument platforms and link the data with that captured by the SCADA control system.
Chemometricanalysis
workstations
Integration
MM
Process mass spectrometer
Off-gas
Air/O2/CO2
pH, T
Air flow, agitation

© ABB Group September 27, 2010 | Slide 43