Embed Size (px)
Citation preview
www.ifrc.orgSaving lives, changing minds.
Project/programme monitoring and evaluation (M&E) guide
Acknowledgements
This guide was developed by the Planning and Evaluation Department (PED) of the IFRC Secretariat. It would not have been possible without the invaluable review and feedback from National Societies. In particular, we want to express our thanks to the British Red Cross, the Danish Red Cross, the Norwegian Red Cross, the Swedish Red Cross, the Finnish Red Cross, the American Red Cross, the Australian Red Cross, and the Canadian Red Cross. Also, special thanks to Julie Smith for her creative cartoons and M&E sense of humour.
© International Federation of Red Cross and Red Crescent Societies, Geneva, 2011
Copies of all or part of this guide may be made for noncommercial use, providing the source is acknowledged The IFRC would appreciate receiving details of its use. Requests for commercial reproduction should be directed to the IFRC at [email protected]
The designations and maps used do not imply the expression of any opinion on the part of the International Federation or National Societies concerning the legal status of a territory or of its authorities.
All photos used in this guide are copyright of the IFRC unless otherwise indicated. Cover photo, from left to right, clockwise: Benoit Matsha-Carpentier/IFRC, Arzu Ozsoy/IFRC, Alex Wynter/IFRC.
P.O. Box 372CH-1211 Geneva 19SwitzerlandTelephone: +41 22 730 4222Telefax: +41 22 733 0395E-mail: [email protected] site: www.ifrc.org
Project/programme monitoring and evaluation (M&E) guide
1000400 E 3,000 08/2011
Strategy 2020 voices the collective determination of the International Federation of Red Cross and Red Crescent Societies (IFRC) to move forward in tackling the major challenges that confront humanity in the next decade. Informed by the needs and vulnerabilities of the diverse communities with whom we work, as well as the basic rights and freedoms to which all are entitled, this strategy seeks to benefit all who look to Red Cross Red Crescent to help to build a more humane, dignified and peaceful world.
Over the next ten years, the collective focus of the IFRC will be on achieving the following strategic aims:
1. Save lives, protect livelihoods, and strengthen recovery from disasters and crises
2. Enable healthy and safe living 3. Promote social inclusion and a culture
of non-violence and peace
1
Table of ContentsAcknowledgements inside coverAbbreviations and Acronyms 4
Introduction 5
PART 1: M&E concepts and considerations 9
1.1 Results-based management (RBM) 9 1.2 M&E and the project/programme cycle 10 1.3 What is monitoring? 11 1.4 What is evaluation? 13 1.5 Baseline and endline studies 17 1.6 Comparing monitoring, evaluation, reviews and audits 19 1.7 M&E standards and ethics 20 1.8 Attention to gender and vulnerable groups 21 1.9 Minimize bias and error 22
PART 2: Six key steps for project/programme M&E 25
2.1 STEP 1 – Identify the purpose and scope of the M&E system 27 2.1.1 Review the project/programme’s operational design (logframe) 27 2.1.2 Identify key stakeholder informational needs and expectations 29 2.1.3 Identify any M&E requirements 30 2.1.4 Scope of major M&E events and functions 30
2.2 STEP 2 – Plan for data collection and management 32 2.2.1 Develop an M&E plan table 32 2.2.2 Assess the availability of secondary data 33 2.2.3 Determine the balance of quantitative and qualitative data 35 2.2.4 Triangulate data collection sources and methods 36 2.2.5 Determine sampling requirements 36 2.2.6 Prepare for any surveys 38 2.2.7 Prepare specific data collection methods/tools 38 2.2.8 Establish stakeholder complaints and feedback mechanisms 40 2.2.9 Establish project/programme staff/volunteers review mechanisms 42 2.2.10 Plan for data management 43 2.2.11 Use an indicator tracking table (ITT) 45 2.2.12 Use a risk log (table) 47
2.3 STEP 3 – Plan for data analysis 48 2.3.1 Develop a data analysis plan 49 2.3.2 Follow the key data analysis stages 50
2.4 STEP 4 – Plan for information reporting and utilization 57 2.4.1 Anticipate and plan for reporting 58 2.4.2 Plan for information utilization 66
2.5 STEP 5 – Plan for M&E human resources and capacity building 69
2
International Federation of Red Cross and Red Crescent Societies
Project/programme monitoring and evaluation guide
2.5.1 Assess the project/programme’s human resources capacity for M&E 69 2.5.2 Determine the extent of local participation 69 2.5.3 Determine the extent of outside expertise 72 2.5.4 Define the roles and responsibilities for M&E 72 2.5.5 Plan to manage project/programme team’s M&E activities 73 2.5.6 Identify M&E capacity-building requirements and opportunities 73
2.6 STEP 6 – Prepare the M&E budget 74 2.6.1 Itemize M&E budget needs 74 2.6.2 Incorporate M&E costs in the project/programme budget 74 2.6.3 Review any donor budget requirements and contributions 75 2.6.4 Plan for cost contingency 75
ANNEXES 77
Annex 1: Glossary of key terms for M&E 77 Annex 2: M&E resources 83 Annex 3: Factors affecting the quality of M&E information 88 Annex 4: Checklist for the six key M&E steps 90 Annex 5: IFRC’s logframe – definition of terms 92 Annex 6: Example M&E stakeholder assessment table 93 Annex 7: Example M&E activity planning table 95 Annex 8: M&E plan table template and instructions 96 M&E plan example 97 M&E plan purpose and compliance 98 M&E plan instructions 98 Annex 9: Closed-ended questions examples 100 Annex 10: Key data collection methods and tools 101 Annex 11: Project/programme feedback form template 103 Annex 12: Complaints log 104 Annex 13: Staff/volunteer performance management template 105 Annex 14: Individual time resourcing sheet 106 Annex 15: Project/programme team time resourcing sheet 107 Annex 16: Indicator tracking table (ITT) examples and instructions 108 Annex 17: Example risk log 113 Annex 18: Reporting schedule 114 Annex 19: IFRC’s project/programme management report – template and instructions 115 Annex 20: Example tables (logs) for action planning and management response 122 Annex 21: Example M&E job description 123 Annex 22: M&E training schedule 127
List of tables, boxes and diagrams
Table 1: Common types of monitoring 12
Table 2: Summary of major evaluation types 15
Table 3: The IFRC’s framework for evaluation – criteria and standards 17
Table 4: Comparing key features of monitoring/review, evaluation and audit 20
Table 5: Example of indicator tracking table – for one quarter only 46
Table 6: Comparing data analysis terms: findings, conclusions, recommendations and actions 56
3
International Federation of Red Cross and Red Crescent Societies
Project/programme monitoring and evaluation guide
Box 1: Principle Nine of the Conduct for International Red Cross and Red Crescent
Movement and NGOs in Disaster Relief 6
Box 2: Monitoring best practices 13
Box 3: The challenge of measuring impact 18
Box 4: Principle Five of the Code of Conduct for International Red Cross and Red Crescent
Movement and NGOs in Disaster Relief 21
Box 5: M&E in emergency settings 27
Box 6: Types of industry (standard) indicators 28
Box 7: Examples of IFRC’s key stakeholders and informational needs 29
Box 8: Specific evaluation requirements for the IFRC’s secretariat-funded projects/programmes 30
Box 9: Examples of key M&E activities 31
Box 10: Is an M&E plan worth all the time and effort? 33
Box 11: Comparing quantitative versus qualitative data 35
Box 12: Minimizing data collection costs 40
Box 13: The IFRC’s guide for stakeholder feedback 42
Box 14: Formats can reinforce critical analysis and use 44
Box 15: The importance of target setting 47
Box 16: Benefits of involving multiple stakeholders in data analysis 50
Box 17: Data analysis questions to help describe the data 52
Box 18: Using traffic lights to highlight data 55
Box 19: Criteria of good reporting 58
Box 20: Internal versus external reporting 60
Box 21: Example reporting formats 62
Box 22: Report writing tips 63
Box 23: IFRC’s project/programme management report outline (refer to Annex 19 for full template) 64
Box 24: Reporting roadblocks and solutions 65
Box 25: Key categories of information use 66
Box 26: Key mediums of information dissemination 66
Box 27: Principle Seven of the Conduct for International Red Cross and Red Crescent
Movement and NGOs in Disaster Relief 70
Box 28: Considering participatory M&E 71
Box 29: Adhering to human resources codes and standards – People in Aid 73
Box 30: How much money should be allocated for M&E? 75
Diagram 1: Key M&E activities in the project/programme cycle 10
Diagram 2: Monitoring questions and the logframe 11
Diagram 3: Evaluation questions and the logframe 14
Diagram 4: An example of information flows in project/programme reporting 61
Diagram 5: The participatory continuum 70
4
International Federation of Red Cross and Red Crescent Societies
Project/programme monitoring and evaluation guide
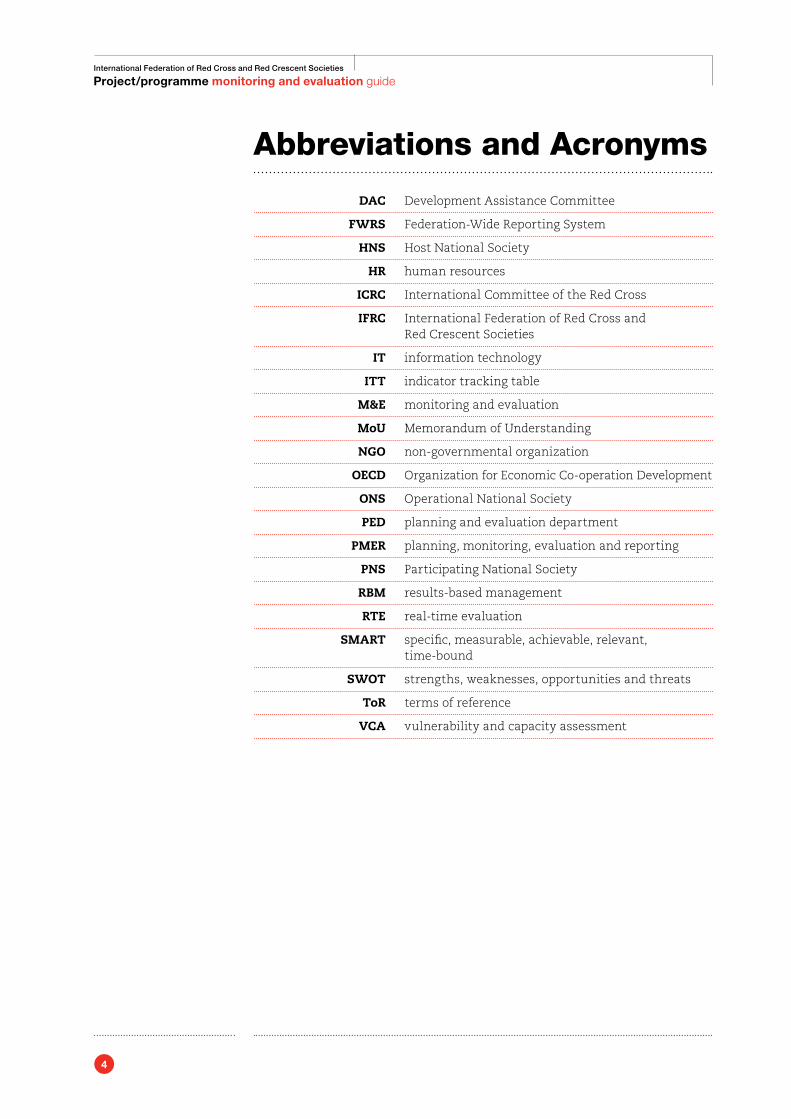
Abbreviations and Acronyms
DAC Development Assistance Committee
FWRS Federation-Wide Reporting System
HNS Host National Society
HR human resources
ICRC International Committee of the Red Cross
IFRC International Federation of Red Cross and Red Crescent Societies
IT information technology
ITT indicator tracking table
M&E monitoring and evaluation
MoU Memorandum of Understanding
NGO non-governmental organization
OECD Organization for Economic Co-operation Development
ONS Operational National Society
PED planning and evaluation department
PMER planning, monitoring, evaluation and reporting
PNS Participating National Society
RBM results-based management
RTE real-time evaluation
SMART specific, measurable, achievable, relevant, time-bound
SWOT strengths, weaknesses, opportunities and threats
ToR terms of reference
VCA vulnerability and capacity assessment
5
International Federation of Red Cross and Red Crescent Societies
Project/programme monitoring and evaluation guide
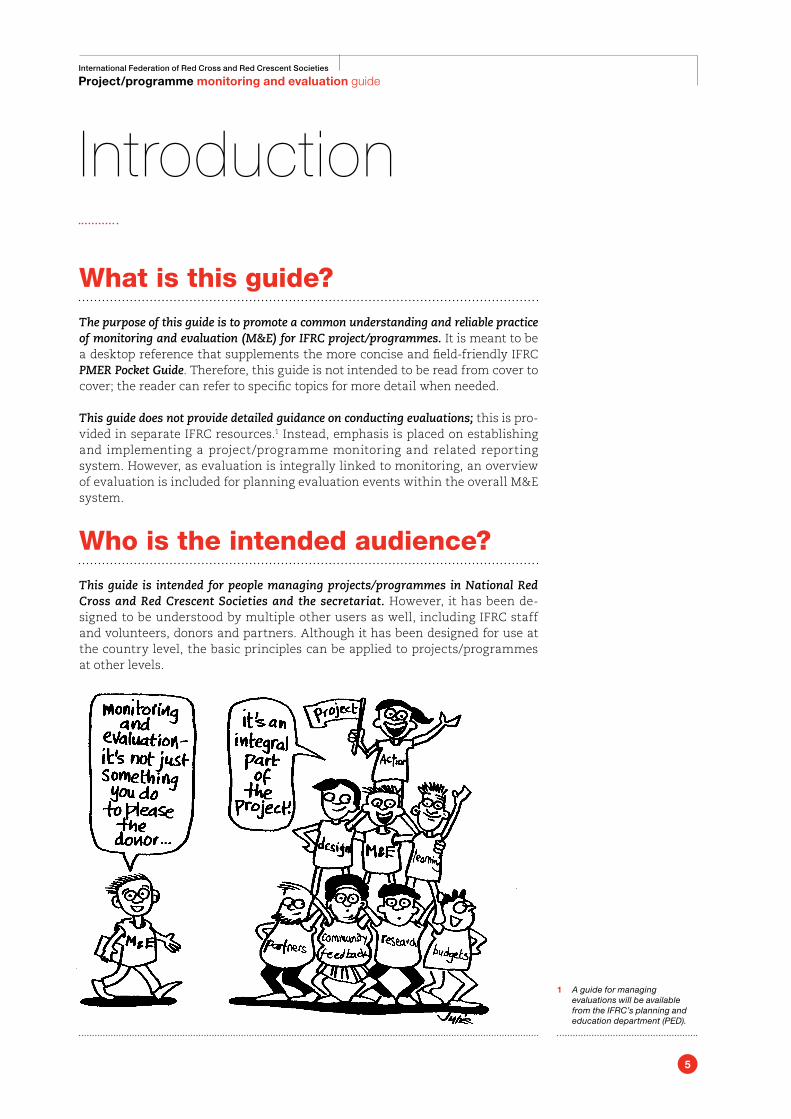
What is this guide?
The purpose of this guide is to promote a common understanding and reliable practice of monitoring and evaluation (M&E) for IFRC project/programmes. It is meant to be a desktop reference that supplements the more concise and field-friendly IFRC PMER Pocket Guide. Therefore, this guide is not intended to be read from cover to cover; the reader can refer to specific topics for more detail when needed.
This guide does not provide detailed guidance on conducting evaluations; this is pro-vided in separate IFRC resources.1 Instead, emphasis is placed on establishing and implementing a project/programme monitoring and related reporting system. However, as evaluation is integrally linked to monitoring, an overview of evaluation is included for planning evaluation events within the overall M&E system.
Who is the intended audience?
This guide is intended for people managing projects/programmes in National Red Cross and Red Crescent Societies and the secretariat. However, it has been de-signed to be understood by multiple other users as well, including IFRC staff and volunteers, donors and partners. Although it has been designed for use at the country level, the basic principles can be applied to projects/programmes at other levels.
Introduction
1 A guide for managing evaluations will be available from the IFRC’s planning and education department (PED).
6
International Federation of Red Cross and Red Crescent Societies
Project/programme monitoring and evaluation guide
Why is M&E important?
A well-functioning M&E system is a critical part of good project/programme management and accountability. Timely and reliable M&E provides informa-tion to:
ÔÔ ÔSupport project/programme implementation with accurate, evidence-based reporting that informs management and decision-making to guide and improve project/programme performance.
Ô Contribute to organizational learning and knowledge sharing by reflecting upon and sharing experiences and lessons so that we can gain the full benefit from what we do and how we do it.
Ô Uphold accountability and compliance by demonstrating whether or not our work has been carried out as agreed and in compliance with established standards (e.g. the Red Cross and Red Crescent Fundamental Principles and Code of Conduct – see Box 1) and with any other donor requirements.2
Ô Provide opportunities for stakeholder feedback, especially beneficiaries, to provide input into and perceptions of our work, modelling openness to criti-cism, and willingness to learn from experiences and to adapt to changing needs.
Ô Promote and celebrate our work by highlighting our accomplishments and achievements, building morale and contributing to resource mobilization.3
Box 1: Principle Nine of the Conduct for International Red Cross and Red Crescent Movement and NGOs in Disaster Relief
We hold ourselves accountable to both those we seek to assist and those from whom we accept resources. We often act as an institutional link in the partnership between those who wish to assist and those who need as-sistance during disasters. We therefore hold ourselves accountable to both constituencies. All our dealings with donors and beneficiaries shall reflect an attitude of openness and transparency. We recognize the need to report on our activities, both from a financial perspective and the perspective of effectiveness. We recognize the obligation to ensure appropriate monitoring of aid distributions and to carry out regular assessments of the impact of disaster assistance. We will also seek to report, in an open fashion, upon the impact of our work, and the factors limiting or enhancing that impact. Our programmes will be based upon high standards of professionalism and expertise in order to minimize the wasting of valuable resources.
What about other IFRC resources?
This guide and its pocket companion, the IFRC PMER Pocket Guide, replace prior versions of IFRC M&E guidance (primarily the Handbook for Monitoring and Evaluation, and the Monitoring and Evaluation in a Nutshell), using updated ter-minology and approaches that are consistent with the newly revised Project/Programme Planning Guidance Manual (IFRC PPP, 2010).
2 IFRC adopts the OECD/DAC definition of accountability, (see the Glossary of Key Terms in Annex 1). In addition to its own Fundamental Principles and Code of Conduct, it also endorses other internationally recognized standards, such as the Sphere Standards to enhance accountability of humanitarian assistance to people affected by disasters, and the Good Enough Guide for impact measurement and accountability in emergencies (both developed by a coalition of leading international humanitarian organizations and are listed in Annex 2, M&E Resources).
3 The use of M&E for resource mobilization should not be perceived as a pure marketing tactic because assessments of our performance and results help demonstrate the returns we get from the investment of resources, lending credibility to our achievements.
Advice for the reader
Refer to the additional resources in Annex 2, which includes both IFRC resources for PMER by project/programme and focus area, as well as other useful resources from the in-ternational community.
7
International Federation of Red Cross and Red Crescent Societies
Project/programme monitoring and evaluation guide
We understand that this guide is not exhaustive of M&E. Within the IFRC, project/programme areas may develop M&E guidance specific to their technicality; in such cases, this guide is meant to complement such resources. Outside the IFRC, there are numerous M&E resources in the international community, and an effort has been made to highlight some of these additional resources throughout this guide.
Diagram 1 of the Key M&E Activities in the Project/Programme Cycle (Section 1.2, page 10) summarizes some of the key planning, monitoring, evaluation, and reporting (PMER) resources in IFRC for the major stages of the project/pro-gramme cycle. Additional resources are listed in Annex 2, M&E Resources.
How to best use this guide?
This guide is divided into three parts: Part 1 focuses conceptually on important major M&E considerations; Part 2 focuses practically on six key steps for pro-ject/programme M&E; and the Annexes present additional tools, resources and examples for project/programme M&E.
Throughout the guide, an effort has been made to highlight important points and resources with boxes, diagrams, tables and bold text. Also note that key resources in the Annexes, such as the M&E plan, indicator tracking table (ITT), and project/programme management report, include instructions so that they can be printed as a “take-away” guide for the respective tool.
All cited resources in this guide are referenced as a footnote on the cited page. Annex 2 provides citations of additional resources outside of this guide.
Hyperlinks have been formatted in brown for key resources that can be ac-cessed online. (When using this guide on a computer connected to the internet, clicking the hyperlinked resource will take you to its location on the internet.)
Feedback and revision
This guide will be periodically reviewed and updated to take account of learning gained from use in the field, and to ensure it continues to conform to the highest international standards. Feedback or questions can be directed to the IFRC planning and evaluation department (PED) at [email protected], or P.O. Box 372, CH-1211 Geneva 19, Switzerland.
Advice for the reader
It may be helpful as you use the key to refer to: the Glossary of key M&E terms in Annex 1, Diagram 1 of the key M&E activities in the project/programme cycle (Section 1.2), and the Checklist for the six key M&E steps (Annex 4).
8
International Federation of Red Cross and Red Crescent Societies
Project/programme monitoring and evaluation guide
IFR
C
9
International Federation of Red Cross and Red Crescent Societies
Project/programme monitoring and evaluation guide
What you will find in Part 1:
1.1 Results-based management (RBM)1.2 M&E and the project/programme cycle1.3 What is monitoring?1.4 What is evaluation?1.5 Baseline and endline studies1.6 Comparing monitoring, evaluation, reviews and audits1.7 M&E standards and ethics1.8 Attention to gender and vulnerable groups1.9 Minimize bias and error
Part 1 provides an overview of key M&E concepts and considerations to in-form planning and implementing effective monitoring and evaluation. This is supplemented by a Glossary of Key Terms in Annex 1.
1.1 Results-based management (RBM)
RBM is an approach to project/programme management based on clearly defined results, and the methodologies and tools to measure and achieve them. RBM sup-ports better performance and greater accountability by applying a clear, logical framework to plan, manage and measure an intervention with a focus on the results you want to achieve. By identifying in advance the intended results of a project/programme and how we can measure their progress, we can better manage a project/programme and determine whether a difference has genu-inely been made for the people concerned.4
Monitoring and evaluation (M&E) is a critical part of RBM. It forms the basis for clear and accurate reporting on the results achieved by an intervention (project or programme). In this way, information reporting is no longer a headache, but becomes an opportunity for critical analysis and organizational learning, in-forming decision-making and impact assessment.
Part 1.
M&E concepts and considerations
4 Results-based management (RBM) is an approach that has been adopted by many international organizations. RBM is explained in more detail in the IFRC Project/Programme Planning Guidance Manual (IFRC PPP, 2010).
10
International Federation of Red Cross and Red Crescent Societies
Project/programme monitoring and evaluation guide
1.2 M&E and the project/programme cycle
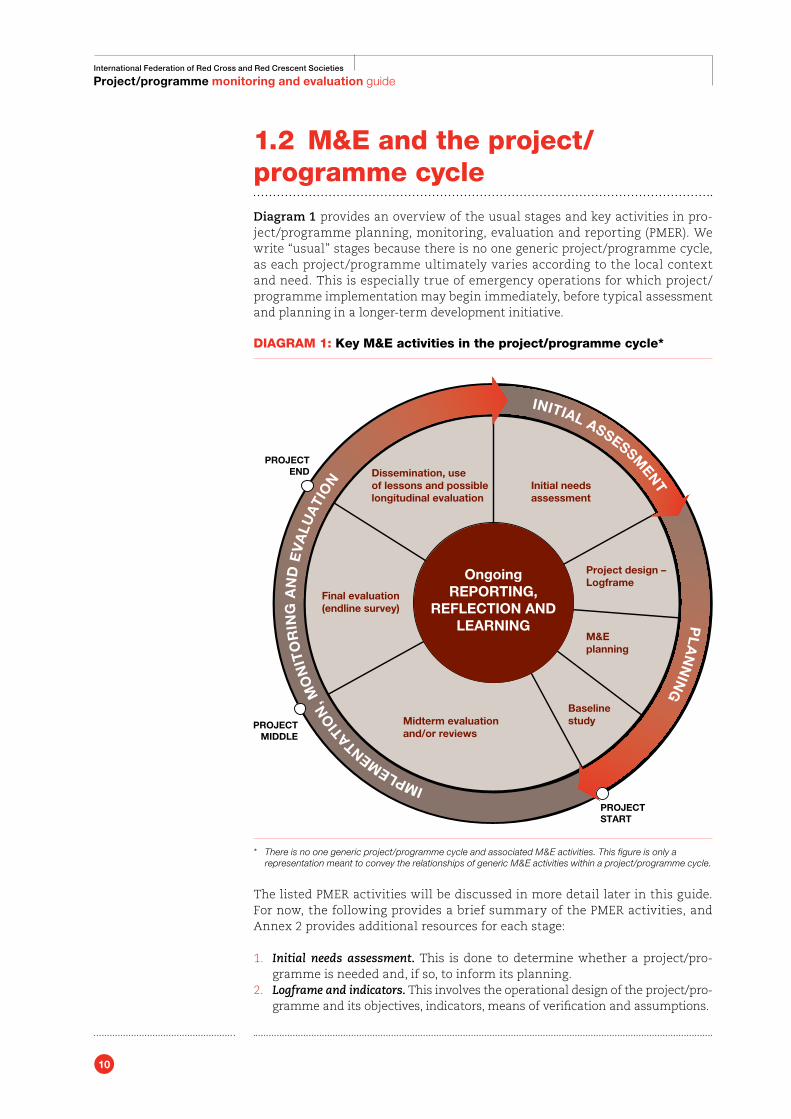
Diagram 1 provides an overview of the usual stages and key activities in pro-ject/programme planning, monitoring, evaluation and reporting (PMER). We write “usual” stages because there is no one generic project/programme cycle, as each project/programme ultimately varies according to the local context and need. This is especially true of emergency operations for which project/programme implementation may begin immediately, before typical assessment and planning in a longer-term development initiative.
DIAGRAM 1: Key M&E activities in the project/programme cycle*
* There is no one generic project/programme cycle and associated M&E activities. This figure is only a representation meant to convey the relationships of generic M&E activities within a project/programme cycle.
The listed PMER activities will be discussed in more detail later in this guide. For now, the following provides a brief summary of the PMER activities, and Annex 2 provides additional resources for each stage:
1. Initial needs assessment. This is done to determine whether a project/pro-gramme is needed and, if so, to inform its planning.
2. Logframe and indicators. This involves the operational design of the project/pro-gramme and its objectives, indicators, means of verification and assumptions.
M&Eplanning
Project design –Logframe
Dissemination, useof lessons and possiblelongitudinal evaluation
Final evaluation(endline survey)
Midterm evaluationand/or reviews
Baselinestudy
Initial needsassessment
OngoingREPORTING,
REFLECTION ANDLEARNING
PROJECTSTART
IMPLEMENTATIO
N, M
ON
ITO
RIN
G A
ND
EV
ALU
ATI
ON
INITIAL ASSESSM
ENT P
LA
NN
ING
PROJECTEND
PROJECT MIDDLE
11
International Federation of Red Cross and Red Crescent Societies
Project/programme monitoring and evaluation guide
3. M&E planning. This is the practical planning for the project/programme to monitor and evaluate the logframe’s objectives and indicators.
4. Baseline study. This is the measurement of the initial conditions (appropriate indicators) before the start of a project/programme.
5. Midterm evaluation and/or reviews. These are important reflection events to assess and inform ongoing project/programme implementation.
6. Final evaluation. This occurs after project/programme completion to assess how well the project/programme achieved its intended objectives and what difference this has made.
7. Dissemination and use of lessons. This informs ongoing programming. How-ever, reporting, reflection and learning should occur throughout the whole project/programme cycle, which is why these have been placed in the centre of the diagram.
1.3 What is monitoring?
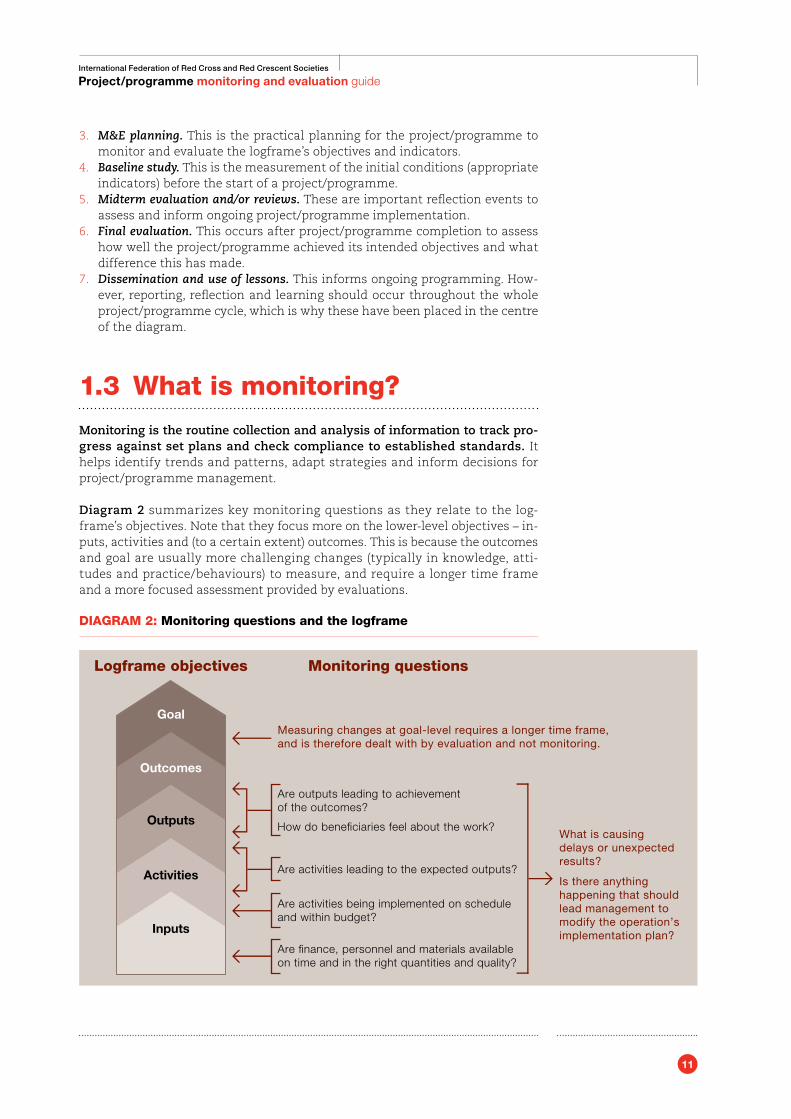
Monitoring is the routine collection and analysis of information to track pro-gress against set plans and check compliance to established standards. It helps identify trends and patterns, adapt strategies and inform decisions for project/programme management.
Diagram 2 summarizes key monitoring questions as they relate to the log-frame’s objectives. Note that they focus more on the lower-level objectives – in-puts, activities and (to a certain extent) outcomes. This is because the outcomes and goal are usually more challenging changes (typically in knowledge, atti-tudes and practice/behaviours) to measure, and require a longer time frame and a more focused assessment provided by evaluations.
DIAGRAM 2: Monitoring questions and the logframe
Are activities being implemented on scheduleand within budget?
Are activities leading to the expected outputs?
Are outputs leading to achievementof the outcomes?
What is causingdelays or unexpectedresults?
Is there anythinghappening that shouldlead management tomodify the operation’simplementation plan?
Are finance, personnel and materials availableon time and in the right quantities and quality?
Measuring changes at goal-level requires a longer time frame,and is therefore dealt with by evaluation and not monitoring.
How do beneficiaries feel about the work?
Logframe objectives Monitoring questions
Outputs
Activities
Inputs
Goal
Outcomes
12
International Federation of Red Cross and Red Crescent Societies
Project/programme monitoring and evaluation guide
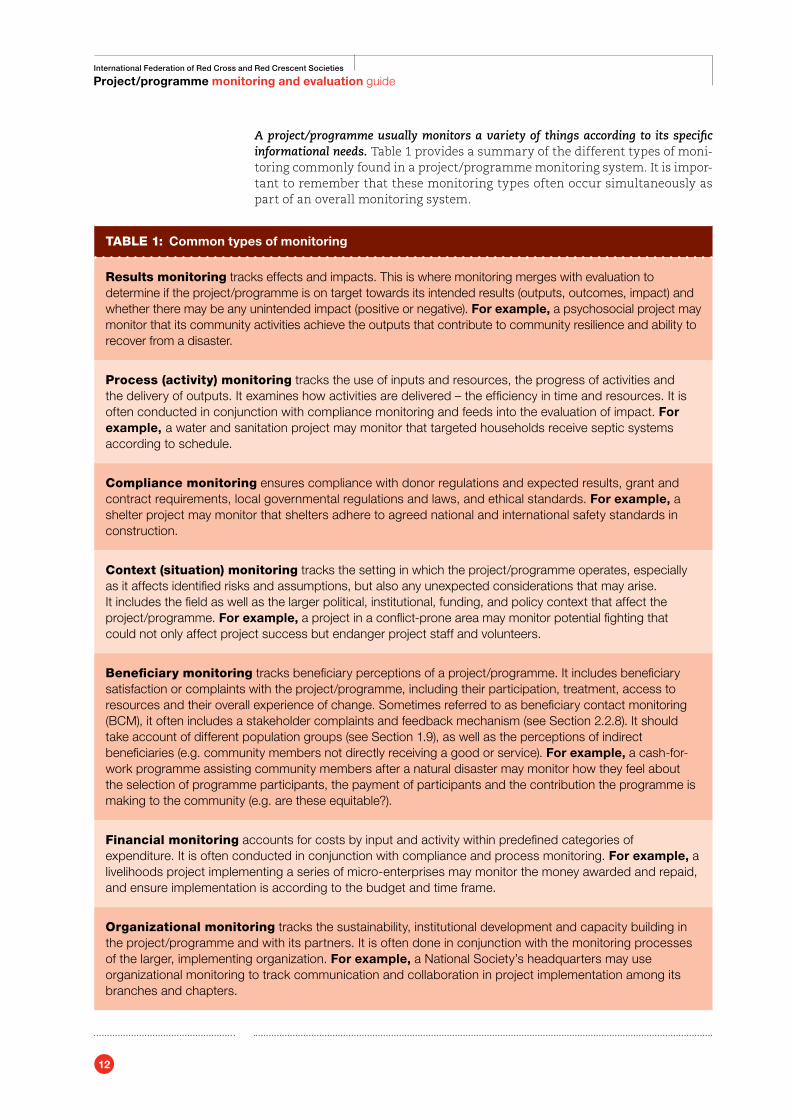
A project/programme usually monitors a variety of things according to its specific informational needs. Table 1 provides a summary of the different types of moni-toring commonly found in a project/programme monitoring system. It is impor-tant to remember that these monitoring types often occur simultaneously as part of an overall monitoring system.
TABLE 1: Common types of monitoring
Results monitoring tracks effects and impacts. This is where monitoring merges with evaluation to determine if the project/programme is on target towards its intended results (outputs, outcomes, impact) and whether there may be any unintended impact (positive or negative). For example, a psychosocial project may monitor that its community activities achieve the outputs that contribute to community resilience and ability to recover from a disaster.
Process (activity) monitoring tracks the use of inputs and resources, the progress of activities and the delivery of outputs. It examines how activities are delivered – the efficiency in time and resources. It is often conducted in conjunction with compliance monitoring and feeds into the evaluation of impact. For example, a water and sanitation project may monitor that targeted households receive septic systems according to schedule.
Compliance monitoring ensures compliance with donor regulations and expected results, grant and contract requirements, local governmental regulations and laws, and ethical standards. For example, a shelter project may monitor that shelters adhere to agreed national and international safety standards in construction.
Context (situation) monitoring tracks the setting in which the project/programme operates, especially as it affects identified risks and assumptions, but also any unexpected considerations that may arise. It includes the field as well as the larger political, institutional, funding, and policy context that affect the project/programme. For example, a project in a conflict-prone area may monitor potential fighting that could not only affect project success but endanger project staff and volunteers.
Beneficiary monitoring tracks beneficiary perceptions of a project/programme. It includes beneficiary satisfaction or complaints with the project/programme, including their participation, treatment, access to resources and their overall experience of change. Sometimes referred to as beneficiary contact monitoring (BCM), it often includes a stakeholder complaints and feedback mechanism (see Section 2.2.8). It should take account of different population groups (see Section 1.9), as well as the perceptions of indirect beneficiaries (e.g. community members not directly receiving a good or service). For example, a cash-for-work programme assisting community members after a natural disaster may monitor how they feel about the selection of programme participants, the payment of participants and the contribution the programme is making to the community (e.g. are these equitable?).
Financial monitoring accounts for costs by input and activity within predefined categories of expenditure. It is often conducted in conjunction with compliance and process monitoring. For example, a livelihoods project implementing a series of micro-enterprises may monitor the money awarded and repaid, and ensure implementation is according to the budget and time frame.
organizational monitoring tracks the sustainability, institutional development and capacity building in the project/programme and with its partners. It is often done in conjunction with the monitoring processes of the larger, implementing organization. For example, a National Society’s headquarters may use organizational monitoring to track communication and collaboration in project implementation among its branches and chapters.
13
International Federation of Red Cross and Red Crescent Societies
Project/programme monitoring and evaluation guide
As we will discuss later in this guide (Part 2), there are various processes and tools to assist with the different types of monitoring, which generally involve obtaining, analysing and reporting on monitoring data. Specific processes and tools may vary according to monitoring need, but there are some overall best practices, which are summarized in Box 2 below.
Box 2: Monitoring best practices
•Monitoring data should be well-focused to specific audiences and uses (only what is necessary and sufficient).
•Monitoring should be systematic, based upon predetermined indicators and assumptions.
•Monitoring should also look for unanticipated changes with the project/programme and its context, including any changes in project/programme assumptions/risks; this information should be used to adjust project/pro-gramme implementation plans.
•Monitoring needs to be timely, so information can be readily used to in-form project/programme implementation.
•Whenever possible, monitoring should be participatory, involving key stakeholders – this can not only reduce costs but can build understanding and ownership.
•Monitoring information is not only for project/programme management but should be shared when possible with beneficiaries, donors and any other relevant stakeholders.
1.4 What is evaluation?
The IFRC’s secretariat adopts the OECD/DAC definition of evaluation as “an assessment, as systematic and objective as possible, of an ongoing or completed project, programme or policy, its design, implementation and results. The aim is to determine the relevance and fulfilment of objectives, developmental ef-ficiency, effectiveness, impact and sustainability. An evaluation should provide information that is credible and useful, enabling the incorporation of lessons learned into the decision-making process of both recipients and donors.”5
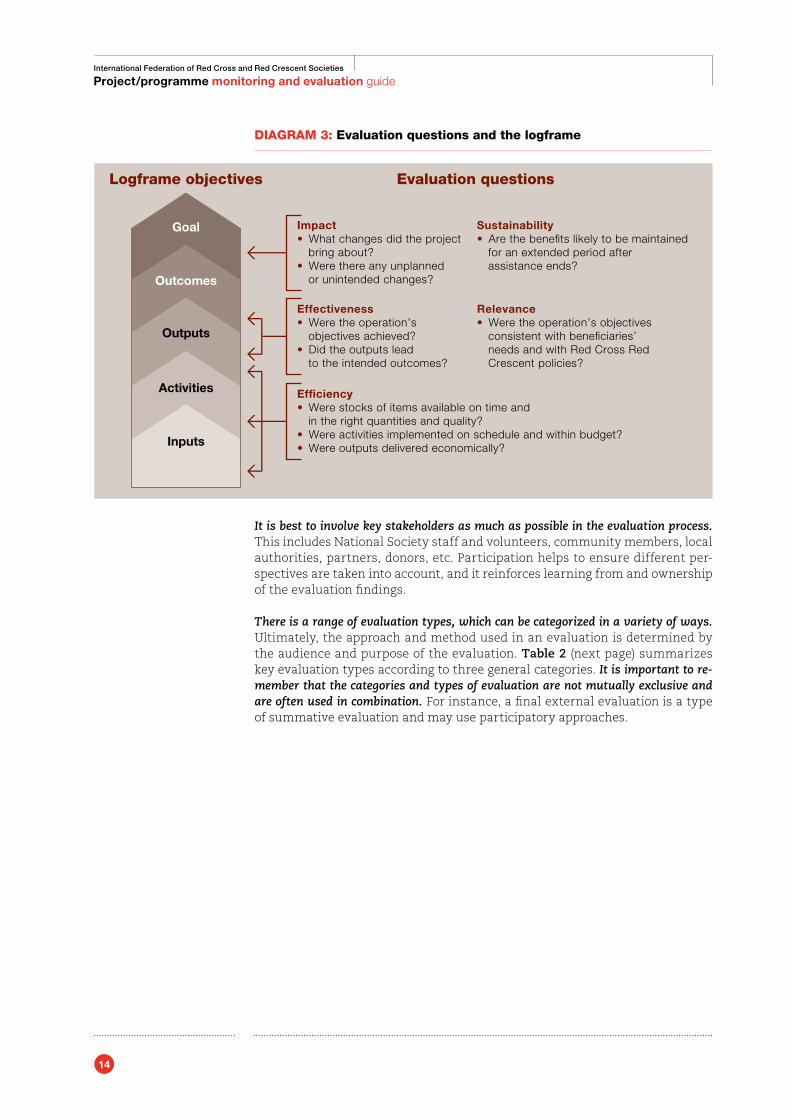
Evaluations involve identifying and reflecting upon the effects of what has been done, and judging their worth. Their findings allow project/programme man-agers, beneficiaries, partners, donors and other project/programme stake-holders to learn from the experience and improve future interventions. Diagram 3 (below) summarizes key evaluation questions as they relate to the logframe’s objectives, which tend to focus more on how things have been per-formed and what difference has been made.
5 The Organization for Economic Co-operation and Development (OECD) is an inter-governmental international organization that brings together the most industrialized countries of the market economy with the objective to coordinate economic and development policies of the member nations. The Development Assistance Committee (DAC) is the principal body through which the OECD deals with issues related to cooperation with developing countries.
14
International Federation of Red Cross and Red Crescent Societies
Project/programme monitoring and evaluation guide
DIAGRAM 3: Evaluation questions and the logframe
It is best to involve key stakeholders as much as possible in the evaluation process. This includes National Society staff and volunteers, community members, local authorities, partners, donors, etc. Participation helps to ensure different per-spectives are taken into account, and it reinforces learning from and ownership of the evaluation findings.
There is a range of evaluation types, which can be categorized in a variety of ways. Ultimately, the approach and method used in an evaluation is determined by the audience and purpose of the evaluation. Table 2 (next page) summarizes key evaluation types according to three general categories. It is important to re-member that the categories and types of evaluation are not mutually exclusive and are often used in combination. For instance, a final external evaluation is a type of summative evaluation and may use participatory approaches.
Logframe objectives Evaluation questions
Effectiveness• Were the operation’s objectives achieved?• Did the outputs lead to the intended outcomes?
Impact• What changes did the project bring about?• Were there any unplanned or unintended changes?
Efficiency• Were stocks of items available on time and in the right quantities and quality?• Were activities implemented on schedule and within budget?• Were outputs delivered economically?
Sustainability• Are the benefits likely to be maintained for an extended period after assistance ends?
Relevance• Were the operation’s objectives consistent with beneficiaries’ needs and with Red Cross Red Crescent policies?
Outputs
Activities
Inputs
Goal
Outcomes
15
International Federation of Red Cross and Red Crescent Societies
Project/programme monitoring and evaluation guide
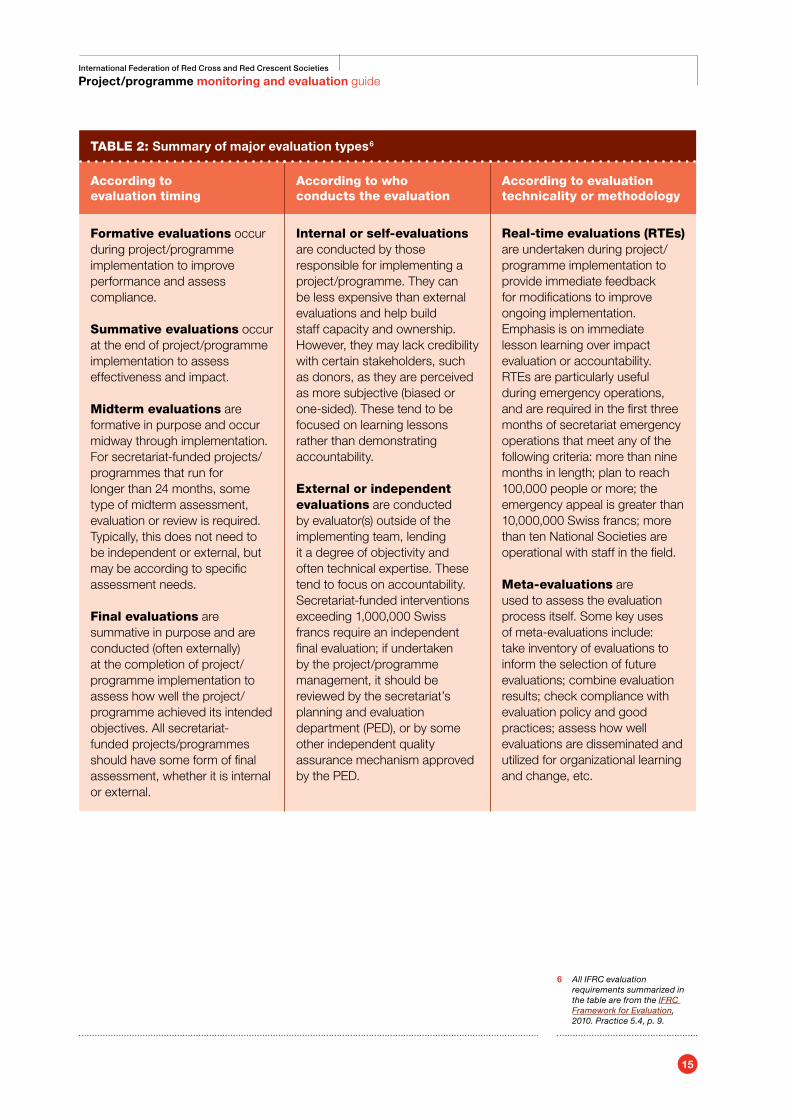
TABLE 2: Summary of major evaluation types 6
According to evaluation timing
According to who conducts the evaluation
According to evaluation technicality or methodology
Formative evaluations occur during project/programme implementation to improve performance and assess compliance.
Summative evaluations occur at the end of project/programme implementation to assess effectiveness and impact.
Midterm evaluations are formative in purpose and occur midway through implementation. For secretariat-funded projects/programmes that run for longer than 24 months, some type of midterm assessment, evaluation or review is required. Typically, this does not need to be independent or external, but may be according to specific assessment needs.
Final evaluations are summative in purpose and are conducted (often externally) at the completion of project/programme implementation to assess how well the project/programme achieved its intended objectives. All secretariat-funded projects/programmes should have some form of final assessment, whether it is internal or external.
Internal or self-evaluations are conducted by those responsible for implementing a project/programme. They can be less expensive than external evaluations and help build staff capacity and ownership. However, they may lack credibility with certain stakeholders, such as donors, as they are perceived as more subjective (biased or one-sided). These tend to be focused on learning lessons rather than demonstrating accountability.
External or independent evaluations are conducted by evaluator(s) outside of the implementing team, lending it a degree of objectivity and often technical expertise. These tend to focus on accountability. Secretariat-funded interventions exceeding 1,000,000 Swiss francs require an independent final evaluation; if undertaken by the project/programme management, it should be reviewed by the secretariat’s planning and evaluation department (PED), or by some other independent quality assurance mechanism approved by the PED.
Real-time evaluations (RTEs) are undertaken during project/programme implementation to provide immediate feedback for modifications to improve ongoing implementation. Emphasis is on immediate lesson learning over impact evaluation or accountability. RTEs are particularly useful during emergency operations, and are required in the first three months of secretariat emergency operations that meet any of the following criteria: more than nine months in length; plan to reach 100,000 people or more; the emergency appeal is greater than 10,000,000 Swiss francs; more than ten National Societies are operational with staff in the field.
Meta-evaluations are used to assess the evaluation process itself. Some key uses of meta-evaluations include: take inventory of evaluations to inform the selection of future evaluations; combine evaluation results; check compliance with evaluation policy and good practices; assess how well evaluations are disseminated and utilized for organizational learning and change, etc.
6 All IFRC evaluation requirements summarized in the table are from the IFRC Framework for Evaluation, 2010. Practice 5.4, p. 9.
16
International Federation of Red Cross and Red Crescent Societies
Project/programme monitoring and evaluation guide
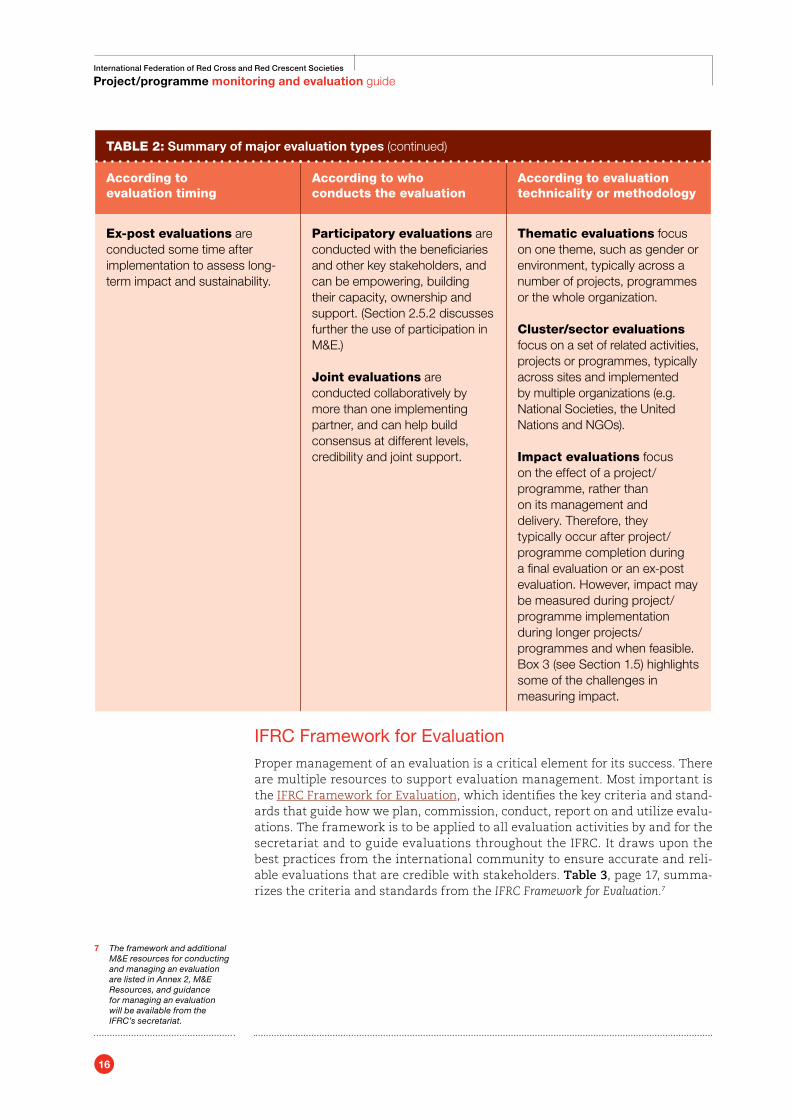
TABLE 2: Summary of major evaluation types (continued)
According to evaluation timing
According to who conducts the evaluation
According to evaluation technicality or methodology
Ex-post evaluations are conducted some time after implementation to assess long-term impact and sustainability.
Participatory evaluations are conducted with the beneficiaries and other key stakeholders, and can be empowering, building their capacity, ownership and support. (Section 2.5.2 discusses further the use of participation in M&E.)
Joint evaluations are conducted collaboratively by more than one implementing partner, and can help build consensus at different levels, credibility and joint support.
Thematic evaluations focus on one theme, such as gender or environment, typically across a number of projects, programmes or the whole organization.
Cluster/sector evaluations focus on a set of related activities, projects or programmes, typically across sites and implemented by multiple organizations (e.g. National Societies, the United Nations and NGOs).
Impact evaluations focus on the effect of a project/programme, rather than on its management and delivery. Therefore, they typically occur after project/programme completion during a final evaluation or an ex-post evaluation. However, impact may be measured during project/programme implementation during longer projects/programmes and when feasible. Box 3 (see Section 1.5) highlights some of the challenges in measuring impact.
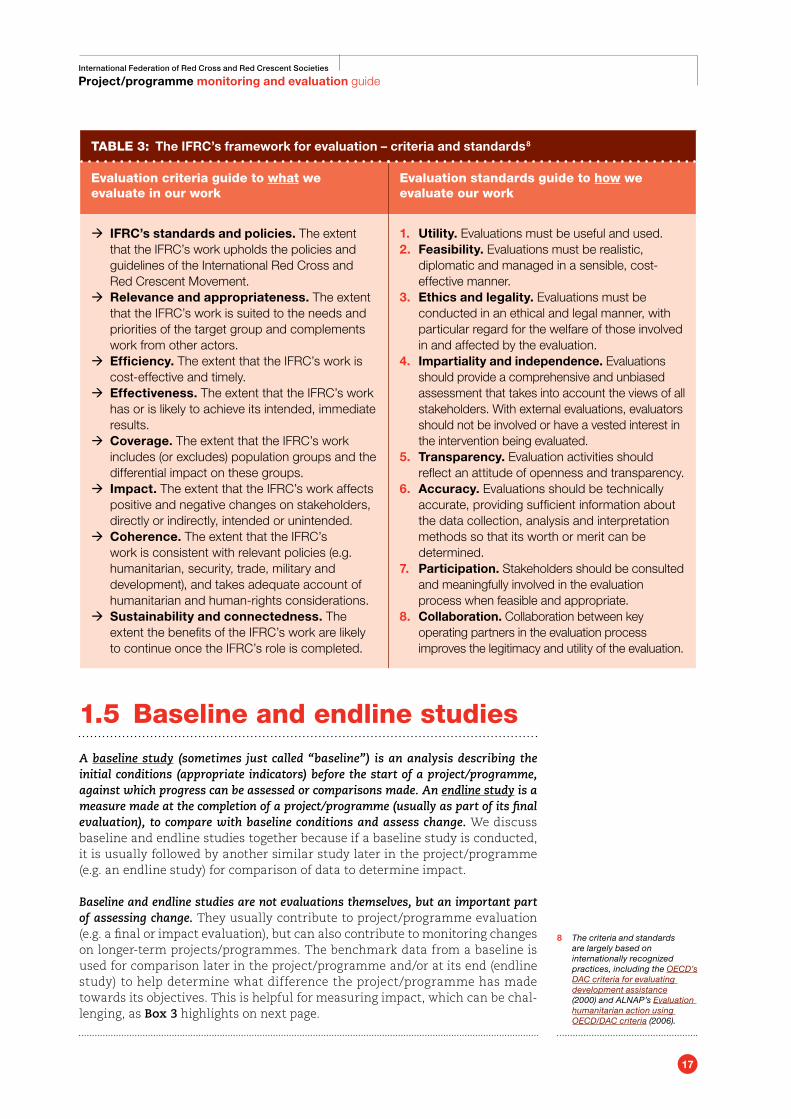
IFRC Framework for EvaluationProper management of an evaluation is a critical element for its success. There are multiple resources to support evaluation management. Most important is the IFRC Framework for Evaluation, which identifies the key criteria and stand-ards that guide how we plan, commission, conduct, report on and utilize evalu-ations. The framework is to be applied to all evaluation activities by and for the secretariat and to guide evaluations throughout the IFRC. It draws upon the best practices from the international community to ensure accurate and reli-able evaluations that are credible with stakeholders. Table 3, page 17, summa-rizes the criteria and standards from the IFRC Framework for Evaluation.67
7 The framework and additional
M&E resources for conducting and managing an evaluation are listed in Annex 2, M&E Resources, and guidance for managing an evaluation will be available from the IFRC’s secretariat.
17
International Federation of Red Cross and Red Crescent Societies
Project/programme monitoring and evaluation guide
TABLE 3: The IFRC’s framework for evaluation – criteria and standards 8
Evaluation criteria guide to what we evaluate in our work
Evaluation standards guide to how we evaluate our work
Æ IFRC’s standards and policies. The extent that the IFRC’s work upholds the policies and guidelines of the International Red Cross and Red Crescent Movement.
Æ Relevance and appropriateness. The extent that the IFRC’s work is suited to the needs and priorities of the target group and complements work from other actors.
Æ Efficiency. The extent that the IFRC’s work is cost-effective and timely.
Æ Effectiveness. The extent that the IFRC’s work has or is likely to achieve its intended, immediate results.
Æ Coverage. The extent that the IFRC’s work includes (or excludes) population groups and the differential impact on these groups.
Æ Impact. The extent that the IFRC’s work affects positive and negative changes on stakeholders, directly or indirectly, intended or unintended.
Æ Coherence. The extent that the IFRC’s work is consistent with relevant policies (e.g. humanitarian, security, trade, military and development), and takes adequate account of humanitarian and human-rights considerations.
Æ Sustainability and connectedness. The extent the benefits of the IFRC’s work are likely to continue once the IFRC’s role is completed.
1. Utility. Evaluations must be useful and used. 2. Feasibility. Evaluations must be realistic,
diplomatic and managed in a sensible, cost-effective manner.
3. Ethics and legality. Evaluations must be conducted in an ethical and legal manner, with particular regard for the welfare of those involved in and affected by the evaluation.
4. Impartiality and independence. Evaluations should provide a comprehensive and unbiased assessment that takes into account the views of all stakeholders. With external evaluations, evaluators should not be involved or have a vested interest in the intervention being evaluated.
5. Transparency. Evaluation activities should reflect an attitude of openness and transparency.
6. Accuracy. Evaluations should be technically accurate, providing sufficient information about the data collection, analysis and interpretation methods so that its worth or merit can be determined.
7. Participation. Stakeholders should be consulted and meaningfully involved in the evaluation process when feasible and appropriate.
8. Collaboration. Collaboration between key operating partners in the evaluation process improves the legitimacy and utility of the evaluation.
1.5 Baseline and endline studies
A baseline study (sometimes just called “baseline”) is an analysis describing the initial conditions (appropriate indicators) before the start of a project/programme, against which progress can be assessed or comparisons made. An endline study is a measure made at the completion of a project/programme (usually as part of its final evaluation), to compare with baseline conditions and assess change. We discuss baseline and endline studies together because if a baseline study is conducted, it is usually followed by another similar study later in the project/programme (e.g. an endline study) for comparison of data to determine impact.
Baseline and endline studies are not evaluations themselves, but an important part of assessing change. They usually contribute to project/programme evaluation (e.g. a final or impact evaluation), but can also contribute to monitoring changes on longer-term projects/programmes. The benchmark data from a baseline is used for comparison later in the project/programme and/or at its end (endline study) to help determine what difference the project/programme has made towards its objectives. This is helpful for measuring impact, which can be chal-lenging, as Box 3 highlights on next page.
8 The criteria and standards are largely based on internationally recognized practices, including the OECD’s DAC criteria for evaluating development assistance (2000) and ALNAP’s Evaluation humanitarian action using OECD/DAC criteria (2006).
18
International Federation of Red Cross and Red Crescent Societies
Project/programme monitoring and evaluation guide
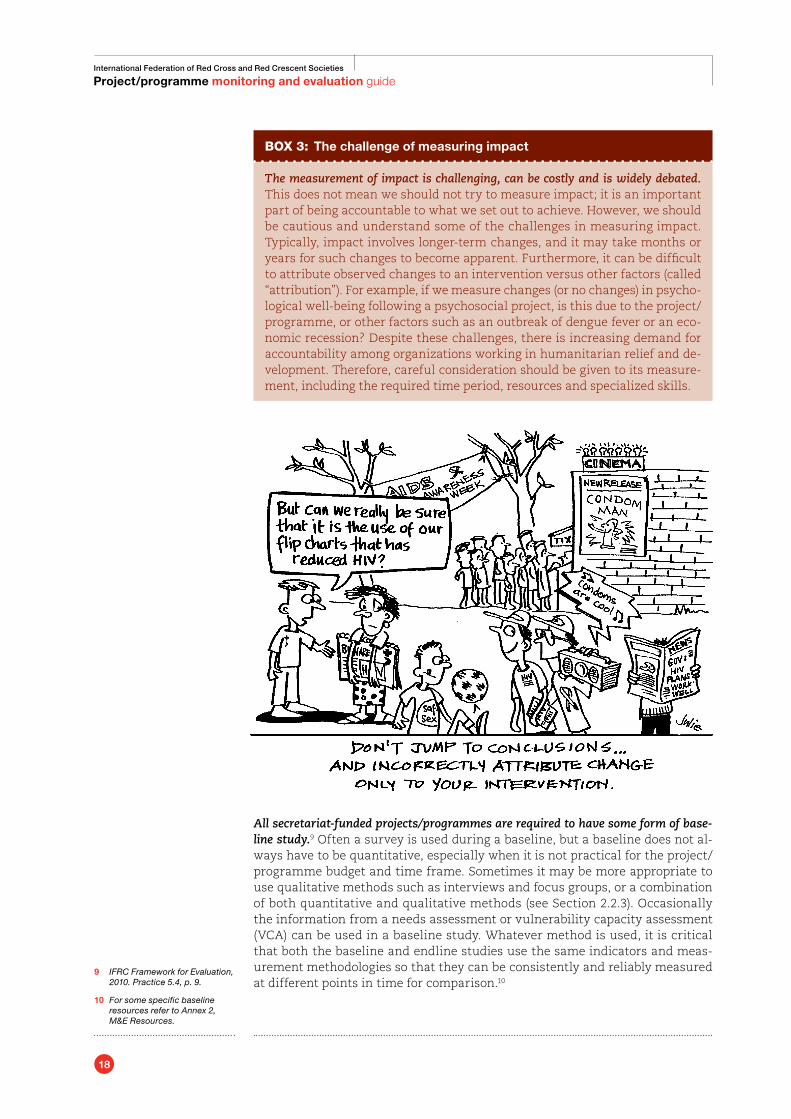
Box 3: The challenge of measuring impact
The measurement of impact is challenging, can be costly and is widely debated. This does not mean we should not try to measure impact; it is an important part of being accountable to what we set out to achieve. However, we should be cautious and understand some of the challenges in measuring impact. Typically, impact involves longer-term changes, and it may take months or years for such changes to become apparent. Furthermore, it can be difficult to attribute observed changes to an intervention versus other factors (called “attribution”). For example, if we measure changes (or no changes) in psycho-logical well-being following a psychosocial project, is this due to the project/programme, or other factors such as an outbreak of dengue fever or an eco-nomic recession? Despite these challenges, there is increasing demand for accountability among organizations working in humanitarian relief and de-velopment. Therefore, careful consideration should be given to its measure-ment, including the required time period, resources and specialized skills.
All secretariat-funded projects/programmes are required to have some form of base-line study.9 Often a survey is used during a baseline, but a baseline does not al-ways have to be quantitative, especially when it is not practical for the project/programme budget and time frame. Sometimes it may be more appropriate to use qualitative methods such as interviews and focus groups, or a combination of both quantitative and qualitative methods (see Section 2.2.3). Occasionally the information from a needs assessment or vulnerability capacity assessment (VCA) can be used in a baseline study. Whatever method is used, it is critical that both the baseline and endline studies use the same indicators and meas-urement methodologies so that they can be consistently and reliably measured at different points in time for comparison.10
9 IFRC Framework for Evaluation, 2010. Practice 5.4, p. 9.
10 For some specific baseline resources refer to Annex 2, M&E Resources.
19
International Federation of Red Cross and Red Crescent Societies
Project/programme monitoring and evaluation guide
1.6 Comparing monitoring, evaluation, reviews and audits
The main difference between monitoring and evaluation is their timing and focus of assessment. Monitoring is ongoing and tends to focus on what is happening. On the other hand, evaluations are conducted at specific points in time to assess how well it happened and what difference it made. Monitoring data is typically used by managers for ongoing project/programme implementation, tracking outputs, budgets, compliance with procedures, etc. Evaluations may also in-form implementation (e.g. a midterm evaluation), but they are less frequent and examine larger changes (outcomes) that require more methodological rigour in analysis, such as the impact and relevance of an intervention.
Recognizing their differences, it is also important to remember that both monitoring and evaluation are integrally linked; monitoring typically provides data for evalu-ation, and elements of evaluation (assessment) occur when monitoring. For ex-ample, monitoring may tell us that 200 community facilitators were trained (what happened), but it may also include post-training tests (assessments) on how well they were trained. Evaluation may use this monitoring information to assess any difference the training made towards the overall objective or change the training was trying to produce, e.g. increase condom use, and whether this was relevant in the reduction of HIV transmission.
A review is a structured opportunity for reflection to identify key issues and con-cerns, and make informed decisions for effective project/programme implementa-tion. While monitoring is ongoing, reviews are less frequent but not as involved as evaluations. Also, IFRC typically uses reviews as an internal exercise, based on monitoring data and reports. They are useful to share information and col-lectively involve stakeholders in decision-making. They may be conducted at different levels within the project/programme structure (e.g. at the community level and at headquarters) and at different times and frequencies. Reviews can also be conducted across projects or sectors. It is best to plan and structure regular reviews throughout the project/programme implementation.
An audit is an assessment to verify compliance with established rules, regulations, procedures or mandates. Audits can be distinguished from an evaluation in that emphasis is on assurance and compliance with requirements, rather than a judgement of worth. Financial audits provide assurance on financial records and practices, whereas performance audits focus on the three E’s – efficiency, economy and effectiveness of project/programme activities. Audits can be in-ternal or external.
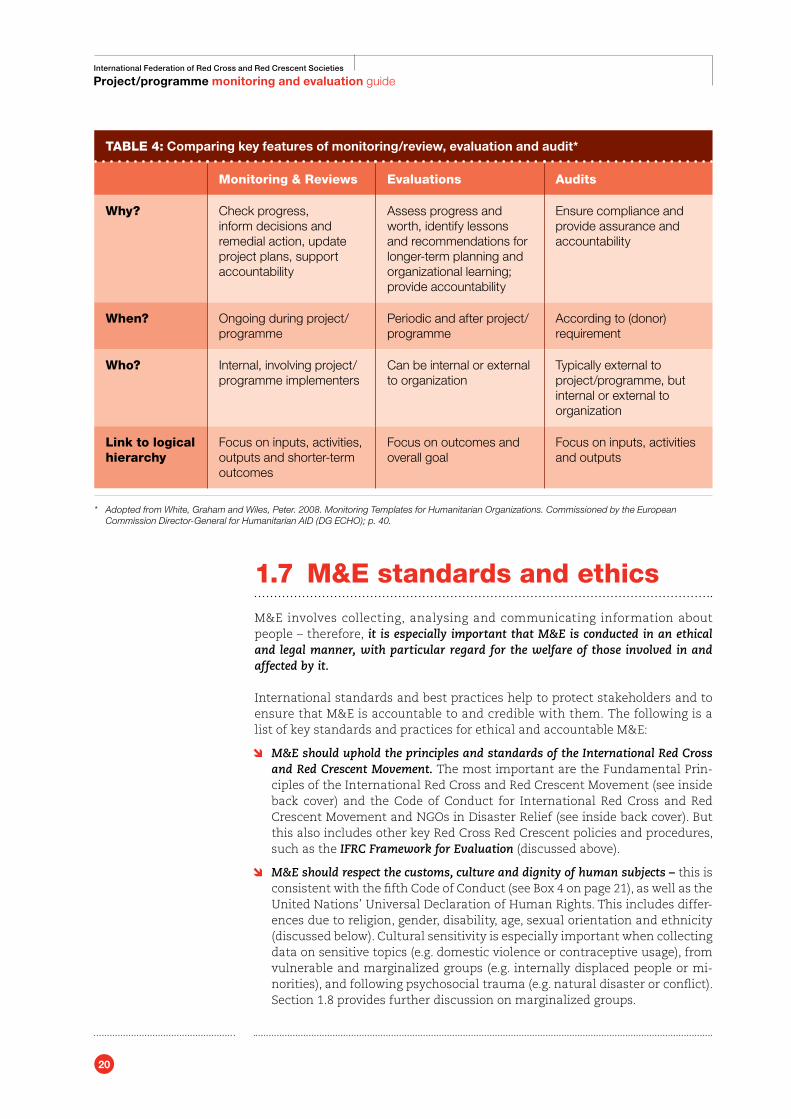
Table 4 (next page) summarizes the key differences between monitoring, eval-uation and audits.
20
International Federation of Red Cross and Red Crescent Societies
Project/programme monitoring and evaluation guide
TABLE 4: Comparing key features of monitoring/review, evaluation and audit*
Monitoring & Reviews Evaluations Audits
Why? Check progress, inform decisions and remedial action, update project plans, support accountability
Assess progress and worth, identify lessons and recommendations for longer-term planning and organizational learning; provide accountability
Ensure compliance and provide assurance and accountability
When? Ongoing during project/programme
Periodic and after project/programme
According to (donor) requirement
Who? Internal, involving project/programme implementers
Can be internal or external to organization
Typically external to project/programme, but internal or external to organization
Link to logical hierarchy
Focus on inputs, activities, outputs and shorter-term outcomes
Focus on outcomes and overall goal
Focus on inputs, activities and outputs
* Adopted from White, Graham and Wiles, Peter. 2008. Monitoring Templates for Humanitarian Organizations. Commissioned by the European Commission Director-General for Humanitarian AID (DG ECHO); p. 40.
1.7 M&E standards and ethics
M&E involves collecting, analysing and communicating information about people – therefore, it is especially important that M&E is conducted in an ethical and legal manner, with particular regard for the welfare of those involved in and affected by it.
International standards and best practices help to protect stakeholders and to ensure that M&E is accountable to and credible with them. The following is a list of key standards and practices for ethical and accountable M&E:
Ô M&E should uphold the principles and standards of the International Red Cross and Red Crescent Movement. The most important are the Fundamental Prin-ciples of the International Red Cross and Red Crescent Movement (see inside back cover) and the Code of Conduct for International Red Cross and Red Crescent Movement and NGOs in Disaster Relief (see inside back cover). But this also includes other key Red Cross Red Crescent policies and procedures, such as the IFRC Framework for Evaluation (discussed above).
Ô M&E should respect the customs, culture and dignity of human subjects – this is consistent with the fifth Code of Conduct (see Box 4 on page 21), as well as the United Nations’ Universal Declaration of Human Rights. This includes differ-ences due to religion, gender, disability, age, sexual orientation and ethnicity (discussed below). Cultural sensitivity is especially important when collecting data on sensitive topics (e.g. domestic violence or contraceptive usage), from vulnerable and marginalized groups (e.g. internally displaced people or mi-norities), and following psychosocial trauma (e.g. natural disaster or conflict). Section 1.8 provides further discussion on marginalized groups.
21
International Federation of Red Cross and Red Crescent Societies
Project/programme monitoring and evaluation guide
Box 4: Principle Five of the Code of Conduct for International Red Cross and Red Crescent Movement and NGOs in Disaster Relief
We shall respect culture and custom. We will endeavour to respect the culture, structures and customs of the communities and countries we are working in.
Ô M&E practices should uphold the principle of “do no harm”. Data collectors and those disseminating M&E reports should be respectful that certain information can endanger or embarrass respondents. “Under this circumstance, evaluators should seek to maximize the benefits and reduce any unnecessary harm that might occur, provided this will not compromise the integrity of the evaluation findings” (American Evaluation Association 2004). Participants in data collec-tion have the legal and ethical responsibility to report any evidence of criminal activity or wrongdoing that may harm others (e.g. alleged sexual abuse).
Ô When feasible and appropriate, M&E should be participatory. Local involve-ment supports the sixth and seventh Principles of Conduct to find ways to involve beneficiaries and build local capacities. Stakeholder consultation and involvement in M&E increases the legitimacy and utility of M&E information, as well as overall cooperation and support for and ownership of the process. (Section 2.5.2 in Part 2 discusses participation in the M&E system.)
Ô An M&E system should ensure that stakeholders can provide comment and voice any complaints about the IFRC’s work. This also includes a process for review-ing and responding concerns/grievances. (Section 2.2.8 in Part 2 discusses building stakeholder complaints and feedback mechanisms into the overall M&E system.)
1.8 Attention to gender and vulnerable groups
Data collection, analysis and reporting should strive for a balanced repre-sentation of any potentially vulnerable or marginalized groups. This includes attention to differences and inequalities in society related to gender, race, age, sexual orientation, physical or intellectual ability, religion or socioeconomic status. This is especially important for Red Cross Red Crescent services, which are provided on the basis of need alone.11 Therefore, it is important to collect and analyse data so that it can be disaggregated by sex, age and any other social distinctions that inform programme decision-making and implementation.
Particular attention should be given to a gender-balanced representation. The example of health care, an important programme area for IFRC illustrates this. Gender refers to economic, social, political and cultural differences (including opportunities) with being male or female. Due to social (gender) and biological (sex) differences, women and men can have different health behaviours and risks, as well as different experiences from health services. In most societies, women have less access to and control over health resources and service for themselves and their children. Gender norms can also affect men by assigning them roles that encourage risk-taking behaviour and neglect of their and their family’s health. Furthermore, gender interacts with other social differences, such as race, age and class.
11 Principle 2 of the Code of Conduct for International Red Cross and Red Crescent Movement and NGOs in Disaster Relief.
22
International Federation of Red Cross and Red Crescent Societies
Project/programme monitoring and evaluation guide
Gender inequalities especially affect sexually transmitted infections among women and men. A gender-sensitive approach in health care recognizes both sex and gender differences and seeks to provide equal access to treatment and services for both women and men. Therefore, data collection and analysis should focus on how differences between women and men may affect equal ac-cess to health services. This can involve attention during data collection to ac-cess to health services among women versus men; such disaggregation of data by sex (and age) is a good starting point for such analysis (Global Fund 2009).
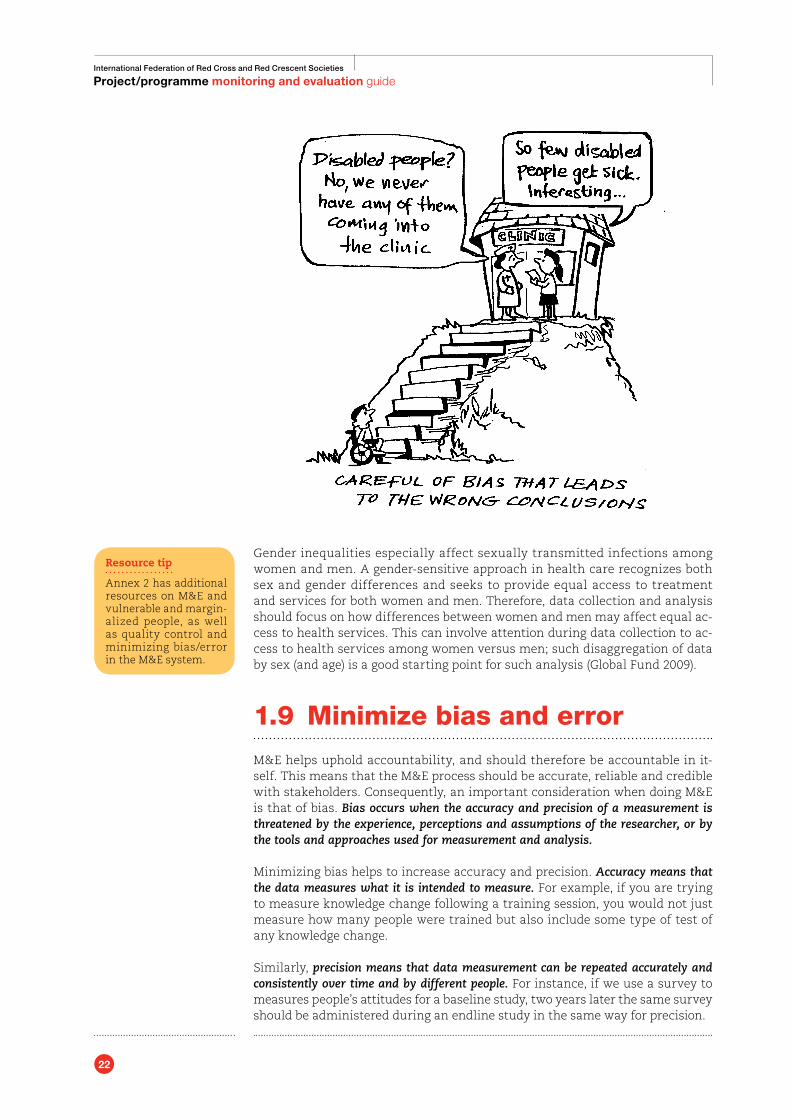
1.9 Minimize bias and error
M&E helps uphold accountability, and should therefore be accountable in it-self. This means that the M&E process should be accurate, reliable and credible with stakeholders. Consequently, an important consideration when doing M&E is that of bias. Bias occurs when the accuracy and precision of a measurement is threatened by the experience, perceptions and assumptions of the researcher, or by the tools and approaches used for measurement and analysis.
Minimizing bias helps to increase accuracy and precision. Accuracy means that the data measures what it is intended to measure. For example, if you are trying to measure knowledge change following a training session, you would not just measure how many people were trained but also include some type of test of any knowledge change.
Similarly, precision means that data measurement can be repeated accurately and consistently over time and by different people. For instance, if we use a survey to measures people’s attitudes for a baseline study, two years later the same survey should be administered during an endline study in the same way for precision.
Resource tip
Annex 2 has additional resources on M&E and vulnerable and margin-alized people, as well as quality control and minimizing bias/error in the M&E system.
23
International Federation of Red Cross and Red Crescent Societies
Project/programme monitoring and evaluation guide
As much as we would like to eliminate bias and error in our measurements and information reporting, no research is completely without bias. Nevertheless, there are precautions that can be taken, and the first is to be familiar with the major types of bias we encounter in our work:
a. Selection bias results from poor selection of the sample population to meas-ure/study. Also called design bias or sample error, it occurs when the people, place or time period measured is not representative of the larger population or condition being studied. It is a very important concept to understand be-cause there is a tendency to study the most successful and/or convenient sites or populations to reach (which are often the same). For example, if data collection is done during a convenient time of the day, during the dry sea-son or targets communities easily accessible near paved roads, it may not accurately represent the conditions being studied for the whole population. Such “selection bias” can exclude those people in greatest need – which goes against IFRC’s commitment to provide aid on the basis of need alone.12
b. Measurement bias results from poor data measurement – either due to a fault in the data measurement instrument or the data collector. Sometimes the direct measurement may be done incorrectly, or the attitudes of the inter-viewer may influence how questions are asked and responses are recorded. For instance, household occupancy in a disaster response operation may be calculated incorrectly, or survey questions may be written in a way that bi-ases the response, e.g. “Why do you like this project?” (rather than “What do you think of this project?”).
c. Processing error results from the poor management of data – miscoded data, incorrect data entry, incorrect computer programming and inadequate check-ing. This source of error is particularly common with the entry of quantitative (statistical) data, for which specific practices and checks have been developed.
d. Analytical bias results from the poor analysis of collected data. Different ap-proaches to data analysis generate varying results e.g. the statistical methods employed, or how the data is separated and interpreted. A good practice to help reduce analytical bias is to carefully identify the rationale for the data analysis methods.
It is beyond the scope of this guide to fully cover the topic of bias and error and how to minimize them.13 However, many of the precautions for bias and error are topics in the next section of this guide. For instance, triangulating (com-bining) sources and methods in data collection can help reduce error due to selection and measurement bias. Data management systems can be designed to verify data accuracy and completeness, such as cross-checking figures with other data sources or computer double-entry and post-data entry verification when possible. A participatory approach to data analysis can help to include dif-ferent perspectives and reduce analytical bias. Also, stakeholders should have the opportunity to review data products for accuracy.
12 Principle 2 of the Code of Conduct for International Red Cross and Red Crescent Movement and NGOs in Disaster Relief.
13 Additional resources for reducing bias and error and improving data quality in M&E can be found in Annex 2, M&E Resources.
Resource tip
Annex 3 provides a list of real examples from the field of factors af-fecting the quality of M&E information.
24
International Federation of Red Cross and Red Crescent Societies
Project/programme monitoring and evaluation guide
IFR
C
25
International Federation of Red Cross and Red Crescent Societies
Project/programme monitoring and evaluation guide
The six key M&E steps discussed in Part 2 are:
1. Identify the purpose and scope of the M&E system2. Plan for data collection and management3. Plan for data analysis4. Plan for information reporting and utilization5. Plan for M&E human resources and capacity building6. Prepare the M&E budget
Part 2 builds upon the key M&E concepts presented in Part 1, outlining six key steps for project/programme M&E. Taken together, these steps are to guide planning for and implementing an M&E system for the systematic, timely and effective collection, analysis and use of project/programme information.
Key reminders for all M&E steps:
Ô The M&E steps are interconnected and should be viewed as part of a mutually supportive M&E system. We identify separate steps to help organize and guide the discussion. In reality, these steps are not necessarily separate, but inter-related, often happening simultaneously. For example, what data is collected will largely depend on the data needed to be reported – one step is integral to the other step and would be planned at the same time.
Ô M&E planning should be done by those who use the information. Involvement of project/programme staff and key stakeholders ensures feasibility, under-standing and ownership of the M&E system. M&E planning should not be limited to a headquarters’ office, but informed by the realities and practicali-ties of the field. The leadership of an experienced project/programme man-ager, ideally experienced in M&E, is very helpful to ensure M&E activities are well adapted and within the project/programme’s time frame and capacity.
Ô Begin planning for your M&E system immediately after the project/programme design stage (see Diagram 1). Early M&E planning allows for preparation of adequate time, resources and personnel before project/programme imple-mentation. It also informs the project/programme design process itself as it re-quires people to realistically consider how practical it is to do everything they intend to measure. Sometimes, the timing of the M&E planning is determined
Part 2.
Six key steps for project/programme M&E
Advice for the reader
The Checklist – six key steps for project and programme M&E (Annex 4) – provides a useful overview of the key steps and related resources.
26
International Federation of Red Cross and Red Crescent Societies
Project/programme monitoring and evaluation guide
by donor requirements (e.g. at the proposal stage), and additional M&E plan-ning may occur after a project/programme is approved and funded.
Ô A project/programme M&E system builds upon the initial assessment and project/programme design. At IFRC, it is based on the short-term, intermediate and long-term objectives and their indicators identified in the project’s logframe, the in-formational requirements and expectations of stakeholders, as well as other practical considerations, such as project/programme budget and time frame.
Ô When appropriate, it is useful to build on existing M&E capacities and practices. New M&E processes may not only burden the local capacity but they can al-ienate local stakeholders. If existing M&E practices are accurate, reliable and timely, this can save time/resources and build ownership to coordinate with and complement them.
Ô Particular attention should be given to stakeholder interests and expectations throughout the M&E process (as discussed in Step 1 below, but a key considera-tion throughout all M&E steps). In addition to local beneficiaries, it is also im-portant to coordinate and address interests and concerns from other stake-holders. Often, multiple Red Cross Red Crescent actors may be involved in delivering programmes either multilaterally, bilaterally or directly.
Ô M&E should be tailored and adjusted to the real-world context throughout the project/programme’s life cycle. Projects/programmes operate in a dynamic set-ting, and M&E activities need to adapt accordingly. Objectives may change, as will the M&E system as it refines its processes and addresses arising prob-lems and concerns. Like a project/programme itself, the M&E system should be monitored, periodically reviewed and improved upon.
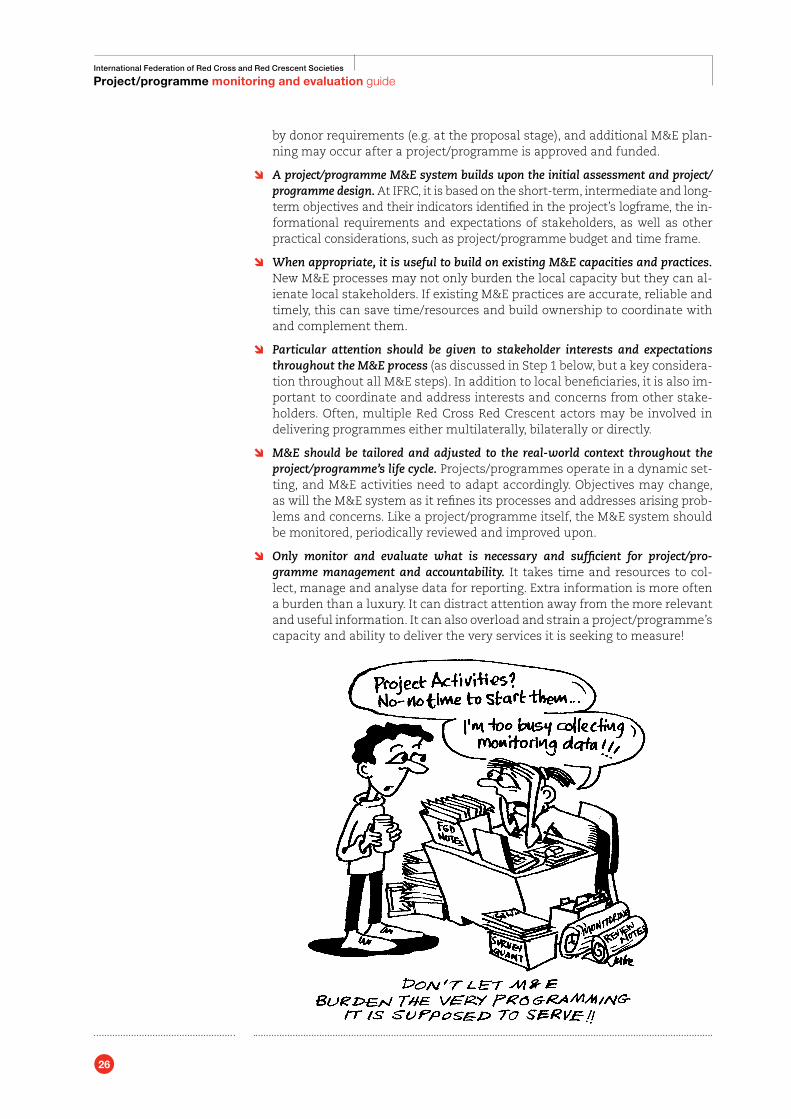
Ô Only monitor and evaluate what is necessary and sufficient for project/pro-gramme management and accountability. It takes time and resources to col-lect, manage and analyse data for reporting. Extra information is more often a burden than a luxury. It can distract attention away from the more relevant and useful information. It can also overload and strain a project/programme’s capacity and ability to deliver the very services it is seeking to measure!
27
International Federation of Red Cross and Red Crescent Societies
Project/programme monitoring and evaluation guide
2.1 STEP 1 – Identify the purpose and scope of the M&E system
What you will find in Step 1:
2.1.1 Review the project/programme’s operational design (logframe)2.1.2 Identify key stakeholder informational needs and expectations2.1.3 Identify any M&E requirements2.1.4 Scope of major M&E events and functions
The purpose and scope of the M&E system answers, “Why do we need M&E and how comprehensive should it be?” It serves as a reference point for the M&E system, guiding key decisions such as informational needs, methodological ap-proaches, capacity building and allocation of resources. The following outlines some key considerations when determining an M&E system’s purpose and scope.
2.1.1 Review the project/programme’s operational design (logframe)For IFRC’s projects/programmes, the logframe is the foundation on which the M&E system is built. The logframe is a summary of the project/programme’s operational design, based on the situation and problem analysis conducted during the project/programme’s design stage. It summarizes the logical sequence of objectives to achieve the project/programme’s intended results (activities, outputs, outcomes and goal), the indicators and means of verification to measure these objectives, and any key assumptions. For IFRC’s projects, the project/programme design is typi-cally summarized in a standard logframe table (see Annex 5).14
A well-developed logframe reflects the informational needs of the project/pro-gramme. For example, the objectives and informational needs of a project/pro-gramme during an emergency operation will have very different logframe and related M&E requirements than a longer-term development project/programme (see Box 5).
Box 5: M&E in emergency settings
Much of the IFRC’s work is assisting people in need in emergency settings. Planning M&E for an emergency operation presents operational objectives and contexts that typically differ from longer-term development projects/pro-grammes. Emergency settings are often dangerous and dynamic, with rapidly changing, complex situations. Therefore, acute and immediate needs often take priority over longer-term objectives in a project/programme’s operational de-sign. Also, high media coverage and pressure from donors demand timely M&E evidence for results. Other key challenges include increased insecurity and un-certainty for both affected populations and field workers, damaged or absent in-frastructure, restricted access to areas and populations, absence of baseline data, and rapid changes in personnel. In such settings, it may not be possible to imple-ment complex M&E systems. Instead, it is best to plan for simple and efficient systems, stressing regular and timely monitoring and rapid evaluations, such as real-time evaluations (RTEs – see Table 2, Section 1.4). Timely information is es-sential to determine priorities and inform decision-making, identifying emerging problems as well as developing trends to guide intervention revision that best meets emergency needs. The IFRC plan of action for disaster response opera-tions (see Annex 2, M&E Resources) provides templates and guidance for col-lecting and summarizing key information during an IFRC response to a disaster.
14 In addition to the example logframe format presented in Annex 5, these logframe components are defined in more detail in the IFRC’s Project/Programme Planning Guidance Manual (IFRC PPP 2010).
28
International Federation of Red Cross and Red Crescent Societies
Project/programme monitoring and evaluation guide
When reviewing the logframe, it is important to check it for logic and relevance. Often, in the rush to start a project/programme, there may be oversights in the development of a logframe. Sometimes it is prepared in an office or by people far removed from the project/programme setting. The logframe is not a static “blueprint”, but should be reassessed and revised according to the realities and changing circumstances in the field. This is particularly true in humanitarian re-sponses, where populations and needs can rapidly change in a short time frame. However, changes should only be made after careful consideration and consulta-tion with key stakeholders and in compliance with any donor requirements.
An important consideration in the logframe is the use of industry-recognized, standard indicators – see Box 6 below. These can make a big difference in the subsequent M&E. Standard indicators may not only save time in designing in-dicators but an important advantage is that they typically come with accepted, standard definitions to ensure they are measured reliably and consistently, and measurement methods are usually well developed and tested. Another key advantage is that standard indicators can be compared over time, place and projects/programmes. Finally, industry-recognized indicators contribute to credibility and legitimacy across stakeholders.
However, there are limitations to how much indicators can be standardized, and they can be inflexible and unrepresentative of the local context. Also, consider-ation should be given to the project/programme’s capacity (financial or human) to measure certain standard indicators according to international methods and best practices. Nevertheless, industry-recognized, standard indicators can be very useful, and often it is best to use a combination of standardized indicators and those designed specifically for the local context.
Box 6: Types of industry (standard) indicators
Industry-recognized, standard indicators vary from sector or project/pro-gramme area. The following is a summary of key types of industry-recog-nized indicators:
Î Industry indicators developed for use across the humanitarian in-dustry. Examples include the Sphere Project and the Humanitarian Accountability Partnership. (While many industry codes and standards exist, they do not all necessarily include standard indicators, but may be left to interpretation by individual organizations.)
Î Sector-specific or thematic indicators developed for use in specific the-matic sectors. Examples include the sectors covered by the Sphere Project, progress indicators for the United Nations Millennium Development Goals and thematic groupings such as the IFRC HIV Global Alliance indicators.
Î Cluster indicators developed by some of the UN Clusters to assess achievements of the overall focus area of the cluster. These are particu-larly useful where outcomes and impact achieved cannot be attributed to the work of one organization, but rather to the collective efforts of multiple organizations in a cluster or across clusters.
Î Organization-specific indicators which have been developed for use in specific operations or for organizational reporting against its strategy. The seven key proxy indicators detailed for the Federation-Wide Reporting System (FWRS)15 are an example of this, as are the ICRC’s standard indicators on beneficiary counting.
15 Refer to the IFRC’s FWRS Indicator Guidelines, listed in Annex 2, M&E Resources.
29
International Federation of Red Cross and Red Crescent Societies
Project/programme monitoring and evaluation guide
2.1.2 Identify key stakeholder informational needs and expectationsPlanning an M&E system based on stakeholder needs and expectations helps to ensure understanding, ownership and use of M&E information. It is essential to have a clear understanding of the priorities and information needs of people interested in or affected by the project/programme. This includes stakeholder motivations, experience and commitment, as well as the political and other constraints under which various stakeholders operate. It is especially important that local knowledge is sought when planning M&E functions to ensure that they are relevant to and feasible in the local context, and that M&E information is credible, accepted and more likely to be supported.
Typically, the IFRC’s projects/programmes involve multiple stakeholders at different levels. Box 7 summarizes some key stakeholders and some of their common informational needs.
Box 7: Examples of the IFRC’s key stakeholders and informational needs
Î Communities (beneficiaries) provided with information are able to better understand, participate in and own a project/programme.
Î Donors, which include those within the IFRC (e.g. donor National Societies and the secretariat) and individuals and agencies outside the IFRC, typi-cally require information to ensure compliance and accountability.
Î Project/programme management use information for decision-making, strategic planning, and accountability.
Î Project/programme staff can use information for project/programme implementation and to understand management decisions.
Î The IFRC’s secretariat and National Societies may require informa-tion for donor accountability, long-term strategic planning, knowledge sharing, organizational learning and advocacy.
Î Partners (bilateral or local) can use information for coordination and collaboration, as well as for knowledge and resource sharing. The ICRC is an important multilateral actor with which the IFRC often works closely.
Î Government and local authorities may require information to ensure that legal and regulatory requirements are met, and it can help build political understanding and support.
Typically, a stakeholder assessment is conducted during the planning stage of a project/programme.16 This initial assessment can inform M&E planning, but for planning the M&E system it is recommended to focus more specifically on the informational needs and expectations of the key stakeholders.
An M&E stakeholder assessment table is provided in Annex 6. It is a useful tool to refer to throughout the project/programme cycle, summarizing: who are the key stakeholders, what information they require, why, when, how (in what format) and any role or function they expect or are required to have in the M&E system.
16 Refer to IFRC PPP, 2010: p. 16.
Practical tip
Sometimes there is a combination of M&E requ i rement s f rom multiple donors and partners. It is best early in the project /pro-gramme design stage to coordinate these expectations and re-quirements as much as possible to reduce the burden on project/programme implemen-tation. Agreement on common indicators, methods, tools and for-mats not only reduces the M&E overload, but it can conserve human and financial resources.
30
International Federation of Red Cross and Red Crescent Societies
Project/programme monitoring and evaluation guide
2.1.3 Identify any M&E requirementsImportant informational needs worth specific attention are those that arise from any donor guidelines and requirements, governmental laws and regulations, and inter-nationally-agreed-upon standards. These requirements can include very detailed procedures, formats and resources, and are often non-negotiable. Therefore, it is best to identify and plan for them early in the M&E planning process.
Internationally-agreed-upon standards and criteria are particularly relevant to the IFRC’s work. IFRC interventions are often implemented through various partnerships within the Movement, with bilateral donors and between interna-tional, national and civil society organizations. It is important that we conduct our work according to agreed-upon standards and criteria – which need to be monitored and evaluated.
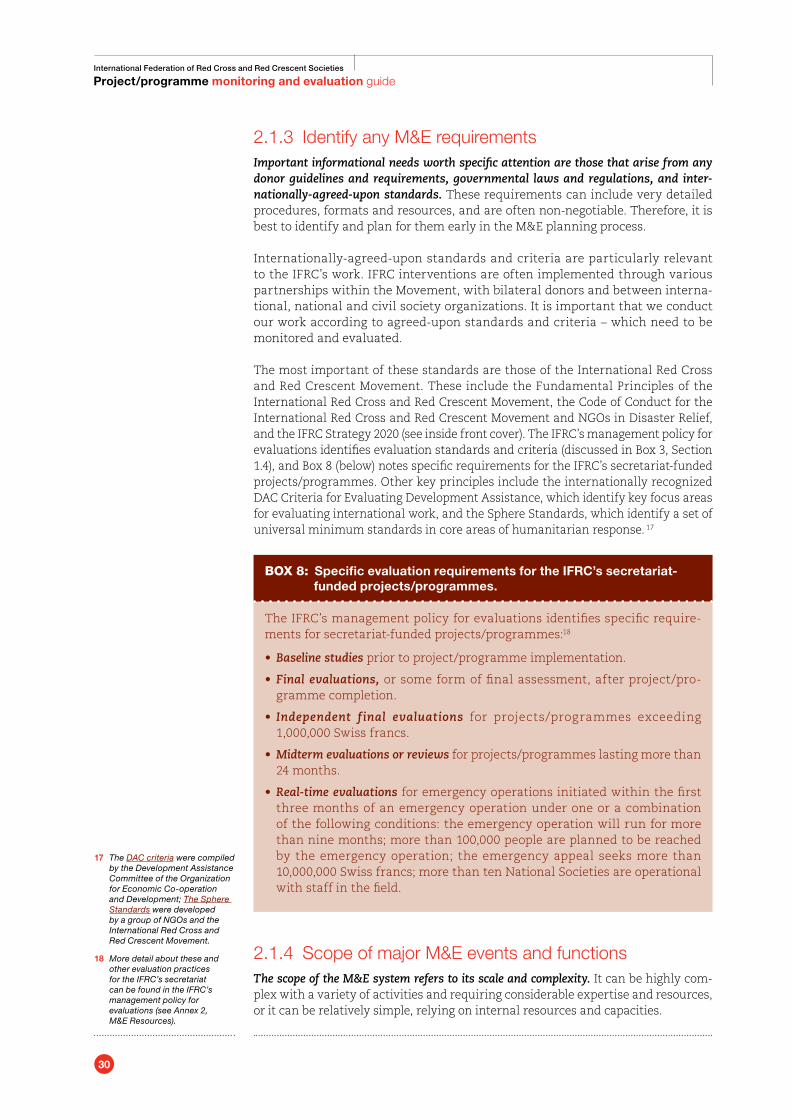
The most important of these standards are those of the International Red Cross and Red Crescent Movement. These include the Fundamental Principles of the International Red Cross and Red Crescent Movement, the Code of Conduct for the International Red Cross and Red Crescent Movement and NGOs in Disaster Relief, and the IFRC Strategy 2020 (see inside front cover). The IFRC’s management policy for evaluations identifies evaluation standards and criteria (discussed in Box 3, Section 1.4), and Box 8 (below) notes specific requirements for the IFRC’s secretariat-funded projects/programmes. Other key principles include the internationally recognized DAC Criteria for Evaluating Development Assistance, which identify key focus areas for evaluating international work, and the Sphere Standards, which identify a set of universal minimum standards in core areas of humanitarian response. 17
Box 8: Specific evaluation requirements for the IFRC’s secretariat-funded projects/programmes.
The IFRC’s management policy for evaluations identifies specific require-ments for secretariat-funded projects/programmes:18
•Baseline studies prior to project/programme implementation.
• Final evaluations, or some form of final assessment, after project/pro-gramme completion.
• Independent final evaluations for projects/programmes exceeding 1,000,000 Swiss francs.
•Midterm evaluations or reviews for projects/programmes lasting more than 24 months.
•Real-time evaluations for emergency operations initiated within the first three months of an emergency operation under one or a combination of the following conditions: the emergency operation will run for more than nine months; more than 100,000 people are planned to be reached by the emergency operation; the emergency appeal seeks more than 10,000,000 Swiss francs; more than ten National Societies are operational with staff in the field.
2.1.4 Scope of major M&E events and functions The scope of the M&E system refers to its scale and complexity. It can be highly com-plex with a variety of activities and requiring considerable expertise and resources, or it can be relatively simple, relying on internal resources and capacities.
17 The DAC criteria were compiled by the Development Assistance Committee of the Organization for Economic Co-operation and Development; The Sphere Standards were developed by a group of NGOs and the International Red Cross and Red Crescent Movement.
18 More detail about these and other evaluation practices for the IFRC’s secretariat can be found in the IFRC’s management policy for evaluations (see Annex 2, M&E Resources).
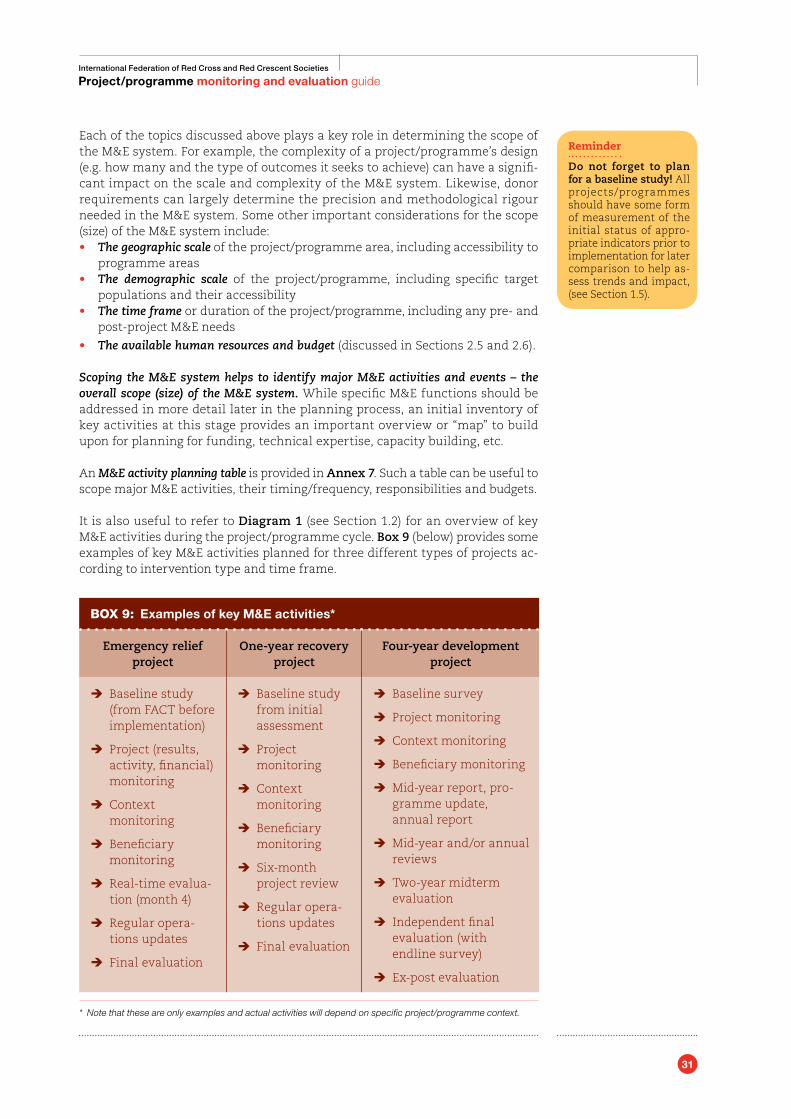
31
International Federation of Red Cross and Red Crescent Societies
Project/programme monitoring and evaluation guide
Each of the topics discussed above plays a key role in determining the scope of the M&E system. For example, the complexity of a project/programme’s design (e.g. how many and the type of outcomes it seeks to achieve) can have a signifi-cant impact on the scale and complexity of the M&E system. Likewise, donor requirements can largely determine the precision and methodological rigour needed in the M&E system. Some other important considerations for the scope (size) of the M&E system include: • The geographic scale of the project/programme area, including accessibility to
programme areas• The demographic scale of the project/programme, including specific target
populations and their accessibility• The time frame or duration of the project/programme, including any pre- and
post-project M&E needs
• The available human resources and budget (discussed in Sections 2.5 and 2.6).
Scoping the M&E system helps to identify major M&E activities and events – the overall scope (size) of the M&E system. While specific M&E functions should be addressed in more detail later in the planning process, an initial inventory of key activities at this stage provides an important overview or “map” to build upon for planning for funding, technical expertise, capacity building, etc.
An M&E activity planning table is provided in Annex 7. Such a table can be useful to scope major M&E activities, their timing/frequency, responsibilities and budgets.
It is also useful to refer to Diagram 1 (see Section 1.2) for an overview of key M&E activities during the project/programme cycle. Box 9 (below) provides some examples of key M&E activities planned for three different types of projects ac-cording to intervention type and time frame.
Box 9: Examples of key M&E activities*
Emergency relief project
One-year recovery project
Four-year development project
Î Baseline study (from FACT before implementation)
Î Project (results, activity, financial) monitoring
Î Context monitoring
Î Beneficiary monitoring
Î Real-time evalua-tion (month 4)
Î Regular opera-tions updates
Î Final evaluation
Î Baseline study from initial assessment
Î Project monitoring
Î Context monitoring
Î Beneficiary monitoring
Î Six-month project review
Î Regular opera-tions updates
Î Final evaluation
Î Baseline survey
Î Project monitoring
Î Context monitoring
Î Beneficiary monitoring
Î Mid-year report, pro-gramme update, annual report
Î Mid-year and/or annual reviews
Î Two-year midterm evaluation
Î Independent final evaluation (with endline survey)
Î Ex-post evaluation
* Note that these are only examples and actual activities will depend on specific project/programme context.
Reminder
Do not forget to plan for a baseline study! All projects/programmes should have some form of measurement of the initial status of appro-priate indicators prior to implementation for later comparison to help as-sess trends and impact, (see Section 1.5).
32
International Federation of Red Cross and Red Crescent Societies
Project/programme monitoring and evaluation guide
2.2 STEP 2 – Plan for data collection and management
What you will find in Step 2:
2.2.1 Develop an M&E plan table2.2.2 Assess the availability of secondary data2.2.3 Determine the balance of quantitative and qualitative data2.2.4 Triangulate data collection sources and methods2.2.5 Determine sampling requirements2.2.6 Prepare for any surveys2.2.7 Prepare specific data collection methods/tools2.2.8 Establish stakeholder complaints and feedback mechanisms2.2.9 Establish project/programme staff/volunteer review mechanisms2.2.10 Plan for data management2.2.11 Use an indicator tracking table (ITT)2.2.12 Use a risk log (table)
Once you have defined the project/programme’s informational needs, the next step is to plan for the reliable collection and management of the data so it can be efficiently analysed and used as information. Both data collection and management are firmly linked as data management begins the moment it is collected.
2.2.1 Develop an M&E plan tableAn M&E plan is a table that builds upon a project/programme’s logframe to detail key M&E requirements for each indicator and assumption. It summarizes key in-dicator (measurement) information in a single table: a detailed definition of the data, its sources, the methods and timing of its collection, the people respon-sible and the intended audience and use of the data. Box 10 (next page) summa-rizes the benefits of using an M&E plan.
Annex 8 provides the M&E plan table template adopted by the IFRC, with specific in-structions and examples. The M&E plan can be formatted differently, according to the planning requirements for project/programme management. For instance, additional columns can be added, such as a budget column, a separate column to focus on data sources, or two columns to distinguish people responsible for data collection versus data analysis. Often the project/programme donor will require a specific M&E plan format.
The M&E plan should be completed during the planning stage of a project/pro-gramme (before implementation). This allows the project/programme team to cross-check the logframe and ensure that the indicators and scope of work they represent in both project/programme implementation and data collection, anal-ysis and reporting are realistic to field realities and team capacities.
It is best that the M&E plan is developed by those who will be using it. Completing the table requires detailed knowledge of the project/programme and context provided by the local project/programme team and partners. Their involvement also contributes to data quality because it reinforces their understanding of what data they are to collect and how it will be collected.
Note
Data is a term given to raw facts or figures before they have been processed and ana-lysed. Information refers to data that has been processed and analysed for reporting and use.
Note
M&E plans are some-times called different names by various users, such as an “indicator planning matrix” and a “data collection plan”. While the names (and formats) may vary, the overall funct ion re-mains the same – to detail the M&E require-ments for each indi-cator and assumption.
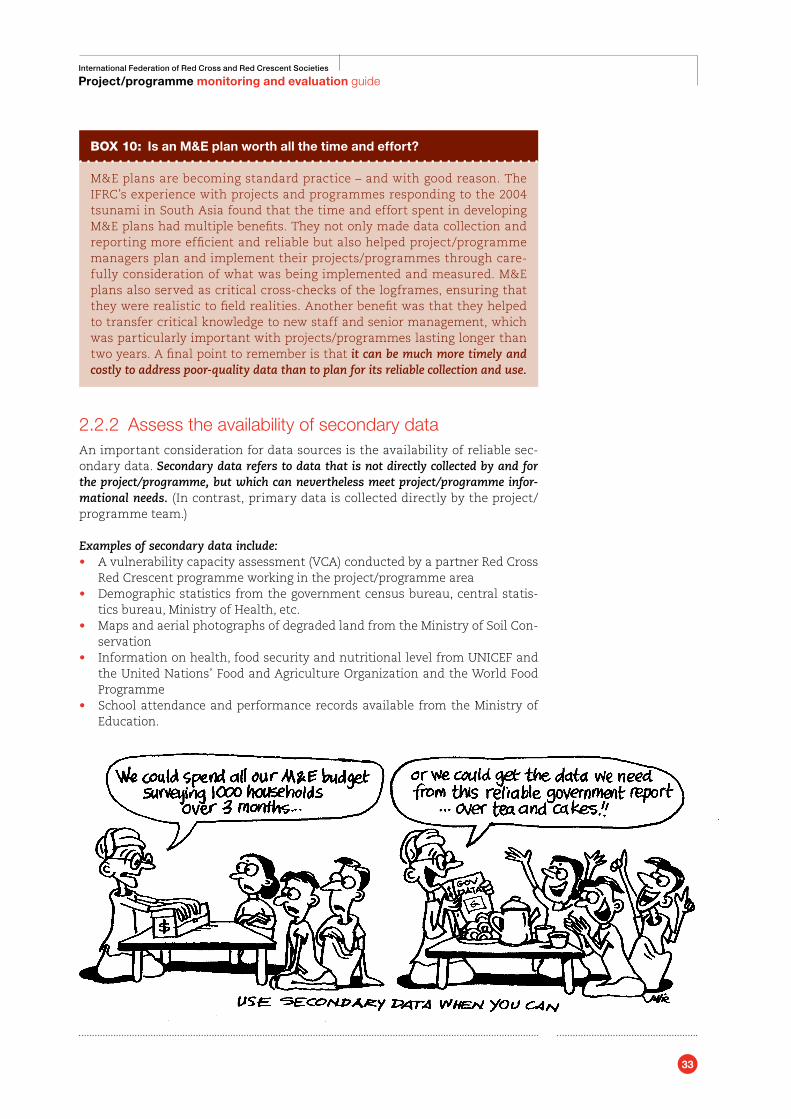
33
International Federation of Red Cross and Red Crescent Societies
Project/programme monitoring and evaluation guide
Box 10: Is an M&E plan worth all the time and effort?
M&E plans are becoming standard practice – and with good reason. The IFRC’s experience with projects and programmes responding to the 2004 tsunami in South Asia found that the time and effort spent in developing M&E plans had multiple benefits. They not only made data collection and reporting more efficient and reliable but also helped project/programme managers plan and implement their projects/programmes through care-fully consideration of what was being implemented and measured. M&E plans also served as critical cross-checks of the logframes, ensuring that they were realistic to field realities. Another benefit was that they helped to transfer critical knowledge to new staff and senior management, which was particularly important with projects/programmes lasting longer than two years. A final point to remember is that it can be much more timely and costly to address poor-quality data than to plan for its reliable collection and use.
2.2.2 Assess the availability of secondary dataAn important consideration for data sources is the availability of reliable sec-ondary data. Secondary data refers to data that is not directly collected by and for the project/programme, but which can nevertheless meet project/programme infor-mational needs. (In contrast, primary data is collected directly by the project/programme team.)
Examples of secondary data include:• A vulnerability capacity assessment (VCA) conducted by a partner Red Cross
Red Crescent programme working in the project/programme area• Demographic statistics from the government census bureau, central statis-
tics bureau, Ministry of Health, etc.• Maps and aerial photographs of degraded land from the Ministry of Soil Con-
servation• Information on health, food security and nutritional level from UNICEF and
the United Nations’ Food and Agriculture Organization and the World Food Programme
• School attendance and performance records available from the Ministry of Education.
34
International Federation of Red Cross and Red Crescent Societies
Project/programme monitoring and evaluation guide
Secondary data is important to consider because it can save considerable time and expense. It can also be used to help triangulate (see below) data sources and verify (prove) primary data and analysis collected directly as part of the project/programme.
However, it is critical to ensure that secondary data is relevant and reliable. As secondary data is not designed specifically for project/programme needs, it is important to avoid the trap of using irrelevant secondary data just because it is available. Check the relevance of secondary data for:
Ô Population – does it cover the population about which you need data?
Ô Time period – does it cover the same time period during which you need data?
Ô Data variables – are the characteristics measured relevant for what you are researching? For example, just because the data may be on road safety, if your project/programme focuses on the use of motorcycle helmets, a road safety study on deaths due to drunken driving may not be relevant (unless they separate deaths for those cases in which it involved a motorcyclist with or without a helmet).
Even if the data measures what you need, it is important to ensure that the source is credible and reliable. As Section 1.9 discusses, it is important to check that any data source (primary or secondary) is accurate (measures what it is intended to measure) and precise (the data measurement can be repeated ac-curately and consistently over time and by different people.) Two key considera-tions for secondary data include:
Ô Reputation – how credible and respected are the people (organization) that commissioned the data and the authors who conducted the research and reported the data? Identify why the secondary data was initially collected and whether there may have been any motive or reason (e.g. political or eco-nomic) that it could bias the data. It can be helpful to check with other or-ganizations and stakeholders to assess this. If possible, it can also help to check the credentials of the researchers/authors of the data and report – e.g. their educational background, related reports and systematic assessments, whether they are accredited or belong to industry associations, etc.
Ô Rigour – were the methods used to collect, analyse and report on the data technically accurate? Check that there is a description of the research meth-ods that provides sufficient information about the data collection, manage-ment and quality control, analysis, and interpretation so that its worth or merit can be determined. (If you do not feel capable to do this, then seek out the expertise of someone competent in research methods to assist you.)
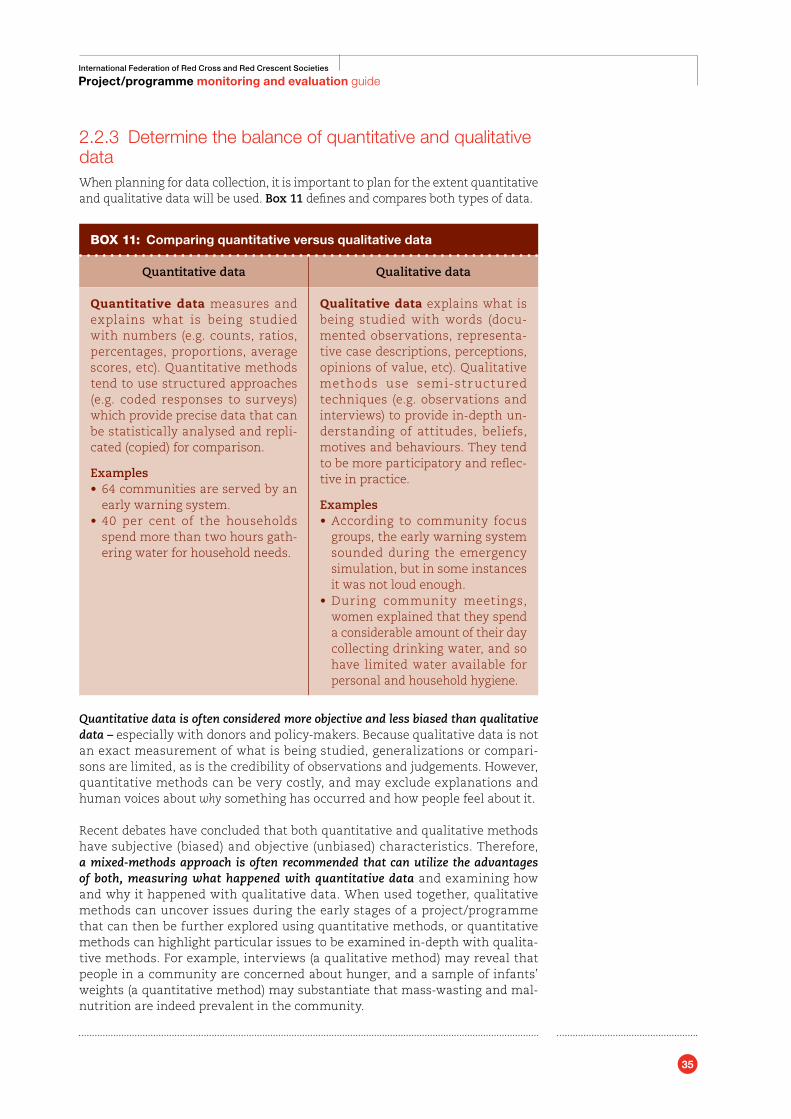
35
International Federation of Red Cross and Red Crescent Societies
Project/programme monitoring and evaluation guide
2.2.3 Determine the balance of quantitative and qualitative data When planning for data collection, it is important to plan for the extent quantitative and qualitative data will be used. Box 11 defines and compares both types of data.
Box 11: Comparing quantitative versus qualitative data
Quantitative data Qualitative data
Quantitative data measures and explains what is being studied with numbers (e.g. counts, ratios, percentages, proportions, average scores, etc). Quantitative methods tend to use structured approaches (e.g. coded responses to surveys) which provide precise data that can be statistically analysed and repli-cated (copied) for comparison.
Examples• 64 communities are served by an
early warning system.• 40 per cent of the households
spend more than two hours gath-ering water for household needs.
Qualitative data explains what is being studied with words (docu-mented observations, representa-tive case descriptions, perceptions, opinions of value, etc). Qualitative methods use semi-structured techniques (e.g. observations and interviews) to provide in-depth un-derstanding of attitudes, beliefs, motives and behaviours. They tend to be more participatory and reflec-tive in practice.
Examples•According to community focus
groups, the early warning system sounded during the emergency simulation, but in some instances it was not loud enough.
•During community meetings, women explained that they spend a considerable amount of their day collecting drinking water, and so have limited water available for personal and household hygiene.
Quantitative data is often considered more objective and less biased than qualitative data – especially with donors and policy-makers. Because qualitative data is not an exact measurement of what is being studied, generalizations or compari-sons are limited, as is the credibility of observations and judgements. However, quantitative methods can be very costly, and may exclude explanations and human voices about why something has occurred and how people feel about it.
Recent debates have concluded that both quantitative and qualitative methods have subjective (biased) and objective (unbiased) characteristics. Therefore, a mixed-methods approach is often recommended that can utilize the advantages of both, measuring what happened with quantitative data and examining how and why it happened with qualitative data. When used together, qualitative methods can uncover issues during the early stages of a project/programme that can then be further explored using quantitative methods, or quantitative methods can highlight particular issues to be examined in-depth with qualita-tive methods. For example, interviews (a qualitative method) may reveal that people in a community are concerned about hunger, and a sample of infants’ weights (a quantitative method) may substantiate that mass-wasting and mal-nutrition are indeed prevalent in the community.
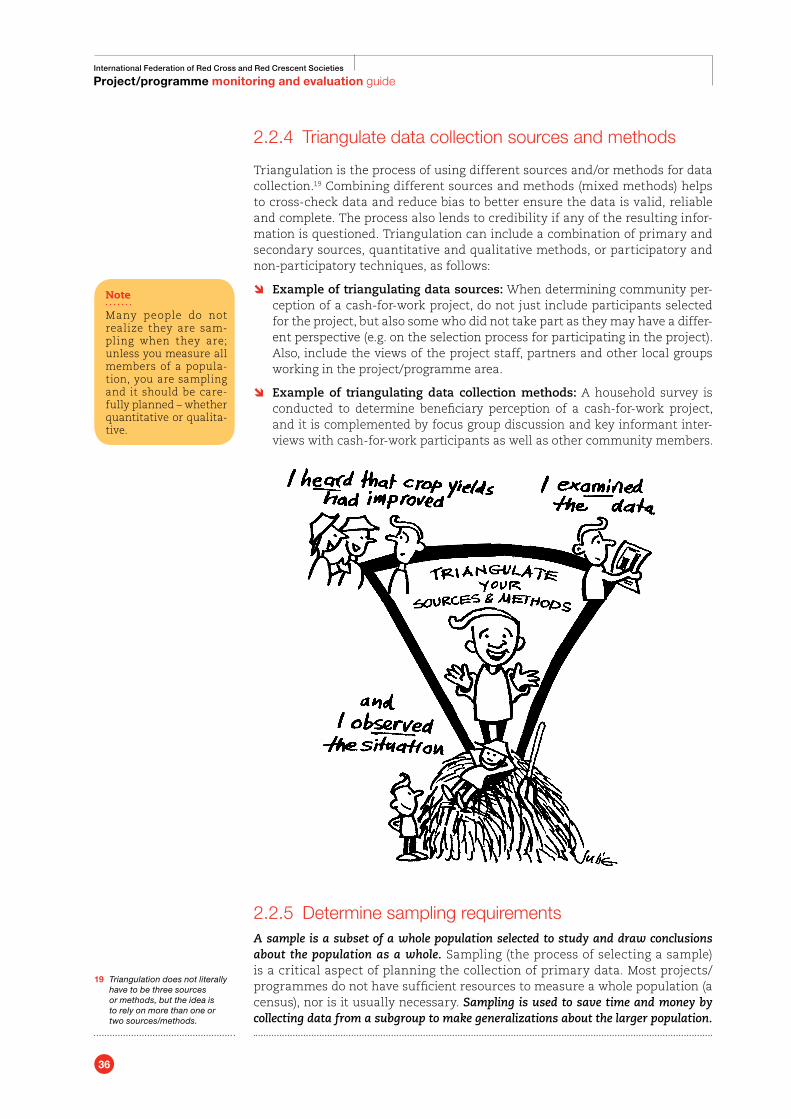
36
International Federation of Red Cross and Red Crescent Societies
Project/programme monitoring and evaluation guide
2.2.4 Triangulate data collection sources and methods
Triangulation is the process of using different sources and/or methods for data collection.19 Combining different sources and methods (mixed methods) helps to cross-check data and reduce bias to better ensure the data is valid, reliable and complete. The process also lends to credibility if any of the resulting infor-mation is questioned. Triangulation can include a combination of primary and secondary sources, quantitative and qualitative methods, or participatory and non-participatory techniques, as follows:
Ô Example of triangulating data sources: When determining community per-ception of a cash-for-work project, do not just include participants selected for the project, but also some who did not take part as they may have a differ-ent perspective (e.g. on the selection process for participating in the project). Also, include the views of the project staff, partners and other local groups working in the project/programme area.
Ô Example of triangulating data collection methods: A household survey is conducted to determine beneficiary perception of a cash-for-work project, and it is complemented by focus group discussion and key informant inter-views with cash-for-work participants as well as other community members.
2.2.5 Determine sampling requirementsA sample is a subset of a whole population selected to study and draw conclusions about the population as a whole. Sampling (the process of selecting a sample) is a critical aspect of planning the collection of primary data. Most projects/programmes do not have sufficient resources to measure a whole population (a census), nor is it usually necessary. Sampling is used to save time and money by collecting data from a subgroup to make generalizations about the larger population.
19 Triangulation does not literally have to be three sources or methods, but the idea is to rely on more than one or two sources/methods.
Note
Many people do not realize they are sam-pling when they are; unless you measure all members of a popula-tion, you are sampling and it should be care-fully planned – whether quantitative or qualita-tive.
37
International Federation of Red Cross and Red Crescent Societies
Project/programme monitoring and evaluation guide
The process of sampling includes the following steps:
1. Define the specific issues that you will be measuring – this will inform what methodology will be used to address the selected issues. For example, in de-termining a survey on sanitation knowledge, attitude and practice/behaviour could be used to assess the extent to which behaviour has been changed by activities that raise awareness of sanitation.
2. Determine the appropriate sampling method – unless primary data collection includes the total population studied, one of two broad types of samples will be used, depending on the degree of accuracy and precision required:• Random (probability) samples are quantitatively determined and use sta-
tistics to make more precise generalizations about the larger population. • Purposeful (non-random) samples are qualitatively determined, often based
on convenience or some other factor; they typically involve smaller, target-ed samples of the population, but because they do not use statistics they are less reliable for generalizations about the larger population.
Random samples are more complex, laborious and costly than purposeful samples, and are not necessary for qualitative methods such as focus group discussions. However, random samples are often expected in larger projects/programmes because they are more precise and can minimize bias – donors frequently require random sampling when using baseline and endline sur-veys. As discussed above, a mixed-methods approach may be best, combining both sample methods for quantitative and qualitative data collection.
In addition to these two broad types of sampling methods, there is a variety of specific sampling designs, such as simple random sampling, stratified random sampling, cluster sampling, multi-stage sampling, convenience sam-pling, purposeful sampling, and respondent-driven sampling. While we are unable to go into detail about the different sampling designs now, it is impor-tant to understand that the design choice impacts the overall sample size. In sum-mary, certain sample designs are selected over others because they provide a sample size and composition that is best suited for what is being studied.
3. Define the sample frame – a list of every member of the population from which a sample is to be taken (e.g. the communities or categories of people – wom-en, children, refugees, etc).
4. Determine the sample size – the sample size is calculated using equations spe-cific to the type of survey (whether descriptive/one-off or comparative/base-line-endline surveys – both discussed below) and to the indicator type used as a basis for the calculation (whether a mean/integer or proportion/percentage).
There are several key design variables for each of these equations that need to be determined, each of which affects sample size. While there are no “right” values for these design variables, there are accepted standards and “rules of thumb”. For example, for descriptive/one-off surveys, the key de-sign variables include significance (also known as confidence level) and the margin of sampling error.20 The accepted standard varies between 90 and 95 per cent for the confidence level and between 5 and 10 per cent for the margin of sampling error.
While calculating sample sizes is a scientific exercise (understanding which equations to use and what values to assign the key design variables), shaping the sample size to “fit” a given project/programme contains a fair amount of art, as manipulating the values of the key design variables involves trade-offs that affect both survey implementation and analysis. It is strongly recommended that an experienced sampling technician is consulted.
20 The margin of error is where your results have an error of no more than X per cent, while the confidence level is the percentage confidence in the reliability of the estimate to produce similar results over time. These two determine how accurate your sample and survey results are - e.g. to achieve 95 per cent confidence with an error of 5 per cent, if the same survey were done 100 times, results would be within +/- 5 per cent the same as the first time, 95 times out of 100. There is a variety of simple sample size calculators on the internet – see Annex 2, M&E Resources, for some links.
21 Some key resources for the use of statistics in project/programme M&E, including online sample calculators, can be found in Annex 2, M&E Resources.
Sounds complicated?
The use of random sampling and statistics can be confusing, and it is often best to seek out the expert ise of someone competent in statistics.21
38
International Federation of Red Cross and Red Crescent Societies
Project/programme monitoring and evaluation guide
2.2.6 Prepare for any surveysSurveys are a common method of gathering data for project/programme M&E. Surveys can be classified in a number of ways, such as according to the specific method used – e.g. in person, by mail, telephone, etc. They generally use inter-view techniques (questions or statements that people respond to), measurement techniques (e.g. infant’s weight to determine nutritional status), or a combina-tion of both. Unless a complete population is to be surveyed, some form of sam-pling (discussed above) is used with surveys.
One important distinction for surveys can be made by the manner in which the survey questions are asked:• Semi-structured surveys use open-ended questions that are not limited to de-
fined answers but allow respondents to answer and express opinions at length – e.g. “How useful is the first-aid kit to your family?” Semi-structured surveys allow more flexibility in response, but take more skill and cost in administer-ing – interviewers must be experienced in probing and extracting information.
• Structured surveys use a standardized approach to asking fixed (closed-ended) questions that limit respondents’ answers to a predefined set of answers, such as yes/no, true/false, or multiple choice – e.g. “Did you receive the first-aid kit?” While pre-coded questions can be efficient in time and useful for statistical analysis, they must be carefully designed to ensure that questions are understood by all respondents and are not misleading. Designing a ques-tionnaire may seem commonsense, but it involves a subtlety that requires experience. See Annex 9 for examples of closed-ended questions used in structured surveys.
Another important distinction for surveys can be made based on the timing and function of the survey:• A descriptive survey seeks to obtain representative data about a population at
a single point of time, without making comparisons between groups (such as a one-off needs assessment).
• A comparative survey seeks to compare the results between groups – either the same population at two points in time (e.g. baseline-endline design), or two distinct groups at the same point in time (e.g. treatment control groups).
Whatever survey method is used, it is critical to understand how it affects the way in which sample sizes are calculated. For example, descriptive surveys need to ac-count for a margin of error when calculating the sample size, while comparative surveys require a power calculation to determine the best sample size.
It is beyond the scope of this guide to adequately cover the topic of surveys, and interested readers are encouraged to refer to other resources.22 In addition to survey design, implementation and analysis, it is useful to also have an un-derstanding of sampling (discussed above) and statistical analysis (see Data analysis, Section 2.3). In short, it may be advisable to seek expert advice/assis-tance if a survey is to be used.
2.2.7 Prepare specific data collection methods/toolsThe M&E plan summarizes data collection methods and tools, but these still need to be prepared and ready for use. Sometimes methods/tools will need to be newly developed but, more often, they can be adapted from elsewhere. Annex 10 provides a summary of key data collection methods and tools.
The best practices for preparing data collection methods/tools will ultimately depend on the specific method/tool. However, there are some important overall
22 Some key resources are listed in Annex 2, M&E Resources, but there are a large number of other resources available online.
39
International Federation of Red Cross and Red Crescent Societies
Project/programme monitoring and evaluation guide
recommendations. Box 12 (on page 40) highlights ways to minimize data collec-tion costs. Some additional practical considerations in planning for data collec-tion include:
Ô Prepare data collection guidelines. This helps to ensure standardization, con-sistency and reliability over time and among different people in the data col-lection process. Double-check that all the data required for indicators is being captured through at least one data source.
Ô Pre-test data collection tools. This helps to detect problematic questions or techniques, verify collection time, identify potential ethical issues and build the competence of data collectors.
Ô Translate and back-translate data collection tools. This ensures that the tools are linguistically accurate, culturally compatible and operate smoothly.
Ô Train data collectors. This includes an overview of the data collection system, data collection techniques, tools, ethics, culturally appropriate interpersonal communication skills and practical experience in collecting data.
Ô Address ethical concerns. Identify and respond to any concerns expressed by the target population. Ensure that the necessary permission or authoriza-tion has been obtained from local authorities, that local customs and attire (clothing) are respected, and that confidentiality and voluntary participation are maintained.
40
International Federation of Red Cross and Red Crescent Societies
Project/programme monitoring and evaluation guide
Box 12: Minimizing data collection costs
Data collection is typically one of the most expensive aspects of the M&E system. One of the best ways to lessen data collection costs is to reduce the amount of data collected (Bamberger et al. 2006). The following questions can help simplify data collection and reduce costs:
Î Is the information necessary and sufficient? Collect only what is neces-sary for project/programme management and evaluation. Limit infor-mation needs to the stated objectives, indicators and assumptions in the logframe.
Î Are there reliable secondary sources of data? As discussed above, sec-ondary data can save considerable time and costs – as long as it is reliable.
Î Is the sample size adequate but not excessive? Determine the sample size that is necessary to estimate or detect change. Consider using strati-fied and cluster samples.
Î Can the data collection instruments be simplified? Eliminate unneces-sary questions from questionnaires and checklists. In addition to saving time and cost, this has the added benefit of reducing survey fatigue among respondents.
Î Is it possible to use competent local people for the collection of survey data? This can include university students, health workers, teachers, government officials and community workers. There may be associated training costs, but considerable savings can be made by hiring a team of external data collectors, and there is the advantage that local helpers will be familiar with the population, language, etc.
Î Are there alternative, cost-saving methods? Sometimes targeted quali-tative approaches (e.g. participatory rapid appraisal – PRA) can reduce the costs of the data collection, data management and statistical anal-ysis required by a survey – when such statistical accuracy is not neces-sary. Self-administered questionnaires can also reduce costs.
2.2.8 Establish stakeholder complaints and feedback mechanisms A complaints and feedback mechanism provides a means for stakeholders to pro-vide comment and voice complaints about the IFRC’s work. It is a particularly im-portant data collection topic worth special mention. Complaints and feedback mechanisms provide valuable insights and data for the ongoing monitoring and periodical evaluation of a project/programme. They can help to anticipate and address potential problems, increase accountability and credibility, and rein-force morale and ownership.
It is important to recognize that stakeholder complaints and feedback can be in-ternal or external – (from those involved in project/programme management and implementation versus those affected by project implementation). Most importantly, beneficiaries (the target population) should have the opportunity to express their perceptions and file any grievances about the services they receive. However, it is also important for other stakeholders, such as project/programme staff, volunteers and partners, to have the opportunity to file com-plaints and provide feedback.
41
International Federation of Red Cross and Red Crescent Societies
Project/programme monitoring and evaluation guide
It is also important to understand that stakeholder feedback can be positive or negative. It can be just as useful and empowering for stakeholders to express positive feedback, lessons learned, and reflections, as it is grievances. However, at a minimum, projects/programmes should have a formal complaints mecha-nism for stakeholders to legally file grievances.
A complaints mechanism is an established set of procedures for stakeholders to safely voice grievances or concerns that are addressed objectively against a standard set of rules and principles. It models accountability and commitment to the IFRC’s stakeholders – especially our moral and legal responsibility to respond to any wrongdoing or misconduct, e.g. issues of sexual exploitation, abuse of power, and corruption.
There is no one approach (method) for stakeholder complaints and feedback – approaches should be adapted to specific stakeholders. Communicating and dealing with complaints and feedback differ across community and organiza-tional cultures. Complaints and feedback can be written or oral, function di-rectly or through intermediaries (third parties), individually or through groups, personally or anonymously. Specific examples range from a comment box and posted mail feedback to community meetings and online (feedback) forums.
Annex 11 provides an example of a complaints form to record and respond to specific complaints, and Annex 12 provides an example of a complaints log to track multiple complaints. Stakeholder complaints and feedback can also be tracked in a regular project/programme management report – discussed in Section 2.4 and as illustrated in Annex 19.
It is beyond the scope (and space) of this guide to adequately cover this important topic and we encourage you to refer to the IFRC Guide for Stakeholder Complaints and Feedback – see Box 13 on next page.
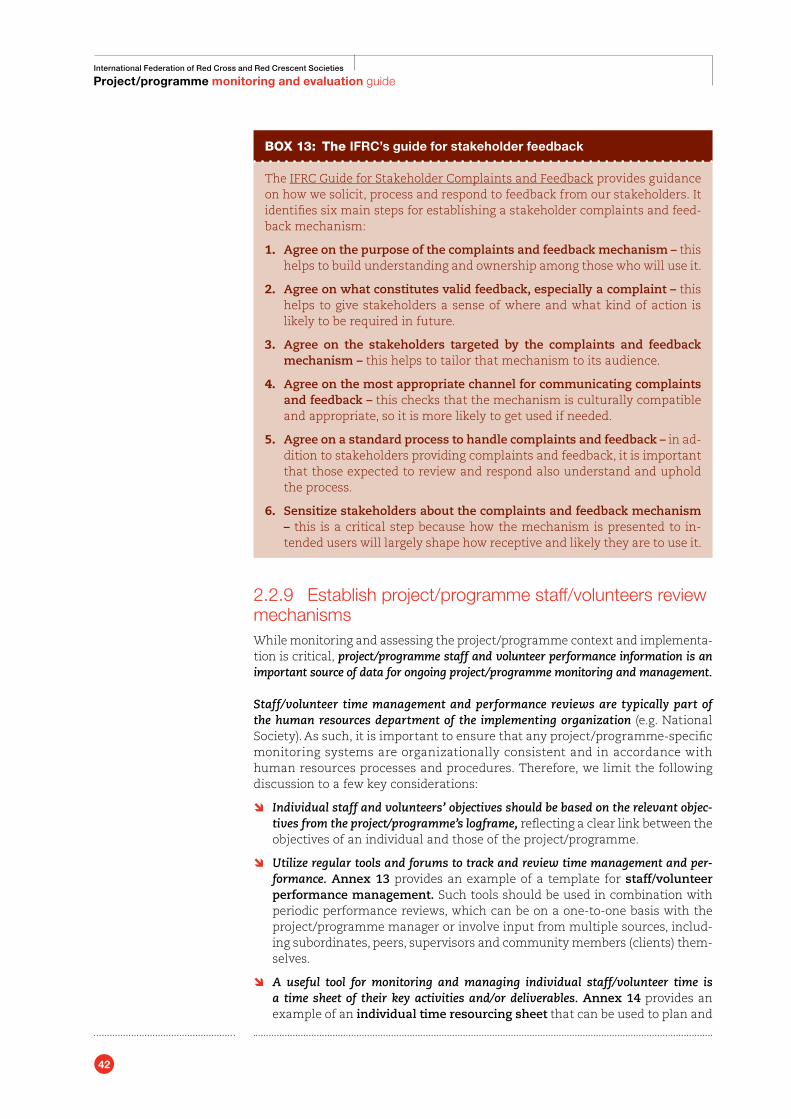
42
International Federation of Red Cross and Red Crescent Societies
Project/programme monitoring and evaluation guide
Box 13: The IFRC’s guide for stakeholder feedback
The IFRC Guide for Stakeholder Complaints and Feedback provides guidance on how we solicit, process and respond to feedback from our stakeholders. It identifies six main steps for establishing a stakeholder complaints and feed-back mechanism:
1. Agree on the purpose of the complaints and feedback mechanism – this helps to build understanding and ownership among those who will use it.
2. Agree on what constitutes valid feedback, especially a complaint – this helps to give stakeholders a sense of where and what kind of action is likely to be required in future.
3. Agree on the stakeholders targeted by the complaints and feedback mechanism – this helps to tailor that mechanism to its audience.
4. Agree on the most appropriate channel for communicating complaints and feedback – this checks that the mechanism is culturally compatible and appropriate, so it is more likely to get used if needed.
5. Agree on a standard process to handle complaints and feedback – in ad-dition to stakeholders providing complaints and feedback, it is important that those expected to review and respond also understand and uphold the process.
6. Sensitize stakeholders about the complaints and feedback mechanism – this is a critical step because how the mechanism is presented to in-tended users will largely shape how receptive and likely they are to use it.
2.2.9 Establish project/programme staff/volunteers review mechanismsWhile monitoring and assessing the project/programme context and implementa-tion is critical, project/programme staff and volunteer performance information is an important source of data for ongoing project/programme monitoring and management.
Staff/volunteer time management and performance reviews are typically part of the human resources department of the implementing organization (e.g. National Society). As such, it is important to ensure that any project/programme-specific monitoring systems are organizationally consistent and in accordance with human resources processes and procedures. Therefore, we limit the following discussion to a few key considerations:
Ô Individual staff and volunteers’ objectives should be based on the relevant objec-tives from the project/programme’s logframe, reflecting a clear link between the objectives of an individual and those of the project/programme.
Ô Utilize regular tools and forums to track and review time management and per-formance. Annex 13 provides an example of a template for staff/volunteer performance management. Such tools should be used in combination with periodic performance reviews, which can be on a one-to-one basis with the project/programme manager or involve input from multiple sources, includ-ing subordinates, peers, supervisors and community members (clients) them-selves.
Ô A useful tool for monitoring and managing individual staff/volunteer time is a time sheet of their key activities and/or deliverables. Annex 14 provides an example of an individual time resourcing sheet that can be used to plan and
43
International Federation of Red Cross and Red Crescent Societies
Project/programme monitoring and evaluation guide
monitor the time required for each individual to engage in different activities. Against this, each individual can then record how much time they actually spent on each activity. As such, this tool helps with planning an individual’s time as well as subsequent monitoring, and, when actual time is very differ-ent to that planned, plans should be revised accordingly.
Ô A useful tool for monitoring and managing human resources is a project/pro-gramme team time sheet of key activities and/or deliverables. Annex 15 pro-vides an example of project/programme team time resourcing sheet. This provides an overview of the full team, highlighting which people should be engaged in which activities, when, and how much of their time is required.
2.2.10 Plan for data managementData management refers to the processes and systems for how a project/programme will systematically and reliably store, manage and access M&E data. It is a critical part of the M&E system, linking data collection with its analysis and use. Poorly managed data wastes time, money and resources; lost or incorrectly recorded data affects not only the quality and reliability of the data but also all the time and resources invested in its analysis and use.
Data management should be timely and secure, and in a format that is practical and user-friendly. It should be designed according to the project/programme needs, size and complexity. Typically, project/programme data management is part of an organization’s or project/programme’s larger data management system and should adhere to any established policies and requirements. The following are seven key considerations for planning a project/programme’s data management system: 23
1. Data format. The format in which data is recorded, stored and eventually reported is an important aspect of overall data management. Standardized formats and templates (as provided in this guide) improve the organization and storage of data. Generated data comes in many forms, but are primarily:
a. Numerical (e.g. spreadsheets, database sets)
b. Descriptive (narrative reports, checklists, forms)
c. Visual (e.g. pictures, video, graphs, maps, diagrams)
d. Audio (recordings of interviews, etc).
Data formats can be physical, such as written forms stored in an office filing cabinet, or electronic, such as a spreadsheet stored in a computer database (discussed below). Sometimes, donors or key partners, such as govern-ment ministries, may define how the data should be recorded and stored. Whatever format, it is important that it is user-friendly, whether its user is a community member, field staff member or project manager.
23 Adopted from Rodolfo Siles, 2004, “Project Management Information Systems”, which provides a more comprehensive discussion on the topic.
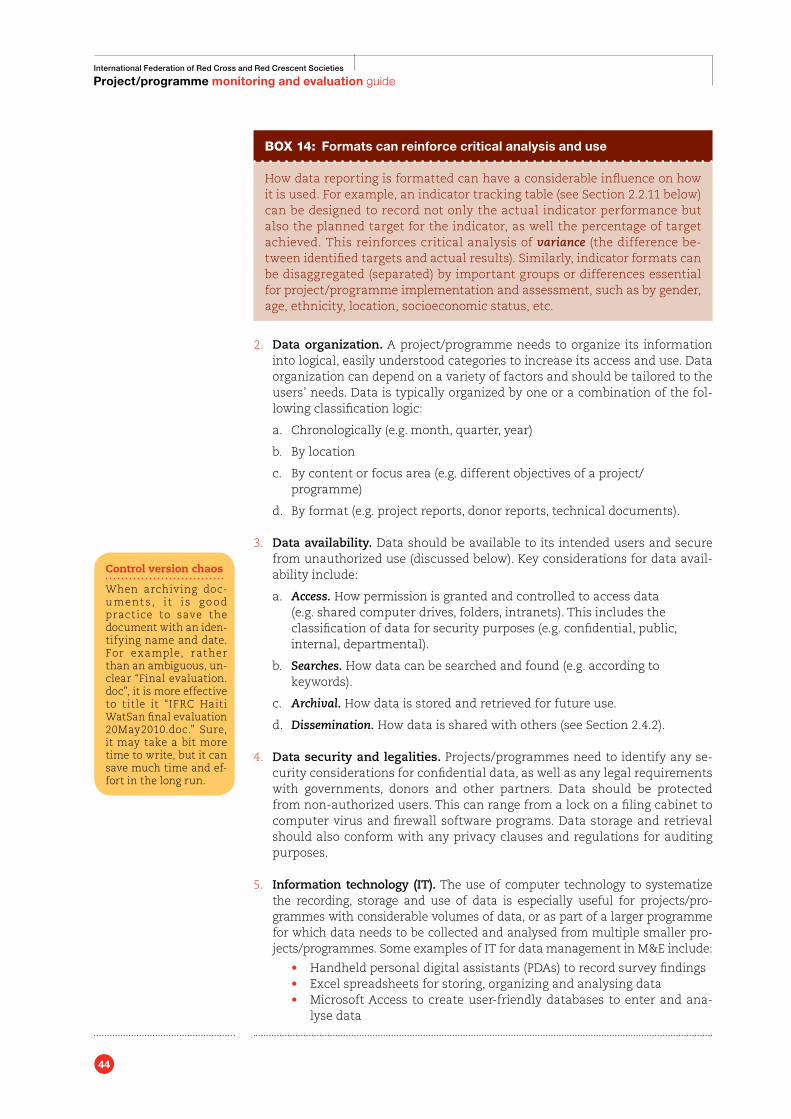
44
International Federation of Red Cross and Red Crescent Societies
Project/programme monitoring and evaluation guide
Box 14: Formats can reinforce critical analysis and use
How data reporting is formatted can have a considerable influence on how it is used. For example, an indicator tracking table (see Section 2.2.11 below) can be designed to record not only the actual indicator performance but also the planned target for the indicator, as well the percentage of target achieved. This reinforces critical analysis of variance (the difference be-tween identified targets and actual results). Similarly, indicator formats can be disaggregated (separated) by important groups or differences essential for project/programme implementation and assessment, such as by gender, age, ethnicity, location, socioeconomic status, etc.
2. Data organization. A project/programme needs to organize its information into logical, easily understood categories to increase its access and use. Data organization can depend on a variety of factors and should be tailored to the users’ needs. Data is typically organized by one or a combination of the fol-lowing classification logic:
a. Chronologically (e.g. month, quarter, year)
b. By location
c. By content or focus area (e.g. different objectives of a project/programme)
d. By format (e.g. project reports, donor reports, technical documents).
3. Data availability. Data should be available to its intended users and secure from unauthorized use (discussed below). Key considerations for data avail-ability include:
a. Access. How permission is granted and controlled to access data (e.g. shared computer drives, folders, intranets). This includes the classification of data for security purposes (e.g. confidential, public, internal, departmental).
b. Searches. How data can be searched and found (e.g. according to keywords).
c. Archival. How data is stored and retrieved for future use.
d. Dissemination. How data is shared with others (see Section 2.4.2).
4. Data security and legalities. Projects/programmes need to identify any se-curity considerations for confidential data, as well as any legal requirements with governments, donors and other partners. Data should be protected from non-authorized users. This can range from a lock on a filing cabinet to computer virus and firewall software programs. Data storage and retrieval should also conform with any privacy clauses and regulations for auditing purposes.
5. Information technology (IT). The use of computer technology to systematize the recording, storage and use of data is especially useful for projects/pro-grammes with considerable volumes of data, or as part of a larger programme for which data needs to be collected and analysed from multiple smaller pro-jects/programmes. Some examples of IT for data management in M&E include:
• Handheld personal digital assistants (PDAs) to record survey findings• Excel spreadsheets for storing, organizing and analysing data• Microsoft Access to create user-friendly databases to enter and ana-
lyse data
Control version chaos
When archiving doc-u ment s , i t i s good pract ice to save the document with an iden-tifying name and date. For example, rather than an ambiguous, un-clear “Final evaluation.doc”, it is more effective to title it “IFRC Haiti WatSan final evaluation 20May2010.doc.” Sure, it may take a bit more time to write, but it can save much time and ef-fort in the long run.
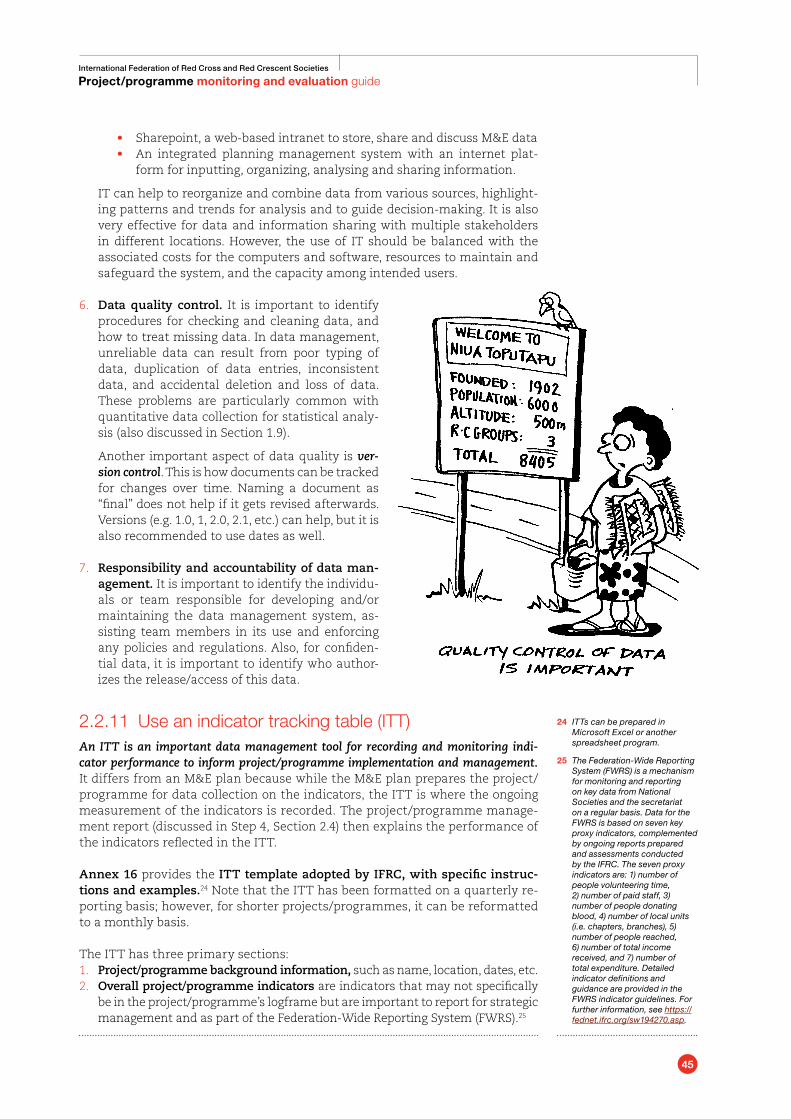
45
International Federation of Red Cross and Red Crescent Societies
Project/programme monitoring and evaluation guide
• Sharepoint, a web-based intranet to store, share and discuss M&E data • An integrated planning management system with an internet plat-
form for inputting, organizing, analysing and sharing information.
IT can help to reorganize and combine data from various sources, highlight-ing patterns and trends for analysis and to guide decision-making. It is also very effective for data and information sharing with multiple stakeholders in different locations. However, the use of IT should be balanced with the associated costs for the computers and software, resources to maintain and safeguard the system, and the capacity among intended users.
6. Data quality control. It is important to identify procedures for checking and cleaning data, and how to treat missing data. In data management, unreliable data can result from poor typing of data, duplication of data entries, inconsistent data, and accidental deletion and loss of data. These problems are particularly common with quantitative data collection for statistical analy-sis (also discussed in Section 1.9).
Another important aspect of data quality is ver-sion control. This is how documents can be tracked for changes over time. Naming a document as “final” does not help if it gets revised afterwards. Versions (e.g. 1.0, 1, 2.0, 2.1, etc.) can help, but it is also recommended to use dates as well.
7. Responsibility and accountability of data man-agement. It is important to identify the individu-als or team responsible for developing and/or maintaining the data management system, as-sisting team members in its use and enforcing any policies and regulations. Also, for confiden-tial data, it is important to identify who author-izes the release/access of this data.
2.2.11 Use an indicator tracking table (ITT)An ITT is an important data management tool for recording and monitoring indi-cator performance to inform project/programme implementation and management. It differs from an M&E plan because while the M&E plan prepares the project/programme for data collection on the indicators, the ITT is where the ongoing measurement of the indicators is recorded. The project/programme manage-ment report (discussed in Step 4, Section 2.4) then explains the performance of the indicators reflected in the ITT.
Annex 16 provides the ITT template adopted by IFRC, with specific instruc-tions and examples.24 Note that the ITT has been formatted on a quarterly re-porting basis; however, for shorter projects/programmes, it can be reformatted to a monthly basis.
The ITT has three primary sections:1. Project/programme background information, such as name, location, dates, etc.2. Overall project/programme indicators are indicators that may not specifically
be in the project/programme’s logframe but are important to report for strategic management and as part of the Federation-Wide Reporting System (FWRS).25
24 ITTs can be prepared in Microsoft Excel or another spreadsheet program.
25 The Federation-Wide Reporting System (FWRS) is a mechanism for monitoring and reporting on key data from National Societies and the secretariat on a regular basis. Data for the FWRS is based on seven key proxy indicators, complemented by ongoing reports prepared and assessments conducted by the IFRC. The seven proxy indicators are: 1) number of people volunteering time, 2) number of paid staff, 3) number of people donating blood, 4) number of local units (i.e. chapters, branches), 5) number of people reached, 6) number of total income received, and 7) number of total expenditure. Detailed indicator definitions and guidance are provided in the FWRS indicator guidelines. For further information, see https://fednet.ifrc.org/sw194270.asp.
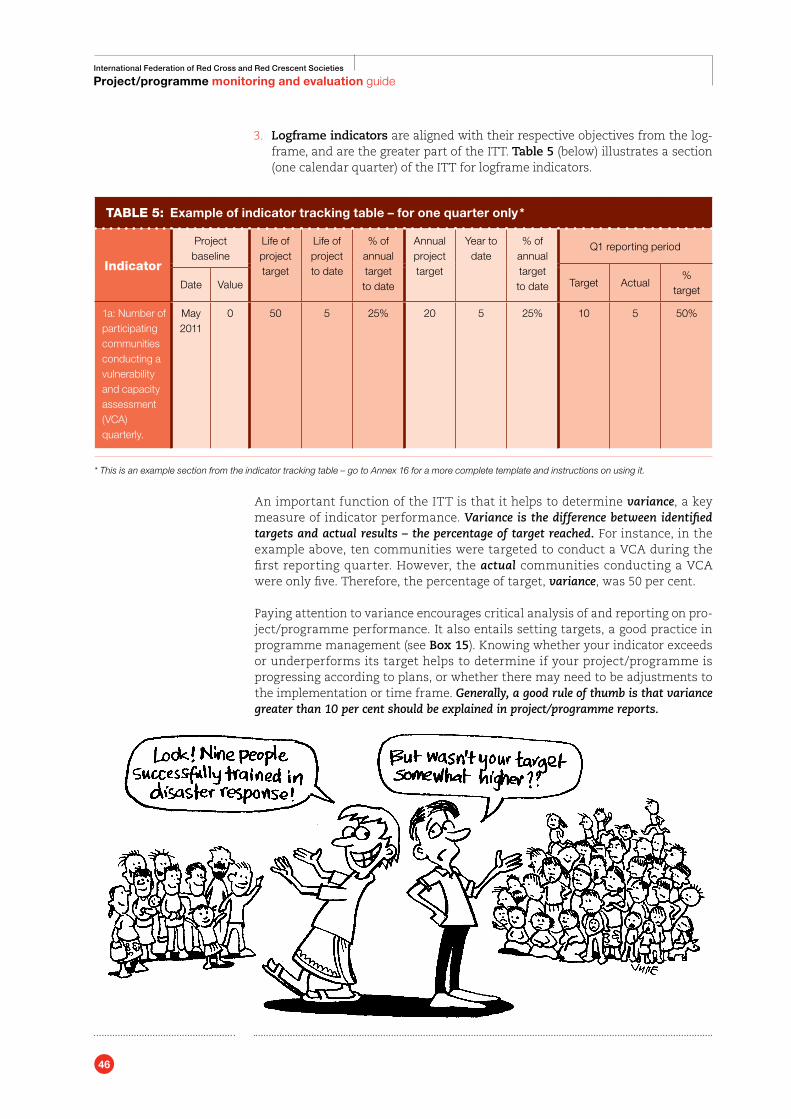
46
International Federation of Red Cross and Red Crescent Societies
Project/programme monitoring and evaluation guide
3. Logframe indicators are aligned with their respective objectives from the log-frame, and are the greater part of the ITT. Table 5 (below) illustrates a section (one calendar quarter) of the ITT for logframe indicators.
TABLE 5: Example of indicator tracking table – for one quarter only *
Indicator
Project baseline
Life of project target
Life of project to date
% of annual target to date
Annual project target
Year to date
% of annual target to date
Q1 reporting period
Target Actual%
targetDate Value
1a: Number of participating communities conducting a vulnerability and capacity assessment (VCA) quarterly.
May2011
0 50 5 25% 20 5 25% 10 5 50%
* This is an example section from the indicator tracking table – go to Annex 16 for a more complete template and instructions on using it.
An important function of the ITT is that it helps to determine variance, a key measure of indicator performance. Variance is the difference between identified targets and actual results – the percentage of target reached. For instance, in the example above, ten communities were targeted to conduct a VCA during the first reporting quarter. However, the actual communities conducting a VCA were only five. Therefore, the percentage of target, variance, was 50 per cent.
Paying attention to variance encourages critical analysis of and reporting on pro-ject/programme performance. It also entails setting targets, a good practice in programme management (see Box 15). Knowing whether your indicator exceeds or underperforms its target helps to determine if your project/programme is progressing according to plans, or whether there may need to be adjustments to the implementation or time frame. Generally, a good rule of thumb is that variance greater than 10 per cent should be explained in project/programme reports.
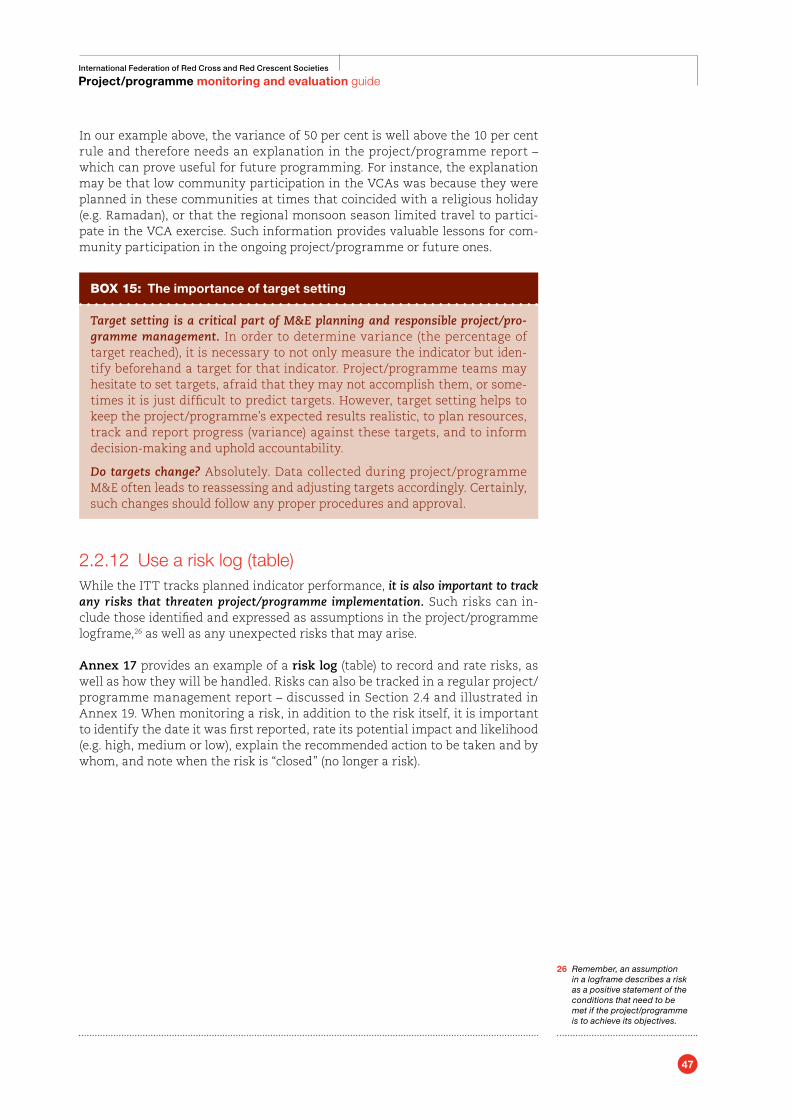
47
International Federation of Red Cross and Red Crescent Societies
Project/programme monitoring and evaluation guide
In our example above, the variance of 50 per cent is well above the 10 per cent rule and therefore needs an explanation in the project/programme report – which can prove useful for future programming. For instance, the explanation may be that low community participation in the VCAs was because they were planned in these communities at times that coincided with a religious holiday (e.g. Ramadan), or that the regional monsoon season limited travel to partici-pate in the VCA exercise. Such information provides valuable lessons for com-munity participation in the ongoing project/programme or future ones.
Box 15: The importance of target setting
Target setting is a critical part of M&E planning and responsible project/pro-gramme management. In order to determine variance (the percentage of target reached), it is necessary to not only measure the indicator but iden-tify beforehand a target for that indicator. Project/programme teams may hesitate to set targets, afraid that they may not accomplish them, or some-times it is just difficult to predict targets. However, target setting helps to keep the project/programme’s expected results realistic, to plan resources, track and report progress (variance) against these targets, and to inform decision-making and uphold accountability.
Do targets change? Absolutely. Data collected during project/programme M&E often leads to reassessing and adjusting targets accordingly. Certainly, such changes should follow any proper procedures and approval.
2.2.12 Use a risk log (table)While the ITT tracks planned indicator performance, it is also important to track any risks that threaten project/programme implementation. Such risks can in-clude those identified and expressed as assumptions in the project/programme logframe,26 as well as any unexpected risks that may arise. Annex 17 provides an example of a risk log (table) to record and rate risks, as well as how they will be handled. Risks can also be tracked in a regular project/programme management report – discussed in Section 2.4 and illustrated in Annex 19. When monitoring a risk, in addition to the risk itself, it is important to identify the date it was first reported, rate its potential impact and likelihood (e.g. high, medium or low), explain the recommended action to be taken and by whom, and note when the risk is “closed” (no longer a risk).
26 Remember, an assumption in a logframe describes a risk as a positive statement of the conditions that need to be met if the project/programme is to achieve its objectives.
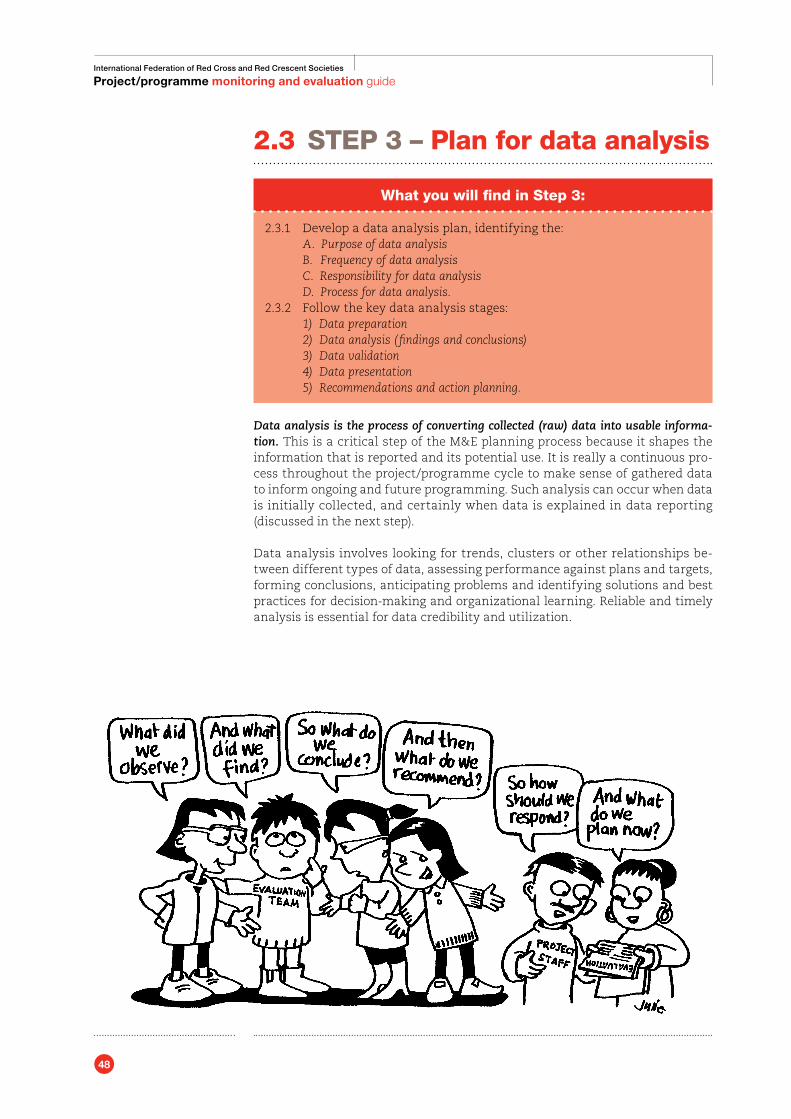
48
International Federation of Red Cross and Red Crescent Societies
Project/programme monitoring and evaluation guide
2.3 STEP 3 – Plan for data analysis
What you will find in Step 3:
2.3.1 Develop a data analysis plan, identifying the: A. Purpose of data analysis B. Frequency of data analysis C. Responsibility for data analysis D. Process for data analysis.2.3.2 Follow the key data analysis stages: 1) Data preparation 2) Data analysis (findings and conclusions) 3) Data validation 4) Data presentation 5) Recommendations and action planning.
Data analysis is the process of converting collected (raw) data into usable informa-tion. This is a critical step of the M&E planning process because it shapes the information that is reported and its potential use. It is really a continuous pro-cess throughout the project/programme cycle to make sense of gathered data to inform ongoing and future programming. Such analysis can occur when data is initially collected, and certainly when data is explained in data reporting (discussed in the next step).
Data analysis involves looking for trends, clusters or other relationships be-tween different types of data, assessing performance against plans and targets, forming conclusions, anticipating problems and identifying solutions and best practices for decision-making and organizational learning. Reliable and timely analysis is essential for data credibility and utilization.
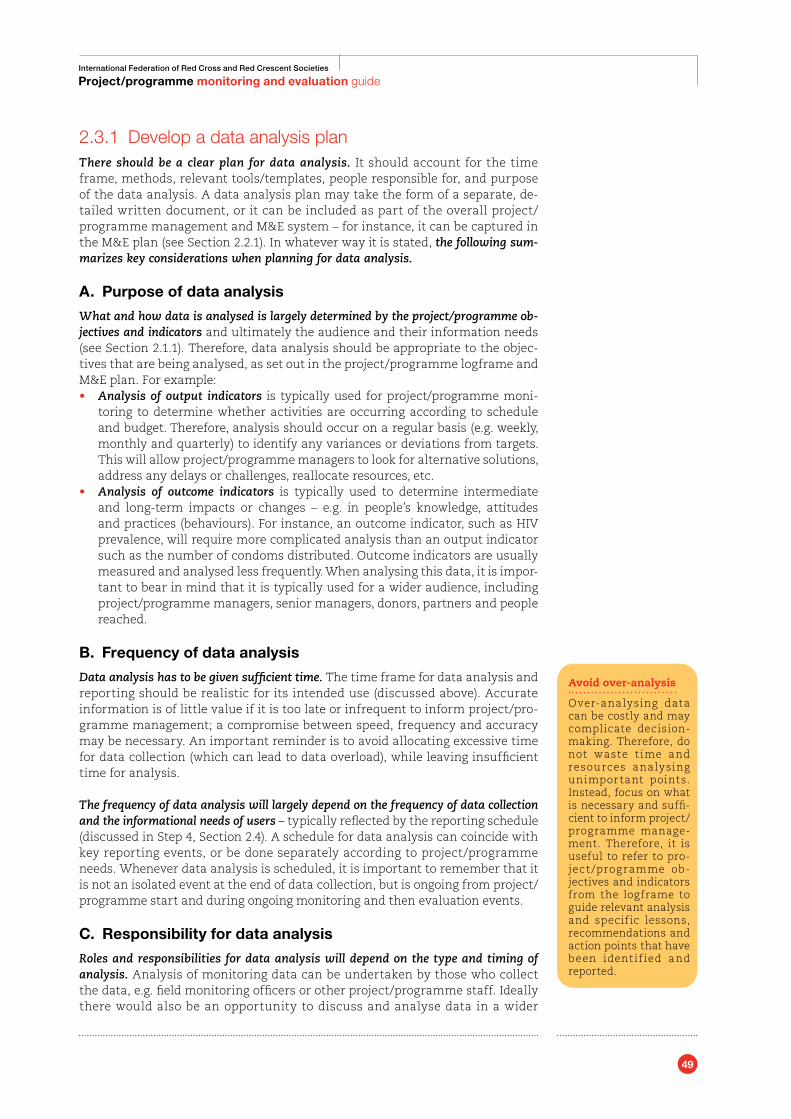
49
International Federation of Red Cross and Red Crescent Societies
Project/programme monitoring and evaluation guide
2.3.1 Develop a data analysis planThere should be a clear plan for data analysis. It should account for the time frame, methods, relevant tools/templates, people responsible for, and purpose of the data analysis. A data analysis plan may take the form of a separate, de-tailed written document, or it can be included as part of the overall project/programme management and M&E system – for instance, it can be captured in the M&E plan (see Section 2.2.1). In whatever way it is stated, the following sum-marizes key considerations when planning for data analysis.
A. Purpose of data analysis
What and how data is analysed is largely determined by the project/programme ob-jectives and indicators and ultimately the audience and their information needs (see Section 2.1.1). Therefore, data analysis should be appropriate to the objec-tives that are being analysed, as set out in the project/programme logframe and M&E plan. For example:• Analysis of output indicators is typically used for project/programme moni-
toring to determine whether activities are occurring according to schedule and budget. Therefore, analysis should occur on a regular basis (e.g. weekly, monthly and quarterly) to identify any variances or deviations from targets. This will allow project/programme managers to look for alternative solutions, address any delays or challenges, reallocate resources, etc.
• Analysis of outcome indicators is typically used to determine intermediate and long-term impacts or changes – e.g. in people’s knowledge, attitudes and practices (behaviours). For instance, an outcome indicator, such as HIV prevalence, will require more complicated analysis than an output indicator such as the number of condoms distributed. Outcome indicators are usually measured and analysed less frequently. When analysing this data, it is impor-tant to bear in mind that it is typically used for a wider audience, including project/programme managers, senior managers, donors, partners and people reached.
B. Frequency of data analysis
Data analysis has to be given sufficient time. The time frame for data analysis and reporting should be realistic for its intended use (discussed above). Accurate information is of little value if it is too late or infrequent to inform project/pro-gramme management; a compromise between speed, frequency and accuracy may be necessary. An important reminder is to avoid allocating excessive time for data collection (which can lead to data overload), while leaving insufficient time for analysis.
The frequency of data analysis will largely depend on the frequency of data collection and the informational needs of users – typically reflected by the reporting schedule (discussed in Step 4, Section 2.4). A schedule for data analysis can coincide with key reporting events, or be done separately according to project/programme needs. Whenever data analysis is scheduled, it is important to remember that it is not an isolated event at the end of data collection, but is ongoing from project/programme start and during ongoing monitoring and then evaluation events.
C. Responsibility for data analysis
Roles and responsibilities for data analysis will depend on the type and timing of analysis. Analysis of monitoring data can be undertaken by those who collect the data, e.g. field monitoring officers or other project/programme staff. Ideally there would also be an opportunity to discuss and analyse data in a wider
Avoid over-analysis
Over-analysing data can be costly and may complicate decision-making. Therefore, do not waste t ime and resources analysing unimportant points. Instead, focus on what is necessary and suffi-cient to inform project/programme manage-ment. Therefore, it is useful to refer to pro-ject /programme ob-jectives and indicators from the logframe to guide relevant analysis and specific lessons, recommendations and action points that have been ident if ied and reported.
50
International Federation of Red Cross and Red Crescent Societies
Project/programme monitoring and evaluation guide
forum, including other project/programme staff and management, partner or-ganizations, beneficiaries and other stakeholders.
For evaluation data, analysis will depend on the purpose and type of evaluation. For instance, if it is an independent, accountability-focused evaluation required by donors, analysis may be led by external consultants. If it is an internal, learning-oriented evaluation, the analysis will be undertaken by the IFRC’s implementing project/programme or organization(s). However, whenever possible, it is advis-able to involve multiple stakeholders in data analysis – refer to Box 16 below. Evaluations may also use independent consultants to initially analyse statistical data, which is then discussed and analysed in a wider forum of stakeholders.
Box 16: Benefits of involving multiple stakeholders in data analysis
Data analysis is not something that happens behind closed doors among statisticians, nor should it be done by one person, e.g. the project/pro-gramme manager, the night before a reporting deadline. Much data analysis does not require complicated techniques and when multiple per-spectives are included, greater participation can help cross-check data accuracy and improve critical reflection, learning and utilization of infor-mation. A problem, or solution, can look different from the perspective of a headquarters’ office versus project/programme staff in the field versus community members. Stakeholder involvement in analysis at all levels helps ensure M&E will be accepted and regarded as credible. It can also help build ownership for the follow-up and utilization of findings, conclu-sions and recommendations.
D. Process for data analysis
Data analysis can employ a variety of forums tailored to the project/pro-gramme needs and context, including meetings, e-mail correspondence, dia-logue through internet platforms (e.g. Sharepoint) and conference calls. As Box 16 highlights above, it is best to try to involve as many stakeholders as practical in such forums, which may require multiple sessions. However it occurs, it is important that data analysis is structured and planned for and not conducted as an afterthought or simply to meet a reporting deadline. Another important consideration is the need for any specialized equipment (e.g. calculators or computers) or software (e.g. Excel, SPSS, Access, Visio) for data analysis. Also, if the project/programme team is to be involved in any data entry or analysis that requires specific technical skills, determine whether such experi-ence exists among the staff or if training is necessary. These factors can then be itemized for the M&E budget and human resource development (Steps 5 and 6, discussed later).
2.3.2 Follow the key data analysis stagesThere is no one recipe for data analysis, but five key stages can be identified: 1) Data preparation; 2) Data analysis; 3) Data presentation; 4) Data verification; and 5) Recommendations and action planning. The remainder of this section discusses these five stages. One common consideration throughout all stages of data anal-ysis is to identify any limitations, biases and threats to the accuracy of the data and its analysis. Data distortion can occur due to limitations or errors in design, sampling, field interviews and data recording and analysis (see Section 1.9). Therefore, it is best to monitor the research process carefully and seek expert advice when needed.
51
International Federation of Red Cross and Red Crescent Societies
Project/programme monitoring and evaluation guide
1. Data preparation
Data preparation, often called data “reduction” or “organization”, involves getting the data into a more usable form for analysis. Data should be prepared according to its intended use, usually informed by the logframe’s indicators. Typically, this involves cleaning, editing, coding and organizing “raw” quantitative and quali-tative data (see Section 2.2.3), as well as cross-checking the data for accuracy and consistency.27
As quantitative data is numerical, it will need to be prepared for statistical anal-ysis. It is also at this stage that quantitative data is checked, “cleaned” and cor-rected for analysis. A number of tools and guidelines are available to assist with data processing, and are best planned for with technical expertise. The United Nations’ World Food Programme has identified six useful steps for preparing quantitative data for analysis:28
1. Nominating a person and setting a procedure to ensure the quality of data entry
2. Entering numerical variables in spreadsheet or database3. Entering continuous variable data on spreadsheets4. Coding and labelling variables5. Dealing with missing values6. Data cleaning methods.
For qualitative data (descriptive text, questionnaire responses, pictures, maps, videos, etc.), it is important to first identify and summarize key points. This may involve circling important text, summarizing long descriptions into main ideas (writing summaries in the paper’s margin), or highlighting critical statements, pictures or other visuals. Key points can then be coded and organized into cat-egories and subcategories that represent observed trends for further analysis.
A final point worth noting is that data organization can actually begin during the data collection phase (see Box 14, Section 2.2.10). The format by which data is recorded and reported can play an important role in organizing data and reinforcing critical analysis. For example, an indicator tracking table (ITT) can be designed to report not only the actual indicator performance but also its planned target and the percentage of target achieved (see Box 15, Section 2.2.11). This rein-forces critical reflection on variance (the difference between identified targets and actual results). For narrative reporting formats, sections can be structured highlighting priority areas that encourage critical analysis – such as best prac-tices, challenges and constraints, lessons, future action, etc. (see the discussion on the IFRC’s project/programme management report template in Section 2.4.1).
2. Data analysis (findings and conclusions)
Data analysis can be descriptive or interpretive. Descriptive analysis involves de-scribing key findings – conditions, states and circumstances uncovered from the data – while interpretive analysis helps to provide meaning, explanation or causal relationship from the findings. Descriptive analysis focuses on what hap-pened, while interpretive analysis seeks to explain why it occurred – what might be the cause(s). Both are interrelated and useful in information reporting as de-scriptive analysis informs interpretive analysis. Box 17 (page 52) illustrates key questions to guide descriptive analysis, with data interpretation questions highlighted in italic red.
27 Data cleaning is the process by which data is cleaned and corrected for analysis. A number of tools and guidelines are available to assist with data processing, and are best planned for with technical expertise.
28 For a detailed discussion of these and other data analysis considerations, refer to UN-WFP, 2011, “How to consolidate, process and analyse qualitative and quantitative data,” in Monitoring & Evaluation Guidelines (Annex 2, M&E Resources).
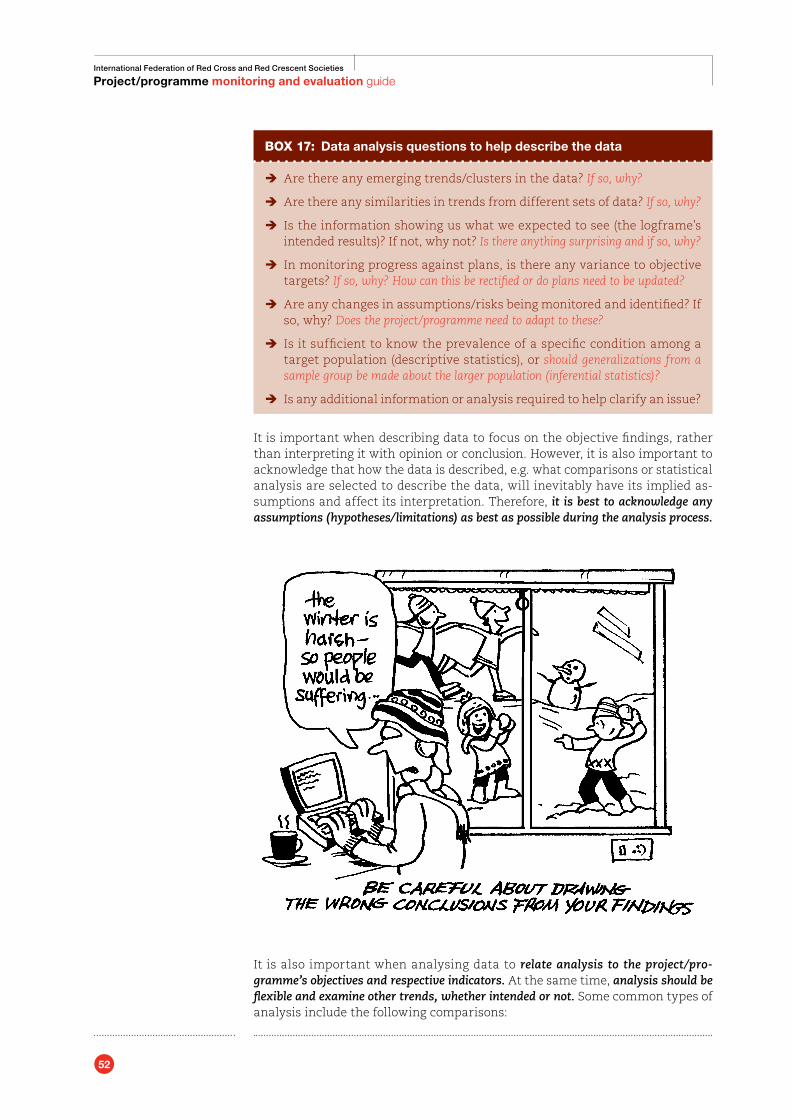
52
International Federation of Red Cross and Red Crescent Societies
Project/programme monitoring and evaluation guide
Box 17: Data analysis questions to help describe the data
Î Are there any emerging trends/clusters in the data? If so, why?
Î Are there any similarities in trends from different sets of data? If so, why?
Î Is the information showing us what we expected to see (the logframe’s intended results)? If not, why not? Is there anything surprising and if so, why?
Î In monitoring progress against plans, is there any variance to objective targets? If so, why? How can this be rectified or do plans need to be updated?
Î Are any changes in assumptions/risks being monitored and identified? If so, why? Does the project/programme need to adapt to these?
Î Is it sufficient to know the prevalence of a specific condition among a target population (descriptive statistics), or should generalizations from a sample group be made about the larger population (inferential statistics)?
Î Is any additional information or analysis required to help clarify an issue?
It is important when describing data to focus on the objective findings, rather than interpreting it with opinion or conclusion. However, it is also important to acknowledge that how the data is described, e.g. what comparisons or statistical analysis are selected to describe the data, will inevitably have its implied as-sumptions and affect its interpretation. Therefore, it is best to acknowledge any assumptions (hypotheses/limitations) as best as possible during the analysis process.
It is also important when analysing data to relate analysis to the project/pro-gramme’s objectives and respective indicators. At the same time, analysis should be flexible and examine other trends, whether intended or not. Some common types of analysis include the following comparisons:
53
International Federation of Red Cross and Red Crescent Societies
Project/programme monitoring and evaluation guide
Ô Planned versus actual (temporal) comparison: As discussed in Section 2.2.11, variance is the difference between identified targets and actual results, such as data organized to compare the number of people (households) tar-geted in a disaster preparedness programme, versus how many were actually reached. When doing such analysis it is important to explain why any vari-ance occurred.
Ô Demographic comparison, such as data separated by gender, age or ethnic-ity to compare the delivery of services to specific vulnerable groups, e.g. in a poverty-lessening/livelihoods project.
Ô Geographical comparison, such as data described by neighbourhood, or ur-ban versus rural, e.g. to compare food delivery during an emergency opera-tion. This is particularly important if certain areas have been more affected than others.
Ô Thematic comparison, such as data described by donor-driven versus own-er-driven housing interventions to compare approaches for a shelter recon-struction programme.
In data description, it is often helpful to use summary tables/matrices, graphs, dia-grams and other visual aids to help organize and describe key trends/findings – this can also be used later for data presentation. While this will require different types of analysis for quantitative versus qualitative data, it is important to take into consideration both quantitative and qualitative data together. Relating and comparing both data types helps to best summarize findings and interpret what is being studied, rather than using separate sets of data.
As quantitative data is numerical, its description and analysis involves statistical techniques. Therefore, it is useful to briefly discuss the use of statistics in data analysis.29 Simple statistical analysis (such as percentages) can be done using a calculator, while more complex statistical analysis, such as survey data, can be carried out using Excel or statistical software such as SPSS (Statistical Package for Social Sciences) – often it may be advisable to seek expert statistical advice.
A basic distinction to understand in statistics is the difference between descriptive and inferential statistics:
Ô Descriptive statistics: Descriptive statistics are used to summarize a single set of numerical results or scores (e.g. test result patterns) or a sample group; this method helps to set the context. As the name implies, these statistics are descriptive and include total numbers, frequency, averages, proportions and distribution. Two other descriptive concepts important to understand are prevalence and incidence. Prevalence shows how many people have a specific condition (e.g. percentage prevalence of HIV/AIDS) or demonstrate a certain behaviour at a specific point in time. Incidence can show how many new cases of people with this illness occur in a given period of time (e.g. rate of occurrence of a disease in a population).
Ô Inferential statistics: Inferential statistics are more complicated, but allow for generalizations (inferences) to be made about the larger population from a sample. Two main catgories of inferential statics are: 1) examining dif-ferences between groups (e.g. differences in outcome indicators between groups that participated in the same project/programme activities and con-trol groups outside the project/programme area); 2) examining relationships between variables, such as cause and effect relationships (e.g. differences in the number of people with changes in sanitation practices after receiving sanitation messaging).
29 It is beyond the scope of this guide to provide detailed statistical guidelines, but there are numerous resources available, some of which are listed in Annex 2, M&E Resources.
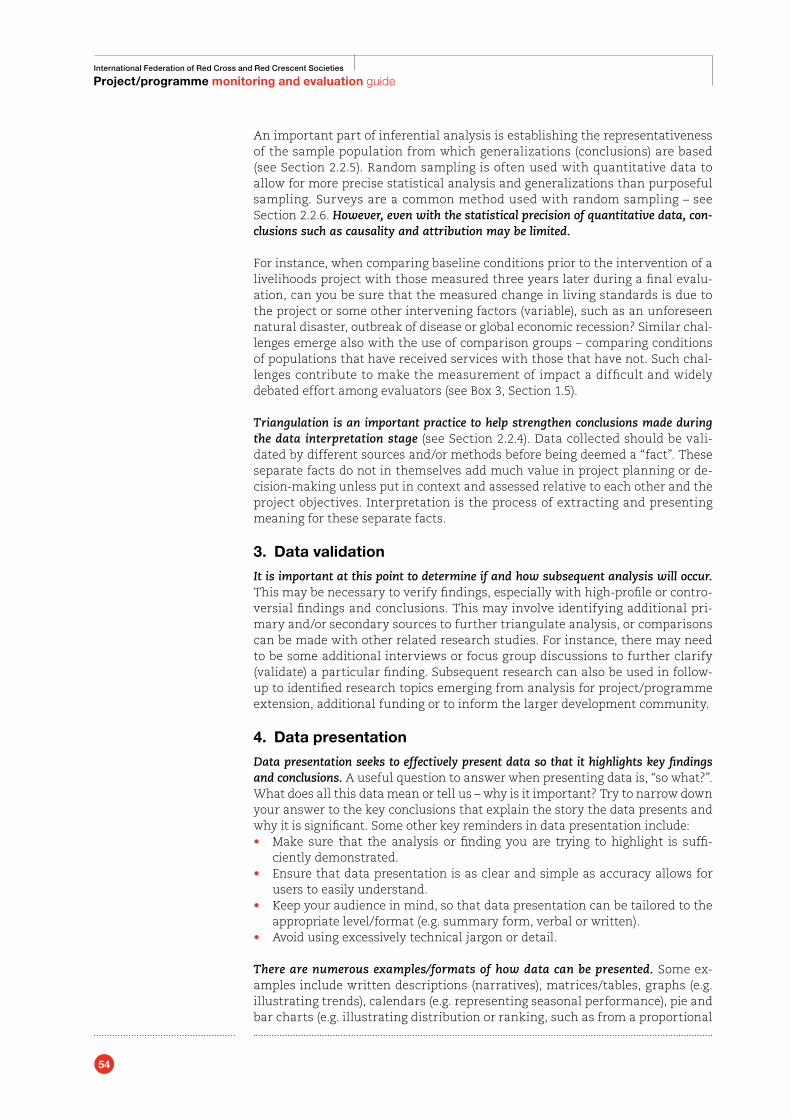
54
International Federation of Red Cross and Red Crescent Societies
Project/programme monitoring and evaluation guide
An important part of inferential analysis is establishing the representativeness of the sample population from which generalizations (conclusions) are based (see Section 2.2.5). Random sampling is often used with quantitative data to allow for more precise statistical analysis and generalizations than purposeful sampling. Surveys are a common method used with random sampling – see Section 2.2.6. However, even with the statistical precision of quantitative data, con-clusions such as causality and attribution may be limited.
For instance, when comparing baseline conditions prior to the intervention of a livelihoods project with those measured three years later during a final evalu-ation, can you be sure that the measured change in living standards is due to the project or some other intervening factors (variable), such as an unforeseen natural disaster, outbreak of disease or global economic recession? Similar chal-lenges emerge also with the use of comparison groups – comparing conditions of populations that have received services with those that have not. Such chal-lenges contribute to make the measurement of impact a difficult and widely debated effort among evaluators (see Box 3, Section 1.5).
Triangulation is an important practice to help strengthen conclusions made during the data interpretation stage (see Section 2.2.4). Data collected should be vali-dated by different sources and/or methods before being deemed a “fact”. These separate facts do not in themselves add much value in project planning or de-cision-making unless put in context and assessed relative to each other and the project objectives. Interpretation is the process of extracting and presenting meaning for these separate facts.
3. Data validation
It is important at this point to determine if and how subsequent analysis will occur. This may be necessary to verify findings, especially with high-profile or contro-versial findings and conclusions. This may involve identifying additional pri-mary and/or secondary sources to further triangulate analysis, or comparisons can be made with other related research studies. For instance, there may need to be some additional interviews or focus group discussions to further clarify (validate) a particular finding. Subsequent research can also be used in follow-up to identified research topics emerging from analysis for project/programme extension, additional funding or to inform the larger development community.
4. Data presentation
Data presentation seeks to effectively present data so that it highlights key findings and conclusions. A useful question to answer when presenting data is, “so what?”. What does all this data mean or tell us – why is it important? Try to narrow down your answer to the key conclusions that explain the story the data presents and why it is significant. Some other key reminders in data presentation include:• Make sure that the analysis or finding you are trying to highlight is suffi-
ciently demonstrated. • Ensure that data presentation is as clear and simple as accuracy allows for
users to easily understand. • Keep your audience in mind, so that data presentation can be tailored to the
appropriate level/format (e.g. summary form, verbal or written). • Avoid using excessively technical jargon or detail.
There are numerous examples/formats of how data can be presented. Some ex-amples include written descriptions (narratives), matrices/tables, graphs (e.g. illustrating trends), calendars (e.g. representing seasonal performance), pie and bar charts (e.g. illustrating distribution or ranking, such as from a proportional
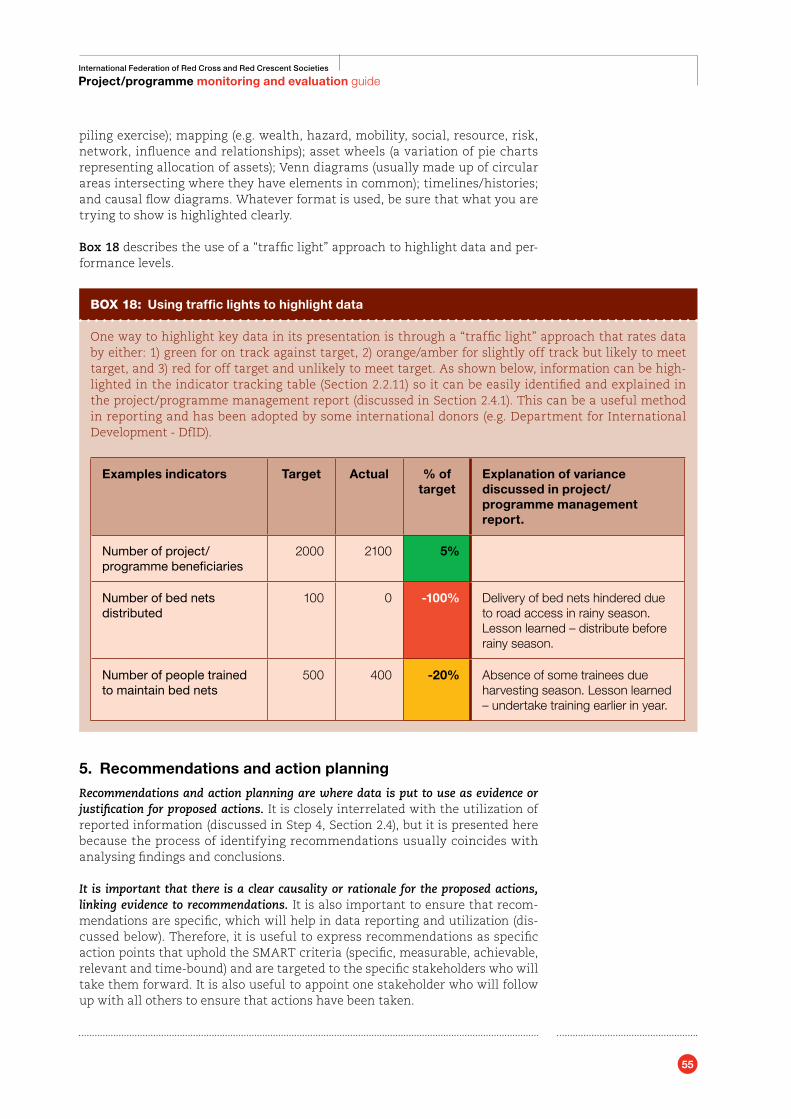
55
International Federation of Red Cross and Red Crescent Societies
Project/programme monitoring and evaluation guide
piling exercise); mapping (e.g. wealth, hazard, mobility, social, resource, risk, network, influence and relationships); asset wheels (a variation of pie charts representing allocation of assets); Venn diagrams (usually made up of circular areas intersecting where they have elements in common); timelines/histories; and causal flow diagrams. Whatever format is used, be sure that what you are trying to show is highlighted clearly.
Box 18 describes the use of a “traffic light” approach to highlight data and per-formance levels.
Box 18: Using traffic lights to highlight data
One way to highlight key data in its presentation is through a “traffic light” approach that rates data by either: 1) green for on track against target, 2) orange/amber for slightly off track but likely to meet target, and 3) red for off target and unlikely to meet target. As shown below, information can be high-lighted in the indicator tracking table (Section 2.2.11) so it can be easily identified and explained in the project/programme management report (discussed in Section 2.4.1). This can be a useful method in reporting and has been adopted by some international donors (e.g. Department for International Development - DfID).
Examples indicators Target Actual % of target
Explanation of variance discussed in project/programme management report.
Number of project/programme beneficiaries
2000 2100 5%
Number of bed nets distributed
100 0 -100% Delivery of bed nets hindered due to road access in rainy season. Lesson learned – distribute before rainy season.
Number of people trained to maintain bed nets
500 400 -20% Absence of some trainees due harvesting season. Lesson learned – undertake training earlier in year.
5. Recommendations and action planning
Recommendations and action planning are where data is put to use as evidence or justification for proposed actions. It is closely interrelated with the utilization of reported information (discussed in Step 4, Section 2.4), but it is presented here because the process of identifying recommendations usually coincides with analysing findings and conclusions.
It is important that there is a clear causality or rationale for the proposed actions, linking evidence to recommendations. It is also important to ensure that recom-mendations are specific, which will help in data reporting and utilization (dis-cussed below). Therefore, it is useful to express recommendations as specific action points that uphold the SMART criteria (specific, measurable, achievable, relevant and time-bound) and are targeted to the specific stakeholders who will take them forward. It is also useful to appoint one stakeholder who will follow up with all others to ensure that actions have been taken.
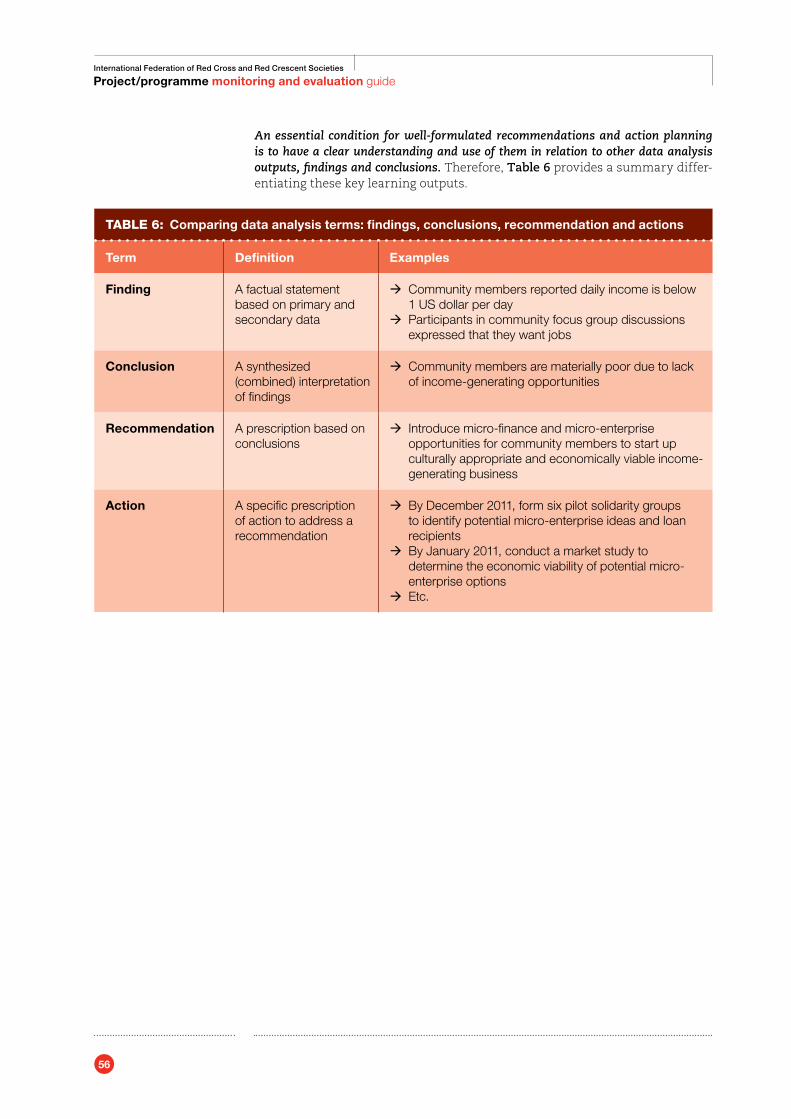
56
International Federation of Red Cross and Red Crescent Societies
Project/programme monitoring and evaluation guide
An essential condition for well-formulated recommendations and action planning is to have a clear understanding and use of them in relation to other data analysis outputs, findings and conclusions. Therefore, Table 6 provides a summary differ-entiating these key learning outputs.
TABLE 6: Comparing data analysis terms: findings, conclusions, recommendation and actions
Term Definition Examples
Finding A factual statement based on primary and secondary data
Æ Community members reported daily income is below 1 US dollar per day
Æ Participants in community focus group discussions expressed that they want jobs
Conclusion A synthesized (combined) interpretation of findings
Æ Community members are materially poor due to lack of income-generating opportunities
Recommendation A prescription based on conclusions
Æ Introduce micro-finance and micro-enterprise opportunities for community members to start up culturally appropriate and economically viable income-generating business
Action A specific prescription of action to address a recommendation
Æ By December 2011, form six pilot solidarity groups to identify potential micro-enterprise ideas and loan recipients
Æ By January 2011, conduct a market study to determine the economic viability of potential micro-enterprise options
Æ Etc.
57
International Federation of Red Cross and Red Crescent Societies
Project/programme monitoring and evaluation guide
2.4 STEP 4 – Plan for information reporting and utilization
What you will find in Step 4:
2.4.1 Anticipate and plan for reporting: A. Needs/audience B. Frequency C. Formats D. People responsible.2.4.2 Plan for information utilization: A. Information dissemination B. Decision-making and planning.
Having defined the project/programme’s informational needs and how data will be collected, managed and analysed, the next step is to plan how the data will be reported as information and put to good use. Reporting is the most visible part of the M&E system, where collected and analysed data is presented as information for key stakeholders to use. Reporting is a critical part of M&E because no matter how well data may be collected and analysed, if it is not well presented it cannot be well used – which can be a considerable waste of valuable time, resources and personnel. Sadly, there are numerous examples where valuable data has proved valueless because it has been poorly reported on.
58
International Federation of Red Cross and Red Crescent Societies
Project/programme monitoring and evaluation guide
2.4.1 Anticipate and plan for reportingReporting can be costly in both time and resources and should not become an end in itself, but serve a well-planned purpose. Therefore, it is critical to anticipate and carefully plan for reporting. Box 19 summarizes key reporting criteria to help ensure its usability.
Box 19: Criteria of good reporting
Î Relevant and useful. Reporting should serve a specific purpose/use. Avoid excessive, unnecessary reporting – information overload is costly and can burden information flow and the potential of using other more relevant information.
Î Timely. Reporting should be timely for its intended use. Information is of little value if it is too late or infrequent for its intended purpose.
Î Complete. Reporting should provide a sufficient amount of information for its intended use. It is especially important that reporting content in-cludes any specific reporting requirements.
Î Reliable. Reporting should provide an accurate representation of the facts.
Î Simple and user-friendly. Reporting should be appropriate for its in-tended audience. The language and reporting format used should be clear, concise and easy to understand.
Î Consistent. Reporting should adopt units and formats that allow com-parison over time, enabling progress to be tracked against indicators, targets and other agreed-upon milestones.
Î Cost-effective. Reporting should warrant the time and resources de-voted to it, balanced against its relevance and use (above).
A valuable tool when planning for reporting is a reporting schedule, matching each reporting requirement with its frequency, audience/purpose, format/outlet and person(s) responsible. Annex 18 provides an example reporting schedule tem-plate. The remainder of this section will discuss key aspects of reporting sum-marized in this schedule.
A. Identify the specific reporting needs/audience
Reports should be prepared for a specific purpose/audience. This informs the ap-propriate content, format and timing for the report. For example, do users need information for ongoing project/programme implementation, strategic plan-ning, compliance with donor requirements, evaluation of impact and/or organi-zational learning for future project/programmes?
As already noted, it is best to identify reporting and other informational needs early in the M&E planning process, especially any reporting requirements (see Step 1, Section 2.1). Therefore, a completed M&E stakeholder assessment table (Annex 6) is a valuable tool for report planning, as well as the “informational use/audience” column in the M&E plan table (Annex 8).
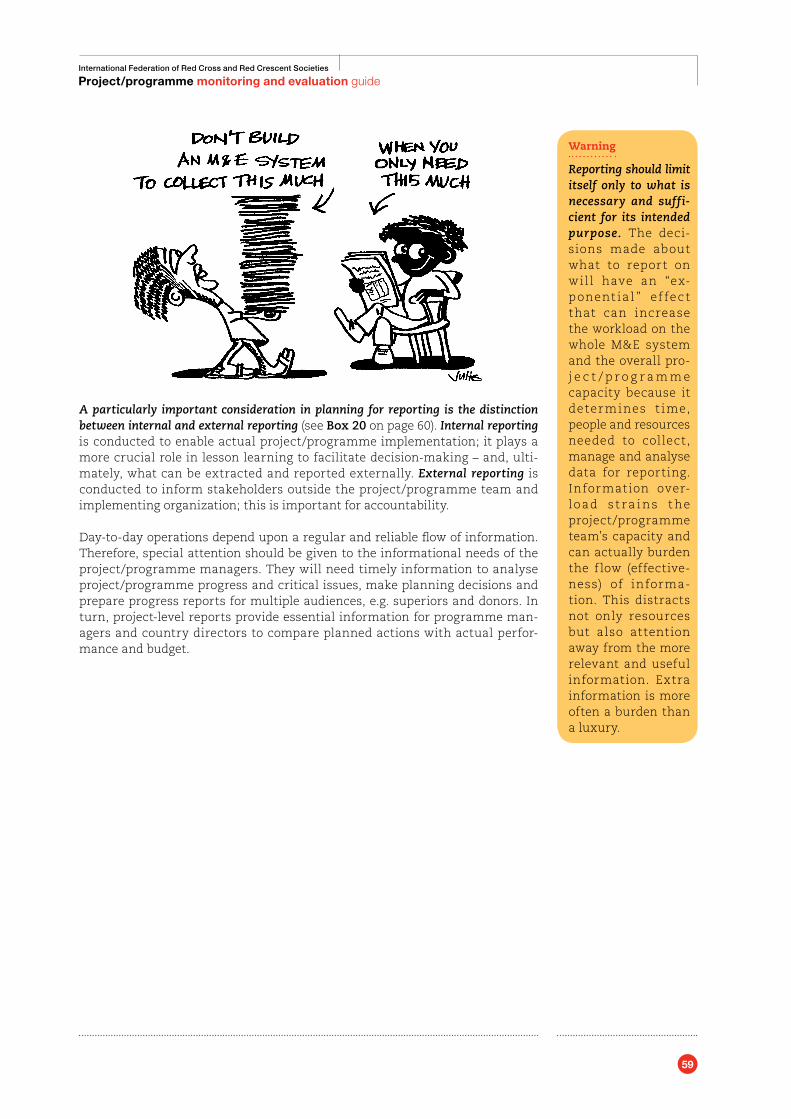
59
International Federation of Red Cross and Red Crescent Societies
Project/programme monitoring and evaluation guide
A particularly important consideration in planning for reporting is the distinction between internal and external reporting (see Box 20 on page 60). Internal reporting is conducted to enable actual project/programme implementation; it plays a more crucial role in lesson learning to facilitate decision-making – and, ulti-mately, what can be extracted and reported externally. External reporting is conducted to inform stakeholders outside the project/programme team and implementing organization; this is important for accountability.
Day-to-day operations depend upon a regular and reliable flow of information. Therefore, special attention should be given to the informational needs of the project/programme managers. They will need timely information to analyse project/programme progress and critical issues, make planning decisions and prepare progress reports for multiple audiences, e.g. superiors and donors. In turn, project-level reports provide essential information for programme man-agers and country directors to compare planned actions with actual perfor-mance and budget.
Warning
Reporting should limit itself only to what is necessary and suffi-cient for its intended purpose. The deci-sions made about what to report on will have an “ex-ponent ia l ” ef fect that can increase the workload on the whole M&E system and the overall pro-j e c t / p r o g r a m m e capacity because it deter mines t ime, people and resources needed to collect, manage and analyse data for reporting. Informat ion over-load st r a i ns t he project/programme team’s capacity and can actually burden the f low (effective-ness) of informa-tion. This distracts not only resources but also attention away from the more relevant and useful information. Extra information is more often a burden than a luxury.
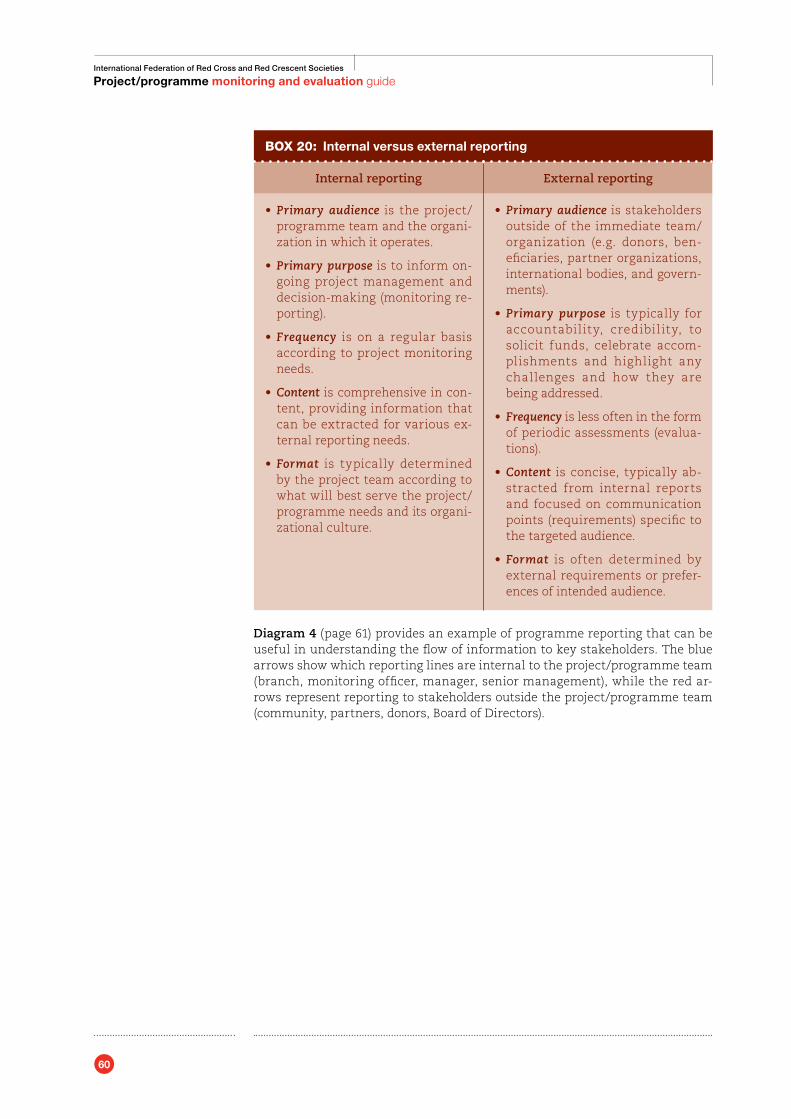
60
International Federation of Red Cross and Red Crescent Societies
Project/programme monitoring and evaluation guide
Box 20: Internal versus external reporting
Internal reporting External reporting
• Primary audience is the project/programme team and the organi-zation in which it operates.
• Primary purpose is to inform on-going project management and decision-making (monitoring re-porting).
• Frequency is on a regular basis according to project monitoring needs.
•Content is comprehensive in con-tent, providing information that can be extracted for various ex-ternal reporting needs.
• Format is typically determined by the project team according to what will best serve the project/programme needs and its organi-zational culture.
• Primary audience is stakeholders outside of the immediate team/organization (e.g. donors, ben-eficiaries, partner organizations, international bodies, and govern-ments).
• Primary purpose is typically for accountability, credibility, to solicit funds, celebrate accom-plishments and highlight any challenges and how they are being addressed.
• Frequency is less often in the form of periodic assessments (evalua-tions).
•Content is concise, typically ab-stracted from internal reports and focused on communication points (requirements) specific to the targeted audience.
• Format is often determined by external requirements or prefer-ences of intended audience.
Diagram 4 (page 61) provides an example of programme reporting that can be useful in understanding the flow of information to key stakeholders. The blue arrows show which reporting lines are internal to the project/programme team (branch, monitoring officer, manager, senior management), while the red ar-rows represent reporting to stakeholders outside the project/programme team (community, partners, donors, Board of Directors).
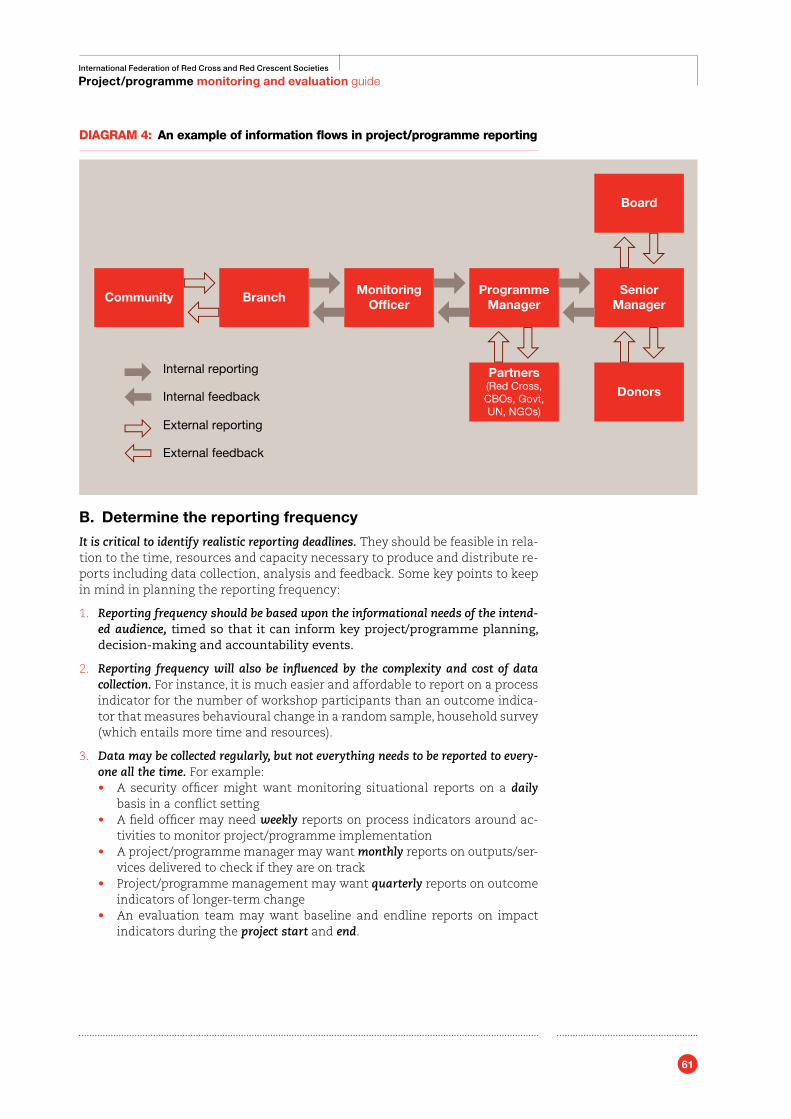
61
International Federation of Red Cross and Red Crescent Societies
Project/programme monitoring and evaluation guide
DIAGRAM 4: An example of information flows in project/programme reporting
B. Determine the reporting frequency
It is critical to identify realistic reporting deadlines. They should be feasible in rela-tion to the time, resources and capacity necessary to produce and distribute re-ports including data collection, analysis and feedback. Some key points to keep in mind in planning the reporting frequency:
1. Reporting frequency should be based upon the informational needs of the intend-ed audience, timed so that it can inform key project/programme planning, decision-making and accountability events.
2. Reporting frequency will also be influenced by the complexity and cost of data collection. For instance, it is much easier and affordable to report on a process indicator for the number of workshop participants than an outcome indica-tor that measures behavioural change in a random sample, household survey (which entails more time and resources).
3. Data may be collected regularly, but not everything needs to be reported to every-one all the time. For example:• A security officer might want monitoring situational reports on a daily
basis in a conflict setting• A field officer may need weekly reports on process indicators around ac-
tivities to monitor project/programme implementation• A project/programme manager may want monthly reports on outputs/ser-
vices delivered to check if they are on track• Project/programme management may want quarterly reports on outcome
indicators of longer-term change• An evaluation team may want baseline and endline reports on impact
indicators during the project start and end.
Internal reporting
Internal feedback
Community BranchMonitoring
OfficerProgramme
ManagerSenior
Manager
Donors
Partners(Red Cross,CBOs, Govt,UN, NGOs)
Board
External reporting
External feedback
62
International Federation of Red Cross and Red Crescent Societies
Project/programme monitoring and evaluation guide
C. Determine specific reporting formats
Once the reporting audience (who), purpose (why) and timing (when) have been identified, it is then important to determine the key reporting formats that are most appropriate for the intended user(s). This can vary from written docu-ments to video presentations posted on the internet. Sometimes the reporting format must adhere to strict requirements, while at other times there can be more flexibility.
The IFRC has defined reporting templates for many technical areas, as well as for many donor reports and communications, with related links to the donor reporting web pages. Box 21 summarizes different types of reports (and for-mats) that may be used for reporting, and below we specifically discuss a recommended IFRC format for a project/programme management report.
Box 21: Example reporting formats
• Project management reports (Annex 19)
•Evaluation reports
• Programme updates, mid-year and annual reports
•Operational updates
•Donor-specific reports (e.g. ECHO)
•Situation reports, e.g. FACT reports, infor-mation bulletin, secu-rity updates, etc.
•Activity/event reports
•Memos
• Pictures/videos
•Brochure, pamphlets, handouts, posters
•Newsletters, bulletins
• Professional perfor-mance reports (of an individual staff member or volunteer, etc.)
• Press releases
• Public presentations – conferences or com-munity meetings
•Success stories, case studies
• Popular publications, e.g. magazine, news-paper, or web site
•Scientific publications in a referred article, paper or book
Resources
Refer to the IFRC’s pro-gramme/sector areas section in Annex 2 for resources specific to technical focus.
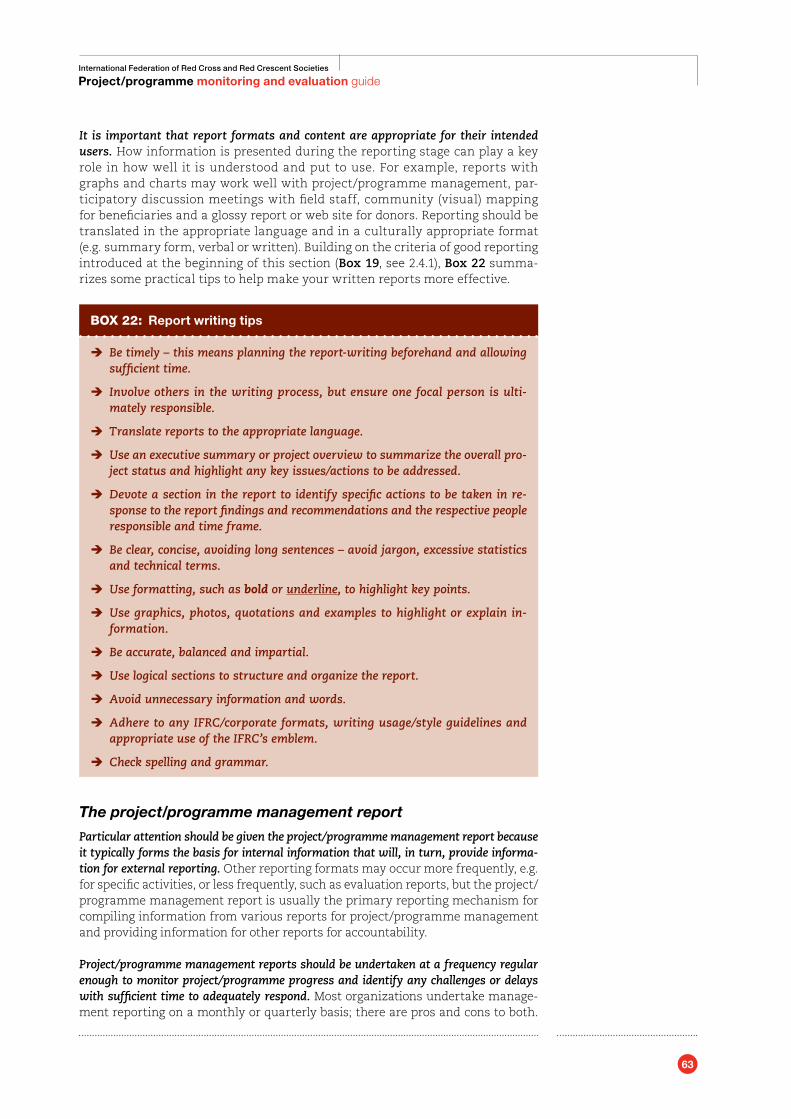
63
International Federation of Red Cross and Red Crescent Societies
Project/programme monitoring and evaluation guide
It is important that report formats and content are appropriate for their intended users. How information is presented during the reporting stage can play a key role in how well it is understood and put to use. For example, reports with graphs and charts may work well with project/programme management, par-ticipatory discussion meetings with field staff, community (visual) mapping for beneficiaries and a glossy report or web site for donors. Reporting should be translated in the appropriate language and in a culturally appropriate format (e.g. summary form, verbal or written). Building on the criteria of good reporting introduced at the beginning of this section (Box 19, see 2.4.1), Box 22 summa-rizes some practical tips to help make your written reports more effective.
Box 22: Report writing tips
Î Be timely – this means planning the report-writing beforehand and allowing sufficient time.
Î Involve others in the writing process, but ensure one focal person is ulti-mately responsible.
Î Translate reports to the appropriate language.
Î Use an executive summary or project overview to summarize the overall pro-ject status and highlight any key issues/actions to be addressed.
Î Devote a section in the report to identify specific actions to be taken in re-sponse to the report findings and recommendations and the respective people responsible and time frame.
Î Be clear, concise, avoiding long sentences – avoid jargon, excessive statistics and technical terms.
Î Use formatting, such as bold or underline, to highlight key points.
Î Use graphics, photos, quotations and examples to highlight or explain in-formation.
Î Be accurate, balanced and impartial.
Î Use logical sections to structure and organize the report.
Î Avoid unnecessary information and words.
Î Adhere to any IFRC/corporate formats, writing usage/style guidelines and appropriate use of the IFRC’s emblem.
Î Check spelling and grammar.
The project/programme management report
Particular attention should be given the project/programme management report because it typically forms the basis for internal information that will, in turn, provide informa-tion for external reporting. Other reporting formats may occur more frequently, e.g. for specific activities, or less frequently, such as evaluation reports, but the project/programme management report is usually the primary reporting mechanism for compiling information from various reports for project/programme management and providing information for other reports for accountability. Project/programme management reports should be undertaken at a frequency regular enough to monitor project/programme progress and identify any challenges or delays with sufficient time to adequately respond. Most organizations undertake manage-ment reporting on a monthly or quarterly basis; there are pros and cons to both.
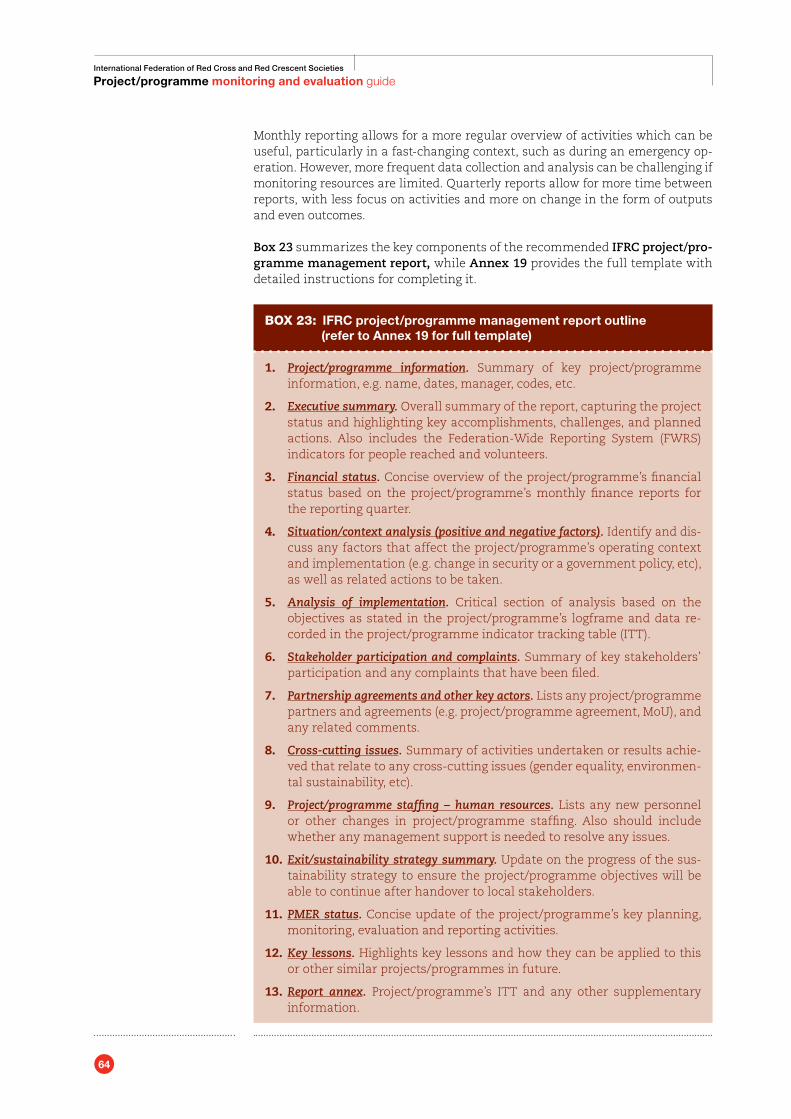
64
International Federation of Red Cross and Red Crescent Societies
Project/programme monitoring and evaluation guide
Monthly reporting allows for a more regular overview of activities which can be useful, particularly in a fast-changing context, such as during an emergency op-eration. However, more frequent data collection and analysis can be challenging if monitoring resources are limited. Quarterly reports allow for more time between reports, with less focus on activities and more on change in the form of outputs and even outcomes. Box 23 summarizes the key components of the recommended IFRC project/pro-gramme management report, while Annex 19 provides the full template with detailed instructions for completing it.
Box 23: IFRC project/programme management report outline (refer to Annex 19 for full template)
1. Project/programme information. Summary of key project/programme information, e.g. name, dates, manager, codes, etc.
2. Executive summary. Overall summary of the report, capturing the project status and highlighting key accomplishments, challenges, and planned actions. Also includes the Federation-Wide Reporting System (FWRS) indicators for people reached and volunteers.
3. Financial status. Concise overview of the project/programme’s financial status based on the project/programme’s monthly finance reports for the reporting quarter.
4. Situation/context analysis (positive and negative factors). Identify and dis-cuss any factors that affect the project/programme’s operating context and implementation (e.g. change in security or a government policy, etc), as well as related actions to be taken.
5. Analysis of implementation. Critical section of analysis based on the objectives as stated in the project/programme’s logframe and data re-corded in the project/programme indicator tracking table (ITT).
6. Stakeholder participation and complaints. Summary of key stakeholders’ participation and any complaints that have been filed.
7. Partnership agreements and other key actors. Lists any project/programme partners and agreements (e.g. project/programme agreement, MoU), and any related comments.
8. Cross-cutting issues. Summary of activities undertaken or results achie-ved that relate to any cross-cutting issues (gender equality, environmen-tal sustainability, etc).
9. Project/programme staffing – human resources. Lists any new personnel or other changes in project/programme staffing. Also should include whether any management support is needed to resolve any issues.
10. Exit/sustainability strategy summary. Update on the progress of the sus-tainability strategy to ensure the project/programme objectives will be able to continue after handover to local stakeholders.
11. PMER status. Concise update of the project/programme’s key planning, monitoring, evaluation and reporting activities.
12. Key lessons. Highlights key lessons and how they can be applied to this or other similar projects/programmes in future.
13. Report annex. Project/programme’s ITT and any other supplementary information.
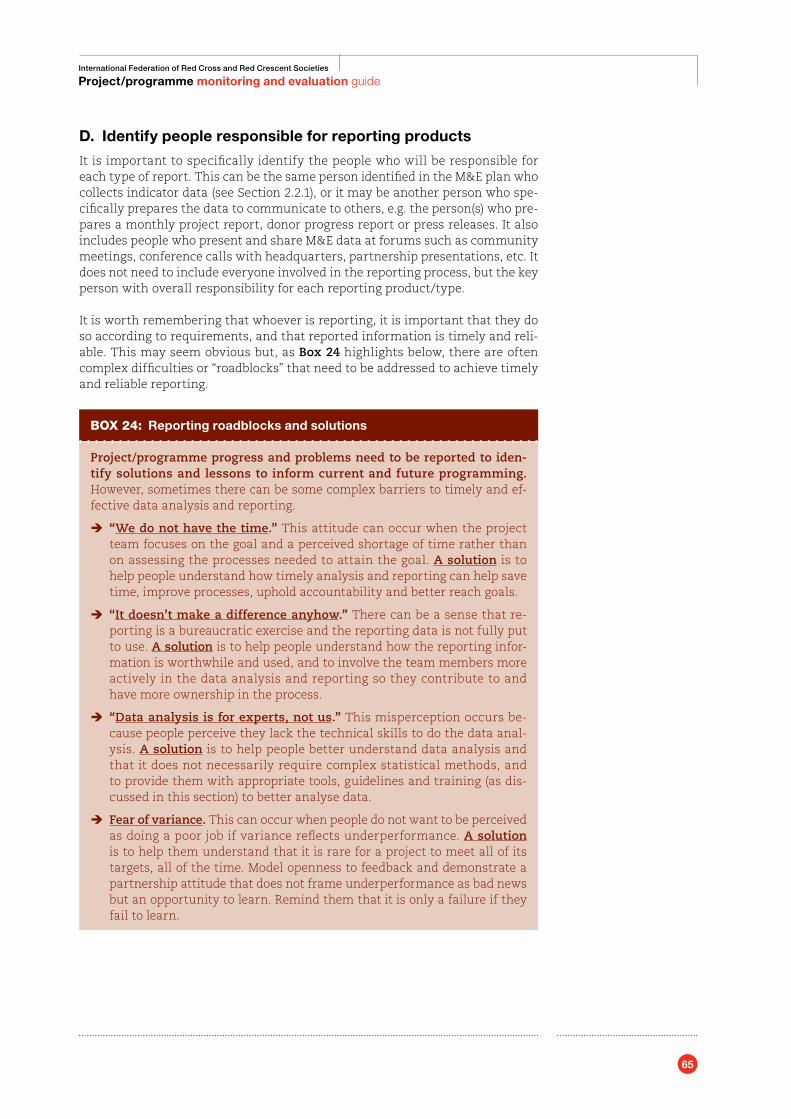
65
International Federation of Red Cross and Red Crescent Societies
Project/programme monitoring and evaluation guide
D. Identify people responsible for reporting products
It is important to specifically identify the people who will be responsible for each type of report. This can be the same person identified in the M&E plan who collects indicator data (see Section 2.2.1), or it may be another person who spe-cifically prepares the data to communicate to others, e.g. the person(s) who pre-pares a monthly project report, donor progress report or press releases. It also includes people who present and share M&E data at forums such as community meetings, conference calls with headquarters, partnership presentations, etc. It does not need to include everyone involved in the reporting process, but the key person with overall responsibility for each reporting product/type.
It is worth remembering that whoever is reporting, it is important that they do so according to requirements, and that reported information is timely and reli-able. This may seem obvious but, as Box 24 highlights below, there are often complex difficulties or “roadblocks” that need to be addressed to achieve timely and reliable reporting.
Box 24: Reporting roadblocks and solutions
Project/programme progress and problems need to be reported to iden-tify solutions and lessons to inform current and future programming. However, sometimes there can be some complex barriers to timely and ef-fective data analysis and reporting.
Î “We do not have the time.” This attitude can occur when the project team focuses on the goal and a perceived shortage of time rather than on assessing the processes needed to attain the goal. A solution is to help people understand how timely analysis and reporting can help save time, improve processes, uphold accountability and better reach goals.
Î “It doesn’t make a difference anyhow.” There can be a sense that re-porting is a bureaucratic exercise and the reporting data is not fully put to use. A solution is to help people understand how the reporting infor-mation is worthwhile and used, and to involve the team members more actively in the data analysis and reporting so they contribute to and have more ownership in the process.
Î “Data analysis is for experts, not us.” This misperception occurs be-cause people perceive they lack the technical skills to do the data anal-ysis. A solution is to help people better understand data analysis and that it does not necessarily require complex statistical methods, and to provide them with appropriate tools, guidelines and training (as dis-cussed in this section) to better analyse data.
Î Fear of variance. This can occur when people do not want to be perceived as doing a poor job if variance reflects underperformance. A solution is to help them understand that it is rare for a project to meet all of its targets, all of the time. Model openness to feedback and demonstrate a partnership attitude that does not frame underperformance as bad news but an opportunity to learn. Remind them that it is only a failure if they fail to learn.

66
International Federation of Red Cross and Red Crescent Societies
Project/programme monitoring and evaluation guide
2.4.2 Plan for information utilizationThe overall purpose of the M&E system is to provide useful information. Therefore, information utilization should not be an afterthought, but a central planning consideration. For this reason, identifying stakeholder informational needs (initially discussed in M&E planning Step 1, Section 2.1) has been a recur-ring topic throughout all M&E planning steps.
Box 25 summarizes four primary ways in which M&E information is used. There are many factors that determine the use of information. First are the actual se-lection, collection and transformation of data into usable information, which has been the topic of this guide so far. Ideally, this process produces informa-tion that is relevant, timely, complete, consistent, reliable and user-friendly (see Box 19, Section 2.4.1). The remainder of this section will briefly look at key con-siderations for information distribution, decision-making and planning.
Box 25: Key categories of information use
Î Project/programme management – inform decisions to guide and improve ongoing project/programme implementation.
Î Learning and knowledge-sharing – advance organizational learning and knowledge-sharing for future programming, both within and external to the project/programme’s implementing organization.
Î Accountability and compliance – demonstrating how and what work has been completed, and whether it was according to any specific donor or legal re-quirements, as well as to the IFRC and others’ international standards.
Î Celebration and advocacy – highlight and promote accomplishments and achievements, building morale and contributing to resource mobilization.
A. Information dissemination
Information dissemination refers to how information (reports) is distributed to users. This can be seen as part of reporting, but we use dissemination here to mean the distribution of the information (reports) rather than the actual prepa-ration of the information into a report.
There is a variety of mediums to share information, and as with the reporting formats themselves, how reporting information is disseminated will largely depend on the user and purpose of information. Box 26 summarizes some dif-ferent mediums for sharing information.
Box 26: Key mediums of information dissemination
1. Print materials distributed through mail or in person.
2. Internet communication, e.g. e-mail (and attachments), web sites, blogs, etc
3. Radio communication includes direct person-to-person radio (ham radio), as well as broadcasting radio.
4. Telephone communication includes voice calls, text-messaging, as well as other functions enabled on a mobile phone.
5. Television and filmed presentations.
6. Live presentations, such as project/programme team meetings and public meetings.
67
International Federation of Red Cross and Red Crescent Societies
Project/programme monitoring and evaluation guide
Selection of the reporting medium should be guided by what is most efficient in time and resources, and suitable for the audience – a process that should ideally be completed with a reporting schedule (see Annex 18). For instance:
Ô An internet-based reporting system may be best for communication between a project/programme management team and its headquarters.
Ô Community meetings may be appropriate to report on data to beneficiaries who lack access to computers or are illiterate.
Ô Mobile phone texting may be most timely and efficient for volunteers to re-port on safety conditions from the field.
It is also important to remember that information dissemination should be multi-directional. This means that in addition to distributing information upwards to management, senior management and donors, information flows should also be directed to field staff, partners and the beneficiaries themselves.
Another important consideration when distributing information is the security of internal or confidential information. As discussed with data management (see Section 2.2.10), precautions should be taken to protect assess to confidential information.
B. Decision-making and planning
Decision-making and planning really form the heart of data utilization. But no matter how well the information is prepared or disseminated, it will ultimately be up to the user to decide when and how to put it to use. This is where M&E planning merges with project/programme management, and the manner in which decisions are made and information is used will vary according to project/programme, context and organizational culture. However, while in-formation use is largely in the area of project/programme and organizational management, there are two key considerations that can aid the use of informa-tion in decision-making and planning:
1. Stakeholder dialogue. Stakeholder discussion and feedback on information is critical for building understanding and ownership, and informing the appro-priate response. This process can begin during the analysis, review and revi-sion of reporting information, and can correspond with information dissemi-nation outlets, such as meetings, seminars and workshops, web-based forums, teleconferences and/or organizational reporting and follow-up procedures.
For instance, the findings of an evaluation report are more likely to be un-derstood and used if they are not limited to a printed report, but presented to key stakeholders in a face-to-face forum that allows them to reflect and give feedback. Ideally, this can be done before the final draft of the report to confirm key lessons and inform realistic recommendations.
2. Management response. Specific procedures for documenting and responding to information findings and recommendations (often called “management re-sponse”) should be built into the project/programme management system. At the project/programme level, this can be a management action plan with clear responses to key issues identified in a management or evaluation report. This should specifically explain what actions will be taken, including their time frame and responsibilities; it should also explain why any recommenda-tion or identified issue may not be addressed. Follow-up should be systematic and monitored and reported on in a reliable, timely and public manner.
There is a variety of tools to support action planning and follow-up. Annex 20 presents three examples of tables (also called “logs”) for recording key items
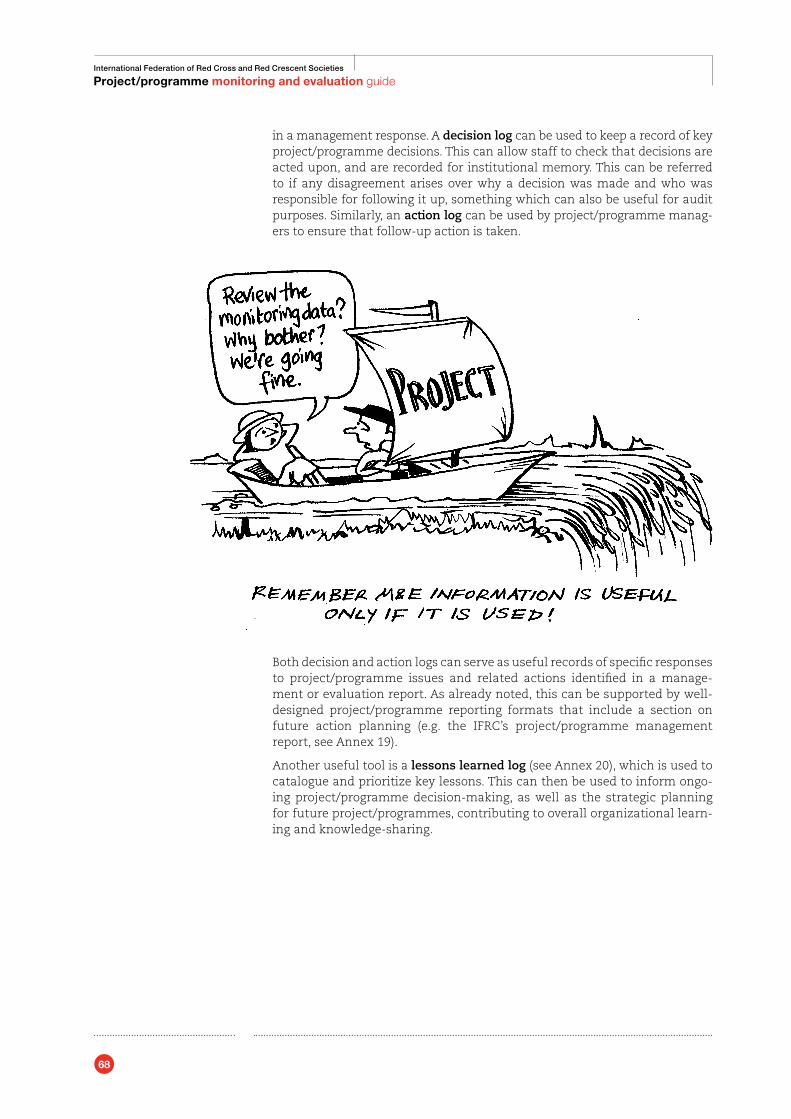
68
International Federation of Red Cross and Red Crescent Societies
Project/programme monitoring and evaluation guide
in a management response. A decision log can be used to keep a record of key project/programme decisions. This can allow staff to check that decisions are acted upon, and are recorded for institutional memory. This can be referred to if any disagreement arises over why a decision was made and who was responsible for following it up, something which can also be useful for audit purposes. Similarly, an action log can be used by project/programme manag-ers to ensure that follow-up action is taken.
Both decision and action logs can serve as useful records of specific responses to project/programme issues and related actions identified in a manage-ment or evaluation report. As already noted, this can be supported by well- designed project/programme reporting formats that include a section on future action planning (e.g. the IFRC’s project/programme management report, see Annex 19).
Another useful tool is a lessons learned log (see Annex 20), which is used to catalogue and prioritize key lessons. This can then be used to inform ongo-ing project/programme decision-making, as well as the strategic planning for future project/programmes, contributing to overall organizational learn-ing and knowledge-sharing.
69
International Federation of Red Cross and Red Crescent Societies
Project/programme monitoring and evaluation guide
2.5 STEP 5 – Plan for M&E human resources and capacity buildingAn effective M&E system requires capable people to support it. While the M&E plan identifies responsibilities for the data collection on each indicator, it is also important to plan for the people responsible for M&E processes, including data management, analysis, reporting and M&E training. This section summarizes key considerations in planning for the human resources and capacity building for a project/programme’s M&E system.
2.5.1 Assess the projects/programme’s human resources capacity for M&EA first step in planning for M&E human resources is to determine the available M&E experience within the project/programme team, partner organizations, target communities and any other potential participants in the M&E system. It is important to identify any gaps between the project/programme’s M&E needs (see Step 1, Section 2.1) and available personnel, which will inform the need for capacity building or outside expertise.
Key questions to guide this process include:
Ô Is there existing M&E expertise among the project/programme team? How does this match with the M&E needs of the project/programme?
Ô Is there M&E support from the organization implementing the project/pro-gramme? For instance, is there a technical unit or individuals assigned with M&E responsibilities to advise and support staff, and if so, what is their avail-ability for the specific project/programme?
Ô Do the target communities (or certain members) and other project/pro-gramme partners have any experience in M&E?
It can be useful to refer to the discussions about the M&E stakeholder assess-ment (Section 2.1.2) and the M&E activity planning (Section 2.1.4) to guide this process. When available, any larger organizational assessment that has in-cluded M&E should be referred to for projects/programmes belonging to the organization. For example, the IFRC’s secretariat offers a planning, monitoring, evaluation and reporting assessment tool for National Societies and project/programme teams, which can help assess the institutional understanding and practice of M&E for an implementing National Society or for the project/pro-gramme team itself.30
2.5.2 Determine the extent of local participationIdeally, data collection and analysis is undertaken with the very people to whom these processes and decisions most relate. This is an important principle for the Movement (see Box 27 next page), which prioritizes the involvement of local volunteers and communities. Often, local participation in M&E is expected or required, and building local capacity to sustain the project/programme is iden-tified as a key objective of the project/programme itself.
30 Refer to the IFRC-PAD M&E Capacity Assessment Tool.
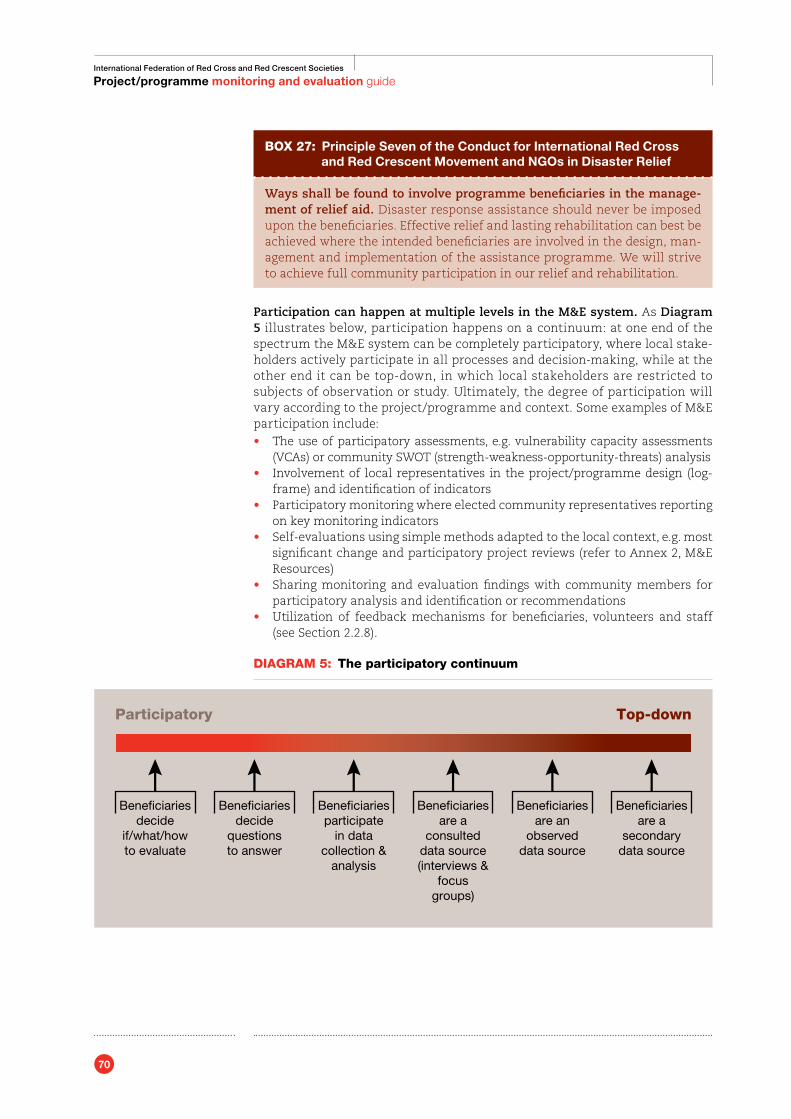
70
International Federation of Red Cross and Red Crescent Societies
Project/programme monitoring and evaluation guide
Box 27: Principle Seven of the Conduct for International Red Cross and Red Crescent Movement and NGOs in Disaster Relief
Ways shall be found to involve programme beneficiaries in the manage-ment of relief aid. Disaster response assistance should never be imposed upon the beneficiaries. Effective relief and lasting rehabilitation can best be achieved where the intended beneficiaries are involved in the design, man-agement and implementation of the assistance programme. We will strive to achieve full community participation in our relief and rehabilitation.
Participation can happen at multiple levels in the M&E system. As Diagram 5 illustrates below, participation happens on a continuum: at one end of the spectrum the M&E system can be completely participatory, where local stake-holders actively participate in all processes and decision-making, while at the other end it can be top-down, in which local stakeholders are restricted to subjects of observation or study. Ultimately, the degree of participation will vary according to the project/programme and context. Some examples of M&E participation include:• The use of participatory assessments, e.g. vulnerability capacity assessments
(VCAs) or community SWOT (strength-weakness-opportunity-threats) analysis • Involvement of local representatives in the project/programme design (log-
frame) and identification of indicators• Participatory monitoring where elected community representatives reporting
on key monitoring indicators• Self-evaluations using simple methods adapted to the local context, e.g. most
significant change and participatory project reviews (refer to Annex 2, M&E Resources)
• Sharing monitoring and evaluation findings with community members for participatory analysis and identification or recommendations
• Utilization of feedback mechanisms for beneficiaries, volunteers and staff (see Section 2.2.8).
DIAGRAM 5: The participatory continuum
Bene�ciariesdecide
if/what/howto evaluate
Bene�ciariesdecide
questionsto answer
Bene�ciariesparticipate
in datacollection &
analysis
Bene�ciariesare a
consulteddata source(interviews &
focusgroups)
Bene�ciariesare an
observeddata source
Bene�ciariesare a
secondarydata source
Participatory Top-down
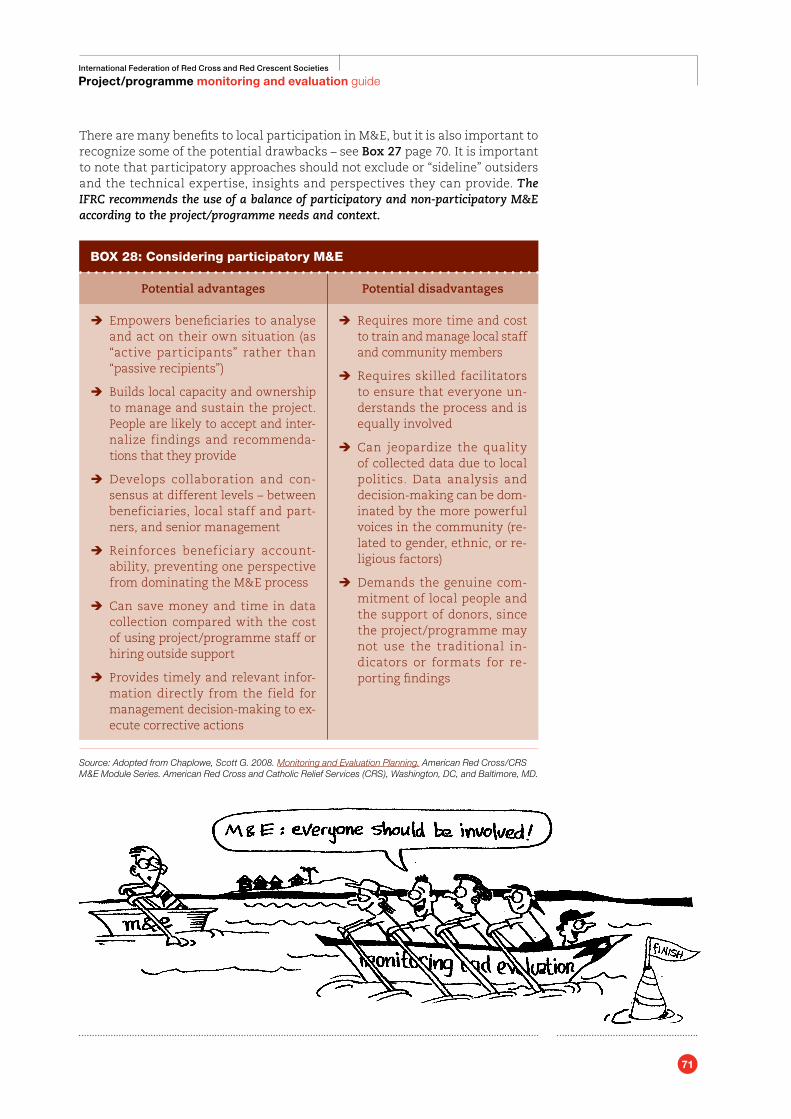
71
International Federation of Red Cross and Red Crescent Societies
Project/programme monitoring and evaluation guide
There are many benefits to local participation in M&E, but it is also important to recognize some of the potential drawbacks – see Box 27 page 70. It is important to note that participatory approaches should not exclude or “sideline” outsiders and the technical expertise, insights and perspectives they can provide. The IFRC recommends the use of a balance of participatory and non-participatory M&E according to the project/programme needs and context.
Box 28: Considering participatory M&E
Potential advantages Potential disadvantages
Î Empowers beneficiaries to analyse and act on their own situation (as “active participants” rather than “passive recipients”)
Î Builds local capacity and ownership to manage and sustain the project. People are likely to accept and inter-nalize findings and recommenda-tions that they provide
Î Develops collaboration and con-sensus at different levels – between beneficiaries, local staff and part-ners, and senior management
Î Reinforces beneficiary account-ability, preventing one perspective from dominating the M&E process
Î Can save money and time in data collection compared with the cost of using project/programme staff or hiring outside support
Î Provides timely and relevant infor-mation directly from the field for management decision-making to ex-ecute corrective actions
Î Requires more time and cost to train and manage local staff and community members
Î Requires skilled facilitators to ensure that everyone un-derstands the process and is equally involved
Î Can jeopardize the quality of collected data due to local politics. Data analysis and decision-making can be dom-inated by the more powerful voices in the community (re-lated to gender, ethnic, or re-ligious factors)
Î Demands the genuine com-mitment of local people and the support of donors, since the project/programme may not use the traditional in-dicators or formats for re-porting findings
Source: Adopted from Chaplowe, Scott G. 2008. Monitoring and Evaluation Planning. American Red Cross/CRS M&E Module Series. American Red Cross and Catholic Relief Services (CRS), Washington, DC, and Baltimore, MD.
72
International Federation of Red Cross and Red Crescent Societies
Project/programme monitoring and evaluation guide
2.5.3 Determine the extent of outside expertiseOutside specialists (consultants) are usually employed for technical expertise, objec-tivity and credibility, to save time and/or as a donor requirement. Clearly, and espe-cially for external evaluators, experience, reliability and credibility are essential when considering whether or not to use outside expertise.
Examples of when outside expertise is used include:• For the independent, final evaluation of all secretariat-funded projects/
programmes exceeding 1,000,000 Swiss francs (in accordance with the IFRC’s management policy for evaluations)
• As part of a joint, real-time evaluation for a disaster response operation involv-ing the IFRC, OCHA (United Nations’ Office for the Coordination of Humanitar-ian Affairs) and other participating partners, such as CARE International
• To administer random samples for household surveys during a baseline or endline study
• For project/programme data entry and statistical analysis• For the translation of project/programme documents.
Sometimes, a project/programme or implementing organization may need to hire a specific person to oversee M&E processes – e.g. an M&E officer or advisor. Annex 20 provides an example of an M&E job description and the following summarizes key steps in the hiring process:31
1. Identify M&E needs for the staff position2. Create a job description 3. Establish a hiring committee and outline the hiring process 4. Advertise for the position 5. Sort, short-list, and pre-screen applicants 6. Interview the candidates 7. Hire and train new staff.
2.5.4 Define the roles and responsibilities for M&EIt is important to have well-defined roles and responsibilities at each level of the M&E system. The M&E plan (Step 2, Section 2.2) identifies people responsible for the specific collection of data on each indicator, but there are other respon-sibilities throughout the M&E system, from data management and analysis to reporting and feedback. This will ultimately depend on the scope of the pro-ject/programme and what systems are already in place within the project/pro-gramme and/or the implementing organization (see Section 2.1.4).
Typically, there is a wide range of people with some kind of monitoring respon-sibilities within their job descriptions – including not only project/programme staff but maybe volunteers, community members and other partners. When identifying roles and responsibilities for M&E it is worth considering using the M&E stakeholder assessment table (Annex 6 and discussed in Step 1 – Section 2.1), or an organizational diagram for the project/programme (with accompa-nying text). Specific consideration should be given to the M&E qualifications and expectations, including the approximate percentage of time each person is expected to allocate to M&E. This will help with practical work planning, as well as in the preparation of project/programme job descriptions and terms of reference (ToR).
One key planning consideration is who will have overall management responsi-bility for the M&E system. It is important to clearly identify who will be the primary resource person that others, internal and external to the project/programme, will turn to for M&E guidance and accountability. This person
31 Source: Hagens, Clara, 2008. Hiring M&E Staff. American Red Cross/CRS M&E Module Series. American Red Cross and Catholic Relief Services (CRS), Washington, DC, and Baltimore, MD.
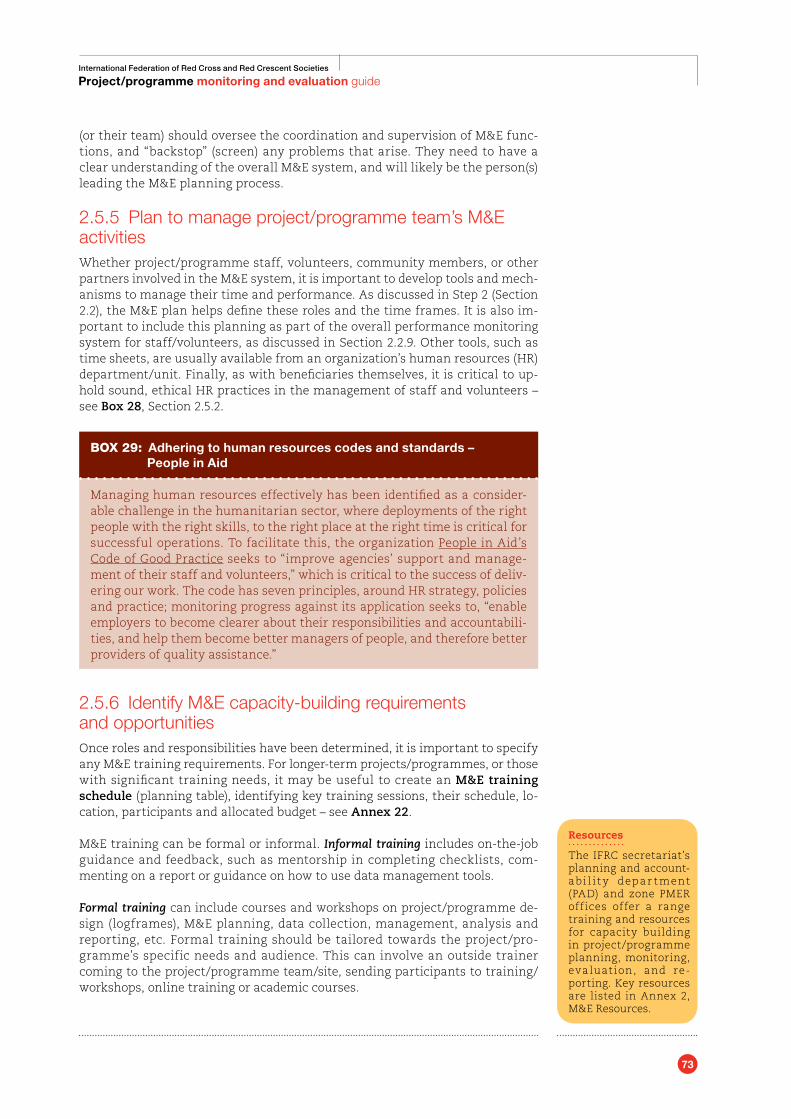
73
International Federation of Red Cross and Red Crescent Societies
Project/programme monitoring and evaluation guide
(or their team) should oversee the coordination and supervision of M&E func-tions, and “backstop” (screen) any problems that arise. They need to have a clear understanding of the overall M&E system, and will likely be the person(s) leading the M&E planning process.
2.5.5 Plan to manage project/programme team’s M&E activitiesWhether project/programme staff, volunteers, community members, or other partners involved in the M&E system, it is important to develop tools and mech-anisms to manage their time and performance. As discussed in Step 2 (Section 2.2), the M&E plan helps define these roles and the time frames. It is also im-portant to include this planning as part of the overall performance monitoring system for staff/volunteers, as discussed in Section 2.2.9. Other tools, such as time sheets, are usually available from an organization’s human resources (HR) department/unit. Finally, as with beneficiaries themselves, it is critical to up-hold sound, ethical HR practices in the management of staff and volunteers – see Box 28, Section 2.5.2.
Box 29: Adhering to human resources codes and standards – People in Aid
Managing human resources effectively has been identified as a consider-able challenge in the humanitarian sector, where deployments of the right people with the right skills, to the right place at the right time is critical for successful operations. To facilitate this, the organization People in Aid’s Code of Good Practice seeks to “improve agencies’ support and manage-ment of their staff and volunteers,” which is critical to the success of deliv-ering our work. The code has seven principles, around HR strategy, policies and practice; monitoring progress against its application seeks to, “enable employers to become clearer about their responsibilities and accountabili-ties, and help them become better managers of people, and therefore better providers of quality assistance.”
2.5.6 Identify M&E capacity-building requirements and opportunitiesOnce roles and responsibilities have been determined, it is important to specify any M&E training requirements. For longer-term projects/programmes, or those with significant training needs, it may be useful to create an M&E training schedule (planning table), identifying key training sessions, their schedule, lo-cation, participants and allocated budget – see Annex 22.
M&E training can be formal or informal. Informal training includes on-the-job guidance and feedback, such as mentorship in completing checklists, com-menting on a report or guidance on how to use data management tools.
Formal training can include courses and workshops on project/programme de-sign (logframes), M&E planning, data collection, management, analysis and reporting, etc. Formal training should be tailored towards the project/pro-gramme’s specific needs and audience. This can involve an outside trainer coming to the project/programme team/site, sending participants to training/workshops, online training or academic courses.
Resources
The IFRC secretariat’s planning and account-abi l it y depar t ment (PAD) and zone PMER offices offer a range training and resources for capacity building in project/programme planning, monitoring, evaluat ion, and re-porting. Key resources are listed in Annex 2, M&E Resources.
74
International Federation of Red Cross and Red Crescent Societies
Project/programme monitoring and evaluation guide
2.6 STEP 6 – Prepare the M&E budgetIt is best to begin systematically planning the M&E budget early in the project/pro-gramme design process so that adequate funds are allocated and available for M&E activities. The following section summarizes key considerations for planning the project/programme’s M&E budget.
2.6.1 Itemize M&E budget needsIf the M&E planning has been approached systematically, identifying key steps and people involved, detailing budget items should be straightforward. Start by listing M&E tasks and associated costs. If a planning table for key M&E activities (see Section 2.1.4 and Annex 7) has been prepared, this can be used to guide the process. If there is a required format for itemizing budget items – e.g. within the implementing organization or from the donor – adhere to the format or an agreed-upon variation. Otherwise, prepare a spreadsheet clearly itemizing M&E expenses. It is particularly important to budget for any “big-ticket items”, such as baseline surveys and evaluations.
Examples of budget items include:• Human resources. Budget for staffing, including full-time staff, external con-
sultants, capacity building/training and other related expenses, e.g. transla-tion, data entry for baseline surveys, etc.
• Capital expenses. Budget for facility costs, office equipment and supplies, any travel and accommodation, computer hardware and software, printing, pub-lishing and distributing M&E documents, etc.
In addition to itemizing expenses in a spreadsheet, a narrative (description) jus-tifying each line item can help guard against unexpected budget cuts. It may be necessary to clarify or justify M&E expenses, such as wage rates not normally paid to comparable positions, fees for consultants and external experts, or the various steps in a survey that add up in cost (e.g. development and testing of a questionnaire, translation and back-translation, training in data collection, data collectors’ and field supervisors’ daily rates, travel/accommodation costs for administering the survey, data analysis and write-up, etc).
2.6.2 Incorporate M&E costs into the project/programme budgetCosts associated with regular project/programme monitoring and undertaking eval-uations should be included in the project/programme budget, rather than as part of the organization’s overhead (organizational development or administrative costs). Therefore, the true cost of a project/programme will be reflected in the budget. Otherwise, including M&E costs as an administrative or organizational devel-opment cost may incorrectly suggest inefficiencies in the project/programme and the implementing organization, with donors reluctant to cover such costs when in reality they are project-related costs. Ideally, financial systems should allow for activity-based costing where monitoring costs are linked to project/programme activities being monitored.
75
International Federation of Red Cross and Red Crescent Societies
Project/programme monitoring and evaluation guide
If the budget has already been completed with the project/programme proposal, determine whether there is a separate/appropriated budget for M&E purposes. Ongoing monitoring expenses may already be built into staff time and ex-penditure budgets for the overall project/programme operation, such as sup-port for an information management system, field transportation and vehicle maintenance, translation, and printing and publishing of M&E documents/tools. Certain M&E events, such as a baseline study or external evaluation, may not have been included in the overall project/programme budget because the budget was planned during the proposal preparation period, before the M&E system had been developed. In such instances it is critical to ensure that these M&E costs are added to the project/programme budget.
2.6.3 Review any donor budget requirements and contributionsIdentify any specific budgeting requirements or guidance from the funding agency or implementing organization. If multiple funding sources are utilized, ensure that the budget is broken down by donor source. Determine if there are any additional costs the donor(s) will or will not cover, such as required evalua-tions, baseline studies, etc. Check with the finance unit or officer to ensure the budget is prepared in the appropriate format.
2.6.4 Plan for cost contingencyContingency costs refer to unexpected costs that may arise during project/programme implementation – in this case the M&E system. It is important to plan for unex-pected contingencies such as inflation, currency devaluation, equipment theft or the need for additional data collection/analysis to verify findings. Although budget planning seeks to avoid these risks, unexpected expenses do arise.
Box 30: How much money should be allocated for M&E?
There is no set formula for determining the budget for a project/pro-gramme’s M&E system. During initial planning, it can be difficult to deter-mine this until more careful attention is given to specific M&E functions described in the following steps. However, an industry standard is that be-tween 3 and 10 per cent of a project/programme’s budget be allocated to M&E. A general rule of thumb is that the M&E budget should not be so small as to compromise the accuracy and credibility of results, but neither should it divert project/programme resources to the extent that programming is impaired. Sometimes certain M&E functions, especially monitoring, are included as part of the project/programme’s activities. Other functions, such as inde-pendent evaluations, should be specifically budgeted. The IFRC’s manage-ment policy for evaluations states that a dedicated budget line between 3 and 5 per cent should be included for all evaluations of interventions above 200,000 Swiss francs.32
32 Frankel, Nina and Gage, Anastasia for USAID (2007) M&E Fundamentals: A Self-Guided Minicourse: p. 11; The Global Fund (2009), Monitoring and Evaluation Toolkit: p. 42; UNICEF (2007), UNICEF Evaluation Policy: p. 8.
76
International Federation of Red Cross and Red Crescent Societies
Project/programme monitoring and evaluation guide
Valé
rie B
atse
laer
e/IF
RC
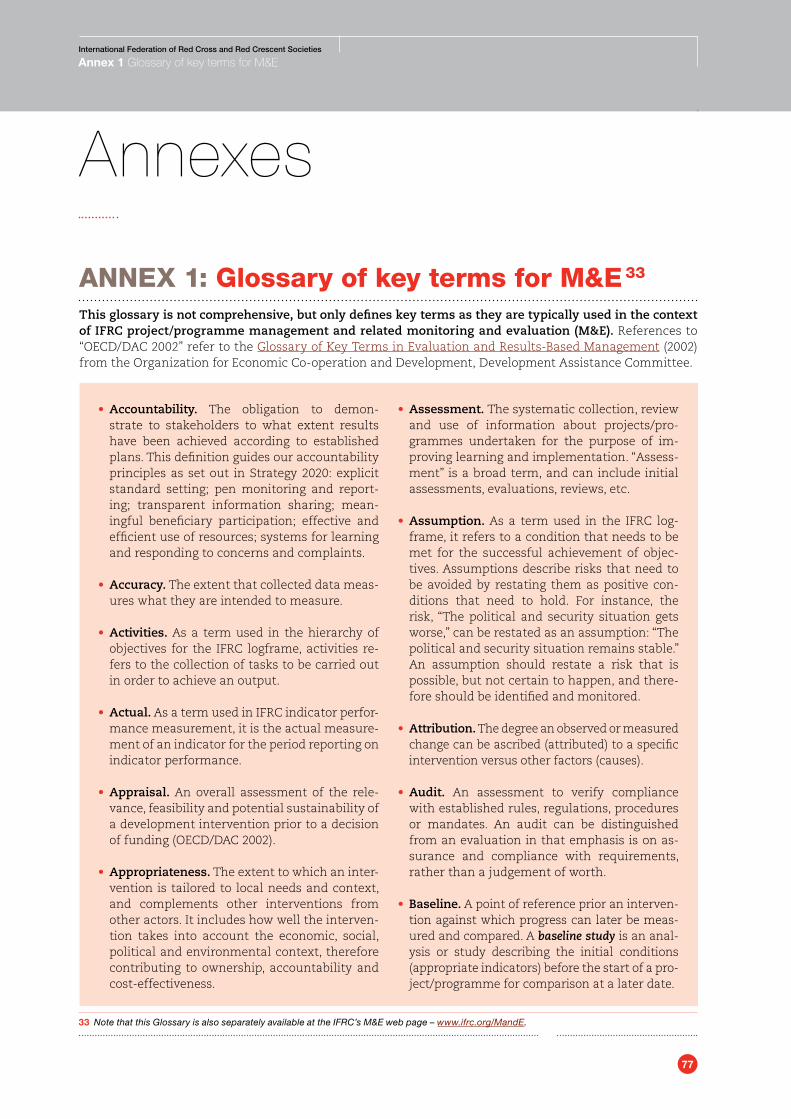
77
International Federation of Red Cross and Red Crescent Societies
Annex 1 Glossary of key terms for M&E
AnnEx 1: Glossary of key terms for M&E 33
This glossary is not comprehensive, but only defines key terms as they are typically used in the context of IFRC project/programme management and related monitoring and evaluation (M&E). References to “OECD/DAC 2002” refer to the Glossary of Key Terms in Evaluation and Results-Based Management (2002) from the Organization for Economic Co-operation and Development, Development Assistance Committee.
•Accountability. The obligation to demon-strate to stakeholders to what extent results have been achieved according to established plans. This definition guides our accountability principles as set out in Strategy 2020: explicit standard setting; pen monitoring and report-ing; transparent information sharing; mean-ingful beneficiary participation; effective and efficient use of resources; systems for learning and responding to concerns and complaints.
•Accuracy. The extent that collected data meas-ures what they are intended to measure.
•Activities. As a term used in the hierarchy of objectives for the IFRC logframe, activities re-fers to the collection of tasks to be carried out in order to achieve an output.
•Actual. As a term used in IFRC indicator perfor-mance measurement, it is the actual measure-ment of an indicator for the period reporting on indicator performance.
•Appraisal. An overall assessment of the rele-vance, feasibility and potential sustainability of a development intervention prior to a decision of funding (OECD/DAC 2002).
•Appropriateness. The extent to which an inter-vention is tailored to local needs and context, and complements other interventions from other actors. It includes how well the interven-tion takes into account the economic, social, political and environmental context, therefore contributing to ownership, accountability and cost-effectiveness.
•Assessment. The systematic collection, review and use of information about projects/pro-grammes undertaken for the purpose of im-proving learning and implementation. “Assess-ment” is a broad term, and can include initial assessments, evaluations, reviews, etc.
•Assumption. As a term used in the IFRC log-frame, it refers to a condition that needs to be met for the successful achievement of objec-tives. Assumptions describe risks that need to be avoided by restating them as positive con-ditions that need to hold. For instance, the risk, “The political and security situation gets worse,” can be restated as an assumption: “The political and security situation remains stable.” An assumption should restate a risk that is possible, but not certain to happen, and there-fore should be identified and monitored.
•Attribution. The degree an observed or measured change can be ascribed (attributed) to a specific intervention versus other factors (causes).
•Audit. An assessment to verify compliance with established rules, regulations, procedures or mandates. An audit can be distinguished from an evaluation in that emphasis is on as-surance and compliance with requirements, rather than a judgement of worth.
•Baseline. A point of reference prior an interven-tion against which progress can later be meas-ured and compared. A baseline study is an anal-ysis or study describing the initial conditions (appropriate indicators) before the start of a pro-ject/programme for comparison at a later date.
Annexes
33 Note that this Glossary is also separately available at the IFRC’s M&E web page – www.ifrc.org/MandE.
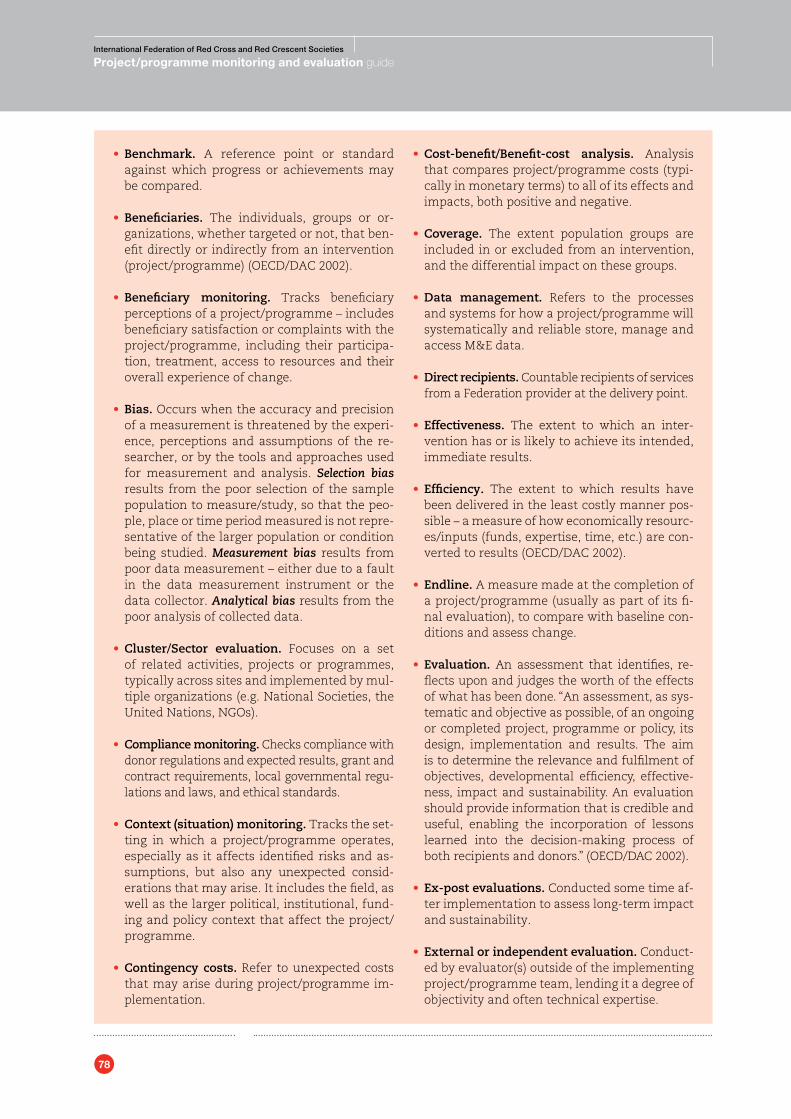
78
International Federation of Red Cross and Red Crescent Societies
Project/programme monitoring and evaluation guide
• Benchmark. A reference point or standard against which progress or achievements may be compared.
•Beneficiaries. The individuals, groups or or-ganizations, whether targeted or not, that ben-efit directly or indirectly from an intervention (project/programme) (OECD/DAC 2002).
•Beneficiary monitoring. Tracks beneficiary perceptions of a project/programme – includes beneficiary satisfaction or complaints with the project/programme, including their participa-tion, treatment, access to resources and their overall experience of change.
•Bias. Occurs when the accuracy and precision of a measurement is threatened by the experi-ence, perceptions and assumptions of the re-searcher, or by the tools and approaches used for measurement and analysis. Selection bias results from the poor selection of the sample population to measure/study, so that the peo-ple, place or time period measured is not repre-sentative of the larger population or condition being studied. Measurement bias results from poor data measurement – either due to a fault in the data measurement instrument or the data collector. Analytical bias results from the poor analysis of collected data.
•Cluster/Sector evaluation. Focuses on a set of related activities, projects or programmes, typically across sites and implemented by mul-tiple organizations (e.g. National Societies, the United Nations, NGOs).
• Compliance monitoring. Checks compliance with donor regulations and expected results, grant and contract requirements, local governmental regu-lations and laws, and ethical standards.
•Context (situation) monitoring. Tracks the set-ting in which a project/programme operates, especially as it affects identified risks and as-sumptions, but also any unexpected consid-erations that may arise. It includes the field, as well as the larger political, institutional, fund-ing and policy context that affect the project/programme.
•Contingency costs. Refer to unexpected costs that may arise during project/programme im-plementation.
•Cost-benefit/Benefit-cost analysis. Analysis that compares project/programme costs (typi-cally in monetary terms) to all of its effects and impacts, both positive and negative.
•Coverage. The extent population groups are included in or excluded from an intervention, and the differential impact on these groups.
•Data management. Refers to the processes and systems for how a project/programme will systematically and reliable store, manage and access M&E data.
• Direct recipients. Countable recipients of services from a Federation provider at the delivery point.
•Effectiveness. The extent to which an inter-vention has or is likely to achieve its intended, immediate results.
•Efficiency. The extent to which results have been delivered in the least costly manner pos-sible – a measure of how economically resourc-es/inputs (funds, expertise, time, etc.) are con-verted to results (OECD/DAC 2002).
•Endline. A measure made at the completion of a project/programme (usually as part of its fi-nal evaluation), to compare with baseline con-ditions and assess change.
•Evaluation. An assessment that identifies, re-flects upon and judges the worth of the effects of what has been done. “An assessment, as sys-tematic and objective as possible, of an ongoing or completed project, programme or policy, its design, implementation and results. The aim is to determine the relevance and fulfilment of objectives, developmental efficiency, effective-ness, impact and sustainability. An evaluation should provide information that is credible and useful, enabling the incorporation of lessons learned into the decision-making process of both recipients and donors.” (OECD/DAC 2002).
•Ex-post evaluations. Conducted some time af-ter implementation to assess long-term impact and sustainability.
•External or independent evaluation. Conduct-ed by evaluator(s) outside of the implementing project/programme team, lending it a degree of objectivity and often technical expertise.
79
International Federation of Red Cross and Red Crescent Societies
Annex 1 Glossary of key terms for M&E
•Final evaluation. A summative evaluation conducted (often externally) at the completion of project/programme implementation to as-sess how well the project/programme achieved its intended objectives.
•Financial monitoring. Tracks and accounts for costs by input and activity within predefined categories of expenditure.
•Formative evaluations. Occurs during project/programme implementation to improve per-formance and assess compliance.
•Generalizability. The extent to which findings can be assumed to be true for the entire target population, rather than just the sample popu-lation under study.
•Goal. As a term used in the hierarchy of objec-tives for the IFRC logframe, a goal refers to the long-term result that an intervention seeks to achieve (even if it may be beyond the scope of an individual project/programme to achieve on its own – e.g. a nutritional programme may contribute to the goal of community health, while other programmes, such as a malaria prevention programme, also contributes to community health).
•Host National Society (sometimes called an Operational National Society or ONS). The National Red Cross or Red Crescent Society in the country in which an intervention (project/programme) is implemented.
• Impact. The positive and negative, primary and secondary long-term effects produced by an intervention, directly or indirectly, intended or intended (OECD/DAC 2002).
• Impact evaluation. Focuses on the effect of a project/programme, rather than on its manage-ment and delivery. Therefore, they typically oc-cur after project/programme completion dur-ing a final evaluation or an ex-post evaluation.
• Independent evaluation. See “external evaluation”.
• Indicator. As a term used in the IFRC logframe, an indicator is a unit of measurement that helps determine what progress is being made towards the achievement of an intended result (objective).
• Indicator tracking table (ITT). A data man-agement tool for recording and monitoring indicator performance (targets, actual perfor-mance and percentage of target achieved) to inform project/programme implementation and management.
• Indirect recipients. Recipients that cannot be directly counted because they receive services apart from the provider and the delivery point.
• Information dissemination. Refers to how in-formation (reports) is distributed to users.
• Inputs. As a term used in the hierarchy of ob-jectives for the IFRC logframe, inputs refer to the financial, human and material resources needed to carry out activities.
• Internal or self-evaluation. Conducted by those responsible for implementing a project/programme, typically being more participatory and reinforcing ownership and understanding among the project/programme team.
• Joint evaluation. Conducted collaboratively by more than one implementing partner, and can help build consensus at different levels, cred-ibility and joint support.
•Logical framework (logframe). A table (matrix) summarizing a project/programme’s opera-tional design, including: the logical sequence of objectives to achieve the project/pro-gramme’s intended results (activities,outputs, outcomes and goal), the indicators and means of verification to measure these objectives, and any key assumptions.
•M&E plan. A table that builds upon a project/programme’s logframe to detail key M&E re-quirements for each indicator and assump-tion. Table columns typically summarize key indicator (measurement) information, includ-ing: a detailed definition of the data, its sourc-es, the methods and timing of its collection, the people responsible, and the intended audi-ence and use of the data.
•Meta-evaluation. Used to assess the evalu-ation process itself, such as: an inventory of evaluations to inform the selection of future evaluations; the synthesis of evaluation re-sults; checking compliance with evaluation
80
International Federation of Red Cross and Red Crescent Societies
Project/programme monitoring and evaluation guide
policy and good practices; assessing how well evaluations are disseminated and utilized for organizational learning and change, etc.
•Midterm evaluation. A formative evaluation that occurs midway through implementation.
•Monitoring. The routine collection and analy-sis of information to track progress against set plans and check compliance to established standards. It helps identify trends and pat-terns, adapt strategies and inform decisions for project/programme management.
•National Society paid staff. People who work with a National Society for a minimum of three months and are remunerated.
•Objective. As a term used in the IFRC logframe, objectives refer to the terms used in the left column of the logframe summarizing the key results (theory of change) that a project/pro-gramme seeks to achieve: inputs, activities, outputs, outcomes and goal.
•Organizational monitoring. Tracks the sus-tainability, institutional development and ca-pacity building in the project/programme and with its partners.
•Outcome. As a term used in the hierarchy of objectives for the IFRC logframe, outcomes refer to the primary results that lead to the achievement of the goal (most commonly in terms of the knowledge, attitudes or practices of the target group).
•Output. As a term used in the hierarchy of ob-jectives for the IFRC logframe, outputs are the tangible products, goods and services and oth-er immediate results that lead to the achieve-ment of outcomes.
•Participating National Society (PNS). A National Red Cross or Red Crescent Society that assists an intervention (project/pro-gramme) implemented in the country of a Host National Society (HNS).
•Participatory evaluations. Conducted with the beneficiaries and other key stakeholders, and can be empowering, building their capacity, ownership and support.
•People reached. Direct and indirect recipients and people covered by the IFRC’s services, sep-arated by service areas.
•Precision. The extent that data measurement can be repeated accurately and consistently over time and by different people.
• Primary data. Data is collected directly by the project/programme team or specifically commis-sioned to be collected for the project/programme.
•Problem analysis. Used to get an idea of the main problems and their causes, focusing on cause-effect relationships (often conducted with a problem tree).
•Process (activity) monitoring. Tracks the use of inputs and resources, the progress of activities and the delivery of outputs. It examines how activities are delivered – the efficiency in time and resources.
•Programme. A set of coordinated projects im-plemented to meet specific objectives within defined time, cost and performance parame- ters. Programmes aimed at achieving a com-mon goal are grouped under a common entity (country plan, operation, alliance, etc).
•Project. A set of coordinated activities imple-mented to meet specific objectives within de-fined time, cost and performance parameters. Projects aimed at achieving a common goal form a programme.
•Qualitative data/methods. Analyses and ex-plains what is being studied with words (doc-umented observations, representative case descriptions, perceptions, opinions of value, etc). Qualitative methods use semi-structured techniques (e.g. observations and interviews) to provide in-depth understanding of attitudes, beliefs, motives and behaviours. They tend to be more participatory and reflective in practice.
•Quantitative data/methods. Measures and ex-plains what is being studied with numbers (e.g. counts, ratios, percentages, proportions, aver-age scores, etc). Quantitative methods tend to use structured approaches (e.g. coded respons-es to surveys) that provide precise data that can be statistically analysed and replicated (copied) for comparison.
81
International Federation of Red Cross and Red Crescent Societies
Annex 1 Glossary of key terms for M&E
•Real-time evaluations (RTEs). These are under-taken during project/programme implementa-tion, typically during an emergency operation, to provide immediate feedback for modifica-tions to improve ongoing implementation.
•Relative. The extent to which an intervention is suited to the priorities of the target group (i.e. local population and donor). It also considers other approaches that may have been better suited to address the identified needs.
•Reporting. The process of providing analysed data as information for key stakeholders to use, i.e. for project/programme management, donor accountability, advocacy, etc. Inter-nal reporting is conducted to actual project/programme implementation; it plays a more crucial role in lesson learning to facilitate decision-making – and, ultimately, what can be extracted and reported externally. External reporting is conducted to inform stakeholders outside the project/programme team and im-plementing organization; this is important for accountability.
•Results. The effects of an intervention (project/programme), which can be intended or unin-tended, positive or negative. In the IFRC log-frame, the three highest levels of results are outputs, outcomes and goal.
•Results-based management (RBM). An ap-proach to project/programme management based on clearly defined results and the meth-odologies and tools to measure and achieve them.
•Results monitoring. Tracks the effects and impacts – determines any progress towards in-tended results (objectives) and whether there may be any unintended impact (positive or negative).
•Review. A structured opportunity for reflection to identify key issues and concerns, and make informed decisions for effective project/pro-gramme implementation.
•Risk analysis. An analysis or an assessment of factors (called assumptions in the logframe) that affect the successful achievement of an intervention’s objectives. A detailed examina-tion of the potential unwanted and negative
consequences to human life, health, property or the environment posed by development in-terventions (OECD/DAC 2002).
•Sample. A subset of a whole population se-lected to study and draw conclusions about the population as a whole. Sampling (the pro-cess of selecting a sample) is a critical aspect of planning the collection of primary data. Random (probability) samples are quantita-tively determined and use statistics to make more precise generalizations about the larger population. Purposeful (non-random) samples are qualitatively determined and do not use statistics; they often involve smaller, targeted samples of the population and are less statis-tically reliable for generalizations about the larger population.
•Sample frame. The list of every member of the population from which a sample is to be taken (e.g. the communities or categories of people – women, children, refugees, etc).
•Secondary data. Data that is not directly col-lected by and for the project/programme but which can nevertheless meet project/pro-gramme information needs.
•Secretariat paid staff. People who work with the secretariat for a minimum of three months and are remunerated.
•Source. The origin (i.e. people or documents) identified as the subject of inquiry for monitor-ing or evaluation.
•Stakeholder. A person or group of people with a direct or indirect role or interest in the objec-tives and implementation of an intervention (project/programme) and/or its evaluation.
•Stakeholder complaints and feedback analy-sis. A means for stakeholders to provide com-ment and voice complaints and feedback about services delivered.
•Summative evaluation. Occurs at the end of project/programme implementation to assess its effectiveness and impact.
•Sustainability. The degree to which the ben-efits of an intervention are likely to contin-ue once donor input has been withdrawn. It
82
International Federation of Red Cross and Red Crescent Societies
Project/programme monitoring and evaluation guide
includes environmental, institutional and fi-nancial sustainability.
• SWOT analysis. Conducted to assess the strengths, weaknesses, opportunities and threats of an organization, group or people (i.e. commu-nity), or an intervention (project/programme).
•Target. As a term used in IFRC indicator track-ing, a target is the intended measure (quantity) set to achieve an indicator.
•Target group/population. The specific individ-uals or organizations for whose benefit an in-tervention (project/programme) is undertaken.
•Terms of reference (ToR). Written document presenting the purpose and scope of the evalu-ation, the methods to be used, the standard against which performance is to be assessed or analyses are to be conducted, the resources and time allocated and reporting requirements (OECD/DAC 2002).
•Thematic evaluation. Focuses on one theme, such as gender or environment, typically across a number of projects, programmes or the whole organization.
•Total people covered. People that are targeted by a programme for which the benefit is not immediate but from which the target popula-tion can benefit if an adverse event occurs (e.g. early warning system).
•Triangulation. The process of using differ-ent sources and/or methods for data collec-tion. Combining different sources and methods
(mixed methods) helps to reduce bias and cross-check data to better ensure it is valid, reliable and complete.
•Validity. As a term used in evaluation methodol-ogy, it refers to the extent to which data collec-tion strategies and instruments measure what they intend to measure. Internal validity refers to the accuracy of the data in reflecting the reality of the programme, while external validity refers to the generalizability of study results to other groups, settings, treatments and outcomes.
•Variance. As a term used in IFRC indicator per-formance measurement, it is the difference be-tween identified targets and actual results for the indicator – the percentage of target reached (actual/target). For example, if ten communi-ties were targeted to participate in a commu-nity assessment but the actual communities conducting an assessment were only five, the variance would be 50 per cent (five communi-ties/ten communities = 50 per cent).
•Volunteering. An activity that is motivated by the free will of the person volunteering, and not by a desire for material or financial gain or by external social, economic or political pres-sure; intended to benefit vulnerable people and their communities in accordance with the Fun-damental Principles of the Red Cross and Red Crescent; organized by recognized representa-tives of a National Red Cross or Red Crescent Society.
•Volunteers. People that have volunteered at least four hours during the annual reporting perioed with Red Cross Red Crescent.
83
International Federation of Red Cross and Red Crescent Societies
Annex 2 M&E resources
AnnEx 2: M&E resourcesCited materials in this guide are footnoted on the page on which they are cited. This annex lists additional re-sources to assist with M&E. It is far from extensive as there is an abundance of M&E resources, which a quick search on the internet can demonstrate. Instead, the following list is a selection of key resources, from which ad-ditional resources can be sought. Only open-access resources available on the internet have been listed with their internet address (if this address does not work in the future as it has changed, we suggest you search the publica-tion title and author using an internet search engine).
IFRC M&E web page – www.ifrc.org/MandE
Maintained by the IFRC secretariat’s planning and evaluation department (PED), this web page on the IFRC’s public web site includes:
› IFRC. 2011. IFRC Framework for Evaluation identifying the international criteria and standard, including ethical, by which IFRC secretariat-funded evaluations are to be planned, managed, conducted and utilized.
› IFRC Evaluation database – a internet archive of completed IFRC secretariat-funded evaluations and related studies (i.e. baselines) for transparent accountability, as well as strategic planning and lesson sharing.
› IFRC. 2010. IFRC Project/Programme Planning Guidance Manual Guidance introducing analysis and a logical framework model for results-based project management.
› IFRC. 2011. IFRC Monitoring and Evaluation Guide to promote a common understanding and reliable prac-tice of M&E for IFRC projects/programmes.
› IFRC. 2011. IFRC Guide to Stakeholder Complaints and Feedback to guide accountable and transparent sys-tems for stakeholders to provide comment and voice complaints about IFRC work.
› IFRC. 2011. IFRC PMER Capacity Assessment Tool
› IFRC Glossary of Key PMER Terms
› Key IFRC PMER Templates: Logical framework (“logframe”) template; Monitoring and Evaluation Plan Table; Indicator Tracking Table (ITT); Project/Programme Management Report template.
› IFRC-PMER classroom and online training – a complete package of skills-based training materials for National Society and IFRC staff and volunteers in planning, monitoring, evaluation, and reporting (PMER), including online trainings.
› Snedecor, G. W. and Cochran, W. G. 1989. Sample Size Calculation Sheet (from Statistical Methods, Eighth Edition. Iowa State University Press).
› White, Graham and Wiles, Peter. 2008. Monitoring Templates for Humanitarian Organizations. Commis-sioned by the European Commission Director-General for Humanitarian AID (DG ECHO).
IFRC Federation-Wide Reporting System (FWRS) web page – https://fednet.ifrc.org/en/resources-and-services/ns-development/performance-development/federation-wide-reporting-system/ (accessible
only to IFRC members registered with FedNet).
Provides FWRS guidance and resources to monitor and report on key data from National Societies and the secretariat on regular basis. The above internet/web site link needs to be updated. The correct web site is expected shortly.
M&E resource web sites
There is a variety of web sites with a comprehensive selection of M&E resources, including guides, tools, trainings, links to other M&E web sites, international associations and organizations, internet discussion groups, etc. The following list is a sampling:
› CARE Program Quality Digital Library. 2011. http://pqdl.care.org/default.aspx
› Catholic Relief Services Technical Resources – M&E. 2011. http://www.crsprogramquality.org/m-and-e/
84
International Federation of Red Cross and Red Crescent Societies
Project/programme monitoring and evaluation guide
› The Evaluation Center. 2011. Evaluation Checklists. Western Michigan University. http://www.wmich.edu/evalctr/checklists
› Evaluation Portal. 2011. /www.evaluation.lars-balzer.name/
› EvaluationWiki.org. 2011. A public compendium of user-defined terms and other M&E information. www.evaluationwiki.org
› IFRC Monitoring and Evaluation web page. 2011. www.ifrc.org/MandE
› InterAction M&E web site. 2011. www.interaction.org/monitoring-evaluation
› International Organization for Cooperation in Evaluation (IOCE). 2011. www.internationalevaluation.com/events/index.shtml
› INTRAC Resources. 2011. International NGO Training and Research Center. www.intrac.org/resources.php
› MandE News web site: http://mande.co.uk/. [This is one of the largest internet resources for M&E, including a Training Forum: www.mande.co.uk/emaillists.htm].
› MEASURE (Measure and Evaluation to Assess and Use Results Evaluation). 2008. http://www.cpc.unc.edu/measure. [Funded by USAID, the MEASURE framework offers M&E publications, tools, trainings and other resources, including a Population, Health and Environmental M&E Training Tool Kit, www.cpc.unc.edu/measure/phe-training]
› National Science Foundation (NSF). 2011. User-Friendly Handbook for Mixed Method Evaluations. http://www.nsf.gov/pubs/1997/nsf97153/start.htm [Comprehensive, online resource.]
› OECD/DAC Evaluation of Development Programs web site. 2011. www.oecd.org/department/0,3355,en_2649_34435_1_1_1_1_1,00.html. Organization for Economic Co-operation and Development/Develop-ment Assistance Committee.
› Participatory Planning Monitoring & Evaluation (PPM&E) Resource Portal. 2008. http://portals.wdi.wur.nl/ppme/index.php?Home. [Contains multiple resources for M&E planning.]
› Public Health Agency of Canada. 2011. Program Evaluation Tool Kit. www.phac-aspc.gc.ca/php-psp/toolkit-eng.php
› Resources for Methods in Evaluation and Social Research web site. 2011. http://gsociology.icaap.org/methods/, in-cluding a series of user-friendly beginner guides, http://gsociology.icaap.org/methods/BasicguidesHandouts.html.
› UNDP Evaluation web site: 2011. United Nations Development Programme. http://www.undp.org/eo/
› UNEG Evaluation Resources web site. 2011. www.uneval.org/evaluationresource/index.jsp?ret=true. United Nations Evaluation Group.
› UNICEF Web site & External Links for Evaluation and Lessons Learned. 2011. United Nations International Children’s Emergency Fund. www.unicef.org/evaluation/index_18077.html
› Wageningen PPM&E Resource Portal. 2011. Participator Planning Monitoring & Evaluation. http://portals.wi.wur.nl/ppme/?PPM%26E_in_projects_and_programs
› World Bank. 2011. The Nuts & Bolts of M&E Systems. http://web.worldbank.org/WBSITE/EXTERNAL/TOPICS/EXTPOVERTY/0,,contentMDK:22632898~pagePK:148956~piPK:216618~theSitePK:336992,00.html
Overall M&E guides
› ALNAP (Active Learning Network for Accountability and Performance in Humanitarian). 2006. Evaluation Humanitarian Action Using OECD/DAC Criteria. www.alnap.org/pool/files/eha_2006.pdf
› American Red Cross and Catholic Relief Services. RS. 2008. M&E Training and Capacity-Building Modules, Washington, DC, and Baltimore, MD. http://pqpublications.squarespace.com/publications/2011/1/18/me-training-and-capacity-building-modules.html
› Bamberger, Michael, Rugh, Jim, and Mabry, Linda. 2006. RealWorld Evaluation: Working Under Budget, Time, Data and Political Constraints. Thousand Oaks, London, New Delhi: SAGE Publications. www.realworldevalu-ation.org/RealWorld_Evaluation_resour.html
85
International Federation of Red Cross and Red Crescent Societies
Annex 2 M&E resources
› Chaplowe, Scott G. 2008. Monitoring and Evaluation Planning. M&E Training and Capacity-Building Modules American Red Cross and Catholic Relief Services (CRS), Washington, DC, and Baltimore, MD. http://pqpub-lications.squarespace.com/storage/pubs/me/MEmodule_planning.pdf
› DfID (Department for International Development). 2006. Monitoring and Evaluation: A Guide for DfID-con-tracted Research Programmes. www.dfid.gov.uk/research/me-guide-contracted-research.pdf
› European Commission. 2004. Aid Delivery Methods – Volume 1, Project Cycle Management Guidelines. http://ec.europa.eu/europeaid/infopoint/publications/europeaid/49a_en.htm
› IFAD (International Fund for Agricultural Development). 2009. Evaluation Manual: Methodology and Pro-cesses. www.ifad.org/evaluation/process_methodology/doc/manual.pdf
› IFAD (International Fund for Agricultural Development). 2002. A Guide for Project M&E. IFAD, Rome. http://www.ifad.org/evaluation/guide/toc.htm
› IFRC. 2011. IFRC Monitoring and Evaluation Guide Guidance. www.ifrc.org/MandE
› IFRC. 2011. IFRC Framework for Evaluation. International Federation of Red Cross and Red Crescent Societies (IFRC). www.ifrc.org/MandE
› Local Livelihoods. 2009. Results Based Monitoring and Evaluation. http://www.locallivelihoods.com/Docu-ments/RBPME%20Toolkit.pdf
› OECD/DAC (Organization for Economic Co-operation and Development/Development Assistance Commit-tee). 2011. DAC Network on Development Evaluation web site: http://www.oecd.org/document/35/0,3343,en_21571361_34047972_31779555_1_1_1_1,00.html
› UNDP (United Nations Development Programme). 2009. Handbook on Planning, Monitoring and Evaluating for Development Results. www.undp.org/evaluation/handbook/documents/english/pme-handbook.pdf
› USAID (United States Agency for International Development). 2007. M&E Fundamentals – A Self-Guided Minicourse. USAID, Washington, DC. www.cpc.unc.edu/measure/publications/pdf/ms-07-20.pdf
› WFP (United Nations’ World Food Programme). 2011. Monitoring and Evaluation Guidelines. http://www.wfp.org/content/monitoring-and-evaluation-guidelines
› The World Bank Group, Independent Evaluation Group (IEG). 2008. International Program for Development Evaluation Training. http://www.worldbank.org/oed/ipdet/modules.html. [Course modules provide an overview of key M&E concepts and practices.]
Project/programme design (logframes) › Caldwell, Richard. 2002. Project Design Handbook. Atlanta: CARE International. http://www.ewb-interna-
tional.org/pdf/CARE%20Project%20Design%20Handbook.pdf. [Comprehensive overview of project design as it relates to the overall M&E system.]
› Danida. 1996. Logical Framework Approach: A Flexible Tool for Participatory Development. http://amg.um.dk/en/menu/TechnicalGuidelines/LogicalFrameworkApproach
› IFRC. 2010. IFRC Project/Programme Planning Guidance Manual. www.ifrc.org/MandE
› Rugh, Jim. 2008. The Rosetta Stone of Logical Frameworks. Compiled by Jim Rugh for CARE International and InterAction’s Evaluation Interest Group. http://www.mande.co.uk/docs/Rosettastone.doc. [Helpful sum-mary of different logframe terminology used by international organizations.]
Data collection and analysis methods › CARE. 2001. Guidelines to CARE Malawi for the Design of Future Baseline and Evaluation Studies. http://pqdl.
care.org/Practice/Baseline%20Guidelines.pdf
› Cody, Ronald. 2011. Data Cleaning 101. Robert Wood Johnson Medical School. NJ. http://www.ats.ucla.edu/stat/sas/library/nesug99/ss123.pdf
› Davies, Rich and Dart, Jess. 2005. The “Most Significant Change” (MSC) Technique. http://www.mande.co.uk/docs/MSCGuide.pdf
86
International Federation of Red Cross and Red Crescent Societies
Project/programme monitoring and evaluation guide
› Emergency Capacity Building Project. 2007. The Good Enough Guide: Impact Measurement and Accountability in Emergencies. http://www.oxfam.org.uk/what_we_do/resources/downloads/Good_Enough_Guide.pdf
› Harvey, Jen. 1998. Evaluation Cookbook. http://www.icbl.hw.ac.uk/ltdi/cookbook/cookbook.pdf
› IHSN. 2011. Catalog of Survey Questionnaires. http://www.ihsn.org/home/index.php?q=country_questionnaires
› Mack, Natasha, Woodsong, Cynthia, MacQueen, Kathleen M, Guest, Greg and Namey, Emily. 2005. Qualita-tive Research Methods. Family Health International (FHI) and the Agency for International Development (USAID). http://www.fhi.org/en/rh/pubs/booksreports/qrm_datacoll.htm
› Magnani, Robert. 1997. Sample Guide. Food and Nutrition Technical Assistance (FANTA). Academy for Edu-cational Development. Washington, DC. http://www.fantaproject.org/downloads/pdfs/sampling.pdf
› Online Sample Calculators. In addition to the Sample Size Calculation Sheet available on the IFRC’s M&E web site (www.ifrc.org/MandE), there are numerous online sample calculators, of which the following are not exhaustive: Creative Research Systems: www.surveysystem.com/sscalc.htm; Custom Insight, www.cus-tominsight.com/articles/random-sample-calculator.asp; Raosoft; www.raosoft.com/samplesize.html
› Scheuren, Fritz. 2004. What is a Survey? http://www.whatisasurvey.info/
› Snedecor, G. W. and Cochran, W. G. 1989. Sample Size Calculation Sheet. (from Statistical Methods, Eighth Edition. Iowa State University Press.) Also listed and available above under the IFRC M&E web page, www.ifrc.org/MandE.
› University of Florida IFAS Extension. 2011. Determining Sample Size. http://edis.ifas.ufl.edu/pd006
› WFP (United Nations’ World Food Programme). 2011. Monitoring and Evaluation Guidelines – How to Plan a Baseline Study. http://www.wfp.org/content/monitoring-and-evaluation-guidelines
› WFP (United Nations’ World Food Programme). 2011. Monitoring and Evaluation Guidelines – How to consoli-date, process and analyse qualitative and quantitative data. http://www.wfp.org/content/monitoring-and-evaluation-guidelines.
› World Bank. 2004. Reconstructing Baseline Data for Impact Evaluation and Results Measurement. http://site resources.worldbank.org/INTPOVERTY/Resources/335642-1276521901256/premnoteME4.pdf
Community health M&E resources
› The Global Fund. 2009. Monitoring and Evaluation Toolkit. http://www.theglobalfund.org/documents/me/M_E_Toolkit.pdf
› IFRC. 2011. Community Based Health and First Aid (CBHFA) PMER Toolkit. International Federation of Red Cross and Red Crescent Societies (IFRC). http://www.ifrc.org/en/what-we-do/health/community-based-health/ [Comprehensive toolkit of resources for planning, monitoring, evaluating and reporting on CBHFA projects/programmes.]
› Global HIV M&E Information Portal. 2011. www.globalhivmeinfo.org
› MEASURE. 2008. Measure and Evaluation to Assess and Use Results Evaluation web site: http://www.cpc.unc.edu/measure. [Funded by USAID, the MEASURE framework offers M&E publications, tools, trainings, and other resources to support improvement of global health and well-being.]
› UNAIDS. 2002. Monitoring and Evaluation Operations Manual. Joint United Nations Programme on HIV/AIDS. http://siteresources.worldbank.org/INTHIVAIDS/Resources/375798-1098987393985/M&EManual.pdf
› WHO, World Bank, USAID. 2009. Handbook on Monitoring and Evaluation of Human Resources for Health. http://whqlibdoc.who.int/publications/2009/9789241547703_eng.pdf
Disaster management M&E resources
› IFRC. 2007. Disaster Response and Contingency Planning Guide. www.ifrc.org/Global/Publications/disasters/disaster-response-en.pdf
› ICRC & IFRC. 2008. Guidelines for Assessment in Emergencies. www.ifrc.org/Global/Publications/disasters/guidelines/guidelines-for-emergency-en.pdf
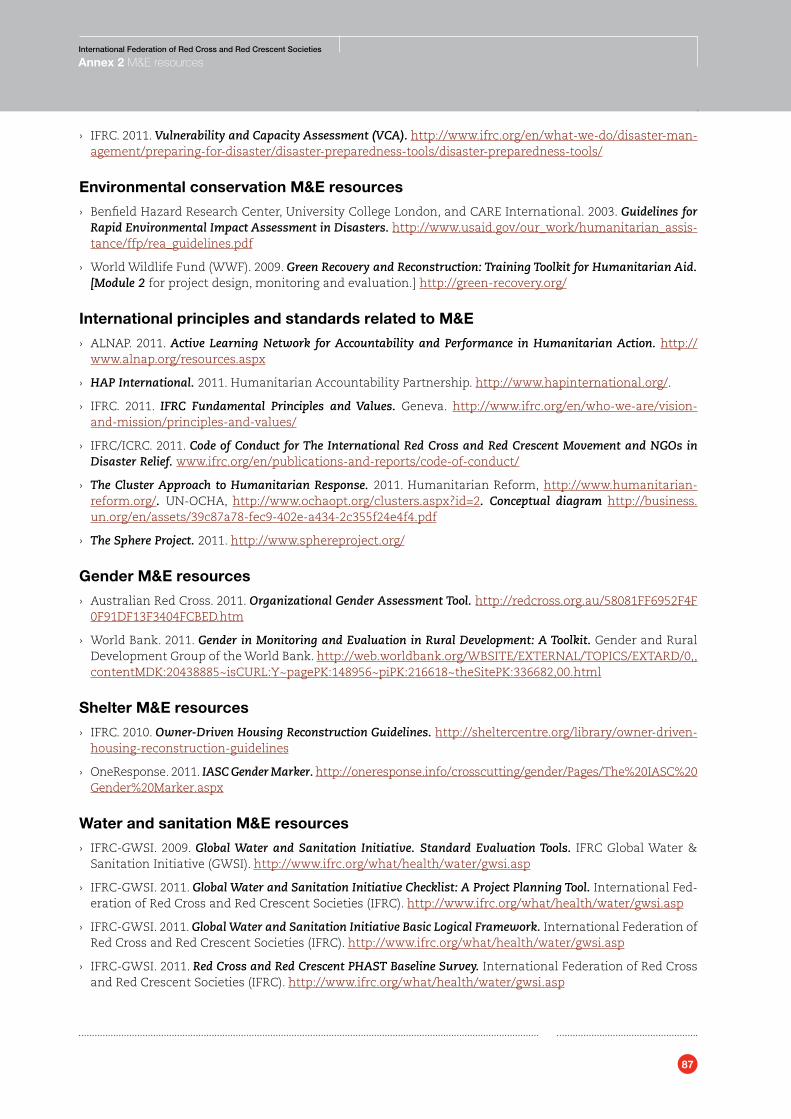
87
International Federation of Red Cross and Red Crescent Societies
Annex 2 M&E resources
› IFRC. 2011. Vulnerability and Capacity Assessment (VCA). http://www.ifrc.org/en/what-we-do/disaster-man-agement/preparing-for-disaster/disaster-preparedness-tools/disaster-preparedness-tools/
Environmental conservation M&E resources
› Benfield Hazard Research Center, University College London, and CARE International. 2003. Guidelines for Rapid Environmental Impact Assessment in Disasters. http://www.usaid.gov/our_work/humanitarian_assis-tance/ffp/rea_guidelines.pdf
› World Wildlife Fund (WWF). 2009. Green Recovery and Reconstruction: Training Toolkit for Humanitarian Aid. [Module 2 for project design, monitoring and evaluation.] http://green-recovery.org/
International principles and standards related to M&E
› ALNAP. 2011. Active Learning Network for Accountability and Performance in Humanitarian Action. http://www.alnap.org/resources.aspx
› HAP International. 2011. Humanitarian Accountability Partnership. http://www.hapinternational.org/.
› IFRC. 2011. IFRC Fundamental Principles and Values. Geneva. http://www.ifrc.org/en/who-we-are/vision-and-mission/principles-and-values/
› IFRC/ICRC. 2011. Code of Conduct for The International Red Cross and Red Crescent Movement and NGOs in Disaster Relief. www.ifrc.org/en/publications-and-reports/code-of-conduct/
› The Cluster Approach to Humanitarian Response. 2011. Humanitarian Reform, http://www.humanitarian-reform.org/. UN-OCHA, http://www.ochaopt.org/clusters.aspx?id=2. Conceptual diagram http://business.un.org/en/assets/39c87a78-fec9-402e-a434-2c355f24e4f4.pdf
› The Sphere Project. 2011. http://www.sphereproject.org/
Gender M&E resources
› Australian Red Cross. 2011. Organizational Gender Assessment Tool. http://redcross.org.au/58081FF6952F4F0F91DF13F3404FCBED.htm
› World Bank. 2011. Gender in Monitoring and Evaluation in Rural Development: A Toolkit. Gender and Rural Development Group of the World Bank. http://web.worldbank.org/WBSITE/EXTERNAL/TOPICS/EXTARD/0,,contentMDK:20438885~isCURL:Y~pagePK:148956~piPK:216618~theSitePK:336682,00.html
Shelter M&E resources
› IFRC. 2010. Owner-Driven Housing Reconstruction Guidelines. http://sheltercentre.org/library/owner-driven-housing-reconstruction-guidelines
› OneResponse. 2011. IASC Gender Marker. http://oneresponse.info/crosscutting/gender/Pages/The%20IASC%20Gender%20Marker.aspx
Water and sanitation M&E resources
› IFRC-GWSI. 2009. Global Water and Sanitation Initiative. Standard Evaluation Tools. IFRC Global Water & Sanitation Initiative (GWSI). http://www.ifrc.org/what/health/water/gwsi.asp
› IFRC-GWSI. 2011. Global Water and Sanitation Initiative Checklist: A Project Planning Tool. International Fed-eration of Red Cross and Red Crescent Societies (IFRC). http://www.ifrc.org/what/health/water/gwsi.asp
› IFRC-GWSI. 2011. Global Water and Sanitation Initiative Basic Logical Framework. International Federation of Red Cross and Red Crescent Societies (IFRC). http://www.ifrc.org/what/health/water/gwsi.asp
› IFRC-GWSI. 2011. Red Cross and Red Crescent PHAST Baseline Survey. International Federation of Red Cross and Red Crescent Societies (IFRC). http://www.ifrc.org/what/health/water/gwsi.asp
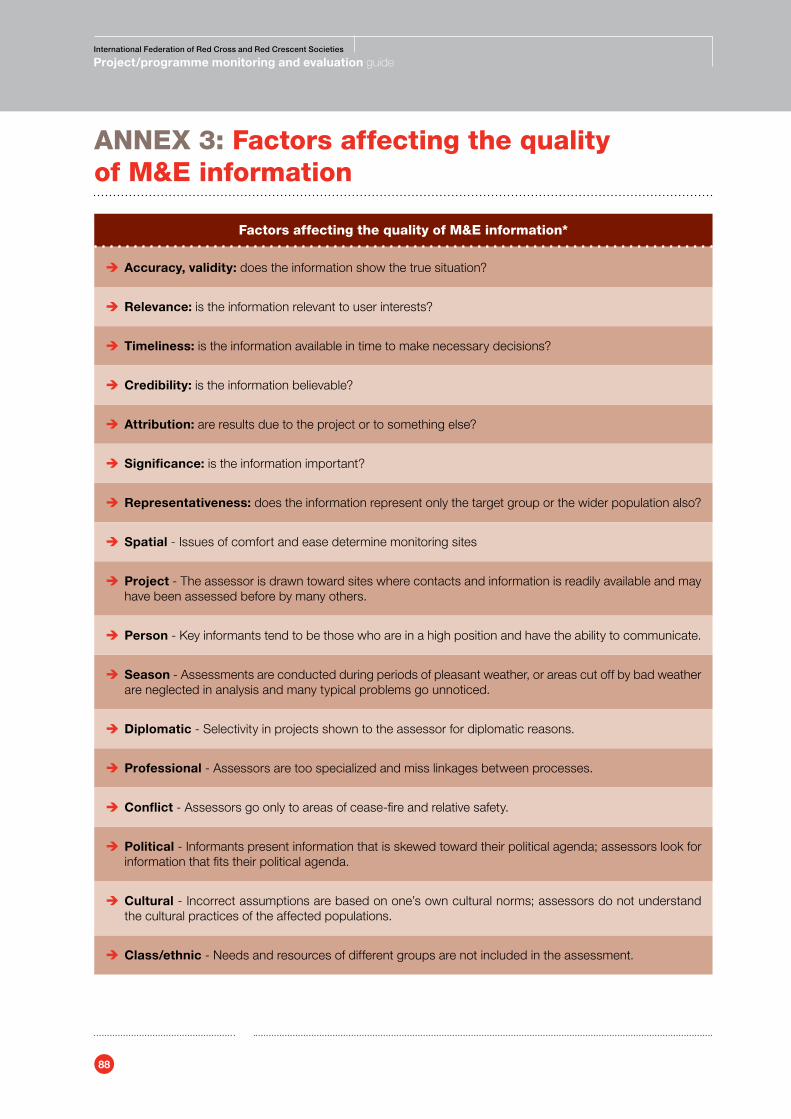
88
International Federation of Red Cross and Red Crescent Societies
Project/programme monitoring and evaluation guide
AnnEx 3: Factors affecting the quality of M&E information
Factors affecting the quality of M&E information*
Î Accuracy, validity: does the information show the true situation?
Î Relevance: is the information relevant to user interests?
Î Timeliness: is the information available in time to make necessary decisions?
Î Credibility: is the information believable?
Î Attribution: are results due to the project or to something else?
Î Significance: is the information important?
Î Representativeness: does the information represent only the target group or the wider population also?
Î Spatial - Issues of comfort and ease determine monitoring sites
Î Project - The assessor is drawn toward sites where contacts and information is readily available and may have been assessed before by many others.
Î Person - Key informants tend to be those who are in a high position and have the ability to communicate.
Î Season - Assessments are conducted during periods of pleasant weather, or areas cut off by bad weather are neglected in analysis and many typical problems go unnoticed.
Î Diplomatic - Selectivity in projects shown to the assessor for diplomatic reasons.
Î Professional - Assessors are too specialized and miss linkages between processes.
Î Conflict - Assessors go only to areas of cease-fire and relative safety.
Î Political - Informants present information that is skewed toward their political agenda; assessors look for information that fits their political agenda.
Î Cultural - Incorrect assumptions are based on one’s own cultural norms; assessors do not understand the cultural practices of the affected populations.
Î Class/ethnic - Needs and resources of different groups are not included in the assessment.
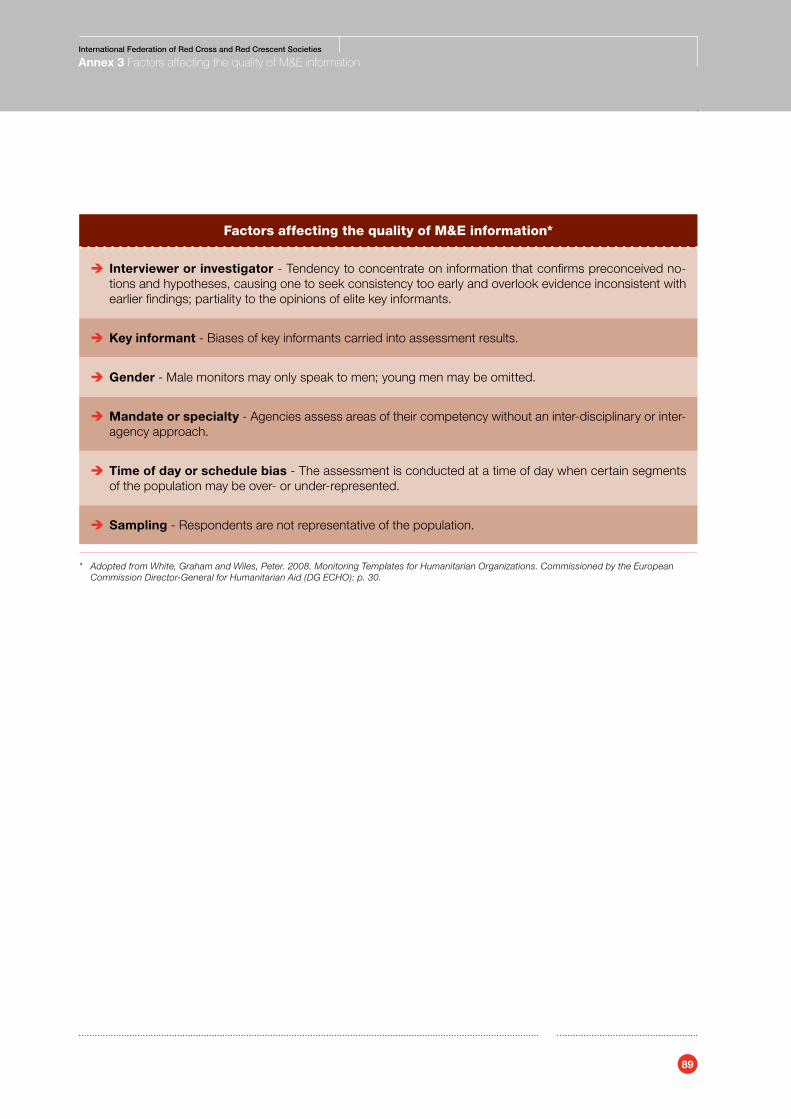
89
International Federation of Red Cross and Red Crescent Societies
Annex 3 Factors affecting the quality of M&E information
Factors affecting the quality of M&E information*
Î Interviewer or investigator - Tendency to concentrate on information that confirms preconceived no-tions and hypotheses, causing one to seek consistency too early and overlook evidence inconsistent with earlier findings; partiality to the opinions of elite key informants.
Î Key informant - Biases of key informants carried into assessment results.
Î Gender - Male monitors may only speak to men; young men may be omitted.
Î Mandate or specialty - Agencies assess areas of their competency without an inter-disciplinary or inter-agency approach.
Î Time of day or schedule bias - The assessment is conducted at a time of day when certain segments of the population may be over- or under-represented.
Î Sampling - Respondents are not representative of the population.
* Adopted from White, Graham and Wiles, Peter. 2008. Monitoring Templates for Humanitarian Organizations. Commissioned by the European Commission Director-General for Humanitarian Aid (DG ECHO): p. 30.
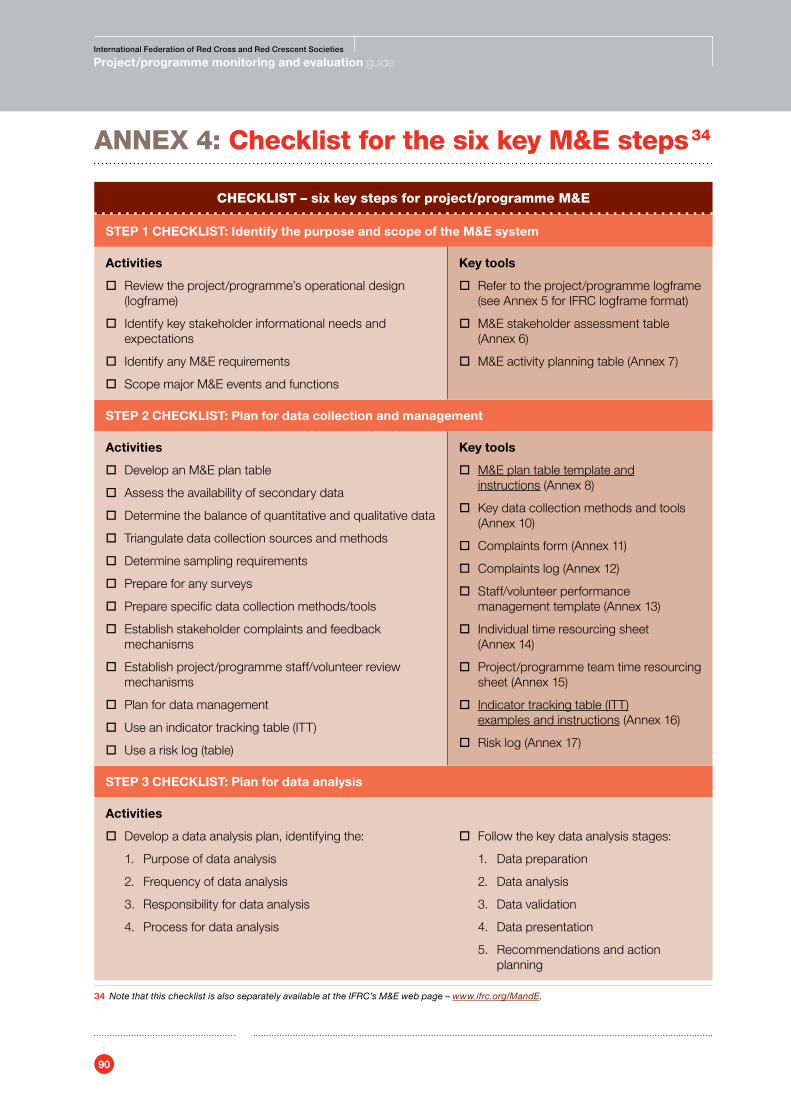
90
International Federation of Red Cross and Red Crescent Societies
Project/programme monitoring and evaluation guide
AnnEx 4: Checklist for the six key M&E steps 34
CHECKLIST – six key steps for project/programme M&E
STEP 1 CHECKLIST: Identify the purpose and scope of the M&E system
Activities
� Review the project/programme’s operational design (logframe)
� Identify key stakeholder informational needs and expectations
� Identify any M&E requirements
� Scope major M&E events and functions
Key tools
� Refer to the project/programme logframe (see Annex 5 for IFRC logframe format)
� M&E stakeholder assessment table (Annex 6)
� M&E activity planning table (Annex 7)
STEP 2 CHECKLIST: Plan for data collection and management
Activities
� Develop an M&E plan table
� Assess the availability of secondary data
� Determine the balance of quantitative and qualitative data
� Triangulate data collection sources and methods
� Determine sampling requirements
� Prepare for any surveys
� Prepare specific data collection methods/tools
� Establish stakeholder complaints and feedback mechanisms
� Establish project/programme staff/volunteer review mechanisms
� Plan for data management
� Use an indicator tracking table (ITT)
� Use a risk log (table)
Key tools
� M&E plan table template and instructions (Annex 8)
� Key data collection methods and tools (Annex 10)
� Complaints form (Annex 11)
� Complaints log (Annex 12)
� Staff/volunteer performance management template (Annex 13)
� Individual time resourcing sheet (Annex 14)
� Project/programme team time resourcing sheet (Annex 15)
� Indicator tracking table (ITT) examples and instructions (Annex 16)
� Risk log (Annex 17)
STEP 3 CHECKLIST: Plan for data analysis
Activities
� Develop a data analysis plan, identifying the:
1. Purpose of data analysis
2. Frequency of data analysis
3. Responsibility for data analysis
4. Process for data analysis
� Follow the key data analysis stages:
1. Data preparation
2. Data analysis
3. Data validation
4. Data presentation
5. Recommendations and action planning
34 Note that this checklist is also separately available at the IFRC’s M&E web page – www.ifrc.org/MandE.
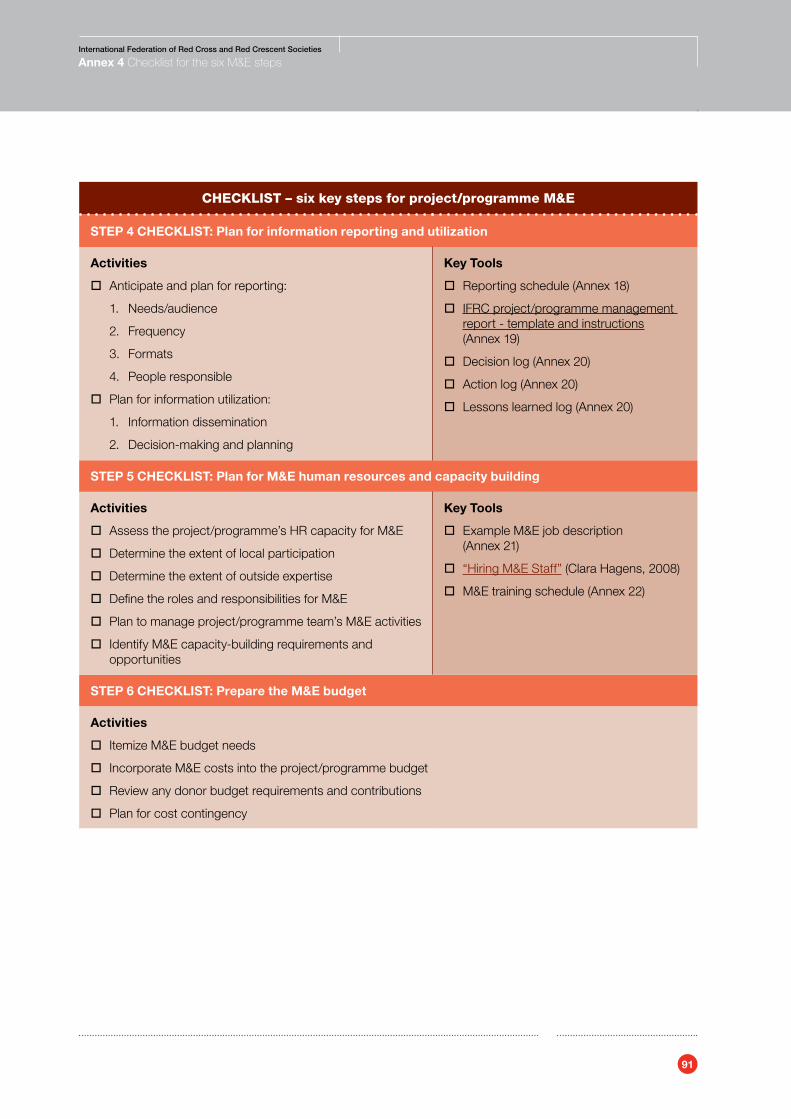
91
International Federation of Red Cross and Red Crescent Societies
Annex 4 Checklist for the six M&E steps
CHECKLIST – six key steps for project/programme M&E
STEP 4 CHECKLIST: Plan for information reporting and utilization
Activities
� Anticipate and plan for reporting:
1. Needs/audience
2. Frequency
3. Formats
4. People responsible
� Plan for information utilization:
1. Information dissemination
2. Decision-making and planning
Key Tools
� Reporting schedule (Annex 18)
� IFRC project/programme management report - template and instructions (Annex 19)
� Decision log (Annex 20)
� Action log (Annex 20)
� Lessons learned log (Annex 20)
STEP 5 CHECKLIST: Plan for M&E human resources and capacity building
Activities
� Assess the project/programme’s HR capacity for M&E
� Determine the extent of local participation
� Determine the extent of outside expertise
� Define the roles and responsibilities for M&E
� Plan to manage project/programme team’s M&E activities
� Identify M&E capacity-building requirements and opportunities
Key Tools
� Example M&E job description (Annex 21)
� “Hiring M&E Staff” (Clara Hagens, 2008)
� M&E training schedule (Annex 22)
STEP 6 CHECKLIST: Prepare the M&E budget
Activities
� Itemize M&E budget needs
� Incorporate M&E costs into the project/programme budget
� Review any donor budget requirements and contributions
� Plan for cost contingency
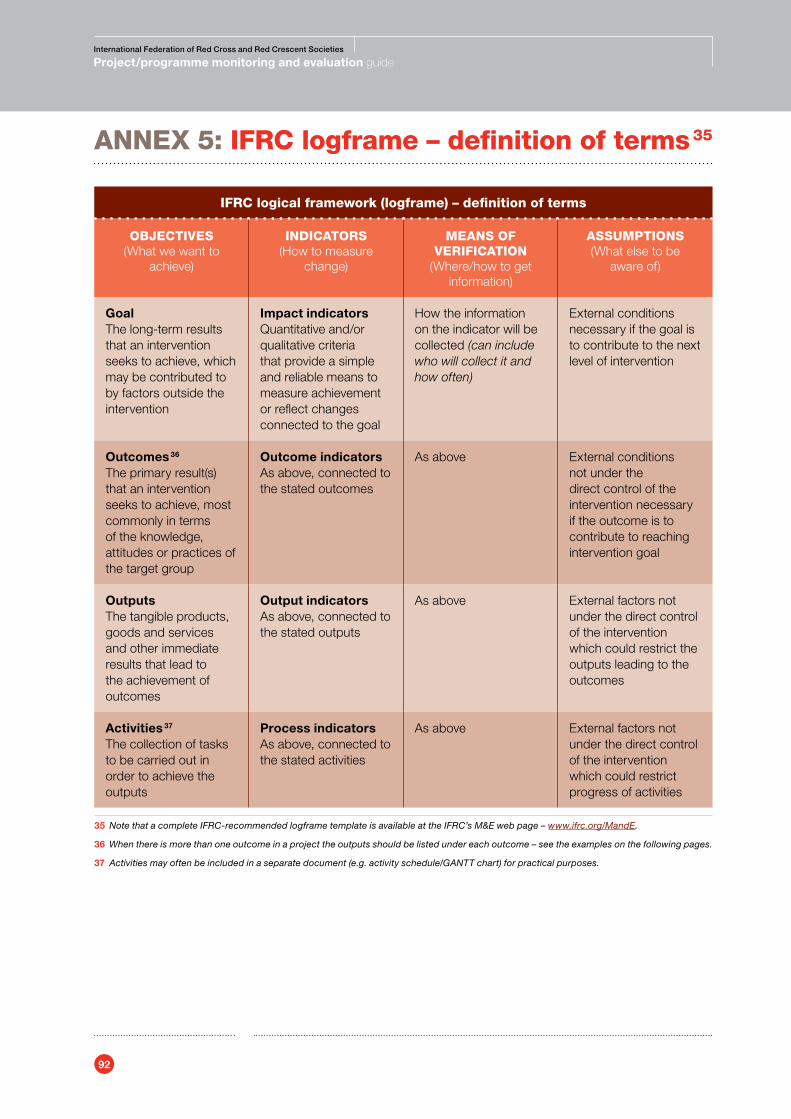
92
International Federation of Red Cross and Red Crescent Societies
Project/programme monitoring and evaluation guide
AnnEx 5: IFRC logframe – definition of terms 35
IFRC logical framework (logframe) – definition of terms
oBJECTIVES(What we want to
achieve)
InDICAToRS(How to measure
change)
MEAnS oF VERIFICATIon
(Where/how to get information)
ASSUMPTIonS(What else to be
aware of)
GoalThe long-term results that an intervention seeks to achieve, which may be contributed to by factors outside the intervention
Impact indicatorsQuantitative and/or qualitative criteria that provide a simple and reliable means to measure achievement or reflect changes connected to the goal
How the information on the indicator will be collected (can include who will collect it and how often)
External conditions necessary if the goal is to contribute to the next level of intervention
Outcomes 36
The primary result(s) that an intervention seeks to achieve, most commonly in terms of the knowledge, attitudes or practices of the target group
Outcome indicatorsAs above, connected to the stated outcomes
As above External conditions not under the direct control of the intervention necessary if the outcome is to contribute to reaching intervention goal
OutputsThe tangible products, goods and services and other immediate results that lead to the achievement of outcomes
Output indicatorsAs above, connected to the stated outputs
As above External factors not under the direct control of the intervention which could restrict the outputs leading to the outcomes
Activities 37
The collection of tasks to be carried out in order to achieve the outputs
Process indicatorsAs above, connected to the stated activities
As above External factors not under the direct control of the intervention which could restrict progress of activities
35 Note that a complete IFRC-recommended logframe template is available at the IFRC’s M&E web page – www.ifrc.org/MandE.
36 When there is more than one outcome in a project the outputs should be listed under each outcome – see the examples on the following pages.
37 Activities may often be included in a separate document (e.g. activity schedule/GANTT chart) for practical purposes.
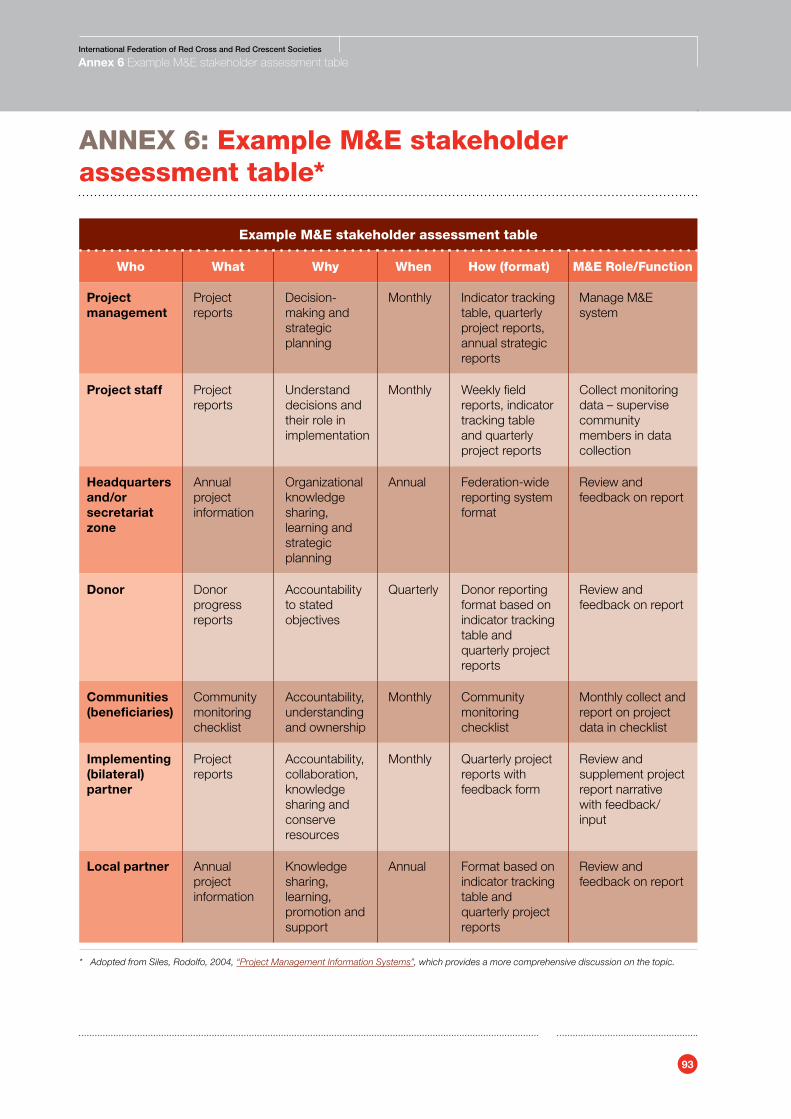
93
International Federation of Red Cross and Red Crescent Societies
Annex 6 Example M&E stakeholder assessment table
AnnEx 6: Example M&E stakeholder assessment table*
Example M&E stakeholder assessment table
Who What Why When How (format) M&E Role/Function
Project management
Project reports
Decision-making and strategic planning
Monthly Indicator tracking table, quarterly project reports, annual strategic reports
Manage M&E system
Project staff Project reports
Understand decisions and their role in implementation
Monthly Weekly field reports, indicator tracking table and quarterly project reports
Collect monitoring data – supervise community members in data collection
Headquarters and/or secretariat zone
Annual project information
Organizational knowledge sharing, learning and strategic planning
Annual Federation-wide reporting system format
Review and feedback on report
Donor Donor progress reports
Accountability to stated objectives
Quarterly Donor reporting format based on indicator tracking table and quarterly project reports
Review and feedback on report
Communities (beneficiaries)
Community monitoring checklist
Accountability, understanding and ownership
Monthly Community monitoring checklist
Monthly collect and report on project data in checklist
Implementing (bilateral) partner
Project reports
Accountability, collaboration, knowledge sharing and conserve resources
Monthly Quarterly project reports with feedback form
Review and supplement project report narrative with feedback/input
Local partner Annual project information
Knowledge sharing, learning, promotion and support
Annual Format based on indicator tracking table and quarterly project reports
Review and feedback on report
* Adopted from Siles, Rodolfo, 2004, “Project Management Information Systems”, which provides a more comprehensive discussion on the topic.
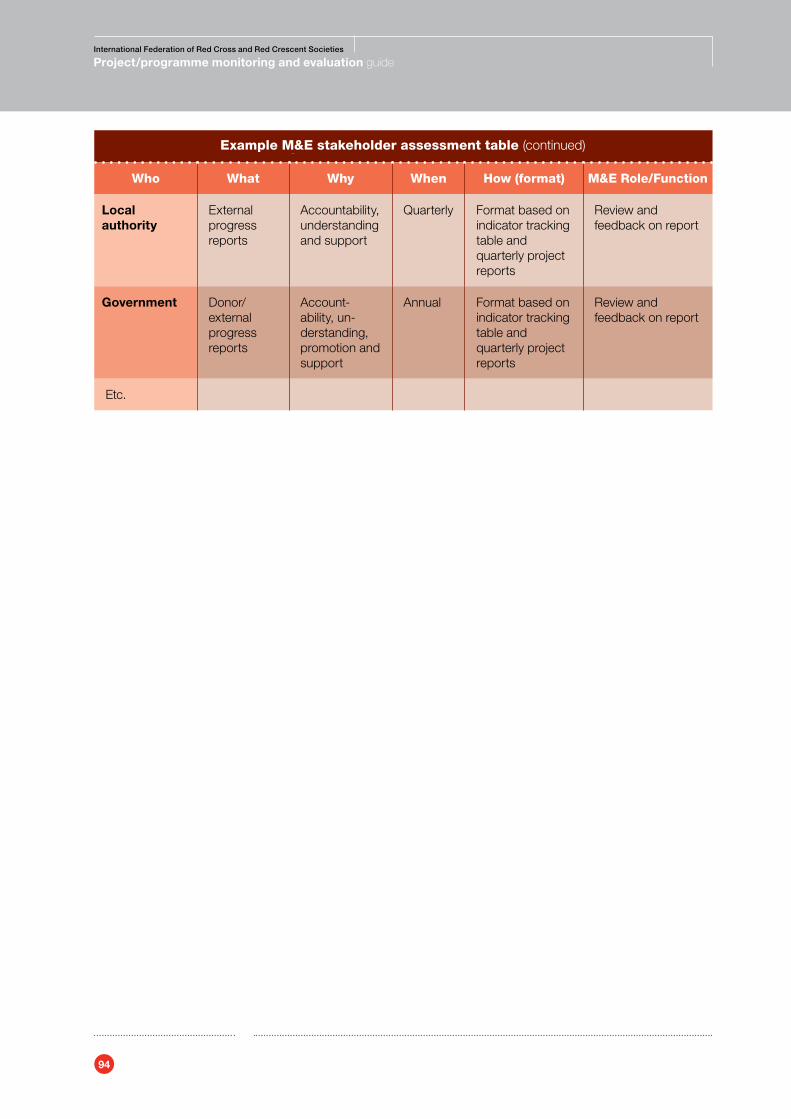
94
International Federation of Red Cross and Red Crescent Societies
Project/programme monitoring and evaluation guide
Example M&E stakeholder assessment table
Who What Why When How (format) M&E Role/Function
Local authority
External progress reports
Accountability, understanding and support
Quarterly Format based on indicator tracking table and quarterly project reports
Review and feedback on report
Government Donor/external progress reports
Account-ability, un-derstanding, promotion and support
Annual Format based on indicator tracking table and quarterly project reports
Review and feedback on report
Etc.
Example M&E stakeholder assessment table (continued)
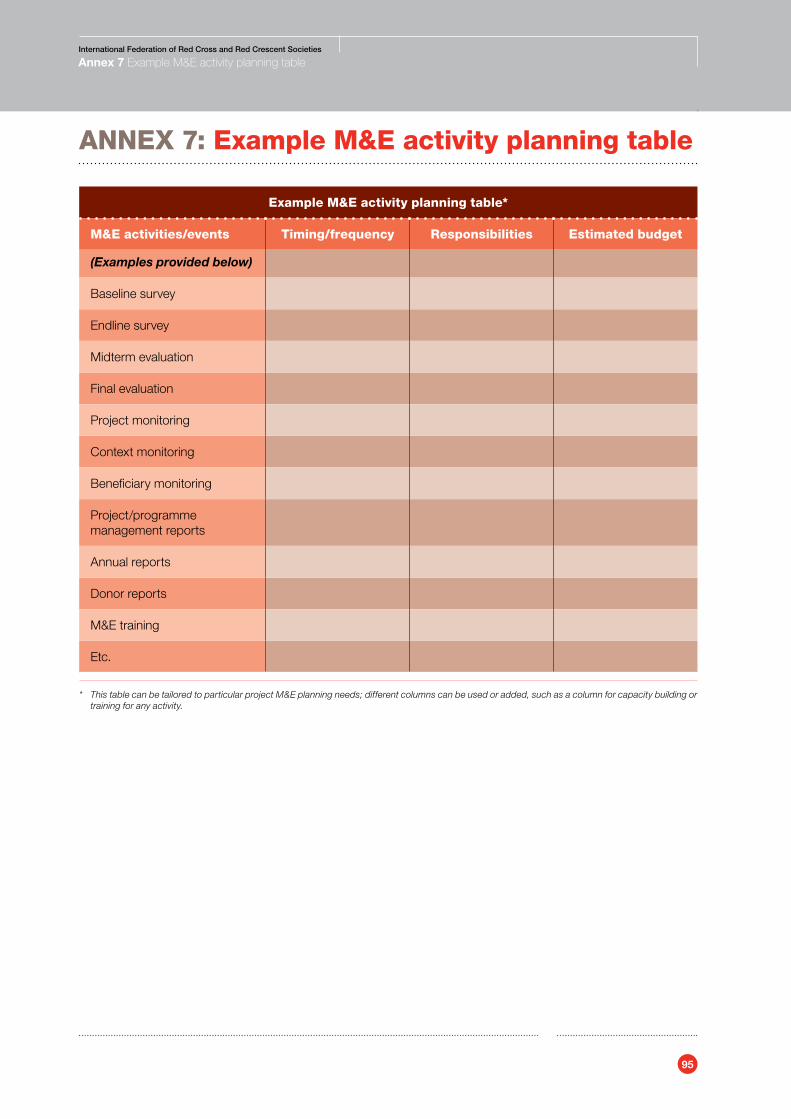
95
International Federation of Red Cross and Red Crescent Societies
Annex 7 Example M&E activity planning table
AnnEx 7: Example M&E activity planning table
Example M&E activity planning table*
M&E activities/events Timing/frequency Responsibilities Estimated budget
(Examples provided below)
Baseline survey
Endline survey
Midterm evaluation
Final evaluation
Project monitoring
Context monitoring
Beneficiary monitoring
Project/programme management reports
Annual reports
Donor reports
M&E training
Etc.
* This table can be tailored to particular project M&E planning needs; different columns can be used or added, such as a column for capacity building or training for any activity.
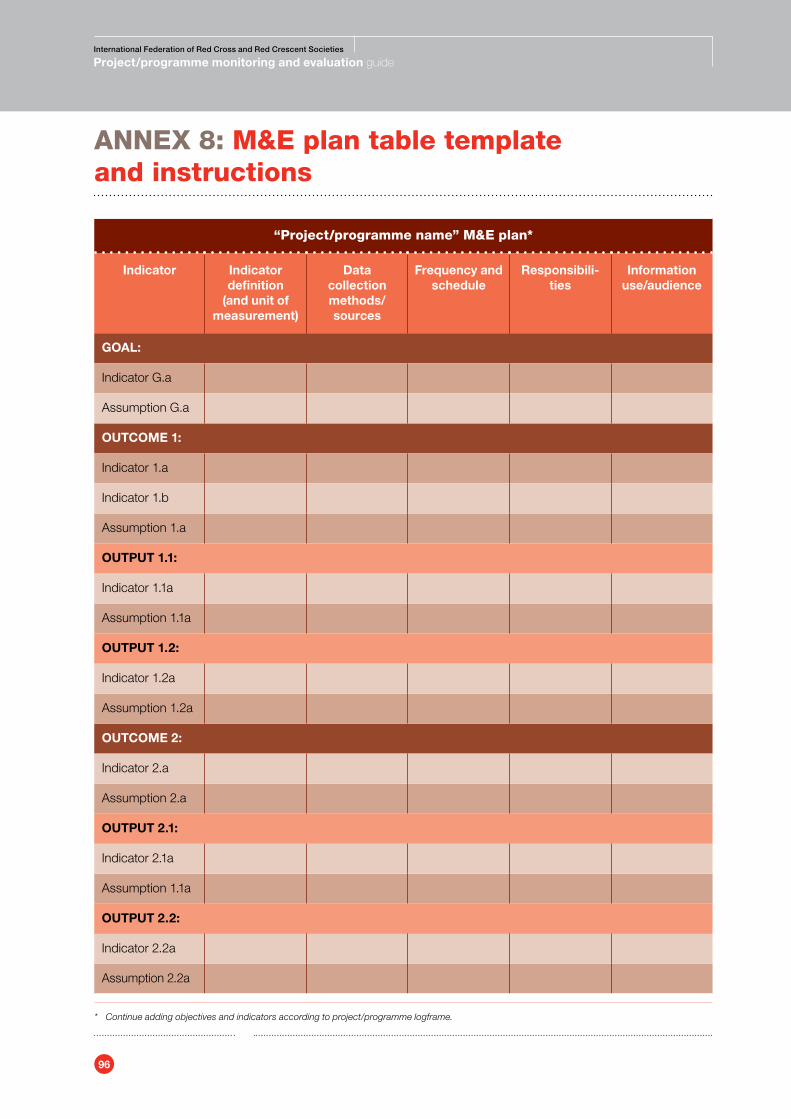
96
International Federation of Red Cross and Red Crescent Societies
Project/programme monitoring and evaluation guide
AnnEx 8: M&E plan table template and instructions
“Project/programme name” M&E plan*
Indicator Indicator definition
(and unit of measurement)
Data collectionmethods/sources
Frequency and schedule
Responsibili-ties
Information use/audience
GOAL:
Indicator G.a
Assumption G.a
OUTCOME 1:
Indicator 1.a
Indicator 1.b
Assumption 1.a
OUTPUT 1.1:
Indicator 1.1a
Assumption 1.1a
OUTPUT 1.2:
Indicator 1.2a
Assumption 1.2a
OUTCOME 2:
Indicator 2.a
Assumption 2.a
OUTPUT 2.1:
Indicator 2.1a
Assumption 1.1a
OUTPUT 2.2:
Indicator 2.2a
Assumption 2.2a
* Continue adding objectives and indicators according to project/programme logframe.
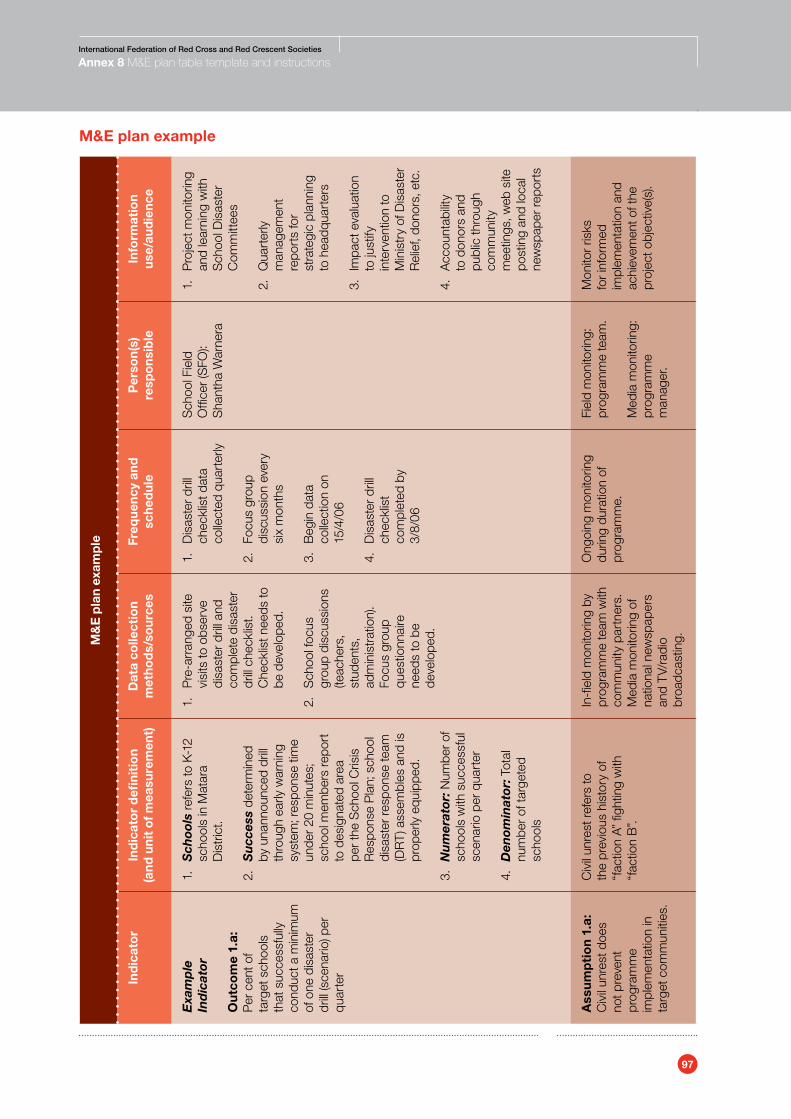
97
International Federation of Red Cross and Red Crescent Societies
Annex 8 M&E plan table template and instructions
M&E plan example
M&
E p
lan
exam
ple
Ind
icat
or
Ind
icat
or
defi
niti
on
(and
uni
t o
f mea
sure
men
t)D
ata
colle
ctio
nm
etho
ds/
sour
ces
Freq
uenc
y an
d
sche
dul
eP
erso
n(s)
re
spo
nsib
leIn
form
atio
n us
e/au
die
nce
Exa
mp
leIn
dic
ator
Ou
tco
me
1.a:
P
er c
ent o
f ta
rget
sch
ools
th
at s
ucce
ssfu
lly
cond
uct a
min
imum
of
one
dis
aste
r dr
ill (s
cena
rio) p
er
quar
ter
1.
Sch
ool
s re
fers
to K
-12
scho
ols
in M
atar
a D
istr
ict.
2.
Su
cces
s de
term
ined
by
una
nnou
nced
dril
l th
roug
h ea
rly w
arni
ng
syst
em; r
espo
nse
time
unde
r 20
min
utes
; sc
hool
mem
bers
repo
rt
to d
esig
nate
d ar
ea
per t
he S
choo
l Cris
is
Res
pons
e P
lan;
sch
ool
disa
ster
resp
onse
team
(D
RT
) ass
embl
es a
nd is
pr
oper
ly e
quip
ped.
3.
Nu
mer
ator
: Num
ber o
f sc
hool
s w
ith s
ucce
ssfu
l sc
enar
io p
er q
uart
er
4.
Den
omin
ator
: Tot
al
num
ber o
f tar
gete
d sc
hool
s
1.
Pre
-arr
ange
d si
te
visi
ts to
obs
erve
di
sast
er d
rill a
nd
com
plet
e di
sast
er
drill
chec
klis
t. C
heck
list n
eeds
to
be d
evel
oped
.
2.
Sch
ool f
ocus
gr
oup
disc
ussi
ons
(teac
hers
, st
uden
ts,
adm
inis
trat
ion)
. Fo
cus
grou
p qu
estio
nnai
re
need
s to
be
deve
lope
d.
1.
Dis
aste
r dril
l ch
eckl
ist d
ata
colle
cted
qua
rter
ly
2.
Focu
s gr
oup
disc
ussi
on e
very
si
x m
onth
s
3.
Beg
in d
ata
colle
ctio
n on
15
/4/0
6 4.
D
isas
ter d
rill
chec
klis
t co
mpl
eted
by
3/8/
06
Sch
ool F
ield
O
ffice
r (S
FO):
Sha
ntha
War
nera
1.
Pro
ject
mon
itorin
g an
d le
arni
ng w
ith
Sch
ool D
isas
ter
Com
mitt
ees
2.
Qua
rter
ly
man
agem
ent
repo
rts
for
stra
tegi
c pl
anni
ng
to h
eadq
uart
ers
3.
Impa
ct e
valu
atio
n to
just
ify
inte
rven
tion
to
Min
istr
y of
Dis
aste
r R
elie
f, do
nors
, etc
.
4.
Acc
ount
abilit
y to
don
ors
and
publ
ic th
roug
h co
mm
unity
m
eetin
gs, w
eb s
ite
post
ing
and
loca
l ne
wsp
aper
repo
rts
Ass
um
pti
on
1.a:
C
ivil
unre
st d
oes
not p
reve
nt
prog
ram
me
impl
emen
tatio
n in
ta
rget
com
mun
ities
.
Civ
il un
rest
refe
rs to
th
e pr
evio
us h
isto
ry o
f “f
actio
n A”
figh
ting
with
“f
actio
n B
”.
In-fi
eld
mon
itorin
g by
pr
ogra
mm
e te
am w
ith
com
mun
ity p
artn
ers.
Med
ia m
onito
ring
of
natio
nal n
ewsp
aper
s an
d T
V/ra
dio
broa
dcas
ting.
Ong
oing
mon
itorin
g du
ring
dura
tion
of
prog
ram
me.
Fiel
d m
onito
ring:
pr
ogra
mm
e te
am.
Med
ia m
onito
ring:
pr
ogra
mm
e m
anag
er.
Mon
itor r
isks
fo
r inf
orm
ed
impl
emen
tatio
n an
d ac
hiev
emen
t of t
he
proj
ect o
bjec
tive(
s).
98
International Federation of Red Cross and Red Crescent Societies
Project/programme monitoring and evaluation guide
M&E plan purpose and compliance
• An M&E plan is a table that builds upon a project/programme’s logframe to de-tail key M&E requirements for each indicator and assumption. It allows project/programme staff at the field level to track progress towards specific targets for better transparency and accountability within and outside the IFRC.
• This IFRC M&E plan is to be used for all secretariat-funded projects/programmes at the field level, and is to inform other indicator planning formats within the secretariat and the larger IFRC community as appropriate.
• The M&E plan should be completed during the planning stage of a project/pro-gramme and by those who will be using it. This allows the project/programme team to cross-check the logframe and indicators before project/programme implementation (ensuring they are realistic to field realities and team ca-pacities). Team involvement is essential because the M&E plan requires their detailed knowledge of the project/programme context, and their involvement reinforces their understanding of what data they are to collect and how they will collect it.
• The IFRC M&E plan template and instructions can be accessed at the IFRC-PED web site for M&E: www.ifrc.org/MandE.
M&E plan instructions
Drawing upon the above example, the following is an explanation of each column in an M&E plan:
1. The indicator column provides an indicator statement of the precise infor-mation needed to assess whether intended changes have occurred. Indica-tors can be either quantitative (numeric) or qualitative (descriptive observa-tions). Indicators are typically taken directly from the logframe, but should be checked in the process to ensure they are SMART (specific, measurable, achievable, relevant and time-bound).39 Often, the indicator may need to be revised upon closer examination and according to field realities. If this is the case, be sure any revisions are approved by key stakeholders, e.g. donors.
2. The definition column defines any key terms in the indicator that need further detail for precise and reliable measurement. It should also explain precisely how the indicator will be calculated, such as the numerator and denominator of a percent measure. This column should also note if the indi-cator is to be separated by sex, age, ethnicity, or some other variable.
Our example illustrates two terms that needed clarification. The definition of “schools” clarifies that data should be collected from kindergartens through Grade 12 (not higher-level university or professional schools). The definition of “success” tells us the specific criteria needed for a school to be successful in its disaster drill – otherwise, “success” could be interpreted in different ways and leads to inconsistent and unreliable data.
3. The methods/sources column identifies sources of information and data col-lection methods and tools, such as the use of secondary data, regular mon-itoring or periodic evaluation, baseline or endline surveys, and interviews. While the “Means of verification” column in a logframe may list a data source or method, e.g. “household survey”, the M&E plan provides more detail, such as the sampling method, survey type, etc. This column should also indicate whether data collection tools (e.g. questionnaires, checklists) are pre-existing or will need to be developed.
Our example has two primary methods (observation of and focus group dis-cussions about the disaster drills), and two tools (a disaster drill checklist
39 SMART and other guidance for indicator development is addressed in more detail in the IFRC Project/Programme Planning Guidance Manual (IFRC PPP, 2010: p. 35).
99
International Federation of Red Cross and Red Crescent Societies
Annex 8 M&E plan table template and instructions
and FGD questionnaire). Both methods illustrate that the data source is often implicit in the method description, in this case the school population.
Note: Annex 10 of the IFRC M&E Guide provides a summary of key methods/tools with links to key resources for further guidance.
4. The frequency/schedules column states how often the data for each indica-tor will be collected, such as weekly, monthly, quarterly, annually, etc. It also states any key dates to schedule, such as start-up and end dates for collec-tion or deadlines for tool development. When planning for data collection, it is important to consider factors that can affect data collection timing, such as seasonal variations, school schedules, holidays and religious observances (e.g. Ramadan).
In our example, in addition to noting the frequency of data collection on the disaster drill checklists (quarterly) and the focus group discussions (every six months), two key dates in the schedule are noted: the start date of date col-lection, as well as the completion date to develop the disaster drill checklist.
5. The person(s) responsible column lists the people responsible and account- able for the data collection and analysis, e.g. community volunteers, field staff, project/programme managers, local partner(s) and external consult-ants. In addition to specific people’s names, use the job title to ensure clarity in case of personnel changes. This column is also useful in assessing and planning for capacity building for the M&E system (see Section 2.5.6).
6. The information use/audience column identifies the primary use of the information and its intended audience. This column can also state ways in which the findings will be formatted (e.g. tables, graphs, maps, histograms, and narrative reports) and distributed (e.g. internet web sites, briefings, com-munity meetings, listservs and mass media). If an assessment of M&E stake-holders has been done (see Section 2.1.2), this would be useful to refer to when completing this column.
Often some indicators will have the same information use/audience. Some examples of information use for indicators include:• Monitoring project/programme implementation for decision-making• Evaluating impact to justify intervention• Identifying lessons for organizational learning and knowledge-sharing• Assessing compliance with donor or legal requirements• Reporting to senior management, policy-makers or donors for strategic
planning• Accountability to beneficiaries, donors and partners• Advocacy and resource mobilization.
The same principles for completing the columns for an indicator apply when completing them for an assumption. However, the information use/audience for an assumption will generally be the same for all assumptions: we monitor assumptions for the informed implementation and achievement of the project/programme objective(s) (i.e. the assumptions need to hold true if the objective is to be achieved).
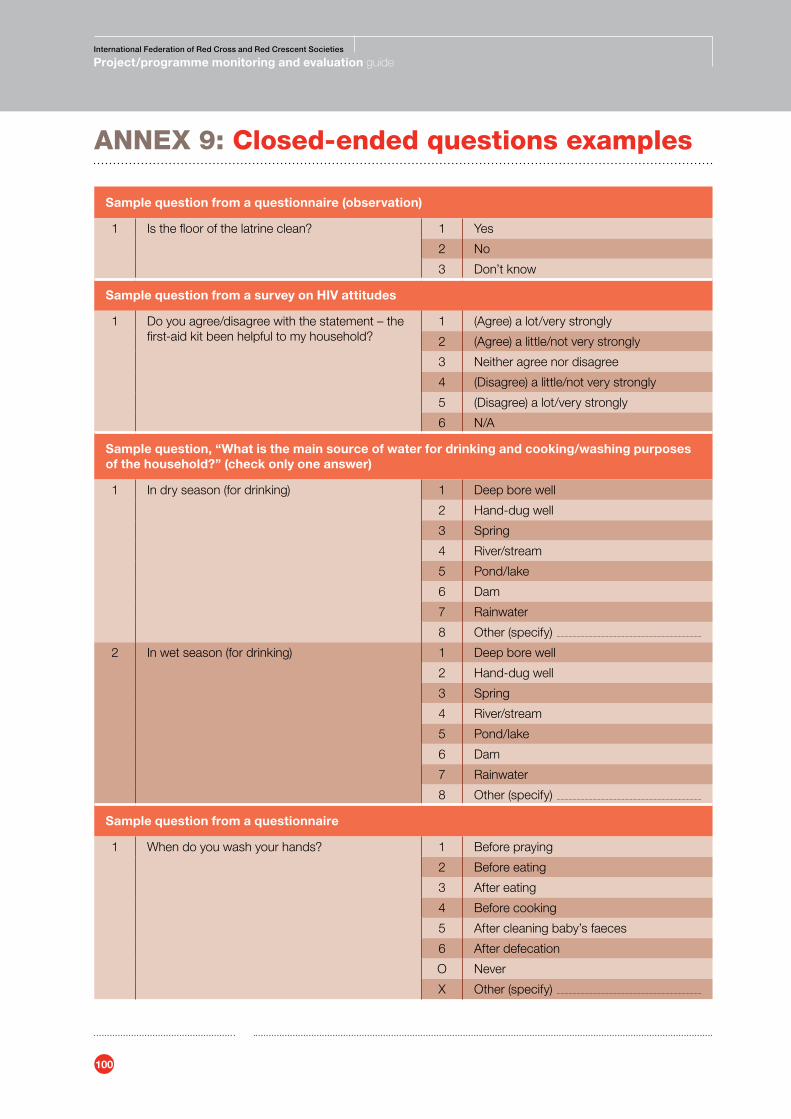
100
International Federation of Red Cross and Red Crescent Societies
Project/programme monitoring and evaluation guide
AnnEx 9: Closed-ended questions examples
Sample question from a questionnaire (observation)
1 Is the floor of the latrine clean? 1 Yes
2 No
3 Don’t know
Sample question from a survey on HIV attitudes
1 Do you agree/disagree with the statement – the first-aid kit been helpful to my household?
1 (Agree) a lot/very strongly
2 (Agree) a little/not very strongly
3 Neither agree nor disagree
4 (Disagree) a little/not very strongly
5 (Disagree) a lot/very strongly
6 N/A
Sample question, “What is the main source of water for drinking and cooking/washing purposes of the household?” (check only one answer)
1 In dry season (for drinking) 1 Deep bore well
2 Hand-dug well
3 Spring
4 River/stream
5 Pond/lake
6 Dam
7 Rainwater
8 Other (specify)
2 In wet season (for drinking) 1 Deep bore well
2 Hand-dug well
3 Spring
4 River/stream
5 Pond/lake
6 Dam
7 Rainwater
8 Other (specify)
Sample question from a questionnaire
1 When do you wash your hands? 1 Before praying
2 Before eating
3 After eating
4 Before cooking
5 After cleaning baby’s faeces
6 After defecation
O Never
X Other (specify)
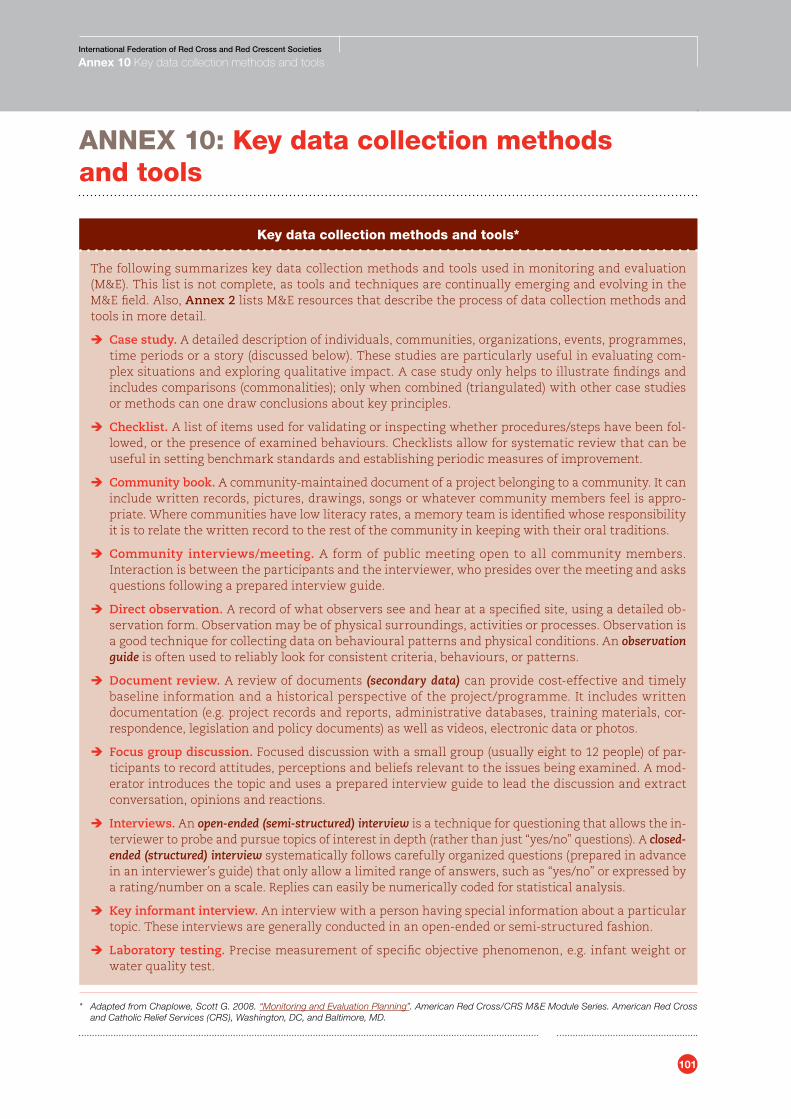
101
International Federation of Red Cross and Red Crescent Societies
Annex 10 Key data collection methods and tools
AnnEx 10: Key data collection methods and tools
Key data collection methods and tools*
The following summarizes key data collection methods and tools used in monitoring and evaluation (M&E). This list is not complete, as tools and techniques are continually emerging and evolving in the M&E field. Also, Annex 2 lists M&E resources that describe the process of data collection methods and tools in more detail.
Î Case study. A detailed description of individuals, communities, organizations, events, programmes, time periods or a story (discussed below). These studies are particularly useful in evaluating com-plex situations and exploring qualitative impact. A case study only helps to illustrate findings and includes comparisons (commonalities); only when combined (triangulated) with other case studies or methods can one draw conclusions about key principles.
Î Checklist. A list of items used for validating or inspecting whether procedures/steps have been fol-lowed, or the presence of examined behaviours. Checklists allow for systematic review that can be useful in setting benchmark standards and establishing periodic measures of improvement.
Î Community book. A community-maintained document of a project belonging to a community. It can include written records, pictures, drawings, songs or whatever community members feel is appro-priate. Where communities have low literacy rates, a memory team is identified whose responsibility it is to relate the written record to the rest of the community in keeping with their oral traditions.
Î Community interviews/meeting. A form of public meeting open to all community members. Interaction is between the participants and the interviewer, who presides over the meeting and asks questions following a prepared interview guide.
Î Direct observation. A record of what observers see and hear at a specified site, using a detailed ob-servation form. Observation may be of physical surroundings, activities or processes. Observation is a good technique for collecting data on behavioural patterns and physical conditions. An observation guide is often used to reliably look for consistent criteria, behaviours, or patterns.
Î Document review. A review of documents (secondary data) can provide cost-effective and timely baseline information and a historical perspective of the project/programme. It includes written documentation (e.g. project records and reports, administrative databases, training materials, cor-respondence, legislation and policy documents) as well as videos, electronic data or photos.
Î Focus group discussion. Focused discussion with a small group (usually eight to 12 people) of par-ticipants to record attitudes, perceptions and beliefs relevant to the issues being examined. A mod-erator introduces the topic and uses a prepared interview guide to lead the discussion and extract conversation, opinions and reactions.
Î Interviews. An open-ended (semi-structured) interview is a technique for questioning that allows the in-terviewer to probe and pursue topics of interest in depth (rather than just “yes/no” questions). A closed-ended (structured) interview systematically follows carefully organized questions (prepared in advance in an interviewer’s guide) that only allow a limited range of answers, such as “yes/no” or expressed by a rating/number on a scale. Replies can easily be numerically coded for statistical analysis.
Î Key informant interview. An interview with a person having special information about a particular topic. These interviews are generally conducted in an open-ended or semi-structured fashion.
Î Laboratory testing. Precise measurement of specific objective phenomenon, e.g. infant weight or water quality test.
* Adapted from Chaplowe, Scott G. 2008. “Monitoring and Evaluation Planning”. American Red Cross/CRS M&E Module Series. American Red Cross and Catholic Relief Services (CRS), Washington, DC, and Baltimore, MD.
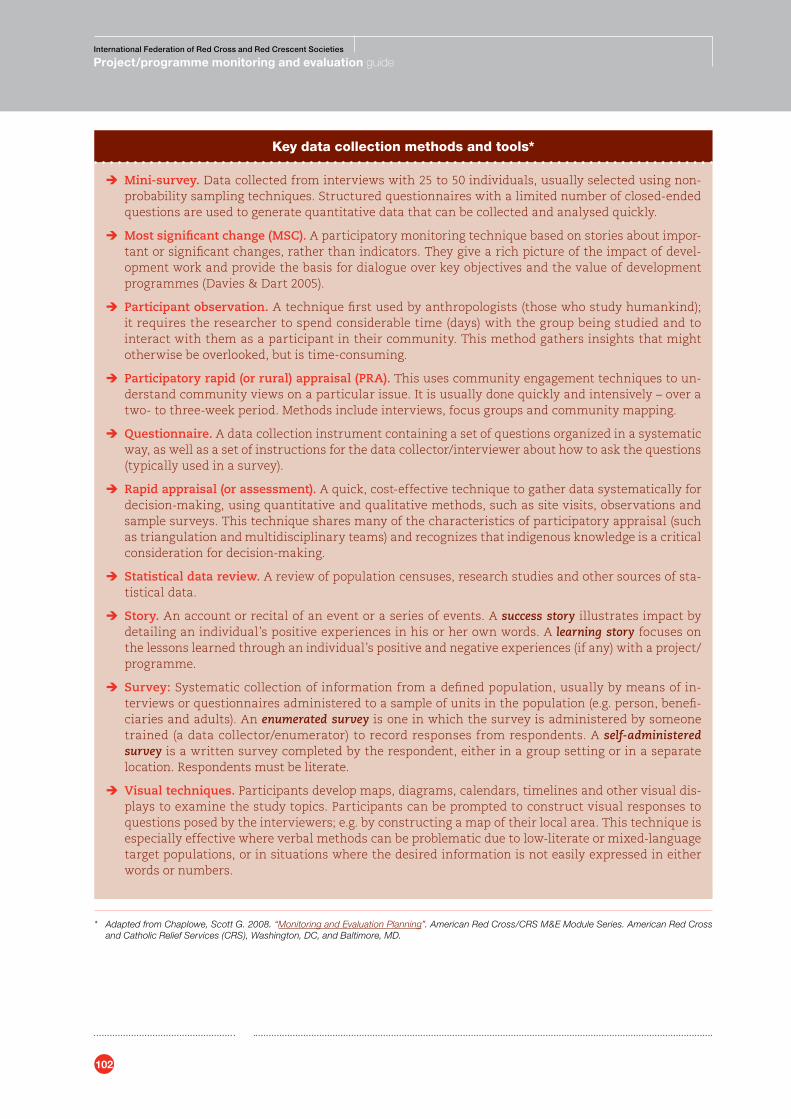
102
International Federation of Red Cross and Red Crescent Societies
Project/programme monitoring and evaluation guide
Key data collection methods and tools*
Î Mini-survey. Data collected from interviews with 25 to 50 individuals, usually selected using non-probability sampling techniques. Structured questionnaires with a limited number of closed-ended questions are used to generate quantitative data that can be collected and analysed quickly.
Î Most significant change (MSC). A participatory monitoring technique based on stories about impor-tant or significant changes, rather than indicators. They give a rich picture of the impact of devel-opment work and provide the basis for dialogue over key objectives and the value of development programmes (Davies & Dart 2005).
Î Participant observation. A technique first used by anthropologists (those who study humankind); it requires the researcher to spend considerable time (days) with the group being studied and to interact with them as a participant in their community. This method gathers insights that might otherwise be overlooked, but is time-consuming.
Î Participatory rapid (or rural) appraisal (PRA). This uses community engagement techniques to un-derstand community views on a particular issue. It is usually done quickly and intensively – over a two- to three-week period. Methods include interviews, focus groups and community mapping.
Î Questionnaire. A data collection instrument containing a set of questions organized in a systematic way, as well as a set of instructions for the data collector/interviewer about how to ask the questions (typically used in a survey).
Î Rapid appraisal (or assessment). A quick, cost-effective technique to gather data systematically for decision-making, using quantitative and qualitative methods, such as site visits, observations and sample surveys. This technique shares many of the characteristics of participatory appraisal (such as triangulation and multidisciplinary teams) and recognizes that indigenous knowledge is a critical consideration for decision-making.
Î Statistical data review. A review of population censuses, research studies and other sources of sta-tistical data.
Î Story. An account or recital of an event or a series of events. A success story illustrates impact by detailing an individual’s positive experiences in his or her own words. A learning story focuses on the lessons learned through an individual’s positive and negative experiences (if any) with a project/programme.
Î Survey: Systematic collection of information from a defined population, usually by means of in-terviews or questionnaires administered to a sample of units in the population (e.g. person, benefi-ciaries and adults). An enumerated survey is one in which the survey is administered by someone trained (a data collector/enumerator) to record responses from respondents. A self-administered survey is a written survey completed by the respondent, either in a group setting or in a separate location. Respondents must be literate.
Î Visual techniques. Participants develop maps, diagrams, calendars, timelines and other visual dis-plays to examine the study topics. Participants can be prompted to construct visual responses to questions posed by the interviewers; e.g. by constructing a map of their local area. This technique is especially effective where verbal methods can be problematic due to low-literate or mixed-language target populations, or in situations where the desired information is not easily expressed in either words or numbers.
* Adapted from Chaplowe, Scott G. 2008. “Monitoring and Evaluation Planning”. American Red Cross/CRS M&E Module Series. American Red Cross and Catholic Relief Services (CRS), Washington, DC, and Baltimore, MD.
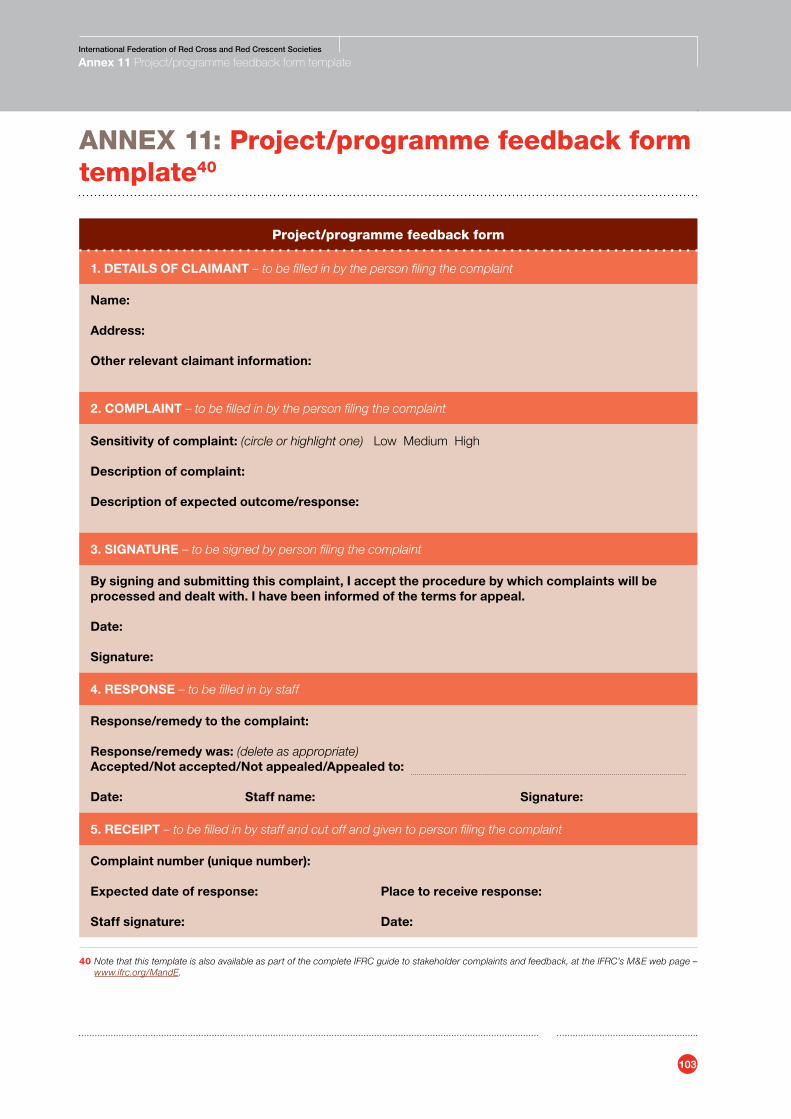
103
International Federation of Red Cross and Red Crescent Societies
Annex 11 Project/programme feedback form template
AnnEx 11: Project/programme feedback form template40
Project/programme feedback form
1. DETAILS OF CLAIMANT – to be filled in by the person filing the complaint
Name:
Address:
Other relevant claimant information:
2. COMPLAINT – to be filled in by the person filing the complaint
Sensitivity of complaint: (circle or highlight one) Low Medium High
Description of complaint:
Description of expected outcome/response:
3. SIGNATURE – to be signed by person filing the complaint
By signing and submitting this complaint, I accept the procedure by which complaints will be processed and dealt with. I have been informed of the terms for appeal.
Date:
Signature:
4. RESPONSE – to be filled in by staff
Response/remedy to the complaint:
Response/remedy was: (delete as appropriate) Accepted/Not accepted/Not appealed/Appealed to:
Date: Staff name: Signature:
5. RECEIPT – to be filled in by staff and cut off and given to person filing the complaint
Complaint number (unique number):
Expected date of response: Place to receive response:
Staff signature: Date:
40 Note that this template is also available as part of the complete IFRC guide to stakeholder complaints and feedback, at the IFRC’s M&E web page – www.ifrc.org/MandE.
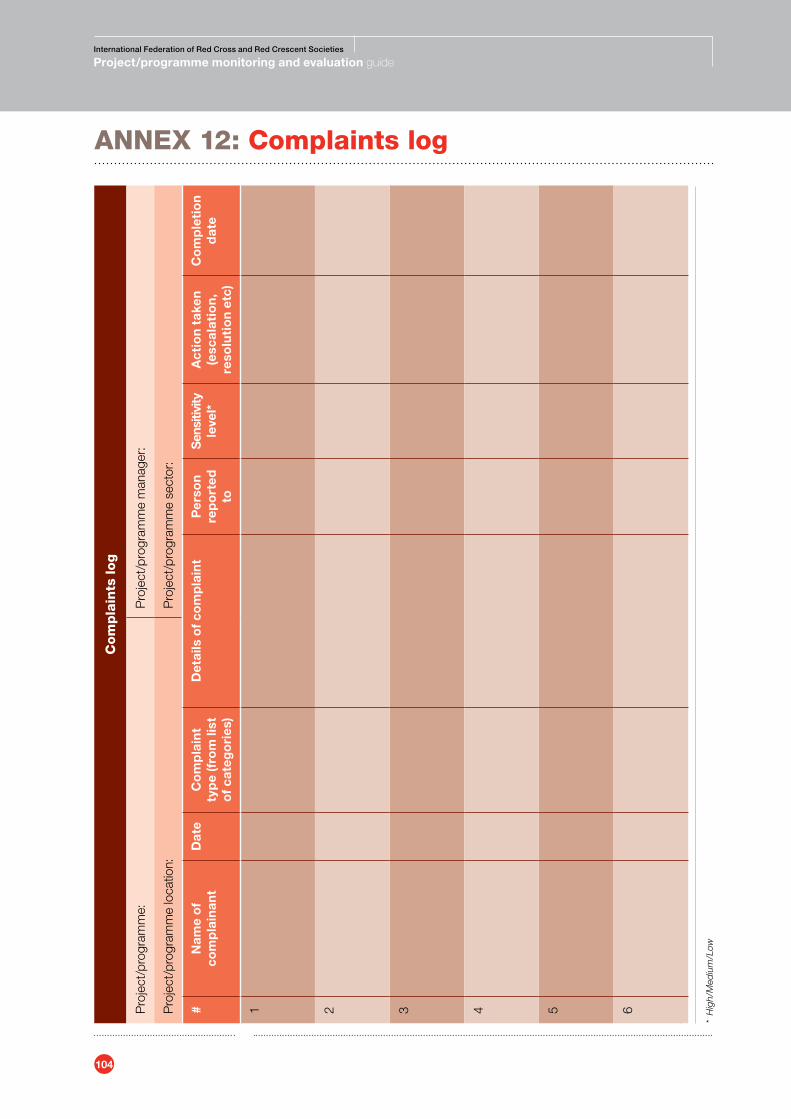
104
International Federation of Red Cross and Red Crescent Societies
Project/programme monitoring and evaluation guide
AnnEx 12: Complaints logC
om
pla
ints
log
Pro
ject
/pro
gram
me:
Pro
ject
/pro
gram
me
man
ager
:
Pro
ject
/pro
gram
me
loca
tion:
Pro
ject
/pro
gram
me
sect
or:
#N
ame
of
com
pla
inan
tD
ate
Co
mp
lain
t ty
pe
(fro
m li
st
of
cate
go
ries
)
Det
ails
of
com
pla
int
Per
son
rep
ort
ed
to
Sen
sitiv
ity
leve
l*
Act
ion
take
n (e
scal
atio
n,
reso
luti
on
etc)
Co
mp
leti
on
dat
e
1 2 3 4 5 6
* H
igh
/Med
ium
/Low
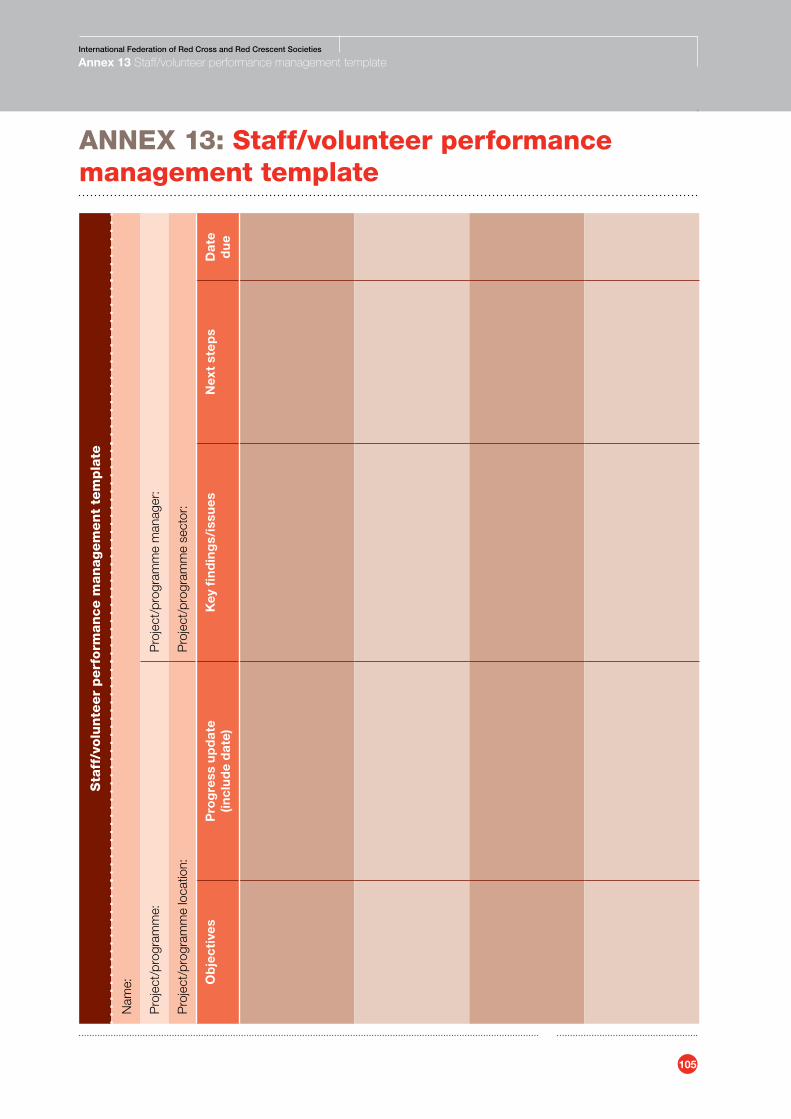
105
International Federation of Red Cross and Red Crescent Societies
Annex 13 Staff/volunteer performance management template
AnnEx 13: Staff/volunteer performance management template
Sta
ff/v
olu
nte
er
perf
orm
an
ce m
an
agem
ent
tem
pla
te
Nam
e:
Pro
ject
/pro
gram
me:
Pro
ject
/pro
gram
me
man
ager
:
Pro
ject
/pro
gram
me
loca
tion:
Pro
ject
/pro
gram
me
sect
or:
Ob
ject
ives
Pro
gre
ss u
pd
ate
(incl
ud
e d
ate)
Key
fin
din
gs/
issu
esN
ext
step
sD
ate
du
e
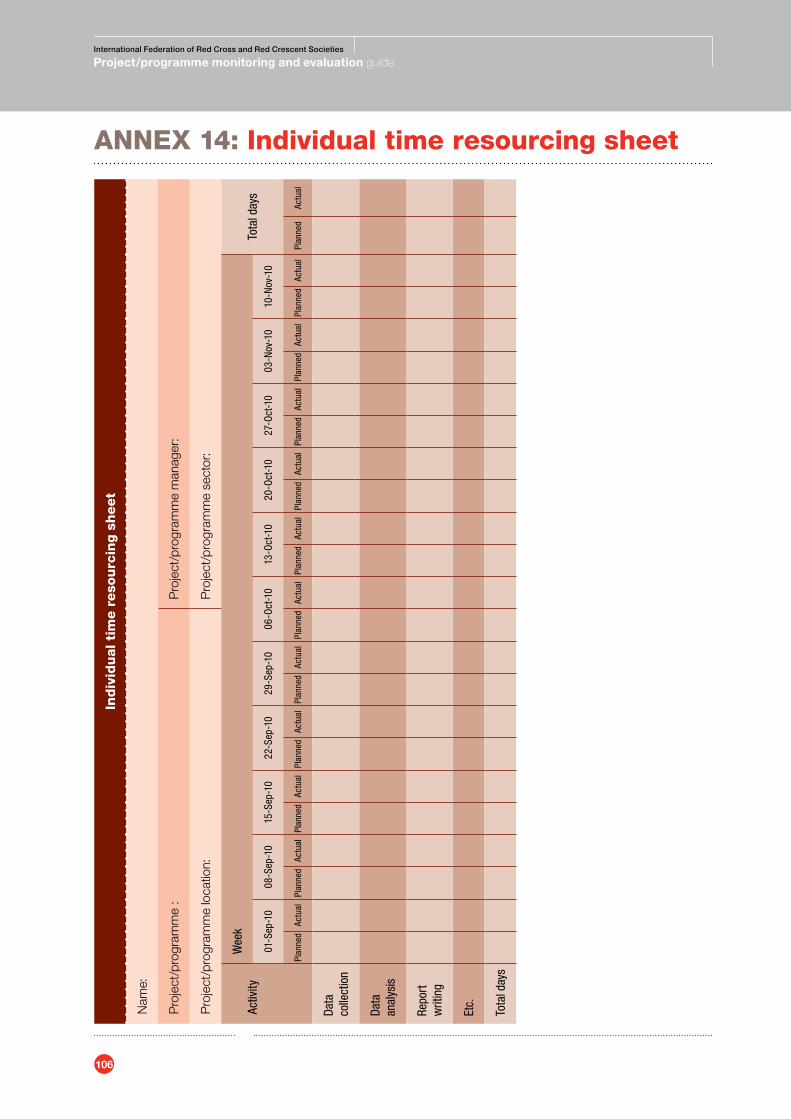
106
International Federation of Red Cross and Red Crescent Societies
Project/programme monitoring and evaluation guide
AnnEx 14: Individual time resourcing sheetIn
div
idu
al ti
me r
eso
urc
ing s
heet
Nam
e:
Pro
ject
/pro
gram
me
:P
roje
ct/p
rogr
amm
e m
anag
er:
Pro
ject
/pro
gram
me
loca
tion:
Pro
ject
/pro
gram
me
sect
or:
Activ
ityW
eek
Tota
l day
s01
-Sep
-10
08-S
ep-1
015
-Sep
-10
22-S
ep-1
029
-Sep
-10
06-O
ct-1
013
-Oct
-10
20-O
ct-1
027
-Oct
-10
03-N
ov-1
010
-Nov
-10
Plan
ned
Actu
alPl
anne
dAc
tual
Plan
ned
Actu
alPl
anne
dAc
tual
Plan
ned
Actu
alPl
anne
dAc
tual
Plan
ned
Actu
alPl
anne
dAc
tual
Plan
ned
Actu
alPl
anne
dAc
tual
Plan
ned
Actu
alPl
anne
dAc
tual
Data
co
llect
ion
Data
an
alys
is
Repo
rt
writ
ing
Etc.
Tota
l day
s
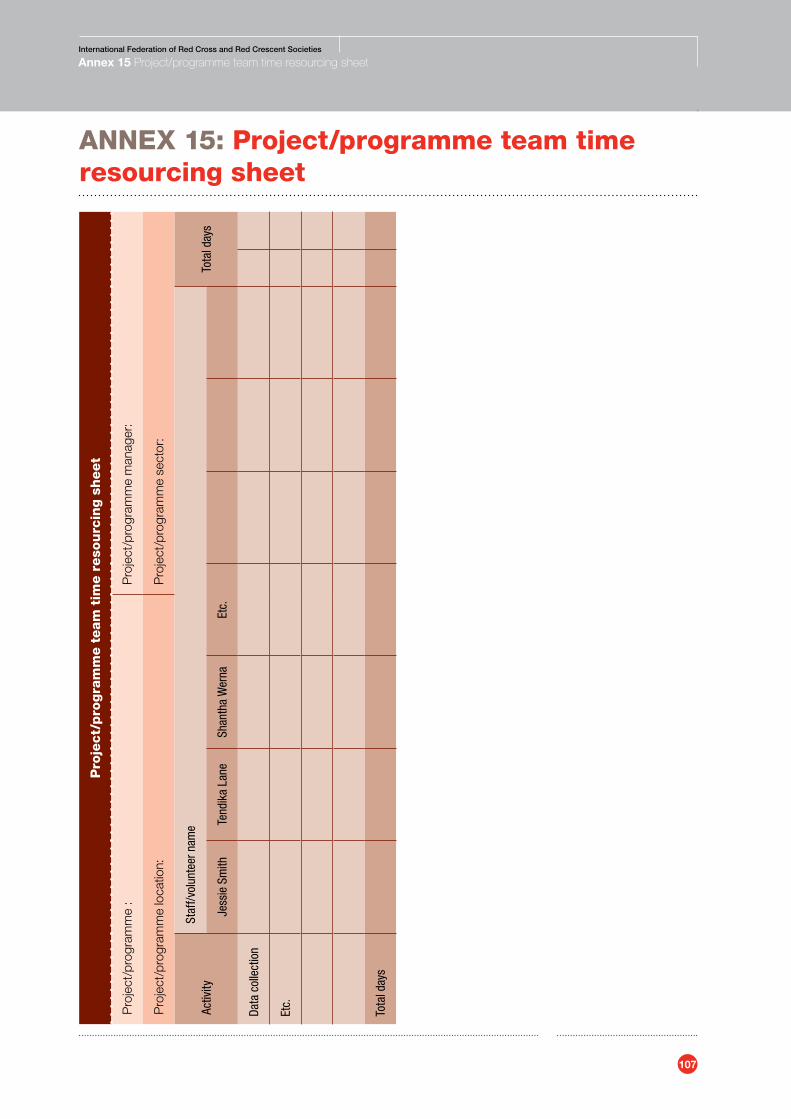
107
International Federation of Red Cross and Red Crescent Societies
Annex 15 Project/programme team time resourcing sheet
AnnEx 15: Project/programme team time resourcing sheet
Pro
ject/
pro
gra
mm
e t
eam
tim
e r
eso
urc
ing s
heet
Pro
ject
/pro
gram
me
:P
roje
ct/p
rogr
amm
e m
anag
er:
Pro
ject
/pro
gram
me
loca
tion:
Pro
ject
/pro
gram
me
sect
or:
Activ
itySt
aff/v
olun
teer
nam
eTo
tal d
ays
Jess
ie S
mith
Tend
ika
Lane
Shan
tha
Wer
naEt
c.
Data
col
lect
ion
Etc.
Tota
l day
s
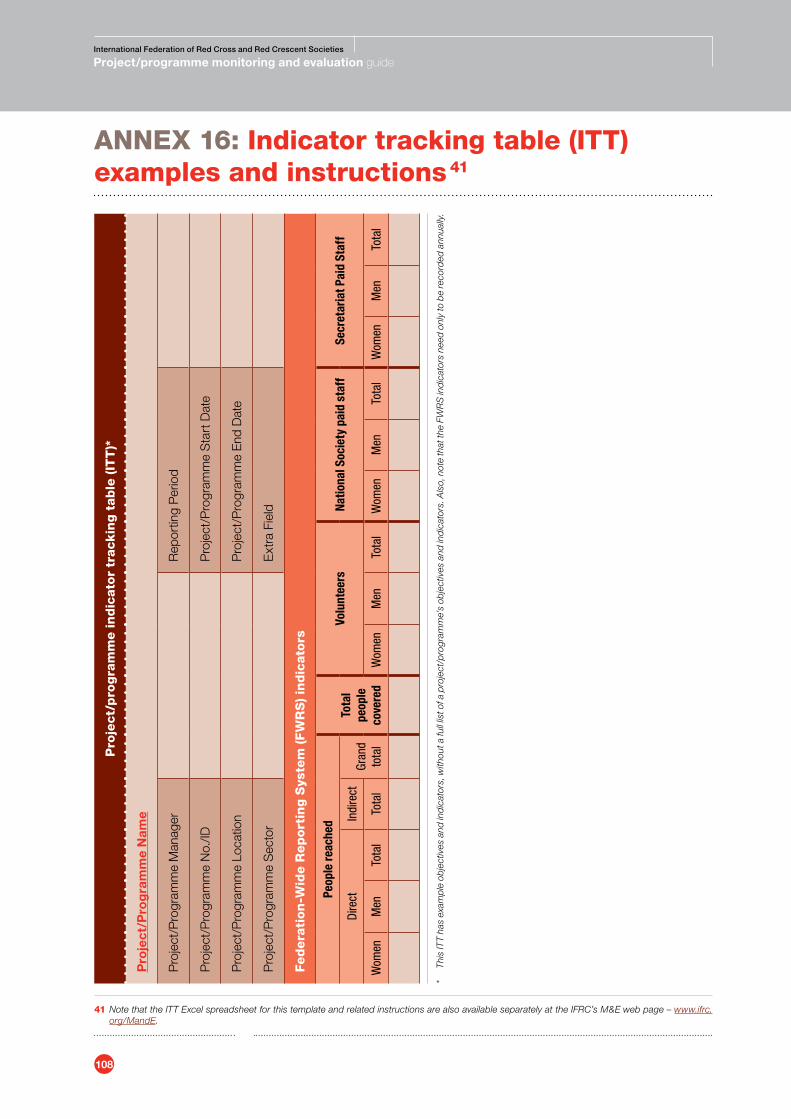
108
International Federation of Red Cross and Red Crescent Societies
Project/programme monitoring and evaluation guide
AnnEx 16: Indicator tracking table (ITT) examples and instructions 41
41 Note that the ITT Excel spreadsheet for this template and related instructions are also available separately at the IFRC’s M&E web page – www.ifrc.org/MandE.
Pro
ject/
pro
gra
mm
e in
dic
ato
r tr
ackin
g t
ab
le (IT
T)*
Pro
ject
/Pro
gra
mm
e N
ame
Pro
ject
/Pro
gram
me
Man
ager
Rep
ortin
g P
erio
d
Pro
ject
/Pro
gram
me
No.
/IDP
roje
ct/P
rogr
amm
e S
tart
Dat
e
Pro
ject
/Pro
gram
me
Loca
tion
Pro
ject
/Pro
gram
me
End
Dat
e
Pro
ject
/Pro
gram
me
Sec
tor
Ext
ra F
ield
Fed
era
tion
-Wid
e R
ep
ort
ing S
yste
m (F
WR
S) in
dic
ato
rs
Peop
le re
ache
dTo
tal
peop
le
cove
red
Volu
ntee
rsNa
tiona
l Soc
iety
pai
d st
aff
Secr
etar
iat P
aid
Staf
fDi
rect
In
dire
ctGr
and
tota
lW
omen
Men
Tota
l To
tal
Wom
enM
enTo
tal
Wom
enM
enTo
tal
Wom
enM
enTo
tal
* Th
is IT
T ha
s ex
amp
le o
bje
ctiv
es a
nd in
dic
ator
s, w
ithou
t a fu
ll lis
t of a
pro
ject
/pro
gram
me’
s ob
ject
ives
and
ind
icat
ors.
Als
o, n
ote
that
the
FWR
S in
dic
ator
s ne
ed o
nly
to b
e re
cord
ed a
nnua
lly.

109
International Federation of Red Cross and Red Crescent Societies
Annex 16 Indicator tracking table (ITT) examples and instructions
Pro
ject
/pro
gra
mm
e lo
gfr
ame
ind
icat
ors
IND
ICA
TO
R
Pro
ject
b
asel
ine
LoP
ta
rget
Lo
P
actu
al
% o
f Lo
P
targ
et
Ann
ual
targ
et
Year
to
dat
e ac
tual
% o
f an
nual
ta
rget
Q1
Rep
ort
ing
per
iod
Q2
Rep
ort
ing
per
iod
Q3
Rep
ort
ing
per
iod
Q4
Rep
ort
ing
per
iod
Dat
eVa
lue
Targ
etA
ctua
l%
of
targ
etTa
rget
Act
ual
% o
f ta
rget
Targ
etA
ctua
l%
of
targ
etTa
rget
Act
ual
% o
f ta
rget
Go
al
Ga.
OU
TC
OM
E 1
. Exa
mp
le –
Imp
rove
d c
om
mu
nit
y ca
pac
ity
to p
rep
are
for
and
res
po
nd
to
dis
aste
rs.
1a. E
xam
ple
- %
peo
ple
in p
artic
ipat
ing
com
mun
ities
who
pra
ctis
e 5
or m
ore
disa
ster
pre
pare
dnes
s m
easu
res
iden
tified
in th
e co
mm
unity
dis
aste
r m
anag
emen
t (D
M) p
lan.
1-De
c10
%80
%45
%56
%80
%45
%56
%50
%UK
60%
30%
50%
70%
45%
64%
80%
0%
OU
TP
UT
1.1
. Exa
mp
le –
Imp
rove
d c
om
mu
nit
y aw
aren
ess
of
mea
sure
s to
pre
par
e fo
r an
d r
esp
on
d t
o d
iast
ers.
1.1a
. Exa
mpl
e -
% p
eopl
e in
pa
rtic
ipat
ing
com
mun
ities
who
can
id
entif
y at
leas
t 5 p
repa
redn
ess
and
5 re
spon
se m
easu
res.
1-De
c20
%70
%55
%79
%70
%55
%79
%40
%20
%50
%50
%30
%60
%60
%55
%92
%70
%0%
OU
TP
UT
1.2
. Exa
mp
le –
Co
mm
un
ity
Dis
aste
r M
anag
emen
t P
lan
s ar
e d
evel
op
ed a
nd
tes
ted
by
Co
mm
un
ity
Dis
aste
r M
anag
emen
t C
om
mit
tees
.
1.2a
. Exa
mpl
e -
num
ber o
f pa
rtic
ipat
ing
com
mun
ities
that
hav
e a
test
ed D
isas
ter M
anag
emen
t Pla
n.
1-De
c0
100
2323
%50
2346
%10
330
%10
550
%20
1575
%10
0%
OU
TC
OM
E 2
. Exa
mp
le –
Sch
oo
l cap
acit
y to
pre
par
e fo
r an
d r
esp
on
d t
o d
isas
ters
is im
pro
ved
.
2a. E
xam
ple
- %
of s
choo
ls th
at
have
pas
sed
the
annu
al d
isas
ter
safe
ty in
spec
tion
from
the
Min
istr
y of
Di
sast
er M
anag
emen
t.
1-De
c10
%50
%30
%60
%50
%30
%60
%20
%15
%75
%30
%25
%83
%40
%30
%75
%50
%0%
OU
TP
UT
2.1
. Exa
mp
le –
Sch
oo
l Dis
aste
r M
anag
emen
t P
lan
s ar
e d
evel
op
ed a
nd
tes
ted
at
par
tici
pat
ing
sch
oo
ls.
2.1a
. Exa
mpl
e -
num
ber o
f pa
rtic
ipat
ing
scho
ols
that
hav
e a
new
D
M p
lan
test
ed.
1-De
c0
100
3030
%45
3067
%N
AN
A10
550
%15
1067
%20
1575
%
OU
TP
UT
2.2
. Exa
mp
le –
Dis
aste
r ri
sk r
edu
cti
on
less
on
s ar
e in
clu
ded
in t
he
curr
icu
lum
.
2.2a
. Exa
mpl
e -
% o
f stu
dent
s in
the
targ
eted
sch
ools
who
hav
e re
ceiv
ed
disa
ster
pre
pare
dnes
s an
d di
sast
er
risk
educ
atio
n.
1-De
c25
%75
%35
%47
%50
%35
%70
%25
%UK
30%
25%
83%
40%
35%
88%
50%
0%
110
International Federation of Red Cross and Red Crescent Societies
Project/programme monitoring and evaluation guide
ITT purpose and compliance• The ITT is an important data management tool for recording and monitoring indicator performance.
It informs project/programme implementation and management, tracking progress towards specific targets for better transparency and accountability within and outside the IFRC.
• This ITT format is to be used by all secretariat-funded projects/programmes at the field level, and is to in-form other indicator reporting formats within the secretariat and the larger IFRC community as appropriate.
• ITT submission should follow the agreed (required) frequency and reporting lines according to the specific project/programme. Typically the ITT is completed on a quarterly reporting basis, as the spread-sheet is currently formatted. However, for shorter projects/programmes, it can be reformatted to a monthly basis.
• Typically, the ITT is completed by project/programme team members and submitted by the project/pro-gramme manager. The ITT should be included as an annex in the project/programme management report. Indicator performance (especially any variance greater than ten per cent) should be discussed in the report.
ITT instructions42
ITT format
• Initial set-up of the ITT for a specific project/programme will take some time, but thereafter it will be easier to complete.
• The ITT is designed and managed in an Excel worksheet that contains all of the objectives of the project/programme logframe, with indicators listed under their objectives. The Excel worksheet for the IFRC’s ITT can be accessed at the IFRC’s web site for M&E: www.ifrc.org/MandE
• Excel formulas should be embedded in some cells of the ITT worksheet. These formulas make au-tomatic calculations (e.g. percentages) and therefore reduce the amount of data that must be entered manually. However, even with the help of formulas to automatically calculate, it is important to be care-ful that the data has been calculated as intended. If there are problems with the formulas, you may need to re-enter them. If necessary, seek the assistance of someone experienced with Excel.
• As the ITT mirrors the project/programme logframe, the listed objectives and indicators in the work-sheet should remain the same throughout the life of the project/programme (unless the logframe itself is to be changed).
• Additional guidance for the ITT and the overall M&E system can be found in the IFRC project/programme M&E guideline (www.ifrc.org/MandE).
ITT completion – overall reminders
• Data reported in the ITT should be confirmed for the reporting period, and not made up of estimates or guesses. If you are confused about what an indicator means or how to report on it, refer to your project/programme M&E plan.
• Values for indicators should be numeric with descriptions reserved for the narrative report.
• Remember that “0”, “NA” and “UK” all mean different things. Entering “0” means that no progress was made against an indicator for the given time period. If your project/programme does not measure an indicator for a given time period (e.g. no target was set), enter “NA” (not applicable). Only enter “UK” (un-known) for instances where an indicator target has been set, but the indicator can not be measured due to missing or unreliable data (e.g. the M&E system may not be in place yet).
• For indicators that are measured in percentages, enter the numerator and denominator as a ratio and then format the cell as a percentage (e.g. 50 per cent, not 0.5). This ensures that all of the relevant data is entered into the ITT.
• A new ITT worksheet should be added for each new project/programme year as needed.
42 The IFRC’s format and instructions for the ITT were largely adopted from those developed and piloted by the American Red Cross for its Tsunami Recovery Programme (2005-2010).
111
International Federation of Red Cross and Red Crescent Societies
Annex 16 Indicator tracking table (ITT) examples and instructions
Project/Programme background information
• Project/Programme Name: Enter the project/programme name used in the proposal.
• Project/Programme No. or ID: Enter the project/programme number or ID.
• Project/Programme Manager: Enter the project/programme manager’s name.
• Project/Programme Sector: Select the appropriate project/programme sector, e.g. disaster management.
• Project/Programme Location: Enter the field location of where the project/programme is being implement-ed (e.g. district(s) and/or province and country).
• Reporting Period: Enter the reporting period for which the ITT is being completed.
• Project/Programme Start Date: Enter the date for when the project/programme implementation will begin.
• Project/Programme End Date: Enter the expected date for when the project/programme will end.
Federation-Wide Reporting System (FWRS) indicators (for more detailed guidance on the FWRS, Red Cross Crescent users can visit FedNet, https://fednet.ifrc.org/sw194270.asp)
• The FWRS indicators allow us (IFRC) to annually report on our global performance across project/programme areas and locations. However, they are an important aspect of project/programme perfor-mance and should be monitored and reported on in any case.
• The FWRS indicators only need to be reported on an annual basis, but the project/programme can monitor them according to its own needs. It is likely that the indicator values will be determined at the end of the calendar year, corresponding with the FWRS reporting requirements.
• The FWRS indicator guide should be carefully consulted to ensure that indicator reporting is consistent and accurate. Measuring the FWRS indicators can be tricky, especially due to issues of double-counting and direct/indirect recipients. Therefore, use the FWRS indicator guide, and it may be necessary to seek the technical assistance of an IFRC FWRS resource person.
• As the FWRS indicators do not need to be reported on a quarterly basis, their measurement will likely be determined from a review of the existing indicator performance (and with caution to avoid double-counting according to the FWRS indicator guide).
• Targets for the FWRS indicators are recommended for people reached, and up to the project/programme’s management for the other indicators.
Logframe objective and indicators statements
• Enter the project/programme statements for the project/programme goal, outcome(s), outputs, and indi-cators as they appear in the logframe.
Logframe indicator reporting
• Project/programme baseline date/value – Enter the date of the project/programme baseline and value for this indicator. If a baseline has not yet been conducted but is planned, leave this blank. If no baseline will be conducted or no data is required for a particular indicator, write “NA” (for “not applicable”). Re-member, not all indicators will need to be measured during the baseline. For instance, in example indi-cator 1.2a and 2.1a, the value is zero because participating communities and schools had not developed any disaster management plans.
• Target – Targets should be set for each quarter and are usually entered into the indicator tracking sheet during the same time period as the planning of the annual project budget for the next year. If your project/programme does not measure (set a target) an indicator for a respective quarter, enter “NA” not “0”. For instance, in example indicator 2.1a, targets are “NA” because community disaster management plans had not yet been developed to be tested.
• Actual – Enter the actual indicator value for the current reporting period. Enter only accurate data, not es-timated data. Entering “0” means that no progress was made against an indicator for the given time period.
112
International Federation of Red Cross and Red Crescent Societies
Project/programme monitoring and evaluation guide
If your project/programme does not measure this indicator for a respective quarter, write “NA”. Enter “UK” (unknown) for instances where an indicator target has been set, but the indicator cannot be measured due to missing or unreliable data (e.g. the M&E system may not be in place yet). For instance, in example indicator 1.a, for the first quarter, the target was set at identifying 50 people in participating communities who practiced 5 or more disaster preparedness measures identified in the community DM plan, but it was not possible to measure this indicator for this quarter in view of missing data.
• Percentage of target – This cell has a formula to automatically calculate the percentage of the target that was actually achieved by the indicator during the reporting period (by dividing actual by the target). Double check to make sure that the percentage is accurate and that the formula is working correctly. In example indicator 2.2a for the second quarter, the number of students in the targeted schools who received disaster preparedness and disaster risk education was larger than the original target set for Q2 for that indicator which resulted in a percentage of target of 130 per cent.
• Annual target – Annual targets are entered into this column at the start of the project/programme. All annual targets should be included in each annual indicator tracking sheet. Annual targets for individual indicators may be revised at the end of the year to reflect major programmatic changes/revisions. However, revisions should not affect total life of project targets, and any revision should be authorized (e.g. approved by the donor). See Annual targets in indicators 1a, 1.1a, 1.2a, 2a and 2.2a.
• Year to date actual – This value will change each quarter there has been indicator performance. Depend-ing on the indicator, you may want to create a formula to tabulate this automatically. Some indicators may need to be calculated manually (e.g. where the actual is not the sum of all quarterly actuals but the highest number). See Year to date actuals in indicators 1a, 1.1a, 1.2a, 2a and 2.2a.
• Percentage of annual target – This cell has a formula to automatically calculate this value by dividing the Year to date actual by the Annual target. Double-check to make sure that this is the accurate percentage and that the formula is working correctly. See Percentage of annual target in indicators 1a, 1.1a, 1.2a, 2a and 2.2a.
• Life of project (LoP) target – LoP targets are entered into this column at the start of the project/programme. All LoP targets should be included in each annual indicator tracking sheet. Generally, LoP targets should not be revised except under rare instances, and with the proper authorization (e.g. from donors). See LoP targets in indicators 1a, 1.1a, 1.2a, 2a and 2.2a.
• Life of project actual – This value will change each quarter there has been indicator performance. Depend-ing on the indicator, you may want to create a formula to tabulate this automatically. Some indicators may need to be calculated manually (e.g. where the LoP actual is not the sum of all quarterly actuals but the highest number). See LoP actuals in indicators 1a, 1.1a, 1.2a, 2a and 2.2a.
• Percentage of LoP target – This cell has a formula to automatically calculate this value by dividing the actual to date by the life of project/programme target. Double-check to make sure that this is the accurate percentage and the formula is working correctly. See Percentage of LoP target in indicators 1a, 1.1a, 1.2a, 2a and 2.2a.
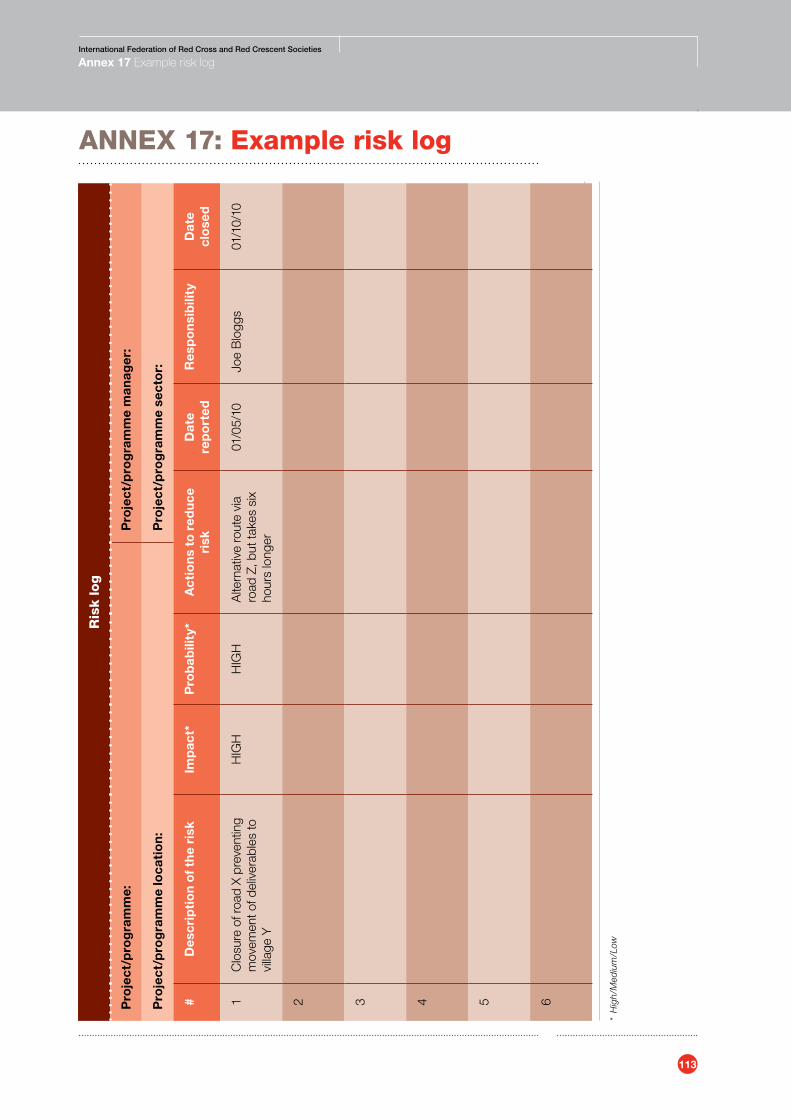
113
International Federation of Red Cross and Red Crescent Societies
Annex 17 Example risk log
AnnEx 17: Example risk log
Ris
k lo
g
Pro
ject
/pro
gra
mm
e:P
roje
ct/p
rog
ram
me
man
ager
:
Pro
ject
/pro
gra
mm
e lo
cati
on
:P
roje
ct/p
rog
ram
me
sect
or:
#D
escr
ipti
on
of
the
risk
Imp
act*
Pro
bab
ility
*A
ctio
ns
to r
edu
ce
risk
Dat
e re
po
rted
Res
po
nsi
bili
tyD
ate
clo
sed
1C
losu
re o
f roa
d X
prev
entin
g m
ovem
ent o
f del
iver
able
s to
vi
llage
Y
HIG
HH
IGH
Alte
rnat
ive
rout
e vi
a ro
ad Z
, but
take
s si
x ho
urs
long
er
01/0
5/10
Joe
Blo
ggs
01/1
0/10
2 3 4 5 6
* H
igh
/Med
ium
/Low
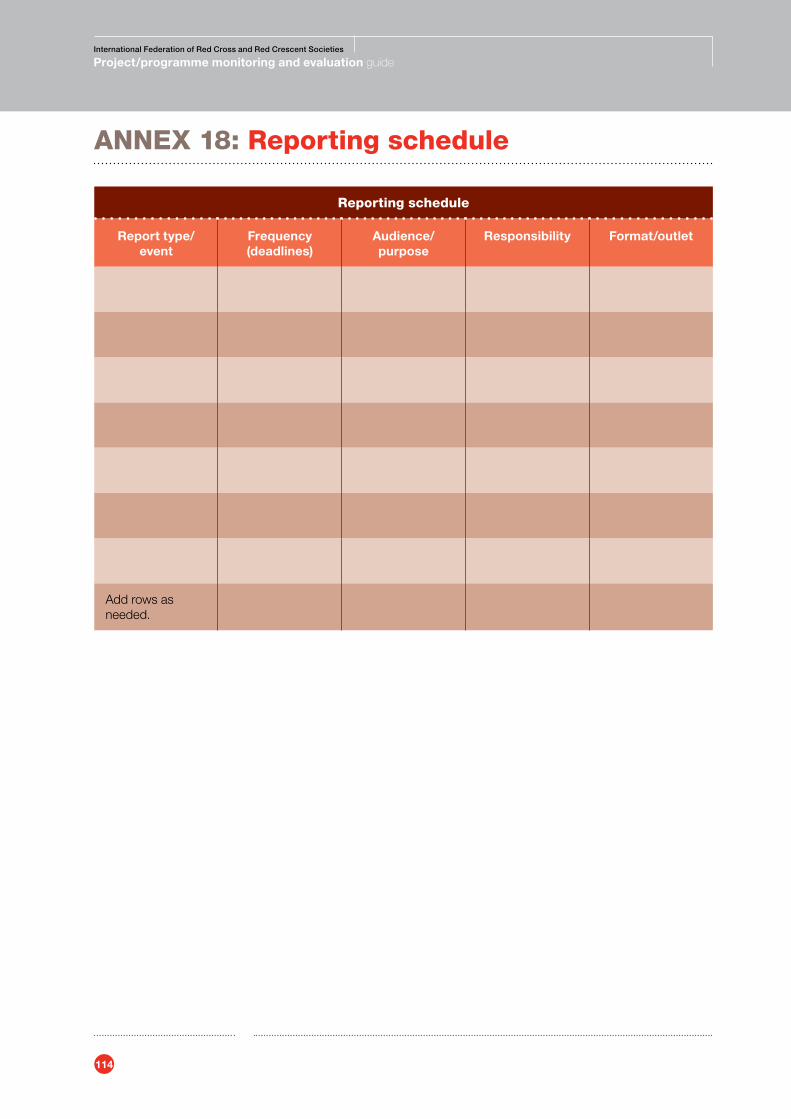
114
International Federation of Red Cross and Red Crescent Societies
Project/programme monitoring and evaluation guide
AnnEx 18: Reporting schedule
Reporting schedule
Report type/event
Frequency(deadlines)
Audience/purpose
Responsibility Format/outlet
Add rows as needed.
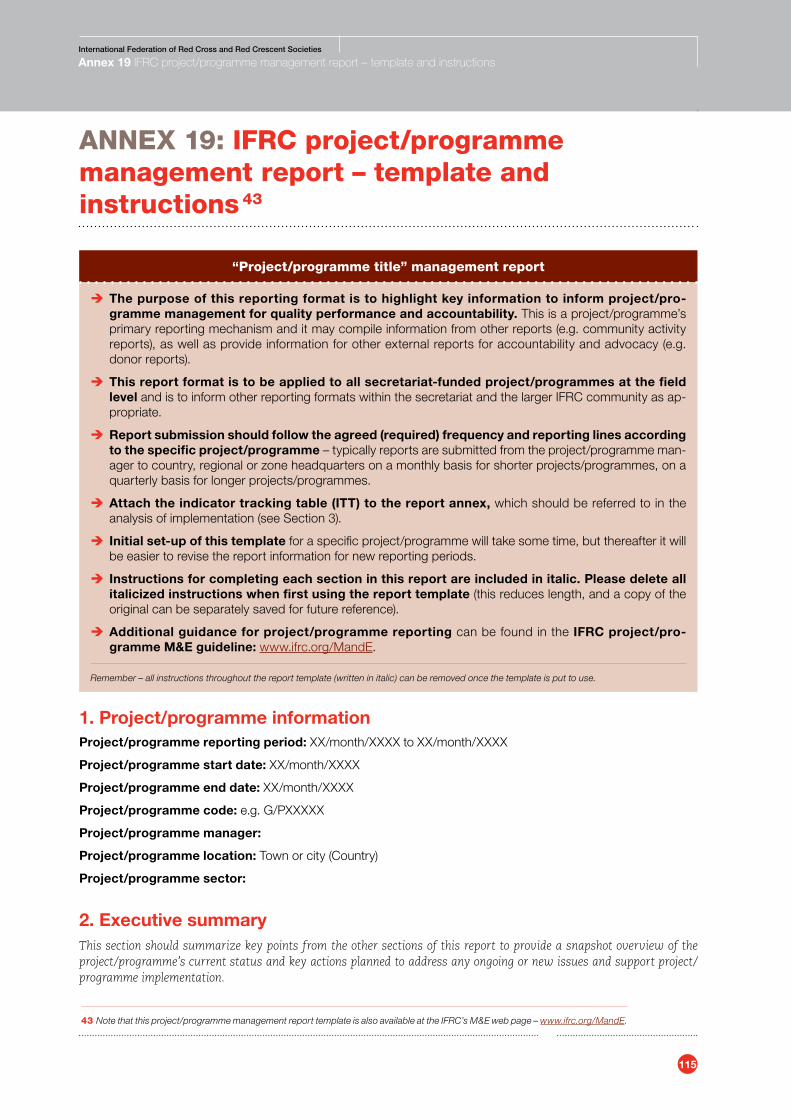
115
International Federation of Red Cross and Red Crescent Societies
Annex 19 IFRC project/programme management report – template and instructions
AnnEx 19: IFRC project/programme management report – template and instructions 43
“Project/programme title” management report
Î The purpose of this reporting format is to highlight key information to inform project/pro-gramme management for quality performance and accountability. This is a project/programme’s primary reporting mechanism and it may compile information from other reports (e.g. community activity reports), as well as provide information for other external reports for accountability and advocacy (e.g. donor reports).
Î This report format is to be applied to all secretariat-funded project/programmes at the field level and is to inform other reporting formats within the secretariat and the larger IFRC community as ap-propriate.
Î Report submission should follow the agreed (required) frequency and reporting lines according to the specific project/programme – typically reports are submitted from the project/programme man-ager to country, regional or zone headquarters on a monthly basis for shorter projects/programmes, on a quarterly basis for longer projects/programmes.
Î Attach the indicator tracking table (ITT) to the report annex, which should be referred to in the analysis of implementation (see Section 3).
Î Initial set-up of this template for a specific project/programme will take some time, but thereafter it will be easier to revise the report information for new reporting periods.
Î Instructions for completing each section in this report are included in italic. Please delete all italicized instructions when first using the report template (this reduces length, and a copy of the original can be separately saved for future reference).
Î Additional guidance for project/programme reporting can be found in the IFRC project/pro-gramme M&E guideline: www.ifrc.org/MandE.
Remember – all instructions throughout the report template (written in italic) can be removed once the template is put to use.
1. Project/programme information Project/programme reporting period: XX/month/XXXX to XX/month/XXXX
Project/programme start date: XX/month/XXXX
Project/programme end date: XX/month/XXXX
Project/programme code: e.g. G/PXXXXX
Project/programme manager:
Project/programme location: Town or city (Country)
Project/programme sector:
2. Executive summary This section should summarize key points from the other sections of this report to provide a snapshot overview of the project/programme’s current status and key actions planned to address any ongoing or new issues and support project/programme implementation.
43 Note that this project/programme management report template is also available at the IFRC’s M&E web page – www.ifrc.org/MandE.
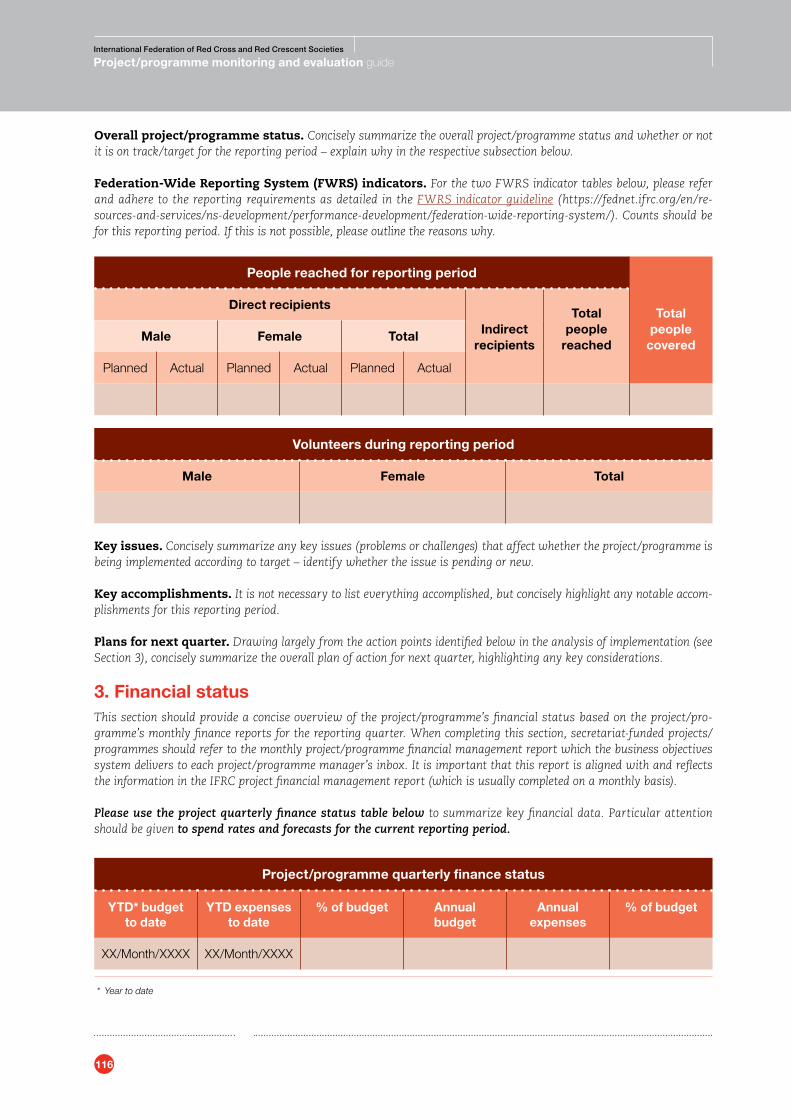
116
International Federation of Red Cross and Red Crescent Societies
Project/programme monitoring and evaluation guide
Overall project/programme status. Concisely summarize the overall project/programme status and whether or not it is on track/target for the reporting period – explain why in the respective subsection below.
Federation-Wide Reporting System (FWRS) indicators. For the two FWRS indicator tables below, please refer and adhere to the reporting requirements as detailed in the FWRS indicator guideline (https://fednet.ifrc.org/en/re-sources-and-services/ns-development/performance-development/federation-wide-reporting-system/). Counts should be for this reporting period. If this is not possible, please outline the reasons why.
People reached for reporting period
Totalpeople
covered
Direct recipients
Indirect recipients
Total people
reachedMale Female Total
Planned Actual Planned Actual Planned Actual
Volunteers during reporting period
Male Female Total
Key issues. Concisely summarize any key issues (problems or challenges) that affect whether the project/programme is being implemented according to target – identify whether the issue is pending or new.
Key accomplishments. It is not necessary to list everything accomplished, but concisely highlight any notable accom-plishments for this reporting period.
Plans for next quarter. Drawing largely from the action points identified below in the analysis of implementation (see Section 3), concisely summarize the overall plan of action for next quarter, highlighting any key considerations.
3. Financial status This section should provide a concise overview of the project/programme’s financial status based on the project/pro-gramme’s monthly finance reports for the reporting quarter. When completing this section, secretariat-funded projects/programmes should refer to the monthly project/programme financial management report which the business objectives system delivers to each project/programme manager’s inbox. It is important that this report is aligned with and reflects the information in the IFRC project financial management report (which is usually completed on a monthly basis).
Please use the project quarterly finance status table below to summarize key financial data. Particular attention should be given to spend rates and forecasts for the current reporting period.
Project/programme quarterly finance status
YTD* budget to date
YTD expenses to date
% of budget Annual budget
Annual expenses
% of budget
XX/Month/XXXX XX/Month/XXXX
* Year to date
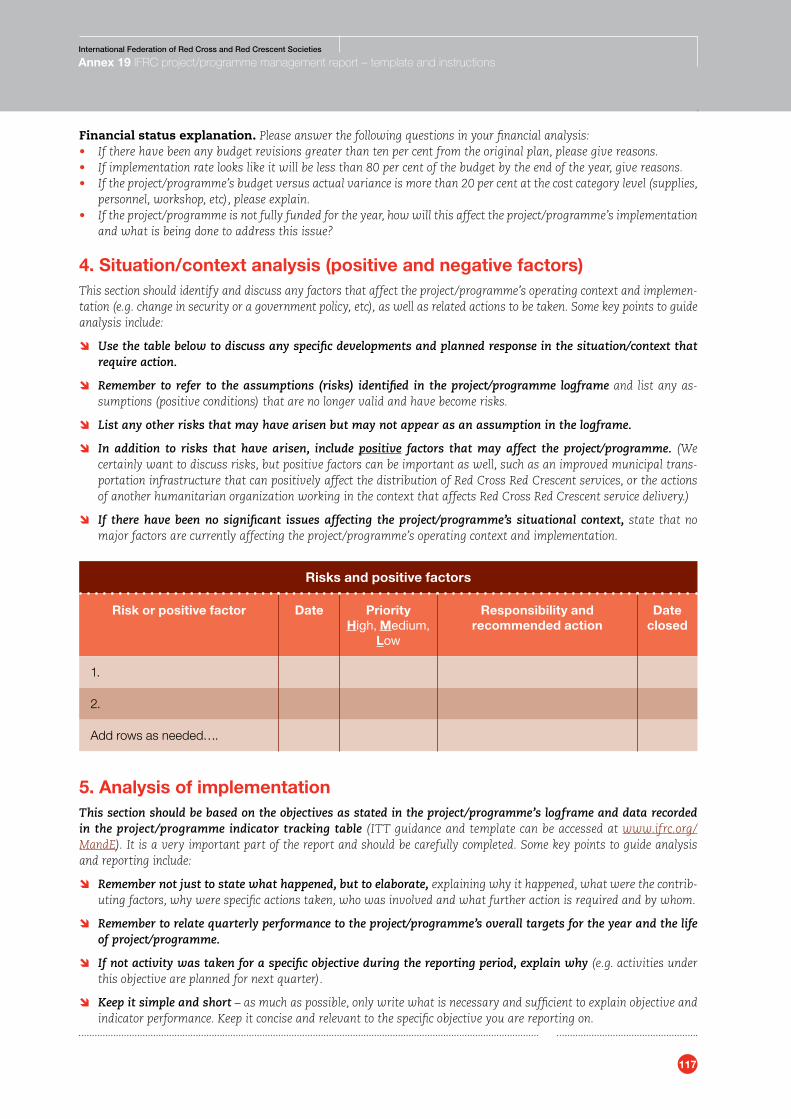
117
International Federation of Red Cross and Red Crescent Societies
Annex 19 IFRC project/programme management report – template and instructions
Financial status explanation. Please answer the following questions in your financial analysis: • If there have been any budget revisions greater than ten per cent from the original plan, please give reasons.• If implementation rate looks like it will be less than 80 per cent of the budget by the end of the year, give reasons.• If the project/programme’s budget versus actual variance is more than 20 per cent at the cost category level (supplies,
personnel, workshop, etc), please explain. • If the project/programme is not fully funded for the year, how will this affect the project/programme’s implementation
and what is being done to address this issue?
4. Situation/context analysis (positive and negative factors)This section should identify and discuss any factors that affect the project/programme’s operating context and implemen-tation (e.g. change in security or a government policy, etc), as well as related actions to be taken. Some key points to guide analysis include:
Ô Use the table below to discuss any specific developments and planned response in the situation/context that require action.
Ô Remember to refer to the assumptions (risks) identified in the project/programme logframe and list any as-sumptions (positive conditions) that are no longer valid and have become risks.
Ô List any other risks that may have arisen but may not appear as an assumption in the logframe.
Ô In addition to risks that have arisen, include positive factors that may affect the project/programme. (We certainly want to discuss risks, but positive factors can be important as well, such as an improved municipal trans-portation infrastructure that can positively affect the distribution of Red Cross Red Crescent services, or the actions of another humanitarian organization working in the context that affects Red Cross Red Crescent service delivery.)
Ô If there have been no significant issues affecting the project/programme’s situational context, state that no major factors are currently affecting the project/programme’s operating context and implementation.
Risks and positive factors
Risk or positive factor Date PriorityHigh, Medium,
Low
Responsibility and recommended action
Date closed
1.
2.
Add rows as needed….
5. Analysis of implementationThis section should be based on the objectives as stated in the project/programme’s logframe and data recorded in the project/programme indicator tracking table (ITT guidance and template can be accessed at www.ifrc.org/MandE). It is a very important part of the report and should be carefully completed. Some key points to guide analysis and reporting include:
Ô Remember not just to state what happened, but to elaborate, explaining why it happened, what were the contrib-uting factors, why were specific actions taken, who was involved and what further action is required and by whom.
Ô Remember to relate quarterly performance to the project/programme’s overall targets for the year and the life of project/programme.
Ô If not activity was taken for a specific objective during the reporting period, explain why (e.g. activities under this objective are planned for next quarter).
Ô Keep it simple and short – as much as possible, only write what is necessary and sufficient to explain objective and indicator performance. Keep it concise and relevant to the specific objective you are reporting on.
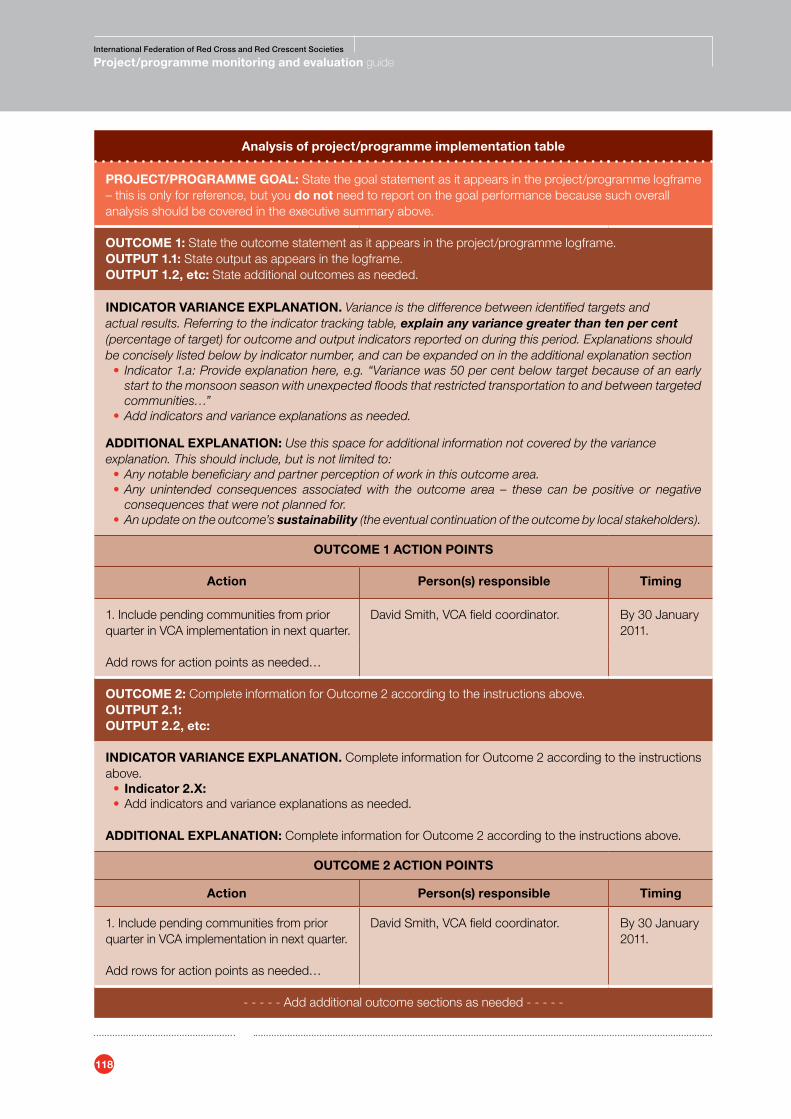
118
International Federation of Red Cross and Red Crescent Societies
Project/programme monitoring and evaluation guide
Analysis of project/programme implementation table
PROjECT/PROGRAMME GOAL: State the goal statement as it appears in the project/programme logframe – this is only for reference, but you do not need to report on the goal performance because such overall analysis should be covered in the executive summary above.
OUTCOME 1: State the outcome statement as it appears in the project/programme logframe. OUTPUT 1.1: State output as appears in the logframe. OUTPUT 1.2, etc: State additional outcomes as needed.
INDICATOR VARIANCE EXPLANATION. Variance is the difference between identified targets and actual results. Referring to the indicator tracking table, explain any variance greater than ten per cent (percentage of target) for outcome and output indicators reported on during this period. Explanations should be concisely listed below by indicator number, and can be expanded on in the additional explanation section
• Indicator 1.a: Provide explanation here, e.g. “Variance was 50 per cent below target because of an early start to the monsoon season with unexpected floods that restricted transportation to and between targeted communities…”
•Add indicators and variance explanations as needed.
ADDITIONAL EXPLANATION: Use this space for additional information not covered by the variance explanation. This should include, but is not limited to:
•Any notable beneficiary and partner perception of work in this outcome area.•Any unintended consequences associated with the outcome area – these can be positive or negative
consequences that were not planned for.•An update on the outcome’s sustainability (the eventual continuation of the outcome by local stakeholders).
OUTCOME 1 ACTION POINTS
Action Person(s) responsible Timing
1. Include pending communities from prior quarter in VCA implementation in next quarter.
David Smith, VCA field coordinator. By 30 January 2011.
Add rows for action points as needed…
OUTCOME 2: Complete information for Outcome 2 according to the instructions above. OUTPUT 2.1: OUTPUT 2.2, etc:
INDICATOR VARIANCE EXPLANATION. Complete information for Outcome 2 according to the instructions above.• Indicator 2.X: •Add indicators and variance explanations as needed.
ADDITIONAL EXPLANATION: Complete information for Outcome 2 according to the instructions above.
OUTCOME 2 ACTION POINTS
Action Person(s) responsible Timing
1. Include pending communities from prior quarter in VCA implementation in next quarter.
David Smith, VCA field coordinator. By 30 January 2011.
Add rows for action points as needed…
- - - - - Add additional outcome sections as needed - - - - -
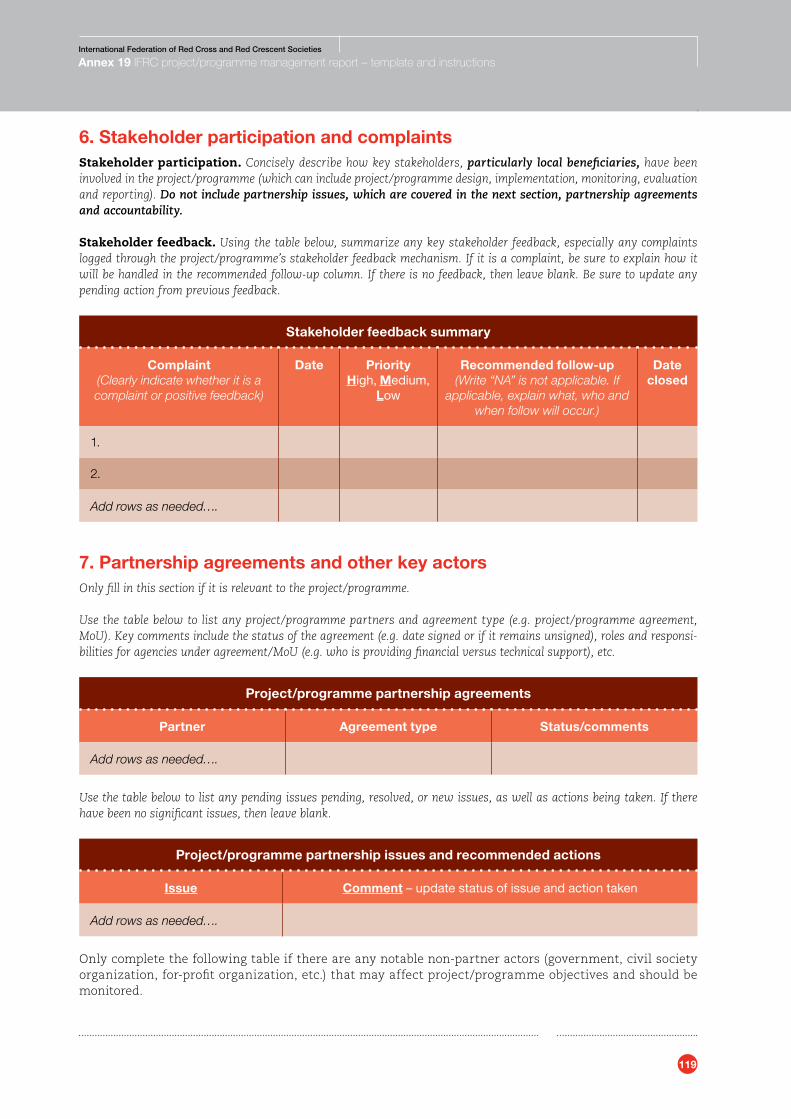
119
International Federation of Red Cross and Red Crescent Societies
Annex 19 IFRC project/programme management report – template and instructions
6. Stakeholder participation and complaintsStakeholder participation. Concisely describe how key stakeholders, particularly local beneficiaries, have been involved in the project/programme (which can include project/programme design, implementation, monitoring, evaluation and reporting). Do not include partnership issues, which are covered in the next section, partnership agreements and accountability.
Stakeholder feedback. Using the table below, summarize any key stakeholder feedback, especially any complaints logged through the project/programme’s stakeholder feedback mechanism. If it is a complaint, be sure to explain how it will be handled in the recommended follow-up column. If there is no feedback, then leave blank. Be sure to update any pending action from previous feedback.
Stakeholder feedback summary
Complaint(Clearly indicate whether it is a complaint or positive feedback)
Date PriorityHigh, Medium,
Low
Recommended follow-up(Write “NA” is not applicable. If
applicable, explain what, who and when follow will occur.)
Date closed
1.
2.
Add rows as needed….
7. Partnership agreements and other key actors Only fill in this section if it is relevant to the project/programme.
Use the table below to list any project/programme partners and agreement type (e.g. project/programme agreement, MoU). Key comments include the status of the agreement (e.g. date signed or if it remains unsigned), roles and responsi-bilities for agencies under agreement/MoU (e.g. who is providing financial versus technical support), etc.
Project/programme partnership agreements
Partner Agreement type Status/comments
Add rows as needed….
Use the table below to list any pending issues pending, resolved, or new issues, as well as actions being taken. If there have been no significant issues, then leave blank.
Project/programme partnership issues and recommended actions
Issue Comment – update status of issue and action taken
Add rows as needed….
Only complete the following table if there are any notable non-partner actors (government, civil society organization, for-profit organization, etc.) that may affect project/programme objectives and should be monitored.
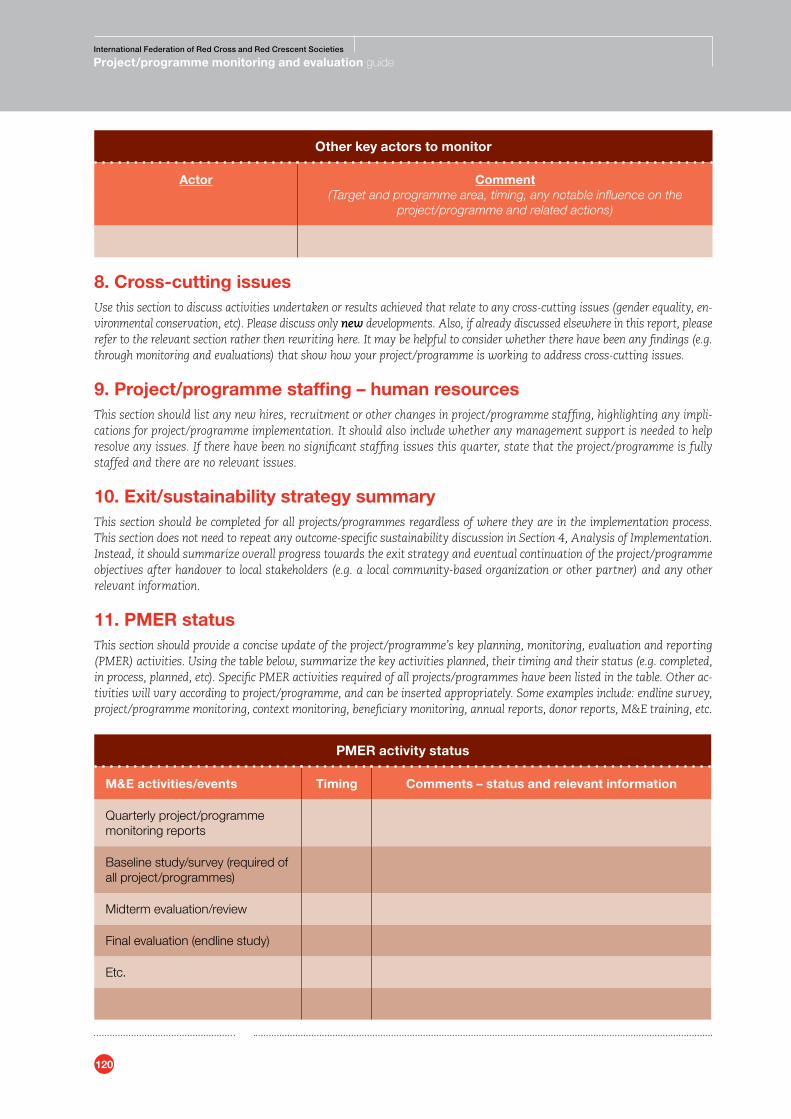
120
International Federation of Red Cross and Red Crescent Societies
Project/programme monitoring and evaluation guide
Other key actors to monitor
Actor Comment(Target and programme area, timing, any notable influence on the
project/programme and related actions)
8. Cross-cutting issues Use this section to discuss activities undertaken or results achieved that relate to any cross-cutting issues (gender equality, en-vironmental conservation, etc). Please discuss only new developments. Also, if already discussed elsewhere in this report, please refer to the relevant section rather then rewriting here. It may be helpful to consider whether there have been any findings (e.g. through monitoring and evaluations) that show how your project/programme is working to address cross-cutting issues.
9. Project/programme staffing – human resources This section should list any new hires, recruitment or other changes in project/programme staffing, highlighting any impli-cations for project/programme implementation. It should also include whether any management support is needed to help resolve any issues. If there have been no significant staffing issues this quarter, state that the project/programme is fully staffed and there are no relevant issues.
10. Exit/sustainability strategy summary This section should be completed for all projects/programmes regardless of where they are in the implementation process. This section does not need to repeat any outcome-specific sustainability discussion in Section 4, Analysis of Implementation. Instead, it should summarize overall progress towards the exit strategy and eventual continuation of the project/programme objectives after handover to local stakeholders (e.g. a local community-based organization or other partner) and any other relevant information.
11. PMER status This section should provide a concise update of the project/programme’s key planning, monitoring, evaluation and reporting (PMER) activities. Using the table below, summarize the key activities planned, their timing and their status (e.g. completed, in process, planned, etc). Specific PMER activities required of all projects/programmes have been listed in the table. Other ac-tivities will vary according to project/programme, and can be inserted appropriately. Some examples include: endline survey, project/programme monitoring, context monitoring, beneficiary monitoring, annual reports, donor reports, M&E training, etc.
PMER activity status
M&E activities/events Timing Comments – status and relevant information
Quarterly project/programme monitoring reports
Baseline study/survey (required of all project/programmes)
Midterm evaluation/review
Final evaluation (endline study)
Etc.
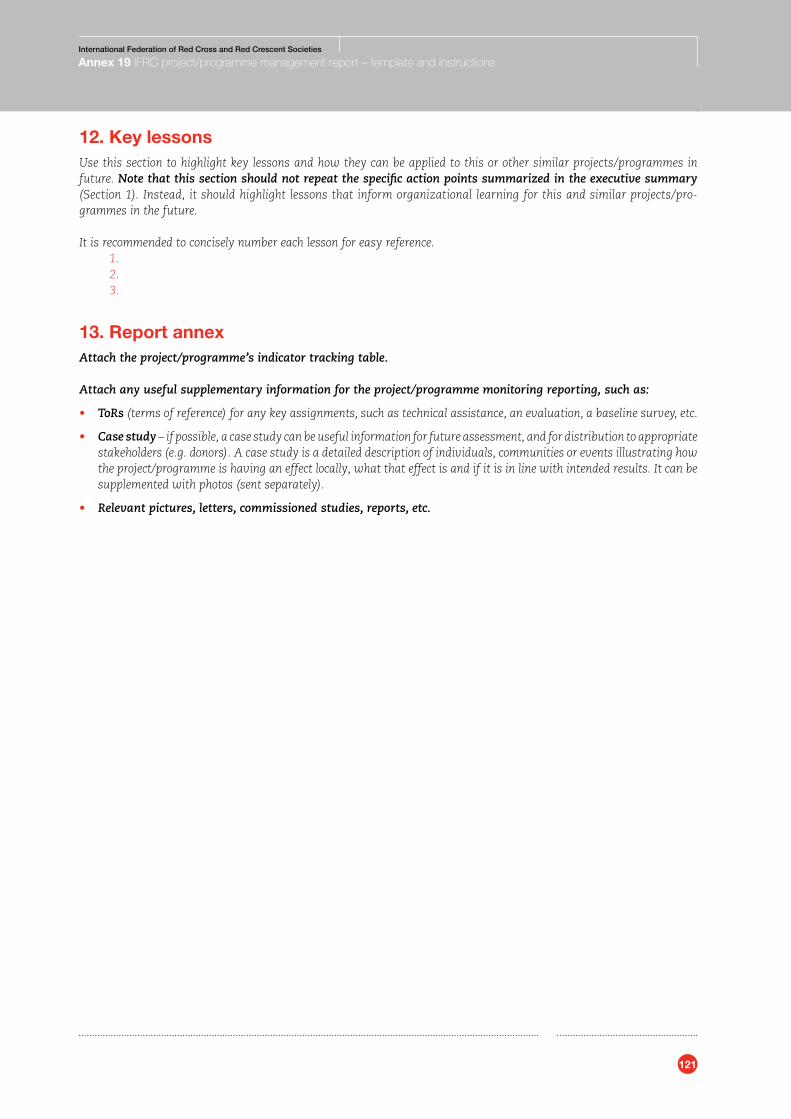
121
International Federation of Red Cross and Red Crescent Societies
Annex 19 IFRC project/programme management report – template and instructions
12. Key lessons Use this section to highlight key lessons and how they can be applied to this or other similar projects/programmes in future. Note that this section should not repeat the specific action points summarized in the executive summary (Section 1). Instead, it should highlight lessons that inform organizational learning for this and similar projects/pro-grammes in the future.
It is recommended to concisely number each lesson for easy reference. 1. 2. 3.
13. Report annex Attach the project/programme’s indicator tracking table. Attach any useful supplementary information for the project/programme monitoring reporting, such as:
• ToRs (terms of reference) for any key assignments, such as technical assistance, an evaluation, a baseline survey, etc.
• Case study – if possible, a case study can be useful information for future assessment, and for distribution to appropriate stakeholders (e.g. donors). A case study is a detailed description of individuals, communities or events illustrating how the project/programme is having an effect locally, what that effect is and if it is in line with intended results. It can be supplemented with photos (sent separately).
• Relevant pictures, letters, commissioned studies, reports, etc.
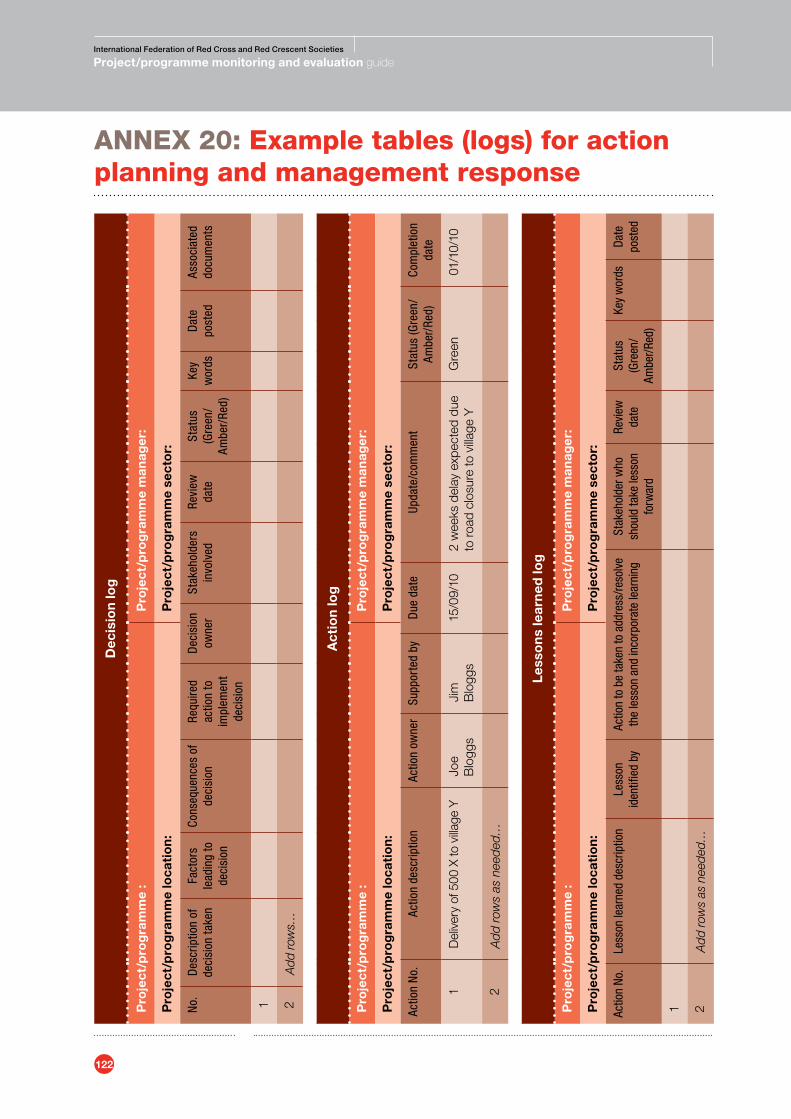
122
International Federation of Red Cross and Red Crescent Societies
Project/programme monitoring and evaluation guide
AnnEx 20: Example tables (logs) for action planning and management response
Dec
isio
n lo
g
Pro
ject
/pro
gra
mm
e :
Pro
ject
/pro
gra
mm
e m
anag
er:
Pro
ject
/pro
gra
mm
e lo
cati
on
:P
roje
ct/p
rog
ram
me
sect
or:
No.
Des
crip
tion
of
deci
sion
take
nFa
ctor
s le
adin
g to
de
cisi
on
Cons
eque
nces
of
deci
sion
Requ
ired
actio
n to
im
plem
ent
deci
sion
Dec
isio
n ow
ner
Stak
ehol
ders
in
volv
edRe
view
da
teSt
atus
(G
reen
/ Am
ber/
Red)
Key
wor
dsDa
te
post
edAs
soci
ated
do
cum
ents
1 2A
dd ro
ws…
Act
ion
log
Pro
ject
/pro
gra
mm
e :
Pro
ject
/pro
gra
mm
e m
anag
er:
Pro
ject
/pro
gra
mm
e lo
cati
on
:P
roje
ct/p
rog
ram
me
sect
or:
Actio
n N
o.Ac
tion
desc
riptio
nAc
tion
owne
rSu
ppor
ted
byD
ue d
ate
Upda
te/c
omm
ent
Stat
us (G
reen
/ Am
ber/
Red)
Com
plet
ion
date
1D
eliv
ery
of 5
00 X
to v
illage
YJo
e B
logg
sJi
m
Blo
ggs
15/0
9/10
2 w
eeks
del
ay e
xpec
ted
due
to ro
ad c
losu
re to
villa
ge Y
Gre
en01
/10/
10
2A
dd r
ows
as n
eede
d…
Les
son
s le
arn
ed lo
g
Pro
ject
/pro
gra
mm
e :
Pro
ject
/pro
gra
mm
e m
anag
er:
Pro
ject
/pro
gra
mm
e lo
cati
on
:P
roje
ct/p
rog
ram
me
sect
or:
Actio
n No
.Le
sson
lear
ned
desc
riptio
nLe
sson
id
entifi
ed b
yAc
tion
to b
e ta
ken
to a
ddre
ss/re
solv
e th
e le
sson
and
inco
rpor
ate
lear
ning
Stak
ehol
der w
ho
shou
ld ta
ke le
sson
fo
rwar
d
Revi
ew
date
Stat
us
(Gre
en/
Ambe
r/Re
d)
Key
wor
dsDa
te
post
ed
1 2A
dd ro
ws
as n
eede
d…
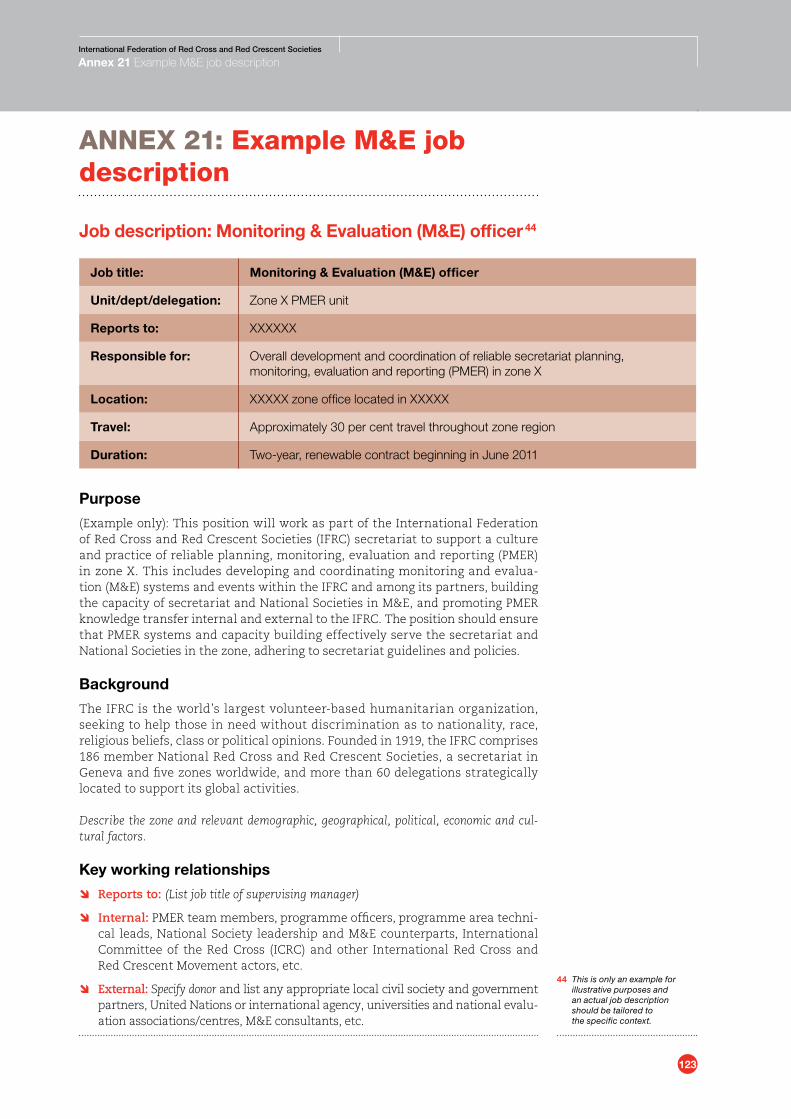
123
International Federation of Red Cross and Red Crescent Societies
Annex 21 Example M&E job description
AnnEx 21: Example M&E job description
job description: Monitoring & Evaluation (M&E) officer 44
job title: Monitoring & Evaluation (M&E) officer
Unit/dept/delegation: Zone X PMER unit
Reports to: XXXXXX
Responsible for: Overall development and coordination of reliable secretariat planning, monitoring, evaluation and reporting (PMER) in zone X
Location: XXXXX zone office located in XXXXX
Travel: Approximately 30 per cent travel throughout zone region
Duration: Two-year, renewable contract beginning in June 2011
Purpose
(Example only): This position will work as part of the International Federation of Red Cross and Red Crescent Societies (IFRC) secretariat to support a culture and practice of reliable planning, monitoring, evaluation and reporting (PMER) in zone X. This includes developing and coordinating monitoring and evalua-tion (M&E) systems and events within the IFRC and among its partners, building the capacity of secretariat and National Societies in M&E, and promoting PMER knowledge transfer internal and external to the IFRC. The position should ensure that PMER systems and capacity building effectively serve the secretariat and National Societies in the zone, adhering to secretariat guidelines and policies.
Background
The IFRC is the world’s largest volunteer-based humanitarian organization, seeking to help those in need without discrimination as to nationality, race, religious beliefs, class or political opinions. Founded in 1919, the IFRC comprises 186 member National Red Cross and Red Crescent Societies, a secretariat in Geneva and five zones worldwide, and more than 60 delegations strategically located to support its global activities.
Describe the zone and relevant demographic, geographical, political, economic and cul-tural factors.
Key working relationships
Ô Reports to: (List job title of supervising manager)
Ô Internal: PMER team members, programme officers, programme area techni-cal leads, National Society leadership and M&E counterparts, International Committee of the Red Cross (ICRC) and other International Red Cross and Red Crescent Movement actors, etc.
Ô External: Specify donor and list any appropriate local civil society and government partners, United Nations or international agency, universities and national evalu-ation associations/centres, M&E consultants, etc.
44 This is only an example for illustrative purposes and an actual job description should be tailored to the specific context.
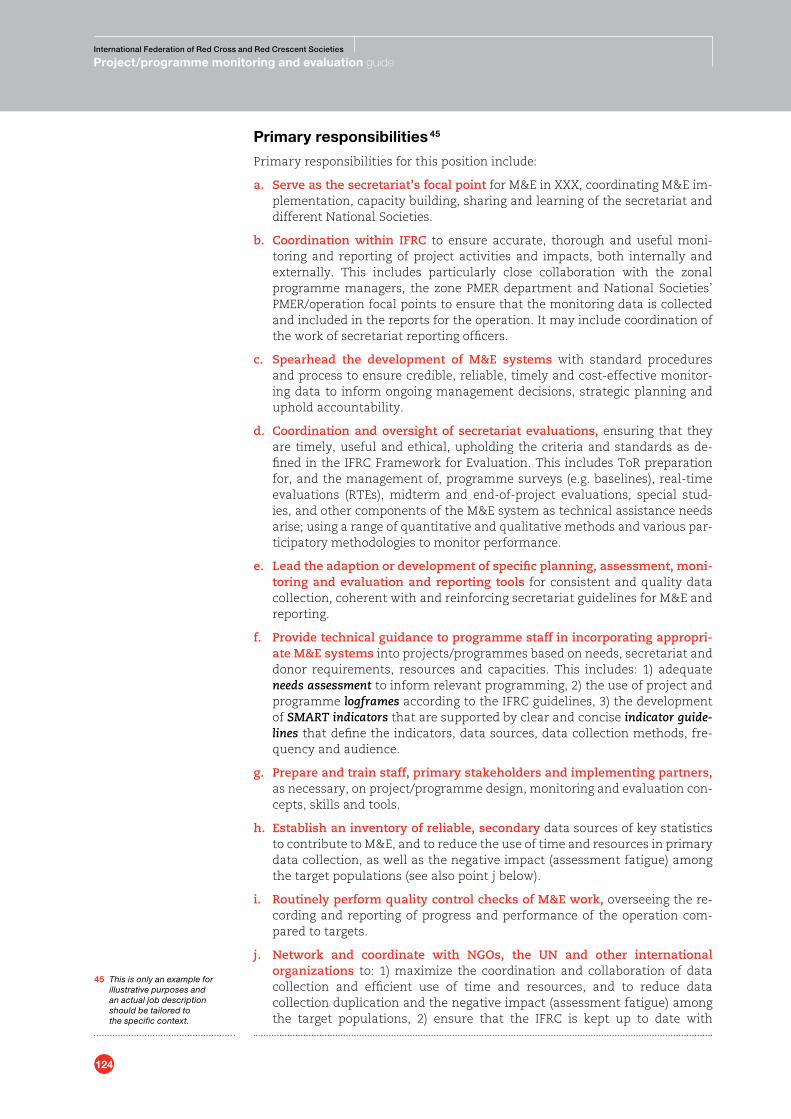
124
International Federation of Red Cross and Red Crescent Societies
Project/programme monitoring and evaluation guide
Primary responsibilities 45
Primary responsibilities for this position include:
a. Serve as the secretariat’s focal point for M&E in XXX, coordinating M&E im-plementation, capacity building, sharing and learning of the secretariat and different National Societies.
b. Coordination within IFRC to ensure accurate, thorough and useful moni-toring and reporting of project activities and impacts, both internally and externally. This includes particularly close collaboration with the zonal programme managers, the zone PMER department and National Societies’ PMER/operation focal points to ensure that the monitoring data is collected and included in the reports for the operation. It may include coordination of the work of secretariat reporting officers.
c. Spearhead the development of M&E systems with standard procedures and process to ensure credible, reliable, timely and cost-effective monitor-ing data to inform ongoing management decisions, strategic planning and uphold accountability.
d. Coordination and oversight of secretariat evaluations, ensuring that they are timely, useful and ethical, upholding the criteria and standards as de-fined in the IFRC Framework for Evaluation. This includes ToR preparation for, and the management of, programme surveys (e.g. baselines), real-time evaluations (RTEs), midterm and end-of-project evaluations, special stud-ies, and other components of the M&E system as technical assistance needs arise; using a range of quantitative and qualitative methods and various par-ticipatory methodologies to monitor performance.
e. Lead the adaption or development of specific planning, assessment, moni-toring and evaluation and reporting tools for consistent and quality data collection, coherent with and reinforcing secretariat guidelines for M&E and reporting.
f. Provide technical guidance to programme staff in incorporating appropri-ate M&E systems into projects/programmes based on needs, secretariat and donor requirements, resources and capacities. This includes: 1) adequate needs assessment to inform relevant programming, 2) the use of project and programme logframes according to the IFRC guidelines, 3) the development of SMART indicators that are supported by clear and concise indicator guide-lines that define the indicators, data sources, data collection methods, fre-quency and audience.
g. Prepare and train staff, primary stakeholders and implementing partners, as necessary, on project/programme design, monitoring and evaluation con-cepts, skills and tools.
h. Establish an inventory of reliable, secondary data sources of key statistics to contribute to M&E, and to reduce the use of time and resources in primary data collection, as well as the negative impact (assessment fatigue) among the target populations (see also point j below).
i. Routinely perform quality control checks of M&E work, overseeing the re-cording and reporting of progress and performance of the operation com-pared to targets.
j. Network and coordinate with NGOs, the UN and other international organizations to: 1) maximize the coordination and collaboration of data collection and efficient use of time and resources, and to reduce data collection duplication and the negative impact (assessment fatigue) among the target populations, 2) ensure that the IFRC is kept up to date with
45 This is only an example for illustrative purposes and an actual job description should be tailored to the specific context.
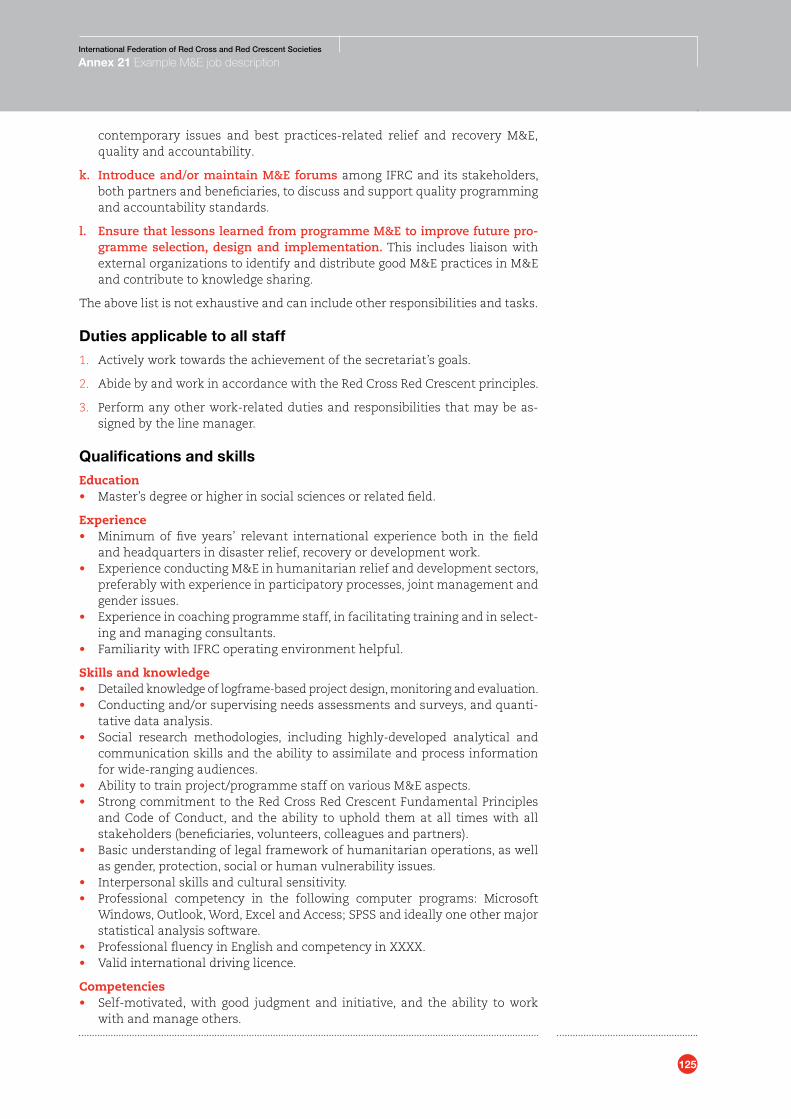
125
International Federation of Red Cross and Red Crescent Societies
Annex 21 Example M&E job description
contemporary issues and best practices-related relief and recovery M&E, quality and accountability.
k. Introduce and/or maintain M&E forums among IFRC and its stakeholders, both partners and beneficiaries, to discuss and support quality programming and accountability standards.
l. Ensure that lessons learned from programme M&E to improve future pro-gramme selection, design and implementation. This includes liaison with external organizations to identify and distribute good M&E practices in M&E and contribute to knowledge sharing.
The above list is not exhaustive and can include other responsibilities and tasks.
Duties applicable to all staff
1. Actively work towards the achievement of the secretariat’s goals.
2. Abide by and work in accordance with the Red Cross Red Crescent principles.
3. Perform any other work-related duties and responsibilities that may be as-signed by the line manager.
Qualifications and skills
Education• Master’s degree or higher in social sciences or related field.
Experience• Minimum of five years’ relevant international experience both in the field
and headquarters in disaster relief, recovery or development work.• Experience conducting M&E in humanitarian relief and development sectors,
preferably with experience in participatory processes, joint management and gender issues.
• Experience in coaching programme staff, in facilitating training and in select-ing and managing consultants.
• Familiarity with IFRC operating environment helpful.
Skills and knowledge• Detailed knowledge of logframe-based project design, monitoring and evaluation.• Conducting and/or supervising needs assessments and surveys, and quanti-
tative data analysis.• Social research methodologies, including highly-developed analytical and
communication skills and the ability to assimilate and process information for wide-ranging audiences.
• Ability to train project/programme staff on various M&E aspects.• Strong commitment to the Red Cross Red Crescent Fundamental Principles
and Code of Conduct, and the ability to uphold them at all times with all stakeholders (beneficiaries, volunteers, colleagues and partners).
• Basic understanding of legal framework of humanitarian operations, as well as gender, protection, social or human vulnerability issues.
• Interpersonal skills and cultural sensitivity.• Professional competency in the following computer programs: Microsoft
Windows, Outlook, Word, Excel and Access; SPSS and ideally one other major statistical analysis software.
• Professional fluency in English and competency in XXXX. • Valid international driving licence.
Competencies• Self-motivated, with good judgment and initiative, and the ability to work
with and manage others.
126
International Federation of Red Cross and Red Crescent Societies
Project/programme monitoring and evaluation guide
• Strong interpersonal skills and ability to collaborate with and motivate col-leagues to achieve shared goals.
• Strong capacity to handle complex tasks independently, multitask and prior-itize, and meet multiple deadlines on time.
• Excellent verbal and written communication skills required.• Extremely strong time management and organizational skills with very close
attention to detail. • Able to work in a stressful environment with limited access to basic facilities.
Application procedures
Interested candidates should submit their application material by XdateX to: (list name and address, or e-mail).
1. Curriculum vitae (CV).
2. Cover letter clearly summarizing your experience as it pertains to this job, with three professional references who we may contact.
3. At least one writing example of a written sample most relevant to the job description above.
Application materials are non-returnable, and we thank you in advance for un-derstanding that only short-listed candidates will be contacted for the next step in the application process.
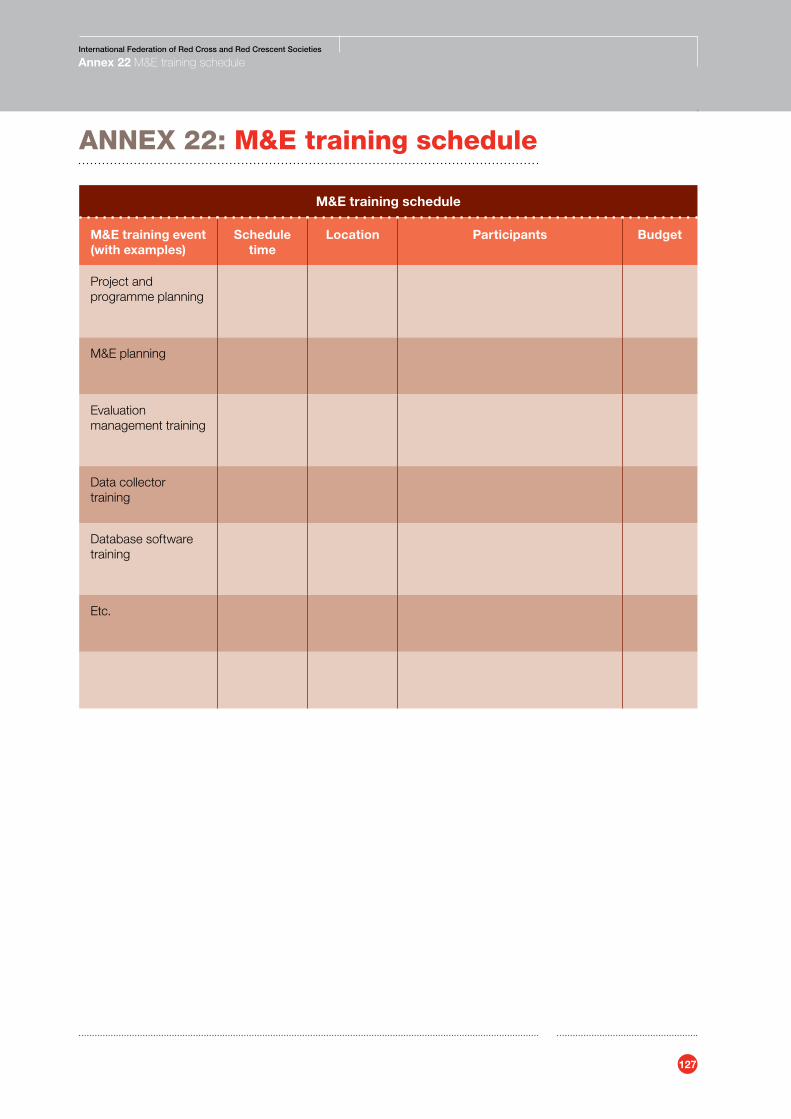
127
International Federation of Red Cross and Red Crescent Societies
Annex 22 M&E training schedule
AnnEx 22: M&E training schedule
M&E training schedule
M&E training event (with examples)
Schedule time
Location Participants Budget
Project and programme planning
M&E planning
Evaluation management training
Data collector training
Database software training
Etc.
128
International Federation of Red Cross and Red Crescent Societies
Project/programme monitoring and evaluation guide
Sco
tt C
hap
low
e/IF
RC
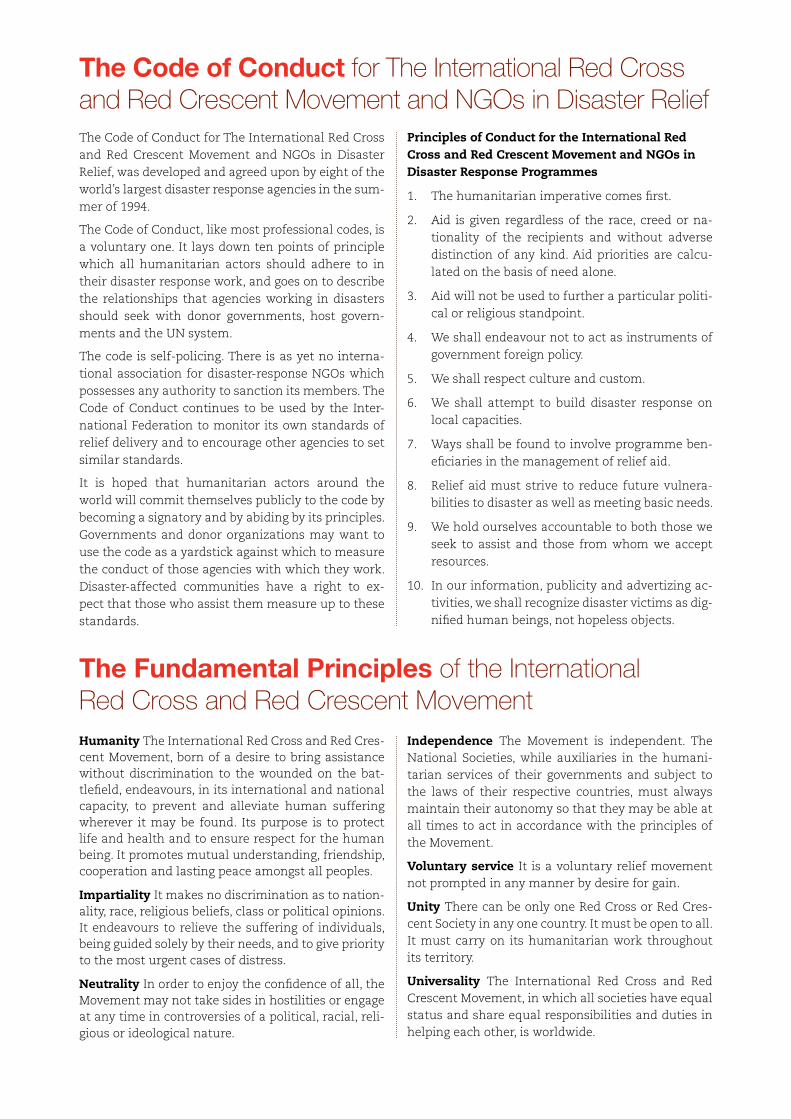
Humanity The International Red Cross and Red Cres-cent Movement, born of a desire to bring assistance without discrimination to the wounded on the bat-tlefield, endeavours, in its international and national capacity, to prevent and alleviate human suffering wherever it may be found. Its purpose is to protect life and health and to ensure respect for the human being. It promotes mutual understanding, friendship, cooperation and lasting peace amongst all peoples.
Impartiality It makes no discrimination as to nation-ality, race, religious beliefs, class or political opinions. It endeavours to relieve the suffering of individuals, being guided solely by their needs, and to give priority to the most urgent cases of distress.
Neutrality In order to enjoy the confidence of all, the Movement may not take sides in hostilities or engage at any time in controversies of a political, racial, reli-gious or ideological nature.
Independence The Movement is independent. The National Societies, while auxiliaries in the humani-tarian services of their governments and subject to the laws of their respective countries, must always maintain their autonomy so that they may be able at all times to act in accordance with the principles of the Movement.
Voluntary service It is a voluntary relief movement not prompted in any manner by desire for gain.
Unity There can be only one Red Cross or Red Cres-cent Society in any one country. It must be open to all. It must carry on its humanitarian work throughout its territory.
Universality The International Red Cross and Red Crescent Movement, in which all societies have equal status and share equal responsibilities and duties in helping each other, is worldwide.
The Code of Conduct for The International Red Cross and Red Crescent Movement and NGOs in Disaster Relief, was developed and agreed upon by eight of the world’s largest disaster response agencies in the sum-mer of 1994.
The Code of Conduct, like most professional codes, is a voluntary one. It lays down ten points of principle which all humanitarian actors should adhere to in their disaster response work, and goes on to describe the relationships that agencies working in disasters should seek with donor governments, host govern-ments and the UN system.
The code is self-policing. There is as yet no interna-tional association for disaster-response NGOs which possesses any authority to sanction its members. The Code of Conduct continues to be used by the Inter-national Federation to monitor its own standards of relief delivery and to encourage other agencies to set similar standards.
It is hoped that humanitarian actors around the world will commit themselves publicly to the code by becoming a signatory and by abiding by its principles. Governments and donor organizations may want to use the code as a yardstick against which to measure the conduct of those agencies with which they work. Disaster-affected communities have a right to ex-pect that those who assist them measure up to these standards.
Principles of Conduct for the International Red Cross and Red Crescent Movement and NGOs in Disaster Response Programmes
1. The humanitarian imperative comes first.
2. Aid is given regardless of the race, creed or na-tionality of the recipients and without adverse distinction of any kind. Aid priorities are calcu-lated on the basis of need alone.
3. Aid will not be used to further a particular politi-cal or religious standpoint.
4. We shall endeavour not to act as instruments of government foreign policy.
5. We shall respect culture and custom.
6. We shall attempt to build disaster response on local capacities.
7. Ways shall be found to involve programme ben-eficiaries in the management of relief aid.
8. Relief aid must strive to reduce future vulnera-bilities to disaster as well as meeting basic needs.
9. We hold ourselves accountable to both those we seek to assist and those from whom we accept resources.
10. In our information, publicity and advertizing ac-tivities, we shall recognize disaster victims as dig-nified human beings, not hopeless objects.
The Fundamental Principles of the International Red Cross and Red Crescent Movement
The Code of Conduct for The International Red Cross and Red Crescent Movement and NGOs in Disaster Relief
www.ifrc.orgSaving lives, changing minds.
Project/programme monitoring and evaluation (M&E) guide
The purpose of this guide is to promote a common understanding and reliable practice of monitoring and evaluation (M&E) for the IFRC’s project/programmes.
The intended audience of this guide is project and programme managers, as well as IFRC staff and volunteers, donors and partners, and other stakeholders.
Key topics in this guide include:
M&E concepts and considerations
• Results-based management (RBM) • M&E and the project/programme cycle• What is monitoring? • What is evaluation? • Baseline and endline studies • M&E standards and ethics • Attention to gender and vulnerable groups • Minimizing bias and error
Six key steps for project/programme M&E
• Step 1 – Identify the purpose and scope of the M&E system• Step 2 – Plan for data collection and management • Step 3 – Plan for data analysis• Step 4 – Plan for information reporting and utilization • Step 5 – Plan for M&E human resources and capacity building• Step 6 – Prepare the M&E budget
Annexes – with additional guidance, templates, tools and resources