Embed Size (px)
Citation preview

IGC Audit of Guidance & Counselling (GC) Practice
in
Second Level Schools in Ireland:
2011 – 2013
PHASE 1: MARCH 2012
PHASE 1 RESULTS ONLY
Sheelagh Beatty
LifeCare Psychological Services Ltd.
January, 2, 2013

Phase 1: Total Results
2
The presentation of results will follow the same format as that used in the Questionnaires. Results from each phase of the Audit will report separately on their findings as they arise. Phase 1: 2011-2012 Actual GC Practice 745 second level schools were invited to participate in Phase 1 of the IGC Audit of Guidance & Counselling practice in Ireland. 271 participant schools (36.4%) returned completed questionnaires under Phase 1 of the Audit, which reported data on the actual GC practice for the 2011-2012 academic year.
Table 1.1: Phase 1: Participant Schools in Each Phase of the Audit
Category N N % Response
No. of 2nd Level Schools invited to participate 745
Total Phase 1 respondents 271 36.4%
Details of the location of the 271 participant schools are shown in Table 1.2 below.
Table 1.2: Phase 1: Participant Schools by Location
Participant Schools by Location
County N Percentage
Carlow 4 1.5
Cavan 4 1.5
Clare 8 3.0
Cork 31 11.4
Donegal 10 3.7
Dublin 64 23.6
Galway 16 5.9
Kerry 15 5.5
Kildare 8 3.0
Kilkenny 9 3.3
Laois 3 1.1
Leitrim 1 .4

Phase 1: Total Results
3
Limerick 12 4.4
Longford 3 1.1
Louth 7 2.6
Mayo 12 4.4
Meath 7 2.6
Monaghan 6 2.2
Offaly 8 3.0
Sligo 4 1.5
Tipperary 14 5.2
Waterford 5 1.8
Westmeath 6 2.2
Wexford 8 3.0
Wicklow 6 2.2
Total 271 100.0
The 271 participant schools fell into 10 school types, and are shown in Table 1.3 and Figures 1.1 below: Table 1:3 Phase 1: Schools by School Type
Schools by School Type
School Description N %
Voluntary Secondary School 120 44.28%
Vocational School/Community College 71 26.20%
Community/Comprehensive School 45 16.61%
Fee-Paying Secondary School 14 5.17%
College of Further Education 12 4.43%
Voluntary School + C.F.E 3 1.11%
Vocational School + C.F.E. 3 1.11%
Community College + C.F.E. 1 0.37%
Youthreach 1 0.37%
VTOS/Second Chance 1 0.37%
Total 271 100.0

Phase 1: Total Results
4
Figure 1.1: School Type by Percentage of all Participant Schools Of the 271 participant schools, 73 reported holding PLC status, while 73 further reported holding DEIS status, as shown in Tables 1.4 and 1.5 below: Table 1.4: Phase 1: Schools with PLC Status
PLC Colleges
Category N %
Yes 73 26.9
No 196 72.3
No Response 2 .7
Total 271 100.0 Table 1.5: Phase 1: Schools with DEIS Status
DEIS Status
Category N %
Yes 73 26.9
No 192 70.8
No 3Response 6 2.2
Total 271 100.0

Phase 1: Total Results
5
Of the 271 participant schools, 265 reported employing 444 qualified Guidance & Counselling staff, of which 409 were practicing during the 2011-12 academic year, as per Table 1.5 below. In addition, 263 participant schools reported 56 unqualified staff were practicing as Guidance Counsellors during this same period, representing 12.04% of all staff practicing G & C, as shown in Tables 1.6 and 1.7 below. Table 1.5: Phase 1: Status of Qualified GC Staff in Schools
Qualified GC Staff in Schools
Category Qualified GC Staff Qualified & Practicing GC Staff
% Practicing
GC Staff 444 409 92.3
N 265 265
No Response 6 6
Total 271 271 Table 1.6: Phase 1: Status of Unqualified GC Staff in Schools
Unqualified GC Staff in Schools
Category Unqualified GC Staff
Unqualified & Practicing GC Staff
GC Staff 56 56
N 263 263
No Response 8 8
Total 271 271 Table 1.7: Phase 1: Status of Practicing Qualified & Unqualified GC Staff in Schools
Practicing Qualified & Unqualified GC Staff in Schools
Category Total %
Qualified 409 87.96
Unqualified 56 12.04
Total 465 271

Phase 1: Total Results
6
Of the participant schools who reported qualified (265) and unqualified (263) staff practicing Guidance & Counselling during the 2011-12 academic year, 12.04% of those practicing Guidance & Counselling were unqualified, as shown in Figure 1.2 below.
Figure 1.2: Practicing Qualified & Unqualified GC Staff
Phase 1: Total Results
7
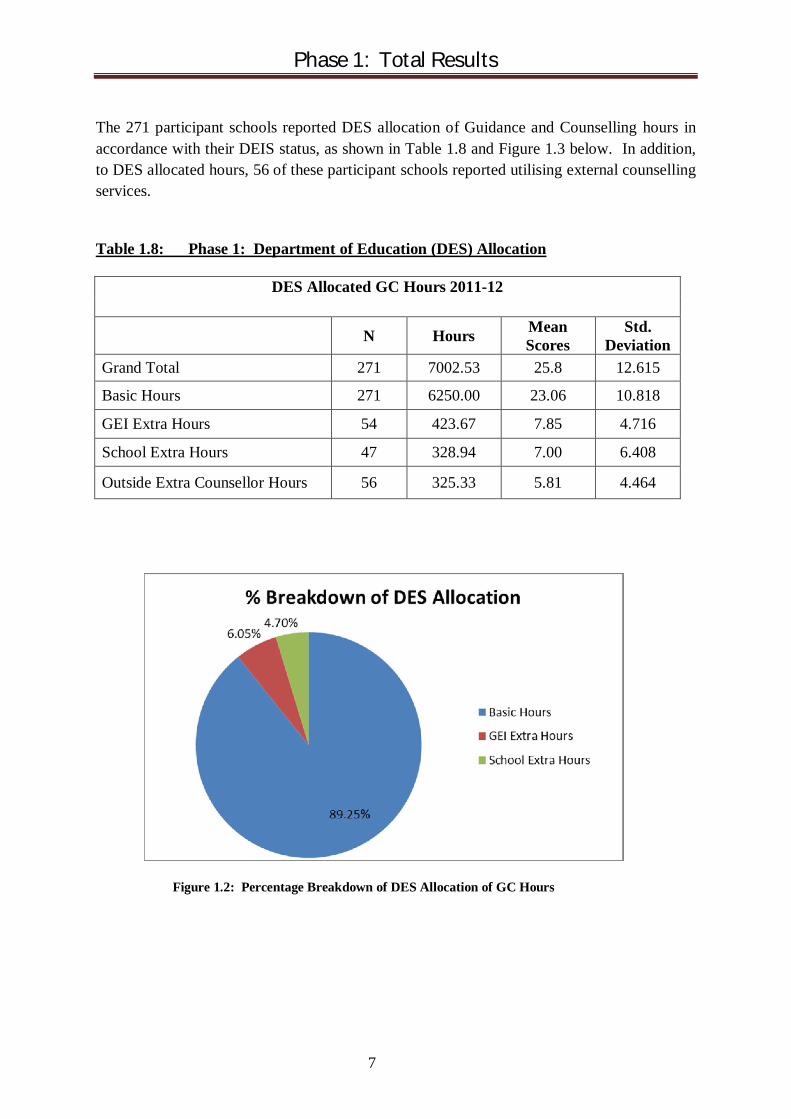
The 271 participant schools reported DES allocation of Guidance and Counselling hours in accordance with their DEIS status, as shown in Table 1.8 and Figure 1.3 below. In addition, to DES allocated hours, 56 of these participant schools reported utilising external counselling services. Table 1.8: Phase 1: Department of Education (DES) Allocation
DES Allocated GC Hours 2011-12
N Hours Mean Scores
Std. Deviation
Grand Total 271 7002.53 25.8 12.615
Basic Hours 271 6250.00 23.06 10.818
GEI Extra Hours 54 423.67 7.85 4.716
School Extra Hours 47 328.94 7.00 6.408
Outside Extra Counsellor Hours 56 325.33 5.81 4.464
Figure 1.2: Percentage Breakdown of DES Allocation of GC Hours

Phase 1: Total Results
8
The 271 participant schools reported practice hours which were 477.36 hours (6.82%) below the DES allocation, as shown in Figures 1.4 and 1.5 below.
Figure 1.4: Allocated Practice GC Hours 2011-12
Figure 1.5: Percentage GC Practice Hours v's DES Allocation 2011-12

Phase 1: Total Results
9
Of the 271 participant schools, a maximum of 216 submitted data on the number of GC classes by student year, and their length in minutes, as shown in Table 1.9 and Figures 1.6 and 1.7 below; while 55 participant schools (20.3%) did not.
Table 1.9: Phase 1: Timetabled GC Classes by Student Year
Timetabled GC Classes per Week
Category N
Mean Number of
Classes S.D.
Mean Minutes
per Meeting S.D.
Year 1 30 1.5667 1.52414 32.66 15.805
Year 2 24 1.2083 1.14129 30.29 18.417
Year 3 38 1.885 1.56117 33.26 13.966
Year 4 182 2.7106 3.25898 38.76 5.759
Year 5 196 2.8438 1.87698 38.43 5.453
Year 6 216 3.369 2.20077 39.26 4.111
Figure 1.6: Weekly Time-Tabled GC Classes

Phase 1: Total Results
10
Figure 1.7: Timetabled GC Minutes per Class

Phase 1: Total Results
11
Of the 271 participant schools, a maximum of 246 submitted data on the number of one-to-one career/educational meetings by student year, number of students seen, and their length in minutes, as shown in Table 1.10 and Figures 1.8, 1.8 and 1.10 below; while 25 participant schools (9.2%) did not.
Table 1.10: Phase 1: One-To-One: Career/Educational Meeting per Year
One-to-One: Career/Educational Meetings per Year
Category N
Mean Students
Seen S.D.
Mean Meetings
per Student S.D.
Mean Minutes
per Meeting S.D.
Year 1 175 35.44 42.170 1.7160 2.32413 33.34 10.286
Year 2 140 15.84 22.499 2.1282 2.77743 36.12 8.123
Year 3 217 44.92 46.486 2.1202 4.54272 33.43 9.570
Year 4 195 32.00 27.500 1.7989 5.41681 33.06 9.625
Year 5 225 48.20 67.767 1.5974 2.13188 36.23 8.095
Year 6 246 56.85 50.538 3.3539 10.55607 37.82 6.877
Figure 1.8: One-To-One Career/Educational Students Seen

Phase 1: Total Results
12
Figure 1.9: One-To-One Career/Educational Meetings
Figure 1.10: One-To-One Career/Educational Minutes per Meeting

Phase 1: Total Results
13
Of the 271 participant schools, a maximum of 236 submitted data on the number of one-to-one career/educational meetings, number of students seen, and their length in minutes, by student year, as shown in Table 1.11 and Figures 1.11, 1.12 and 1.13 below; while 35 participant schools (12.9%) did not.
Table 1.11: Phase 1: One-To-One: Personal Counselling Meeting per Year
One-to-One: Personal Counselling Meetings per Year
Category N
Mean Students
Seen S.D.
Mean Meetings per
Student S.D.
Mean Minutes
per Meeting S.D.
Year 1 210 13.37 16.216 4.1533 5.159 37.40 7.085
Year 2 205 12.21 13.518 4.2153 3.461 37.63 7.216
Year 3 210 12.06 15.023 4.4685 3.492 37.83 6.260
Year 4 156 6.120 6.653 3.7553 3.541 38.54 5.336
Year 5 226 10.61 9.496 4.1888 3.184 38.27 6.098
Year 6 236 15.10 18.013 5.0480 4.748 38.79 6.349
Figure 1.11: One-To-One Personal Counselling Students Seen by Student Year

Phase 1: Total Results
14
Figure 1.12: One-To-One Personal Counselling Meetings by Student Year
Figure 1.13: One-To-One Personal Counselling Minutes per Meeting

Phase 1: Total Results
15
Of the 271 participant schools, a maximum of 254 (93.7%) reported data on their annual GC activities, as shown in Table 1.12 below. Table 1.12: Phase 1: Breakdown of Types of Annual GC Activities
Types of GC Activities per Year
Category N Hours Mean Scores S.D.
Consulting/Networking Externally 254 7187.50 28.30 33.221
Collaborating/Consulting Externally 246 5293.50 21.52 30.761
Collaborating Internally 251 12815.67 51.06 56.438
Attending Open Days, etc. 254 7032.83 27.69 20.285
Continuing Professional Development 245 6959.00 28.40 26.762
Testing (Administration) 249 5014.30 20.14 22.728
Liaising with parents 252 10397.00 41.26 46.513
Presenting 251 3983.67 15.87 30.002
Administration/Record Keeping 248 19669.00 79.31 93.228
Amt. of hours Supervision 250 3488.00 13.95 12.565
Organising/Planning SPHE with others 200 1419.75 7.10 16.631
Teaching SPHE 170 4242.66 24.96 41.765
Figure 1.14: Annual GC Activities by Hours Spent

Phase 1: Total Results
16
Of the 271 participant schools, 261 (96.3%) reported data on the location where various GC activities were carried out, as per Table 1.13 and Figure 1.15 below. Table 1.13: Phase 1: Where GC Activities are Carried Out
Where GC Activities are Carried Out
Category N
School time Only
Mostly School time Both
Mostly Personal
Time
Personal time Only
Consult/Network Externally - Further/Higher Education 257 41 92 102 2 1
Collaborative work/Consulting with External Agencies 258 37 98 109 13 1
Collaborative work/meeting with school staff/management 261 65 97 86 13 0
Attendance at Open days, exhibitions 261 58 97 96 10 0
Continuing Professional Development 254 23 43 123 50 15
Testing (Administration) 254 90 52 88 19 5
Liaising with parents; meetings; phone calls 257 28 74 139 14 2
Presentations 256 18 26 60 76 1
Administration/Record Keeping 260 21 49 121 57 1
Supervision 246 90 5 42 21 38
Figure 1.15: Where GC Activities Take Place