Embed Size (px)
Citation preview
IGCP/SIDA Project 594, Annual Workshop, Windhoek, Namibia, 2012
Pathways of exposure to cobalt in populations living in Katanga, D.R. Congo
C. Banza Lubaba Nkulu1, K. Cheyns2, J. Ngoy Asosa1, L. Kabamba Ngombe1, A. Mutombo Mwanza1, V. Haufroid3, Th. De Putter4, O. Luboya Numbi1,
B. Kabyla Ilunga1, C. Muleka Kimpanga1, B. Nemery5, E. Smolders2
1. Unité de Toxicologie et Environnement, Ecole de Santé Publique, Université de Lubumbashi, Lubumbashi, D.R. Congo
2. Division of Soil and Water Management,Department of Earth and Environmental Sciences, KU Leuven, Leuven, Belgium
3. Laboratoire de Toxicologie Industrielle et Médecine du Travail, U.C. Louvain, Brussels, Belgium
4. Geology, Royal Museum for Central Africa, Tervuren, Belgium 5. Occupational, Environmental and Insurance Medicine, Department of
Public Health, KU Leuven, Leuven, Belgium
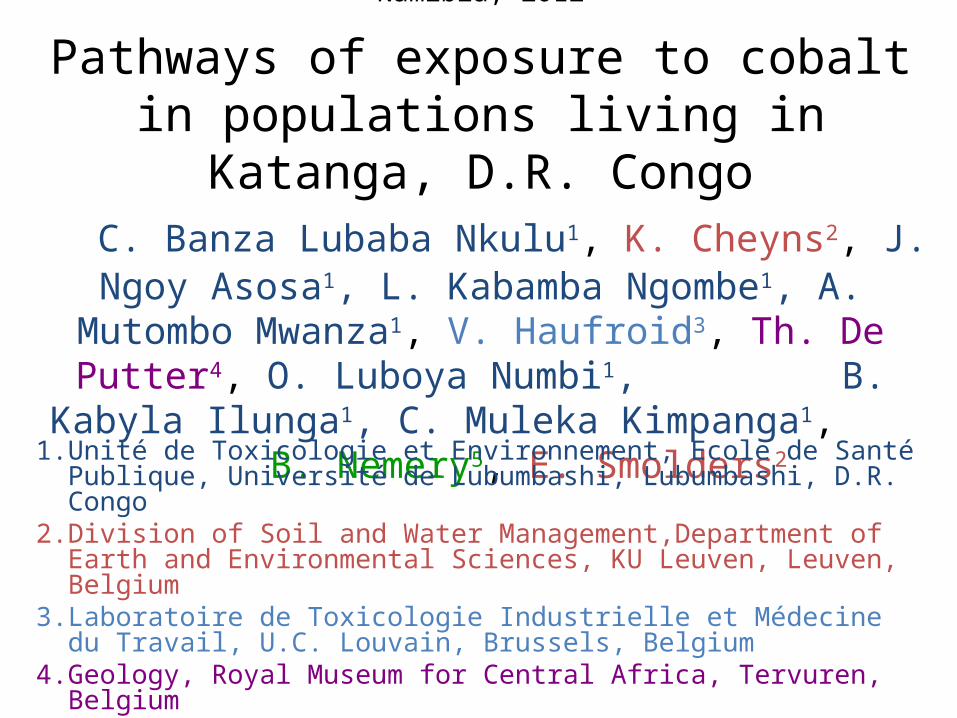
Kamina
Likasi Lubumbas
hiKipushi
26°0’0’’E
28°0’0’’E
10°0’0’’S
12°0’0’’S
“African copperbelt”
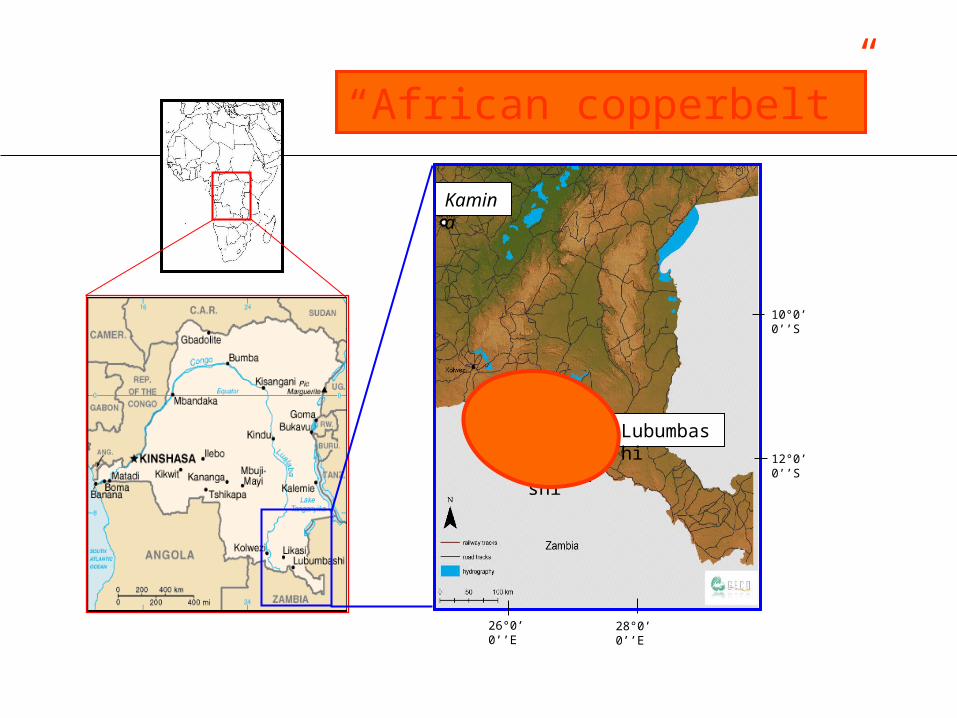
Background
• Evidence of high exposure to several metals (Co, Cu, As, U, …) in the population of south Katanga
• Evidence of higher exposure in subjects living very close (< 3 km) to mines or smelting plants
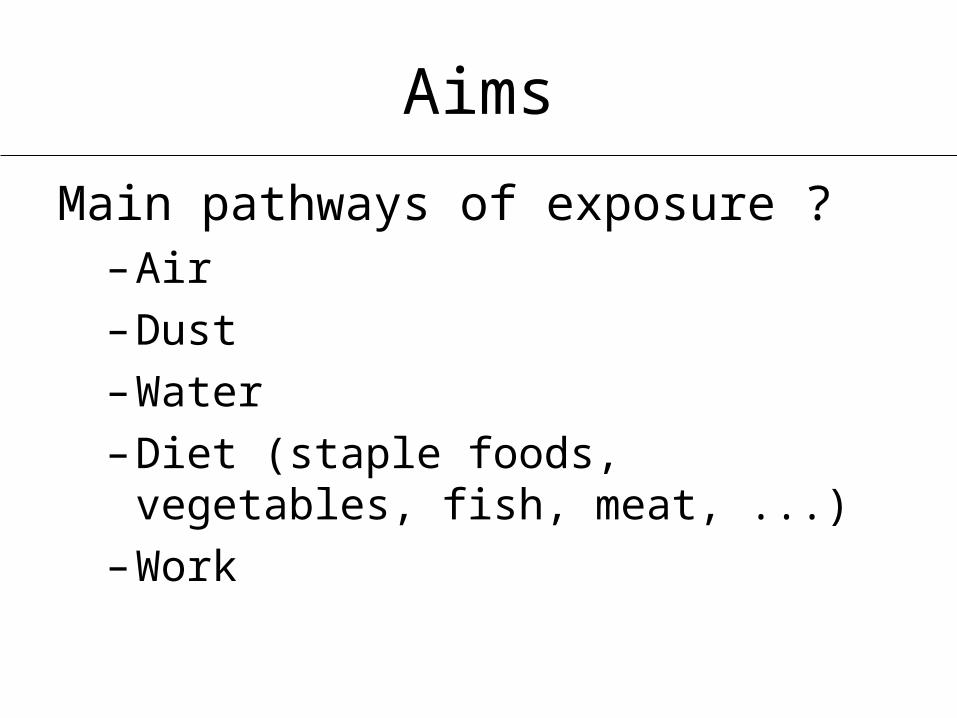
Aims
Main pathways of exposure ?– Air
– Dust
– Water
– Diet (staple foods, vegetables, fish, meat, ...)
– Work
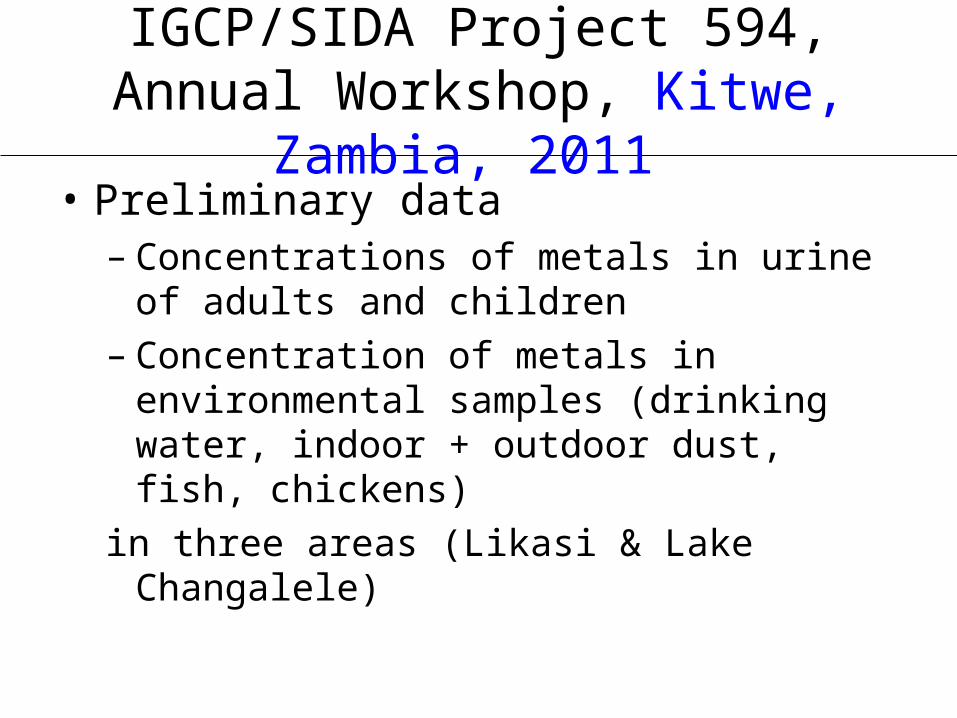
IGCP/SIDA Project 594, Annual Workshop, Kitwe, Zambia, 2011
• Preliminary data – Concentrations of metals in urine of adults
and children– Concentration of metals in environmental
samples (drinking water, indoor + outdoor dust, fish, chickens)
in three areas (Likasi & Lake Changalele)
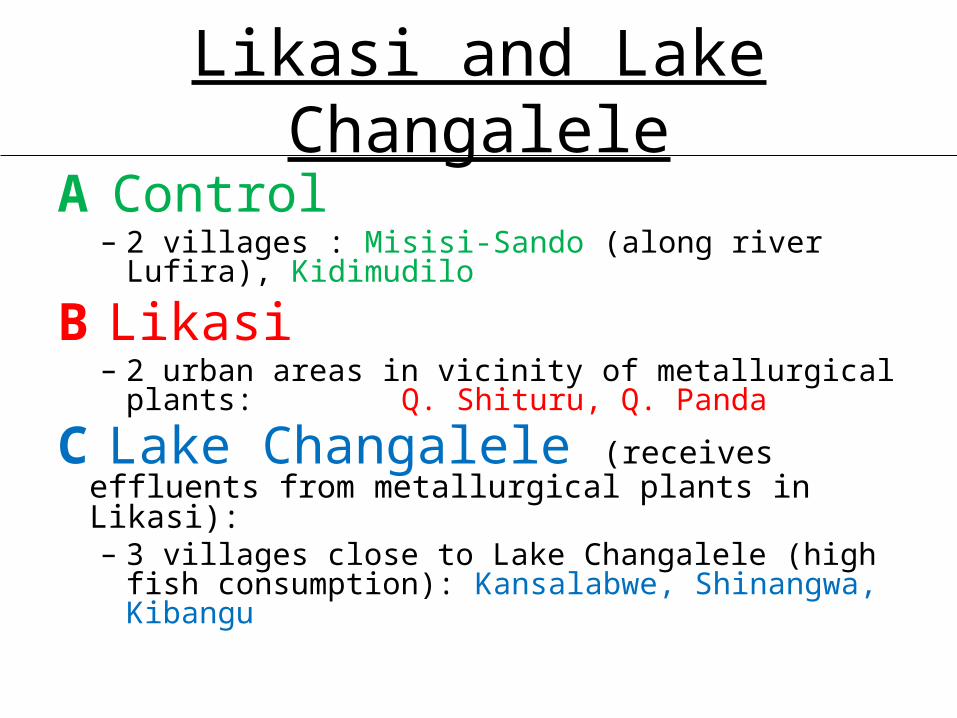
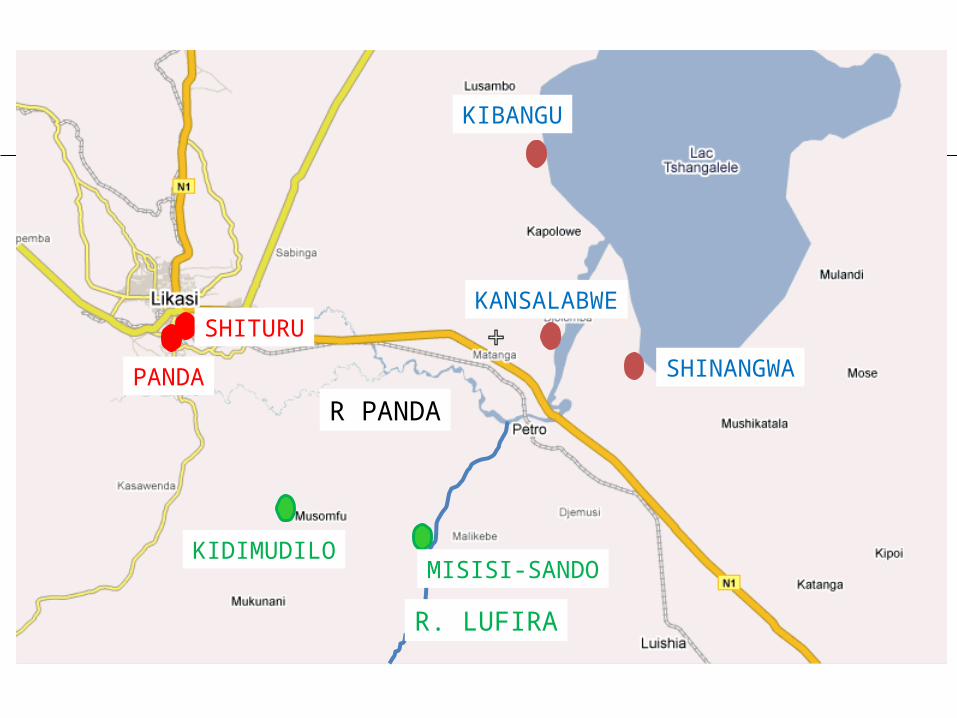
Likasi and Lake Changalele
A Control– 2 villages : Misisi-Sando (along river Lufira),
Kidimudilo
B Likasi– 2 urban areas in vicinity of metallurgical plants:
Q. Shituru, Q. Panda
C Lake Changalele (receives effluents from metallurgical plants in Likasi):– 3 villages close to Lake Changalele (high fish
consumption): Kansalabwe, Shinangwa, Kibangu
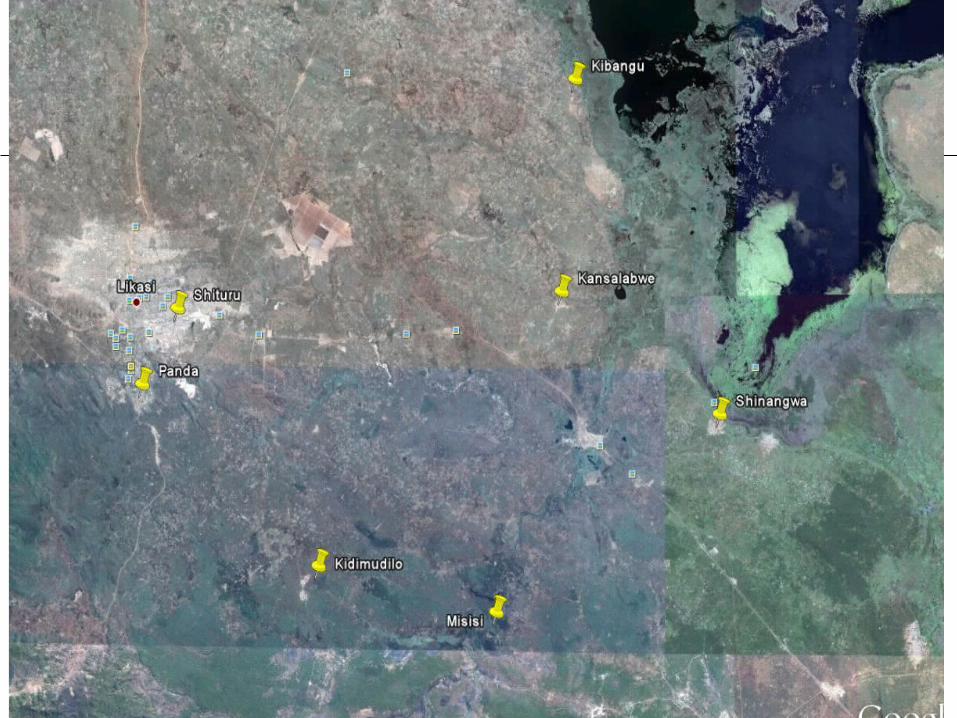
R PANDA
R. LUFIRA
KIBANGU
SHINANGWA
KANSALABWE
KIDIMUDILOMISISI-SANDO
SHITURU
PANDA
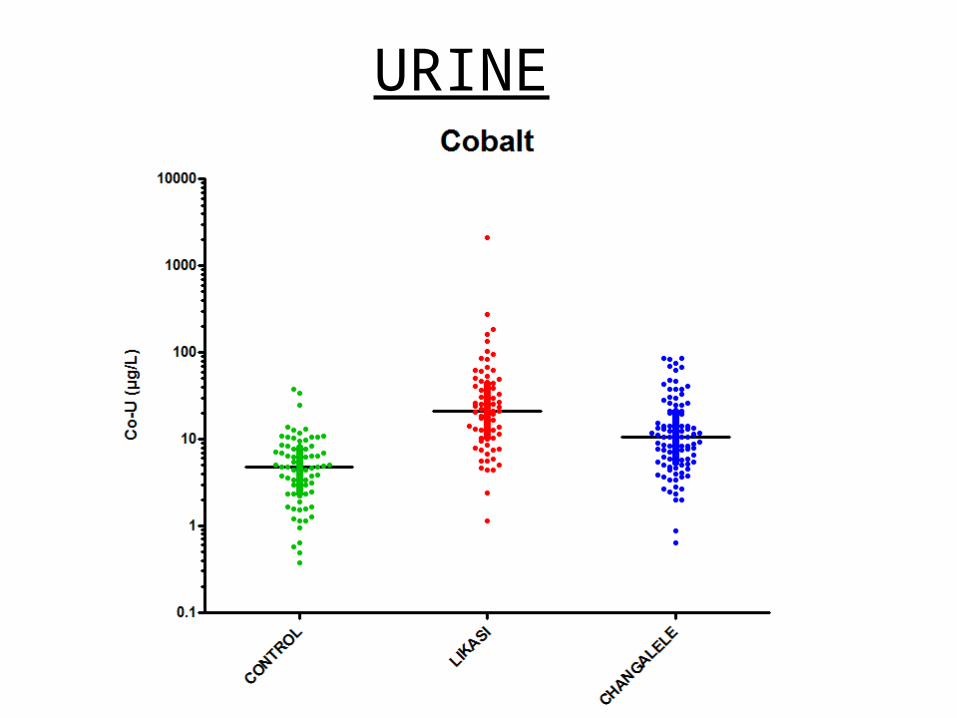
URINE
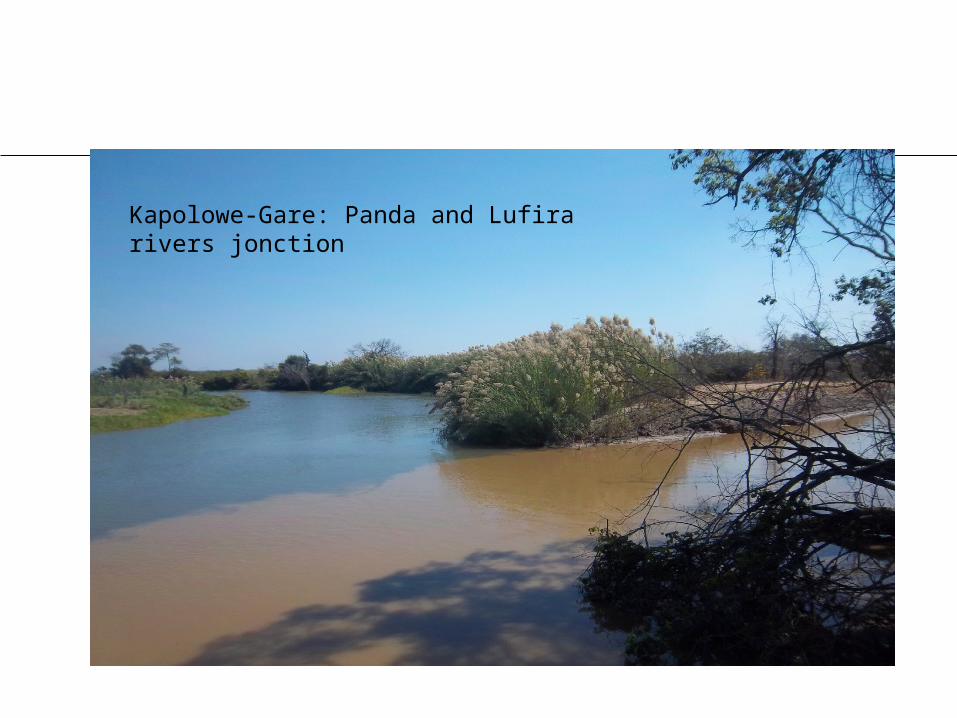
Kapolowe-Gare: Panda and Lufira rivers jonction
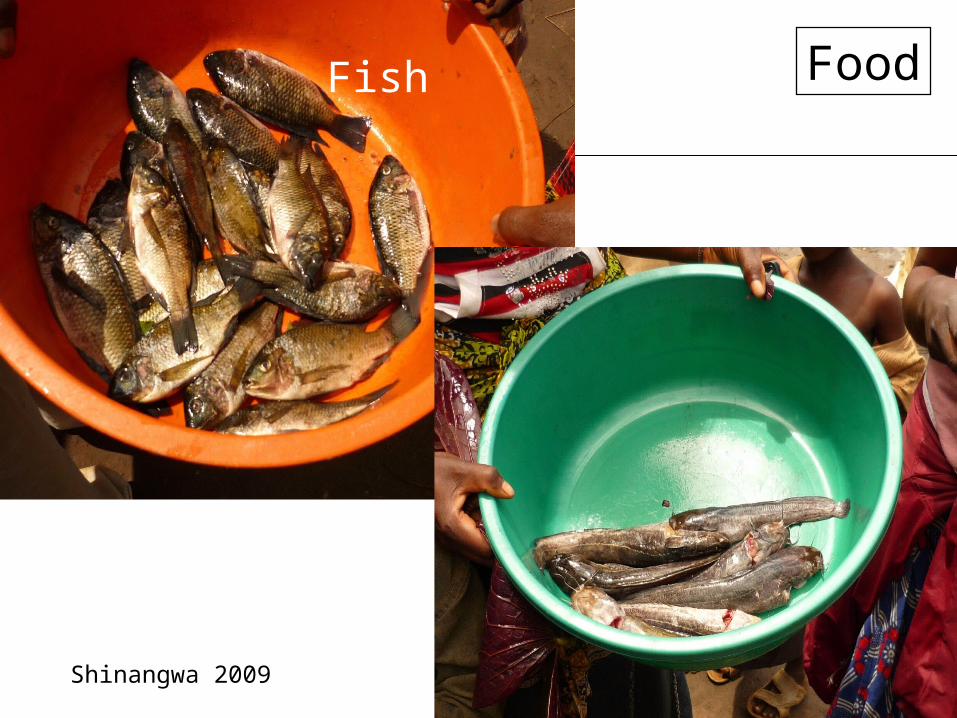
Shinangwa 2009
FoodFish
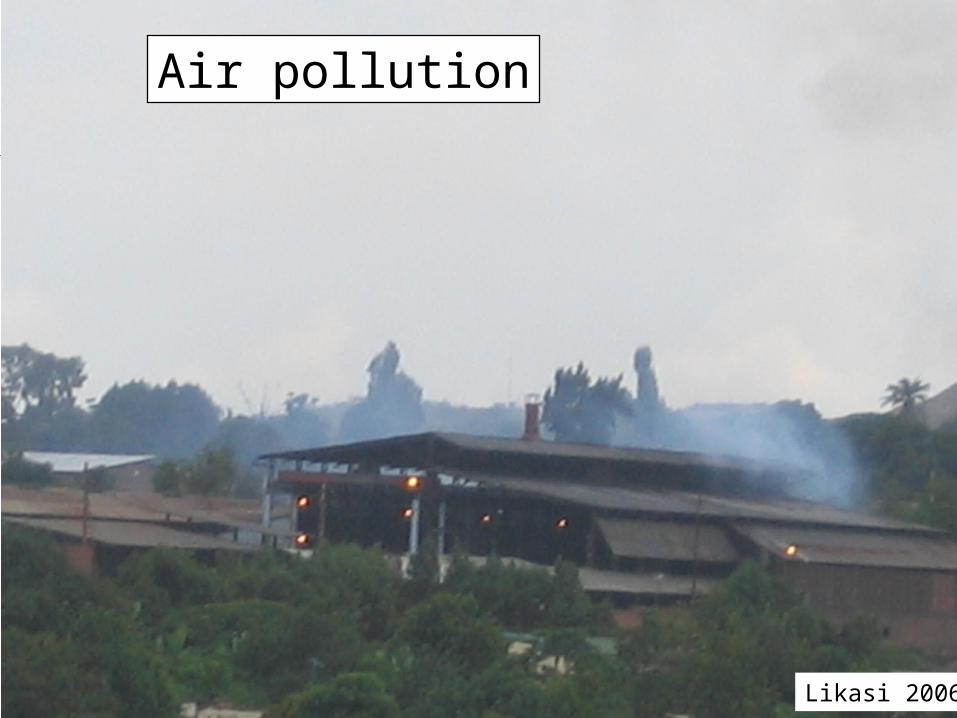
Air pollution
Likasi 2006
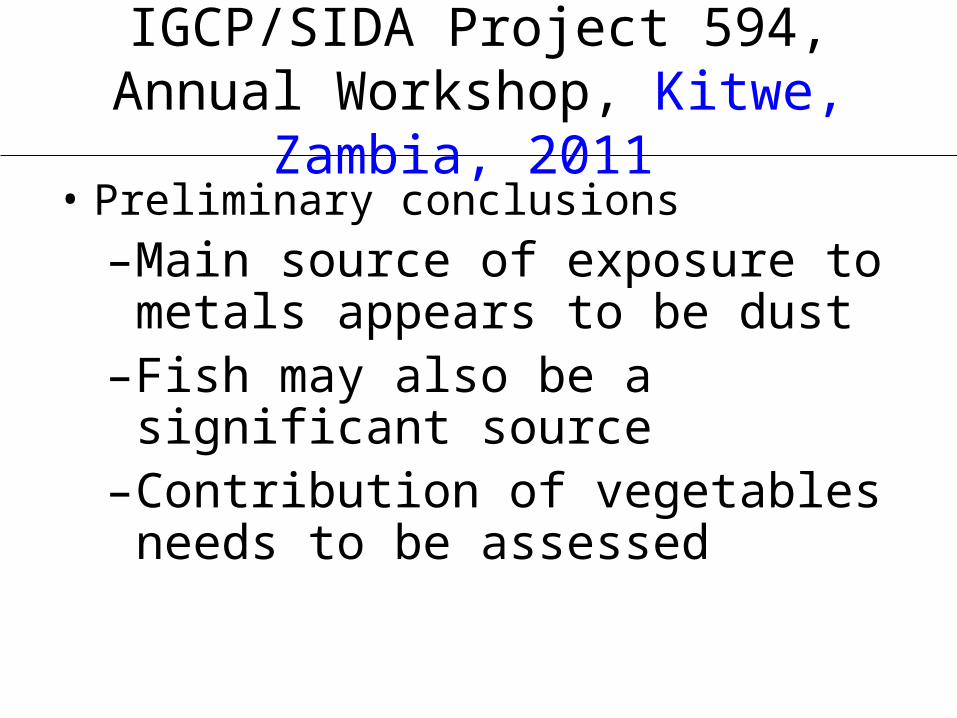
IGCP/SIDA Project 594, Annual Workshop, Kitwe, Zambia, 2011
• Preliminary conclusions
–Main source of exposure to metals appears to be dust
–Fish may also be a significant source
–Contribution of vegetables needs to be assessed
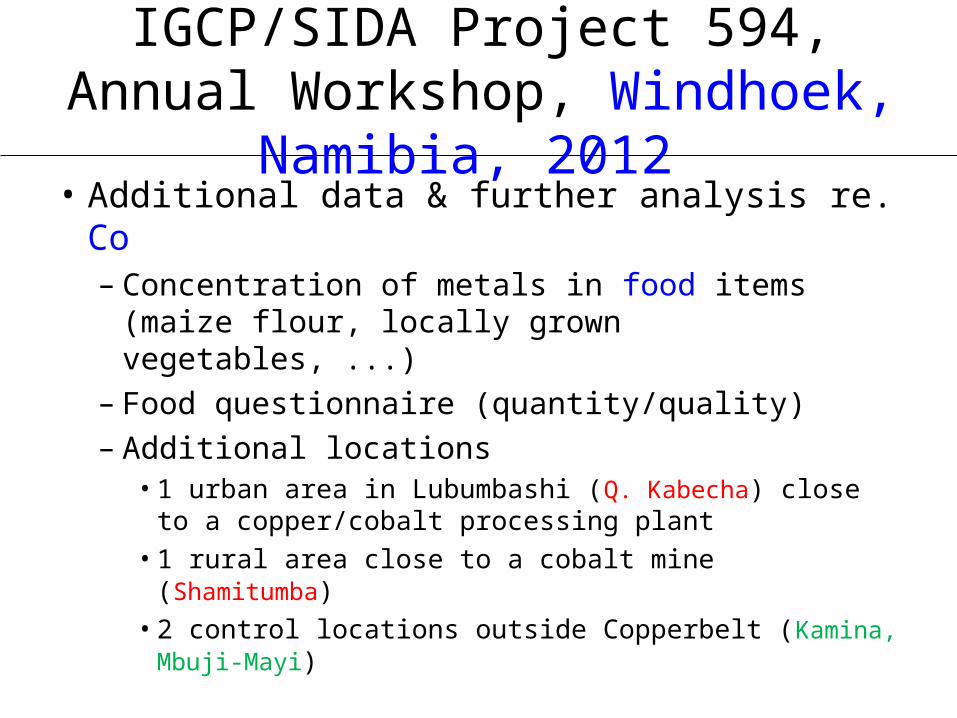
IGCP/SIDA Project 594, Annual Workshop, Windhoek, Namibia, 2012 • Additional data & further analysis re. Co
– Concentration of metals in food items (maize flour, locally grown vegetables, ...)
– Food questionnaire (quantity/quality)– Additional locations
• 1 urban area in Lubumbashi (Q. Kabecha) close to a copper/cobalt processing plant
• 1 rural area close to a cobalt mine (Shamitumba)• 2 control locations outside Copperbelt (Kamina,
Mbuji-Mayi)
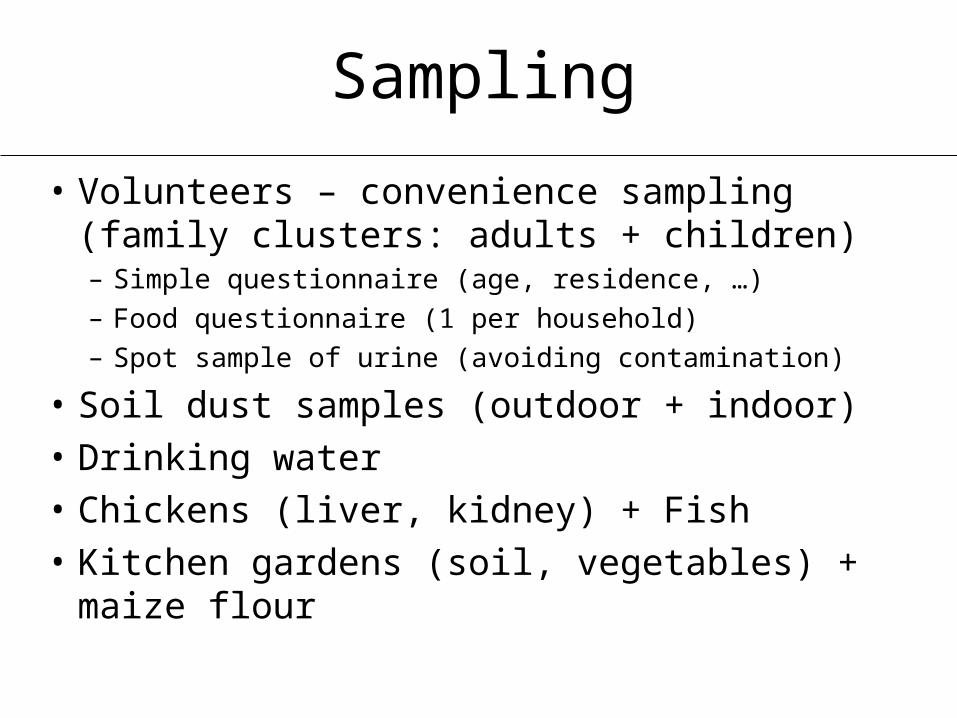
Sampling
• Volunteers – convenience sampling (family clusters: adults + children) – Simple questionnaire (age, residence, …)– Food questionnaire (1 per household)– Spot sample of urine (avoiding contamination)
• Soil dust samples (outdoor + indoor)
• Drinking water
• Chickens (liver, kidney) + Fish
• Kitchen gardens (soil, vegetables) + maize flour
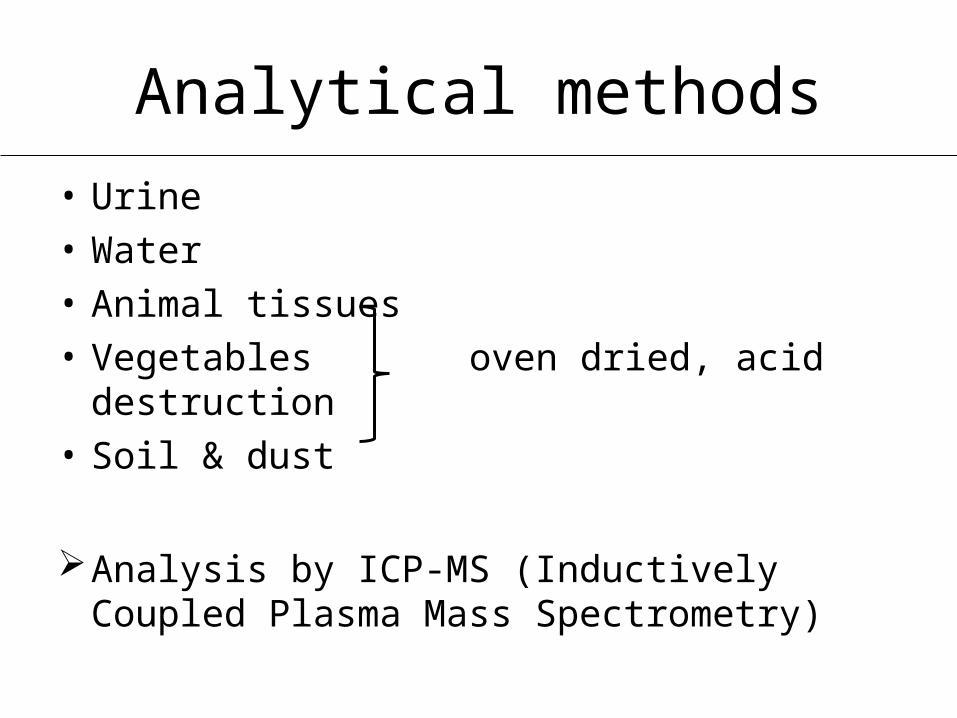
Analytical methods
• Urine• Water• Animal tissues• Vegetables oven dried, acid destruction• Soil & dust
Analysis by ICP-MS (Inductively Coupled Plasma Mass Spectrometry)
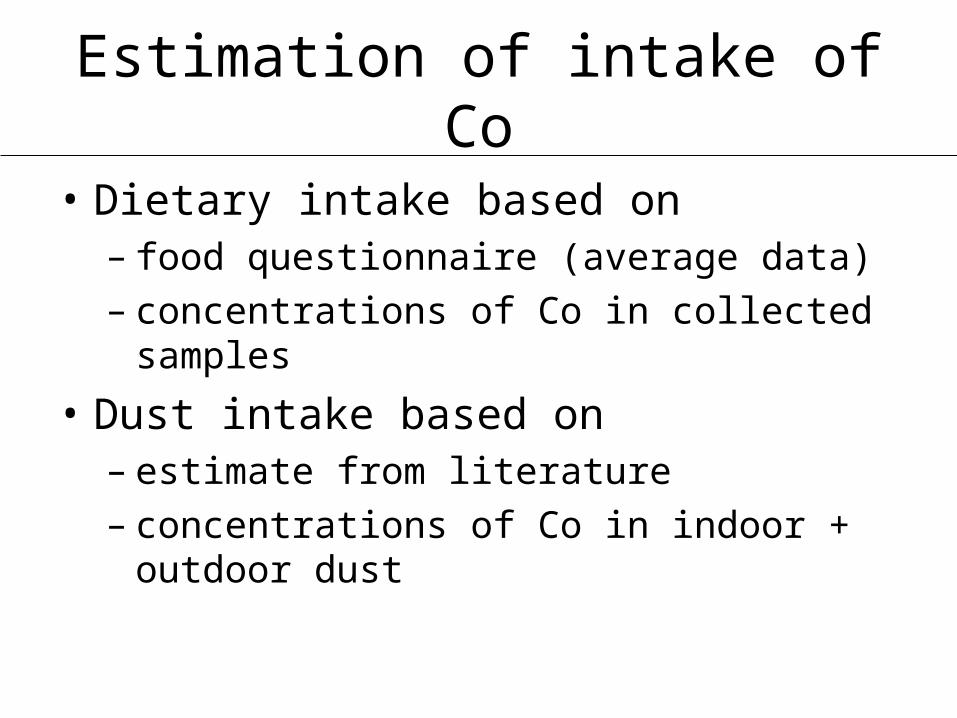
Estimation of intake of Co
• Dietary intake based on – food questionnaire (average data)– concentrations of Co in collected samples
• Dust intake based on – estimate from literature– concentrations of Co in indoor + outdoor dust
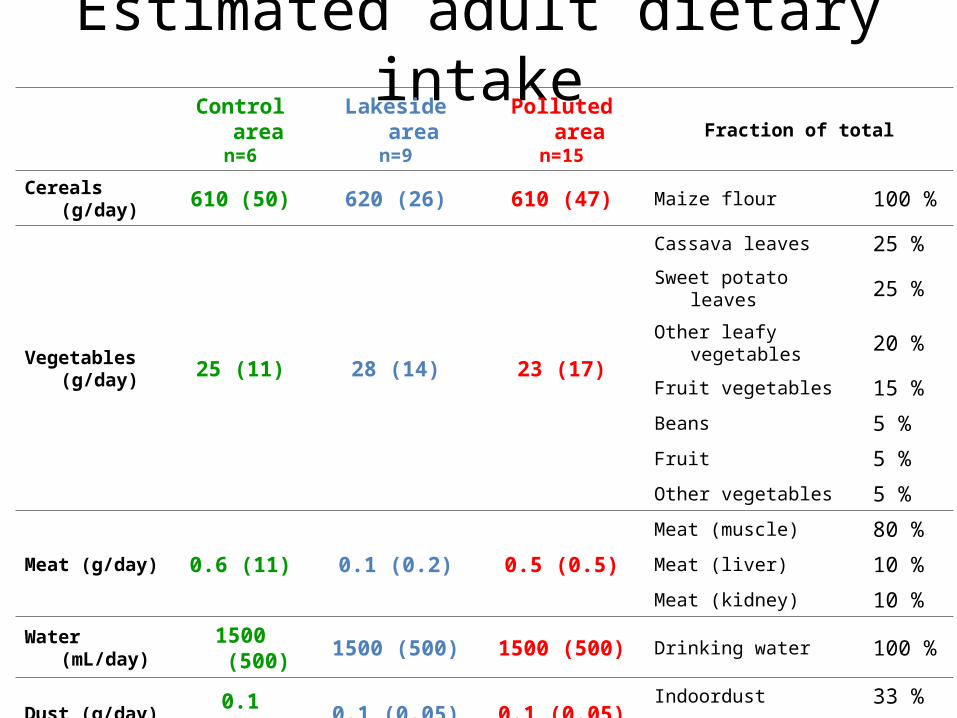
Estimated adult dietary intakeControl area
n=6Lakeside area
n=9Polluted area
n=15Fraction of total
Cereals (g/day) 610 (50) 620 (26) 610 (47) Maize flour 100 %
Vegetables (g/day) 25 (11) 28 (14) 23 (17)
Cassava leaves 25 %
Sweet potato leaves 25 %
Other leafy vegetables 20 %
Fruit vegetables 15 %
Beans 5 %
Fruit 5 %
Other vegetables 5 %
Meat (g/day) 0.6 (11) 0.1 (0.2) 0.5 (0.5)
Meat (muscle) 80 %
Meat (liver) 10 %
Meat (kidney) 10 %
Water (mL/day) 1500 (500) 1500 (500) 1500 (500) Drinking water 100 %
Dust (g/day) 0.1 (0.05) 0.1 (0.05) 0.1 (0.05)Indoordust 33 %
Outdoordust 67 %
Fish (g/day) 4.1 (1.0) 3.1 (0.8) 2.5 (1.6) Fish 100 %
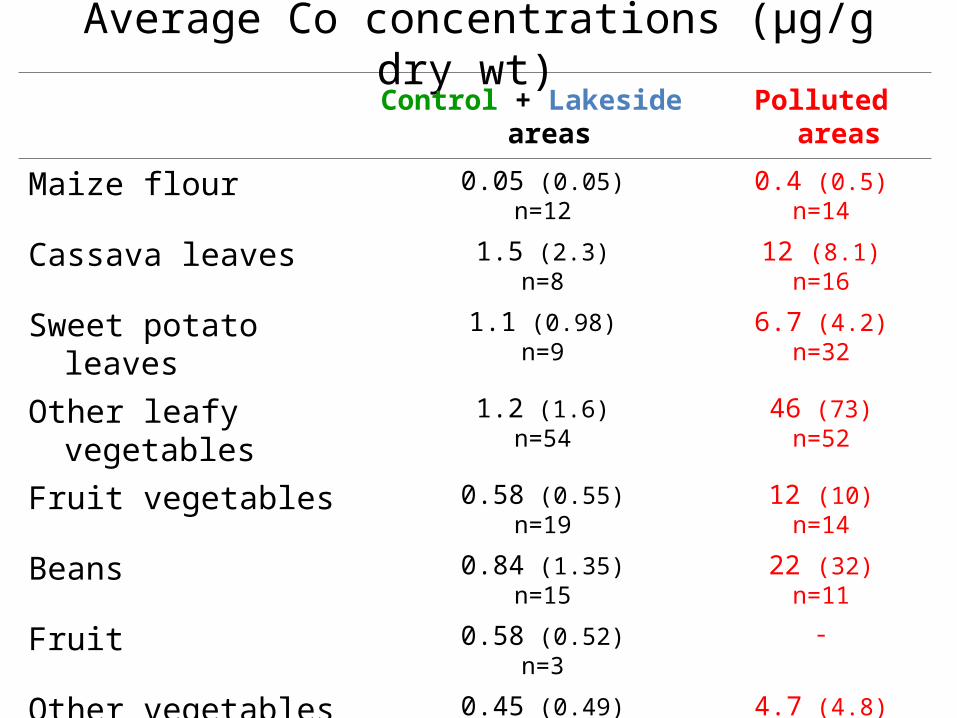
Average Co concentrations (µg/g dry wt)
Control + Lakeside areas Polluted areas
Maize flour 0.05 (0.05)n=12
0.4 (0.5)n=14
Cassava leaves 1.5 (2.3)n=8
12 (8.1)n=16
Sweet potato leaves 1.1 (0.98)n=9
6.7 (4.2)n=32
Other leafy vegetables 1.2 (1.6)n=54
46 (73)n=52
Fruit vegetables 0.58 (0.55)n=19
12 (10)n=14
Beans 0.84 (1.35)n=15
22 (32)n=11
Fruit 0.58 (0.52)n=3
-
Other vegetables 0.45 (0.49)n=16
4.7 (4.8)n=15
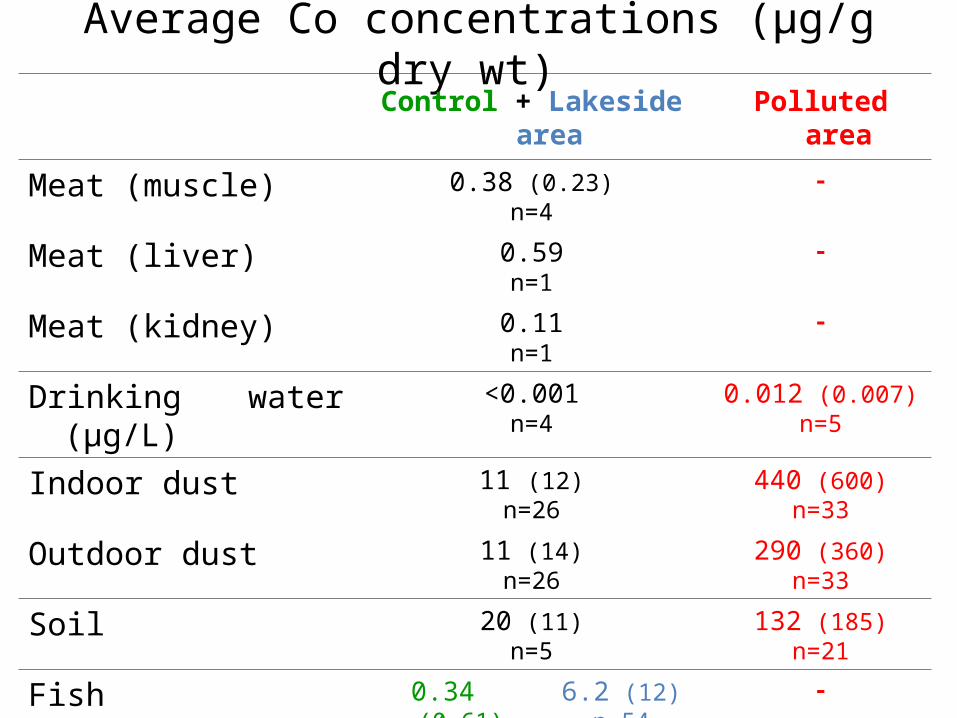
Average Co concentrations (µg/g dry wt)
Control + Lakeside area Polluted area
Meat (muscle) 0.38 (0.23)n=4
-
Meat (liver) 0.59n=1
-
Meat (kidney) 0.11n=1
-
Drinking water (µg/L) <0.001n=4
0.012 (0.007)n=5
Indoor dust 11 (12)n=26
440 (600)n=33
Outdoor dust 11 (14)n=26
290 (360)n=33
Soil 20 (11)n=5
132 (185)n=21
Fish 0.34 (0.61)n=44
6.2 (12)n=54
-
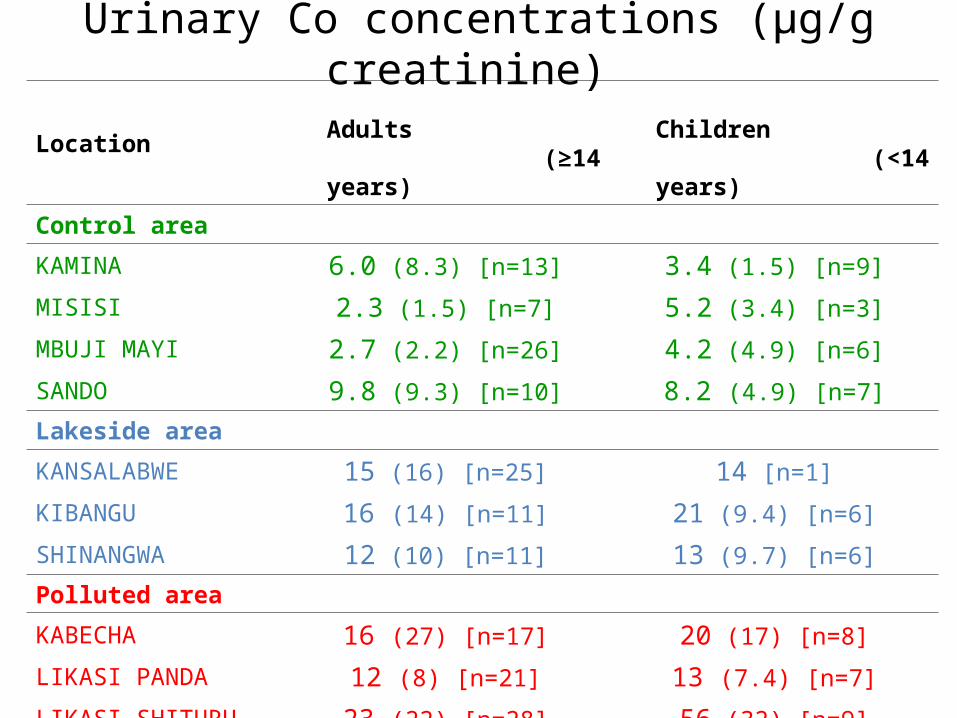
Location Adults (≥14 years)
Children (<14 years)
Control area
KAMINA 6.0 (8.3) [n=13] 3.4 (1.5) [n=9]
MISISI 2.3 (1.5) [n=7] 5.2 (3.4) [n=3]
MBUJI MAYI 2.7 (2.2) [n=26] 4.2 (4.9) [n=6]
SANDO 9.8 (9.3) [n=10] 8.2 (4.9) [n=7]
Lakeside area
KANSALABWE 15 (16) [n=25] 14 [n=1]
KIBANGU 16 (14) [n=11] 21 (9.4) [n=6]
SHINANGWA 12 (10) [n=11] 13 (9.7) [n=6]
Polluted area
KABECHA 16 (27) [n=17] 20 (17) [n=8]
LIKASI PANDA 12 (8) [n=21] 13 (7.4) [n=7]
LIKASI SHITURU 23 (22) [n=28] 56 (32) [n=9]
SHAMITUMBA 25 (24) [n=13] 99 (120) [n=9]
Urinary Co concentrations (µg/g creatinine)
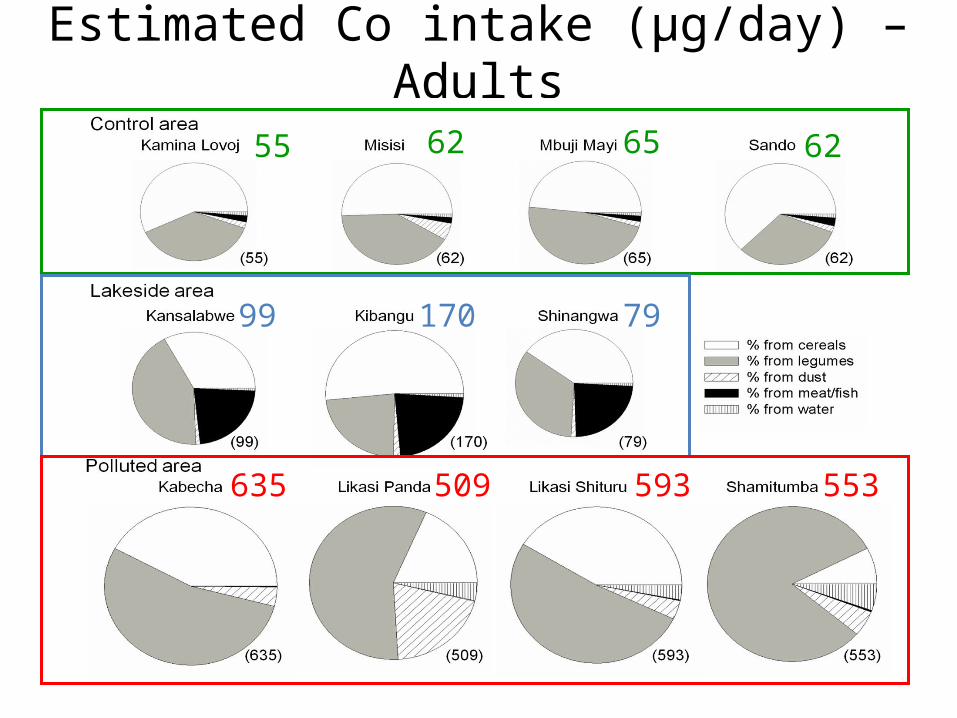
Estimated Co intake (µg/day) – Adults
55 62 6265
635 509 553593
99 170 79
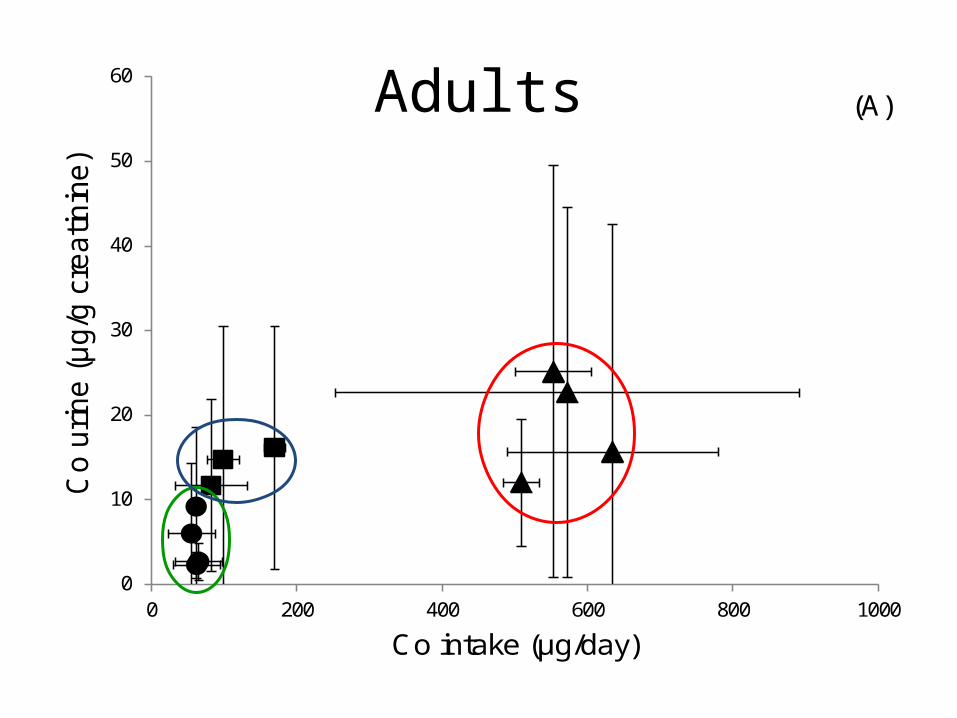
0
10
20
30
40
50
60
0 200 400 600 800 1000
Co
uri
ne (
µg/g
cre
atin
ine)
Co intake (µg/day)
(A)Adults
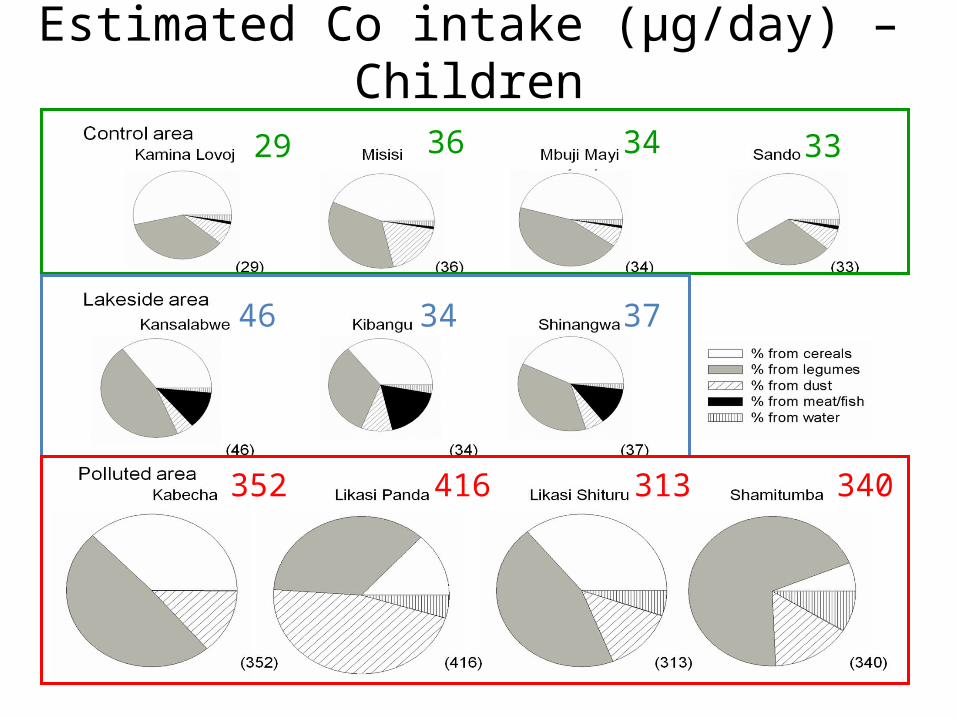
29 36 3334
352 416 340313
46 34 37
Estimated Co intake (µg/day) – Children
0
50
100
150
200
250
0 100 200 300 400 500 600
Co
uri
ne
(µ
g/g
cre
atin
ine
)
Co intake (µg/day)
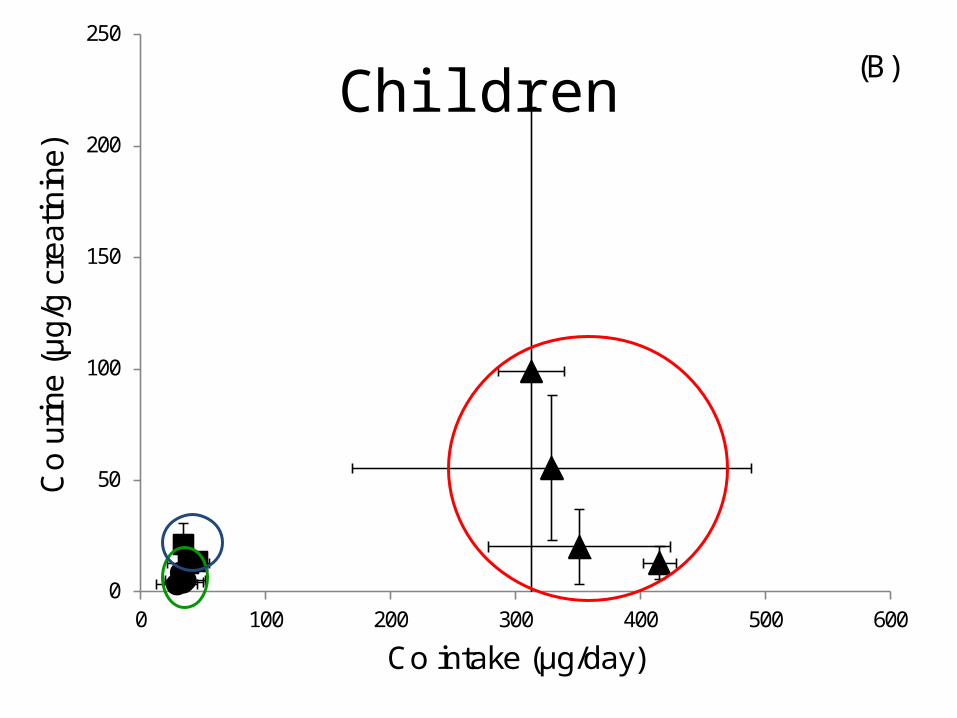
(B)Children
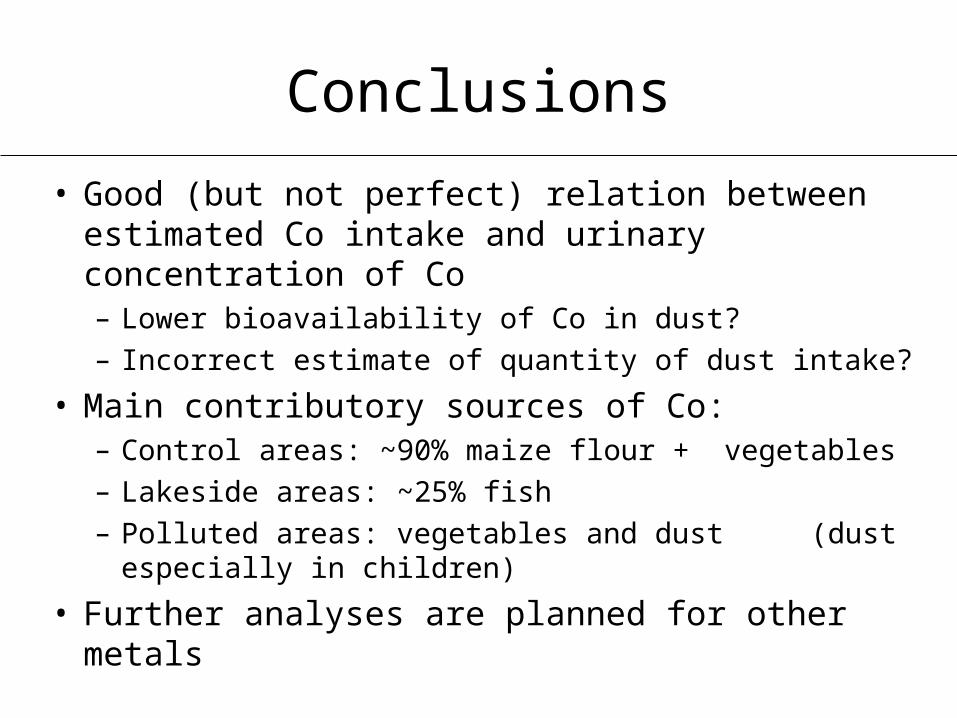
Conclusions
• Good (but not perfect) relation between estimated Co intake and urinary concentration of Co– Lower bioavailability of Co in dust?– Incorrect estimate of quantity of dust intake?
• Main contributory sources of Co:– Control areas: ~90% maize flour + vegetables– Lakeside areas: ~25% fish – Polluted areas: vegetables and dust
(dust especially in children)
• Further analyses are planned for other metals


![PORTUGAL - IGCP, E.P.E. - IGCP€¦ · …buoyed by strong gains in exports’market share 2. Stronger growth foundations 12 Significant gains in exports’ market share [Index 2007Q1=100]](https://img.pdfslide.net/doc/110x75/5f0c30927e708231d4342edd/portugal-igcp-epe-igcp-buoyed-by-strong-gains-in-exportsamarket-share.jpg)