Embed Size (px)
Citation preview

IGCSE GEOGRAPHY – Development and Human Welfare Revision These are the BASIC KEYWORDS which you should use wherever possible: affluence The general level of prosperity enjoyed by a population. intermediate aid Know-how and equipment that are suited to the basic conditions prevailing in the receiving country. birth rate The number of births in a year per 1000 of the total population. death rate The number of deaths in a year per 1000 of the total population. development The economic and social progress that leads to an improvement in the standard of living and quality of life for an increasing proportion of the population. development gap The difference in standards of living and wellbeing between the world’s richest and poorest countries (between HICs and LICs), or within countries and regions. free trade When trade between countries is not restricted by, for example, import duties or not being a member of a group of trading nations. gross domestic product (GDP) The total value of goods and services produced by a country during a year. When expressed as per head of population (per capita), it provides a widely used measure of national prosperity and development. human development index (HDI) Used as a measure of development in a country and for making international comparisons. human welfare The general condition of a population in terms of diet, housing, healthcare, education, etc. infant mortality The average number of deaths of infants under 1 year of age, per 1000 live births, per year. Intermediate technology The simple, easily learned and maintained technology used in a range of economic activities serving local needs in LICs. life expectancy The average number of years a person might be expected to live. quality of life The degree of well-being and satisfaction felt by a person or a group of people in a particular area.
SECTION C: DEVELOPMENT & HUMAN WELFARE
1. Development
Define development and quality of life.
There are six strands of development. Place the factors (next page) under the correct development strand below. Development - The economic and social progress that leads to an improvement in the standard of living and quality of life for an increasing proportion of the population. Quality of life - The degree of well-being and satisfaction felt by a person or a group of people in a particular area.
What is
development?
Economic
-
-
-
Demographic
-
-
-
Social
-
-
-
Cultural
-
-
-
Political
-
-
-
Environmental
-
-
-
Word box:
Welfare – access to services Birth control – right to choose Conservation of resources and biodiversity
Right to vote Leisure time – restricted working hours
Equal opportunities
Pollution Heritage – respect and conserve Democratic government – fair elections
Life Expectancy Productivity – efficient use of capital and labour
Life expectancy
Standard of living – raising the minimum
Ethnicity – mutual respect Compulsory education for all
Mobility – freedom to migrate Civil and religious liberties
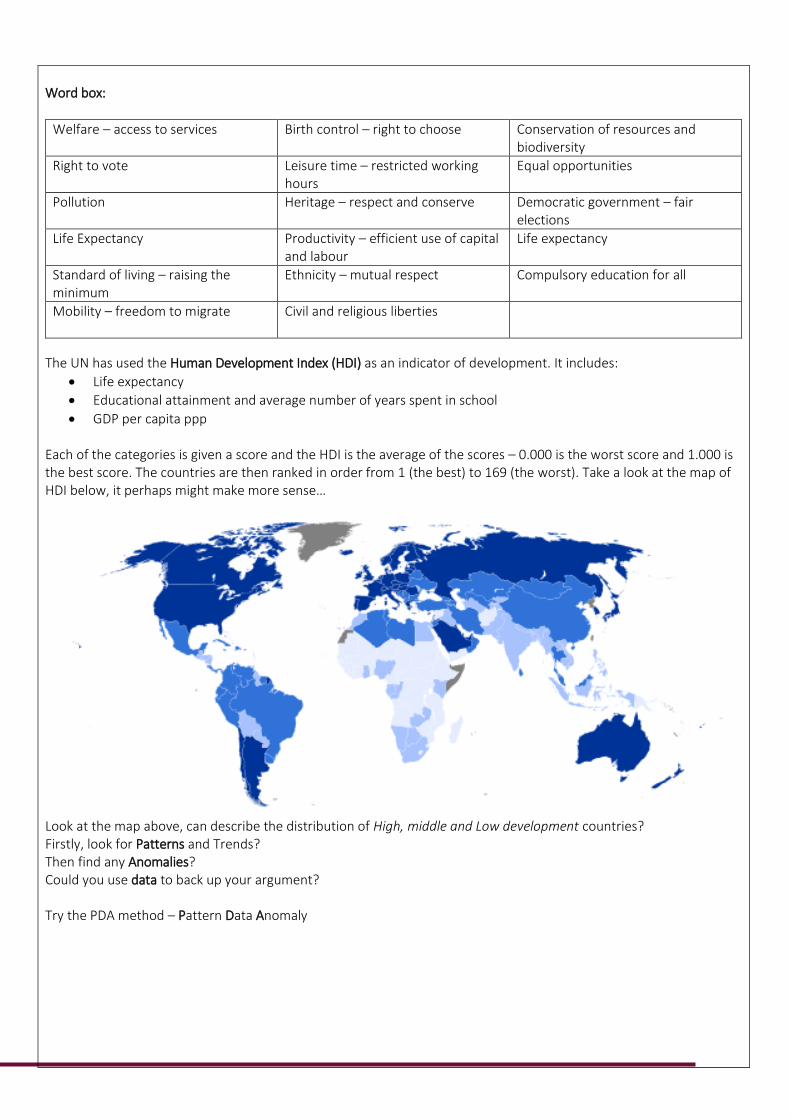
The UN has used the Human Development Index (HDI) as an indicator of development. It includes:
Life expectancy
Educational attainment and average number of years spent in school
GDP per capita ppp
Each of the categories is given a score and the HDI is the average of the scores – 0.000 is the worst score and 1.000 is the best score. The countries are then ranked in order from 1 (the best) to 169 (the worst). Take a look at the map of HDI below, it perhaps might make more sense…
Look at the map above, can describe the distribution of High, middle and Low development countries? Firstly, look for Patterns and Trends? Then find any Anomalies? Could you use data to back up your argument? Try the PDA method – Pattern Data Anomaly

TASK Describe how the quality of life in a high HDI country, such as Singapore, differs from that in a low HDI country, such as Guinea. (6) ………………………………………………………………………………………………………………………………………………………………………………………. ………………………………………………………………………………………………………………………………………………………………………………………. ………………………………………………………………………………………………………………………………………………………………………………………. ………………………………………………………………………………………………………………………………………………………………………………………. ………………………………………………………………………………………………………………………………………………………………………………………. ………………………………………………………………………………………………………………………………………………………………………………………. ………………………………………………………………………………………………………………………………………………………………………………………. ………………………………………………………………………………………………………………………………………………………………………………………. ………………………………………………………………………………………………………………………………………………………………………………………. ………………………………………………………………………………………………………………………………………………………………………………………. ………………………………………………………………………………………………………………………………………………………………………………………. ………………………………………………………………………………………………………………………………………………………………………………………. TASK

Outline the nature of development as a complex, multi–strand process with many facets.
The North/South divide between MEDCs and LEDCs by Willy Brandt, German Chancellor 1980
The North South Divide
MEDCs are countries which have a high standard of living and a large GDP. LEDCs are countries with a low standard of living and a much lower GDP.
The map shows the locations of LEDCs and MEDCs. Most of the southern hemisphere is less developed, while countries in the northern hemisphere are more developed.
TASK Explain why the measurement of development is much more complicated than simply comparing GDP. (6)
……………………………………………………………………………………………………………………………………………………………………………………….
……………………………………………………………………………………………………………………………………………………………………………………….
……………………………………………………………………………………………………………………………………………………………………………………….
……………………………………………………………………………………………………………………………………………………………………………………….
……………………………………………………………………………………………………………………………………………………………………………………….
……………………………………………………………………………………………………………………………………………………………………………………….
……………………………………………………………………………………………………………………………………………………………………………………….
………………………………………………………………………………………………………………………………………………………………………………………. ………………………………………………………………………………………………………………………………………………………………………………………. ……………………………………………………………………………………………………………………………………………………………………………………….

2. Development indicators
Describe a range of development indicators (per capita GDP/GNI, employment by sector, energy use, birth/death/IM rates, life expectancy).
TASK What is meant by the term GDP (gross domestic product)? (2) ………………………………………………………………………………………………………………………………………………………………………………………. ………………………………………………………………………………………………………………………………………………………………………………………. ………………………………………………………………………………………………………………………………………………………………………………………. TASK Describe two indicators of development other than life expectancy and GDP. (4) ………………………………………………………………………………………………………………………………………………………………………………………. ………………………………………………………………………………………………………………………………………………………………………………………. ………………………………………………………………………………………………………………………………………………………………………………………. ………………………………………………………………………………………………………………………………………………………………………………………. ………………………………………………………………………………………………………………………………………………………………………………………. ………………………………………………………………………………………………………………………………………………………………………………………. ……………………………………………………………………………………………………………………………………………………………………………………….
The employment structure means how the workforce is divided up between the three main employment sectors - primary, secondary and tertiary. Employment structures change over time.
Countries in the early stage of development usually have a high percentage of the population in primary employment. This is because most people are engaged in agricultural activities.
As a country begins to develop an industrial base there is an increase in the secondary sector. An increase in machinery on farms means fewer people are needed. People tend to migrate to urban areas to get jobs in factories.
When a country becomes more economically developed there is a greater demand for services such as education, health care and tourism. Therefore the tertiary sector undergoes growth. By this time computers, machinery and robots replace people in the secondary sector hence the decrease in secondary jobs.

TASK What does the employment structure of a country like Nepal suggest about its level of development? (3) ………………………………………………………………………………………………………………………………………………………………………………………. ………………………………………………………………………………………………………………………………………………………………………………………. ………………………………………………………………………………………………………………………………………………………………………………………. ………………………………………………………………………………………………………………………………………………………………………………………. TASK Sort these by colouring the data column in two colours – one for Niger (LIC), the other for Australia (HIC).
Measure Definition Data
Gross national income (GNI) per head
Measures the total economic output of a country, including earnings from foreign investments which is then divided by the number of people in the population.
$873 $41,524
Birth rate The number of live births per 1,000 people per year
46.12 births/1,000 population 12.19 births/1,000 population
Death rate The number of deaths per 1,000 people per year 12.73 deaths/1,000 population 7.07 deaths/1,000 population
Infant mortality The number of deaths of children under the age of 1 year expressed as 1000 live births per year
86.27 deaths/1,000 live births 4.43 deaths/1,000 live births
Life expectancy The average number of years from birth that a person can expect to live
54.74 years 82.07 years
People per Doctor The total population divided by the number of doctors in the country
0.02 physicians/1,000 population 3.27 physicians/1,000 population
Literacy rates Is the percentage of adults who can read and write
19.1% 99%
Access to safe drinking water
The proportion of people using improved drinking water sources: household connection; public standpipe; borehole; protected dug well; protected spring; rainwater.
52% 100%
Human Development index (HDI)
The Human Development Index (HDI) is a composite (more than one element) statistic of life expectancy, education, and per capita income indicators, which is used to rank countries
0.337 0.933
Explain how these indicate levels of development.

Statistics and correlations
Geographers compare the statistics for different countries to see if there is a relationship or correlation between the data for different countries. A correlation helps to show what factors contribute to development.
The example below compares GDP per capita to adult literacy rate in a scatter graph. The plotting for each country does not show much on its own, but together they show a pattern.

TASK How does the graph above help indicate the level of development in Liberia and Canada? (4) ………………………………………………………………………………………………………………………………………………………………………………………. ………………………………………………………………………………………………………………………………………………………………………………………. ………………………………………………………………………………………………………………………………………………………………………………………. ………………………………………………………………………………………………………………………………………………………………………………………. ………………………………………………………………………………………………………………………………………………………………………………………. ……………………………………………………………………………………………………………………………………………………………………………………….
3. Quality of life indicators
Describe a range of QoL indicators (housing, health and healthcare, access to services, diet, literacy, security and safety, political freedom and HDI).
TASK Describe how you could measure and compare QOL in terms of::
Diet:
Work:
Health:
Quality of environment:
Security/safety:
TASK Describe how the Human Development Index (HDI) is calculated. (4)
………………………………………………………………………………………………………………………………………………………………………………………. ………………………………………………………………………………………………………………………………………………………………………………………. ………………………………………………………………………………………………………………………………………………………………………………………. ………………………………………………………………………………………………………………………………………………………………………………………. ……………………………………………………………………………………………………………………………………………………………………………………….
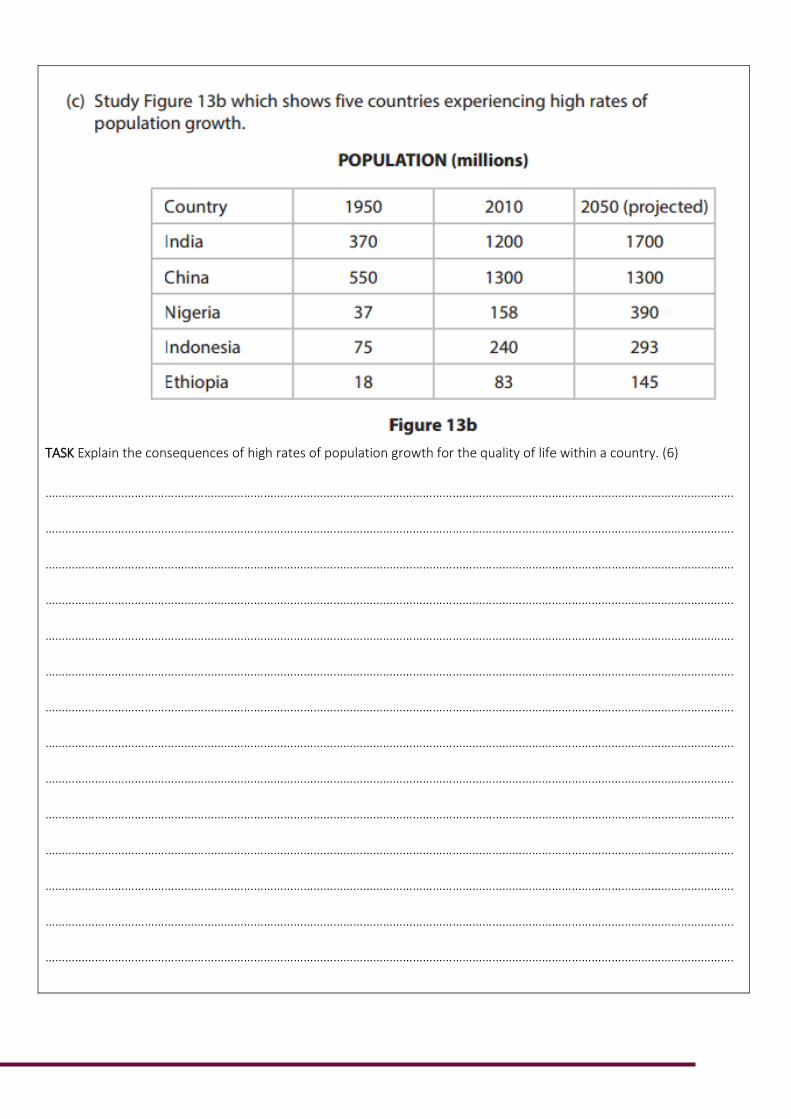
TASK Explain the consequences of high rates of population growth for the quality of life within a country. (6)
………………………………………………………………………………………………………………………………………………………………………………………. ………………………………………………………………………………………………………………………………………………………………………………………. ………………………………………………………………………………………………………………………………………………………………………………………. ………………………………………………………………………………………………………………………………………………………………………………………. ………………………………………………………………………………………………………………………………………………………………………………………. ………………………………………………………………………………………………………………………………………………………………………………………. ………………………………………………………………………………………………………………………………………………………………………………………. ………………………………………………………………………………………………………………………………………………………………………………………. ………………………………………………………………………………………………………………………………………………………………………………………. ………………………………………………………………………………………………………………………………………………………………………………………. ………………………………………………………………………………………………………………………………………………………………………………………. ………………………………………………………………………………………………………………………………………………………………………………………. ………………………………………………………………………………………………………………………………………………………………………………………. ……………………………………………………………………………………………………………………………………………………………………………………….

TASK Give reasons for the contrast in quality of life within urban areas. Reference to examples may help your answer. (6)
………………………………………………………………………………………………………………………………………………………………………………………. ………………………………………………………………………………………………………………………………………………………………………………………. ………………………………………………………………………………………………………………………………………………………………………………………. ………………………………………………………………………………………………………………………………………………………………………………………. ………………………………………………………………………………………………………………………………………………………………………………………. ………………………………………………………………………………………………………………………………………………………………………………………. ………………………………………………………………………………………………………………………………………………………………………………………. ………………………………………………………………………………………………………………………………………………………………………………………. ………………………………………………………………………………………………………………………………………………………………………………………. ………………………………………………………………………………………………………………………………………………………………………………………. ………………………………………………………………………………………………………………………………………………………………………………………. ………………………………………………………………………………………………………………………………………………………………………………………. ………………………………………………………………………………………………………………………………………………………………………………………. ……………………………………………………………………………………………………………………………………………………………………………………….

Explain how these indicate quality of life.
The map above shows the Daily Calorie Intake Per Capita. TASK What does ‘Per Capita mean? (1) ………………………………………………………………………………………………………………………………………………………………………………………. ………………………………………………………………………………………………………………………………………………………………………………………. ………………………………………………………………………………………………………………………………………………………………………………………. TASK How does this indicator indicate quality of life? (3) ………………………………………………………………………………………………………………………………………………………………………………………. ………………………………………………………………………………………………………………………………………………………………………………………. ………………………………………………………………………………………………………………………………………………………………………………………. ………………………………………………………………………………………………………………………………………………………………………………………. ………………………………………………………………………………………………………………………………………………………………………………………. ……………………………………………………………………………………………………………………………………………………………………………………….

PQLI - This is measured from 0-100 and combines life expectancy, infant mortality and adult literacy. The higher the score, the higher the quality of life of a country. TASK What are the limitations (disadvantages) of using this indicator alone? (4) ………………………………………………………………………………………………………………………………………………………………………………………. ………………………………………………………………………………………………………………………………………………………………………………………. ………………………………………………………………………………………………………………………………………………………………………………………. ………………………………………………………………………………………………………………………………………………………………………………………. ………………………………………………………………………………………………………………………………………………………………………………………. ………………………………………………………………………………………………………………………………………………………………………………………. TASK Suggest why GDP per capita is not necessarily a good indicator of quality of life. (2) ………………………………………………………………………………………………………………………………………………………………………………………. ………………………………………………………………………………………………………………………………………………………………………………………. ……………………………………………………………………………………………………………………………………………………………………………………….
Problems with development indicators Development indicators can be misleading and need to be used with care. For example: Many indices are averages for the whole population of a country. This means that indices do not always reveal substantial inequalities between different segments of society. For example, a portion of the population of a highly developed country could be living below the poverty line. In some countries, the data used in indices could be out of date or hard to collect.
Some countries do not wish to have certain index data collected - for example, many countries do not publish statistics about the number of immigrants and migrants.
The development indicators all have their advantages and disadvantages, the main problems with them are that they only focus on certain aspects of development, social, economic, political or even environmental. Because of this there tend to be countries with will rank highly due to part of their country but realistically aren’t as good as another country.
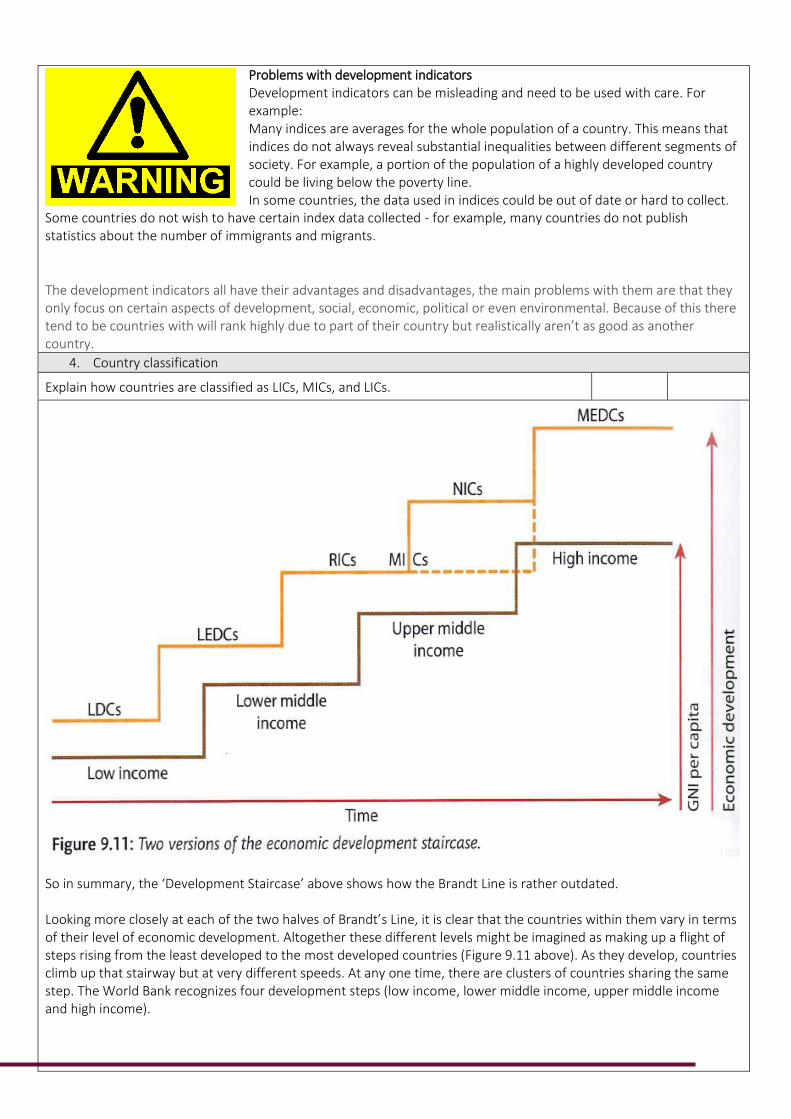
4. Country classification
Explain how countries are classified as LICs, MICs, and LICs.
So in summary, the ‘Development Staircase’ above shows how the Brandt Line is rather outdated. Looking more closely at each of the two halves of Brandt’s Line, it is clear that the countries within them vary in terms of their level of economic development. Altogether these different levels might be imagined as making up a flight of steps rising from the least developed to the most developed countries (Figure 9.11 above). As they develop, countries climb up that stairway but at very different speeds. At any one time, there are clusters of countries sharing the same step. The World Bank recognizes four development steps (low income, lower middle income, upper middle income and high income).

The Edexcel Geography specification amalgamates the two middle-income groupings and so arrives at three step stairway:
low-income (LIC)
middle-income (MIC)
high-income (HIC)
Describe the global pattern of countries at different levels of economic development.
TASK Describe the global pattern of countries at different levels of economic development. (6) ………………………………………………………………………………………………………………………………………………………………………………………. ………………………………………………………………………………………………………………………………………………………………………………………. ………………………………………………………………………………………………………………………………………………………………………………………. ………………………………………………………………………………………………………………………………………………………………………………………. ………………………………………………………………………………………………………………………………………………………………………………………. ………………………………………………………………………………………………………………………………………………………………………………………. ………………………………………………………………………………………………………………………………………………………………………………………. ………………………………………………………………………………………………………………………………………………………………………………………. ………………………………………………………………………………………………………………………………………………………………………………………. ………………………………………………………………………………………………………………………………………………………………………………………. ………………………………………………………………………………………………………………………………………………………………………………………. ……………………………………………………………………………………………………………………………………………………………………………………….

5. Changing global development
Outline the changing pattern of global development – the emerging economies, NICs and BRICs.
The emerging countries: China and India Two of the world's most populated countries, China and India, are in Asia. They are both globally significant and are both aiming to become global leaders. They are referred to as 'emerging countries'.
China's growth is partly due to its move from agricultural production to manufacturing. China joined the World Trade Organisation (WTO) in 2001. Many manufactured goods that we buy in the UAE come from China. The growth of manufacturing in China is due to many reasons, including:
China has created excellent opportunities for businesses to set up - making sure that the infrastructure is present.
Incentives are offered by some agencies in China. There are Special Economic Zones (SEZ) that offer tax incentives to foreign businesses. One SEZ is Shenzen.
China has a good supply of highly-skilled labour.
There are lower labour costs involved - there is no national minimum wage.
China is able to offer economies of scale because it already has a large manufacturing base.
China has a growing domestic market for goods because of its large population.
China has a reputation of a strong work ethic, and workers are used to long working hours.
Health and safety laws are sometimes not heavily enforced which means companies do not have to spend money on meeting health and safety standards.

Stagnant Economies There are lots of reasons why some countries are much less developed than others. The reasons are complex and vary from place to place. Physical factors Climate - many of the poorest countries are in the
tropics where it is hot, the land is less fertile, water is scarce, and diseases flourish. Natural resources - some raw materials are valuable and can help a country develop if they have the resources to collect and process them, eg oil, diamonds, forests and gold. Location - being near trade routes and having access to the sea, eg ports have been important for trade. Landlocked countries are at a disadvantage. Natural hazards - some places are vulnerable to natural disasters, eg Haiti is located in an area prone to earthquakes and hurricanes.
Historical/political factors Trade - goods are traded on a global scale but it is difficult for poor countries to compete. Some believe the rules of trade are unfair. Rich countries can raise tariff barriers to stop cheap imports undercutting their own goods. In the past some countries made money by colonizing other countries and using their raw materials to produce manufactured goods. Corruption/poor management - countries need strong, stable and honest leaders to help them develop. War - wars use up resources and make it difficult to produce goods and trade.
Social factors Discrimination - some groups may have fewer opportunities and this can hold back overall development, eg if women are not educated to the same standard as men. Population - overpopulation occurs where population growth outstrips resources. TASK Explain why landlocked Malawi has a stagnant economy. (3)
………………………………………………………………………………………………………………………………………………………………………………………. ………………………………………………………………………………………………………………………………………………………………………………………. ………………………………………………………………………………………………………………………………………………………………………………………. ………………………………………………………………………………………………………………………………………………………………………………………. ……………………………………………………………………………………………………………………………………………………………………………………….

TASK Explain why Zimbabwe has a stagnant economy. (3)
………………………………………………………………………………………………………………………………………………………………………………………. ………………………………………………………………………………………………………………………………………………………………………………………. ………………………………………………………………………………………………………………………………………………………………………………………. ……………………………………………………………………………………………………………………………………………………………………………………….
TASK Explain why a named country ( ________________________ ) economy may be at risk of stagnation due to certain employment laws. (3)
………………………………………………………………………………………………………………………………………………………………………………………. ………………………………………………………………………………………………………………………………………………………………………………………. ………………………………………………………………………………………………………………………………………………………………………………………. ………………………………………………………………………………………………………………………………………………………………………………………. ……………………………………………………………………………………………………………………………………………………………………………………….
Awakening Economies Nigeria is considered the ‘Giant of Africa’ – albeit a sleeping one – for good reason. Yes, it is a top global oil producer, Africa’s largest economy, and its most populous nation. It produces and exports more tomatoes than any other African country. TASK What is an awakening economy? (2)
………………………………………………………………………………………………………………………………………………………………………………………. ………………………………………………………………………………………………………………………………………………………………………………………. ……………………………………………………………………………………………………………………………………………………………………………………….
Advanced Economies Even though many HIC’s have lost lots of jobs and business in the manufacturing (secondary) sector, they still manage to stay ahead in terms of development than their LIC and MIC counterparts. TASK How do they do this? A clue is in the cartoons below and the balance of world trade section underneath:
………………………………………………………………………………………………………………………………………………………………………………………. ………………………………………………………………………………………………………………………………………………………………………………………. ………………………………………………………………………………………………………………………………………………………………………………………. ………………………………………………………………………………………………………………………………………………………………………………………. ……………………………………………………………………………………………………………………………………………………………………………………….

The balance of trade
There is a balance of trade between the
countries of the developed North and the
developing South. However not everyone
agrees that it is particularly fair.
The developing countries of the world tend
to have most of the raw materials that the
developed countries need. However the
developing countries do not have the
technology or finances to process these raw
materials and so sell them to the developed
countries who can process them.
Often the products produced are then sold
back to the developing countries for a far
higher price than the original raw materials
were sold for.
Every country imports and exports. This is
their own trade balance. Developed countries tend to earn more money from their exports than they spend on
imports, meaning they have a trade surplus and will become richer. Many developing countries import more
than they export, meaning they have a trade deficit and so become poorer, and fall greater into debt.
The biggest single problem for developing countries is the debts that they have, especially as there are
interest payments on them. That is why many people have been calling for the debts to be written off to
allow these countries a real chance to spend their money on becoming more developed. The chances of it
occurring appear minimal though because that would mean the developed countries losing their economic
control over the developed countries.
TASK Describe two ways in which the distribution of global development is changing. (4)
………………………………………………………………………………………………………………………………………………………………………………………. ………………………………………………………………………………………………………………………………………………………………………………………. ………………………………………………………………………………………………………………………………………………………………………………………. ………………………………………………………………………………………………………………………………………………………………………………………. ………………………………………………………………………………………………………………………………………………………………………………………. ………………………………………………………………………………………………………………………………………………………………………………………. ……………………………………………………………………………………………………………………………………………………………………………………….

TASK Describe how the global pattern of development is changing. (6)
………………………………………………………………………………………………………………………………………………………………………………………. ………………………………………………………………………………………………………………………………………………………………………………………. ………………………………………………………………………………………………………………………………………………………………………………………. ………………………………………………………………………………………………………………………………………………………………………………………. ………………………………………………………………………………………………………………………………………………………………………………………. ………………………………………………………………………………………………………………………………………………………………………………………. ………………………………………………………………………………………………………………………………………………………………………………………. ………………………………………………………………………………………………………………………………………………………………………………………. ………………………………………………………………………………………………………………………………………………………………………………………. ………………………………………………………………………………………………………………………………………………………………………………………. ………………………………………………………………………………………………………………………………………………………………………………………. ……………………………………………………………………………………………………………………………………………………………………………………….
Consider the global north–south divide in terms of its causes and symptoms.
6. The development gap
1. CASE STUDY: Outline regional disparities within one country (core and periphery, growth versus decline) and explain the causes, consequences and management of these regional disparities. ITALY’S NORTH/SOUTH DIVIDE


Outline the disparity between deprived and affluent urban areas. Discuss why there is a global development gap. (9)

Problems of urbanisation in the inner city - inequalities
Inequalities exist in all urban areas. Inequality means extreme differences between poverty and wealth, as well as in peoples' wellbeing and access to things like jobs, housing and education. Inequalities may occur in:
housing provision
access to services
access to open land
safety and security
Often people who live in inner-city areas experience a poor quality of life. This is because the inner-city is typically a zone with older housing and declining industry. The diagram below compares the quality of life for someone living in an outer London borough with that of someone who lives in an inner London borough.
Graph showing quality of life in Outer London
Graph showing quality of life in Inner London Unemployment and incidents of long-term illness are higher in the inner-city boroughs, while households are more likely to have central heating and multiple cars in the outer-city boroughs.
Governments and planners often step in to help redevelop run-down inner-city areas. Inner-city redevelopments, such as those in London's Docklands or Cardiff Bay in the UK, may improve the physical environment of the area and improve the quality of housing. But it can also create even greater inequalities because the local residents may not be
able to afford to live there anymore. Often the old industrial jobs are replaced by skilled jobs and new people move to the area.
TASK Describe how the quality of life can differ in Inner and Outer London. Suggest reasons for these differences. (6) ………………………………………………………………………………………………………………………………………………………………………………………. ………………………………………………………………………………………………………………………………………………………………………………………. ………………………………………………………………………………………………………………………………………………………………………………………. ………………………………………………………………………………………………………………………………………………………………………………………. ………………………………………………………………………………………………………………………………………………………………………………………. ………………………………………………………………………………………………………………………………………………………………………………………. ………………………………………………………………………………………………………………………………………………………………………………………. ………………………………………………………………………………………………………………………………………………………………………………………. ………………………………………………………………………………………………………………………………………………………………………………………. ………………………………………………………………………………………………………………………………………………………………………………………. ………………………………………………………………………………………………………………………………………………………………………………………. ……………………………………………………………………………………………………………………………………………………………………………………….
TASK What is meant by the term global development gap? (2) ………………………………………………………………………………………………………………………………………………………………………………………. ………………………………………………………………………………………………………………………………………………………………………………………. ………………………………………………………………………………………………………………………………………………………………………………………. ………………………………………………………………………………………………………………………………………………………………………………………. TASK Some experts believe that changes in the pattern of global development are narrowing the development gap. Give two pieces of evidence to support this belief. (4) ………………………………………………………………………………………………………………………………………………………………………………………. ………………………………………………………………………………………………………………………………………………………………………………………. ………………………………………………………………………………………………………………………………………………………………………………………. ………………………………………………………………………………………………………………………………………………………………………………………. ………………………………………………………………………………………………………………………………………………………………………………………. ………………………………………………………………………………………………………………………………………………………………………………………

7. Rapid population growth
Outline trends in global population growth.

Patterns of population growth
Rates of population growth vary across the world. Although the world's total population is rising rapidly, not all countries are experiencing this growth. In the UK, for example, population growth is slowing, while in Germany the population has started to decline. MEDCs have low population growth rates, with low death rates and low birth rates.
Population will decline if death rate is greater than birth rate.
Population will increase if death rate is less than birth rate.
LEDCs have high population growth rates. Both birth rates and death rates in LEDCs tend to be high. However, improving healthcare leads to death rates falling - while birth rates remain high.
The table shows data in selected LEDC and MEDC countries. The figures are per 1,000 of the population per year.
MEDCs
Country Birth rate Death rate Natural increase Population growth rate (%)
UK 11 10 1 0.1
Canada 11 7 4 0.4
Bulgaria 9 14 -5 -0.5
LEDCs
Country Birth rate Death rate Natural increase Population growth rate (%)
South Africa 25 15 10 1
Botswana 31 22 9 0.9
Zimbabwe 29 20 9 0.9
In Bulgaria, the birth rate is 9/1,000 and death rate is 14/1,000. As birth rate is less than the death rate, Bulgaria has a declining population.
In South Africa, the birth rate is 25/1,000 and death rate is 15/1,000. South Africa has an increasing population with a population growth rate of 1 per cent.
TASK Why do birth and death rates vary?
High Birth Rate Low Birth Rate
High Death Rate Low Death Rate
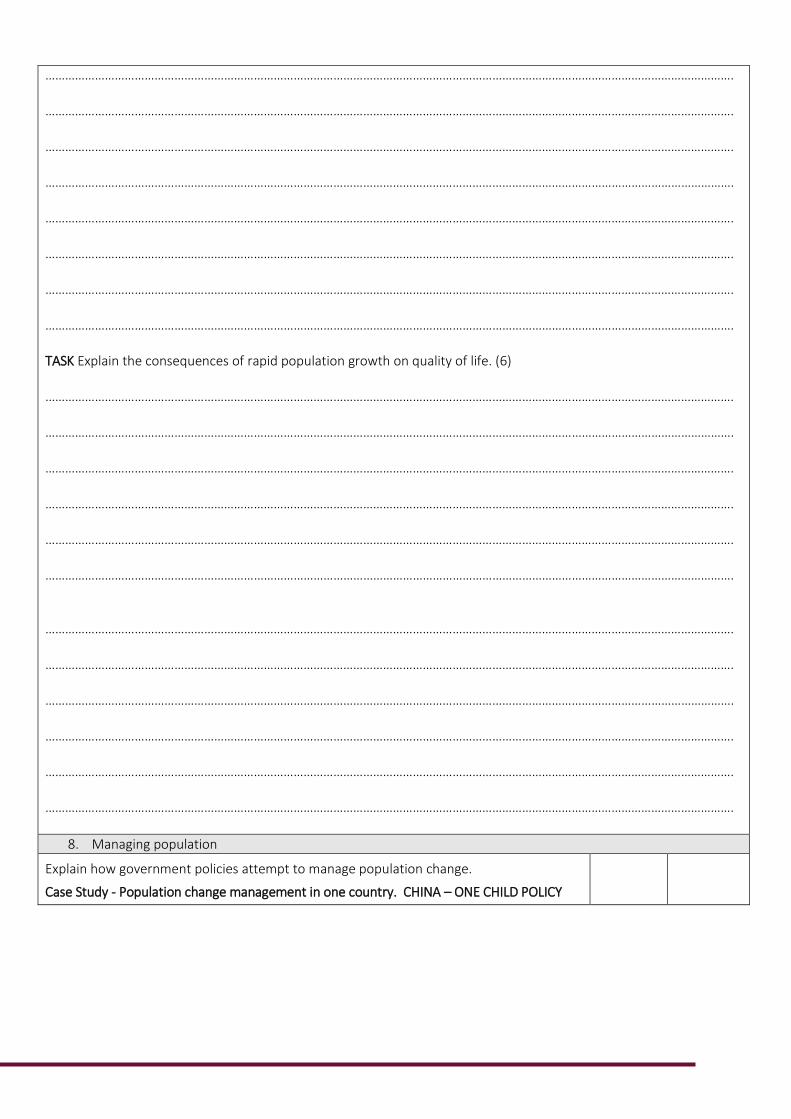
Consider how population growth places pressure on QoL (poverty, unemployment, inadequate housing and physical infrastructure).
TASK Using the diagram and cartoon above, explain how overpopulation puts pressure on Quality of Life. (6) ………………………………………………………………………………………………………………………………………………………………………………………. ………………………………………………………………………………………………………………………………………………………………………………………. ………………………………………………………………………………………………………………………………………………………………………………………. ……………………………………………………………………………………………………………………………………………………………………………………….
………………………………………………………………………………………………………………………………………………………………………………………. ………………………………………………………………………………………………………………………………………………………………………………………. ………………………………………………………………………………………………………………………………………………………………………………………. ………………………………………………………………………………………………………………………………………………………………………………………. ………………………………………………………………………………………………………………………………………………………………………………………. ………………………………………………………………………………………………………………………………………………………………………………………. ………………………………………………………………………………………………………………………………………………………………………………………. ………………………………………………………………………………………………………………………………………………………………………………………. TASK Explain the consequences of rapid population growth on quality of life. (6) ………………………………………………………………………………………………………………………………………………………………………………………. ………………………………………………………………………………………………………………………………………………………………………………………. ………………………………………………………………………………………………………………………………………………………………………………………. ………………………………………………………………………………………………………………………………………………………………………………………. ………………………………………………………………………………………………………………………………………………………………………………………. ………………………………………………………………………………………………………………………………………………………………………………………. ………………………………………………………………………………………………………………………………………………………………………………………. ………………………………………………………………………………………………………………………………………………………………………………………. ………………………………………………………………………………………………………………………………………………………………………………………. ………………………………………………………………………………………………………………………………………………………………………………………. ………………………………………………………………………………………………………………………………………………………………………………………. ……………………………………………………………………………………………………………………………………………………………………………………….
8. Managing population
Explain how government policies attempt to manage population change.
Case Study - Population change management in one country. CHINA – ONE CHILD POLICY

Case study: China
In the late 1970s, the Chinese government introduced a number of measures to reduce the country's birth rate and slow the population growth rate. The most important of the new measures was a one-child policy, which decreed that couples in China could only have one child.
In 1950 the rate of population change in China was 1.9 per cent each year. If this doesn't sound high, consider that a growth rate of only 3 per cent will cause the population of a country to double in less than 24 years!
Previous Chinese governments had encouraged people to have a lot of children to increase the country's workforce. But by the 1970s the government realised that current rates of population growth would soon become unsustainable.
The one-child policy
The one-child policy, established in 1979, meant that each couple was allowed just one child. Benefits included increased access to education for all, plus childcare and healthcare offered to families that followed this rule.
Problems with enforcing the policy: Those who had more than one child didn't receive these benefits and were fined. The policy was keenly resisted in rural areas, where it was traditional to have large families. In urban areas, the policy has been enforced strictly but remote rural areas have been harder to control. Many people claim that some women, who became pregnant after they had already had a child, were forced
to have an abortion and many women were forcibly sterilised. There appears to be evidence to back up these claims.
Impact of the policy
The birth rate in China has fallen since 1979, and the rate of population growth is now 0.7 per cent.
There have been negative impacts too - due to a traditional preference for boys, large numbers of female babies have ended up homeless or in orphanages, and in some cases killed. In 2000, it was reported that 90 per cent of foetuses aborted in China were female.
As a result, the gender balance of the Chinese population has become distorted. Today it is thought that men outnumber women by more than 60 million.
Long-term implications
China's one-child policy has been somewhat relaxed in recent years. Couples can now apply to have a second child if their first child is a girl, or if both parents are themselves only-children.
While China's population is now rising more slowly, it still has a very large total population (1.3 billion in 2008) and China faces new problems, including:
the falling birth rate - leading to a rise in the relative number of elderly people
fewer people of working age to support the growing number of elderly dependants - in the future China could have an ageing population

TASK Explain why some countries are attempting to reduce their population. (6) ………………………………………………………………………………………………………………………………………………………………………………………. ………………………………………………………………………………………………………………………………………………………………………………………. ………………………………………………………………………………………………………………………………………………………………………………………. ………………………………………………………………………………………………………………………………………………………………………………………. ………………………………………………………………………………………………………………………………………………………………………………………. ………………………………………………………………………………………………………………………………………………………………………………………. ………………………………………………………………………………………………………………………………………………………………………………………. ………………………………………………………………………………………………………………………………………………………………………………………. ………………………………………………………………………………………………………………………………………………………………………………………. ………………………………………………………………………………………………………………………………………………………………………………………. ………………………………………………………………………………………………………………………………………………………………………………………. ……………………………………………………………………………………………………………………………………………………………………………………….

9. Managing disparities
Outline ways in which development and quality of life disparities are managed (appropriate aid, intermediate technology, fair and free trade, debt relief).
Types of aid
Aid is help given, often from one country to another.
There are however many different types of aid:
Bilateral aid - from one country to another. There can be strings attached, which is then known as conditional or tied aid – when one country donates money or resources to another (bilateral aid) but with conditions attached which will often be in the MEDCs favour, e.g the aid has to be used for buying goods from the donor country.
Multilateral aid - from international organisations which receive money from several countries e.g. United Nations, the World Bank
Emergency or short-term aid – food or medical help to give short term relief. Needed after a disaster such as the 2000 Mozambique floods or the 2004 Asian tsunami.
Voluntary and Charitable aid – funded by donations from the public through organisations such as OXFAM.
3. Case Study - one UN Aid Agency project in an LIC.

Debt abolition (also known as Debt Relief)
Debt abolition is when some or all of a countries debt is cancelled. The money can then be used to develop. Organizations like ‘Drop the Debt’ try to encourage developed countries to help developing countries by cancelling debt.
For example, in 2005, Zambia had $4 million of debt cancelled. In 2006, the country had enough money to start a free healthcare scheme for millions of people in rural areas. This improved quality of life. The World Bank decided to help countries by cancelling their debts, provided that they spend their money on welfare programmes – housing, education and healthcare for the poor. This is also known as debt relief.
STATES CLEARED OF DEBT BY IMF Benin, Bolivia, Burkina Faso, Cambodia, Ethiopia, Ghana, Guyana, Honduras, Madagascar, Mali, Mozambique, Nicaragua, Niger, Rwanda, Senegal, Tajikistan, Tanzania, Uganda and Zambia
Who are the IMF?
The International Monetary Fund (IMF) is an organization of 189 countries, working to foster global monetary cooperation, secure financial stability, facilitate international trade, promote high employment and sustainable economic growth, and reduce poverty around the world.
TASK How have the countries, who have been cleared of debt, benefitted from the debt abolition by the International Monetary Fund? (IMF) (4) ………………………………………………………………………………………………………………………………………………………………………………………. ………………………………………………………………………………………………………………………………………………………………………………………. ………………………………………………………………………………………………………………………………………………………………………………………. ………………………………………………………………………………………………………………………………………………………………………………………. ………………………………………………………………………………………………………………………………………………………………………………………. ………………………………………………………………………………………………………………………………………………………………………………………. ………………………………………………………………………………………………………………………………………………………………………………………. TASK How does debt relief work? (2) ………………………………………………………………………………………………………………………………………………………………………………………. ………………………………………………………………………………………………………………………………………………………………………………………. ………………………………………………………………………………………………………………………………………………………………………………………. ………………………………………………………………………………………………………………………………………………………………………………………. ……………………………………………………………………………………………………………………………………………………………………………………….
4. Case Study - one NGO project in an LIC.

Case study: Practical Action shelter project – in Kenya
Practical Action, founded in 1966, is an international non-governmental organisation (NGO) which specializes in helping people to use technology to eliminate poverty. PA believes in Technology Justice to create a sustainable world free of poverty and injustice with technology used for the benefit of all.
Today a fifth of the world's population are either homeless or live in poor housing, mainly in LEDCs.
Homeless people in LEDCs often build makeshift shelters in shanty towns on poor land such as steep slopes and marshland, which is vulnerable to floods and landslides.
Practical Action has been working on ways to assist communities to solve these problems by using their own labour, local resources, and traditional techniques.
There has been success in Kenya in changing government policy to allow building regulations and standards more appropriate to low income people.
Improving the homes is just one part of Practical Action's aims in their 'Shelter' project. Once the houses have been improved this leads to other developments in basic services and infrastructure. As the local people have been involved from the outset they can apply their skills in continuing to improve their surroundings and they are given a sense of ownership and responsibility.
Practical Action also has shelter programmes in other countries such as Zimbabwe and Peru.
Their work is an example of sustainable development.
Initiated in response to the changing livelihood needs of the nomadic Maasai population, this project provides technical skills and advice on appropriate technologies and durable building materials to pastoral communities in Kenya that are increasingly opting for permanent accommodation. The project seeks to build the capacity of women groups, artisans and local institutions to design, plan and manage their shelter improvements as well as establishing viable income generating enterprises through the identification of business opportunities, skills development and linkages to credit. To date over 300 individual houses have been improved incorporating water and sanitation facilities, as well as reducing indoor air pollution, 53 project leaders have been trained in building and construction and 400 women are involved in micro-enterprise activities. Intermediate technology, simple and practical tools, basic machines, and engineering systems that economically disadvantaged farmers and other rural people can purchase or construct from resources that are available locally to improve their well-being. Designed to focus on people rather than machines, intermediate technology is considered to be more harmonious with the environment and with traditional ways of life.

In Peru, Zimbabwe, Sri Lanka and Kenya, Practical Action has worked to establish micro-hydro power by harnessing energy from falling water. While modern hydro-electrical power requires complex, costly equipment such as dams and storage facilities, micro-hydro projects channel water from streams and rivers into valleys and drop it onto a turbine via pipeline called a penstock; the water turns the turbine which drives a generator providing electricity to the local
community.
This low-cost alternative also has the benefit of being environmentally sustainable as the lack of dams and reservoirs avoids the potential for flooding and dispenses with the need for fossil fuels that power stations require.
What makes this appropriate technology even more practical is its capacity to supply charge to portable batteries. In turn, batteries can be conveniently supplied to villages to power domestic lighting and workshop machines, providing cheap, clean, renewable energy.
TASK What is meant by the term intermediate technology? (2) ………………………………………………………………………………………………………………………………………………………………………………………. ………………………………………………………………………………………………………………………………………………………………………………………. ………………………………………………………………………………………………………………………………………………………………………………………. ………………………………………………………………………………………………………………………………………………………………………………………. ………………………………………………………………………………………………………………………………………………………………………………………. TASK Describe how the use of intermediate technology is encouraging development in LICs. (4) ………………………………………………………………………………………………………………………………………………………………………………………. ………………………………………………………………………………………………………………………………………………………………………………………. ………………………………………………………………………………………………………………………………………………………………………………………. ………………………………………………………………………………………………………………………………………………………………………………………. ………………………………………………………………………………………………………………………………………………………………………………………. ………………………………………………………………………………………………………………………………………………………………………………………. ……………………………………………………………………………………………………………………………………………………………………………………….

Now that you’ve reviewed the whole topic, answer the following questions: TASK Suggest why MICs, such as China and India, may take some time to reach the level of economic development of HICs. (4) ………………………………………………………………………………………………………………………………………………………………………………………. ………………………………………………………………………………………………………………………………………………………………………………………. ………………………………………………………………………………………………………………………………………………………………………………………. ………………………………………………………………………………………………………………………………………………………………………………………. ………………………………………………………………………………………………………………………………………………………………………………………. ………………………………………………………………………………………………………………………………………………………………………………………. ………………………………………………………………………………………………………………………………………………………………………………………. ………………………………………………………………………………………………………………………………………………………………………………………. TASK Explain how disparities in development and quality of life are being reduced. (9) ………………………………………………………………………………………………………………………………………………………………………………………. ………………………………………………………………………………………………………………………………………………………………………………………. ………………………………………………………………………………………………………………………………………………………………………………………. ………………………………………………………………………………………………………………………………………………………………………………………. ……………………………………………………………………………………………………………………………………………………………………………………….
………………………………………………………………………………………………………………………………………………………………………………………. ………………………………………………………………………………………………………………………………………………………………………………………. ………………………………………………………………………………………………………………………………………………………………………………………. ………………………………………………………………………………………………………………………………………………………………………………………. ……………………………………………………………………………………………………………………………………………………………………………………….
………………………………………………………………………………………………………………………………………………………………………………………. ………………………………………………………………………………………………………………………………………………………………………………………. ………………………………………………………………………………………………………………………………………………………………………………………. ………………………………………………………………………………………………………………………………………………………………………………………. ……………………………………………………………………………………………………………………………………………………………………………………….