Embed Size (px)
Citation preview

Combust Sci andTech ,176: 1577-1591.2004 Copyr~ght $>Taylor & Franc~s Inc ISSN: 0010-2203 printl1563-521X online DOl: 10 1080/00102200490474278
Taylor &Francis * Taylor &Francis Group 0
IGNITION BEHAVIOR OF LIVE CALIFORNIA CHAPARRAL LEAVES
J. D. ENGSTROM, J. K. BUTLER, S. G. SMITH, L. L. BAXTER, AND T. H. FLETCHER*
Department of Chemical Engineering, BrighamYoung University, Provo, Utah
USDA Forest Service, Pacific Southwest Research Station, Forest Fire Laboratory, Riverside, California
Current forest fire models are largely empirical correlations based on data from beds of dead vegetation Improvement in model capabilities is sought by developing models of the combustion of live fuels. A facility was developed to determine the combustion behavior of small samples of live fuels, consisting of a flat-flame burner on a moveable platform Qualitative and quantitative combustion data are presented for representative samples of California cha- parral: manzanita (Arctostaphylos purryuna); oak (Qurrcus herheridifblia);
ceanothus (Ceanothus crus.sifolius), and chamise (Adenostoma fusciculatum)
Times to ignition were significantly influenced by shape effects. whereas ignition temperature was more dependent on chemical composition
Keywords: wildland fires, ignition
Received 15 October 2003; accepted 17 March 2004 This research was funded by the USDA/USDI National Fire Plan administered
through a Research Joint Venture Agreement (No. 01-CR-11272166-168) with the Forest Fire Laboratory, Pacific Southwest Research Station, USDA Forest Service, Riverside, CA. Special thanks go to Brett Butler at the Fire Sciences Laboratory, Rocky Mountain Research Station, USDA Forest Service. Missoula, MT, for advice and insight in developing this experiment Thanks also to Joey Chong from the Forest Fire Laboratory, who helped with the infrared camera images.
*Address correspondence to tom-fletcher(a> IJyu.edu

J. D. ENGSTROM ET AL.
INTRODUCTION
Current wildland fire models in the United States are based on the extensive empirical correlations developed by Rothermel (1972), Van Wagner (1 973), Albini (1 976), Byram (1 959), Fosberg and Deeming (1971), and others. The operational models currently used by fire managers are FARSITE (Finney, 1998) and BEHAVE (Andrews, 1986), which use the empirical correlations to account for effects of fuel quantity and type, wind, and slope. These models have proven to be accurate for prediction of surface fire spread rates in forests and range- lands under many conditions from which the empirical correlations were developed. Fire spread rates and intensity in live vegetation are also predicted by these models, but with less accuracy. Combustion data for live vegetation must be obtained to improve current forest fire models, especially when trying to predict when fires move from the ground to the tree crowns and for predicting flare-ups.
The combustion behaviors of 20 live and dead fuels were investigated by Susott (1982a) using thermal gravimetric analysis (TGA) of shredded samples. Very little difference was observed in the pyrolysis behavior of leaves of different species, although differences were observed between classes of vegetation, such as between leaves and bark. The differences in pyrolysis behavior observed in the TGA between the different shredded live fuel samples do not explain observed variations in combustion behavior such as flame height and brands. Brands are burning pieces of fuel that are separated from the rest of a burning fuel body and lofted away. These burning pieces of fuel have the potential to start fires in new loca- tions, also called spotting (Tarifa et al., 1965; Woycheese, 2000). The brand generation behavior is of great interest to the wildland fire community.
The lack of variation in the pyrolysis behavior of the live vegetation samples studied by Susott seems to indicate that combustion behavior of live vegetation is limited by the effects of heat and mass transfer. Therefore, to understand the differences in live fuel combustion behavior, an apparatus was developed to study the combustion behavior of whole leaf samples. This paper describes the characterization of this apparatus and the first data on combustion behaviors of live vegetation.
EXPERIMENT DESCRIPTION
Samples of California chaparral were cut and sent by express mail to Utah. Four species were examined, namely, manzanita (Arctostaphplos

IGNITION BEHAVIOR OF LEAVES
Figure 1. Representative photos of California chaparral samples: ( u ) ~nanzanita, (b) oak, (c) ceanothus, (4 chamise. All leaf samples are approximately 4 6 c m in length.
parryana), oak (Quercus berberidifolia), ceanothus (Ceanothus crassifo- lius), and chamise (Adenostoma ,fasciculatum) (see Figure 1). Samples were stored in sealed plastic bags until the experiments were performed. Most of the data presented in this paper were collected from samples that had been sitting in the lab for one to two weeks, and hence had moisture contents (wet mass divided by dry mass) of less than 10%. The effects of moisture content are currently being explored.
The experimental apparatus was designed to closely resemble the conditions of a forest fire flame front. Two modes of heat transfer are involved in fire spread, namely radiation and convection. Heat energy from radiation initially preheats the fuel while heat from convection brings the fuel to the ignition temperature. Temperatures in wildland fires are thought to be about 1200 K, with heating rates of approximately 100 K/s (B. Butler, personal communication, 2002).
To simulate this condition the fuel sample was attached to a stationary horizontal rod connected to a cantilever-type mass balance (Mettler- ole do'). A flat-flame burner (FFB) was positioned on a moveable
' ~ r a d e names are presented for information purposes only and do not constitute endorsement by the U.S. Department of Agriculture
J. D. ENGSTROM ET AL.
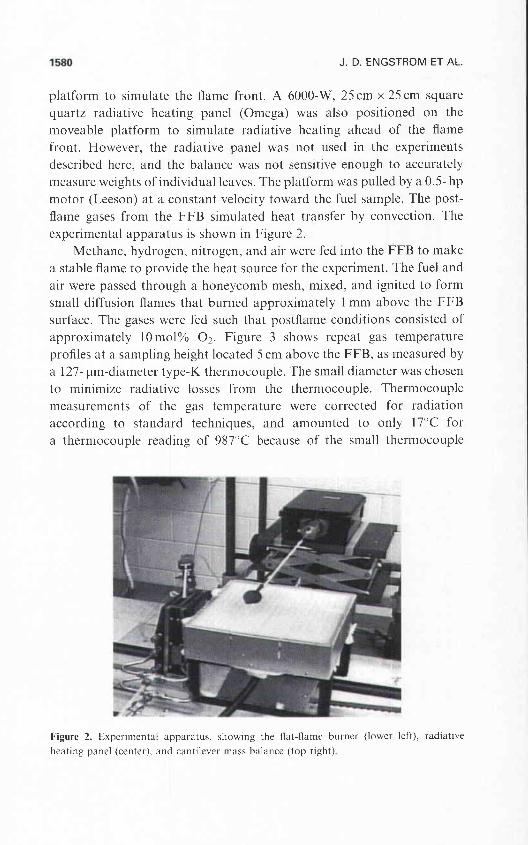
platform to simulate the flame front. A 6000-W, 25cm x 25 cm square quartz radiative heating panel (Omega) was also positioned on the moveable platform to simulate radiative heating ahead of the flame front. However, the radiative panel was not used in the experiments described here, and the balance was not sensitive enough to accurately measure weights of individual leaves. The platform was pulled by a 0.5- hp motor (Leeson) at a constant velocity toward the fuel sample. The post- flame gases from the FFB simulated heat transfer by convection. The experimental apparatus is shown in Figure 2.
Methane, hydrogen. nitrogen, and air were fed into the FFB to make a stable flame to provide the heat source for the experiment. The fuel and air were passed through a honeycomb mesh, mixed, and ignited to form small diffusion flames that burned approximately 1 mm above the FFB surface. The gases were fed such that postflame conditions consisted of approximately IOmol% 02. Figure 3 shows repeat gas temperature profiles at a sampling height located 5 cm above the FFB, as measured by a 127- pm-diameter type-K thermocouple. The small diameter was chosen to minimize radiative losses from the thermocouple. Thermocouple measurements of the gas temperature were corrected for radiation according to standard techniques, and amounted to only 17°C for a thermocouple reading of 987°C because of the small thermocouple
Figure 2. Experimental apparatus, showing the fat-flame burner (lower left), radiative
heating panel (center), and cantilever mass balance (top right).

IGNITION BEHAVIOR OF LEAVES
Time (s)
Figure 3. Time-dependent gas temperature measurements with the thermocouple held 5 cm above the flat-flame burner surface. Thermocouple measurements are corrected for radiation losses.
bead. The repeat experiments were performed by bringing the flame toward the stationary thermocouple at the same speed. For the 10 repeat experiments, the average gas temperature after the initial heating region was 1004"C, with a standard deviation of 11.9"C.
The optimal location for sample placement was determined using an IR camera (FLIR Thermacam SC 500), operating in the wavelength range between 7.5 and 13 pm. The IR camera showed the thermal char- acteristics of the postflame gases from the FFB (C02 and H20) rather than the flaming combustion (i.e., soot) of the burning manzanita leaf. The temperature profile of the postflame gases above the FFB is shown in Figure 4a. The edges of the horizontal manzanita leaf appear brighter than the sur~ounding flame due to the low emissivity of the combustion gases. A sharp interface can be seen in Figure 4a between the hot post- flame gases from the FFB and the surrounding air at room temperature. The sharp temperature interface of the FFB postflame gases explains the sharp rise in the thermocouple temperature profiles of Figure 3. The thermocouple temperature does not rise until the FFB is directly under the thermocouple. In a similar manner, samples of vegetation are not preheated by the FFB until the FFB is directly under the sample. A sample height of 5 cm was chosen in these experiments so that the sample was well within the hot zone of the postflame gases.

J. D. ENGSTROM ET AL.
Figure 4. Photos of burning leaves in the FFB: (a ) infrared image of a horizontal manzanita leaf, (b) vertical manzanita sample, (c) horizontal square manzanita sample, (d) horizontal round manzanita sample, (e) vertical chamise sample, Cf) infrared 1R image of vertical chamise (bright yellow) with a burning brand (circled) (See Color Plate 1 at the end of this issue).

IGNITION BEHAVIOR OF LEAVES 1583
Leaf surface temperature data were obtained at 60 Hz using 127-pm- diameter type-K thermocouples (Omega). The thermocouple was embedded in a pinhole in the leaf edge near the ignition point for the broadleaf samples. It was not possible to obtain thermocouple data for the needle-like leaf samples, due to problems with attaching the ther- mocouples. The thermocouple signal was fed into a PC1 4551 (NI) data acquisition (DAQ) card, yielding temperature data at 60 Hz. Video data were obtained at 30 frames per second (fps) using a PC1 141 1 (NI) DAQ card and a Hi-8 camcorder (Minolta 8-918). Video, mass loss, and temperature data were collected using a program written in LabVIEW 6.0 (National Instruments). All of the mass, video, and temperature data were time stamped for quick and accurate comparison.
SPECIFIC OBJECTIVES
The objective of this project was to determine both qualitative and quantitative differences in combustion behavior of freshly cut leaf sam- ples from the California chaparral, namely, nianzanita oak, ceanothus, and chamise. The qualitative behavior of the burning leaves was observed using the video camera. Differences in combustion behavior were noted with different sample types and by changing the sample type, shape, and orientation above the flame. Temperature and video data were gathered and compared to quantitatively determine the ignition temperature and time to ignition for the broadleaf samples (manzanita, oak, and ceanothus). It was not possible to obtain temperature data for the chamise samples.
RESULTS AND DISCUSSION
Qualitative Experiments
Combustion experiments on all four leaf samples were performed in the FFB to determine ignition location as well as shape and orientation effects. Data were recorded with the video camera. The chamise samples were separated from the broad leaf samples when studying effects of shape and orientation.
The first observation was the effect of leaf orientation on combustion behavior; broad leaves held horizontally exhibited quite different com- bustion behavior than broad leaves held vertically. When the leaves were oriented vertically above the FFB, the leaves ignited at the edge closest to

1584 J. D. ENGSTROM ET AL.
the flame, and propagated to the top edge of the leaf regardless of shape differences (Figure 4h). Horizontally held leaves ignited almost uniformly around the leaf perimeter. In the horizontal configuration, bubbles were observed on the leaf surface prior to ignition, indicating either moisture evaporation or degradation of the waxy layer on the surface of the leaves.
To make the leaf shapes more uniform, the broad leaf samples (manzanita, oak, and ceanothus) were cut into both square and rounded shapes. The square-shaped samples oriented horizontally above the FFB ignited first at the corners, and the flame then propagated along the edges before burning to the center (see Figure 4c). The round-shaped samples ignited along the entire edge at the same time, followed by flame pro- pagation toward the center (see Figure 4 4 . Frame-by-frame analysis of the video data showed that ignition first occurred in the air above the leaf for the round samples (see Figure 4 4 , followed by flame propa- gation to the leaf surface at the edges. This process was discovered after viewing the video data image by image.
These qualitative experiments on the broad leaf samples identified the approximate ignition location, which was where the thermocouples were placed in subsequent quantitative experiments (described below) to measure ignition temperatures and ignition delay times.
As shown in Figure 1, chamise consists of both the small green needles and the stem, both of which contribute to combustion. When the chamise was burned by the FFB, the needles on the stem would ignite first at the tips, as shown in Figure 4e. The first needles to ignite in the vertical position were the ones closest to the FFB. Once the bottom needles ignited, the flames would propagate to the top needles. It was observed that after flaming combustion had neared completion for the needles, the stem would begin flaming combustion. When the chamise was burned in the horizontal position above the FFB, the needles ignited first along the entire sample, followed by the ignition of the stem. Flame propagation from the bottom needles to the top needles was not observed in the horizontal configuration, which was different from the behavior observed in the vertical configuration.
As the chamise burned, occasionally a brand would be lofted off the main stem and float away from the FFB (Figure 4j). The image in Figure 4J'was taken with the IR camera with the brand circled. Brands have the potential of landing in a spot beyond the main fire and starting a new fire. Out of the fuels studied in this report, chamise was the only one that generated brands.
IGNITION BEHAVIOR OF LEAVES 1585
Since the chamise needles were small and the stem was thin, it was not possible to place a thermocouple with a bead as large as 127 pm through a pinhole in this sample. Therefore, only these qualitative observations were made with chamise.
Quantitative Experiments
Quantitative data (i.e., ignition temperature and time to ignition) were gathered for manzanita, scrub oak, and hoaryleaf ceanothus. Measure- ments were also performed on paper samples that were cut to a uniform size and shape to validate the repeatability of the experiment. For this experiment, ignition temperature was defined as the temperature when a flame was first visible. The thermocouple was placed at the point where ignition would first occur. The video data and thermocouple data were recorded simultaneously and had a synchronous time stamp attached to each video frame and thermocouple reading. The ignition temperature was determined for each sample by matching (a) the time stamp of the video frame showing the first visible flame to (b) the temperature time stamp. The data for each type of leaf was plotted on a histogram to compare ignition temperatures (Figure 5). The average ignition temperatures for the samples range between 300 and 350°C (see Table 1). It is important to note that the range in Table 1 is plus or minus two standard deviations. The minimum observed ignition temperature was 197°C.
The ignition times were also determined from each of the samples. The ignition time was based on the amount of time it took for the sample to ignite once the sample was above the FFB. The start time was defined as the time when the temperature reached 30°C. The ignition time was calculated by subtracting the time stamp of the thermocouple reading at 30°C from the time stamp of the thermocouple reading at the point of ignition.
The time-to-ignition data for manzanita, scrub oak, and hoaryleaf ceanothus were scattered over a wide range, as shown in Figure 6. However, the data for the paper samples showed substantially less scatter than the leaf data. This can be explained through sample uniformity effects. Because whole leaf samples of manzanita, scrub oak, and hoary- leaf ceanothus were burned in the experiment, many factors such as shape, thickness, moisture content, weight, and orientation varied within each sample type. The whole leaf samples were burned in both the

J. D. ENGSTROM ET AL.
A. Manzanita B. Oak
E 1
" O O o g X g g ~ 0 0 0 0 0 0 0
" Z Z o , * o q Temperature (OC) Temperature (OC)
Temperature ('C)
D. Paper
2 4
1 2 E 1
0 0 0 0 0 0 0 0 ~
. . R a s x s s % q Temperaturm ('C)
Figure 5. Ignition temperature histograms: ( t r ) manzanita, (h ) oak. ( c ) ceanothus, (4 paper.
All of these data are from horizontally or~ented samples.
Table 1. Ignition temperature statistics
Manzanita
Oak
Ceanothus Paper
Nnte. Thew ~ z m n l ~ c hsll m n i ~ t ~ l r e rnntent~ /~xzet lcivx, h l ~ i ~ ) nf li-cc thnn In"k 2nd were all
~ b l a m e d in the horizo~ltal leaf configuration
horizontal and vertical orientations, were left in their original state, and had variable moisture contents. The paper samples were all burned in the horizontal position and had the same shape, thickness, size, and moisture content. These factors help explain the wide variation in the time to ignition between the whole leaf samples and the paper samples. For example, one set of experiments performed with manzanita oriented horizontally showed that thicker samples had a slightly slower heatup rate (Figure 7), which indicates slower time to ignition. The time to ignition for paper had a relatively small variation due to the uniformity of paper samples, showing the repeatability of the experiment. Future

IGNITION BEHAVIOR OF LEAVES
Time (sec)
Time (sec)
D. Paper 12 3 I
'~~ Tome (sec) o o
Figure 6. Histograms of measured time lo ~gnltion: ( t r ) ~linnranlta. (h) oak. (c , ) ceanothus. ((0 paper. All of thcse data are from horizontally oriented snmplcs.
research will include careful correlation of [he data to account for thickness and moisture, and will be coupled with modeling efforts.
It is interesting that the shape of the histograms of the temperature at ignition were roughly bell-shaped, whereas no shape was readily apparent for the time-to-ignition data. The paper samples had a relatively small variation in time to ignition compared to the manzanita, scrub oak, and
Time (s)
Figure 7. Temperature profiles for horizon~allq oriented manzc.lnlta of varqlng thickness.

J. D. ENGSTROM ET AL.
hoaryleaf ceanothus samples. Regardless of this difference, the paper ignition temperature data still formed a bell-shaped curve. These data suggest that ignition temperature is more a function of chemical com- position, rather than sample conditions such as thickness, moisture content, and shape. In contrast, heat and mass transfer effects due to moisture content, nonuniform sample size, thickness, and shape play an important role in sample heatup time.
The temperature histories shown in Figure 7 were analyzed to estimate the maximum convective heat flux experienced by the leaf, which occurs early in the heatup region. Ignition temperatures for wood samples have been measured as functions of incident radiative heat flux and moisture content (Babrauskas, 2003; Moghtaderi et al., 1997); hence an estimate of the heat flux in this experiment is useful for com- parative purposes. The heat flux estimation was made using the lump- sum heat capacity form of the energy equation for the leaf:
where m is the mass of the leaf (kg), C,, is the leaf heat capacity (kJ/kg/"C), T is the average leaf temperature PC), t is the time (s), h is the convective heat transfer coefficient (w/m2/"c) , and T, is the gas temperature PC). Equation (1) can be reduced to
where ql' is the convective heat flux to the leaf (w/m2), p is the leaf density, and Ax is the leaf thickness. Manzanita leaf densities were measured to be approximately 800 kg/m3, and the leaf heat capacity was estimated from the values for wood (Dunlap, 1912; Susott, 1982b):
where T is in "C. This heat capacity correlation is thought to be valid for temperatures below 150 to 200°C, or until the region where the heat of moisture evaporation must be considered. The data shown in Figure 7 contain T, t , and Ax, and hence an estimate for q" can be obtained by differentiation of the measured temperature histories. A typical flux

IGNITION BEHAVIOR OF LEAVES
0 5 10 15
Time (s)
Figure 8. Estimated convective heat flux for a 72-mm manzanita leaf in the horizontal position.
history estimated from this technique is presented in Figure 8 for times less than 20 s. Moisture evaporation begins soon after the maximum flux, complicating the analysis. However, using this technique, it is estimated from the data in Figure 7 that the leaves in this system experience an average maximum heat flux of 100 kw/m2, a value that can be used for comparison with other studies.
CONCLUSIONS AND RECOMMENDATIONS
An experiment was developed to study the combustion behavior of live fuels, focusing on size and shape factors of leaves. Gas temperatures in the experiment were measured to be 1004°C at the selected conditions, and were shown to be repeatable to * 20°C. Qualitative experiments with the broadleaf samples have shown that combustion behavior varies with shape and orientation. Vertically oriented samples ignited first at the bottom edge, whereas horizontal samples ignited first in the gas phase slightly above the leading edge of the leaf, followed by surface ignition at the leaf edge. Small bubbles were observed in the central part of horizontally oriented broad leaf samples prior to ignition. Flame propagation through the chamise needles was observed in the vertical orientation, but not the horizontal orientation. Small brands of chamise were observed to detach and be carried away by gas currents during the late stages of burning.

J. D. ENGSTROM ET AL.
Quantitative measurements of ignition temperature and time to ignition were made for the broadleaf samples, as well as for samples of paper. The average ignition temperature for the broadleaf samples was approximately 325"C, allhough thc average standard deviation was 65°C. The ignition temperature did not appear to be a significant function of size and shape factors for each sample type. However, the time to ignition was significantly affected by the size, shape, and orientation of the sample. The average time to ignition for the broadleaf samples ranged from I to 4s . The experiments performed on uniform paper samples showed much less variation in the time lo ignition than did the broadleaf experiments. Initial correlation of time to ignition as a function of leaf thickness showed promise.
The prelimiilary experiments mentioned in this paper have demon- strated the technique of gathering interesting and useful quantitative data. Experiments performed in the future will focus on improving the technique to more accurately determine ignition temperature and time to ignition for each sample type. Also, the experiment will include a means for measuring the amount of energy needed to bring a sample to ignition through the use of a thermopile. Improvements will include (a) obtaining fresh samples, (b) burning samples within one day of their arrival, (c) carefully monitor- ing thickness and weight data, (d) using the radiative heating panel to approximate preheating effects, and (e) varying the sample moisture content. It is anticipated that these types of data will help provide a basis for improving combustion physics used in forest fire models.
REFERENCES
Albini, F.A. (1976) E,stirnutirl,y Wildfirr Bchal~ior rirzrl Efj'2,c.t~ USDA Forest Service General Technical Report 1NT-30
Andrews. P.L. (1986) B E H A V E Fi1.c Bcl~ul~ior PI-crlicfiori (rzd Fuel Morlclling Sj,ster~z-BURN Suh.s~stcni. PUI-t I USDA Forest Service General Technical Report 1NT- 194.
Babrauskas. V (2003) Co111171ori .so/id,s. I,?rzifior? Handl~ooli. Fire Science Publishers. Issaquah. WA, Chap. 7.
Byram, G.M. (1959) Combustion of Corest f ~ ~ c l s In Davis. K.P. (Ed.) Forest Firel. Co~qfrol arid Uke, McGraw-Hill. New York, Chap. 3.
Dunlap, F. (19 12) Tl7c Sl~ec,ific, Hc,ur of Woo(i. USDA Forest Serv Forest Products Lab Bull, vol 110, 28 p., Madison. WI
Finney, M.A. (March 1998) FA R S I T E Fire, Arclu Simulr~tor-Mou'c.1 De~~eloj~~?zerzt atzd Ei~aluutiorz. USDA Forest Service Research paper RMRS-RP-4.

IGNITION BEHAVIOR OF LEAVES 1591
Fosberg, M. and Deeming, J.E. (1971) Derivation of the 1- and 10-hour Timelag Fuel Moisture Culc,~llations for Fire-Danger Rating. USDA Forest Service Note RM-207, Rocky Mountain Forest and Range Experiment Station, Fort Collins, CO.
Moghtaderi, B., Novozhilov, V., Fletcher, D.F., and Kent, J.H. (1997) A new correlation for bench-scale piloted ignition data of wood. Fire Safety J., 29, 41-59.
Rothermel, R.C. (January 1972) A Matlzemuticul Morlel for Predicting Fire Spread in Wildland Fuels. USDA Forest Service Research paper INT-115.
Susott, R.A. (1982a) Characterization of the thermal properties of forest fuels by combustible gas analysis. Forest Sci., 28, 404-420.
Susott, R.A. (1982b) Differential scanning calorimetry of forest fuels Forest Sci., 28, 839-851.
Tarifa, C.S., Del Notario, P., and Moreno, F.G. (1965) On the Flight Paths and Lifetimes of Burning Particles of Wood, Proc. Combust. Instit. 10, 1021-1037.
Van Wagner, C.E. (1973) Height of crown scorch in forest fires. Can. J. Forest Res., 3, 373-378.
Woycheese, J.P. (2000) Brand Lofting and Propagation from Large-Scale Fires. Ph.D. Dissertation, Mechanical Engineering Department, University of California, Berkeley, CA.

Color Plate 1. Photos of burning leaves in the FFB: (u) infrared image of a horizontal man- zanita leaf, (h) vertical manzanita sample, (c ) horizontal square manzanita sample, (d) hori- zontal round manzanita sample, (e) vertical chamise sample, V) infrared IR image of vertical chamise (bright yellow) with a burning brand (circled). (See Figure 4, p. 1582).