Embed Size (px)
Citation preview

IHS ECONOMICS AND COUNTRY RISK
The effects of North Dakota oil production on the Minnesota economy
April 2015 ihs.com
Brendan O’Neil Managing Director, ECR Consulting
Phil Hopkins Director, ECR Consulting
Kevin Lindemer Managing Director, Downstream Consulting
Ryland Maltsbarger Director, Economist, IHS Agriculture
Bob Brodesky Director, ECR Consulting
Elizabeth Redman Senior Consultant, ECR Consulting
Julie Gressley Research Economist, ECR Consulting
Aleksandra Maguire Industry Consultant, ECR Consulting

IHS Economics and Country Risk | The effects of North Dakota oil production on the Minnesota economy
© 2015 IHS 2 April 2015
IHS ECONOMICS AND COUNTRY RISK
© 2015 IHS. No portion of this report may be reproduced, reused, or otherwise distributed in any form without prior written consent, with the exception of any internal client distribution as may be permitted in the license agreement between client and IHS. Content reproduced or redistributed with IHS permission must display IHS legal notices and attributions of authorship. The information contained herein is from sources considered reliable but its accuracy and completeness are not warranted, nor are the opinions and analyses which are based upon it, and to the extent permitted by law, IHS shall not be liable for any errors or omissions or any loss, damage or expense incurred by reliance on information or any statement contained herein. For more information, please contact IHS at www.ihs.com/CustomerCare.

IHS Economics and Country Risk | The effects of North Dakota oil production on the Minnesota economy
© 2015 IHS 3 April 2015
Table of Contents
Executive summary 5
Background 5
Phase 1: energy production forecast 5
Phase 2: transportation impacts 6
Phase 3: economic impacts 6
Phase 4: SCOPE analysis 8
Introduction 10
Background 10
Organization 10
Phase 1: Energy Production Forecast 12
International context 13
Forecasts of non-OPEC liquids supply and the need for OPEC oil 14
Global breakeven costs 15
US context 16
US net imports 17
Regional context 17
Historical liquids supply-and-demand balance 18
Bakken shale formation 19
Bakken potential pipeline capacity and rail requirements 21
Frac sand 22
2014 Bakken breakeven cost and volume of production 23
Direct spending effects 24
Major findings 26
Policy considerations 27
Phase 2: Transportation impacts 29
Mode share distributions for all commodities 30
Commodity flows by rail and truck 31
Minnesota freight overview 33
Transportation summary 45
Phase 3: Economic impacts 48
Economic structure and performance 49
Comparative socioeconomic characteristics 53
Labor market characteristics 54
Key economic sectors in Minnesota 56
Backward-linkage sectors 58
Economic impacts of backward linkages 59
Estimating total economic impacts 64

IHS Economics and Country Risk | The effects of North Dakota oil production on the Minnesota economy
© 2015 IHS 4 April 2015
Results: Total economic impacts 65
Tax impacts 69
Economic impacts in the Border Cities and their respective counties 70
Economic development and forward linkages 72
Other economic effects 75
Economic summary 76
Phase 4: SCOPE Analysis 79
Methodology 79
Situation today 79
Core competencies 81
Obstacles 83
Prospects 85
Expectations 90

IHS Economics and Country Risk | The effects of North Dakota oil production on the Minnesota economy
© 2015 IHS 5 April 2015
Executive summary
Background
The Minnesota Department of Employment and Economic Development engaged IHS to assess the effects on the
Minnesota economy of crude-oil production originating from North Dakota’s Bakken shale formation. Prior IHS research
has found that unconventional oil and natural gas is having a transformational impact on the US economy, and there are
clear trends shaping state level economies, as well. The Bakken shale formation is located in western North Dakota and
eastern Montana, a driving distance of 200 miles from Moorhead and 427 miles from St. Paul. Oil production in the
Bakken shale formation increased rapidly from 2007 to April 2014, from about 123,600 barrels per day to more than 1
million barrels per day, making North Dakota the second-largest oil-producing state. Crude-oil production generated high
levels of direct spending in North Dakota, which has led to very high rate of economic growth since 2007 and higher
demand for goods, services, and labor from many states, including Minnesota. As the level of daily oil production rose,
increasing amounts of crude oil began to be shipped eastward across Minnesota by rail, which has increased the visibility
of oil-production impacts in Minnesota and had disruptive effects in Minnesota’s five Border Cities.
The five Border Cities are Breckenridge in
Wilkin County, Dilworth in Clay County,
East Grand Forks in Polk County, Moorhead
in Clay County, and Ortonville in Big Stone
and Lac qui Parle counties. The impacts in
Minnesota presented in this study are based
only on those effects that can be directly
attributed to the production of oil in the
Bakken formation. The IHS team evaluated
these impacts in four project phases.
Phase 1: energy production forecast
The economic impacts in Minnesota are
determined primarily by the amount of crude
oil that will be produced in North Dakota.
The exploration, drilling, and extraction
activities required to produce crude oil are a
function of the number of wells drilled and
brought online and the total number of wells
in operation. These activities generate high
levels of annual direct spending for capital
equipment (capex) and operating
expenditures (opex). IHS forecast the annual
crude-oil production levels and their respective direct expenditures in North Dakota based on three oil-price scenarios:
Low-price scenario: $50/barrel for West Texas Intermediate (WTI) crude oil, with oil prices remaining in the range
observed in late December 2014 and January 2015
Base-price scenario: $70/barrel WTI, with oil prices recovering quickly from the low levels of early 2015 and
fluctuating in the $70/barrel WTI range
High-price scenario: $90/barrel WTI, with oil prices rebounding quickly to the levels observed before mid-October
2014.
In the base scenario ($70/barrel), crude-oil production in the Bakken region continues to rise to just over 1.6 million barrels
per day by the middle of the next decade. With prices now expected to be well below this range for the next few years,
Bakken oil-production growth is expected to slow. If oil prices return to $90/barrel or higher in the next few years, Bakken
Minnesota is a gateway for east-flowing crude oil

IHS Economics and Country Risk | The effects of North Dakota oil production on the Minnesota economy
© 2015 IHS 6 April 2015
production could exceed 2.0 million barrels per day by the middle of the next decade. However, if oil prices remain in the
$50/barrel WTI range, production is not expected to increase; rather, it will remain relatively steady at around 1.1 million
barrels per day. The IHS long-term oil-price outlook foresees WTI crude-oil prices returning to the $70–90/barrel (inflation
adjusted) range over the next few years, therefore the $70/barrel scenario is considered the base scenario for the analysis.
Combined capex and opex spending in North Dakota in 2014 was estimated at $21.1 billion. Under the base scenario,
direct spending is forecast at $15.5 billion in 2016, $17.4 billion in 2019, and $15.1 billion by 2030. Under the high-price
scenario, combined capex and opex spending is projected at $24.9 billion in 2016, $28.2 billion in 2019, and $24.3 billion
in 2030. Finally, combined capex and opex spending in North Dakota under the low-price scenario is forecast at $7.7
billion in 2016, $8.5 billion in 2019, and $7.3 billion in 2030. As shown in the economic impact table below, lower levels of capex and opex spending in North Dakota reduce the economic benefits that accrue to Minnesota.
Phase 2: transportation impacts
IHS examined the pattern of commodity flows—such as crude oil, coal, grain, other agricultural commodities, sand and
gravel, and food products—both into Minnesota and flowing out of Minnesota to other regions, particularly North Dakota.
Using IHS’s proprietary Transearch commodity flow database, we estimated the demand for rail capacity in the form of the
number of unit trains passing through Minnesota under the three oil-price scenarios.
Under the base scenario, which assumes that no additional crude-oil pipelines will be built, the number of unit trains per
day transiting Minnesota carrying crude oil produced in North Dakota is forecast to drop from 9 in 2014 to 5 in 2015, and
then increase to 7 in 2020, 10 in 2025, and 11 in 2030. If the proposed additional pipelines are completed, we forecast that
the number of unit trains will fall to 5 per day in 2015; nearly all oil shipments would be diverted to pipelines between
2017 and 2020, resulting in total pipeline dependency after 2020. Under the high-price scenario, the number of unit trains
per day would be 6 in 2015, before increasing to 14 in 2025 and 17 in 2030, assuming no additional pipelines.
Accommodating agricultural and crude-oil demand for transportation will require rail and highway system capacity
expansions that ensure reliable and timely shipments of all commodity types. We anticipate growth of gravel and sand and
stone-related commodities shipped by rail and truck to North Dakota and other Midwest locations. The Twin Cities are a
significant intermodal hub for national, interregional, and regional shipments and warehousing. The North Dakota oil
developments present an opportunity for the Twin Cities to leverage and maximize their role in providing intermodal
connectivity and distribution services. This provides Border Cities an opportunity to identify sites that would facilitate
railcar maintenance, manufacturing and parts assembly, and supply-chain management (e.g., warehouse and distribution
centers).
Phase 3: economic impacts
Changes in statewide economic activity
IHS estimated the total economic impact on the Minnesota economy for three direct effects:
Annual levels of capital and operational spending in North Dakota for oil production and the resulting indirect
spending that would flow to Minnesota through the backward linkages (crude oil supply chain)
Declines in agricultural commodity basis prices and the accompanying drop in farm income owing to competition
with crude oil for scarce rail capacity
Infrastructure investment in Minnesota directly attributable to the Bakken oil production.
The table below presents the total changes in the level of statewide economic activity under the three oil-price scenarios by
year. The three future years were chosen to represent different combinations of direct spending (infrastructure spending is
at its maximum in 2016; capex and opex spending in North Dakota peak in 2019 under the high-price and base-price
scenarios).

IHS Economics and Country Risk | The effects of North Dakota oil production on the Minnesota economy
© 2015 IHS 7 April 2015
Scenario and measure 2014 2016 2019 2030
Output $1,813.8 $4,643.3 $2,400.3 $1,740.9
Employment 7,748 25,211 10,950 7,984
Value Added $1,065.0 $2,492.6 $1,355.8 $974.9
Labor income $585.4 $1,574.9 $765.3 $547.6
Output $1,813.8 $3,789.1 $1,483.5 $1,112.5
Employment 7,749 21,210 6,671 5,068
Value Added $1,065.0 $2,019.0 $845.7 $623.3
Labor income $585.4 $1,299.2 $470.6 $346.7
Output $1,813.8 $3,077.9 $709.2 $567.7
Employment 7,749 17,902 3,089 2,569
Value Added $1,065.0 $1,621.8 $411.1 $315.0
Labor income $585.4 $1,071.3 $223.9 $174.7
Note: all dollar amounts are in millions, employment in total jobs
Economic impacts in Minnesota by scenario and year
October high scenario
December base scenario
February low scenario
Sources: Minnesota Implan Group, IMPAN input/output models for Minnesota and North Dakota, 2014. Analysis
performed by IHS.
IHS finds that the overall net economic impact of
North Dakota oil production on the Minnesota
economy is positive, but it results in only a small
percent increase in statewide economic activity.
Under the high-price scenario, total employment
rises by 25,211 jobs in 2016 and generates an
additional $2.5 billion in gross state product,
compared with increases of 21,210 jobs and $2
billion under the base scenario. The increases in
statewide economic activity in 2016 are between
0.4% and 0.9% over the IHS forecast for
Minnesota across the three oil-price scenarios. By
2019, increases in gross state product range from
0.1% to 0.3% under the three price scenarios; by
2030, they are 0.2% or lower.
The percent effect is modest primarily because
significant shares of the capex inputs—especially durable manufacturing inputs such as steel, pumps, and compressors—
will come from other states. While Minnesota is relatively close to the Bakken compared with other states, it is not close
enough to benefit from being a supplier of construction labor and raw materials, with the exception of frac (silica) sand. As
the levels of capital and operational spending in North Dakota and infrastructure outlays in Minnesota decline in the future,
the increases in statewide economic activity become smaller, as shown in the table above.
State tax revenues
In 2016, we estimate that the total additional state-level tax revenues in Minnesota generated by increases in economic
activity from North Dakota oil production will range from approximately $104 million for the low price scenario to $155.5
million in the high scenario. The annual tax-revenue increase will gradually decrease thereafter as infrastructure spending
declines, along with the levels of direct capex and opex spending in North Dakota that generate corporate and personal income taxes.
Agriculture
The adverse effects on agriculture income in 2014—owing to the drop in crop basis prices that resulted from a combination
of world prices and transportation competition with crude oil for scarce rail capacity—will be largely short term (between
2014 and 2016). In the near term, pipeline and other infrastructure improvements (such as the completion of the Sandpiper
pipeline and BNSF rail expansion) will help to shift crude oil from rail to pipeline, thus creating additional rail capacity for
agricultural and other types of commodities, such as coal. The impact of the decline in agricultural income on statewide
economic activity was more than offset by infrastructure growth and ripple effects of Bakken capex and opex spending; the
net effects of agriculture income losses and infrastructure spending are included in the table above.
Border Cities
In the five Border Cities and their respective counties, the economic impacts from the backward, or supply chain, linkages
will be minimal. These cities are not located close enough to the Bakken for their companies to benefit by being local
suppliers or to provide significant amounts of labor. The rural economies of the five counties lack the structural diversity to
provide the goods and services used in crude-oil production or the presence of large full-service firms that can meet the
specific demands of oil producers. Finally, based on research by the Minneapolis Federal Reserve Bank, demand for
skilled workers in the Bakken region has not increased the overall wage levels in the five Border Cities and their counties.
Local employers have experienced wage increases in a few specialized, high skill occupations that are in high demand in
the Bakken region, such as construction and electrical workers.
Forward linkages
Minnesota’s economy is diverse and benefits from its logistical advantages, especially the lower delivered price of Bakken
crude oil in the Twin Cities compared with other refining locations in the US Midwest. The extent to which the Minnesota
economy benefits over the long term from the increased supply of North Dakota crude oil will depend on the ability of

IHS Economics and Country Risk | The effects of North Dakota oil production on the Minnesota economy
© 2015 IHS 8 April 2015
Minnesota’s two refineries to use the crude as an input to produce refined products that can be used by other forward-
linkage, or value-added, sectors, such as chemicals and plastics. The ability of the two refineries in Minnesota to use
Bakken crude oil will not be affected by the existing and planned refineries in North Dakota, as they are much smaller and
are designed to produce fuel to meet local demand.
Wealth and infrastructure effects
North Dakota’s per capita personal income reached $53,040 in 2014, compared with $47,320 in Minnesota. Because of the
size and diversity of its economy, Minnesota offers an array of specialized goods and services that are not available in
North Dakota. As a result, North Dakota residents are increasingly spending their disposable income in Minnesota to
purchase these specialized goods and services. While income growth is slowing in the short term, over the next five years
disposable income in North Dakota will grow at a higher annual rate than in Minnesota. Therefore, Minnesota businesses
should take steps to attract customers from North Dakota; many are already doing so.
Total state-level tax revenues in North Dakota grew at a very high compound annual growth rate of 20.8% between 2007
and 2013, giving the state a large tax-revenue windfall over the period in the US. North Dakota is using this windfall to
lower state and local tax rates and to improve the capacity of its infrastructure and government services. Even with the
recent decline in the price of crude oil, North Dakota expects to collect $4.3 billion in oil and gas revenues during 2015–
17. The high level of oil and gas tax revenues will continue to allow North Dakota to allocate substantial spending toward
improving the quality of its public services, such as education and infrastructure, and mitigating the impacts of oil and gas
development on its communities. In February 2015, North Dakota enacted a $1.1-billion “surge” program to improve
infrastructure and public services in the counties that have been most directly affected by oil-production activities in the
Bakken formation. The high level of spending by North Dakota presents a significant opportunity for Minnesota
companies to provide the required goods and services.
Phase 4: SCOPE analysis
The information in the first three chapters of this study was used to present a SCOPE analysis. The SCOPE analysis
examines the Situation today, delineates the Core competencies, describes the Obstacles, presents Prospects, and develops
Expectations, which are summarized below. The SCOPE analysis was used to identify and evaluate issues that affect
Minnesota’s ability to maximize the potential economic development benefits of North Dakota’s crude-oil production.
Regardless of the price of crude oil, North Dakota will continue to be a major oil producer, creating economic development
opportunities in Minnesota. Under the base-price scenario, we forecast North Dakota’s annual oil production to be almost
1.6 million barrels per day in about 10 years; even under the low-price scenario, it will remain around the current level of 1.1 million barrels per day.
Expectations
Despite the recent fall in oil prices and projected relatively lower level of oil related revenues, the energy production
forecast included in this report indicates that North Dakota will continue to be a major player in US oil production.
However, sentiment regarding the opportunities versus challenges this will impose on the Minnesota economy varies by
industry, personal experience, and location within the state.
In order to create a cohesive vision to maximize opportunities and mitigate the challenges associated with North Dakota oil
production, Minnesota DEED, the Minnesota Chamber, and other statewide groups might take a lead role in getting this
issue on the agenda of local and bi-state economic and business development organizations. Specifically, the state has an
opportunity to:
Inform Minnesota businesses about the opportunities to participate in the crude-oil production supply chain.
Actions would include informing them of standards and processes for obtaining contracts, performance
specifications for goods and services, timeframes, risks, permitting requirements, insurance, and certifications and
training required for workers. Over the long term, Minnesota is more likely to benefit from North Dakota oil
production by providing specialized capex goods and opex services, as opposed to goods and services that have to
be provided at well sites.

IHS Economics and Country Risk | The effects of North Dakota oil production on the Minnesota economy
© 2015 IHS 9 April 2015
Alert local businesses about the opportunities to supply transportation and infrastructure-related goods and services
that will be needed in North Dakota as it continues to invest heavily in expanding the capacity and quality of its
infrastructure and government services.
Evaluate opportunities to take advantage of North Dakota’s increasing wealth and per capita income levels to offer
specialized goods and services that are not available in North Dakota.
Design education and training programs to produce workers with the competencies, education, and certifications
required by oil and gas production companies, firms in the supply chain, and local employers facing shortages of
local workers in core occupations.
Seek legislative appropriations to fund transportation infrastructure upgrades to reduce bottlenecks, improve
transportation safety and efficiency along public transportation corridors, and mitigate adverse impacts on the
quality of life in communities located in major transportation corridors. These efforts will require working
collaboratively with the privately owned railways to expedite the planned rail upgrades, as well as with oil pipeline
companies to increase the share of North Dakota crude oil carried by pipeline.
Proactively seek areas for collaboration between Minnesota and North Dakota on economic development,
transportation infrastructure, education and workforce development, and other areas of mutual interest. This type
of collaboration is especially important in the five Border Cities and their respective counties.
Assess the feasibility and value of expanding the economic development incentives available in the development
districts under the Border Cities legislation to mitigate the “edge effect.” Enhancing the incentive package could
include increasing the maximum levels of grants and loans that can be made, lengthening the period of time in
which tax credits and exclusions are available, reducing interest rates on loan programs, expanding the types of
purchases for which tax credits or refunds are available, and ensuring that developable greenfield or brownfield
sites have the required types and sizes of buildings, utility services, and access to critical transportation
infrastructure.

IHS Economics and Country Risk | The effects of North Dakota oil production on the Minnesota economy
© 2015 IHS 10 April 2015
Introduction
Background
Advances in extraction technologies, particularly in horizontal drilling and hydraulic fracturing, during the 1990s and early
2000s had made it possible to obtain natural gas and crude oil from unconventional resources, such as shale formations,
where it had not been previously been technically or economically feasible to do so. As the cost per barrel of obtaining
crude oil from unconventional resources fell, oil companies increasingly turned their attention to the Bakken and Three
Forks shale formations in western North Dakota and eastern Montana. Crude oil production in North Dakota started to
increase rapidly in 2007, rising from about 123,600 barrels per day to more than 1 million barrels per day by April 2014,
making it the second largest oil producing state behind only Texas.
The production of crude oil generated high levels of direct spending in North Dakota that led to a very high rate of
economic growth from 2007 onward. The high level expenditures by crude oil producers for capital equipment (capex)
and operating inputs (opex) led to strong demand for goods and services from suppliers in many states including
Minnesota. IHS estimates that combined capex and opex expenditures in North Dakota for crude oil production rose from
$8.4 billion in 2010 to $21.1 billion in 2014. As the level of daily crude oil production rose, increasing amounts began to
be shipped eastward across Minnesota by rail, while some of its resident workers in key occupations began taking jobs in
the Bakken region. Concurrently, Minnesota companies began to sell goods and services to crude oil producing companies
operating in the Bakken region. The effects of North Dakota oil production became increasingly visible in Minnesota,
especially in five Border Cities that are located adjacent to North Dakota. In response, the Minnesota Department of
Employment and Economic Development retained IHS to assess the effects of North Dakota crude oil production on the
Minnesota economy.
The Bakken formation is located several hours drive from Minnesota, as shown in the accompanying map; one-way
driving distances to Bismarck are 200 miles from Moorhead and 427 miles from St. Paul; distances are even further to the
main producing locations within the Bakken. Although Minnesota borders North Dakota to the east, the long distances
from Minnesota cities to the Bakken limit the competitive locational advantage in supplying inputs for crude oil
production. The Five Border Cities that are located closest to the Bakken and the counties they are in are: 1) Breckenridge
in Wilkin County; 2) Dilworth in Clay County; 3) East Grand Forks in Polk County; 4) Moorhead in Clay County; and 5)
Ortonville in Big Stone and Lac qui Parle counties.
Organization
The study consists of four phases that were performed in sequence presented below:
Phase 1: energy production forecast – develop forecasts of the annual level of crude oil production in North Dakota along
with accompanying estimates of capital equipment and operating expenditures. Production forecasts were prepared for
three different crude oil price scenarios.
Phase 2: transportation impacts – analyze the patterns of commodity flows out of and into Minnesota by type and mode.
This information was used to allocate the flow of crude oil through Minnesota by mode, including forecasts of the number
of unit trains carrying Bakken crude oil.
Phase 3: economic impact assessment – estimate the changes in statewide economic activity in Minnesota directly
attributable oil production activities in North Dakota. The following direct economic effects were considered: 1) spending
for capex and opex in North Dakota; 2) impacts on agricultural income due to competition for rail capacity; and 3)
spending for infrastructure such as crude oil pipelines and rail lines.
Phase 4: SCOPE analysis – incorporating the results of the first three phases, analyze the current Situation, identify Core
competencies, list Obstacles, discuss Prospects, and then present Expectations. The overall context of the SCOPE analysis
was to provide an understanding of the economic development issues and opportunities in Minnesota that can be attributed
to the effects of crude oil production in North Dakota.

IHS Economics and Country Risk | The effects of North Dakota oil production on the Minnesota economy
© 2015 IHS 11 April 2015

IHS Economics and Country Risk | The effects of North Dakota oil production on the Minnesota economy
© 2015 IHS 12 April 2015
Phase 1: Energy Production Forecast
This document presents the IHS view of oil production activity in the Bakken/Three Forks area, including measures of
activity that will be used to determine the economic effects in Minnesota, such as:
Underlying factors in world oil markets that influence the forecast
Total annual production of crude oil
The total number of operating wells in Bakken/Three Forks
The demand for sand used in hydraulic fracturing
The number of new wells drilled and completed annually
Capital expenditures (capex) incurred to drill and complete new oil wells and bring them online
The annual operating expenditures (opex) required to operate the existing oil wells.
The Bakken formation lies under portions of 16 counties in western North Dakota and 11 counties in eastern Montana. As
a result, not all of the crude oil being produced within the Bakken is actually produced within the state of North Dakota.
According to IHS, the Three Forks formation lies below the Bakken in many of the same areas in Montana and North
Dakota. It extends further east across North Dakota, but not as far west into Montana, and as far south as South Dakota.
While the Three Forks is slightly thinner, there are two additional potential productive zones in the formation. To date, the
vast majority of the drilling and extraction activity has occurred in the Bakken formation.
The crude oil production forecasts presented are for both the Bakken and Three Forks formations and include oil coming
from Montana and North Dakota. The term “North Dakota oil production” refers to crude oil extracted from both
formations and both states. Because the Bakken and Three Forks plays are each single, contiguous geological formations
that generally cover the same geographies, the term “Bakken/Three Forks” refers to a single region in terms of production,
transportation accessibility, proximity to markets, direct spending, etc. Finally, all the figures here, except where noted
otherwise, are for unconventional energy production, which requires much larger levels of capex, (e.g., fracking fluid,
sand, water, cement, waste disposal, etc.) than conventional oil wells, but similar amounts of opex (e.g., well operation,
gathering, transport, and processing).
Three Bakken production scenarios were developed for this work, differentiated by the average crude oil price over the
period to test the sensitivity of Bakken activity and its economic impact (prices are in constant dollars):
Low production scenario of $50/barrel (bbl) West Texas Intermediate (WTI) crude oil: In this scenario, oil prices
remain in the range experienced in late December 2014 and January 2015. The key assumptions for this scenario
include:
o The export ban is not lifted.
o After rail transportation costs are deducted, the effective producer price is between $35 and $40 per barrel.
o The low producer price causes a major rapid drop in rig activity, new well additions, and short-term
production.
o Drilling only occurs in the lowest cost areas of Bakken.
o Up to 60% of the production from future new wells will have a breakeven cost above the effective producer
price.
Midline or base production scenario of $70/bbl WTI: In this scenario, oil prices recover quickly from the low level
of early 2015 and average in the $70/bbl WTI range.
o The effective producer price with or without rail transport is high enough to sustain a production increase.
o If the export ban is lifted, pipeline capacity could be sufficient to move all production to Cushing, Oklahoma
(the major crude oil logistics and trading hub in the US) and the Gulf Coast. However, some rail transport may
occur to the East and West Coasts.

IHS Economics and Country Risk | The effects of North Dakota oil production on the Minnesota economy
© 2015 IHS 13 April 2015
o Up to one-third of production from future new wells will have a breakeven cost above the effective producer
price.
High production scenario of $90/bbl WTI: In this scenario, oil prices bounce back quickly to the levels
experienced before mid-October 2014.
o The export ban is assumed to be lifted to due high crude oil production.
o Sufficient pipeline capacity is added to move all crude oil to the US Gulf Coast (USGC).
o The effective producer price will be above the breakeven cost of production for nearly all of the resource base,
including emerging- and higher-risk areas.
The IHS long-term oil price view is that prices will return to the $70–90 (inflation-adjusted) range for WTI crude oil over
the next few years. Consequently, the $70-per-barrel scenario is considered the base scenario for the analysis.
International context
During the last 10 years, world oil prices and the expectations of where future oil prices may trend have been more volatile
than any time since 1973–86, even taking into account the relative price calmness from 2012 to early 2014. Views have
ranged from the widely held belief that supplies were near their peak and the already-high oil prices would go even higher,
to concern of abundant supplies that would cause prices to decline. The transition from the perception of shortage to one of
surplus has occurred over just the last few years due to rising unconventional oil and gas supplies in North America. This
has been driven largely by the combination of (1) new technologies allowing economic use of horizontal drilling and
hydraulic fracturing that has enabled the rapid development of tight oil and gas plays such as the Eagle Ford in Texas and
Bakken in Montana and North Dakota and (2) higher oil and gas prices that have allowed these relatively high-cost
resources to become commercial.
The level of unconventional oil and gas developments in North America is also supporting a broader change in the Atlantic
Basin and global oil and gas markets. The combination of rising supplies of oil and gas in North America, Latin America,
and Africa along with maturing demand in Europe and North America is having far-reaching geopolitical implications as
regional production changes global crude oil and refined-products flows. In recent years, rising production in the United
States had changed the dynamics of petroleum flows in the North Atlantic, which has pushed more African and Middle
Eastern crude oils to the Asian market.
Recently, crude oil prices have declined from as high as $115 per barrel during the third week of June 2014 to under $50
per barrel in January 2015 (UK Brent prices). The decline was driven by rising worldwide surplus crude oil supplies that
resulted, in part, from:
Organization of Petroleum Exporting Countries’ (OPEC) November decision to not reduce production to support
prices
Libyan oil’s return to the world oil market after being severely disrupted by political instability
A greater-than-expected increase in US oil production
A slowdown in the rate of growth in oil demand, particularly in China, that has also influenced fundamentals.
In the coming years, the world crude oil markets will be driven primarily by the following factors:
The responsiveness of US shale oil production growth to lower prices
How OPEC responds, in terms of pricing and production decisions, after a period of very low prices
The rate of increase in other non-OPEC crude oil production after the price collapse. Prior to the price collapse, the
growth rate in non-OPEC liquids supply was the highest on record, as depicted on the accompanying chart.
The postponement or cancellation of capital-intensive projects in deep water and other frontier regions.
OPEC has, at least temporarily, changed its approach to oil production and prices. For much of the last 40 years, OPEC has
attempted to balance supply with demand by cutting production if prices fell too low and increasing production if prices
went too high. However, in November 2014 OPEC changed its approach. OPEC is not reducing its own low-cost
production to keep prices high enough to justify new production in high-cost areas. Rather, its policy is now based on

IHS Economics and Country Risk | The effects of North Dakota oil production on the Minnesota economy
© 2015 IHS 14 April 2015
forcing the market to balance supply and demand. As a result, world oil prices have collapsed under the weight of rising
crude oil inventories. For the market to balance, non-OPEC supply will have to be reduced. Prices have fallen far enough
that at least some resources in shale and oil sands areas of North America and expensive deep-water production in other
countries may not be developed.
Low prices are expected to cause North American oil production to peak and begin a gradual decline during the next
several months rather than continuing to rise as was expected prior to the price collapse. As US and other non-OPEC
production growth slows, rising oil demand will gradually reduce the global surplus of crude oil and production capacity.
Once the surplus is worked off, demand is expected to continue rising, resulting in the need for increased non-OPEC
production. New non-OPEC production is higher cost, which will result in a return to rising oil prices over time. However,
world oil prices are expected to remain volatile as the markets move toward a new balance between supply and demand.
Forecasts of non-OPEC liquids supply and the need for OPEC oil
Geopolitical risk remains an issue for crude oil supplies, as is often the case, with continued concern over unrest and
possible supply disruptions. However, the IHS assessment of the geopolitical risk in the major oil-producing countries does
not show a clear trend toward greater risk despite rising political tensions in the Middle East and Ukraine. The major
supply risk from the Middle East for the next few years could be too much supply rather than too little. The change in
OPEC policy to not lower its own production but force higher-cost producers, such as North American shale oil producers,
to cut back will reduce non-OPEC supply growth and overall production.
The current OPEC policy of not restraining production is difficult to manage for some producers (both OPEC and non-
OPEC). OPEC producers’ government budgets are based on oil prices that range from under $40/bbl to more than
$100/bbl. However, the most powerful OPEC members of the “OPEC core” (Saudi Arabia, Kuwait, and the United Arab
Emirates—UAE) have much more flexibility to handle lower prices, and all have substantial foreign-exchange reserves to
make up any revenue shortfalls). As a result, the current OPEC production policy led by Saudi Arabia is expected to last at
least long enough to bring supply and demand back into balance and, presumably, to higher prices.

IHS Economics and Country Risk | The effects of North Dakota oil production on the Minnesota economy
© 2015 IHS 15 April 2015
Global breakeven costs
The breakeven cycle depiction shows that tight oil breakeven costs have a wide range, but overall are some of the highest
in the world. The base scenario for the Bakken forecast (described in this report) is based on a $70/bbl range, which is
below the highest-cost resources in US and Canadian unconventional oil plays. Consequently, production in some of these
areas is expected to level off and, in some cases, begin to decline. We note that while breakeven costs vary within the
Bakken, the overall average breakeven cost is between $58 and $62/bbl. This breakeven price threshold makes overall
drilling and production in the Bakken vulnerable to drops in the oil price, so we would expect to see certain levels of
reduction but not a complete shutdown of the play in response to current and anticipated oil prices. As the global oil supply
surplus is reduced, oil production from higher-cost areas within the Bakken will be required to meet demand growth.
However, higher oil prices will be needed to stimulate activity and bring that oil to market.
*Note: GTL are liquids produced from natural gas through chemical processing of gas and are similar to diesel fuel, CTL are
similar to GTL, but produced from coal, and NGLs liquids that are naturally produced with natural gas in the field and include
propane and butane.

IHS Economics and Country Risk | The effects of North Dakota oil production on the Minnesota economy
© 2015 IHS 16 April 2015
US context
Tight oil and gas supplies have dramatically changed the oil and energy landscape in the United States. The United States
produced over 9.0 million barrels per day (b/d) of crude oil by the end of 2014, equaling volumes produced in 1973/74 and
showing growth levels only surpassed by one country in the history of oil production—Saudi Arabia. However, the
collapse in oil prices in late 2014 and early 2015 is expected to reverse the recent production trends in the lower 48 states,
including North Dakota.
The rise in tight oil supplies has contributed to a decline in US imports from a high of over 14.5 million b/d in August 2006
to 8.3 million b/d in July 2014—the lowest level since July 1995. Since early in the last decade, US petroleum exports have
risen from an average of about 1.0 million b/d to nearly 4.4 million b/d in November 2014. All of these exports were either
refined products or natural gas liquids because the United States has banned crude oil exports since 1973. The possible
lifting of the crude oil export ban is being debated by Congress, and IHS currently expects the ban to be lifted in the next
few years. Continued rising production will increase the pressure on lawmakers to allow crude oil exports.
IHS Economics and Country Risk | The effects of North Dakota oil production on the Minnesota economy
© 2015 IHS 17 April 2015
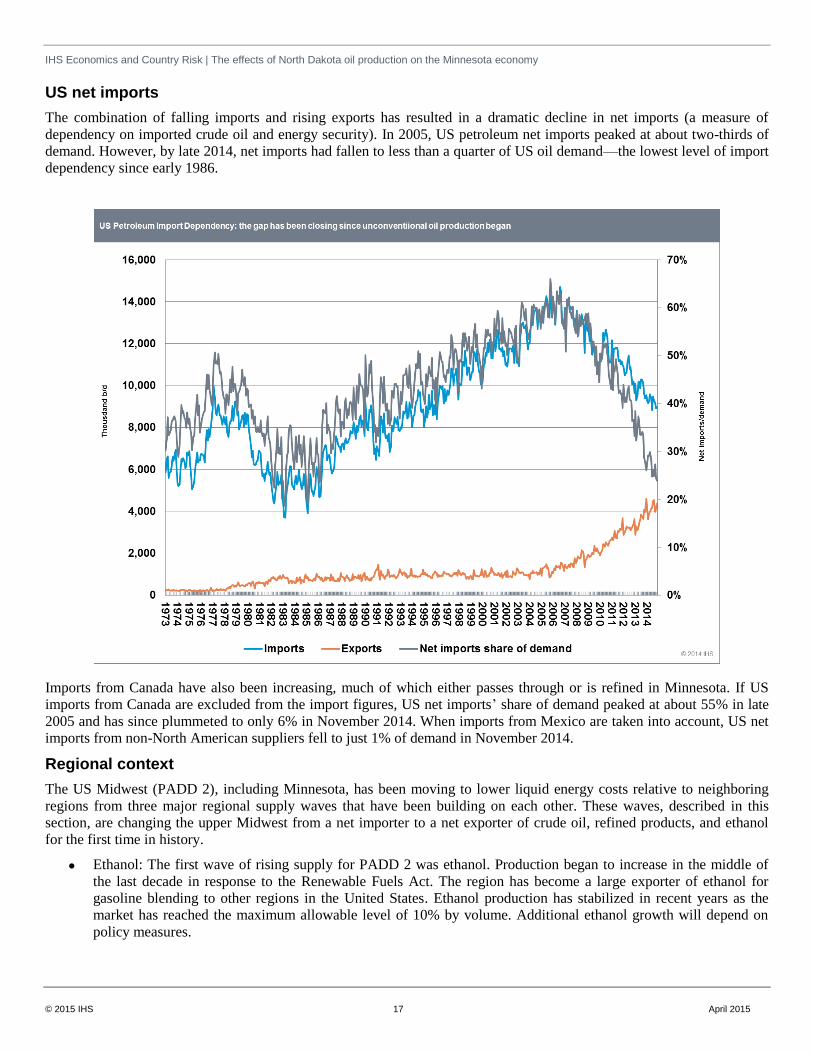
US net imports
The combination of falling imports and rising exports has resulted in a dramatic decline in net imports (a measure of
dependency on imported crude oil and energy security). In 2005, US petroleum net imports peaked at about two-thirds of
demand. However, by late 2014, net imports had fallen to less than a quarter of US oil demand—the lowest level of import
dependency since early 1986.
Imports from Canada have also been increasing, much of which either passes through or is refined in Minnesota. If US
imports from Canada are excluded from the import figures, US net imports’ share of demand peaked at about 55% in late
2005 and has since plummeted to only 6% in November 2014. When imports from Mexico are taken into account, US net
imports from non-North American suppliers fell to just 1% of demand in November 2014.
Regional context
The US Midwest (PADD 2), including Minnesota, has been moving to lower liquid energy costs relative to neighboring
regions from three major regional supply waves that have been building on each other. These waves, described in this
section, are changing the upper Midwest from a net importer to a net exporter of crude oil, refined products, and ethanol
for the first time in history.
Ethanol: The first wave of rising supply for PADD 2 was ethanol. Production began to increase in the middle of
the last decade in response to the Renewable Fuels Act. The region has become a large exporter of ethanol for
gasoline blending to other regions in the United States. Ethanol production has stabilized in recent years as the
market has reached the maximum allowable level of 10% by volume. Additional ethanol growth will depend on
policy measures.

IHS Economics and Country Risk | The effects of North Dakota oil production on the Minnesota economy
© 2015 IHS 18 April 2015
Canadian crude oil: Much of the crude oil exported from Canada to the United States passes through the US
Midwest, particularly Minnesota. Canadian crude oil exports to and through PADD 2 were relatively stable until
early 2011 when volumes began to rise. Most of the capital expenditure for heavy oil sand development has
already occurred, and heavy oil is being brought on-stream. Consequently, IHS expects Canadian heavy oil
production and the associated need for additional crude oil transportation capacity to continue rising over the next
several years, despite lower world oil prices. Some of the expected increase will move through PADD 2 and
Minnesota. The exact amount will depend on pipeline and rail developments.
Bakken/Three Forks: The combination of horizontal drilling and hydraulic fracturing has created an oil and gas
production boom in parts of the United States. In western North Dakota’s Bakken/Three Forks play, production
has risen from fewer than 250,000 b/d in 2010 to more than 1.1 million b/d in 2014. Bakken production could rise
to 1.6 million b/d by 2022 in the base scenario. IHS estimates as much as 50% of the recent production moves
through Minnesota by rail, mainly toward refineries in Minnesota and on the East Coast.
Historical liquids supply-and-demand balance
As supplies in the upper Midwest increase relative to the rest of the United States, relative costs of liquids to local
manufacturers and consumers will decline, refiners and processers will have the incentive to expand production, and
consumers of transportation fuels will have an incentive to expand energy-intensive business activities. Midwest refiners
have already invested in additional capacity to process more Canadian heavy crude oil as these supplies increased. Similar
investments to utilize new light/sweet Bakken crude oil are likely as production continues to rise. As Minnesota refiners
are the closest to the Bakken/Three Forks formation (i.e., about 600 miles to the east), they would have the lowest
delivered cost of crude oil coming from there. However, the refined products logistics system may need to adapt to handle
increased production from refiners. The decline in oil prices may slow the upper Midwest’s move to being a regional net
petroleum liquids (including ethanol) exporter. There are three new small refiners in the Bakken area being discussed or
underway designed to provide diesel fuel to the region. The area needs increased diesel supply and these plants will reduce
the need to bring diesel fuel into the region. However, the total volume is relatively small.
Petroleum Administration for Defense Districts (PADDs)

IHS Economics and Country Risk | The effects of North Dakota oil production on the Minnesota economy
© 2015 IHS 19 April 2015
Bakken shale formation
Bakken production levels, field activity, and economics were developed using three long-term WTI price scenarios:
$50/bbl, $70/bbl, and $90/bbl. These price levels were chosen to cover the wide range of price and expectation swings that
have come through the industry since the middle of the last decade. However, a great deal of uncertainty currently exists
around how the oil industry in the Bakken and other unconventional oil plays will respond to lower prices. After all, much
of the production increase and industry experience has occurred in a high-price environment. The combination of hydraulic
fracturing and horizontal drilling in shale continues to be a developing technology. IHS believes costs will continue to fall
as the industry gains experience and competitive pressures from lower oil prices increase.
These forecasts take into account economic fundamentals such as well performance, capital expenditure, expected
breakeven costs by well, fiscal systems and royalties, and future prices, all of which are relatively easy to measure and
analyze. On the other hand, operator behavior is often predicated on (1) available cash flows and funding, (2) company
strategy, (3) unusual behaviors, such as drilling, but not completing wells, and (4) perceived future commodity price
expectations, all of which vary considerably from operator to operator and are difficult to detect and measure. We have
noted that historically these factors have sometimes contributed to behavior that runs counter to economic fundamentals.
While some slight upward adjustment has been incorporated into our forecasts to account for these behaviors, the forecasts
are based primarily on the economic fundamentals, as stated.

IHS Economics and Country Risk | The effects of North Dakota oil production on the Minnesota economy
© 2015 IHS 20 April 2015
Crude oil production in the Bakken region is expected to continue to rise in the base scenario ($70/bbl WTI). IHS expects
Bakken unconventional oil production to reach just over 1.6 million b/d by the middle of the next decade. WTI averaged
$100 per barrel in the first three quarters of 2014. About 10% of 2014 production had full-cycle breakeven costs above
$90/bbl WTI. With prices now expected to be well below this range for the next few years, Bakken oil production growth
is expected to slow. If oil prices do return to $90/bbl or higher in the next few years, Bakken production could exceed 2.0
million b/d by the middle of the next decade. However, if oil prices remain in the $50/bbl WTI range, production is not
expected to increase, but remain relatively steady at around 1.1 million b/d.
Bakken crude oil production has developed so fast that the pipeline system has not yet had time to add sufficient capacity
to take production to market. As a result, rail is being utilized to move over 60% of production. Rail shipments from
Bakken are expected to fall in the next couple of years if oil prices remain below $70/bbl. Some growth is possible if the
proposed crude oil pipelines are not built. If the proposed lines are built, there would be sufficient pipeline capacity to
eliminate rail shipments through 2021 in the high-price scenario, and through the end of the period for the base- and low-
price scenarios. However, continued low prices and production uncertainty could delay future pipeline additions, resulting
in continued need for rail to move Bakken crude oil.
Rail shipments will continue to be required under any of the price scenarios if the proposed pipelines are not built.
Transporting Bakken crude by rail is attractive in refining markets not served by pipelines, such as the US East Coast and
US West Coast refineries; it is expected to remain a major source of supply for them. Without new pipelines, rail traffic
will increase to higher levels as production grows with higher crude oil prices. If crude averages in the $50/bbl range,
production is not expected to be sufficient to cause an increase in rail volumes from recent levels.
Pipelines are being added to move Bakken crude oil to market. For crude oil producers, railroads have not only been
critical because of their ability to quickly add capacity. Prior to 2010, almost no crude oil was moved by rail in North
America; now, nearly 1.0 million b/d move long distances from the midcontinent and western Canada to refineries on three
US coasts. Bakken producers have been able to quickly move crude oil production to all major refining centers in the
United States and as far away as eastern Canada by rail. Rail has provided producers with some degree of market
flexibility. However, the cost of rail is higher compared with pipelines. As a result, the price the producers receive is lower.

IHS Economics and Country Risk | The effects of North Dakota oil production on the Minnesota economy
© 2015 IHS 21 April 2015
Natural gas is also produced in the Bakken region but the distance to the nearest major market makes new pipeline capacity
prohibitively expensive. Therefore, transport to market is limited to the existing interstate pipelines and must compete
with Canadian gas for the limited capacity. North Dakota natural gas production reached over 1.5 billion cubic feet per day
in December 2014, some of which is flared. Natural gas supplies in the region are abundant when shale resources in
Canada are taken into consideration. Reduced flaring and changes in Bakken crude oil production will contribute to
corresponding changes in natural gas production. However, the impact on the price of gas in the region is expected to be
relatively small considering the overall supply picture on both sides of the border and in Colorado and Wyoming. In
addition, natural gas supplies from shale resources in Pennsylvania are pushing west and adding to the supply abundance in
the upper Midwest.
Bakken potential pipeline capacity and rail requirements
Pipeline capacity could eventually develop to transport all future Bakken production depending on the oil price and
subsequent level of production in Bakken. The new pipeline capacity announced so far cannot take all of the expected
increase if the oil price returns to the $90/bbl leveling during the near term. However, if oil prices remain low, or increase
to the $70/bbl range and all announced pipelines are built, there will be more than enough capacity to move production
without rail.
Nearly all of the pipeline capacity being considered can deliver Bakken crude oil to the USGC market, and all has the
potential for reducing rail traffic through Minnesota. However, only one of the planned pipelines will cross the state of
Minnesota—the Sandpiper pipeline—which will carry Bakken crude oil to Clearbrook, Minnesota, and then on to
Superior, Wisconsin, for eventual shipment by pipeline to the eastern PADD 2 refiners and USGC market. Sandpiper, if
approved, is expected to be operational in 2017.
Crude oil shipments by pipeline to the USGC market could be impeded if the US crude oil export ban is not lifted. Bakken
crude oil is light/sweet crude, which is in surplus supply today in the USGC market since other growing tight oil plays such
as Eagle Ford and the Permian Basin, which are more local to the USGC, also produce light oil. Without an end to the
export ban and increased pipeline shipments to the USGC, lower prices and production from the Bakken could result. If the
export ban is lifted, more light oil would be exported from the USGC region, which would free up more light-oil refining
capacity so that more Bakken crude would flow to the USGC by pipeline—and rail if pipelines are not yet available—for
export. If the export ban is not lifted, more Bakken crude oil will be moved by rail to other US refineries.

IHS Economics and Country Risk | The effects of North Dakota oil production on the Minnesota economy
© 2015 IHS 22 April 2015
Frac sand
Drilling practices and technology continue to advance in the shale plays. Hydraulic fracturing technology continues to
evolve and could increase production or slow the rate of decline caused by low oil prices. One of the operators in the
Bakken uses a practice called “superfracking,” which could dramatically increase the amount of sand used per well and
increase production. In 2014, the average Bakken well required an average of about 4.5 million pounds of sand—
equivalent to an estimated 409 unit trains for frac sand (40,909 cars at 110 tons/car) per year. If many of the other operators
were to adopt superfracking, the average sand used per well could go as high as 9.0 million pounds or more. If we were to
consider the upside for the high scenario with an increase to 9.0 million pounds of sand for the average well, the demand
for rail cars could increase to about 80,000 per year or 800 unit trains in the high scenario. As a result, frac-sand unit trains
could increase from about one per day in 2015 to over two per day in 2020.

IHS Economics and Country Risk | The effects of North Dakota oil production on the Minnesota economy
© 2015 IHS 23 April 2015
The potential impact from superfracking
The demand for frac sand is not expected to increase in the base scenario or the low oil price scenario, assuming no
increase in the use of superfracking. Total production of industrial sand in Minnesota is estimated to be about 7 million
tons, where about two-thirds are used for fracking and the majority is used in locations other than the Bakken.1 The decline
in the number of wells drilled is expected to roughly offset the increase in frac sand use per well in the $70/bbl scenario. In
the low oil price scenario, frac sand demand will fall roughly 50% from recent levels and not increase for the remainder of
the period. The Minnesota Department of Natural Resources has already observed a slight decline in silica sand
production.1 Only in the high-price scenario would frac sand demand rise, and it could peak at 75% above recent levels by
2020. This assumes superfracking is not widely used.
The impact on the overall long-run well economics from superfracking is not yet fully understood. Superfracking increases
the initial production rates, but at a higher cost. It is unclear if it will also increase the total oil recovery during the life of
the well and how fast this additional oil could be recovered. Production would be higher in all oil price scenarios if
superfracking does increase per well oil recovery. In addition, the total amount of sand required would increase. For
example, if we reconsider universal adoption of superfracking and if all wells in all three price scenarios moved to, say, 9
million pounds of sand per well, the amount of sand per well would increase 70%. The frac sand-related infrastructure and
logistics would also increase. In the base scenario, for example, the increase in the amount of sand required would be
equivalent to going from requiring fewer than 40,000 rail cars per year to nearly 80,000 rail cars.
2014 Bakken breakeven cost and volume of production
The average breakeven price in the established Bakken/Three Forks play ranges from $58 to $62/bbl based on WTI with
two-thirds having a breakeven under $70/bbl WTI in 2014. However, the cost of transportation to move Bakken to market
is about $10–11/bbl by pipeline to the USGC and about $15–16/bbl to ship it by rail to the USGC. As a result, the actual
price a Bakken producer would receive is at least $11 per barrel under WTI (WTI minus transportation). The WTI price
fell below $45 per barrel in January 2015, putting even the lowest-cost Bakken production at or below breakeven in the
mid-$30/bbl range.
1 Personal conversation with Heather Arends, Minnesota Department of Natural Resources, 16 March 2015.

IHS Economics and Country Risk | The effects of North Dakota oil production on the Minnesota economy
© 2015 IHS 24 April 2015
As oil prices recover over time, more Bakken crude oil will become economically attractive and production increases will
occur. The amount of the production increase will depend on the price received at the sales point, which may be either the
Cushing hub or an East Coast refinery. Two factors will increase the Bakken producer price of oil:
Rising global oil prices
A lifting of the US crude oil export ban, which leads to the addition of pipeline capacity to move crude oil to the
USGC and reduces shipments on higher-cost rail.
Caution is needed when making determinations regarding breakeven prices and the impact of lower commodity prices on
potential production cutbacks. For example, breakeven prices in the emerging and potential new areas of the Bakken/Three
Forks average about $74 per barrel. These areas include the development of additional zones in the Three Forks as well as
tighter down hole spacing, which is currently only in the piloting phase. Our higher price forecasts include these emerging
areas, but if prices remain low, the development of these areas is in serious jeopardy.
A $74 average breakeven price for these emerging areas also suggests operators will focus solely on the better-producing
mature areas now that the global crude oil price is low. However, breakeven prices are also likely to fall because of
increased competition from suppliers and service companies such as drillers and fracking crews. Furthermore,
improvements have been occurring in production performance and reductions in drilling and cost, which will continue to
drive down breakeven costs. Drilling and production costs tend to decrease during periods of low commodity prices as
operators become even more cost conscious, which ultimately reduces breakeven costs. Ultimately, we would expect fewer
wells to be drilled, but less impact on overall production.
Direct spending effects
The capital expenditure and operating expenses are determined by how many wells are brought online. Both rig count and
new wells are directly related to the price of crude oil. Shown in the accompanying charts are the rig counts and new wells
for each of the three crude oil price scenarios.
The cost for drilling, completion, and facilities for one well in the Bakken/Three Forks has averaged about $8.65 million
and the average operating costs are on the order of $5.99 per barrel with crude oil in the $90–100/bbl range. Combined,
these capital and operating costs allow average Bakken unconventional crude oil production to breakeven at about $58–62
per barrel, if we include production taxes and royalties.

IHS Economics and Country Risk | The effects of North Dakota oil production on the Minnesota economy
© 2015 IHS 25 April 2015
The level of demand for goods and services used by Bakken/Three Forks oil producers that are purchased from suppliers
located in Minnesota will be determined by the following measures of oil production activity in Bakken/Three Forks:
The number of new wells drilled and completed annually, which will determine the demand for capex associated
with well development, and the demand for such inputs as frac sand
The total number of operating wells in a year, which determines the demand opex spending
The annual level of crude oil production in Bakken/Three Forks, and the resulting share that is transported to and
through Minnesota. Together, they determine the level of capacity required in the rail, pipeline, and highway
systems that is needed to move the crude oil and other commodities, especially agriculture. The total demand for
transportation capacity, in turn, will determine the levels of capex needed for transportation infrastructure.
If crude oil prices return to the range of the high-price scenario, IHS expects both capital and operating costs to remain at
the recent levels. However, lower oil prices are expected to cause surplus capacity in drilling, production, and other

IHS Economics and Country Risk | The effects of North Dakota oil production on the Minnesota economy
© 2015 IHS 26 April 2015
services, stimulating increased competition and lower costs. IHS estimates costs to fall from current levels for the base and
low scenarios as follows:
Base scenario: capital expenditures to $7.96 million per well and operating costs to $5.84/bbl
Low-price scenario: capital expenditures to $6.92 million per well and operating costs to $5.51/bbl.
The charts below show the level of capital expenditures and operating costs, respectively, for each scenario.
Major findings
The key points from the most recent IHS forecast of oil production for the Bakken/Three Forks shale formations are
summarized in this section. Additional details are provided in the remainder of the section.
In both the base and high oil price scenarios, Bakken production is expected to continue rising and peak in the
middle of the next decade. In the low oil price scenario, production drops slightly in 2015 and remains relatively
constant at or near the 2014 average.

IHS Economics and Country Risk | The effects of North Dakota oil production on the Minnesota economy
© 2015 IHS 27 April 2015
Crude-oil-by-rail shipments will decline in 2015 as new pipelines come into service. However, the long-term level
of rail shipments will depend on the production of crude oil and the capacity of pipelines that have not yet been
approved. This approval is not likely to occur if long-term prices remain in the $50/bbl range. Nevertheless, major
markets for Bakken crude are located on the East and West Coasts, where no pipelines are planned and transport is
likely to continue by rail for the foreseeable future.
In the base scenario, Bakken/Three Forks production will continue to increase until at least 2022 with fewer rigs
and new wells, as drilling practices and hydraulic fracturing technologies continue to advance. Operators will also
focus on drilling in high-graded areas where production per well is highest. Later in the decade, we expect annual
well counts and rig counts to decrease substantially and production will begin a slow, steady decline.
The number of wells drilled is expected to decrease unless oil prices return to the $90-plus/bbl range. At these high
price levels, the number of new wells could rise to as many as 2,800 per year before declining. In the base
scenario, the number of new wells will fall for the next couple of years to 1,600 per year. In the low-price scenario,
the number of new wells drops sharply to 800 in 2016 and remains at that level for the period.
The average rig count will closely match the trend in new wells.
Frac sand demand in Bakken will follow the number of new wells. Sand use per well has increased over time to
approximately 4.5 million pounds per well. Current trends suggest some increase in the future, which may offset
some of the decreases in drilling through practices such as superfracking.
Capital expenditures will follow the trends of new wells in each scenario and operating expenses will follow
production levels.
In the Petroleum Administration for Defense District (PADD) 2, which includes 15 states around the Great Lakes
and upper Midwest, including Minnesota, energy supplies are growing relative to demand and it could become a
net exporter of crude oil and liquid fuels by 2020.
Policy considerations
Energy policy is a constantly changing concept. Over the longer term, energy policy in the United States tends to change as
perceptions of future energy supplies and prices change. Frequently, policy changes occur in response to unanticipated or
unintended consequences or market dislocations resulting from past policies; recent examples include those for methyl
tertiary butyl ether (MTBE) and ethanol, which are both used as gasoline additives to reduce vehicle emissions. US oil and
gas production growth and the supply/demand balance could be influenced by future policy changes. The net impact of any
policy change is eventually reflected in the price or cost of oil and gas relative to other products and markets. Energy
policy areas where changes could significantly affect the level and price of oil extracted in the Bakken/Three Forks
formation are identified in this section.
US ban on crude oil exports: Primary among the existing US policies that have an impact on US crude oil prices
and, eventually, production growth is the ban on crude oil exports. The ban was put into effect in 1973 and
effectively prohibits the exportation of US crude oil to any country except Canada without a special waiver. There
have been two waivers granted 1) which allows the exporting of Alaskan crude oil with certain shipping
considerations and 2) includes the recent waiver to allow some condensates to be exported. Production of
light/sweet crude oil such as Bakken continues to increase putting pressure on domestic crude oil prices. The
domestic refining system is not designed to run the amount of light/sweet crude oil being produced. To absorb the
growing surplus of light/sweet crude oil would require significant investment in new refinery capability while
reducing the value of existing refining capacity. Modifying or lifting the export ban would bring domestic crude oil
market back into balance with refining capability and prices back to world parity. IHS anticipates the crude oil
export ban will be modified or lifted in 2017. The implication for Bakken will eventually be higher relative prices
compared with the current price, once sufficient pipeline and rail takeaway capacity is built to the Gulf Coast. This
lifting of the ban will also narrow the gap between WTI and Brent and between Bakken and WTI.
Jones Act: The Jones Act was passed in 1920. It requires all goods shipped between US ports to be transported on
US-built, -crewed, and -flagged ships. US ships carry higher costs than international vessels. This is important for

IHS Economics and Country Risk | The effects of North Dakota oil production on the Minnesota economy
© 2015 IHS 28 April 2015
Bakken because the higher cost of Jones Act ships contributes to the attractiveness of rail shipments from Bakken
to the US East and West Coast refiners rather than moving the USGC light/sweet crude oil to these markets by
tanker. IHS does not expect changes to US shipping policies.

IHS Economics and Country Risk | The effects of North Dakota oil production on the Minnesota economy
© 2015 IHS 29 April 2015
Phase 2: Transportation impacts
As part of the Minnesota Department of Employment and Economic Development’s project to examine the effects of
North Dakota oil production on the Minnesota economy, IHS conducted an analysis of trade by commodity type across
different modes of transportation. Annual crude-oil production in the Bakken/Three Forks shale play in western North
Dakota and eastern Montana has increased rapidly, and this has significantly contributed to the tonnage and volume of
crude oil being sent through Minnesota. This recent trend has raised concerns about the ability of Minnesota’s
transportation systems (notably railroads) to accommodate the flows of crude oil originating in North Dakota, and to a
lesser extent in Canada, as well as flows of all other types of commodities (especially all types of agricultural products).
This report presents rail and truck commodity flows through, into, and out of Minnesota for selected years through 2030
based on alternative energy scenarios. Estimates for crude petroleum transiting by rail have been revised based on the
recent reductions in the cost of crude oil and Bakken and in Canadian oil field production. As a result, the estimates for the
number of unit trains2 transiting Minnesota through 2030 have been revised. The revised oil-production forecasts indicate
the variability in the possible number of unit trains, particularly over the short term, owing to per-barrel pricing. We
present the original forecast prior to the recent reduction in oil prices. The accompanying map shows the proximity of
Minnesota to the Bakken formation, and to major oil pipelines, existing and proposed; rail lines are shown in a map
presented below.
2 A unit train is a freight train composed of cars carrying a single type of commodity that are all bound for the same destination. By hauling only one
kind of freight for one destination, a unit train does not need to switch cars at various intermediate junctions and so can make nonstop runs between
two terminals. It can include 100 freight cars.

IHS Economics and Country Risk | The effects of North Dakota oil production on the Minnesota economy
© 2015 IHS 30 April 2015
We also present three alternative scenarios based on $90/barrel West Texas Intermediate (WTI) holding steady, $70/barrel
WTI, and $50/barrel WTI. We anticipate the $70/barrel WTI to be more likely over the long-run; therefore, we focus on
this scenario and present it as a base scenario for planning. These production levels have been generated by IHS Energy of
alternative futures for Bakken production on yearly basis. It must be understood, however, given pricing fluctuations, the
number of unit trains per day will vary on a year-to-year basis. When Bakken production returns to 2013–14 levels, the
number of Bakken-related unit trains could be, again, as many as 10 per day.
The commodity flows originally presented were derived from the 2012 IHS Transearch database (the most current history
year available). They were used to estimate the demand for transportation capacity, such as the number of unit trains. Our
analysis focuses on crude-oil shipments originating in North Dakota and in the Canadian provinces of Alberta and
Saskatchewan that we forecast to be shipped through Minnesota. Importantly, our analysis also considers flows of other
commodities, such as agricultural products (e.g., grain; oil kernels, nuts, or seeds; and nut or vegetable oils), coal, gravel
and sand (including frac sand), and iron ore. These commodities are competing with crude oil for transportation capacity,
especially on the rail system.
The 2012 IHS Transearch database provides county-to-county trade and transportation flows by mode, commodity type,
weight, and value for more than 340 commodities. Transearch is used by governments and transportation service providers
to analyze market demand and transportation system capacity and to identify investment priorities. The trade flow
estimates and forecasts consider the large increases that have occurred during the last two years owing to the amount of
crude oil produced by the Bakken/Three Forks shale formations. The commodity flows produced by Transearch were
based on the findings of the Phase 1 “Forecast of oil production levels in the Bakken/Three Forks formations,” which was
presented earlier in this study.
Mode share distributions for all commodities
To analyze the transportation capacity needed to accommodate the demands from crude oil and other commodities, it is
helpful to provide the context of the movements of all types of commodities through, into, and out of Minnesota.
Approximately 96% of all commodities, by weight, were transported by rail and truck. The rail and truck shares in 2030
are forecast to be 48% and 49%, respectively, compared with mode splits of 54% and 42% in 2012. During the analysis
period, truck tonnage is forecast to grow at an average annual rate of 2.3%, the highest rate of all modes. The average
annual growth rates for air, rail, and water tonnage are estimated at 1.4%, 0.8%, and -0.6%, respectively. Rail tonnage will
experience slow growth because coal shipments will steadily decline between 2012 and 2030. Truck movements constitute
the largest value of all trade, with a 41% share in 2012.
We forecast that the truck share of the value of commodities carried will reach 51% in 2030. Trucking’s share of value
carried is higher than its share of tonnage carried because trucks carry higher-value products, as opposed to bulk
commodities like crude oil, grain, and sand and gravel, which have much lower ratios of value to weight and are more
likely to move by rail.
Mode 2012 2014 2015 2019 2030Percent of
2012
Percent
of 2030
CAGR
2012-2030
Rail 456,512 458,607 464,144 487,779 525,327 53.5% 47.9% 0.8%
Truck 357,048 390,754 402,225 444,001 534,787 42.0% 48.8% 2.3%
Water 39,328 38,297 38,682 38,392 35,328 5.0% 3.2% -0.6%
Air 195 201 205 215 252 0.0% 0.0% 1.4%
Total 853,083 887,859 905,256 970,387 1,095,694 101% 100% 1.4%
Source: IHS, Transearch database for 2012, 2015
CAGR: compound annual grow th rate
Note: Percent sums vary +/- due to rounding error
Total commodity flow tonnages in Minnesota by mode
(Tons in thousands)

IHS Economics and Country Risk | The effects of North Dakota oil production on the Minnesota economy
© 2015 IHS 31 April 2015
Commodity flows by rail and truck
Policymakers and the media in Minnesota have been concerned about the increase in the amount of crude oil from the
Bakken/Three Forks formations and the Canadian oil sands moving by rail through the state. The rapid increases in the
amount of crude-oil production and the accompanying strong growth in demand for rail service have strained the state’s
rail system. The competition for rail capacity has spurred discussions about how to accommodate the additional flows of
crude oil by rail and balance it with the demand to ship other commodities (particularly agricultural products) by rail.
Minnesota’s farmers recently produced bumper crops that have increased the demand for timely rail service. One way to
decrease demand for rail capacity is to expand the capacity of crude-oil pipelines in Minnesota. As IHS concluded in the
Phase 1 report, rail shipments of crude oil out of the Bakken are expected to begin declining within the next several years
as new pipelines overtake production growth. Prior to the recent drop in oil prices, we anticipated that rail traffic would fall
below current levels within the next two years and by 2020 average about 25% below 2014, assuming that the Sandpiper
pipeline project is completed. With $70/barrel WTI, rail traffic transiting Minnesota carrying Bakken oil will drop by about
50% in 2015; it will then reach 2014 levels in 2030 as oil production increases, assuming that no new pipelines come into
service. Conceivably, if all proposed pipelines are built, almost all of the required rail service transiting Minnesota with
Bakken-produced oil could be diverted to the new pipelines starting around 2020. This is also greatly dependent on the
Dakota Access pipeline, which is proposed at this time.
For the most part, the oil shipments originating in North Dakota and Canada move through Minnesota to destinations in the
Midwest, the Gulf Coast, and the Mid-Atlantic. Based on revised Bakken oil production and the eventual completion of the
Sandpiper East pipeline by 2016, required rail service could drop by as much as 70%. Remaining rail service could be
required to deliver oil to East Coast refineries. East Coast deliveries will depend on available capacity and the economics
of Gulf Coast refineries and the potential of moving refined products via Jones Act vessels to East Coast ports.
Approximately 300 miles of the 612-mile, $2.6-billion project will be in Minnesota. Enbridge, the developer of the
Sandpiper pipeline, is completing two other projects in Minnesota that will expand the capacity of its crude-oil pipeline
system: 1) increasing the capacity of line 67 by adding new pumping stations and 2) replacing the pipes of line 3, which
includes 338 miles in Minnesota. Lines 67 and 3 both end at Enbridge’s oil terminal in Superior, Wisconsin.
The primary characteristics of commodity flows through Minnesota are summarized below:
69.9% of all commodities destined to North Dakota originate in Minnesota. Of these, 39.7% shipped on truck,
25.7% are shipped on rail and 4.5% are air cargo commodities originated in Minnesota.
39.7% of all commodities originating in Minnesota are destined to North Dakota. For commodities originating in
Minnesota, 33% are shipped on truck to North Dakota, 3.7% are shipped on rail and 3% are air cargo commodities.
Proposed Sandpiper crude-oil pipeline route

IHS Economics and Country Risk | The effects of North Dakota oil production on the Minnesota economy
© 2015 IHS 32 April 2015
19.2% of all commodities that originate in North Dakota are sent to Minnesota. For commodities destined to
Minnesota, 13.6% are shipped on truck, 4.6% are shipped on rail, and less than 1% is air cargo commodities.
Crude petroleum rail shipments currently moving through Minnesota originate in North Dakota and in the
Canadian provinces of Alberta and Saskatchewan.
Based on historical data, North Dakota crude petroleum rail tonnage moving through Minnesota is estimated to
have grown very rapidly (increasing by as much as 190% and growing at a rate of 43% per year) between 2012 and
2014. Based on new oil production at $70/barrel WTI, the tonnage transiting Minnesota by rail could drop by as
much as 70% by 2016. This would have a proportional effect on Minnesota’s Border Cities, particularly
Moorhead, since it experienced the heaviest increase in rail transits through 2014 with as many as 8 unit trains per day.
Based on historical data, Canadian crude petroleum shipments moving through Minnesota by rail rose from about
3.9 million tons in 2012 to 4 million tons in 2014, an increase of only 3.1%. Before the drop in oil prices,
shipments were anticipated to gradually rise to 4.1 million tons by 2019 and 4.3 million tons in 2030. Based on
revised Canadian crude production rates (due to the recent price reductions), we are anticipating that Canadian tonnage transiting Minnesota will drop but remain around 3.7 million tons by 2030.
North Dakota crude petroleum through rail shipments required approximately 3,300 unit trains in 2014. We
originally estimated that the number of unit trains per year would peak at about 3,700 in 2019 and then gradually
decline to about 2,800 by 2030. Per-day estimates were about 8 to 9 trains in 2014, 10 to 11 trains between 2015
and 2019, and 7 to 8 trains in 2030. With the revised North Dakota oil production, at $70/barrel WTI, we estimate
that approximately 1,600 unit trains per year, or about five per day, will transit Minnesota in 2015. By 2020, we
expect approximately 2,400 unit trains per year, or seven per day. Assuming that no new pipelines come online,
the annual number of unit trains could increase to approximately 4,000, or as many as 11 trains per day. However,
if all proposed pipelines are built, the demand for Bakken carrying unit trains is highly likely to fall close to zero by 2020.
Our original estimate of unit trains carrying crude oil from Canada through Minnesota was approximately 428
trains in 2014, 441 trains in 2015, and 472 trains in 2030, equivalent to one to two unit trains per day. The majority
of these through rail shipments are destined for the US East Coast, Midwest, and Gulf Coast and for locations in
eastern Canada such as Montreal, Toronto, and Chicoutimi, Quebec. Based on new production estimates, the number of annual unit trains is estimated to be about 400, or about one train per day, from 2015 through 2030.
Outbound agricultural tonnage from Minnesota is forecast to have the fastest growth rate among the high tonnage
commodities. Agricultural tonnage includes oil kernels, nuts, or seeds, which are forecast to grow at almost 5%,
followed by grain and soybean oil, which should each grow close to 2%. Large quantities of these agricultural
products are shipped to the US Northwest, where they are consumed or exported to Asia.
Large quantities of iron ore are being shipped from Minnesota to locations in the Midwest and Southeast US.
By far, coal represents the largest amount of tonnage being shipped to Minnesota. However, the annual flow
should decline from 12.3 million tons in 2012 to 9.6 million in 2030, at an average annual rate of 1.4%. Intermodal shipments and fertilizers represent the next largest amount of inbound tonnage shipments.
Grain will be the largest tonnage of commodities shipped out of Minnesota by truck between 2012 and 2019.
Annual outgoing shipments of grain moving by truck will average 30 million tons between 2019 and 2030. Gravel
or sand will become the largest outbound commodity shipped by truck starting in 2020, regardless of oil price
scenarios; shipments will gradually rise to 40.7 million tons by 2030. Of this, it is estimated approximately 4.0
million to 7.3 million tons of frac sand (equivalent to about 1 to 2 unit trains per day) would be shipped through Minnesota to North Dakota through 2030, depending on production levels.

IHS Economics and Country Risk | The effects of North Dakota oil production on the Minnesota economy
© 2015 IHS 33 April 2015
Minnesota freight overview
This section presents detailed data on the movement of commodities through, into, and out of Minnesota by rail and truck.
The characteristics of the trade flows are presented, including tonnage by type of commodity for both modes, value by type
of commodity, and origins and destinations. The trade flows were estimated using our 2012 Transearch database; values
for subsequent years are forecasts. The accompanying map shows the major freight rail lines serving Minnesota and the
Bakken shale formation.
Minnesota through rail traffic
Through traffic makes up about three-fourths of total rail traffic in Minnesota. By far, coal shipments were the greatest
amount of through tonnage in 2012 at approximately 178.1 million tons; annual through shipments are forecast to decline
to 124.2 million tons by 2030 at an average annual rate of about -2%. The reason for the decline is the decreasing use of
coal as a fuel to generate electric power, as utilities switch to natural gas. The coal shipments primarily originate in
Wyoming; destinations include St. Louis, Houston, Peoria, Dallas, Little Rock, Duluth, Chicago, and San Antonio.
The top 10 commodities by weight moving through Minnesota originating in North Dakota and Canada are listed in the
table below. Based on Transearch data, crude oil was the individual commodity with the largest tonnage in 2012 transiting
Minnesota from North Dakota and Canada at about 13.8 million tons, increasing to 40.0 million tons in 2015 and then
declining to approximately 23.9 million tons in 2030. The steep increase in tonnage between 2012 and 2015 represents a
191% increase and an annual growth rate of 43%. The forecast presented below anticipates crude petroleum tonnage
Freight rail connections in Minnesota

IHS Economics and Country Risk | The effects of North Dakota oil production on the Minnesota economy
© 2015 IHS 34 April 2015
declining to 34 million tons in 2019 and eventually 23.9 tons in 2030. The annual growth rate, however, from 2012 to
2030; is estimated to be for 3.1% (accounting for the steep annual increases and then the decline later during the 2030 time
period).
Based on new North Dakota production forecasts at $70/barrel WTI and assuming no major increases in pipeline capacity,
crude petroleum tonnage transiting Minnesota in 2015 could decline to approximately 19.7 million tons. It should reach
approximately 21 million tons in 2019 and 30 million tons in 2030 (assuming a return to 2014 crude-oil production levels).
Three agricultural products – grains; oil kernels, nuts, or seeds; and nut and vegetable oils – as an aggregate were the
largest trade flows by tonnage in 2012; they are forecast to grow at average annual rates of 3.0%, 4.9%, and 1.0%,
respectively, between 2012 and 2030. IHS estimates that, at 32.1 million tons, 2014 crude petroleum tonnage far exceeded
the aggregate tonnage of these three agricultural commodities. We forecast that the aggregate tonnage of the three
agricultural commodities listed above will reach 26.2 million tons by 2030. Based on new production forecasts (at
$70/barrel WTI), crude petroleum tonnage shipments could reach 30 million in 2030, still exceeding the aggregate
agricultural tonnage.
Two figures are presented of North Dakota and Canadian flows transiting Minnesota. One illustrates the original forecast
based on Transearch 2012; the other is based on revised production levels through 2030 at $70/barrel. Under the original
forecast, tonnage of crude oil shipped by rail and originating in North Dakota was expected to peak in 2015 and slowly
decline. However, at $70/barrel WTI, tonnage being shipped through Minnesota dips in 2015 with a gradual increase
occurring through 2030.
Commodity 2012 2014 2015 2019 2030 CAGR 2012-
2030
Crude Petroleum 13,754 32,147 40,038 34,088 23,857 3.11%
Potassium or Sodium Compound 11,566 11,353 11,504 12,033 13,163 0.72%
Lumber or Dimension Stock 9,072 9,870 10,290 11,395 14,507 2.64%
Grain 6,604 7,377 7,357 8,209 11,299 3.03%
Oil Kernels, Nuts or Seeds 4,851 4,461 4,593 5,752 11,397 4.86%
Plastic Mater or Synth Fibers 3,494 3,919 4,160 5,018 8,026 4.73%
Nut or Veg Oils or By-products 2,924 2,932 2,975 3,147 3,512 1.02%
Misc. Industrial Organic Chemicals 2,843 3,052 3,224 4,289 7,693 5.69%
Pulp or Pulp Mill Products 2,530 2,629 2,706 2,925 3,489 1.80%
Motor Vehicles 2,334 2,538 2,646 2,927 3,724 2.63%
Source: IHS, Transearch database for 2012, 2015
CAGR: compound annual grow th rate
Top 10 Commodities from Canada and North Dakota transiting Minnesota by rail
(Tons in thousands)

IHS Economics and Country Risk | The effects of North Dakota oil production on the Minnesota economy
© 2015 IHS 35 April 2015
The figure below illustrates the destinations of crude petroleum trade flows originating in North Dakota and Canada that
pass- through Minnesota on rail, based on Transearch 2012 data. Transearch-generated data indicate that the largest
tonnage flows are going to the Gulf Coast, other locations in Texas and Oklahoma, the Midwest, and the Mid-Atlantic.
Minnesota through truck traffic
Top origins and destinations for truck through-traffic by Bureau of Economic Analysis (BEA) economic area indicates
supply chains that serve the
Upper Midwest. Des Moines,
Iowa, is an important origin and
destination for commodities
moving through the Upper
Midwest and transiting
Minnesota. Two-way truck
tonnage between the
Minneapolis and Des Moines
BEA economic areas represents
the largest amount of traffic
moving through Minnesota.
Between 2012 and 2030, truck
tonnage flowing from
Minneapolis to Des Moines is
forecast to grow at an average
annual rate of only 0.2%, while
the growth rate for the reverse
flow is 2.2% – the highest
among all the origin-destination
pairs shown in the table. The
Fargo, North Dakota, BEA area
includes Clay and Norman
counties in western Minnesota.
The Minneapolis BEA area
contains 54 counties in
Minnesota. The Bakken and
Three Forks formations are
located in the Bismarck, North Dakota; Minot, North Dakota; and Billings, Montana, BEA economic areas.
20142012 2015 2019 2030
Source: IHS Transearch 2012
Destinations of crude oil from Canada and North Dakota moving through
Minnesota by rail

IHS Economics and Country Risk | The effects of North Dakota oil production on the Minnesota economy
© 2015 IHS 36 April 2015
Interstate 94 is important for truck movements through the Upper Midwest, with the Twin Cities serving as pivotal
transportation hub in the region. Interstate 94 also provides direct highway access between the major cities in Minnesota
and the Bakken/Three Forks shale play. Much of the capital equipment (e.g., drilling rigs, pumps, compressors,
instruments, and steel) and materials (e.g., cement and fracking fluid) used in the drilling of new oil wells are transported
by trucks that undoubtedly move along Interstate 94. As the principal east-west highway connecting the Twin Cities to
Moorhead and North Dakota, it is an important conduit for the delivery of materials to North Dakota. Truck traffic carrying
heavier loads will increase along Interstate 94 as North Dakota’s investments in development occur. Inevitably the
increased truck traffic will contribute to congestion particularly in urban areas and accelerated roadway deterioration.
Origin BEA
economic area
Destination BEA
economic area2012 2014 2015 2019 2030 CAGR, 2012–30
Minneapolis, MN Des Moines, IA 1,421 1,576 1,566 1,522 1,471 0.19%
Des Moines, IA Sioux, Falls, SD 720 869 920 1,033 1,042 2.07%
Sioux, Falls, SD Des Moines, IA 712 828 838 910 990 1.85%
Wausau, WI Des Moines, IA 556 619 622 624 640 0.78%
Des Moines, IA Fargo, ND 499 591 626 696 578 0.82%
Des Moines, IA Minneapolis, MN 485 564 591 688 714 2.17%
La Crosse, WI Des Moines, IA 451 505 502 488 473 0.26%
Des Moines, IA La Crosse, WI 407 477 504 589 502 1.17%
Minneapolis, MN Cedar Rapids, IA 399 443 440 443 515 1.43%
Casper, WY Wausau, WI 355 341 334 312 270 -1.51%
CAGR: compound annual grow th rate
Source: IHS Transearch 2012
(Tons in thousands)
Top origin and destinations pairs for through Minnesota commodities carried by truck
Truck trips through Minnesota (2014 tonnages)
Source: IHS Transearch 2012

IHS Economics and Country Risk | The effects of North Dakota oil production on the Minnesota economy
© 2015 IHS 37 April 2015
The top commodity flows in 2012, by tonnage, moving on trucks through Minnesota are gravel and sand, including sand
used for fracking; it is expected to grow at an average annual rate of 3% between 2012 and 2030. Other bulk commodities
with significant tonnage flows in 2012 included grain, broken stone or riprap, and dairy products. Clay ceramic and
refractory minerals are forecast to have the highest average annual growth rate, at 4.8%. The economic recovery –
including new construction, increased manufacturing output in Minnesota and North Dakota, and the expected increases in
North Dakota crude-oil production – is the likely reason for the high growth rates for sand and gravel, clay materials, and
lumber trucks shipments. The warehouse and distribution center commodity consists of many different goods that use
warehouse and distribution services. As noted below, the Twin Cities serve as an important, multimodal distribution center
for the Upper Midwest.
The origin and destination trade flows for the top commodities, including grain and coal, moving through the Upper
Midwest by truck highlights the movement of broken stone and riprap trade flows from the Des Moines, Iowa, and
Rochester, Minnesota, BEA economic areas to the Fargo BEA economic area. Broken stone and riprap trade flows will
grow through 2015 but decline thereafter. The tonnage of broken stone or riprap moving from Rochester to Fargo will
decline by almost 5% annually through 2030. Broken stone and riprap are likely proxy indicators for construction activity.
Grain tonnage remains relatively constant, with modest increases in tonnage moving between Sioux Falls and Des Moines.
Top through-Minnesota commodities carried by truck
Commodity 2012 2015 2019 2030CAGR,
2012–30
Gravel or sand 5,241 7,018 8,527 8,977 3.03%
Grain 5,014 6,148 6,173 6,617 1.55%
Broken stone or riprap 4,990 5,629 6,339 4,961 -0.03%
Warehouse and distribution centers 2,291 2,584 2,922 4,158 3.37%
Dairy farm products 1,370 1,462 1,587 1,824 1.60%
Oil kernels, nuts, or seeds 1,190 956 1,042 1,246 0.26%
Deciduous fruits 992 1,059 1,117 1,235 1.22%
Clay ceramic or refractory minerals 694 832 1,122 1,608 4.78%
Frozen fruit, vegetables, or juice 590 618 682 823 1.87%
Lumber or dimension stock 588 697 757 973 2.84%
CAGR: compound annual grow th rate
Source: IHS Transearch 2012
(Tons in thousands)
Origin BEA
economic area
Destination BEA
economic areaCommodity 2012 2015 2019 2030
CAGR,
2012–30
Minneapolis, MN Des Moines, IA Grain 666 780 745 748 0.65%
Minneapolis, MN Des Moines, IA Gravel or sand 533 552 535 483 -0.55%
Sioux, Falls, SD Des Moines, IA Grain 508 623 645 692 1.73%
Des Moines, IA Fargo, ND Broken stone or riprap 353 434 490 350 -0.05%
Casper, WY Wausau, WI Bituminous coal 333 310 285 244 -1.71%
Des Moines, IA Sioux, Falls, SD Grain 304 400 403 406 1.62%
Wausau, WI Des Moines, IA Grain 301 356 342 349 0.83%
Rochester, MN Fargo, ND Broken stone or riprap 300 322 308 121 -4.92%
La Crosse, WI Des Moines, IA Grain 260 304 290 290 0.61%
Des Moines, IA Sioux, Falls, SD Broken stone or riprap 238 304 380 346 2.10%
CAGR: compound annual grow th rate
Source: IHS Transearch 2012
(Tons in thousands)
Top origin-destination pairs for through Minnesota commodities carried by truck

IHS Economics and Country Risk | The effects of North Dakota oil production on the Minnesota economy
© 2015 IHS 38 April 2015
Minnesota outbound rail traffic
Although outbound freight makes up a relatively small percentage of total rail transportation, it is nonetheless an important
mode of transport for getting numerous Minnesota commodities – including iron ore and agricultural products -- to market.
Oil kernels, nuts, or seeds are forecast to grow at the highest annual rate (4.9%), followed by grain and soybean oil (each
growing close to 2%). The annual growth rate for sand tonnage is about 2.8%, largely owing to the demand for frac sand
produced in Minnesota. Rail freight moves large quantities of iron ore out of Minnesota to locations in the Midwest and
Southeast. Large quantities of agricultural products are shipped to the US Northwest, where they are consumed and/or
transshipped to Asia.
US Northwest locations, such as Seattle and Portland, demonstrate a strong rail-based trade relationship with Minnesota, as
a producer of agricultural products, and serve as a connective location for commodities ultimately destined for Asia. Trade
flows from the Grand Forks, Fargo, and Minneapolis BEA economic areas to the Northwest are forecast to grow at more
than 4% annually for several agricultural commodities.
Commodity 2012 2015 2019 2030 CAGR, 2012–30
Iron ores 16,401 16,791 20,408 23,709 2.07%
Grain 9,078 9,828 10,506 12,773 1.92%
Gravel or sand 4,856 5,372 6,362 8,024 2.83%
Oil kernels, nuts, or seeds 3,791 3,613 4,531 8,951 4.89%
Misc. industrial organic chemicals 2,648 2,947 3,792 4,663 3.19%
Soybean oil or by-products 2,570 2,720 2,997 3,578 1.86%
Petroleum refining products 1,563 1,710 1,812 1,979 1.32%
Intermodal shipments 1,216 1,340 1,436 1,821 2.27%
Wet corn milling or milo 1,156 1,288 1,467 1,813 2.53%
Paper 912 1,106 1,192 1,194 1.51%
CAGR: compound annual grow th rate
Source: IHS Transearch 2012
(Tons in thousands)
Top outbound Minnesota commodities carried by rail
Origin BEA
economic area
Destination
BEA economic
area
Commodity 2012 2015 2019 2030 CAGR, 2012–30
Duluth, MN Duluth, MN Iron ores 8,846 9,255 12,100 13,971 2.57%
Duluth, MN Atlanta, GA Iron ores 2,724 2,623 2,856 3,351 1.16%
Duluth, MN Des Moines, IA Iron ores 2,717 2,616 2,849 3,342 1.16%
Minneapolis, MN Seattle, WA Grain 1,862 1,700 1,870 2,460 1.56%
Minneapolis, MN Seattle, WA Oil kernels, nuts, or seeds 862 829 1,039 2,036 4.89%
Fargo, ND Portland, OR Oil kernels, nuts, or seeds 849 789 991 1,992 4.85%
Minneapolis, MN Denver, CO Gravel or sand 820 952 1,124 1,034 1.30%
Minneapolis, MN New York, NY Misc. industrial organic chemicals 760 849 1,066 1,072 1.93%
Fargo, ND Seattle, WA Oil kernels, nuts, or seeds 689 666 834 1,634 4.91%
Minneapolis, MN Odessa, TX Gravel or sand 630 652 725 789 1.26%
CAGR: compound annual grow th rate
Source: IHS Transearch 2012
(Tons in thousands)
Top origin-destination pairs for all outbound Minnesota commodities carried by rail

IHS Economics and Country Risk | The effects of North Dakota oil production on the Minnesota economy
© 2015 IHS 39 April 2015
The estimated tonnage of frac sand shipments originating in Minnesota is based on the IHS forecast for unconventional oil
production in the Bakken/Three Forks formation. The largest tonnages of Minnesota frac sand are currently being shipped
to Colorado, North Dakota, and Texas. Taken together, the Texas destinations receive substantially more frac sand than the
Minot, North Dakota, BEA economic area. Shipments to the Dallas BEA economic area are forecast to grow at the highest
rate (just over 6%) between 2012 and 2030, while those to the Grand Forks and Minot BEA economic areas are forecast to
increase at average annual rates of 3.5% and 2%, respectively. Demand for frac sand will persist, despite the recent
revision of oil production due to super fracking. Conceivably, this demand can be satisfied by frac sand originating in
Minnesota as well as other locations. Frac sand shipments originating in Minnesota and destined for North Dakota could
result in as many as one to two unit trains per day throughout the study period.
Top rail outbound grain product destinations
Source: IHS Transearch 2012

IHS Economics and Country Risk | The effects of North Dakota oil production on the Minnesota economy
© 2015 IHS 40 April 2015
Origin BEA economic
area
Destination BEA
economic area2012 2014 2015 2019 2030 CAGR, 2012–30
Minneapolis, MN Denver, CO 829 888 952 1,124 1,034 1.24%
Minneapolis, MN Odessa, TX 630 634 652 725 789 1.26%
Minneapolis, MN Minot, ND 479 487 493 584 685 2.01%
Minneapolis, MN Dallas, TX 455 600 634 776 1,388 6.39%
Minneapolis, MN San Antonio, TX 450 452 493 590 695 2.44%
Minneapolis, MN Corpus Christi, TX 234 227 232 315 431 3.45%
Fargo, ND Fargo, ND 232 227 231 261 285 1.15%
Minneapolis, MN Grand Forks, ND 201 212 215 258 376 3.54%
Rochester, MN Dallas, TX 190 172 196 199 178 -0.36%
Minneapolis, MN Alberta, CA 124 126 132 152 199 2.66%
CAGR: compound annual grow th rate
Source: IHS Transearch 2012
(Tons in thousands)
Top origin-destination pairs for outbound Minnesota frac sand
Top destinations for outbound Minnesota fracking sand sent by rail
Source: IHS Transearch 2012

IHS Economics and Country Risk | The effects of North Dakota oil production on the Minnesota economy
© 2015 IHS 41 April 2015
Minnesota outbound truck traffic
Grain constitutes the largest tonnage of commodities being shipped out of Minnesota by truck between 2012 and 2019,
followed closely by sand and gravel. After 2019, annual grain tonnage is forecast to level out at around 30 million tons,
resulting in an annual growth rate of 1% between 2012 and 2030. Additional agricultural shipments include miscellaneous
field crops; dairy farm
products; oil kernels,
nuts, or seeds; and
prepared or canned
feed. The tonnage for
all agricultural
shipments should
climb from about 36.8
million tons in 2012
to approximately 43.0
million by 2030,
equivalent to a 1.5%
average annual
growth rate.
From 2012 to 2030,
gravel and sand
tonnage will grow
3.8% annually,
exceeding the level of
grain tonnage in 2030 by almost 35%. Annual growth rates in tonnage shipped between 2012 and 2030 are highest for cut
stone and stone products and for broken stone, increasing 6.4% and 4%, respectively.
Grain, gravel and sand, and stone are the top commodities being shipped to destinations in the Upper Midwest. Annual
growth rates for gravel and sand will be highest for shipments between Minneapolis and Des Moines, Fargo, Sioux Falls,
and Sioux City, at 3.6%, 3.2%, 4.3%, and 4.7%, respectively.
Origin BEA economic
area
Destination BEA
economic areaCommodity 2012 2015 2019 2030
CAGR,
2012–30
Minneapolis, MN Des Moines, IA Grain 4,810 5,690 5,722 5,919 1.16%
Minneapolis, MN Sioux, Falls, SD Grain 2,986 3,426 3,364 3,071 0.16%
Minneapolis, MN Des Moines, IA Gravel or sand 1,859 2,197 2,659 3,532 3.63%
Minneapolis, MN Sioux, City, IA Grain 1,851 2,234 2,251 2,370 1.38%
Minneapolis, MN Omaha, NE Grain 1,666 1,893 1,890 1,857 0.60%
Minneapolis, MN Fargo, ND Gravel or sand 1,434 1,557 1,845 2,503 3.14%
Minneapolis, MN Sioux Falls, SD Gravel or sand 1,372 1,618 2,006 2,901 4.25%
Minneapolis, MN Fargo, ND Broken stone or riprap 1,365 1,804 2,187 2,813 4.10%
Minneapolis, MN Fargo, ND Grain 1,323 1,586 1,600 1,619 1.13%
Minneapolis, MN Sioux City, IA Gravel or sand 1,046 1,278 1,597 2,388 4.69%
CAGR: compound annual grow th rate
Source: IHS Transearch 2012
(Tons in thousands)
Top origin-destination pairs for outbound Minnesota commodities carried by truck
Commodity 2012 2015 2019 2030CAGR,
2012–30
Grain 25,179 29,426 29,692 30,259 1.03%
Gravel or sand 20,948 24,65 29,646 40,728 3.76%
Warehouse and distribution centers 5,999 6,747 7,427 10,317 3.06%
Misc. field crops 4,221 3,950 4,025 4,044 -0.24%
Broken stone or riprap 3,358 4,322 5,289 6,908 4.09%
Dairy farm products 2,861 2,888 3,117 3,488 1.11%
Oil kernels, nuts, or seeds 2,777 2,224 2,429 2,885 0.21%
Petroleum refining products 1,890 2,069 2,026 1,850 -0.12%
Cut stone or stone products 1,851 2,302 2,685 5,666 6.41%
Prepared or canned feed 1,752 1,882 2,044 2,307 1.54%
CAGR: compound annual grow th rate
Source: IHS Transearch 2012
(Tons in thousands)
Top outbound Minnesota commodities carried by truck
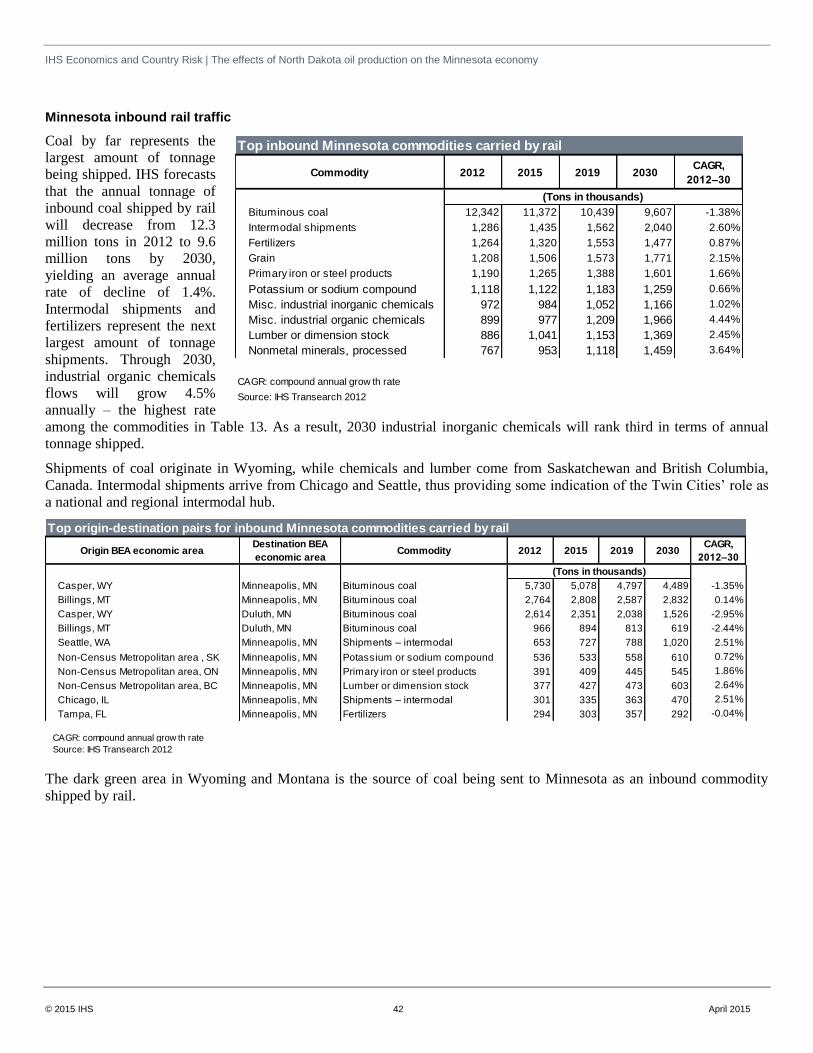
IHS Economics and Country Risk | The effects of North Dakota oil production on the Minnesota economy
© 2015 IHS 42 April 2015
Minnesota inbound rail traffic
Coal by far represents the
largest amount of tonnage
being shipped. IHS forecasts
that the annual tonnage of
inbound coal shipped by rail
will decrease from 12.3
million tons in 2012 to 9.6
million tons by 2030,
yielding an average annual
rate of decline of 1.4%.
Intermodal shipments and
fertilizers represent the next
largest amount of tonnage
shipments. Through 2030,
industrial organic chemicals
flows will grow 4.5%
annually – the highest rate
among the commodities in Table 13. As a result, 2030 industrial inorganic chemicals will rank third in terms of annual
tonnage shipped.
Shipments of coal originate in Wyoming, while chemicals and lumber come from Saskatchewan and British Columbia,
Canada. Intermodal shipments arrive from Chicago and Seattle, thus providing some indication of the Twin Cities’ role as
a national and regional intermodal hub.
The dark green area in Wyoming and Montana is the source of coal being sent to Minnesota as an inbound commodity
shipped by rail.
Origin BEA economic areaDestination BEA
economic areaCommodity 2012 2015 2019 2030
CAGR,
2012–30
Casper, WY Minneapolis, MN Bituminous coal 5,730 5,078 4,797 4,489 -1.35%
Billings, MT Minneapolis, MN Bituminous coal 2,764 2,808 2,587 2,832 0.14%
Casper, WY Duluth, MN Bituminous coal 2,614 2,351 2,038 1,526 -2.95%
Billings, MT Duluth, MN Bituminous coal 966 894 813 619 -2.44%
Seattle, WA Minneapolis, MN Shipments – intermodal 653 727 788 1,020 2.51%
Non-Census Metropolitan area , SK Minneapolis, MN Potassium or sodium compound 536 533 558 610 0.72%
Non-Census Metropolitan area, ON Minneapolis, MN Primary iron or steel products 391 409 445 545 1.86%
Non-Census Metropolitan area, BC Minneapolis, MN Lumber or dimension stock 377 427 473 603 2.64%
Chicago, IL Minneapolis, MN Shipments – intermodal 301 335 363 470 2.51%
Tampa, FL Minneapolis, MN Fertilizers 294 303 357 292 -0.04%
CAGR: compound annual grow th rate
Source: IHS Transearch 2012
(Tons in thousands)
Top origin-destination pairs for inbound Minnesota commodities carried by rail
Commodity 2012 2015 2019 2030CAGR,
2012–30
Bituminous coal 12,342 11,372 10,439 9,607 -1.38%
Intermodal shipments 1,286 1,435 1,562 2,040 2.60%
Fertilizers 1,264 1,320 1,553 1,477 0.87%
Grain 1,208 1,506 1,573 1,771 2.15%
Primary iron or steel products 1,190 1,265 1,388 1,601 1.66%
Potassium or sodium compound 1,118 1,122 1,183 1,259 0.66%
Misc. industrial inorganic chemicals 972 984 1,052 1,166 1.02%
Misc. industrial organic chemicals 899 977 1,209 1,966 4.44%
Lumber or dimension stock 886 1,041 1,153 1,369 2.45%
Nonmetal minerals, processed 767 953 1,118 1,459 3.64%
CAGR: compound annual grow th rate
Source: IHS Transearch 2012
(Tons in thousands)
Top inbound Minnesota commodities carried by rail

IHS Economics and Country Risk | The effects of North Dakota oil production on the Minnesota economy
© 2015 IHS 43 April 2015
Minnesota inbound truck traffic
Broken stone, grain, and distilled or blended liquors constitute the largest flows of inbound tonnage for commodities with
Minnesota destinations being shipped by trucks, followed by grain shipments. The average annual growth rates during
2012–30 for these commodities are comparable, ranging between 1% and 2%. Shipments of gravel and sand are forecast to
grow 3.5% annually, compared with 2.8% for warehousing and redistribution commodities.
Origins of top inbound commodities shipped to Minnesota by rail
Source: IHS Transearch 2012
Origin BEA economic
area
Destination BEA
economic areaCommodity 2012 2015 2019 2030
CAGR,
2012–30
Des Moines, IA Minneapolis, MN Broken stone or riprap 3,659 4,475 5,553 5,723 2.52%
Rochester, MN Minneapolis, MN Broken stone or riprap 2,690 2,753 2,708 1,311 -3.91%
Des Moines, IA Minneapolis, MN Grain 2,257 3,066 3,209 3,689 2.77%
Fargo, ND Minneapolis, MN Grain 2,130 2,622 2,716 3,139 2.18%
Des Moines, IA Duluth, MN Distilled or blended liquors 2,044 2,251 2,517 3,438 2.93%
Sioux, Falls, SD Minneapolis, MN Grain 1,857 2,286 2,380 2,516 1.70%
Grand Island, NE Duluth, MN Distilled or blended liquors 1,751 1,888 1,846 1,543 -0.70%
Grand Forks, ND Minneapolis, MN Gravel or sand 1,660 2,764 3,541 4,128 5.19%
Omaha, NE Duluth, MN Distilled or blended liquors 1,276 1,406 1,459 1,424 0.61%
St. Louis, MO Minneapolis, MN Broken stone or riprap 1,233 1,224 1,223 1,237 0.02%
CAGR: compound annual grow th rate
Source: IHS Transearch 2012
(Tons in thousands
Top origin-destinations pairs for inbound Minnesota commodities carried by truck

IHS Economics and Country Risk | The effects of North Dakota oil production on the Minnesota economy
© 2015 IHS 44 April 2015
The market dynamics and shipment patterns of the Upper Midwest and Midwest highlight truck trade flows with
Minnesota as the destination, illustrating the significance of the Twin Cities as an intermodal and warehousing hub for
commodities moving by truck.
Commodity 2012 2015 2019 2030 CAGR, 2012–30
Broken stone or riprap 16,221 17,868 20,653 22,507 1.84%
Grain 15,247 19,075 19,574 21,374 1.89%
Distilled or blended liquors 15,245 16,819 17,644 19,875 1.48%
Gravel or sand 7,460 9,473 11,812 13,914 3.52%
Warehouse and distribution centers 3,613 3,957 4,395 5,911 2.77%
Misc. field crops 3,343 3,430 3,641 4,318 1.43%
Petroleum refining products 2,179 2,578 2,505 2,135 -0.11%
Oil kernels, nuts, or seeds 2,172 1,838 1,976 2,224 0.13%
Dairy farm products 1,980 2,088 2,128 2,201 0.59%
Livestock 1,503 1,561 1,727 1,996 1.59%
CAGR: compound annual grow th rate
Source: IHS Transearch 2012
(Tons in thousands)
Top inbound Minnesota commodities carried by truck
Truck trade flows with Minnesota destinations
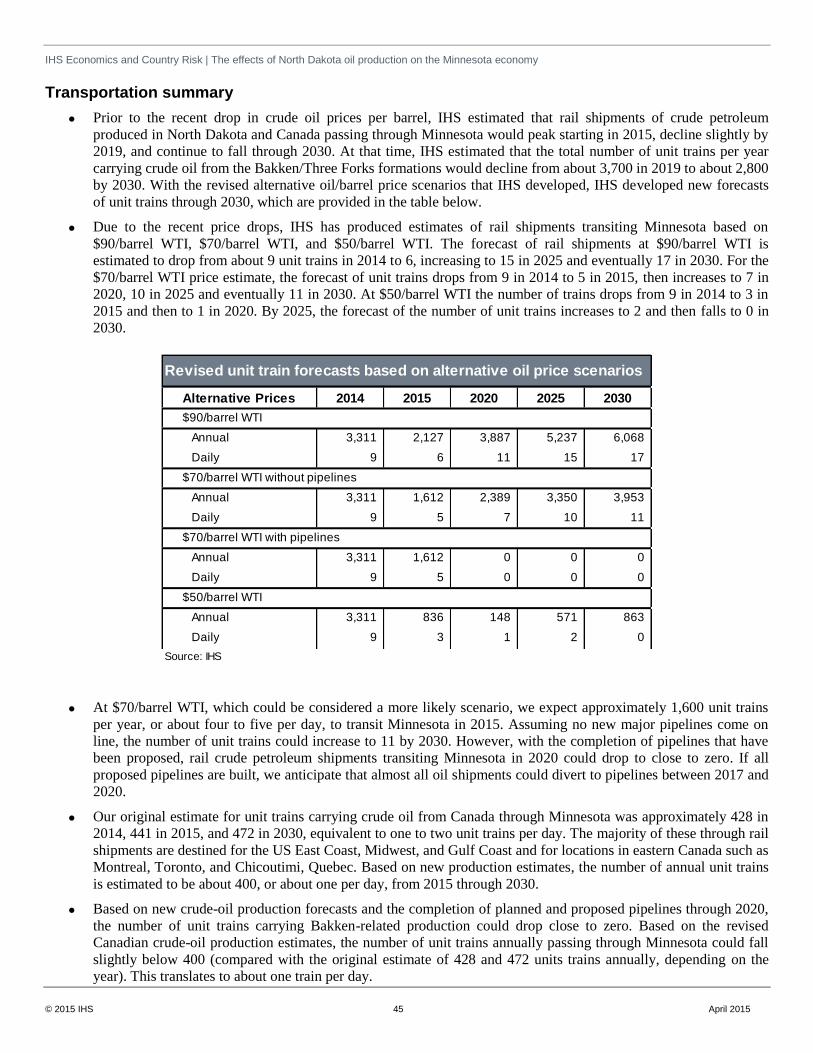
IHS Economics and Country Risk | The effects of North Dakota oil production on the Minnesota economy
© 2015 IHS 45 April 2015
Transportation summary
Prior to the recent drop in crude oil prices per barrel, IHS estimated that rail shipments of crude petroleum
produced in North Dakota and Canada passing through Minnesota would peak starting in 2015, decline slightly by
2019, and continue to fall through 2030. At that time, IHS estimated that the total number of unit trains per year
carrying crude oil from the Bakken/Three Forks formations would decline from about 3,700 in 2019 to about 2,800
by 2030. With the revised alternative oil/barrel price scenarios that IHS developed, IHS developed new forecasts
of unit trains through 2030, which are provided in the table below.
Due to the recent price drops, IHS has produced estimates of rail shipments transiting Minnesota based on
$90/barrel WTI, $70/barrel WTI, and $50/barrel WTI. The forecast of rail shipments at $90/barrel WTI is
estimated to drop from about 9 unit trains in 2014 to 6, increasing to 15 in 2025 and eventually 17 in 2030. For the
$70/barrel WTI price estimate, the forecast of unit trains drops from 9 in 2014 to 5 in 2015, then increases to 7 in
2020, 10 in 2025 and eventually 11 in 2030. At $50/barrel WTI the number of trains drops from 9 in 2014 to 3 in
2015 and then to 1 in 2020. By 2025, the forecast of the number of unit trains increases to 2 and then falls to 0 in
2030.
At $70/barrel WTI, which could be considered a more likely scenario, we expect approximately 1,600 unit trains
per year, or about four to five per day, to transit Minnesota in 2015. Assuming no new major pipelines come on
line, the number of unit trains could increase to 11 by 2030. However, with the completion of pipelines that have
been proposed, rail crude petroleum shipments transiting Minnesota in 2020 could drop to close to zero. If all
proposed pipelines are built, we anticipate that almost all oil shipments could divert to pipelines between 2017 and
2020.
Our original estimate for unit trains carrying crude oil from Canada through Minnesota was approximately 428 in
2014, 441 in 2015, and 472 in 2030, equivalent to one to two unit trains per day. The majority of these through rail
shipments are destined for the US East Coast, Midwest, and Gulf Coast and for locations in eastern Canada such as
Montreal, Toronto, and Chicoutimi, Quebec. Based on new production estimates, the number of annual unit trains
is estimated to be about 400, or about one per day, from 2015 through 2030.
Based on new crude-oil production forecasts and the completion of planned and proposed pipelines through 2020,
the number of unit trains carrying Bakken-related production could drop close to zero. Based on the revised
Canadian crude-oil production estimates, the number of unit trains annually passing through Minnesota could fall
slightly below 400 (compared with the original estimate of 428 and 472 units trains annually, depending on the
year). This translates to about one train per day.
Alternative Prices 2014 2015 2020 2025 2030
Annual 3,311 2,127 3,887 5,237 6,068
Daily 9 6 11 15 17
Annual 3,311 1,612 2,389 3,350 3,953
Daily 9 5 7 10 11
Annual 3,311 1,612 0 0 0
Daily 9 5 0 0 0
Annual 3,311 836 148 571 863
Daily 9 3 1 2 0
Source: IHS
Revised unit train forecasts based on alternative oil price scenarios
$90/barrel WTI
$70/barrel WTI without pipelines
$70/barrel WTI with pipelines
$50/barrel WTI

IHS Economics and Country Risk | The effects of North Dakota oil production on the Minnesota economy
© 2015 IHS 46 April 2015
Grain, along with other agricultural commodities (e.g., oil kernels, nuts, or seeds; soybean oil and by-products; and
corn) and iron ore, will constitute high shares of Minnesota’s outbound commodity shipments by rail and truck
through 2030. Accommodating these demands, along with the continuing high demands for unit trains to carry
crude oil, will require rail and highway system capacity expansions that ensure reliable and timely shipments of all
commodity types.
We anticipate growth of gravel and sand and stone-related commodities shipped by rail and truck to North Dakota
as well as other Midwest locations. This reflects the US economic recovery and indicates a growing demand for
frac sand and construction materials in North Dakota.
The Twin Cities are a significant intermodal hub for national, interregional, and regional shipments and for
warehousing. The North Dakota oil developments present an opportunity for the Twin Cities to leverage and
maximize their role in providing intermodal connectivity and distribution services. This provides an opportunity
for Border Cities to identify sites that would facilitate rail car maintenance, manufacturing and parts assembly, and
supply chain management (e.g., warehouse and distribution centers).
The planning and potential programming of investments to improve Moorhead’s rail separations has been studied.3
With the increasing train traffic and concerns for safety, this should be revisited to implement tactics and strategies
that will alleviate congestion and ensure the safety of the city’s citizens. Moorhead has two BNSF lines, the KO
line and Prosper Lines, running parallel and in close proximity. Additionally, along a 17 block stretch from 20th
Street to 3rd Street, the City has a limited number of at grade crossings. Governor Dayton’s 2015 budget proposal
calls for strategic investments in Minnesota rail safety improvements, to ensure the safety of Minnesotans living
near railroads carrying hazardous materials. The proposal calls for funding 75 priority railway safety infrastructure
improvements of which three are located in the City of Moorhead (11th Street S; Main Avenue and 30th Avenue
S). Metropolitan wide planning provides the opportunity to advocate and prioritize transportation infrastructure
investments. The Fargo-Moorhead Metropolitan Council of Governments provides a forum for North Dakota and
Minnesota border communities (Fargo and Moorhead) to continue to elevate grade crossing improvements as
investment priorities for incorporation in either state’s Transportation Improvement Program.
3 Moorhead Downtown Grade Separation Study: Existing and Future Conditions Report, Executive Summary, City of Moorhead and the Fargo-
Moorhead Metropolitan Council of Governments, 2008, 2014

IHS Economics and Country Risk | The effects of North Dakota oil production on the Minnesota economy
© 2015 IHS 47 April 2015
Source: Minnesota Department of Transportation (top); Moorhead Downtown Grade Separation
Study: Existing and Future Conditions Report
Source: Minnesota Department of Transportation
Moorhead Rail Grade Separation Projects Moorhead Rail Grade Separation Projects

IHS Economics and Country Risk | The effects of North Dakota oil production on the Minnesota economy
© 2015 IHS 48 April 2015
Phase 3: Economic impacts
The purpose of this section is to present the economic impacts on the Minnesota economy generated by the oil production
activity occurring in the Bakken formation of western North Dakota and eastern Montana. The proximity of Minnesota to
the Bakken formation was shown above in the context map presented in the introduction. Impacts on the Five Border
cities and the counties they are in will be discussed as appropriate. The Five Border Cities, shown in the accompanying
map, are: 1) Breckenridge in Wilkin County; 2) Dilworth in Clay County; 3) East Grand Forks in Polk County; 4)
Moorhead in Clay County; and 5) Ortonville in Big Stone and Lac qui Parle counties. The economic impacts occurring in
Minnesota will be based on only those effects that can be directly attributed to the production of oil in the Bakken
formation, such as purchases of goods and services from Minnesota companies, or changes in the basis price of agricultural
commodities due to competition for scarce rail capacity.
On 9 May 2013, the MinnPost Business section ran an article with the headline, “New N.D. oil projections offer
opportunities for Minnesota businesses” citing western North Dakota’s need for “infrastructure like housing, hotels, retail
stores and other services” as an opportunity for Minnesota businesses.4 A year later, Jeff Johnson, publisher of the
Minnesota Real Estate Journal, was quoted as saying, “The opportunities are almost limitless—and it is not too late to get
involved […] North Dakota and the Bakken are still in the early stages of growth and prosperity, and there are many
opportunities to profit—either directly with business ventures in the region or by investing in the ventures already in
place.”5 As of early 2015, decreased oil prices have begun to lower exploration and drilling activity in the Bakken oil field,
local communities face increased health and safety risks because of a lack of preparedness for continued oil train traffic,
4 http://www.minnpost.com/business/2013/05/new-nd-oil-projections-offer-opportunities-minnesota-businesses
5 http://www.rejournals.com/2014/05/28/opportunities-abound-in-north-dakotas-bakken-region-minnesota-real-estate-journal-to-hold-bakken-
investing-conference-this-june/#sthash.4pYwxs3e.dpuf

IHS Economics and Country Risk | The effects of North Dakota oil production on the Minnesota economy
© 2015 IHS 49 April 2015
and local business owners complain of the Bakken “stealing qualified workers.” Many are questioning the nature and
extent of the long-term impact of North Dakota’s Bakken oil production on the Minnesota economy. The economic impact
assessment below considers the long-term economic impacts in Minnesota by analyzing four different years in which the
composition of total direct spending in North Dakota for capital equipment (capex) and operating expenditures (opex) that
support crude oil production changes as exploration and drilling activity declines.
As the level of oil production, and accompanying capex and opex spending, in North Dakota began to accelerate in 2007,
its influence began to be seen in the counties of western Minnesota located along the border with North Dakota. Some of
the Bakken crude oil started to be sent east on railroad unit trains through Minnesota to processing locations. Communities
located along the main rail routes experienced increases in the number of unit trains passing through their communities.
The increased rail traffic was especially significant in communities located along the main rail lines such as Moorhead. As
oil production levels grew rapidly, large numbers of high-paying jobs were created in the Bakken, which began to attract
nonresident workers, including those living in western Minnesota counties. The rapid economic growth in North Dakota
increased the level of state tax revenues, enabling it to keep state-level tax rates low, spend money to improve
infrastructure, and offer economic incentives for existing and new businesses.
The forecast of North Dakota oil production, phase 1 of this study, described the sudden and large drop in the price of
crude oil that has occurred since early summer of 2014. The benchmark West Texas Intermediate (WTI) price for crude oil
has fallen from $107 per barrel in the third week of June 2014 to $44 per barrel during the last week of January 2015, a
decline of 59%. The price drop has begun to reduce the level of exploration and drilling activity in the Bakken formation,
which will lead to lower levels of capital (capex) and operating (opex) spending in North Dakota over the next several
years. The direct spending reductions, in turn, will affect the level of the economic impact on the Minnesota economy as
fewer goods and services, as well as labor, will be obtained from Minnesota companies and households.
Economic structure and performance
The following section describes economic characteristics and recent performance of Minnesota and the five counties with
Border Cities. Because more detailed socioeconomic data, such as employment, income, and gross county product, is
available for counties than for cities and towns, the economic analysis below will present data for the five counties that
have Border Cities. Information and analyses are used to: 1) derive the economic impacts, and 2) to identify, describe, and
derive opportunities, problems, and expectations presented in the Phase 4 analysis.
Minnesota
Economic characteristics
According to IHS’s Business Market Insights (BMI) data base, total 2014 nonfarm employment in Minnesota was 2.98
million jobs, having grown at a compound annual growth rate (CAGR) of 0.3% between 2004 and 2014. The largest
employment growth between 2004 and 2014 occurred in education services; healthcare and social assistance; arts,
entertainment, and recreation; and management of companies. Employment declined in eight sectors, with the largest
declines in information and manufacturing at annual rates of -1.8% and -1.6%, respectively.
At the two-digit NAICS level, the largest employment sectors in 2014 were healthcare and social assistance, retail trade,
and accommodations and food services. The goods-producing sector (e.g., agriculture, mining, construction, and
manufacturing) accounted for 17.6% of total Minnesota employment in 2014, which is well above the US figure of 15.3%.
By contrast, the private-services sector (i.e., all sectors excluding goods-producing and government) represented 68.5% of
total Minnesota employment in 2014, slightly below the US share of 69.4%.

IHS Economics and Country Risk | The effects of North Dakota oil production on the Minnesota economy
© 2015 IHS 50 April 2015
The distribution of Minnesota employment by two-digit NAICS code shows the state’s diverse economy. Nine private-
sector industry groups had employment location quotients (LQs) above 1.0 in 2014. A location quotient is the ratio of an
individual economic sector’s share of total Minnesota employment divided by its share of total US employment. An LQ
greater than 1.0 means Minnesota had an above-average concentration of employment, and likely economic activity, in that
sector when compared with the US economy. Sectors with high LQs are those for which the state likely has competitive
advantages. The five sectors with the highest employment LQs were management of companies; agriculture, forestry, and
fisheries; manufacturing; utilities; and healthcare and social assistance. The lowest LQ was in mining at 0.35, indicating
that mining, while important in Northeast Minnesota, doesn’t have a strong presence statewide. There is no extraction of
oil or natural gas in Minnesota, but silica sand, which is used in fracking, is an emerging mining industry in the
southeastern part of the state.
Comparative performance
Minnesota’s economy has outperformed most other states from 2007 to the present, excluding the unique situation that
occurred in North Dakota as oil production in the Bakken formation began to increase rapidly. Minnesota’s performance,
and rank across the 50 states and the District of Columbia, based on the percent change between 2007 and 2014 is
summarized here:
Total employment: 1.9% increase; ranked 17th
Manufacturing employment: 7.6% decline, ranked 17th
Personal income: 22.5% increase, ranked 28th
Gross state product per capita: 18.9% increase, ranked 12th
Labor force: 3.0% increase, ranked 20th
Population: 4.8% increase, ranked 29th.
Sector2014
Employment%
CAGR 2000
to 2014
Location
quotient -
2014
2014
Employment%
CAGR 2000
to 2014
Location
quotient -
2014
11 Agri., Forestry, Fishing and Hunting 93,888 3.2% -0.97% 1.43 4,905 10.5% -1.2% 4.77
21 Mining 6,109 0.2% -1.19% 0.35 41 0.1% -3.2% 0.15
22 Utilities 13,083 0.4% 0.13% 1.17 34 0.1% -1.5% 0.19
23 Construction 108,485 3.6% -0.64% 0.87 1,698 3.6% -0.6% 0.87
31-33 Manufacturing 314,911 10.6% -1.64% 1.27 2,529 5.4% -1.0% 0.65
42 Wholesale Trade 134,762 4.5% 0.32% 1.12 2,284 4.9% 1.7% 1.22
44-45 Retail Trade 288,559 9.7% -0.44% 0.92 4,539 9.7% -1.6% 0.93
48-49 Trans. & Warehng. 135,862 4.6% -0.66% 0.83 2,015 4.3% 0.4% 0.79
51 Information 53,409 1.8% -1.84% 0.96 401 0.9% -1.9% 0.46
52 Finance & Insurance 139,728 4.7% 0.56% 1.17 860 1.8% 0.4% 0.46
53 Real Estate, Rental & Leasing 40,602 1.4% 0.93% 0.96 457 1.0% 3.9% 0.69
54 Prof., Scientific, and Tech. Svcs. 136,988 4.6% 0.60% 0.81 1,104 2.4% 3.1% 0.41
55 Mgmt. of Companies 78,569 2.6% 1.29% 1.81 320 0.7% 5.6% 0.47
56 Admin. & Waste Mgmt. Services 138,067 4.6% 0.57% 0.78 909 2.0% 5.1% 0.33
61 Educational Services 69,013 2.3% 3.58% 1.00 2,474 5.3% 1.9% 2.29
62 Health Care & Social Assistance 433,310 14.6% 3.10% 1.17 7,316 15.7% 3.6% 1.26
71 Arts, Enter., & Recreation 42,007 1.4% 1.74% 1.01 259 0.6% -2.3% 0.40
72 Accommodation & Food Svcs. 214,887 7.2% 0.93% 0.84 3,153 6.8% -0.1% 0.78
81 Other Svcs. 118,826 4.0% 0.26% 1.06 1,920 4.1% -0.9% 1.09
Federal Government 30,888 1.0% -1.11% 0.56 300 0.6% -3.5% 0.34
State Government 89,710 3.0% 0.56% 0.86 2,305 5.0% 0.0% 1.41
Local Government 295,366 9.9% 0.17% 1.01 6,731 14.5% -0.5% 1.47
Total All Sectors 2,977,029 100.0% 0.3% 46,554 100.0% 0.2%
CAGR: compound annual grow th rate
Employment growth and distribution
Minnesota Border Cities and their respective counties
Gray cells identify sectors w ith location quotients > 1.0
Source: IHS, Business Market Insights data base, 2014.

IHS Economics and Country Risk | The effects of North Dakota oil production on the Minnesota economy
© 2015 IHS 51 April 2015
By contrast, North Dakota ranked first in percent increases in employment, personal income, and gross state product per
capita; second in population; and third in labor force. Minnesota’s economic performance between 2007 and 2014 was
generally higher than in Iowa, Wisconsin, and the United States as shown in the accompanying table.
Structural diversity
IHS measured the diversity of Minnesota using the Shannon-Weaver index of structure diversity.6 The Shannon-Weaver
index ranges from a maximum value of 1.0 for an economy with the highest level of structural diversity, as measured by
employment shares by detailed economic sector, down to 0 for an economy with no diversity (i.e., an economy with only
one industry sector). The state-level Shannon-Weaver index values in 2012 ranged between 0.610 for the District of
Columbia to just over 0.761 for Wisconsin. The corresponding 2012 index values for Minnesota and North Dakota were
0.751 and 0.712, confirming that Minnesota’s economy is substantially more diverse than North Dakota’s, but slightly less
diverse than Wisconsin’s. A higher diversity index value indicates two things when considering economic impacts: 1) the
economy produces a wider range of goods and services, with economic activity being more equally distributed across the
individual subsectors; and 2) the indirect and induced multiplier effects generated by new economic activity will be higher
as more of the required intermediate inputs can purchased locally.
6 The Shannon-Weaver index of structure diversity is calculated by the Minnesota IMPLAN Group (MIG) and is included in its state-level models.
Measure Minnesota North Dakota Iowa Wisconsin South Dakota US
2014 Level (thousands) 2,823.8 464.3 1,550.6 2,863.0 421.2 138,839.1
CAGR 2007 to 2014 (%) 0.3 3.8 0.3 (0.1) 0.5 0.1
% change 2007 to 2014 1.9 29.6 2.1 (0.6) 3.6 0.8
Rank for % change 17 1 15 32 8 NA
2014 Level (thousands) 315.6 25.5 215.0 466.6 42.4 12,125.2
CAGR 2007 to 2014 (%) -1.1 -0.3 -0.9 -1.0 0.1 -1.9
% change 2007 to 2014 -7.6 -2.3 -6.4 -6.9 0.8 -12.5
Rank for % change 17 4 10 13 2 NA
2014 Level (thousands) 265,386.3$ 40,727.4$ 140,668.6$ 256,771.5$ 39,669.0$ 14,704,694.2$
CAGR 2007 to 2014 (%) 2.9 8.1 3.5 2.8 4.4 3.0
% change 2007 to 2014 22.5 72.5 27.3 21.5 34.8 22.6
Rank for % change 28 1 12 33 5 NA
2014 Level (millions of $) 59,185$ 81,936$ 54,768$ 50,563$ 56,030$ 54,376$
CAGR 2007 to 2014 (%) 2.5 9.2 2.7 2.2 3.3 1.9
% change 2007 to 2014 18.9 85.1 20.1 16.1 25.6 13.9
Rank for % change 12 1 8 23 5 NA
2014 Level (thousands) 2,991.8 410.0 1,698.5 3,081.6 452.2 155,831.9
CAGR 2007 to 2014 (%) 0.4 1.6 0.3 -0.1 0.4 0.3
% change 2007 to 2014 3.0 11.9 1.9 -0.5 2.9 2.4
Rank for % change 20 3 25 39 21 NA
2014 Level (thousands) 5,461.6 741.2 3,109.0 5,759.7 854.2 319,158.3
CAGR 2007 to 2014 (%) 0.7 1.8 0.5 0.4 1.1 0.8
% change 2007 to 2014 4.8 13.4 3.6 2.6 7.8 5.8
Rank for % change 29 2 35 40 16 NA
CAGR: compound annual grow th rate
Gross State Product per capita
Labor Force
Population
Comparative economic performance from 2007 to 2014
Tota non-farm Employment
Manufacturing Employment
Personal Income
Sources: Employment: Bureau of Labor Statistics, Current Employment Statisticcs, 2015. Personal income: IHS, US Regional Service, 2015. Gross
State Product: IHS, US Regional Service, 2015. Labor Force: Bureau of Labor Statistics, Local Area Unemployment Statistics, 2015. Population:
IHS, US Regional Service, 2015.

IHS Economics and Country Risk | The effects of North Dakota oil production on the Minnesota economy
© 2015 IHS 52 April 2015
Border Cities and their respective counties
The accompanying map shows the location of the five Border Cities and counties they are located in.
Border Cities legislation
Minnesota first passed legislation in 1987 to allow the establishment of enterprise zones (Minnesota Statutes 469.166
through 469.1735) in five Border Cities, and provided a variety of economic incentives that were available in the zones
(e.g., disparity reduction property tax credits, debt financing for new construction, sales tax credits, and tax credits for new
job creation). The five Border Cities and the counties they are in are 1) Breckenridge in Wilkin County; 2) Dilworth in
Clay County; 3) East Grand Forks in Polk County; 4) Moorhead in Clay County; and 5) Ortonville in Big Stone and Lac
qui Parle counties. Note that the enactment of the initial Border Cities legislation occurred well before North Dakota oil
production began to grow rapidly in 2008, suggesting that concerns about the ability of the Border Cities and the counties
they are in to compete economically with the adjacent cities and counties in North Dakota has been a concern for many
years. The strong economic growth in North Dakota due to oil production, and accompanying high growth rate in state tax
revenues that has enabled North Dakota to lower state and local taxes and to improve the quality of infrastructure and
public services, has only heightened this concern.
The legislation specifies the number of development zones, and the maximum total acreage of the zones that be established
in each Border City; for example Breckenridge and East Grand Forks may designate their entire city as a development
zone. The location of the five Border Cities and the counties they are in are shown in the location map presented above.
The five Border Cities are located approximately 300 miles from the Bakken; the one-way driving distance between
Moorhead and Williston according to Google Maps is 394 miles. The long distance indicates that the five Border Cities
and the counties they are in are located too far from the Bakken to be suppliers of goods and services where close
proximity to the supplier is essential and too far for daily commuting by workers.
Economic characteristics
The economic structure of the five counties (e.g., Big Stone, Clay, Lac qui Parle, Polk, and Wilkin) that contain the five
Border Cities is very different from the structure of the statewide economy. The combined economy of the five counties is
quite small with a total 2014 employment of 46,554 jobs, or 1.6% of the statewide total. Their economy is not as diverse as
the state’s with only five private-sector industries having employment LQs above 1.0. As expected, the highest
employment LQ was in agriculture at 4.72, followed by education services at 2.29, and healthcare and social assistance at
1.26. The lowest LQs were in mining; utilities; and administrative and waste management services. The LQs for
manufacturing and for most of the private, services-providing sectors that would support business activity range between
0.3 and 0.8, suggesting that five counties that include Border Cities are unlikely to be major providers of goods and
services used in the Bakken, especially if size, specialization, and wide range of products and services are required.
Fargo, in Cass County, North Dakota, is located directly across the Red River from the city of Moorhead. Fargo is North
Dakota’s largest city with a 2013 population of 113,658 persons, compared with 39,398 persons for Moorhead. Clay
County, Minnesota, and Cass County, North Dakota comprise the Fargo-Moorhead Metropolitan Statistical Area (MSA).
An MSA is a single functional economic area defined primarily by commuting patterns, so the cost of living and wage
levels are generally the same within it. Utility, land, and housing prices will vary based on locational attributes. Two main
rail lines of the BNSF Corporation (formerly called the Burlington Northern and Santa Fe Railway) run north-south and
east-west through the Fargo-Moorhead MSA.
Commuting
One of the issues raised during the workshop in Moorhead was the out-migration and out-commuting by resident workers
of the five counties that include Border Cities to take high-paying jobs in the Bakken formation. IHS analyzed commuting
and migration patterns by using the Census Bureau’s On the Map database, which has commuting patterns for 2011 and
American Community Survey (ACS) data on out-migration from the five counties that include Border Cities to the Bakken
counties between 2008 and 2012. We found that:
There was comparatively little commuting from the five border counties to the Bakken counties in 2011, likely
because of the long distances. The On the Map database showed only 155 persons commuting from Clay County
to North Dakota’s Bakken counties in 2011 and very few from the other four counties that include Border Cities.

IHS Economics and Country Risk | The effects of North Dakota oil production on the Minnesota economy
© 2015 IHS 53 April 2015
Local employers indicated the most common practice is for resident workers to work in the Bakken for 10 days or
2 weeks at a time, return home for a similar period, and then return. Unfortunately, the data in the On the Map
database primarily captures daily commuting. The level of weekly or biweekly commuting has likely increased
from 2012 onward as the production levels in the Bakken rose sharply.
State-level analysis showed that 34,033 residents of Minnesota commuted to North Dakota in 2011, whereas only
1,096 workers traveled to the Bakken counties in North Dakota and Montana.
According to the ACS, between 2008 and 2012 a total of 3,101 residents of the five counties that include Border
Cities migrated to North Dakota; most went to Fargo and only 55 moved to the Bakken counties.
Given the atypical commutes of Minnesota residents who work in the Bakken, normal data sources may not capture their
movements, nor are they captured in migration data as these workers typically do not change their place of residence.
Minnesota has reciprocity with North Dakota for the personal income taxes; therefore, Minnesota’s resident commuters do
not affect the income taxes collected by Minnesota. If the commuting workers make more in North Dakota than they would
have working in Minnesota, then income tax revenues received by Minnesota would increase.
The “edge” effect and differences between Minnesota and North Dakota
As the five Border Cities and the counties that include Border Cities are located directly across the Red River from North
Dakota, they are most directly affected by differences in the levels of tax, cost of doing business, regulations, and range of
available economic incentives that are determined by state policy. Differences in these variables can be the deciding factor
in decisions by businesses and households to locate in Minnesota or North Dakota due to an “edge effect.” For example, a
business or a household could first decide that the Fargo-Moorhead MSA is the preferred location for them; differences in
state-level variables would then be a factor in determining whether they select Minnesota or North Dakota. Other local
factors will also influence their decision such as land and housing costs, local real property tax rates, amenities, quality of
public services including education, and site characteristics. The edge effect is especially acute in Moorhead, which is
located across the Red River from Fargo, North Dakota’s largest city.
Comparative socioeconomic characteristics
IHS compiled a set of socioeconomic and demographic characteristics for Minnesota, North Dakota, Cass County in North
Dakota, and five counties that include Border Cities in Minnesota, in the following table. The objective of this analysis is
to identify differences and similarities across the eight geographies for key variables that describe the existing situation
(i.e., the “S” in the SCOPE analysis), and the context (i.e., the “C” in the SCOPE analysis).
The urban character of Cass County, North Dakota, is evident when comparing its values with Clay County, Minnesota
and the other four counties that include Border Cities, especially population density, education attainment, retail sales, and
average annual wage. The effects of the strong economic growth in North Dakota are evident is its high employment and
per capita personal income growth rates. It is interesting to note that per capita personal income is higher in North Dakota
than Minnesota, while the median household income is higher in Minnesota. The high level of per capita personal income
in North Dakota is indicative of a “wealth effect” in that its residents now have significant levels of disposable income.
The wealth effect is further confirmed by the high level of retail spending per capita in North Dakota, suggesting that
Minnesota has an opportunity to attract this spending, as it offers a wider array goods and services.
The five counties that include Border Cities and Cass County, North Dakota have a lower cost of living than in other large
cities in Minnesota and North Dakota, and they are well below the statewide levels. Similarly, average wage levels are
lower in the five counties that include Border Cities than in Cass County, and in turn the six counties have wage levels well
below their respective statewide figures.
Minnesota has a highly educated labor force as 32.6% of its residents 25 years and older have a bachelor’s degree or
higher, with 10.7% having advanced degrees; the corresponding figures for North Dakota are 27.2% and 7.6%,
respectively. Cass County, North Dakota, and Clay County, Minnesota, also have above-average levels of educational
attainment as 37.2% and 30.3%, respectively, of their residents 25 years and older have a bachelor’s degree or higher.

IHS Economics and Country Risk | The effects of North Dakota oil production on the Minnesota economy
© 2015 IHS 54 April 2015
Labor market characteristics
The accompanying table presents wage levels and growth rates in Minnesota and North Dakota for the oil and gas
extraction sector, construction, selected manufacturing sectors that either provide inputs to oil and gas activities or are
potential users of crude oil (e.g., petroleum and coal, chemicals), and selected service sectors that support oil and gas
activity. The impact of the oil and gas production in the Bakken is clearly shown by the fact that the average annual growth
rate in wages in North Dakota was higher than the growth rate in Minnesota for almost all of the economic sectors. For
example, average annual pay in the natural resources and mining sector in North Dakota grew at an average annual rate of
8.6% compared with 3.6% in Minnesota. Similarly, average annual pay in construction rose at an annual rate of 6.8% in
North Dakota compared with 1.3% in Minnesota. The level of average annual pay in the goods-producing sector in North
Dakota in 2013 was 13.2% higher than in Minnesota. In virtually all of the sectors where the average annual pay in
Minnesota in 2013 was still higher than in North Dakota, the percent differences declined over the six-year period.
Indicator Big Stone, MN Clay, MNLac qui
Parle, MNPolk, MN Wilkin, MN Cass, ND MN ND
Population 5,209 59,638 7,184 31,522 6,576 154,080 5,347,740 689,781
CAGR 2004 to 2013 -0.8% 1.3% -0.8% 0.1% -0.3% 2.0% 0.5% 0.9%
Populaiton 16 years and older 4,264 47,252 5,867 24,986 5,141 123,691 4,212,737 553,026
% in labor force 58.4% 72.1% 62.8% 66.8% 67.6% 76.5% 70.3% 70.5%
Popuulation 25 years and older 3,837 35,642 5,273 20,888 4,574 95,521 3,562,331 450,429
% high school graduate or higher 96.8% 94.9% 94.2% 94.6% 89.9% 96.8% 92.8% 95.4%
% Bachelor's degree or higher 17.6% 30.3% 17.6% 21.9% 16.5% 37.2% 32.6% 27.2%
% with advanced degrees 4.3% 8.5% 3.8% 6.9% 4.7% 11.3% 10.7% 7.6%
Number of Households 2,347 22,463 3,074 12,663 2,685 65,816 2,107,232 287,270
Population density (persons/sq. mile in 2010) 10.6 56.4 3.1 16.0 8.8 84.9 66.6 9.7
% renter occupied housing units 19.9% 30.7% 17.4% 29.3% 22.7% 46.6% 29.5% 33.9%
Median housing value $91,300 $155,200 $80,200 $128,100 $107,300 $158,900 $187,900 $132,400
Median Household Income $46,313 $52,410 $48,468 $50,695 $50,507 $52,590 $59,836 $53,741
Per capita personal income $50,450 $39,180 $55,500 $44,350 $50,880 $46,720 $47,320 $53,040
CAGR 2003 to 2013 6.2% 4.1% 7.9% 4.8% 2.5% 3.9% 3.0% 6.0%
Average annual wage $32,190 $37,360 $30,710 $35,400 $25,400 $44,920 $49,110 $46,990
CAGR 2003 to 2013 3.8% 1.9% 3.1% 2.9% 5.4% 3.8% 2.6% 5.7%
Number of business establishments 642 2,356 1,088 2,423 662 6,905 240,139 54,904
Retail sales (millions of $) $41 $678 $75 $424 $76 $4,778 $80,567 $15,878
per capita $7,936 $11,375 $10,415 $13,452 $11,568 $31,013 $15,066 $23,019
Total non-farm Employment (2014) 3,047 21,631 3,783 14,744 3,349 116,660 2,977,029 521,566
CAGR 2004 to 2014 1.3% 0.5% 0.6% 0.1% 2.1% 2.5% 0.5% 3.2%
Labor force NSA, Nov. 2014 2,638 35,835 4,053 18,316 3,899 88,751 2,985,228 413,341
Change last 10 years -132 5,276 65 1,274 255 8,344 95,690 65,468
% Change last 10 years -4.8% 17.3% 1.6% 7.5% 7.0% 10.4% 3.3% 18.8%
Unemployment rate NSA 3.2% 2.2% 3.1% 3.2% 2.5% 2.2% 3.7% 2.8%
Fargo-Moorhead MSA 94.1 94.1
Minneapolis,MN 107.00
St. Paul, MN 105.8
Bismarck, ND 100
Minot, ND 105.4
Average for all 264 metros = 100.0
CAGR: compound annual grow th rate
NSA: not seasonally adjusted
All f igures are for calendar year 2013 unless noted otherw ise.
Sources: Demographics and housing, and median household income: Bureau of the Census, 2009-2013 American Community Survey, 2015. Per capita personal income, average annual
w age, and retail sales: IHS, US Regional Service, 2015. Number of establisments: IHS, Business Market Insights database, 2015. Labor force and unemployment rates: Bureau of Labor
Statistics, Local Area Unemployment Rates, 2015. ACCRA Cost of Living: ACCRA, 2015.
ACCRA Cost of Living 2014q3
Economic and social Indicators
Demographics
Housing
Income and wages
Employment and labor force

IHS Economics and Country Risk | The effects of North Dakota oil production on the Minnesota economy
© 2015 IHS 55 April 2015
IHS also analyzed trends in median hourly wage levels by occupation for the Fargo-Moorhead and Minneapolis-St. Paul
MSAs, the far-western nonmetropolitan part of North Dakota where the Bakken is located, and the United States. Based on
our recent work in other similar studies, we identified the detailed, core occupations that are used in either the extraction of
oil and natural gas, or in its supply chain, and then determined changes in wage levels for the major occupational
categories of which they were a part. The accompanying table further confirms the strong effect that North Dakota oil
production has had on rising wage levels.
Between 2007 and 2013, the CAGR in the median hourly wage level for the far-western North Dakota region was higher in
the seven major occupational categories for which data were available than it was in both the Fargo-Moorhead and
Minneapolis-St. Paul MSAs. Median hourly wages in 2013 in the Fargo-Moorhead MSA were lower in six of the major
occupational categories than they were in western North Dakota; the only exception was in business and financial
operations, where they were very similar. Interestingly, the annual growth rate of median hourly wages in the Minneapolis-
St. Paul MSA was lower across the major occupational categories than it was in the Fargo-Moorhead MSA and far-western
North Dakota. One conclusion from this analysis is the counties that include Border Cities, including Cass County, North
Dakota, have an advantage compared with the Bakken region in terms of wage costs, especially for construction and
extraction; installation, maintenance, and repair; production; and transportation and material-moving occupations.
A recent study prepared by the Minneapolis Federal Reserve bank found that the high wages being paid in the Bakken
formation increased average weekly wages out to a radius of 100 miles, and also reduced the unemployment rate. There
was no effect on wages or the unemployment rate beyond this distance. As result, it is unlikely that the Bakken is having a
significant impact on overall wage levels and the unemployment within the five Border Cities and the counties that include
them.
Sector MinnesotaNorth
DakotaMinnesota
North
DakotaMinnesota
North
Dakota
Goods-producing $51,090 $42,551 $58,113 $66,981 2.2% 7.9%
Natural resources and mining $35,621 $54,833 $44,150 $89,901 3.6% 8.6%
NAICS 211 Oil and gas extraction NA $79,186 NA $111,427 NA 5.9%
Construction $53,161 $40,533 $57,337 $60,220 1.3% 6.8%
Manufacturing $52,300 $40,170 $59,579 $48,103 2.2% 3.0%
NAICS 324 Petroleum and coal $85,266 NA $109,077 NA 4.2% NA
NAICS 325 Chemicals. $68,695 $40,577 $72,955 $62,007 1.0% 7.3%
NAICS 333 Machinery $54,931 $46,796 $62,295 $51,148 2.1% 1.5%
NAICS 336 Tran. Equip. $50,281 $37,063 $49,757 $41,923 -0.2% 2.1%
Service-providing $42,941 $30,503 $48,719 $42,811 2.1% 5.8%
Trade, transportation, and utilities $38,333 $31,525 $43,684 $46,965 2.2% 6.9%
Information $59,568 $47,410 $66,787 $55,795 1.9% 2.8%
Financial activities $70,572 $39,403 $81,220 $53,798 2.4% 5.3%
Professional and business services $60,495 $35,875 $69,386 $53,750 2.3% 7.0%
NAICS 541 Prof. & tech. svcs. $69,863 $43,096 $81,106 $67,293 2.5% 7.7%
Leisure and hospitality $15,683 $11,232 $17,826 $16,260 2.2% 6.4%
Total, all industries $44,645 $32,815 $50,476 $48,740 2.1% 6.8%
CAGR: compound annual grow th rate
Source: Bureau of Labor Statistics, 2015. Quarterly Census of Employment and Wages.
Average annual pay in selected economic sectors
2007 2013 CAGR 2007 to 2013
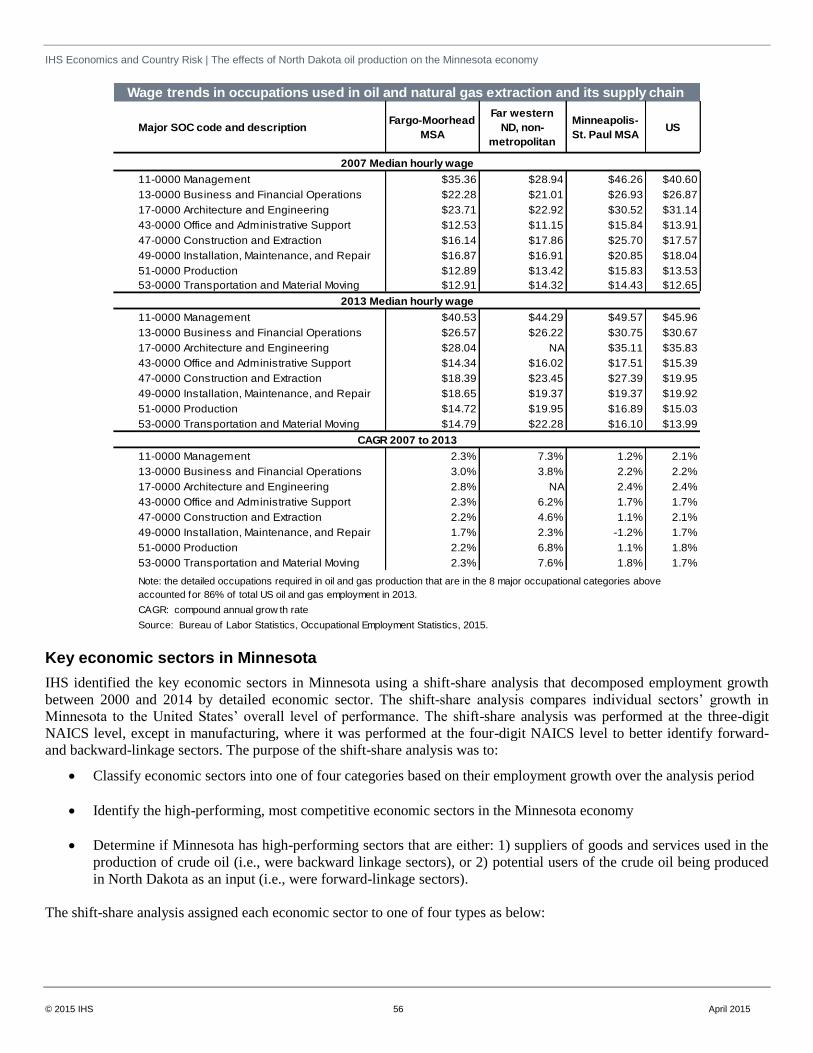
IHS Economics and Country Risk | The effects of North Dakota oil production on the Minnesota economy
© 2015 IHS 56 April 2015
Key economic sectors in Minnesota
IHS identified the key economic sectors in Minnesota using a shift-share analysis that decomposed employment growth
between 2000 and 2014 by detailed economic sector. The shift-share analysis compares individual sectors’ growth in
Minnesota to the United States’ overall level of performance. The shift-share analysis was performed at the three-digit
NAICS level, except in manufacturing, where it was performed at the four-digit NAICS level to better identify forward-
and backward-linkage sectors. The purpose of the shift-share analysis was to:
Classify economic sectors into one of four categories based on their employment growth over the analysis period
Identify the high-performing, most competitive economic sectors in the Minnesota economy
Determine if Minnesota has high-performing sectors that are either: 1) suppliers of goods and services used in the
production of crude oil (i.e., were backward linkage sectors), or 2) potential users of the crude oil being produced
in North Dakota as an input (i.e., were forward-linkage sectors).
The shift-share analysis assigned each economic sector to one of four types as below:
Major SOC code and descriptionFargo-Moorhead
MSA
Far western
ND, non-
metropolitan
Minneapolis-
St. Paul MSAUS
11-0000 Management $35.36 $28.94 $46.26 $40.60
13-0000 Business and Financial Operations $22.28 $21.01 $26.93 $26.87
17-0000 Architecture and Engineering $23.71 $22.92 $30.52 $31.14
43-0000 Office and Administrative Support $12.53 $11.15 $15.84 $13.91
47-0000 Construction and Extraction $16.14 $17.86 $25.70 $17.57
49-0000 Installation, Maintenance, and Repair $16.87 $16.91 $20.85 $18.04
51-0000 Production $12.89 $13.42 $15.83 $13.53
53-0000 Transportation and Material Moving $12.91 $14.32 $14.43 $12.65
11-0000 Management $40.53 $44.29 $49.57 $45.96
13-0000 Business and Financial Operations $26.57 $26.22 $30.75 $30.67
17-0000 Architecture and Engineering $28.04 NA $35.11 $35.83
43-0000 Office and Administrative Support $14.34 $16.02 $17.51 $15.39
47-0000 Construction and Extraction $18.39 $23.45 $27.39 $19.95
49-0000 Installation, Maintenance, and Repair $18.65 $19.37 $19.37 $19.92
51-0000 Production $14.72 $19.95 $16.89 $15.03
53-0000 Transportation and Material Moving $14.79 $22.28 $16.10 $13.99
11-0000 Management 2.3% 7.3% 1.2% 2.1%
13-0000 Business and Financial Operations 3.0% 3.8% 2.2% 2.2%
17-0000 Architecture and Engineering 2.8% NA 2.4% 2.4%
43-0000 Office and Administrative Support 2.3% 6.2% 1.7% 1.7%
47-0000 Construction and Extraction 2.2% 4.6% 1.1% 2.1%
49-0000 Installation, Maintenance, and Repair 1.7% 2.3% -1.2% 1.7%
51-0000 Production 2.2% 6.8% 1.1% 1.8%
53-0000 Transportation and Material Moving 2.3% 7.6% 1.8% 1.7%
CAGR: compound annual grow th rate
Source: Bureau of Labor Statistics, Occupational Employment Statistics, 2015.
Note: the detailed occupations required in oil and gas production that are in the 8 major occupational categories above
accounted for 86% of total US oil and gas employment in 2013.
Wage trends in occupations used in oil and natural gas extraction and its supply chain
CAGR 2007 to 2013
2013 Median hourly wage
2007 Median hourly wage

IHS Economics and Country Risk | The effects of North Dakota oil production on the Minnesota economy
© 2015 IHS 57 April 2015
A sectors: The sector’s employment CAGR in Minnesota between 2000 and 2014 was higher than its employment CAGR
at the US level, and it had a 2014 employment LQ greater than 1.0. These are the highest-performing sectors, and those for
which Minnesota may have a competitive advantage.
B sectors: The sector’s employment CAGR in Minnesota between 2000 and 2014 was higher than its employment CAGR
at the US level, but it had a 2014 employment LQ less than or equal to 1.0. Emerging sectors are often found among B
sectors.
C sectors: The sector’s employment CAGR in Minnesota between 2000 and 2014 was below the sector’s employment
growth rate at the US level, but it had a 2014 employment LQ greater than 1.0. These sectors are the traditionally important
sectors in a locality whose relative performance has declined, either because they are now slow-growth sectors at the US
level or because Minnesota no longer has strong competitive advantages in them.
D sectors: the sector’s employment CAGR in Minnesota between 2000 and 2014 was below the sector’s employment
growth rate at the US level, and it had a 2014 employment LQ less than or equal to 1.0. D sectors are the lowest-
performing sectors as they have both below-average performance levels and comprise below-average shares of the
Minnesota economy.
The following two tables summarize the results of the shift-share analysis by presenting the top-ten sectors in each shift-
share type based on 2014 employment. The A sectors include some expected sectors such as crop production, food
manufacturing, and education and healthcare. Also present are business-related services sectors such as insurance, credit
intermediation, and waste management and remediation services. The B sectors include truck transportation, construction,
telecommunications, general retail trade (possibly due to the presence of the Mall of America), and warehousing storage,
which is consistent with the Minneapolis-St. Paul MSA’s role as multi-state regional distribution center. Interestingly, the
B sectors also include chemicals, a possible user of refined oil products as an intermediate input.
The C sectors also have some expected sectors, such as management, animal production, and securities. More analysis of
the machinery sector is needed to see if it can provide the capital equipment required in oil production. Finally, the D
sectors are dominated by retail trade sectors; the one surprise is the presence of the large professional, scientific, and
technical services sector, which includes engineering design and environmental services.
Top 10 A sectors Top 10 B sectors
721 Accommodation 238 Specialty Trade Contractors
611 Educational Services 452 Retail Trade - General Merchandise Stores
622 Hospitals 484 Truck Transportation
623 Nursing & Residential Care Fac. 236 Construction of Buildings
562 Waste Mgt. & Remed. Services 448 Retail Trade - Apparel & Acc.
423 Merchant Wholesalers, Durable 517 Telecommunications
524 Insurance Carriers & Related Activities 492 Couriers and Messengers
111 Crop Production 325 Chemical mfg.
522 Credit Intermed. & Related Activities 493 Warehousing and Storage
311 Food mfg. 331 Primary Metal mfg.
Top 10 C sectors Top 10 D sectors
551 Management of Comp. & Ent. 541 Professional, Scientific, & Tech. Ser.
812 Personal & Laundry Services 621 Ambulatory Health Care Services
333 Machinery mfg. 445 Retail Trade - Food & Beverage
112 Animal Production 813 Religious, Civic, & Prof. Org.
712 Museums, Historical Sites 441 Retail Trade - Motor Vehicle & Parts
447 Retail Trade - Gasoline Stations 444 Retail Trade - Build. Mat. & Garden Eq.
425 Wholesale Electronic Markets 713 Amusement, Gambling, & Rec. Ind
523 Securities & Oth. Financial Invst. 722 Food Services & Drinking Places
485 Transit and Ground Passenger
Transportation453 Retail Trade - Misc. Stores
454 Retail Trade - Nonstore Retailers 446 Retail Trade - Health & Personal Care
Minnesota shift-share analysis
Note: shares of private sector employment are: A - 35.6%; B - 10.2%; C - 15.6%; and D - 19.4%
Source: IHS, Business Market Insights database, 2015. Analysis by IHS.

IHS Economics and Country Risk | The effects of North Dakota oil production on the Minnesota economy
© 2015 IHS 58 April 2015
The manufacturing shift-share results are consistent with and confirm Minnesota’s large medical device sector, and related
capabilities in instruments. The B sectors also contain advanced manufacturing subsectors such as pharmaceuticals, other
electrical equipment, aerospace, and engines. The C sectors contain, as expected, several subsectors involved in food
production. The presence of the agricultural, construction, and mining machinery subsectors suggests the presence of a
possible backward-linkage sector to support oil production; more analysis is needed to determine if companies in this
sector are currently meeting capex demands coming from the Bakken.
Backward-linkage sectors
The sectors that supply goods and services used in the production of crude oil are referred to as backward linkages. When
crude oil firms increase their levels of exploration, drilling, and production, they purchase the goods and services needed to
support these activities from their vendors. The goods and services used in the production of output in any economic
sector, such as crude oil, are also called intermediate inputs; they do not include labor compensation. The initial increase in
demands for goods and services from the backward-linkage sectors, and the subsequent purchases by suppliers from their
suppliers generate the indirect multiplier effect. The induced effects are generated by the expenditures of the new directly
hired workers, and the other workers hired by companies in the backward-linkage sectors.
A major objective of this study is to determine how the direct capex and opex spending levels under the three production
scenarios in North Dakota affect the Minnesota economy. We first identify the backward-linkage sectors that support crude
oil production, and then determine if they are present in Minnesota. These two steps determine the shares of the goods and
services required by oil producers in North Dakota that could potentially come from Minnesota. IHS identified the
backward-linkage sectors for crude oil production using several sources of information: 1) our work in other recent energy
impact studies; 2) an analysis of US input/output table coefficients, especially the use table for oil and natural gas
production; and 3) the expertise of our energy group. The accompanying table presents the backward-linkage sectors, with
the corresponding shift-share type presented for each one.
Top 5 A sectors Top 5 B sectors
3231 Printing and Related Support Activities 3254 Pharmaceutical and Medicine mfg.
3345 Navigational, Measuring, Electromedical,
and Control Instruments mfg.
3359 Other Electrical Equipment and
Component mfg.
3116 Animal Slaughtering and Processing 3262 Rubber Product mfg.
3391 Medical Equipment and Supplies mfg. 3364 Aerospace Product and Parts mfg.
3327 Machine Shops; Turned Product; and
Screw, Nut, and Bolt mfg.
3336 Engine, Turbine, and Power Transmission
Equipment mfg.
Top 5 C sectors Top 5 D sectors
3344 Semiconductor and Other Electronic
Component mfg.3363 Motor Vehicle Parts mfg.
3331 Agriculture, Construction, and Mining
Machinery mfg.3273 Cement and Concrete Product mfg.
3115 Dairy Product mfg. 3121 Beverage mfg.
3114 Fruit and Vegetable Preserving and
Specialty Food mfg.
3333 Commercial and Service Industry
Machinery mfg.
3321 Forging and Stamping3259 Other Chemical Product and Preparation
mfg.
Source: IHS, Business Market Insights database, 2015. Analysis by IHS.
Minnesota detailed manufacturing shift-share analysis
Note: the shares of mfg. employment are: A - 28.8%; B - 3.2%; C - 10%; and D - 3.7%

IHS Economics and Country Risk | The effects of North Dakota oil production on the Minnesota economy
© 2015 IHS 59 April 2015
The backward linkages are presented for five functional groups: capital goods, construction and wells services, logistics,
materials, and professional and other services. The shift-share classes as described above are presented for each individual
subsector; they show how well it has performed in the Minnesota economy. For example, under the capital goods
functional group, there are a number of potential backward-linkage sectors in durable manufacturing sectors (i.e., 3335,
3336, 3344, 3345, etc.) that are higher performers (i.e., are in shift-share classes A and B), suggesting that firms in these
sectors may be capable of supporting oil production activity. A number of the subsectors under the professional and other
services functional group are in shift-share class D; however, this does not mean that they are not capable of supporting oil
and gas production, only their relative economic performance in Minnesota over the last 14 years has not been as high in
other sectors. Selling services to support Bakken oil production could increase the relative performance of these sectors
(i.e., move them from a D to a C or a B).
In the economic impact assessment that follows, we assigned the capex and opex spending in North Dakota to the
appropriate backward-linkage sectors in the IMPLAN model.
Economic impacts of backward linkages
Methodology
IHS estimated the economic impacts of the oil production in North Dakota on Minnesota’s economy using three
identifiable and quantifiable spending effects:
The directed spending in North Dakota for capital investment (capex) and operating investment (opex) needed to
support crude oil production. Some portion of the capex and opex spending will be used to purchase goods and
services from Minnesota companies. Investment and operations spending in North Dakota and Minnesota
associated with the support of oil production
Description NAICS Code Shift-share
class Description
NAICS
Code
Shift-
share
class
Agric., Construction, and Mining Machinery Mfg. 3331 C General Freight Trucking 4841 B
Motor Vehicle and Motor Vehicle Parts wholesalers 4231 A Secialized Freight Trucking 4842 B
Machinery, Equip, & Supplies Wholesalers 4238 A
Power Boiler and Heat Exchanger Mfg. 332410 A Building Material and Supplies Dealers 4441 B
Metal Tank (Heavy Gauge) Mfg. 332420 A Steel Product Mfg. from Purchased Steel 3312 A
Cutting Tool and Machine Tool Accessory Mfg. 333515 A Wholesale Lumber and Construction Materials 4233 A
Turbine and Turbine Generator Set Units Mfg. 333611 B Wholesale Lumber and Construction Materials 4235 A
Speed Changer,High-Speed Drive, and Gear Mfg. 333612 B Wholesale Electric Goods 4236 A
Mechanical Power Transmission Equipment Mfg. 333613 B Wholesale Hardware, Plumbing and Heating Equip. 4237 A
Other Engine Equipment Mfg. 333618 B Chemical and Allied Products Merchant Wholesalers 4246 D
Pump and Pumping Equipment Mfg. 333911 A Construction Sand and Gravel Mining 212321 C
Air and Gas Compressor Mfg. 333912 A Industrial Gas Manufacturing 325120 B
Conveyor and Conveying Equipment Mfg. 333922 A Other Basic Inorganic Chemical Manufacturing 325180 B
Power-Driven Handtool Mfg. 333991 A Cement Manufacturing 327310 A
Other Electronic Component Mfg. 334419 C Ready-Mix Concrete Manufacturing 327320 A
Automatic Control Mfg. 334512 A Concrete Block and Brick Manufacturing 327331 A
Instr. for Controlling Indust. Process Variables 334513 A Iron and Steel Mills and Ferroalloy Manufacturing 331110 B
Totalizing Fluid Meter and Counting Device Mfg. 334514 A Aluminum Sheet, Plate, and Foil Manufacturing 331315 B
Analytical Laboratory Instrument Mfg. 334516 A Fabricated Pipe and Pipefitting Manufacturing 332996 C
Other Measuring and Controlling Device Mfg. 334519 A
Light Truck and Utility Vehicle Mfg. 336112 D Water, Sewage and Other Systems 2213 A
Heavy Duty Truck Mfg. 336120 D Warehousing and Storage 4931 B
Railroad Rolling Stock Mfg. 336510 D Insurance Carriers 5241 A
Constr., and Mining Machinery and Equip. Leasing 532412 D
Nonresidential Building Construction 2362 B Architectural, Engineering, and Related Services 5413 D
Utility System Construction 2371 D Mgmt. , Scientific, and Technical Consulting Svcs. 5416 D
Highway, Street, and Bridge Construction 2373 D Other Prof. Scientific & tech. Services 5419 D
Other Heavy and Civil Engineering Construction 2379 D Other Nonhazardous Waste Treatment & Disposal 562219 A
Foundation, Structure, and Building Exterior
Contractors
2381 B Comm. & Indust. Mach. & Equip. Repair &
Maintenance
811310 D
Building Equipment Contractors 2382 B
Other Specialty Trade Contractors 2389 B
Drilling Oil and Gas Wells 213111 NA
Support Activities for Oil and Gas Operations 213112 NA
Source: IHS, Busness Market Insights database, 2015
Backward linkage sectors by NAICS codes
Capital goods
Construction and well services
Professional and other services
Materials
Logistics

IHS Economics and Country Risk | The effects of North Dakota oil production on the Minnesota economy
© 2015 IHS 60 April 2015
Infrastructure spending in Minnesota to support the movement of crude oil coming from the Bakken
Agricultural losses incurred as a result of lower basis prices, which in turn are due to increased competition and
higher costs for rail capacity. The issue of the adverse effect on the basis price for agricultural commodities
produced in Minnesota due to competition with crude oil shipments for rail capacity was discussed at both
workshops.
IHS analyzed the economic impacts of three different oil production scenarios in North Dakota based on three different oil
price scenarios developed by the IHS Energy group. The production scenarios are described in detail in the Phase 1
report—Oil production forecasts for North Dakota. For example, IHS forecasts that in 2016 total direct spending in North
Dakota under the high scenario for capex and opex would be approximately $26.2 billion, compared with $16.7 billion and
$8.9 billion under the base and low-price scenarios. One of the challenges of this study was estimating oil production
levels in North Dakota as energy prices continued to fall throughout the second half of 2014. The Bakken formation was
especially difficult to forecast as global oil prices, such as the West Texas Intermediate price measure, fell below the break-
even price at which it was profitable to extract oil from the Bakken formation.
Study area
IHS used the IMPLAN input/output model to evaluate the regional economic impacts of direct spending from the Bakken
activities on the Minnesota economy. We complemented and adjusted, as appropriate, the model’s interstate purchasing
relationship (i.e., what share of goods and services needed for oil production in the Bakken would come from Minnesota
economic sectors) with expert knowledge of Bakken purchasing behavior. The IMPLAN model is based on an input-output
accounting of commodity flows within a regional economy that flow from producers to intermediate users to final
consumers. The model establishes a matrix of supply chain relationships between industries, households, and producers of
household goods and services.7 We generated a multi-region IMPLAN model using the following regions:
North Dakota
Minnesota
A separate aggregated model for the five counties that include Border Cities: Big Stone, Clay, Lac qui Parle, Polk,
and Wilkin. This model was used as a proxy for the five Border Cities because the IMPLAN model builds regions
from individual counties.
Years considered
7 Further details are available at www.implan.com.

IHS Economics and Country Risk | The effects of North Dakota oil production on the Minnesota economy
© 2015 IHS 61 April 2015
IHS estimated economic impacts for the following four years based upon annual forecasts and events in energy,
infrastructure, and agriculture. The purpose of analyzing the four years was to show how the impacts in Minnesota would
vary according to the level and composition (i.e., shares for capex and opex) of direct spending in North Dakota for oil
production.
2014: Base year of analysis. Agricultural basis prices experience their largest anticipated impact in 2014. Oil prices
were volatile throughout 2014. Future Bakken investment and production trends were established. Railway
operator BNSF makes substantial investment in rail upgrades to accommodate the combined demand from crude
oil and agriculture.
2016: High level of infrastructure spending as energy delivery company Enbridge is proposing to build the
Sandpiper pipeline across Minnesota to carry Bakken crude oil to Superior, Wisconsin.
2019: Bakken oil production growth peaks and the level of capital investment spending in North Dakota starts to
level off; by this time the agriculture pricing impacts are largely gone as infrastructure spending in prior years
reduces competition for rail capacity.
2030: Long-term view: North Dakota oil production has leveled off; capital expenditures taper off to about one-
third of current levels, while operations expenditures peak as a large number of producing wells reach their
maximum output.
The economic analysis was conducted using nominal prices as all cost and revenues values for the years after 2014 were
escalated using an inflation rate of 2% to account for increases in nominal prices over time.
Bakken oil production scenarios
The IHS Energy group closely followed the rapidly changing oil prices over the past six months and modeled three oil
production scenarios in North Dakota based on the price of oil, cost of production in the Bakken region, and transportation
prices from October 2014 through February 2015. Three scenarios of capital investment spending and operations and
maintenance spending were assessed based on total number of wells drilled, completed, and maintained from 2010 through
2030. Bakken spending in the low and base scenarios is expected to have peaked in 2014 at $21.1 billion of combined
capital and operations spending in North Dakota. Total spending in both the low and base price scenarios is expected to
decline at a compound annual growth rate of -6% and -2%, respectively, so that by 2030 low scenario spending is expected
to fall to $7.3 billion and base scenario spending is expected to drop to $15.1 billion. Spending under the high scenario is
expected to peak in 2019 at a total of $28.2 billion of combined capital and operations spending in North Dakota. By 2030,
high scenario is expected to fall slightly from the 2019 peak to $24.3 billion, a compound annual growth rate of -1% from
2014.
Average daily oil production is expected to
grow over time in the high and base scenarios,
and decline slightly in the low scenario.
Correspondingly, the levels of operations and
maintenance expenditure are expected to change
at compound annual growth rates of -0.9%,
1.9%, and 3.4% for the low, base, and high
scenarios, respectively, through 2030.
Our energy experts identified a representative set
of backward-linkage economic sectors based on their work in recent, similar studies, and then determined the respective
shares of capex and opex spending by sector. We then compared the IMPLAN model’s data for the backward-linkage
sectors such as: the appropriate IMPLAN final demand sector (i.e., sectors where the direct opex and capex occur), trade
flows between North Dakota and adjacent states including Minnesota, and regional purchasing (RPC) coefficients. Data
from IHS Business Market Insights (BMI) and Transearch databases (see the discussion of Transearch in the transportation
analysis) were also used to vet the trade flows in the IMPLAN model for reasonableness, and adjust them where necessary.
Finally, capital and operations expenditures were entered into the appropriate IMPLAN final demand sectors to derive the
multiplier effects that oil production purchases in North Dakota have on the Minnesota economy through the backward
linkages.
ScenariosCAGR: Annual Operations
Spending
CAGR: Average Daily Oil
Production
Low Case -0.9% -0.4%
Base Case 1.9% 2.1%
High Case 3.4% 3.4%
Growth of production and O&M spending though 2030
Source: IHS Energy

IHS Economics and Country Risk | The effects of North Dakota oil production on the Minnesota economy
© 2015 IHS 62 April 2015
Infrastructure investment
As noted in the transportation analysis, a significant share of North Dakota’s crude oil production is being sent eastward
through Minnesota, primarily by rail, while inputs for oil production are being sent to the Bakken by highway and rail. The
increased flow of crude oil, combined with the existing flows of agricultural commodities, has meant that infrastructure
improvements are needed in Minnesota to accommodate the increased traffic flows, especially to the rail system. Crude oil
pipeline and rail infrastructure projects are being implemented by private sector firms to address the concerns over
insufficient infrastructure capacity within Minnesota, and to provide additional capacity to move crude oil by pipeline. The
Minnesota Department of Transportation is planning highway improvements, such as eliminating at-grade railroad
crossings and construction of bypasses, to reduce congestion.
Sandpiper pipeline
Enbridge, an energy delivery company based in Alberta, Canada, has three infrastructure projects under development in
Minnesota with construction activity occurring between 2014 and 2017. Enbridge has submitted applications to the
Minnesota Public Utilities Commission for a certificate of need and a pipeline route permit for the Sandpiper pipeline. The
Public Utilities Commission is currently reviewing the two applications; as of early March 2015 Enbridge had not yet
received approval to proceed with the project in Minnesota, although they have received approval to proceed from the
North Dakota Public Utilities Commission. IHS included the Sandpiper pipeline development in this study as the pipeline’s
main purpose is to transport crude oil from North Dakota to Enbridge’s oil storage terminal in Superior, Wisconsin; from
there, the crude oil will be sent via pipeline to refineries in the US Midwest and eastern Canada. The Sandpiper pipeline
project will have a total cost of $2.6 billion over a three-year period. Approximately 300 miles of pipeline, or about half its
total length, will be constructed in Minnesota. If the project is approved by the Minnesota Public Utilities Commission, it
will produce substantial, short-term, positive economic impacts in Minnesota because of the estimated $1.3 billion in
construction spending. Enbridge expects to use local workers and suppliers to the maximum extent possible. Operation
expenditures for the entire pipeline are estimated be $30 million per year. We apportioned the expenditures by length to
allocate about $1.3 billion worth of construction spending that would occur in Minnesota in 2016 if the project is approved.
We excluded Enbridge’s two other Minnesota projects from our estimate of economic impacts—the Line 67 upgrade and
the Line 3 replacement—as they are not directly attributable to Bakken activities. We acknowledge that both these projects
will produce positive economic impacts in Minnesota during their construction and operation phases.

IHS Economics and Country Risk | The effects of North Dakota oil production on the Minnesota economy
© 2015 IHS 63 April 2015
Rail infrastructure improvements
Burlington North Santa Fe (BNSF) is one of the largest freight railroads in the United States and has been highlighted as a
major rail transportation provider in Minnesota and North Dakota. BNSF reported investments of $120 million in
Minnesota during 2014 to expand rail capacity, replace and maintain the network, and continue implementation of positive
train control (PTC) technology. We acknowledge that BNSF rail services will continue to have a significant impact as a
transportation provider in the region, but excluded annual maintenance expenditures from the scope of this analysis as the
rail lines serve a variety of freight needs in addition to the movement of crude oil. BNSF will be investing $326 million in
2015 in Minnesota due to rail traffic demands including crude oil and oil field supply demands8. Three other railroads -
Canadian National, Canadian Pacific, and Union Pacific - will also be investing over $200 million in the state, with the
spending by the Canadian Pacific and the Union Pacific due to crude oil and oil field supply demands. Spending associated
with Canadian crude oil was excluded from the scope of this analysis, as they are not directly attributed to Bakken
production.
Agriculture impacts
In July 2014 the Minnesota
Department of Agriculture released a
study9 describing how transportation
problems during the winter and spring
of 2014 affected the shipments of
grains in Minnesota. This then led to
a decline in the basis price (i.e., cash
price relative to the futures price) and
a drop in the market value of
Minnesota grains. The study said
local cash prices for crops are
affected by three factors: 1)
transportation costs and availability;
2) local supply and demand
conditions; and 3) availability of local
storage capacity. The Department of
Agriculture then concluded that the
primary reason for the decline in the basis price had been the lack of available transportation capacity to ship the grain to
market, due in significant part to the simultaneous demand for rail capacity for Bakken crude oil being transported across
the State. During the two workshops held in November 2014, several participants also commented on the decline in the
grain basis price that had occurred earlier in the year, attributing it to a shortage of rail capacity that could not
accommodate both the demands from a bumper agricultural crop and the movement of North Dakota crude oil through
Minnesota. As a result of these comments, IHS included direct agricultural effects in the economic impact analysis.
Current global projections by IHS reflect the changing dynamic across the agriculture sector. The last decade in agriculture
was driven by strong growth in China with the opening of trade barriers along with the advent of biofuel policies. The
decade had periods with historical price levels seen across many of the major agriculture commodities. IHS projections
mark an expected slowdown to the global agriculture commodity market growth. As an example, the world-level corn
production grew nearly 21% between crop years 2005/06 and 2010/11, 15% between 2010/11 and 2015/16 and is projected
at 7–8% between 2015/16 and 2020/21. Over the next five years, global demand is slower at the same time competing
global producers have expanded to fulfill the global supply. In this global context, agriculture producers are projected to
work within an environment of tightened margins. Crop producers are expected to put constraints on costs for inputs:
machinery, seed, chemicals, etc.
The advent of lower crop prices offers the opportunity for animal agriculture producers to see better returns and expand
production. There are positive benefits of a lower marginal cost of feed for animal production centers, which are significant
for Minnesota agriculture, as it is the largest producer of turkey in the United States. Minnesota animal production centers
8 http://www.bnsf.com/media/news-releases/2015/february/2015-02-05a.html. 9 Minnesota Department of Agriculture, Minnesota Basis Analysis, July 2014.

IHS Economics and Country Risk | The effects of North Dakota oil production on the Minnesota economy
© 2015 IHS 64 April 2015
benefit from lower crop prices through reduced feed prices, which results in an increased return for animals though a
possible increase in the marginal dress weight of the animals. As mentioned with grains, the majority of the benefit of
lower commodity prices has been because the global supply of feed that has increased more than the discounts caused by
the transportation issues. The losses that affect the crop producers are larger than the off-set of positive benefits to the
animal producers as the in-state users. The turkey producers are generally found in Central Minnesota and pork producers
are Southern Minnesota, which is part of the reason that basis prices widened less in those two regions than in Northwest
Minnesota. Unfortunately, the lower global macroeconomic growth may limit the export opportunities that could otherwise
be gained.
Minnesota area planted is a normal part of the IHS global agriculture quarterly forecast. The US-level projections include
the supply and demand of major agriculture commodities along with expected US farm income. The projections of the US
level along with the Minnesota specifics set the baseline expectations for this study. The historical state-level farm price
was correlated with the US national season average price for the selected commodities. The level of historical discount or
premium was accounted for within the price transmission. Minnesota historical farm cash receipts were taken directly from
the US Department of Agriculture/Economic Research Service (USDA/ERS). The historical calculation was correlated to a
combination of state-level commodity production and state prices. Carry-over production and prices were taken into
account to create baseline expectations of unadjusted projected returns. We considered the following types of direct
agricultural effects:
Negative regional-specific crop basis price reaction: The basis prices, which are the difference between futures
prices and local prices of commodities, widened in 2014, resulting in lower prices received by crop producers,
which in turn lowered their income. However, the lower local commodity prices mean lower costs for end users
(e.g., biofuels, feed users, and food users).
Increased carryover cost of stocks on hand: The delays in moving supply increase the time in storage.
Decreased volume moved through supply chain: Lower volumes lead to decreased revenue for supply chain,
specifically elevators.
Changes to Minnesota cash receipts for corn, wheat, and soybean were quantified to garner the change due to limited
supply chain resources for input to the IMPLAN model. The state-level commodity price was discounted by a negative
impact on basis pricing during the projection period. The basis-level discount was quantified based on the spatial
distribution of state-level crop production and reported discounts seen in price levels across various locations. Seasonal
mitigation of supply chain availability across the state was taken into account. The level of production associated with a
decreased level of area planted was quantified as the crop mix shifts across the state separately from the overriding global
supply and demand impacts. The new discounted price and discounted production were used to calculate the affected level
of commodity cash receipts. Our agricultural experts anticipate that crop farm revenue declines will be short lived, with the
largest impacts having occurred in 2014 when grain farming cash receipts fell $164 million and soybean cash receipts fell
$69 million. The agricultural losses in cash receipts are expected to gradually decline through 2019 due to a combination of
declining oil production in North Dakota and the addition of new crude oil pipeline capacity, specifically the completion of
the Sandpiper project previously described.
Estimating total economic impacts
IHS was able to estimate total annual economic impacts that the Bakken oil play in North Dakota has on the Minnesota
economy. Total economic impacts in Minnesota are estimated for three variables described below.
Employment: The total number of jobs generated by the direct spending, not the change in number of employed
persons. The job figure includes both nonfarm positions at business establishments with payrolls, and also self-
employed persons and sole proprietors. The employment figure consists of full- and part-time positions, so it is not
presented on a full-time equivalent (FTE) basis.
Gross regional product (GRP): The total change in value added generated by the direct spending. GRP is
conceptually the same type of measure as gross domestic product (GDP), which is also a measure of value added
and indicates the market value of goods and services, at purchaser prices, produced by all economic resources
located in the United States. As a result, GRP measures the change in value added that occurs in a regional
economy, so it is essentially GDP at the regional local level. Value-added is the concept most commonly used to

IHS Economics and Country Risk | The effects of North Dakota oil production on the Minnesota economy
© 2015 IHS 65 April 2015
measure the size of an economy. In our analysis, the terms value added and gross regional product or GRP will be
used interchangeably.
Labor income: Total labor compensation received by the employed persons, based on the definition presented,
generated by the direct spending. Labor compensation includes wages and salaries paid to workers at
establishments with payrolls, income received by self-employed persons and sole proprietors, and the value of
fringe benefits received by workers.
The IMPLAN model also provides economic effects in terms of the change in output, which is defined as value added plus
the costs of intermediate inputs (i.e., raw materials, supplies, equipment, etc. used in producing a good or service). Output
can also be understood as a measure of sales or revenues received by businesses. IHS decided to use value added in the
form of gross state product (GSP) or gross metro product (GMP) instead of output in our analysis because most persons are
more familiar with the term GDP and thus the concept of value added.
Results: Total economic impacts
Total economic impacts in Minnesota from North Dakota oil production varied based on capital investment and operations
spending patterns across the three energy spending scenarios. All North Dakota spending scenarios decline over time and
Minnesota benefits also decrease over time. The accompanying two charts present the total changes in employment and
labor income in Minnesota under the three scenarios disaggregated into the three direct effects: 1) energy spending in
North Dakota; 2) infrastructure spending in Minnesota; and 3) changes in agriculture income in Minnesota.
Minnesota gains a net of 7,749 jobs in 2014 across all energy growth scenarios. As expected, higher spending scenarios
correspond with higher employment, labor income, output, and value-added. Over time, the largest job growth occurs in
high-scenario employment, with an increasing compound annual growth rate of 0.2% from 2014 through 2030. All other
energy scenarios demonstrate overall employment declines. Base scenario employment declines at a compound annual rate
of -2.6% from 2014 through 2030, while low scenario employment falls at rate of -6.7% over the same time period. The
employment declines over time are due to the falling level of Bakken spending, and resulting decline for goods and
services provided by Minnesota companies. In 2014, the decrease in Minnesota employment of 2,586 jobs from the decline
in agricultural income more than offsets the rise in employment of 916 jobs generated by infrastructure spending. In 2016,
the situation is reversed as the drop in employment of 923 jobs due to losses of agriculture income are more than offset by
the increased employment of 15,497 jobs from the construction of the Sandpiper pipeline. Finally, by 2019 the agricultural
income losses are minimal, and infrastructure spending in Minnesota attributable to North Dakota oil production is also at
a low level, so that the change in total employment is due to overwhelmingly to spending on oil production in North
Dakota as shown in the two accompanying charts.
Labor income follows employment trends across scenarios and over time, but demonstrates slightly stronger sensitivity to
overall declines in spending. Labor income does not experience the same overall growth as employment in the high
scenario, declining from 2014 through 2030 at a compounded annual growth rate of -0.4%. In the base scenario labor
income declines with a compound annual growth rate of -3.2% from 2014 through 2030, while for the low scenario labor
income declines at a rate of -7.3% in the same period. The lower growth rates in labor income, compared to employment,
(5,000)
-
5,000
10,000
15,000
20,000
25,000
30,000
2014 2016 2019 2030 2014 2016 2019 2030 2014 2016 2019 2030
High Base LowMinnesota Bakken-related employment Infrastruture employment Agriculture employment
Total employment impacts in Minnesota
Source: IHS © 2015 IHS
Em
plo
ym
en
t

IHS Economics and Country Risk | The effects of North Dakota oil production on the Minnesota economy
© 2015 IHS 66 April 2015
under the three scenarios, likely occurs because the composition of goods and services being supplied to support North
Dakota will shift over time from capex, where skilled workers are highly paid, to opex where more inputs will come from
the service sector where wage levels are lower.
Infrastructure investments, such as the Sandpiper pipeline, generate significant economic benefits in Minnesota as they
produce direct, indirect, and induced increases in employment, rather than the indirect and induced jobs due to Bakken
spending. At the same time, the declines in agriculture income lead to losses of direct, indirect, and induced jobs in
Minnesota.
The percent changes in employment and labor income in Minnesota attributable to North Dakota oil production over our
baseline economic forecast for the state are small, even during the peak year of impacts in 2016. The increases in
employment range between 0.6% and 0.9% across the three scenarios, while those for labor income are from 0.5% to
0.7%.
($200)
$0
$200
$400
$600
$800
$1,000
$1,200
$1,400
$1,600
$1,800
2014 2016 2019 2030 2014 2016 2019 2030 2014 2016 2019 2030
High Base Low
Lab
or
inco
me (
millio
ns)
Minnesota Bakken-related labor income Infrastructure labor income Agriculture labor income
Total labor income impacts in Minnesota
Source: IHS © 2015 IHS
Largest net employment gains in Minnesota, base case 2016 ranking
Base High Low
36 Construction of other new nonresidential structures 5,139 0 0
356 Securities, commodity contracts, investments, and related activities 1,333 202 -92
381 Management of companies and enterprises 1,002 443 -162
413 Food services and drinking places 908 202 -167
201 Fabricated pipe and pipe fitting manufacturing 840 0.3 -280
319 Wholesale trade businesses 535 126 -87
382 Employment services 525 107 -89
369 Architectural, engineering, and related services 463 17 -31
365 Commercial and industrial machinery and equipment rental and leasing 415 52 -3
360 Real estate establishments 370 52 -80
397 Private hospitals 349 70 -61
394 Offices of physicians, dentists, and other health practitioners 327 72 -57
425 Civic, social, professional, and similar organizations 302 94 -48
335 Transport by truck 293 54 -57
398 Nursing and residential care facilities 286 61 -64
354 Monetary authorities and depository credit intermediation activities 264 77 -43
329 Retail Stores - General merchandise 262 77 -67
357 Insurance carriers 254 59 -63
324 Retail Stores - Food and beverage 227 62 -44
388 Services to buildings and dwellings 215 56 -40
230 Other general purpose machinery manufacturing 189 74 -36
367 Legal services 188 42 -47
368 Accounting, tax preparation, bookkeeping, and payroll services 176 53 -39
414 Automotive repair and maintenance, except car washes 165 58 -37
39 Maintenance and repair construction of nonresidential structures 160 46 -35
Source: IHS, IM PLAN © 2015 IHS

IHS Economics and Country Risk | The effects of North Dakota oil production on the Minnesota economy
© 2015 IHS 67 April 2015
The largest overall industry employment gainers in 2016 will be in construction industries supporting the pipeline project.
The second- and third-largest gainers in the base-scenario were among Minnesota cluster industries: IMPLAN 356
(securities, commodity contracts, investments and related activities) and IMPLAN 381 (management of companies and
enterprises); each are expected to gain over 1,000 jobs during Sandpiper construction.
We removed infrastructure and agriculture effects to see which Minnesota industries played a role in the Bakken
unconventional supply chain and its ripple effects. The largest employment gains in Minnesota resulting from capital
investment and operations spending in the Bakken were in business service and consumer service industries. The largest
employment gains across energy scenarios were in IMPLAN 381 Management of companies and enterprises, with an
increase in 885 jobs in the 2016 base scenario. IMPLAN 413 Food services and drinking places and IMPLAN 319
Wholesale trade businesses have the second- and third-largest employment gains in 2016 Bakken scenarios.
Overall, output and value-added impacts follow similar trends to employment and spending scenarios, with the largest
gains occurring in 2016 and growth tapering off through 2030. Output and value-added declined in the high scenario over
the analysis period, falling at a compound annual growth rate of -0.3% and -0.6%, respectively, from 2014 through 2030.
Output declines in the base and low scenarios over the analysis period at a compound annual growth rate of -3% and -7%,
respectively, from 2014 through 2030. Value added declines at similar rates in the base and low scenarios, declining at a
compound annual growth rate of -3.3% and -7.3%, respectively, from 2014 through 2030.
The percent increases in value added and output in Minnesota attributable to North Dakota oil production over our baseline
economic forecast for the state in 2016 are similar in size to those noted for employment and labor income. During 2016,
the increases in value added vary from 0.5% and 0.8% across the three scenarios, while the rises in output range from 0.4%
to 0.6%.
Top 25 energy employment gainers in Minnesota: 2016 base case rankings
Rank IMPLAN High Base Low
Total 10,637 6,636 3,328
1 381 Management of companies and enterprises 1,419 885 444
2 413 Food services and drinking places 537 335 168
3 319 Wholesale trade businesses 330 203 99
4 230 Other general purpose machinery manufacturing 289 188 102
5 356 Securities, commodity contracts, investments, and related activities 294 182 90
6 382 Employment services 287 180 92
7 360 Real estate establishments 261 164 84
8 425 Civic, social, professional, and similar organizations 257 161 81
9 357 Insurance carriers 225 140 69
10 354 Monetary authorities and depository credit intermediation activities 221 137 69
11 389 Other support services 204 127 63
12 397 Private hospitals 197 123 62
13 394 Offices of physicians, dentists, and other health practitioners 185 115 58
14 398 Nursing and residential care facilities 162 101 51
15 329 Retail Stores - General merchandise 135 84 42
16 388 Services to buildings and dwellings 127 79 40
17 368 Accounting, tax preparation, bookkeeping, and payroll services 126 79 40
18 403 Spectator sports companies 127 78 39
19 39 Maintenance and repair construction of nonresidential structures 123 78 40
20 335 Transport by truck 123 76 37
21 377 Advertising and related services 119 75 38
22 324 Retail Stores - Food and beverage 116 73 36
23 367 Legal services 114 71 36
24 380 All other miscellaneous professional, scientific, and technical services 102 64 33
25 358 Insurance agencies, brokerages, and related activities 95 59 29
Source: IHS, IM PLAN © 2015 IHS

IHS Economics and Country Risk | The effects of North Dakota oil production on the Minnesota economy
© 2015 IHS 68 April 2015
To better grasp the significance of North Dakota oil production activities on Minnesota, IHS created two separate
measures: 1) million dollars spent per job created and 2) change in Minnesota’s gross state production (GSP), or value-
added, per million dollars spent. These two measures were created using North Dakota spending and Minnesota benefits
alone, without taking into consideration agriculture and infrastructure activities. With the first measure, we see that for
every $2.24 million spent in North Dakota’s oil industry, one job in Minnesota was created in 2014. In 2030, slightly over
$3 million of spending in North Dakota’s Bakken is required to create one Minnesota job.
The second measure provides a better sense of direct business gains for Minnesota industry. Many stakeholders and
businesses have expressed an increase in business, but perhaps have not been able to isolate their gains from the Bakken
relative to other economic factors. The value-added gains in Minnesota relative to millions of dollars spent in North
Dakota approximates the ripple effects the dollars spent in the Bakken have on Minnesota businesses. In 2014, the change
in Minnesota’s gross state product per million dollars spent for oil production in North Dakota was slightly above $54,000.
The value-added benefits decline over time, as 1) spending shifts with time from capital investment to operations, and 2)
the backward linkages become more complete so that a higher share of the goods and services used in oil production can
be obtained from within North Dakota as opposed to other states.

IHS Economics and Country Risk | The effects of North Dakota oil production on the Minnesota economy
© 2015 IHS 69 April 2015
Tax impacts
IHS estimated the changes in major state-level tax revenues that would be generated by the increases in economic activity
under each of the three scenarios, and for each of the four years, as presented. Our basic approach was to use time series
data on state tax revenue collections in Minnesota back to 2002, and historical data on the four variables provided by the
IMPLAN model—employment, value added, output, and labor income—to derive a set of effective tax rates. These rates
were then multiplied by the results of the economic impact assessment presented in this report to derive revenue estimates.
The effective tax rates took into consideration whether the rates for major state-level taxes such as individual income,
corporate net income, and sales and use taxes had changed over time. In fiscal year 2013 Minnesota obtained 74.7% of its
total state tax revenues from just three sources: individual income tax, 44%; corporate income tax, 6.3%: and sales and use
taxes, 24.4%. By comparison, that same year North Dakota obtained 42.8% of its tax revenues from the same three
sources: individual income tax, 12%; corporate income tax, 3.6%: and sales and use taxes, 27.2%; but 46.6% of its
revenues from oil extraction and gross production taxes. As with economic impacts, the maximum levels of tax revenues
will be generated in 2016 due to the combination of still-high levels of capex and opex spending in North Dakota and
infrastructure spending.
We estimate that in 2016 the total additional state-level tax revenues in Minnesota generated by increases in economic
activity from North Dakota oil production will range from approximately $155.5 million under the October high scenario
down to $104 million under the February low scenario. The annual tax revenue increase will gradually decline thereafter as
infrastructure spending declines, along with the levels of direct capex and opex spending in North Dakota.

IHS Economics and Country Risk | The effects of North Dakota oil production on the Minnesota economy
© 2015 IHS 70 April 2015
Minnesota has reciprocity agreements for individual income taxes with North Dakota and Michigan. Tax reciprocity is an
agreement where if a Minnesota resident works in either of the other two states, their tax obligation to Minnesota is no
different than it would be if the job was located in Minnesota. The effect of tax reciprocity means that there is no reduction
of individual income tax revenues to Minnesota when a resident worker takes a job in North Dakota; if the North Dakota
job pays more than the worker was earning in Minnesota, then individual income tax revenues received in Minnesota
would increase, and vice versa.
There would be some small increases in tax revenues in those counties in southeastern Minnesota that produce frac sand.
Section 298.75 of Minnesota Statutes permits counties to levy a tax of 21.5 cents per cubic yard or 15 cents per ton on
aggregate material excavated in the county. The revenues are required to be used for local transportation improvements –
42.5%, general fund revenues – 42.5%, and deposited into a reserve fund to pay for restoration of mined areas – 15%.
Based on current estimates of between 4.0 million10
and 5.0 million11
tons per year of frac sand production in Minnesota,
this tax would produce between $600,000 and $750,000 in additional county tax revenues, but less than 20% of this
revenue can be attributed to oil production activity in North Dakota at the present time.
Economic impacts in the Border Cities and their respective counties
IHS considered the overall economic impact that capital investments and operations spending in the Bakken has on the five
Border Cities of Minnesota. Given the relatively modest size of the economy and populations of the Border Cities, IHS
constructed an IMPLAN region composed of an aggregation of the five counties in which the affected Border Cities are
located. Infrastructure and agricultural impacts were excluded from the aggregated county impacts due to the structure of
the IMPLAN model we used and our efforts to avoid double counting.
The overall economic impacts were modest throughout the period of analysis. Employment gains are expected to peak in
2019 for the high-growth scenario, and are expected to have already peaked in 2014 for the base- and low-growth
scenarios. Employment effects are expected to decline at a compound annual growth rate of -1.4% in the high scenario
from 2014 through 2030. Employment impact declines are projected to be steeper for the base and low scenarios, declining
at a compound annual growth rate of -4.4% and -8.9%, respectively, from 2014 through 2030. Labor income follows
10 IHS, Transearch database, 2015. 11 Heather Arends, Minnesota Department of Natural Resources, personal conversation, March 16, 2015.
Scenarios and tax types 2014 2016 2019 2030
State corporate income $3.6 $8.8 $4.7 $3.4
Individual income $27.5 $73.9 $35.9 $25.7
General sales and use $13.2 $33.8 $17.5 $12.7
All other taxes and fees $16.0 $39.0 $20.7 $14.9
Total $60.3 $155.5 $78.8 $56.7
State corporate income $3.6 $7.2 $2.9 $2.2
Individual income $27.5 $61.0 $22.1 $16.3
General sales and use $13.2 $27.6 $10.8 $8.1
All other taxes and fees $16.0 $31.7 $12.9 $9.6
Total $60.3 $127.4 $48.7 $36.1
State corporate income $3.6 $5.8 $1.4 $1.1
Individual income $27.5 $50.3 $10.5 $8.2
General sales and use $13.2 $22.4 $5.2 $4.1
All other taxes and fees $16.0 $25.6 $6.2 $4.8
Total $60.3 $104.0 $23.3 $18.3
Note: all revenues are in millions of current dollars.
Sources: IHS, US Regional Service, 2015. Minnesota IMPLAN Group, Input/output model for Minnesota, 2015.
Wolters Kluw er, CCH 2015 State Tax Handbook, 2015. Minnesota Department of Revenue, Table 1. Minnesota
State Tax Collections (FY 1974 - 2013).
http://w w w .revenue.state.mn.us/research_stats/Pages/State_Tax_Collections_by_Type_of_Tax.aspx
December base
February low
State-level tax revenues by scenario
Note: the major components of all other taxes are: motor vehicles sales, motor fuels excise, motor vehicle
registration, alcoholic beverage, cigarettes, tobacco, insurance premiums, health care surcharges,
MinnesotaCare, and state property taxes
October high

IHS Economics and Country Risk | The effects of North Dakota oil production on the Minnesota economy
© 2015 IHS 71 April 2015
employment growth through each year of analysis for each forecasted trend. The relative sizes of labor income impacts are
limited to a range of $120,000 to a maximum of $448,000, with employment impacts in levels of 10 or fewer new jobs.
Output and value-added impacts in the aggregated five-county IMPLAN region are comparable to employment effects. In
2014, the Bakken capital investment and operations spending attributed to $1.68 million of increased output and $672,000
in increase value-added in the five-county region across all three scenarios. The annual increases of output and value
added in the five counties declines over time as the direct spending falls.
The primary reasons for the minimal backward linkage economic impacts in the Border Cities and the counties that include
Border Cities are:
Proximity: the cities and counties are located too far from the Bakken to be local suppliers. It is at least 200 miles
driving distance from Moorhead to the eastern edge of the Bakken formation near Bismarck, which is too far to
provide any proximity benefits to companies located in the five counties.
Economic structure: the economy of the five counties that include Border Cities is small, with a total
employment of 46,554 jobs in 2014. As rural economies with a large agricultural sector and a lack of structural
diversity, many of the specialized goods and services used in the production of crude oil are not produced there.
The five counties also lack, for the most part, larger firms that are able to offer the range of specialized services
required by oil producers at the scale they require. Responses to the interviews performed during the SCOPE
process indicated that the companies selling goods and services into the Bakken tend to be either: 1) large full-
service firms, or 2) those that offer high-level, specialized goods and services, especially those in the professional
and business services, finance, equipment leasing, insurance, and construction sectors. The supplier firms tend to
be located further to the east around near the Twin Cities, and they have the scale to establish branch offices in the
Bakken, supported by activities in other offices.

IHS Economics and Country Risk | The effects of North Dakota oil production on the Minnesota economy
© 2015 IHS 72 April 2015
Given the geographic location and the industrial mix of the aggregated five county regions’ economy, we anticipate the
benefits of Bakken spending to be minimal. Agriculture impacts were excluded in this level of detail of the impact
analysis, as were benefits from the Sandpiper pipeline project. Approximately 60 miles, or one-fifth of the Sandpiper
pipeline’s total length in Minnesota, will be constructed in Polk County, which would produce positive, short-term
economic benefit in 2016.
Economic development and forward linkages
Forward linkages are economic sectors that use the output of another sector as an input in providing other types of goods
and services. As an example, refineries use crude oil as input to produce refined products such as gasoline, diesel fuel, and
other similar products. In turn, the petrochemical sector would use some of the refined products, such as distillates, to
make basic chemicals. The gasoline and diesel fuel produced by the refinery would be used by businesses and households
present with their market area. If crude oil from North Dakota passes through Minnesota by rail (i.e., it is currently being
sent by rail to Philadelphia for processing) or by the Sandpiper pipeline and is not used as an input in the state, the forward
linkage economic development benefits will be minimal. In other words, the extent to which the Minnesota economy
benefits over the long-term from the increased supply of North Dakota crude oil that passes through it will depend in the
ability of the forward linkage sectors to use the crude as an input. Most importantly, in order for the most of the forward
linkage sectors to benefit from the increased supply of crude, it will first have to be refined into products they can use.
Other forward linkage sectors in Minnesota will potentially benefit from North Dakota’s oil production by providing
transportation and storage services for the crude oil passing through the State to processing and storage locations, such as
to the Enbridge oil terminal in Superior, Wisconsin. Crude oil from the Bakken is currently being sent on unit trains to a
large refinery on the Schuylkill River in Philadelphia, resulting in higher demand for rail services provided by rail
companies such as CSX and BNSF. Currently, two unit trains per day carrying about 160,000 barrels of crude oil travel
from the Bakken field to Philadelphia, passing through Minnesota and six other states. A recent IHS report issued in
December 2014 estimates that the cost of shipping Bakken crude oil by rail to the US east coast averages $14.75 per barrel,
compared to the cost of sending it by pipeline to the US Gulf Coast of $9.50 per barrel. Pipeline companies such as
Enbridge will experience an increase in sales for the services they provide in shipping North Dakota crude oil to the
Superior, Wisconsin facility.

IHS Economics and Country Risk | The effects of North Dakota oil production on the Minnesota economy
© 2015 IHS 73 April 2015
When firms like BNSF and Enbridge ship crude oil across multiple states, it is difficult to precisely assign the share of their
increase in sales and economic activity that will occur in a single state such as Minnesota, but it is reasonable to assume
that the impact is generally proportional to the share of the trip that is located in an individual state. Rail and pipeline
companies will purchase goods and services, and hire some workers to maintain their facilities that are located in
Minnesota; these operating and maintenance costs were considered in economic impact assessment presented above. The
size of the economic impacts from purchasing transportation services will also be affected by where the payments are
made. BNSF’s corporate headquarters are in Dallas, Texas, while Enbridge’s are in Toronto, Canada. To the extent that
payments made for rail services provided by BNSF flow to Dallas, as opposed to Minneapolis where they have an office,
the local economic impacts will be less and vice versa.
IHS identified potential forward linkage sectors from our work in other recent studies, the shift-share analysis of the
Minnesota economy described above, and an analysis of the US input/output table to identify economic sectors that use
crude oil as an intermediate input. The accompanying table presents the potential forward linkage sectors that we
identified, along with their shift-share type. The largest potential forward linkage sector is petroleum refining, with
Minnesota having two refineries. Under the right circumstances, these refineries could be potential users of the Bakken
crude, especially if their current refining processes allow them to use the light, sweet crude oil coming from the Bakken
instead of the heavier crude oil coming from Canada. After petroleum refining, all of the other forward linkage sectors on
the list will require that the crude oil first be processed to generate the refined petroleum products that can be directly used
as an intermediate input. Other forward linkage sectors that rank high on the list include transportation services (e.g., air,
truck, and rail), grain farming, other basic organic chemicals, iron ore mining, various agriculture activities, construction,
and wholesale trade.
Since the underlying input/output table combines crude oil and natural gas into a single sector, additional analysis of the
potential forward linkage sectors would need to be done to identify the economic sectors that can use either unrefined
crude oil, or refined petroleum products, as an input. This analysis would be especially important for the two chemical
manufacturing sectors – other basic inorganic chemicals or plastics and resins – that appear on the list.
Refinery forward linkages
Minnesota is geographically advantaged to potentially benefit from rising crude oil supplies in North Dakota and Canada
because it has access to the key rail and pipeline routes to market further east and south. Bakken crude and Canadian crude
volumes move through the state via pipeline and rail to markets in Minnesota, Wisconsin, Illinois and markets further east
and south. Bakken oil production has increased at a rate greater than the supporting pipeline infrastructure, resulting in a
significant use of rail as noted in the recent IHS report “Crude by Rail” released in December 201412
.
There are two refineries in Minnesota, both located in the Minneapolis-St. Paul MSA.
Flint Hills/Pine Bend, located in Rosemount, which processes heavy Canadian crude oil and produces gasoline,
diesel, jet fuel, asphalt, heating fuels, sulfur for fertilizer, and other products with a capacity of 339,000 barrels per
day
Northern Tier, located in St. Paul Park, processes a mix of crude oils, but requires lighter crude oils than Pine Bend
and produces gasoline, diesel, jet fuel, and asphalt, with a capacity of 89,500 barrels per day.
Both refineries provide fuel to Minnesota and the adjacent states. Canadian heavy crude oil fueled refinery expansions in
Minnesota and the Chicago area. Bakken crude oil has now emerged with similar logistical benefits to Minnesota refiners
as Canadian heavy.
12 IHS, Crude by Rail: The new logistics of tight oil and oil sands growth. December 2014. http://press.ihs.com/press-release/energy-
power/transportation-crude-oil-rail-expected-peak-between-2015-2016-will-remain

IHS Economics and Country Risk | The effects of North Dakota oil production on the Minnesota economy
© 2015 IHS 74 April 2015
Minnesota refining capabilities can process some Bakken light sweet crude oil, but to fully benefit from logistical cost
advantages, additional capital investments and refinery reconfiguration and logistic capacity may be required. We find that
Minnesota may have a logistical advantage to capture a greater proportion of the crude shipments and increase production
of higher value refined products, such as gasoline/fuels or refined chemicals with more flexible use, such as polypropylene
and butane.
The opportunity for refinery expansion clearly exists, as is evident by refinery capabilities located in markets further from
Bakken than Minnesota, and by Northern Tier’s public intent to take advantage of Bakken crude sources. Potential
expansion opportunities will be defined by investment costs and comparative market benefits to other refinement locations.
There is currently one operating refinery in North Dakota, the 60,000 barrel per day Tesoro facility in Mandan near
Bismarck. Two other smaller refineries, each with a capacity of 20,000 barrels per day, are currently under construction:
the Dakota Prairie plant near Dickinson which is expected to open this year, and the Trenton refinery; both of which will
produce diesel fuel to meet local demand. Finally, two additional 20,000 barrel per day refineries have been proposed, one
near Devils Lake and the other near Mondak; both of these would also produce fuels for local consumption. Because their
small sizes and local orientation, the eventual operation of all these refineries would not affect the decision-making by the
two Minnesota refineries on whether to start processing crude oil coming from North Dakota.
NAICS Description
% of oil and
natural gas
output used*
Shift-share
class
32411 Petroleum refineries 58.1% A
2211 Electric power generation, trans. & distribution 7.7% A
2212 Natural gas distribution 5.8% A
481 Transport by air 2.4% C
484 Transport by truck 2.2% B
11113-6, 11119 Grain farming 2.1% A
2362 Const. of other new nonresidential structures 1.7% B
32519 Other basic organic chemical mfg. 1.7% B
42 Wholesale trade businesses 1.5% A
21221 Mining iron ore 1.1% C
n.a. Other state and local government enterprises 1.0% NA
5617 Services to buildings and dwellings 1.0% B
2362 Maint. & repair of nonresidential structures 0.8% B
11111-2 Oilseed farming 0.7% A
722 Food services and drinking places 0.7% D
32212 Paper mills 0.6% C
531 Real estate establishments 0.6% A
492 Couriers and messengers 0.5% B
n.a. State and local government passenger transit 0.5% NA
2361 Construction of other new residential structures 0.5% B
2362 Const. of new nonresid. Comm. & health care 0.5% B
482 Transport by rail 0.5% NA
622 Private hospitals 0.4% A
55 Management of companies and enterprises 0.4% C
325211 Plastics material and resin mfg. 0.4% B
2361 Const. of new residential structures 0.3% B
324122 Asphalt shingle and coating materials mfg. 0.3% A
1122, 1124-5, 1129 Animal production, except cattle and poultry and 0.3% C
311313 Beet sugar mfg. 0.3% A
32552 Adhesive mfg. 0.3% B
Source: IHS, 2014.
* The 30 sectors above account for 95% of oil & natural gas output used as an intermediate input,
excluding use by the oil & natural gas extraction sector itself.
Top-30 forward linkage sectors

IHS Economics and Country Risk | The effects of North Dakota oil production on the Minnesota economy
© 2015 IHS 75 April 2015
Other economic effects
In addition to the backward and forward linkage economic impacts described above, the Minnesota economy will benefit
in two other ways as described below.
The wealth effect
As we noted above, the rapid economic growth that has occurred in North Dakota since oil production began in the
Bakken formation has significantly increased the average level of per capita personal income to $53,040 in 2014, above the
figure of $47,320 in Minnesota. Between 2007 and 2014, total personal income in North Dakota rose at a compound
annual growth rate of 8.1%. This is by far the highest rate increase for total personal income among the 50 states and the
District of Columbia, while total disposable income in North Dakota grew by 7.6% annually. Personal income is the
appropriate metric for measuring this increase in income and wealth, as it includes both earned income (i.e., wages and
salaries, and proprietor’s income received from working) and unearned income (i.e., dividends, interest, rent, transfer
payments, fringe benefits, pension payments, etc.). Payments made to North Dakota residents in the form of royalties,
leases, and purchases of land or drilling rights would show up as unearned income. The high per capita personal income
figure in North Dakota is due to the combination of high growth rates in earned and unearned income divided by a small
population. Simply put, North Dakota residents have a lot more disposable income to spend.
As Minnesota has a much larger, more diversified economy than North Dakota; it offers specialized goods and services of
all types that are not available in North Dakota. As examples, Minnesota offers specialized and high-end retail facilities
such as the Mall of America; health care services like the Mayo Clinic; recreation opportunities; arts and culture facilities;
and professional and business services that are not present in North Dakota. As a result, North Dakota residents with their
higher levels of income are purchasing some of these services in Minnesota. In some cases, they are visiting Minnesota to
purchase these services, in other instances they are purchasing high end goods and services and taking them back to, or
having them installed in North Dakota. While in the short-term the income growth rate in North Dakota may slow due to
the reduction in oil exploration and drilling caused by the recent drop in the price of crude oil, over the long-term income
will continue to grow at a high rate in North Dakota, so that the wealth effect will continue. IHS forecasts that over the
next five years, disposable income in North Dakota will grow at an annual rate of 2.1% compared to 1.7% in Minnesota.
The implication for Minnesota businesses is that they should take steps, which many are already doing, to attract and sell to
North Dakota residents.
The infrastructure effect
The rapid growth in oil production in North Dakota has also resulted in high growth rate in state-level tax revenues in
North Dakota. As noted above, total state-level taxes in North Dakota grew at a compound annual growth rate of 20.8%
between 2007 and 2013. North Dakota currently imposes a 5% tax on the gross value of oil at the well and an extraction
tax of 6.5% on the gross value of the oil extracted. However, the extraction tax is subject to a trigger price so that the
extraction tax is reduced to 4% if the average price of crude oil for any consecutive 5-month period falls below the trigger
price. The current trigger price is $52.59 per barrel. The State of North Dakota recently (February 2015) reduced its
revenue forecast for the biennium lasting from July 1, 2015 to June 30, 2017 by $4.05 billion; even so, it still expects to
collect $4.3 billion in oil and gas revenues over the biennium.
As the level of oil related tax revenues began to surge in 2009 and 2010, North Dakota established a legacy fund, similar to
Alaska’s permanent fund, to be used pay for programs to benefit the state; however money from the Legacy fund cannot be
used until 2017. By law, 30% of the revenues from the extraction and production taxes are deposited in the Legacy Fund.
As of February 15, 2015, the Legacy fund had a total value of $3.65 billion. Shares of the oil and gas tax revenues are
distributed to local governments and school districts throughout the state. At the same time, North Dakota established a
series of trust and dedicated funds to use the oil tax revenues for a variety of purposes, including:
Oil and Gas Impact fund
Resources Trust fund
Common Schools Trust fund
Foundation Aid Stabilization fund

IHS Economics and Country Risk | The effects of North Dakota oil production on the Minnesota economy
© 2015 IHS 76 April 2015
Oil and Gas Development fund
Strategic Investment and Improvement fund
Property Tax Relief fund
Disaster Relief fund
Oil and Gas Research fund.
A relatively small share of the oil and gas tax revenues are given to the North Dakota general fund; during the current
biennium that ends on 30 June 2015, this figure is estimated to be $300 million. The largest of the funds listed above is the
Strategic Investment and Improvement fund, whose balance on 30 June 2015 is estimated to be about $1.189 billion by the
North Dakota Legislative Council. The purpose of the Strategic Investment and Improvement fund is to pay for
improvements to state infrastructure or programs to improve the efficiency of state government. The high level of oil and
gas tax revenues has enabled, and will continue to enable, the state of North Dakota to spend substantial amounts to
improve the quality of its public services, such as education and infrastructure, and to mitigate the impacts of oil and gas
development on the infrastructure of the directly affected communities. The combined spending presents a significant
opportunity for Minnesota companies to provide the necessary goods and services. The point made above about
Minnesota’s ability to provide specialized goods and services, including delivering them at a large scale, also applies to
infrastructure spending.
Economic summary
Principal findings are that the overall net impact of North Dakota oil production on the Minnesota economy is positive, but
will produce small percent increases in statewide economic activity. As the annual levels of spending for oil exploration
and drilling in North Dakota rose steadily from 2007 onward, demand also grew for goods and services that could be
provided by companies from Minnesota and in other states. Over the same period, increasing volumes of crude oil were
being sent eastward through Minnesota, affecting communities located along the transportation corridors, but also creating
opportunities for economic sectors to use the crude oil as an input.
The extent to which significant portions of the total capital and operations spending would flow to Minnesota, as opposed
to other states, depends on a variety of factors such as: 1) the types of goods and services needed to support crude oil
production; 2) the ability of Minnesota companies to meet the specific needs of oil producers, 3) the size and diversity of
Minnesota’s economy; 4) existing relationships oil producers have with suppliers in other states; and 5) proximity. IHS
estimated the total economic impacts on the Minnesota economy for three direct effects: 1) the annual levels of capital and
operations spending in North Dakota for oil production and the resulting indirect spending that would flow to Minnesota
through the backward linkages; 2) declines in agricultural commodity basis prices and accompanying decline in farm
income due to competition with crude oil for scarce rail capacity; and 3) infrastructure investment in Minnesota directly
attributable to the Bakken oil production.
The total economic impacts in Minnesota through the backward or supplier linkages for the three North Dakota oil
production scenarios considered in this study are presented below.

IHS Economics and Country Risk | The effects of North Dakota oil production on the Minnesota economy
© 2015 IHS 77 April 2015
Major findings of the economic impact assessment include:
Minnesota benefits from the oil production activity in North Dakota, but because of the size and diversity of the
state’s economy, the incremental impact is small. Minnesota’s economy is only minimally affected by the level of
oil production activity in North Dakota, which is not necessarily a bad thing given the historic volatility of state
economies that are dependent on the prices of natural resources.
IHS determined that overall net economic impact of North Dakota oil production on the Minnesota economy is
positive, but generates only a small percent increase in the level of economic activity. During 2016, when the
combined capex and opex spending in North Dakota, plus infrastructure spending in Minnesota directly
attributable to North Dakota oil production, are at their peaks, total employment would rise by 25,210 jobs under
the high scenario, and generate an additional $2.5 billion in gross state product. The increases in economic activity
in 2016 are between 0.4% and 0.9% over IHS’s forecast baseline for Minnesota. For the other years, the increases
would be much smaller as gross state product rise between 0.1% and 0.3% in 2019, and by 0.1% or less in 2030.
The primary reason for the modest percent effects presented above is that significant shares of the capex inputs
will come from other states, especially durable manufacturing inputs such as steel, pumps, compressors, etc. In
addition, while Minnesota is relatively close to the Bakken compared to other states, it is not close enough to
benefit from being a supplier of locally consumed inputs and construction labor, with the exception of frac (silica)
sand. As the level of capital and operations spending in North Dakota, and infrastructure outlays in Minnesota,
decline in future years, the increases in statewide economic become smaller as shown in the table above. Increases
of $104 million, $127.4 million and $155.5 million in Minnesota state-level tax revenues in 2016 under the three
price scenarios. The increases in subsequent years will be smaller as the total economic impacts decline.
According to our analysis, the percent increases in state-tax revenues over current levels would be the same as the
percent increases in economic activity.
The adverse effects on agriculture income due to the decline in crop basis prices that resulted from competition
with crude oil for scarce rail capacity will be largely short term, between 2014 and 2016. Pipeline and other
infrastructure improvements, such as the completion of the Sandpiper pipeline and BNSF rail expansion, in the
near term will help to shift crude oil from rail to pipeline, thus creating additional rail capacity for agricultural and
types of commodities, such as coal.
The economic impacts in the five Border Cities and the counties that include Border Cities from the backward
linkages will be minimal. They are not located close enough to the Bakken for their companies to benefit by being
local suppliers, or to provide significant amounts of labor. The rural economies of the five counties lack the
structural diversity to provide the goods and services used in crude oil production, and the larger, full service firms
that can meet the specific demands oil producers. Finally, based on research done by the Minneapolis Federal
Scenario and measure 2014 2016 2019 2030
Output $1,813.8 $4,643.3 $2,400.3 $1,740.9
Employment 7,748.4 25,210.9 10,949.7 7,984.3
VA $1,065.0 $2,492.6 $1,355.8 $974.9
Labor income $585.4 $1,574.9 $765.3 $547.6
Output $1,813.8 $3,789.1 $1,483.5 $1,112.5
Employment 7,748.6 21,210.0 6,671.0 5,067.7
VA $1,065.0 $2,019.0 $845.7 $623.3
Labor income $585.4 $1,299.2 $470.6 $346.7
Output $1,813.8 $3,077.9 $709.2 $567.7
Employment 7,748.6 17,901.7 3,088.9 2,569.2
VA $1,065.0 $1,621.8 $411.1 $315.0
Labor income $585.4 $1,071.3 $223.9 $174.7
Note: all dollar amounts are in millions, employment in total jobs
Economic impacts in Minnesota by scenario and year
October high scenario
December base scenario
February low scenario
Sources: Minnesota Implan Group, IMPLAN input/output models for Minnesota and North Dakota, 2014. Analysis
performed by IHS.

IHS Economics and Country Risk | The effects of North Dakota oil production on the Minnesota economy
© 2015 IHS 78 April 2015
Reserve Bank, the overall wage levels in the Five Border cities and the counties they are in have not been
increased by demands for skilled workers in the Bakken region.
Minnesota’s economy is diverse and is potentially positioned to benefit from its logistical advantages, especially
the lower delivered price of Bakken crude oil in the Twin Cities when compared to other refining locations in the
US Midwest. The extent to which the Minnesota economy can benefit over the long-term from the increased
supply of North Dakota crude oil will depend on the ability of the two refineries to use the crude as an input to
produce the refined products that in turn can be used by other forward linkage sectors such as chemicals.
The wealth and infrastructure spending effects described above are currently generating positive economic impacts
in Minnesota that are in addition to increases in economic activity produced by the backward linkages. These two
effects will create long-term opportunities for Minnesota businesses to either attract more North Dakota residents
to visit the state and spend, or to expand the level of goods and services they sell in North Dakota to support its
consumption and infrastructure spending.

IHS Economics and Country Risk | The effects of North Dakota oil production on the Minnesota economy
© 2015 IHS 79 April 2015
Phase 4: SCOPE Analysis
Methodology
Similar to the typical SWOT (Strengths, Weaknesses, Opportunities, Threats) analysis, IHS used the SCOPE (Situation,
Core Competencies, Obstacles, Prospects, and Expectations) framework to evaluate a broad set of factors that has
influenced (and will continue to influence) Minnesota’s ability to leverage North Dakota oil production for statewide
economic development. The SCOPE analysis relies on our findings from three prior phases of the study: oil production
forecast in North Dakota, transportation analysis, and the economic impact assessment.
Situation today
Core industry and economic development competencies
Obstacles for achieving the desired impact from ND oil production
Prospects for deriving economic development and employment opportunities from the oil production and
development occurring in North Dakota, and
Expectations for achieving the projected economic growth and industrial development outcomes.
The three preceding chapters of this report – North Dakota oil production forecast, transportation, and the economic impact
assessment -- contain detailed information about Minnesota, the five Minnesota Border Cities (Breckenridge, Dilworth,
East Grand Forks, Moorhead and Ortonville) and their respective counties, and North Dakota. The first two sections below
– Situation today and Core Competencies - summarize the findings of the other three chapters, and present other material,
to provide context for more detailed discussions of Obstacles, Prospects, and Expectations.
Situation today
As this study is assessing the economic impacts of oil production in North Dakota on the Minnesota economy, it is
essential to understand Minnesota’s proximity to the Bakken formation, and its connectivity to the rail and oil
infrastructure that serves the states of the upper Midwest. The accompanying map presents the locational context of
Minnesota, showing the distance to the Bakken formation, the routes of the major rail lines and oil pipelines that pass
through the states of the upper Midwest, and distances to refineries. The features on the map influence Minnesota’s ability
to:
Provide goods and services to support Bakken oil production and development
Receive economic benefits from the movement, processing, and consumption of Bakken crude oil, and the refined
products derived from it.
The Minneapolis-St. Paul metropolitan statistical area (MSA), including the two refineries located there, are closer to the
Bakken formation than the other large metro areas and refining centers of the upper Midwest offering Minnesota an
advantage in the form of a lowered delivered cost for crude oil. There is one operating refinery in North Dakota, the
60,000 barrel per day Tesoro facility in Mandan. Two 20,000 barrel per day refineries are under construction, and two
more with the same capacity have been proposed. All of these refineries have been designed to produce fuels to meet local
demand within North Dakota. Because of their small sizes and their local market areas, their operation would not affect the
decisions by the two Minnesota refineries to consider using crude oil from North Dakota.
The map shows Minnesota’s position directly east of the Bakken formation and the routes of rail lines and pipelines
carrying Bakken crude through Minnesota to processing facilities in the Midwest and East Coast.

IHS Economics and Country Risk | The effects of North Dakota oil production on the Minnesota economy
© 2015 IHS 80 April 2015
Minnesota
The Bakken formation is located in western North Dakota and extends into eastern Montana and southern Canada.
North Dakota and Minnesota share a 424-mile long border. The driving distance from Moorhead, Minnesota to
Bismarck, North Dakota (located at the extreme eastern edge of the Bakken formation) is approximately 200 miles.
Travel distances from other locations in Minnesota to the center of the Bakken formation are even farther, as noted
in the previous chapters of this study.
Since 2007, when annual oil production levels in the Bakken began to accelerate, North Dakota has had the highest
economic growth rates among the 50 states and District of Columbia, so the Great Recession never occurred there.
Over the same period, Minnesota’s economy performed comparatively well, generally ranking comfortably in the
top half among the states, in terms of percent changes in major economic measures.
Since 2007, annual wage growth rates in occupations and economic sectors that support crude oil production have
been between two and four times higher in North Dakota than in Minnesota due to the demands for skilled workers
in the Bakken.
North Dakota’s oil production has created opportunities for Minnesota businesses to supply the required goods and
services including: professional and business services, (e.g. engineering, architecture, staffing agencies,
environmental consulting), transportation (e.g. rail, pipeline, trucking, crew transport, and storage and distribution
services), hospitality (e.g. hotels and restaurants along the interstate highways and roads connecting the two states)
and a broad range of other inputs (e.g. frac sand, heating equipment for drilling sites, construction, concrete,
building materials, and other services).
Freight rail and oil pipeline connections

IHS Economics and Country Risk | The effects of North Dakota oil production on the Minnesota economy
© 2015 IHS 81 April 2015
Five Border Cities and their respective counties
The counties containing the five Minnesota Border Cities have experienced above-average economic growth since
2007. IHS estimates that the compound annual growth rate of total employment in the five counties between 2007
and 2014 was 0.5%, compared to 0.3% and 0.1% respectively for the Minnesota and the US. Similarly, the annual
growth rate of output in the five counties was 3.6%, again above the corresponding rates for Minnesota and the US
of 3.1% and 2.6%, respectively. Finally, the unemployment rate (not seasonally adjusted) in the five counties has
been lower than the Minnesota rate by an average of 1.3 percent points from January 1, 2007 through October
2014. In our judgment, the above-average economic growth has been due primarily to the structure of the
economy, especially favorable conditions in its largest sectors, and only minimally to the effects of North Dakota
oil production.
There is some commuting by workers from the Border Cities to the Bakken, but the long distances mean that most
commuting is done on a weekly or bi-weekly basis (i.e., work for two weeks in the Bakken, return home for 1-2
weeks, and then go back) as opposed to daily commuting. Similarly, there was little permanent migration by
residents of the five counties to the Bakken region between 2008 and 2012.
In 2013, wage levels for major occupational categories in oil production supply chain industries were substantially
lower in the Fargo-Moorhead MSA than in either far western North Dakota or the Minneapolis-St. Paul MSA. The
aggregate economy of the five Border Cities and the counties that include Border Cities is small and structurally
uniform, and therefore, does not offer many of the specialized goods and services needed in the production of
crude oil. Similarly, the presence of larger, full-service firms in the Border Cities and their respective counties has
been insufficient to meet the needs of oil and gas producers. The largest industry concentrations of employment in
2014 in the aggregate economy of the Border Cities and their respective counties are in healthcare, education
services, agriculture, and wholesale trade. The aggregate economy of the five Border Cities and the counties that
include Border Cities has below average shares of activity in the manufacturing sector and, in several service-
sectors, such as information, financial activities, and professional and business services.
The North Dakota part of the Fargo-Moorhead MSA, Cass County, is much larger than the Minnesota part, Clay
County. In 2014 IHS estimated the following shares of MSA-wide activity in Cass County: 85.7% of total
employment; 88.7% of gross county product; and 74.6% of business establishments. The shares for population
and personal income, which are compiled on a place of residences basis, were 73.4% and 76.3% respectively.
According to Census Bureau’s On the Map database, in 2011 53% of the employed residents of Clay County
worked in Cass County. As confirmation of this spatial distribution, of the 220 primary sector companies served
by the Greater Fargo-Moorhead EDC (GFMEDC), about 90% are located on the North Dakota side of the river.
Core competencies
Economy
Minnesota’s economy and population are considerably larger than North Dakota’s as noted above. In 2014
Minnesota’s total population, non-farm employment, and gross state product were approximately eight, six, and
five times respectively greater than the North Dakota totals. In all industry sectors except mining, Minnesota has at
least double the workforce of North Dakota, and, of the industries involved in the oil and gas supply chain, many
have a more significant presence in Minnesota than in North Dakota. The size effect is visible across a range of
economic sectors. In 2014, the number of people involved in management of companies in Minnesota was more
than 15 times that number in North Dakota. The number of manufacturing jobs in Minnesota was 12 times greater
than that of North Dakota. Even in the construction industry, which accounts for nearly twice the share of
statewide employment in North Dakota as it does in Minnesota, the number of people employed in Minnesota was
more than three times that of the employment base in North Dakota.
The large size of the Minnesota economy means that it has a wide degree of economic diversity, as shown by the
Shannon-Weaver diversity index presented in the economic impact analysis. Minnesota’s diverse economy was
one reason for its above-average economic performance since 2007; others include the national competitiveness of
its key economic sectors, a highly skilled labor force, and access to national markets.
Approximately 60% of Minnesota’s total employment in 2014 was in 2-digit NAICs sectors that had location
quotients (LQs) greater than 1.0, showing that employment is concentrated in sectors where the state appears to

IHS Economics and Country Risk | The effects of North Dakota oil production on the Minnesota economy
© 2015 IHS 82 April 2015
have competitive advantages. The high LQ sectors are: agriculture; utilities; manufacturing; wholesale trade;
finance and insurance; management of companies; health care and social assistance; arts, entertainment, and
recreation; other services; and local government.
Minnesota’s key economic sectors are identified by the shift-share analysis presented in the economic impact
analysis chapter. Approximately 46% of its total employment and 32% of its manufacturing employment in 2014
were in the high performing A and B sectors; this indicates that high-performing sectors account for significant
shares of Minnesota’s economic activity. The shift-share analysis identifies sectors that have potential competitive
advantages for providing goods and services to support North Dakota oil production and related spending for
infrastructure such as professional and business services, insurance, wholesale trade, financial activities,
transportation and logistics, selected durable manufacturing and specialty construction.
Minnesota houses the headquarters of many national and international firms. In 2014, there were 18 Fortune 500
companies whose headquarters were in Minnesota, and Minneapolis-St. Paul ranks first among the largest US
MSAs based on the number of Fortune 500 companies per capita.
Market Access
Minnesota has a strong intermodal and multimodal transport system that facilitates passenger & freight movement,
including an international airport, the Port of Duluth, several interstate highways, and multiple freight rail lines.
Further, the Minnesota DOT and the Metropolitan Council for Greater Minneapolis-St. Paul have been recognized
for forward-thinking transportation planning and programming, especially regarding Intelligent Transportation
Systems.
Minnesota provides access to a much larger market than can be served from most locations in North Dakota. The
Hoover’s database lists 633,207 business establishments located within a 200-mile radius of St. Paul (zip code
55155) compared to 113,681 establishments within the same distance from Bismarck (zip code 58505). By
comparison, 387,008 establishments are located within a 200-mile radius of Moorhead (zip code 56561). These
figures include establishments located in the United States and Canada.
Workforce
In 2014, Minnesota had the 3rd
highest employment/population ratio among the 50 states, behind only North
Dakota and Nebraska, two much smaller states. This finding is consistent with the below-average unemployment
rate in Minnesota for February 2015 of 3.7%, well below the US rate of 5.5%.
In 2014, Minnesota’s gross state product per capita was 14th highest among the 50 states and the District of
Columbia. North Dakota ranked second, but this is attributed to a combination of the high value of crude oil
production and its low population.
Minnesota has a highly educated labor force as shown in the educational attainment figures presented in economic
impact analysis chapter. Higher levels of educational attainment lead to increased worker productivity and are a
very attractive factor for expanding or relocating businesses. The 2012 proportions of Minnesota’s population aged
25 years and older with either a Bachelor’s degree or higher, or an advanced degree, were 32.6% and 10.7%; both
levels were above the shares in North Dakota and the US. In the Fargo-Moorhead MSA, both Cass and Clay
counties have above-average levels of educational attainment, whereas the educational attainment in the other
counties containing Border Cities is below the US average.
Minnesota’s public elementary and secondary school systems have significantly above-average performance levels
when compared to other US states, which, over the long-run, results in a more productive workforce. Minnesota
ranked in the top 10 among all states and the District of Columbia on the four 2013 National Assessment of
Education Progress (NAEP) tests listed below:
o 4th grade reading: MN score: 227, ranked 9
th; US score: 222
o 4th grade math: MN score: 253, ranked 1
st; US score: 242
o 8th grade reading: MN score: 271, ranked 10
th; US score: 268
o 8th grade math: MN score: 295, ranked 5
th; US score: 285.

IHS Economics and Country Risk | The effects of North Dakota oil production on the Minnesota economy
© 2015 IHS 83 April 2015
Minnesota’s NAEP scores were also higher than those for North Dakota on all four tests listed above, but North
Dakota’s scores for all were also above the US average, ranking in the top 10 on the two math tests.
The cost of living in the Fargo-Moorhead MSA in the third quarter of 2014 was significantly lower than in
Bismarck, Minneapolis, St. Paul, and Williston.
Border Cities and their respective counties
The five Border Cities are well served by highway, rail, and pipeline infrastructure, as shown in the context map
presented above.
One of the Fargo-Moorhead MSA’s primary competitive advantages is that it has a lower cost of doing business
than in other metros in Minnesota and North Dakota, and its costs are competitive with those in other comparably
sized metros in the upper Midwest. IHS’s business cost index value in the third quarter of 2014 for the Fargo-
Moorhead MSA was 92.6 compared to 102.3 in Minneapolis-St. Paul, and it was competitive with levels for other
smaller MSAs in the upper Midwest. Similarly, Competitive Alternatives 2014, a study by KPMG which
considered a wide range of location-sensitive business costs (e.g., labor compensation, facility, transportation, and
taxes), offers the following overall cost index results:
o Chicago, IL – 99.1;
o Minneapolis, MN – 98.2;
o Madison, WI – 96.8;
o Fargo, ND – 95.1;
o Sioux Falls, SD – 94.5; and
o Cedar Rapids, IA – 94.
While the costs of doing business in the Fargo-Moorhead are low and very competitive with those in other MSAs, the
decision by firms to locate on either the Minnesota or North Dakota side of the border varies on a case by case basis.
Obstacles
The section below describes the significant obstacles faced by Minnesota in trying to maximize the potential economic
development benefits of North Dakota oil production.
Distance to the Bakken
Typically, oil field exploration and production brings service opportunities for local businesses and workers associated
with both the capex phase (e.g. rigs-drilling; casing/cement crews; perforating; logging; installation of pumps, compressors
and artificial lift systems; and construction of gathering systems) and, to a lesser extent, the servicing of drilling rigs. While
many national oil field service companies are headquartered in Texas or Louisiana, they usually establish a local office in
areas where oil extraction is occurring, from which they hire local crews and procure equipment such as trucks, pumping
units, and mobile rigs that can move from well to well or job-to-job.
For Minnesotan suppliers of these types of services, the state’s location, despite its shared border with North Dakota, is not
close enough to serve as a primary source of competitive advantage. The map presented above shows the distances from
locations in Minnesota to the Bakken. The majority of all the locations permitted for drilling in the Bakken over the past
two years have been in the upper Northwest corner North Dakota, more than 175 miles due west of Grand Forks, the
nearest city on the Minnesota/ North Dakota border. As a point of reference, the one-way driving distance from Moorhead
to Bismarck is 200 miles. Current activity is occurring further away, at more than 240 miles from Grand Forks. The one-
way driving distances from Moorhead and St. Paul to Williston, the center of the recent drilling activity, are 424 miles and
663 miles, respectively. Other support offices servicing wells in the Williston basin are located in Dickenson or Minot, all
within 100 miles or less from the current wells and within 150 miles of permitted locations.
In addition to the oil and gas (O&G) service opportunities that stem from drilling operations are often business
opportunities for relevant manufacturing sectors. However, proximity is even less of a determining factor in the oil & gas
industry’s choice of equipment suppliers. Rather, the materials used in drilling, production, and related construction are
industry-specific, with established manufacturing centers providing equipment and materials tailored to those needs and
relationships previously established between exploration and production companies and their vendors. In fact, even some

IHS Economics and Country Risk | The effects of North Dakota oil production on the Minnesota economy
© 2015 IHS 84 April 2015
of the Minnesota firms working in the Bakken today got their first opportunities to provide equipment or services to the oil
and gas industry through work in other oil-producing states in the East or Western US.
A 2013 study by the Federal Reserve Bank of Minneapolis further confirms the limited reach of the Bakken impact. It
found that the significant impact of the Bakken oil production activity on increasing wage levels and reducing
unemployment rates occurred within a 100-mile radius. While annual wage rates in the Fargo-Moorhead MSA rose over
the last seven years, on an overall basis, they were not directly affected by activity in the Bakken.
Workforce issues
The low current unemployment rates in Minnesota, the Minneapolis-St. Paul, and Fargo-Moorhead MSAs indicate tight
labor markets, and possible upward pressure on wages in occupations that are in short supply. The labor force in the five
counties that include Border Cities is small with only 64,700 workers in November 2014, while unemployment rate is even
lower than for Minnesota and the Minneapolis-St. Paul MSA.
While North Dakota oil production may have been a draw for professionals and skilled laborers across the state, the
Bakken is just one of many factors contributing to a tight labor market in Minnesota. Other factors include the state’s
above-average economic performance, high skill level of the labor force, high employment/population ratio, and its above-
average labor force participation rate.
Increase in North Dakota’s oil and gas tax revenues
The economic impact analysis noted North Dakota’s total state revenues rose at a compound annual growth rate of 20.8%
between 2007 and 2013. North Dakota has been using this revenue windfall for a variety of purposes, including tax
reductions, infrastructure spending and business incentives, among other spending.13,14
Between 2007 and 2013, the
commercial loan portfolio of the Bank of North Dakota, which provides business participation loans, grew from $0.7
billion to $3.5 billion.15
Even with the projected decline in oil tax revenues over the next several years, North Dakota will
still be able to offer economic development incentives and pay for programs to improve the quality of infrastructure and
government services as many of the dedicated funds currently have substantial balances. North Dakota forecast in January
2015 that it will collect $300 million in oil and gas production and extraction taxes during both the 2013-15 biennium that
ends June 30, 2015 and during the 2015-17 biennium.16
Local delays caused by unit trains
Some stakeholders expressed concerns that the high numbers of unit trains passing through the Border Cities each day
were creating bottlenecks at at-grade rail crossings, resulting in delays inhibiting business and daily life. Approximately
nine unit trains per day, or just over 3,300 for the entire year, carrying North Dakota crude oil passed through Minnesota in
2014. IHS forecasts the following levels of unit trains carrying crude oil from North Dakota that will travel through
Minnesota under the three crude oil price scenarios considered in this report.
$90/barrel for West Texas Intermediate: six trains per day in 2015-2016, rising to 11 per day by 2020 and 17 per
day by 2030
$70/barrel for West Texas Intermediate: five trains per day in 2015-2016, rising to seven per day by 2020, and then
11 per day by 2030. If the proposed new pipelines, such as the Sandpiper are completed, the levels will be five
trains per day in 2015, declining to zero starting in 2020
$50/barrel for West Texas Intermediate: three trains per day in 2015, falling to one per day by 2020, and to zero by
2030.
One unit train per day carrying Canadian crude will also cross Minnesota from 2015 onward under all three oil price
scenarios.
13 North Dakota Department of Revenue, North Dakota Oil and Gas Revenue Allocations 2011-1023 Biennium, 2014.
http://www.ndoil.org/image/cache/wardner.pdf. 14 National Conference of State Legislatures, State Revenues and the Natural Gas Boom: An Assessment of State Oil and Gas Production Taxes, June
2013. http://www.ncsl.org/documents/energy/pdf_version_final.pdf 15
Bank of North Dakota, Annual Reports for 2007 through 2013, March 2015.
http://banknd.nd.gov/lending_services/business_financing_programs/commercial_bank_participation_loan_program.html. 16 North Dakota Legislative Council, 2015-17 Biennium Revenue Forecast Adjustments – General Fund and Oil Tax Collection, January 2015.

IHS Economics and Country Risk | The effects of North Dakota oil production on the Minnesota economy
© 2015 IHS 85 April 2015
There are 28 public at-grade railroad crossings in Moorhead, and 120 in Clay County17
, about 30 of which are located
along the main BNSF rail line that goes through Fargo and Moorhead in an east-west direction. By comparison, there are a
total of 4,291 public at-grade rail crossings in Minnesota, many of which are on low-traffic spur lines that serve industrial
plants and parks, and agricultural storage and processing facilities. One direct effect of unit trains when they pass through
cities such as Moorhead is to temporarily disrupt local traffic patterns, unless alternative routes are available such as
tunnels under or bridges over the rail line. While delays associated with train traffic can best be eliminated through the
removal of at-grade rail crossings, conversations with the Minnesota DOT did not confirm how many (if any) of the 10 rail
crossings targeted for improvement by the MnDOT in 2015 are in Moorhead.
Minnesota Governor Mark Dayton recently proposed spending $330 million over the next 10 years to make at-grade rail
crossings safer from passing trains carrying crude oil.18
A total of 71 high priority rail improvement projects were
presented, including three in Moorhead.
The “edge effect” and business costs
Minnesota’s Border Cities and Fargo, North Dakota are almost equally distant from the Bakken, so firms seeking
opportunities associated with North Dakota oil production can choose to locate in either state within the Fargo-Moorhead
MSA. In an MSA like Fargo-Moorhead that straddles two states, differences in state and local tax rates can be a decisive
factor for a firm’s location decision, even if the levels for other variables are similar such as wages, land costs, utility rates,
transportation accessibility, and quality of local services. In these situations, the value of the economic development
incentive package can also be a determining factor19
.
Prospects
As was mentioned in the IHS economic impact analysis, the overall increases in economic activity in Minnesota directly
attributable to North Dakota oil production and related activities (i.e., infrastructure spending and agriculture price effects)
will be small; in proportional terms the increases will range between 0.4% and 0.9% over the IHS forecast baseline for
Minnesota during the peak year of spending in 2016. The increases in economic activity in the five Border Cities and their
respective counties from the backward linkages will also be small in both absolute and percent terms because companies
located there are not major suppliers of goods and services used in the production of crude oil. However, a number of
policies or programs could help the state and the Border Cities address existing challenges and derive additional economic
development opportunities from the oil production occurring in North Dakota.
Statewide opportunities include:
Educate Minnesota firms about North Dakota opportunities
While the major suppliers of goods and services to North Dakota oil producers tend to be larger, full-service firms with
national reach and established experience working with the oil and gas industry, there are opportunities for Minnesota
businesses to meet the specific demands of firms operating in the Bakken oil field. These include examples from across the
state including frac sand from southeastern Minnesota, engineering and technical services from the Twin Cities; heating
equipment from Alexandria, crew transport services from Fergus Falls, garage doors for maintenance buildings and
specialized equipment for transporting pipe from Bemidji, professional services from Moorhead, and many others.
As such, statewide Minnesota economic development organizations, chambers of commerce, and other business
associations have an opportunity to make their business members aware of North Dakota oil production opportunities and
the risks and requirements of serving this industry and its corresponding supply chain.
Minnesota may also wish to replicate the success of other states who have undertaken significant work to educate local
businesses about opportunities to participate in nearby oil and gas production activities. One example is the Canton
Regional Chamber of Commerce in Canton, Ohio. There, the Chamber hosts an annual Utica Summit to evaluate the
17
Federal Railroad Administration, Office of Safety Analysis, Public At-grade Vehicle Rail Crossings in the State of Minnesota by City, County, and
Principal Warning Device, March 16, 2015.
http://safetydata.fra.dot.gov/OfficeofSafety/publicsite/Query/PublicGradeCrossingInventoryByStateCounty.aspx 18
Minnesota Star Tribune, “Dayton proposes spending $330 million to upgrade rail safety”, March 13, 2015.
http://www.startribune.com/local/296219451.html 19
Moran, Stahl & Boyer. Industrial Park Positioning Strategy. October 2014.
http://apps.cityofmoorhead.com/sirepub/cache/2/wyxz4s550jdppxeaiyjion55/13786403242015040603857.PDF

IHS Economics and Country Risk | The effects of North Dakota oil production on the Minnesota economy
© 2015 IHS 86 April 2015
potential business, manufacturing and transportation opportunities created by natural gas extraction in the Utica Play.20
With over 200 attendees, participants gain updated information on the Utica gas field development and discuss the
opportunities stemming from the downstream use of Utica energy, from chemicals and plastics manufacturing to CNG
commercial transportation.21
The Allegheny Conference on Community Development in Pittsburgh, Pennsylvania provides another example. There, in
addition to working with oil and gas industry employers to create training programs to prepare the local workforce for
participation in upstream, downstream, and midstream opportunities associated with the Marcellus Shale unconventional
energy resources, the Allegheny Conference has also worked with industry to put on several supply chain seminars for
local manufacturers and providers of technical services. Through these, they identified 325 small manufacturing and
technical companies that have the capacity to be suppliers, including companies who could haul wastewater, repair
fracking equipment that had previously been sent back to Texas for repair, and provide auto and truck bodies.
While such efforts have taken place in these other oil producing states, to date, relatively few concentrated efforts have
been taken have been undertaken in Minnesota to expose local businesses to opportunities associated with the Bakken oil
production and its corresponding supply chain. However, two organizations have played a role in exposing local Minnesota
businesses to opportunities in the Bakken. The first is the Highway 2 West Manufacturers' Association (H2WMA), which
held its first meeting on the topic in December 2012 with the former Executive Director of Williston Economic
Development. Just over a year later, in February 2014, H2WMA was invited to hold a meeting at The Bakken/ Three Forks
Shale Oil Innovation Conference & Expo in Grand Forks, ND22
and drew over 200 people to this session. During the
meeting, titled “What Can H2W Members Offer to the Bakken Region?”, H2WMA member companies who saw their
products as potentially relevant to Bakken oil production held table-top displays and had an opportunity to explain more
about their company’s products in five minute presentations. In addition, the H2WMA has set up a webpage titled
“Manufacturing Opportunities with the North Dakota Bakken Oil Patch” although the page serves more to recap H2WMA
events on this topic than to offer information relevant to becoming a supplier.23
Unfortunately, the H2WMA also does not
have information on the end results of these activities thus far.
In another example, Fergus Falls Economic Improvement Commission staff traveled to the Bakken oil fields in summer
2012 to find opportunities for local businesses as well as promote Fergus Falls to those residents that no longer wished to
live in the Bakken. Meetings were held with the Williston Rotary Club, the Williston Economic Commission, and selected
business leaders and identified opportunities in housing (including supplying electrical, plumbing, and service sector
support) as well as trucking and other repair services for the oil industry. Subsequently, the Fergus Falls EIC organized a
bus trip to the region to provide local businesses with an opportunity to explore opportunities in the Bakken oilfields and
the corresponding regional development in Western North Dakota.
Evaluate forward linkage opportunities
The economic impact assessment identified a list of downstream economic sectors that use crude oil or refined products as
inputs. Minnesota’s location puts it in a position to potentially benefit from North Dakota and Canadian oil production as
the delivered cost of crude oil is lower there than in other places in the Midwest. The state is also well connected to the
regional rail and oil pipeline networks as shown in the context map in the description of Minnesota’s situation, so that
refined petroleum products from the Twin Cities can be sent to the large markets to the south and east. There are two
refineries in the Minneapolis-St. Paul MSA that are potential users of the Bakken and Canadian crude oil which provide
fuel to Minnesota and the adjacent states. Both refineries are designed primarily to refine the heavier Canadian crude oil,
but can process some Bakken light sweet crude oil. To fully benefit from increased supply of Bakken crude that will occur
if the Sandpiper pipeline is completed as projected by 2017, additional capital investments and refinery reconfiguration
may be required. The expansion opportunities will be defined by investment costs and potential market benefits compared
to other refining locations. The potential future development of other forward linkage sectors in Minnesota, such as
petrochemicals and energy-intensive industries such as food manufacturing, will depend on increasing the supply of
refined petroleum products used as inputs by these other sectors that are available at a competitive cost.
20 http://www.cantonrep.com/article/20131022/News/310229818 21 http://www.cantonrep.com/article/20131022/News/310229818#ixzz3QauRPnip to see examples from Ohio, PA— 22
See http://thebakkenconference.com/ema/DisplayPage.aspx?pageId=Home for more info on this annual conference, occurring again in July 2015. 23 http://www.h2wma.com/Pages/MfgOpportuntywithBakken.aspx

IHS Economics and Country Risk | The effects of North Dakota oil production on the Minnesota economy
© 2015 IHS 87 April 2015
Provide transportation infrastructure improvements
As both governments and private sector companies work to improve transportation infrastructure to accommodate the
additional demands North Dakota oil shipments place on the inter and intra-state roads, railways, and pipelines, economic
opportunities abound for Minnesota planners, engineering firms, maintenance workers, and other companies offering
transportation related products or expertise. These opportunities are due, in large part, to BNSF’s recent record levels of
capital spending, of which $150 million was spent in Minnesota alone in 2014.
In the years ahead, the economic development opportunities associated with Bakken oil-influenced rail transportation
infrastructure investments in Minnesota will come primarily from BNSF and Canadian Pacific, as MnDOT has indicated it
has not assessed or calculated any incremental costs/expenditures associated with Bakken oil shipments and the State of
Minnesota only has allocated limited funding for rail service improvements ($5 million out of a total of $4.594 billion for
State Transportation Improvement Funding for 2015-17) including the elimination of 10 at-grade rail crossings throughout
the state. Meanwhile, BNSF has planned 2015 capital investments of $120 million in rail capacity, network replacement
and maintenance, and implementation of Positive Train Control technology in Minnesota and $400 million in North
Dakota. Despite recent record levels of spending on capital improvements, as a private company, BNSF’s level of
investment in rail infrastructure will be determined by the overall level of demand for its services (which will be impacted
by both the level of overall oil production occurring in the Bakken as well as the amount of oil shipped by pipeline rather
than rail.)
In addition, cities near the planned Sandpiper pipeline which, if approved, will deliver Bakken light crude oil to North
American refineries in the Midwest and along the East Coast can expect a boost to their local economy throughout the
planning and construction process.
Benefit from the wealth effect
With oil production creating a large North Dakota budget surplus and contributing to a per capital personal income growth
rate of more than 6% (almost double that of Minnesota’s) between 2003 and 2013, Minnesota has an opportunity to take
advantage of the overall income and wealth effects occurring in North Dakota by providing retail, recreation, construction,
and hospitality services. As noted in the economic impact analysis table on economic and social indicators, North Dakota’s
per capita personal income expanded at a compound annual growth rate of 6% between 2004 and 2014, compared to 3% in
Minnesota. To determine how best to take advantage of North Dakota’s oil-generated wealth, additional analysis should be
undertaken to further investigate North Dakota’s demand for luxury goods, what products or services are not available in
North Dakota (or either in limited supply or more expensive there than in Minnesota), tourism destinations for shopping or
outdoor recreation, and the reasons why North Dakotans visit neighboring states.
Support investments in infrastructure and public services
Some of the ‘indirect’ impacts on Minnesota businesses are not directly associated with North Dakota oil production, but
rather the income effects and corresponding tax revenue that have resulted in North Dakota city and state investments in
civil infrastructure and public services. Examples include upgrades to city buildings, water and wastewater treatment
plants, and schools. With North Dakota’s plans to use a substantial share of its tax revenues from oil and gas to improve
infrastructure and increase the quality of its public services, Minnesota companies will have opportunities to provide a
range of the goods and services required; many of which may not be available in North Dakota due its smaller size and
lower economic diversity. In February 2015, North Dakota approved a $1.1 billion “surge” funding bill to pay for
infrastructure improvements in the cities and counties in the western part of the State that have been most significantly
affected by oil production in the Bakken formation.
Provide workforce education and skills training
As work opportunities in North Dakota continue to make competition for skilled labor even tougher in Minnesota, they
should also increase statewide awareness of the need to prioritize investments in relevant technical education and training
programs on Science, Technology, Engineering & Math (STEM) and other skills required by Minnesota employers. For
example, the Manufacturing Day program undertaken by the Fargo-Moorhead Economic Development Corporation for the
past two years to provide students with hands-on manufacturing experience through a tour of local manufacturing facilities
including American Crystal Sugar, Cardinal IG, Fargo Automation and Swanson Health Products could be replicated or
expanded. Meanwhile, the Valley Prosperity Partnership could play a lead role in “Developing Trades, STEM, and Other
Career Awareness, Pathway, and Promotion Campaigns” as workforce attraction, development and retention was also

IHS Economics and Country Risk | The effects of North Dakota oil production on the Minnesota economy
© 2015 IHS 88 April 2015
called out as one of the next steps for improving the economic future of the Red River Valley, which includes regions of
both North Dakota and Minnesota.24
Another example of the type of education program that is being developed in Minnesota to support local industry and
could be expanded or replicated elsewhere is the Academies of Alexandria learning academy that launched in the fall of
2014 at Alexandria Area High School in Alexandria, MN. At this senior high school, the nationwide concept of Small
Learning Communities (SLCs) is being applied to prepare Alexandria area students for college and career opportunities. In
addition to requiring students to undertake a core curriculum of English, Math, Science, Social Studies, PE/Health, and
General/Global Electives, students are provided with project-based, interdisciplinary learning that gives them 'real world'
experience and provides connections with local businesses and professionals. The Academies of Alexandria provide
students with curriculum informed by local employers, links schoolwork and real life work skills to provide students with
employable skills, and plans for all students to have the opportunity to undertake an internship before graduation.25
Outside Minnesota, Colorado provides an example of a state that has designed workforce initiatives to increase the supply
of skilled workers to meet the growing energy industry’s needs. As part of this, the Colorado Online Energy Training
Consortium (COETC), founded with a grant for $17.3 million from the Trade Adjustment Assistance Community College
and Career Training (TAACCCT) program of the US Department of Labor, brings together 15 community colleges across
Colorado, the Colorado Department of Labor & Employment with its ten regional workforce centers, and many local
energy employers to redesign curricula and upgrade the equipment used in training facilities to equip unemployed and
under-employed workers with the skills required for placement in some of Colorado’s most in-demand energy industry
jobs. At the university and graduate levels, the Colorado School of Mines, Colorado State University, University of
Colorado, and University of Denver are also playing a role. The Global Energy Management (GEM) Program at the
University of Colorado Denver Business School offers a hybrid-online Master of Science (MS) degree program including
graduate business courses (accounting, finance, strategic management, marketing, economics, etc.) exclusively designed to
develop future leaders in the energy industry. The Colorado School of Mines is in the top ten schools graduating petroleum
engineers and, in addition to serving the energy industry’s demand for skilled workers; Colorado State University and the
University of Denver provide students with research opportunities that enable them to go into Research & Development
(R&D) positions within the energy industry.
Form cross border initiatives
Despite the perception by some that there is a cultural divide between North Dakota and Minnesota, there are a number of
areas where bi-state or cross-border collaboration initiatives are already underway that could be strengthened or expanded
to improve both states’ economic development opportunities associated with the Bakken oil field production. Two of these
include:
Building Transportation Infrastructure
As noted in the transportation analysis, the Sandpiper oil pipeline, if completed as planned by 2017, will divert a
substantial volume of crude oil from rail to pipeline, reducing the demand for rail capacity. Even with the reduction in rail
demand, units trains carrying crude will still continue to move eastward across Minnesota. Therefore, a second area where
cross-state collaboration will be essential is the coordination of transportation infrastructure planning, regulation, and
improvement. MnDOT would benefit from coordinated statewide planning to support goods movement and consideration
of public private partnerships to accelerate infrastructure investments. Metropolitan Planning Organization (MPO), the
Fargo-Moorhead Metropolitan Council of Governments (Metro COG)26
provides the opportunity for multi-state
coordination to identify rail transportation projects and funding needs. This is an important step to establish a programming
timeline for investments and coordination with each state’s department of transportation as they formalize State
Transportation Implement Plans. Coordination will be essential to increasing the regional transportation system capacity
and ensuring system-wide maintenance consistent with goods movement demand. MetroCOG has an opportunity to
advance projects that support the region’s economic well-being, safety, health and environment.
Educating & training the local workforce
24 http://www.valleyprosperitypartnership.com/cooperating-beats-competing/ 25 http://www.alexandria.k12.mn.us/domain/589 26 http://www.fmmetrocog.org/new/index.php?id=22

IHS Economics and Country Risk | The effects of North Dakota oil production on the Minnesota economy
© 2015 IHS 89 April 2015
A focus on workforce development and education should not be limited to Minnesota and, in fact, there are many existing
collaborative efforts taking place across the border at various levels of education and workforce development. Examples
include:
At the high school level, the Northern Valley Career Expo exposes nearly 1500 sophomores from 27 high schools
in Grand Forks, North Dakota and East Grand Forks, Minnesota area annually to opportunities in business on both
sides of the border. The Manufacturing Day program undertaken by the Greater Fargo-Moorhead EDC (mentioned
above) also involved both Minnesota and North Dakota high school students and toured companies in both states.
The Northland Community & Technical College, with campuses in East Grand Forks and Thief River Falls, offers
community college education and technical skills training programs for students on both sides of the border that
include commercial vehicle operations, construction electricity and plumbing, sales marketing and management,
supervisory leadership, and welding. Such programs have the potential to provide Minnesota and North Dakota
employers as well as the North Dakota oil and gas industry and its supply chain with qualified workers.
At the university level, the Tri-College Consortium brings Concordia College and Minnesota State University-
Moorhead in Minnesota and North Dakota State University (NDSU) in Fargo, North Dakota together to prepare
the local workforce with the technical skills required by companies operating in both states. North Dakota and
Minnesota universities already have reciprocity agreements that allow residents to pay a special tuition rate that is
lower than the normal non-resident rate when attending a state institution of higher learning in the neighboring
state.
By expanding programs and initiatives such as these to include a focus on the shared skills required both by North Dakota
and Minnesota employers serving the North Dakota oil production industry and its supply chain (e.g. construction,
engineering, and business), the current skilled worker shortage can be addressed through a collaborative bi-state approach.
For example, the Shale NET program initially started by Westmoreland County Community College in Youngwood,
Pennsylvania to create an effective and efficient entry level training program to meet the local oil and gas industry’s
workforce needs has now expanded to include 20 recognized training providers in four states, and provides an example of a
multi-state, public-private initiative focused on training the highly skilled workforce demanded by the unconventional
energy industry.27
Maintain competitiveness of Border Cities
In addition to the opportunities mentioned above to support statewide economic development corresponding with a recent
increase in North Dakota oil production, the current situation also raises the opportunity to take actions that will
specifically benefit the Border Cities and Northwest Minnesota. These include:
Help Border Cities to mitigate the “edge effect”
As noted in the economic impact assessment, the “edge effect” predates the recent increase in North Dakota oil production
as the original version of the Border Cities legislation was enacted in 1987. However, North Dakota’s recent tax revenue
windfall produced by increase in crude oil production has made it possible to reduce a variety of state and local taxes and
make improvements in civil infrastructure and public services, making the edge effect all the more significant. The Border
Cities legislation addresses this issue by allowing the five Border Cities (Breckenridge, Dilworth, East Grand Forks,
Moorhead, and Ortonville) to establish Border-Cities Enterprise Zones which can provide a variety of economic
development incentives, such as disparity reduction property tax credits, low cost debt financing for new construction, tax
credits for new job creation and sales tax credits for purchases of certain types of equipment. As these incentives help to
mitigate the “edge effect” by providing business tax credits to qualifying businesses that are the source of investment,
development, and job creation or retention, policies such as these can continue to play a role in supporting Border Cities as
Northwest Minnesota’s economy adjusts to reflect recent developments in the Bakken.28
Before recommendations can be made for either expanding these incentives or increasing marketing about the value and
equity of existing policies, Minnesota’s economic development practitioners should seek more detailed information about
27 https://www.shalenet.org/about 28 http://mn.gov/deed/business/financing-business/tax-credits/border-cities/

IHS Economics and Country Risk | The effects of North Dakota oil production on the Minnesota economy
© 2015 IHS 90 April 2015
what businesses considering investment in the region to take advantage of the Western North Dakota oil production see as
the primary differences between the pros and cons of locating on each side of the border.
Supporting bi-state efforts for business attraction & retention
As mentioned earlier, ND’s influx of wealth and planned investments in infrastructure and public services make it all the
more essential for the two states to collaborate on economic development initiatives that benefit both sides of the border.
The Greater Fargo Moorhead Economic Development Corporation provides one example of an organization that is already
marketing the cross-border area and combining data from both states to produce a combined list of job openings,
incentives, available sites/ commercial real estate, available capital, R&D activity, and cultural attractions, recreational
facilities, and other factors that contribute to quality of life.29
The Grand Forks-East Grand Forks Chamber of Commerce
also works to ‘Inform, Promote, Advocate, Connect and Educate’ businesses and community members across both states
about opportunities for business expansion, education, and residential living. Meanwhile, representing the economic
centers of Fargo-Moorhead, Grand Forks-East Grand Forks, and Wahpeton-Breckenridge, the Valley Prosperity
Partnership has been formed to identify common strategic economic development opportunities throughout the Red River
Valley spanning the borders of Minnesota and North Dakota. All of these organizations already play a role in facilitating
cross border economic development initiatives and could play the additional role of educating local businesses in both
states about the opportunities associated with Bakken oil production and the corresponding opportunities.
Expectations
Despite the recent fall in oil prices and projected relatively lower level of oil related revenues, the energy production
forecast included in this report indicates that North Dakota will continue to be a major player in US oil production.
However, sentiment regarding the opportunities versus challenges this will impose on the Minnesota economy varies by
industry, personal experience, and location within the state.
In order to create a cohesive vision to maximize opportunities and mitigate the challenges associated with North Dakota oil
production, Minnesota DEED, the Minnesota Chamber, and other statewide groups might take a lead role in getting this
issue on the agenda of local and bi-state economic and business development organizations. Specifically, the state has an
opportunity to:
Make local businesses aware of the opportunities to get involved in the crude oil production supply chain—what
standards or qualifications are required, contracting requirements, timeframes, risks, permitting requirements,
insurance, certifications and training required for workers, etc.
Alert local businesses about the opportunities to get involved in supplying both states with relevant transportation
and civil infrastructure and other goods and services that will be required in North Dakota as it continues to invest
heavily in expanding the capacity and quality of its infrastructure and government services.
Evaluate opportunities to take advantage of North Dakota’s increasing wealth and per capita incomes and supply
products or services that are not available within North Dakota.
Design education and training programs that produce workers with the STEM skills required not only by the oil
and gas industry but also with other local employers.
Seek legislative appropriations to undertake transportation infrastructure upgrades to reduce bottlenecks and
improve transportation efficiency along public transportation corridors and work collaboratively with the privately
owned railways to expedite the planned rail upgrades.
Proactively seek areas for collaboration with North Dakota on economic development, transportation
infrastructure, education and workforce development, and other areas of mutual interest.
Assess the feasibility and value of expanding the set of economic development incentives that can be offered in the
development districts under the Border Cities legislation in order to mitigate the “edge effect.” Increasing the
incentive package could include increasing maximum levels of grants and loans that can be made, lengthening the
period of time over which tax credits and exclusions are available, reducing interest rates on loan programs,
29 http://gfmedc.com/

IHS Economics and Country Risk | The effects of North Dakota oil production on the Minnesota economy
© 2015 IHS 91 April 2015
expanding the types of purchases for which tax credits or refunds are available, and ensuring that developable
greenfield or brownfield sites have the required types and sizes of buildings, utility services, and access to critical
transportation infrastructure.
In this report, the IHS forecasts on oil production, transportation, and statewide economic impacts provide background
material and justification for initiating future conversations regarding opportunities for Minnesota businesses to benefit
from oil production occurring in the Bakken formation. Groups such as the Minnesota Department of Employment and
Economic Development, the Minnesota Chamber of Commerce, local chambers of commerce along the North Dakota-
Minnesota border and pipeline/ rail corridors, the Greater Fargo-Moorhead EDC, the Red River Valley Prosperity
Partnership, and Enterprise Minnesota might all play a role, building on the areas where they are already focused or well
positioned to work with businesses and local supporting institutions. As appropriate, other economic development
initiatives targeting specific regions of the state or industries (e.g. the Minneapolis-St. Paul Regional Cluster Initiative,
Greater MSP, and other industry-specific trade associations) might also be engaged.
With proactive effort to engage and support local supplier businesses, and ongoing monitoring of North Dakota oil
production activity, Minnesota can expect to make the most of the modest impacts that IHS forecasts will be associated
with continued Bakken oil production through 2030 and the additional opportunities associated with forward linkages, the
wealth effect, and cross border collaboration.