Embed Size (px)
Citation preview
VI Simpósio Ítalo Brasileiro de Engenharia Sanitária e Ambiental
II-091 - ACTIVATED SLUDGE TREATMENT PLANTS: A DYNAMIC SIMULATION MODEL DEVELOPMENT
D. Caniani ( 1) (DIFA) Dept. of Engineering and Physics of Environmental, Basilicata University C. Cavuoti (DIFA) Dept. of Engineering and Physics of Environmental, Basilicata University S. Masi (DIFA) Dept. of Engineering and Physics of Environmental, Basilicata University I.M. Mancini (DIFA) Dept. of Engineering and Physics of Environmental, Basilicata University Address(1): Campus Macchia Romana, 85100 Potenza, Italy, Tel (+39) 0971 205159, Tel (+39) 0971 205209 Fax (+39) 0971 205160, e-mail [email protected], e-mail [email protected] ABSTRACT Research is currently being carried out on water quality pollution problems at DIFA (Dept. of Physics and the Environment), University of Basilicata. Its focus is environmental models definition with the aim of developing a user-friendly tool for integrated water quality management simulation. Thus, it has been necessary to study each single segment of the water systems (sewage, wastewater treatment plant, receiving water body) and facilitate the correlation of their outputs. To these ends a wastewater treatment plant model has been developed which can be integrated with a river water quality model drawn up in earlier research activity at DIFA. In this work the development of a wastewater treatment processes model is described. Two wastewater treatment plants in the city of Matera (South Italy), with the same flowsheets and similar dimensions but extremely different qualitative characteristics for influent: one domestic and the other a mixture of urban and industrial waste, have been selected as a case study. Simulink of Matlab has been chosen as the programming environment for model development on the basis of its wide use in scientific fields for dynamic simulations. The kinetic equations implemented have been derived, with some modifications, from those described in model ASM N.1, the first one developed from the IAWPRC (International Association on Water Pollution Research and Control). The sensitivity analysis has shown that all the components of the model have an elevated sensitivity to the bH and to the µA. The model, calibrated with the use of experimental data, shows good agreement between calculated and observed values. An application of the model developed for one plant for operational purposes, produced an incomplete nitrification under experimental observation. By varying operational parameters, such as sludge and mixed liquor recycle and oxygen transfer coefficient, it was possible to state that the latter factor permits a complete nitrification. Further studies will concentrate on the correlation of model outputs with the inputs of the river water quality model, thus overcoming the limits posed by the remarkable diversity of the parameters describing each segment, which are typical of many stand alone software described in literature. KEYWORDS: activated sludge, simulation model, wastewater treatment, sensitivity. INTRODUCTION Recent Italian legislation on water (DLGS 152/99) has introduced stricter standards for wastewater treatment plant effluents in relation to both receiving water bodies and influent wastewater. Moreover, along with pre-existing quality objectives for specific beneficial uses, the same law introduced environmental quality objectives for surface water bodies, which aim to safeguard both the self cleansing capacity of rivers and the presence of a broad range of animal and plant species. Therefore, it is necessary to:
• upgrade the wastewater treatment plants through optimisation of their management or structural change.
VI Simpósio Ítalo Brasileiro de Engenharia Sanitária e Ambiental
• program actions to determine the state of water quality in receiving water bodies, and for the achievement of environmental quality objectives.
Such actions have to be programmed in a way that facilitates integration between the WWTP and the river, as established in laws 36/94 and 183/89. Given that the main objectives of an optimal wastewater treatment plant management are operation stability and treatment efficiency reliability, with a minimal waste of resources, the most important questions to resolve are:
• The influent parameter variability (discharge, loads, temperatures, etc.); • The time necessary for an operational variable to reach a new value for input parameter variation.
Such problems can only be solved with a numerical model that, with zero risk for the plant, can try out various management options in establishing a stable working situation.
VI
Sim
pósi
o Ít
alo
Bra
sile
iro
de E
ngen
hari
a S
anitá
ria
e A
mbi
enta
l AB
ES -
Asso
ciaç
ão B
rasi
leira
de
Enge
nhar
ia S
anitá
ria e
Am
bien
tal
COMPONENTS
1
2
3
4
5
6
7
8
9
10
11
12
Process rate ,
ρ j (ML-3T-1)
SI
SS
XI
XS
XBH
XBA
XP
SO
SNO
SNH
SND
XND
gCOD/m3 gCOD/
m3
gCOD/
m3
gCOD/m3gCOD/m3gCOD
/m3 gCOD/
m3
gCOD/m3 gNO3-N/
mc
gNH3-N/
mc
gN/
mc
gN/
mc
1 a
erob
ic g
row
th o
f het
erot
rops
-1/Yh
1
-(1-
Yh)/Yh
-Ixb
µh (SS/(KS+SS)) (SO/(KOh+SO)) Xbh
2 a
noxi
c gr
owth
of h
eter
otro
ps
-1/Yh
1
-Ixb
-(1-
Yh)/(2,86
*Yh)
µh (SS/(KS+SS)) (SO/(KOh+SO))
(SnO/KnO+SnO)) eg Xbh
3 a
erob
ic g
row
th o
f aut
otro
phs
1
-
(4,57-
Ya)/Ya
1/Ya
-Ixb-
(1/Ya)
µa (Snh/(Knh+Snh)) (SO/(KOa+SO)) Xba
4 D
ecay
of h
eter
otro
ps
1-Fp
-1
Fp
Ixb-
Fp*Ixpbh Xbh
5 D
ecay
of a
utot
roph
s
1-Fp
-1
Fp
Ixb-
Fp*Ixpba Xba
6 A
mm
onifi
catio
n of
so
lubl
eorg
anic
nitr
ogen
1
-1
KaSnd Xbh
7 H
ydro
lysi
s of e
ntra
pped
or
gani
c
1
-1
Kh ((XS/Xbh)/(KX+(XS/Xbh)))
((SO/(KOh+SO)) + eh (Koh/(Koh+SO))
(SnO/(KnO+SnO)) Xbh (Xnd/XS)
PROCESSES
1
-1
8 H
ydro
lysi
s of e
ntra
pped
or
gani
c ni
trog
en
Kh ((XS/Xbh)/(KX+(XS/Xbh)))
((SO/(KOh+SO)) + eh (Koh/(Koh+SO))
(SnO/(KnO+SnO)) Xbh (Xnd/XS)
Soluble inert organic matter
rate
articulate inert organic matter
lowly biodegradable substrate
ctive heterotrophic biomass
ctive autotrophic biomass
articualte products arising from ecay
xygen
itrate and nitrite
itrogen
oluble biodegradable organic Nitrogen
articulate biodegradable organic itrogen
Readily biodegradable subst
P
S
a
a
Pbiomass d
O
N
N
S
PN
3
Tab.
1 C
ompo
nent
s and
pro
cess
es in
the
mod
el


VI Simpósio Ítalo Brasileiro de Engenharia Sanitária e Ambiental
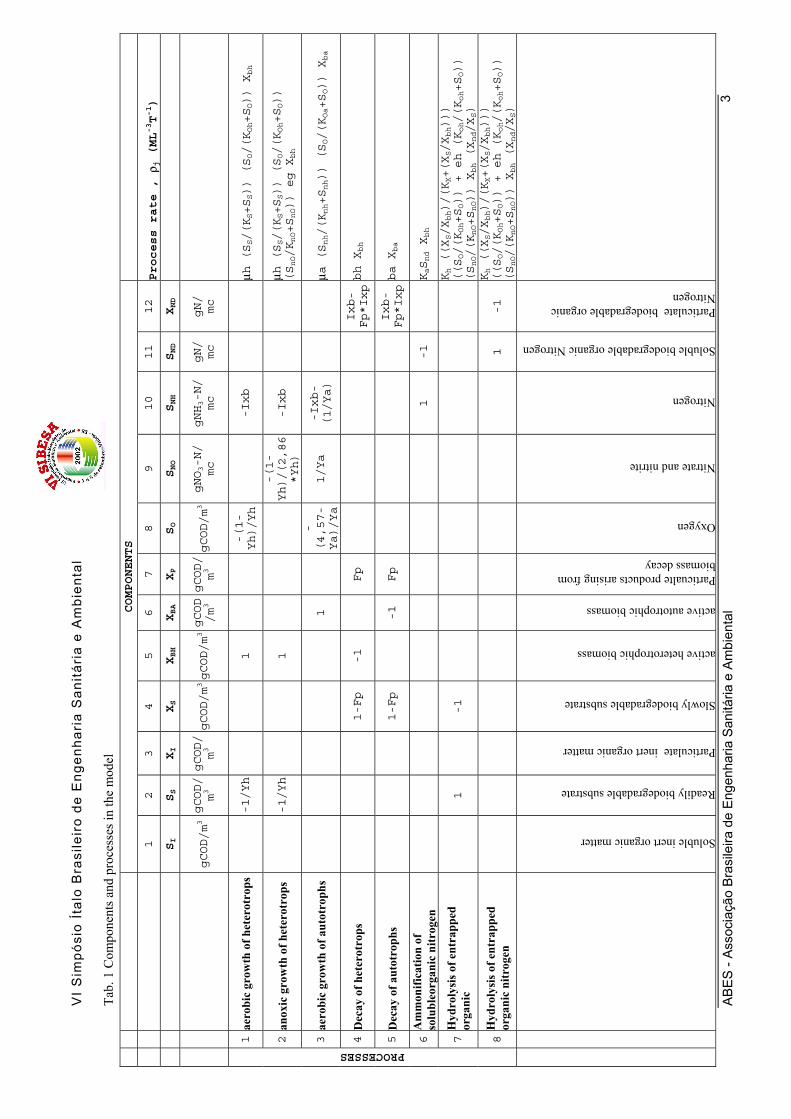
THE MODEL The model has 13 components and comprises biomass, organic substrate, inert organic compounds, nitrogenous substances, dissolved oxygen and alkalinity. All the organic components, including those suspended (biomass, etc), are expressed in terms of COD. This measure can be converted to VSS by means of a suitable factor, usually equal to 1.48 mgCOD/mgVSS. The soluble inert organic substance, SI, and the particulate, XI, are not involved in conversion reactions and therefore the respective columns do not contain stoichiometric coefficients. Such components are, however, included in the model because the soluble inert organic substance contributes to the final effluent COD, while the suspended one contributes to volatile suspended solid concentration in the activated sludge. The readily biodegradable organic matter, SS, is removed by heterotrophic biomass growth under either aerobic or anoxic conditions and is formed by hydrolysis of slowly biodegradable organic matter, XS, entrapped in biofloc. The readily biodegradable substrate, SS, is the only substrate that supports bacterial growth. The slowly biodegradable organic substance, XS, is removed by hydrolysis and it is formed by decay of both autotrophic and heterotrophic bacteria. The IAWPRC model assumes the dead-regeneration concept; therefore part of the dead biomass is endorsed to XS and part is attributed to the inert particulate from decay, XP. This component is inert to further biological attack because it is considered not completely biodegradable, or, at least, its destruction rate is so low that it can be considered inert within the sludge ages normally encountered in the activated sludge system. Heterotrophic, XBH and autotrophic XBA biomass are formed by cell growth and destroyed by decay. The reactions of dissolved oxygen concentration, SO, in the matrix are only responsible for its removal by biological reactions and do not contribute to its growth by means of the aeration systems. The dissolved oxygen it is only consumed for heterotrophic and autotrophic growth. According to the dead-regeneration approach, no oxygen decrease is directly associated with microbial decay, but is calculated indirectly from growth of new biomass on released substrate, XS. The other electron acceptor included in the matrix is nitrate nitrogen, SNO, which is produced by aerobic growth of autotrophic bacteria and removed during anoxic growth of the heterotrophic biomass. Even if nitrite nitrogen it is also formed in the nitrification, the model considers nitrates the only oxidized form of the nitrogen present. The ammonia nitrogen in soluble form, SNH, is assumed to be the sum of the ionised and un-ionised forms. Ammonia nitrogen comes from ammonification of soluble biodegradable organic nitrogen and is removed by aerobic growth of autotrophic bacteria. One small fraction is incorporated in the cells during autotrophic and heterotrophic growth. The Model N°1 assumes ammonia nitrogen as the only source for bacterial synthesis. Soluble biodegradable organic nitrogen, SND, is formed by hydrolysis of particulate organic nitrogen and is removed by ammonificazione. Particulate organic nitrogen, XND, is generated from biomass decay and is converted to SND by hydrolysis. The twelve described components are the essential ones for modelling an activated sludge wastewater treatment plant with organic matter oxidation, nitrification and denitrification. The last component represented is alkalinity, SALK. Such a component is not essential for the modelling, but can supply useful information on eventual undesirable pH variations. There are eight fundamental reactions in the model, corresponding to four basic processes: bacterial growth, bacterial decay, hydrolysis of particulate and organic nitrogen ammonification. The kinetics of aerobic heterotropic growth is subject to a double limitation, represented by the readily biodegradable substrate and the dissolved oxygen. The main aim of using dissolved oxygen as a limiting
ABES - Associação Brasileira de Engenharia Sanitária e Ambiental 5
VI Simpósio Ítalo Brasileiro de Engenharia Sanitária e Ambiental
factor is to create a switching function, that interrupts the aerobic growth when the oxygen becomes limiting and converts it to an anoxic growth. Analogous expressions with switching functions are also present in the reactions of autotropic growth, in anoxic heterotropic growth reactions and in hydrolysis. These kind of expressions, that activate or interrupt a reaction in the presence of determinate environmental conditions (oxygen presence or absence and/or nitrites), greatly facilitate model implementation, since they resolve the problem of the reactions development control. The anoxic growth is expressed in the same way, simply reduced through a factor ηg < 1, that comprises all the effects of reduced maximum growth rate and/or smaller fraction of autotrophic biomass. The autotrophic and heterotrophic decay is described in terms of dead-regeneration and takes place independently of electrons acceptor. The ammonification process of soluble organic nitrogen is a first order reaction. The hydrolysis of particulate organic substrate and particulate nitrogen is described as proportional to the heterotrophic biomass, the relationship between entrapped substrate biomass and the electron acceptor concentration. In anoxic condition, in nitrate presence, the hydrolysis rate is reduced by a factor ηh, which accounts for the various enzymatic syntheses. The model is based on basic hypotheses and conditions that must always be verified:
• The pH must remain constant and near neutrality, • The sludge age must be between 3 and 30 days, • The unaerated fraction of the reactor volume should not exceed 50% • There should not be limitations due to nitrogen, phosphorus or other nutrient deficiency.
The model of the IAWPRC can be used to simulate, in steady state or dynamic conditions, activated sludge systems also with complex configurations. It is necessary to model adequately the hydrodynamics system configuration (discharges, volumes etc.), to fix the sludge age or the sludge wastage and to solve, for each reactor, the balance equation for all the considered components. The described model has been integrated with a model to consider what happens in the secondary sedimentation tank, defined by IAWPRC as a simple separation point. The model used for studying settling dynamics is one-dimensional, not reagent and based on the theory of solid flow (Takacs, 1991). By solving the system of ten not linear algebraic equations describing the mass balance, the relations between influent and effluent concentrations in the sedimentation tank and influent and recycle concentrations have been obtained. Components and processes in the model are shown in Table 1 DESCRIPTION OF THE PLANT LAYOUTS Pantano Nuovo and Sarra, two wastewater treatment plants of the city of Matera, have been chosen as case studies for the model application. Plant layouts comprise: mechanical and manual screen, grit chamber, primary sedimentation, denitrification, oxidation-nitrification, secondary sedimentation with mixer liquor and sludge recycles, disinfection and sludge treatments. Tables 2 and 3 give the main characteristics of the biological sections for both plants: denitrification and oxidation-nitrification tanks.
ABES - Associação Brasileira de Engenharia Sanitária e Ambiental 6
VI Simpósio Ítalo Brasileiro de Engenharia Sanitária e Ambiental
Tab. 2 Main characteristics of the biological sections: denitrification tanks
Units Pantano Nuovo Sarra
N. 1 1 Width m 16 12 Length m 24 34 Average Water level m 3 2.2 Area m2 384 408 Volume m3 1152 898 Retention time at Qm Qmax QPP
h h h
1,43 0,96 0,48
1.49 1 0.5
Tab. 3 Main characteristics of the biological sections: oxidation-nitrification tanks
Units Pantano Nuovo Sarra
N. 2 2 Width m 13 13 Lenght m 26 26 Average Water level m 2,96 3 Volume m3 1000,48 1014 Retention time at Qm Qmax QPP
h h h
12 8 4
8.05 5.36 2.68
The effective activated sludge operation requires that the biomass be removed from the liquid stream prior to being discharged to the disinfection step. Part of the biomass is wasted, while a large fraction is returned to the biological reactor to maintain the appropriate substrate-to-biomass ratio. To simulate the secondary sedimentation, knowledge of the structural characteristics is not necessary, the relations between the concentrations having already been defined.
PROCESS FLOWSHEET The process flowsheet of the described treatment plants, are reported in Figure 1. It can be seen, after a primary sedimentation, two reactors, anoxic and aerated. The sludge recycle goes to the oxidation tank, while the mixed-liquor recycle goes to the anoxic reactor.
D O + N
IN OUT
Fig. 1 Process flowsheet
ABES - Associação Brasileira de Engenharia Sanitária e Ambiental 7
VI Simpósio Ítalo Brasileiro de Engenharia Sanitária e Ambiental
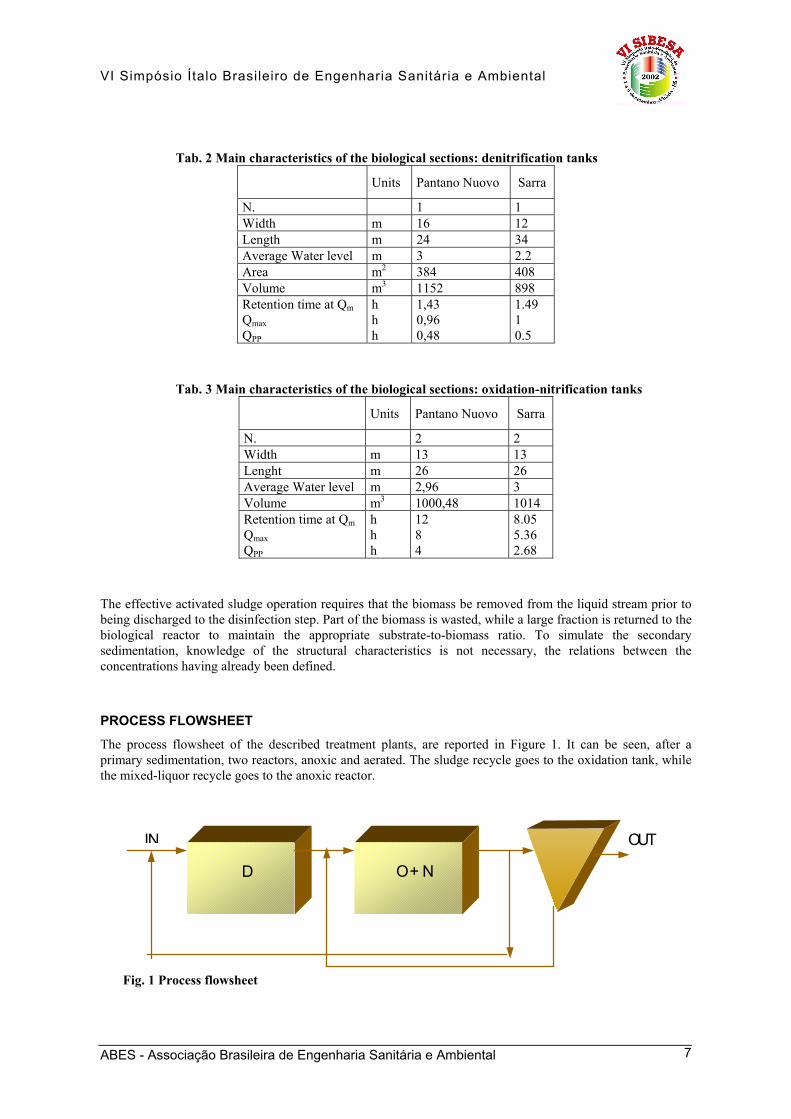
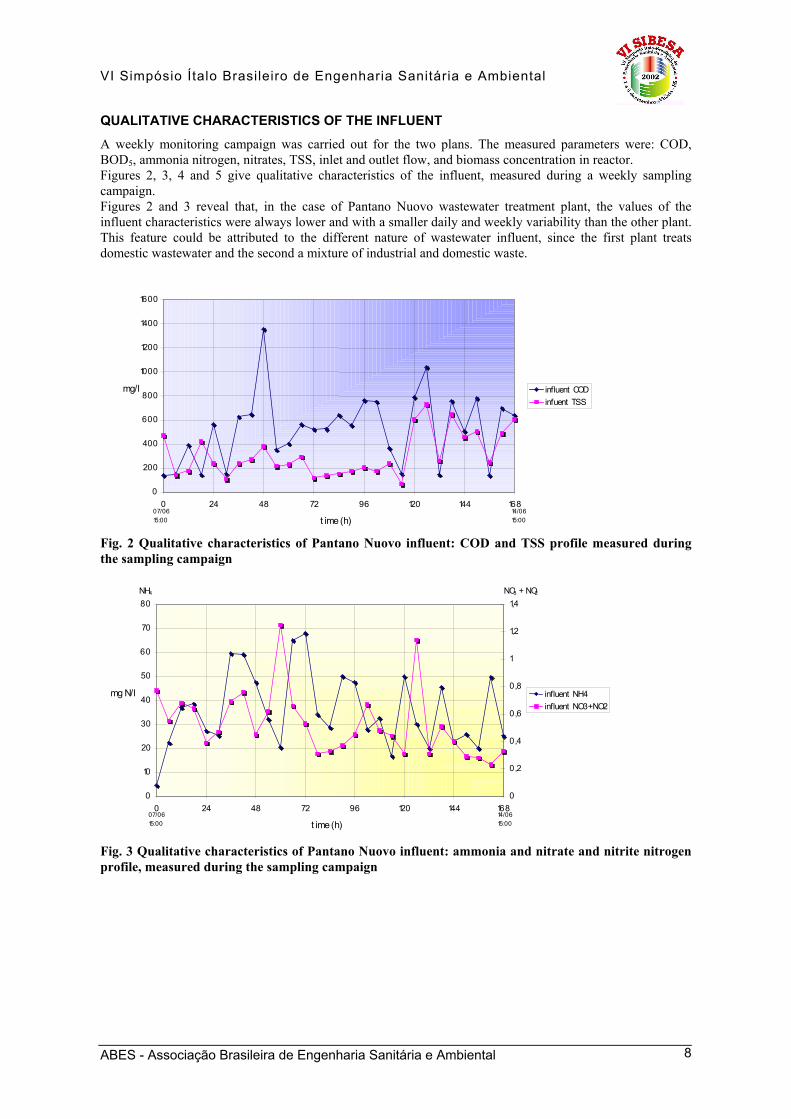
QUALITATIVE CHARACTERISTICS OF THE INFLUENT A weekly monitoring campaign was carried out for the two plans. The measured parameters were: COD, BOD5, ammonia nitrogen, nitrates, TSS, inlet and outlet flow, and biomass concentration in reactor. Figures 2, 3, 4 and 5 give qualitative characteristics of the influent, measured during a weekly sampling campaign. Figures 2 and 3 reveal that, in the case of Pantano Nuovo wastewater treatment plant, the values of the influent characteristics were always lower and with a smaller daily and weekly variability than the other plant. This feature could be attributed to the different nature of wastewater influent, since the first plant treats domestic wastewater and the second a mixture of industrial and domestic waste.
0
200
400
600
800
1000
1200
1400
1600
0 24 48 72 96 120 144 168
t ime (h)
mg/l influent COD infuent TSS
07/06 15:00
14/0615:00
Fig. 2 Qualitative characteristics of Pantano Nuovo influent: COD and TSS profile measured during the sampling campaign
0
10
20
30
40
50
60
70
80
0 24 48 72 96 120 144 168
t ime (h)
mg N/l
0
0,2
0,4
0,6
0,8
1
1,2
1,4
influent NH4 influent NO3+NO2
NO3 + NO2NH 4
07/06 15:00
14/0615:00
Fig. 3 Qualitative characteristics of Pantano Nuovo influent: ammonia and nitrate and nitrite nitrogen profile, measured during the sampling campaign
ABES - Associação Brasileira de Engenharia Sanitária e Ambiental 8
VI Simpósio Ítalo Brasileiro de Engenharia Sanitária e Ambiental
0
200
400
600
800
1000
1200
1400
1600
1800
2000
0 24 48 72 96 120 144 168
t ime (h)
mg/l Influent COD Influent SST
07/06 14/06 15:00
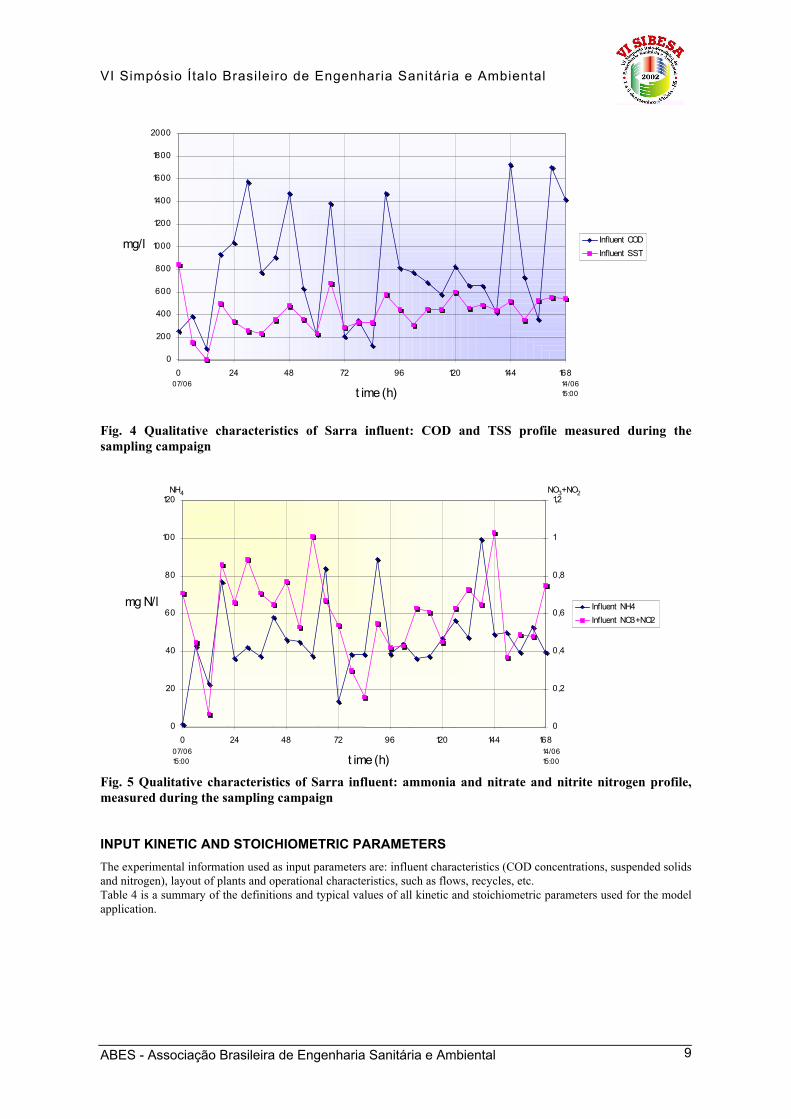
Fig. 4 Qualitative characteristics of Sarra influent: COD and TSS profile measured during the sampling campaign
0
20
40
60
80
100
120
0 24 48 72 96 120 144 168
t ime (h)
mg N/l
0
0,2
0,4
0,6
0,8
1
1,2
Influent NH4 Influent NO3+NO2
NH 4 NO3 +NO 2
07/06 15:00
14/06 15:00
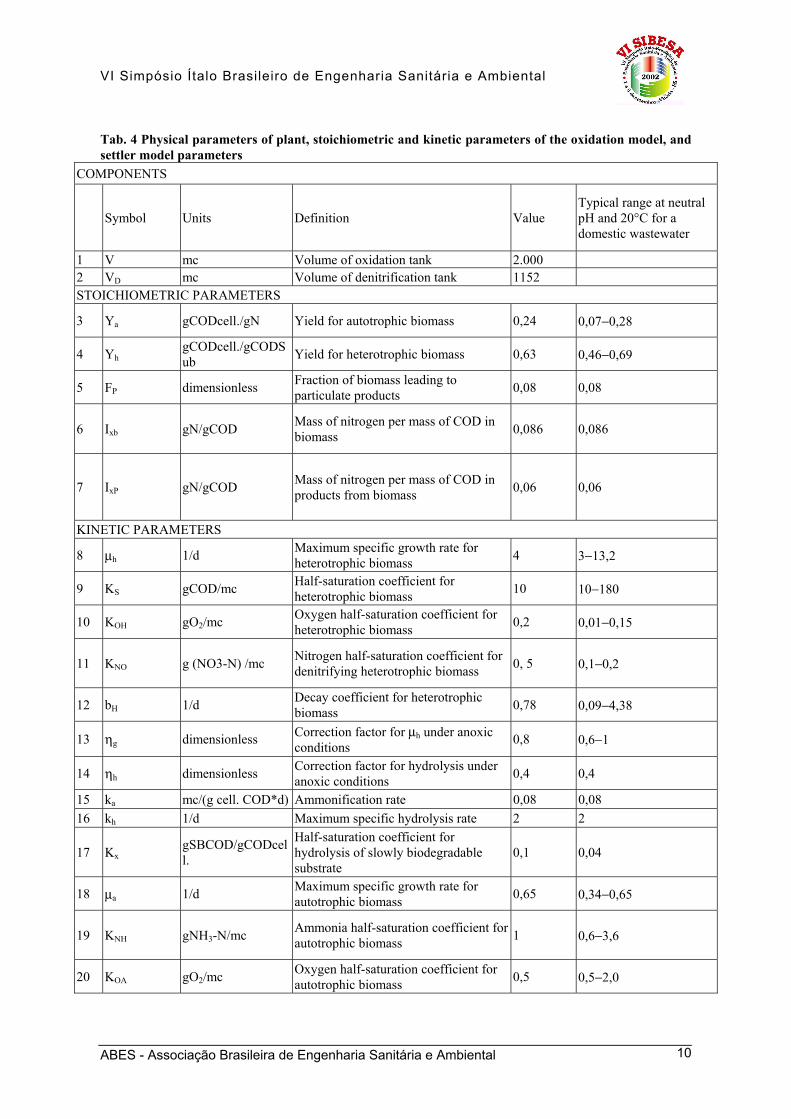
Fig. 5 Qualitative characteristics of Sarra influent: ammonia and nitrate and nitrite nitrogen profile, measured during the sampling campaign INPUT KINETIC AND STOICHIOMETRIC PARAMETERS The experimental information used as input parameters are: influent characteristics (COD concentrations, suspended solids and nitrogen), layout of plants and operational characteristics, such as flows, recycles, etc. Table 4 is a summary of the definitions and typical values of all kinetic and stoichiometric parameters used for the model application.
ABES - Associação Brasileira de Engenharia Sanitária e Ambiental 9
VI Simpósio Ítalo Brasileiro de Engenharia Sanitária e Ambiental
Tab. 4 Physical parameters of plant, stoichiometric and kinetic parameters of the oxidation model, and settler model parameters
COMPONENTS
Symbol Units Definition Value Typical range at neutral pH and 20°C for a domestic wastewater
1 V mc Volume of oxidation tank 2.000 2 VD mc Volume of denitrification tank 1152 STOICHIOMETRIC PARAMETERS
3 Ya gCODcell./gN Yield for autotrophic biomass 0,24 0,07−0,28
4 Yh gCODcell./gCODSub Yield for heterotrophic biomass 0,63 0,46−0,69
5 FP dimensionless Fraction of biomass leading to particulate products 0,08 0,08
6 Ixb gN/gCOD Mass of nitrogen per mass of COD in biomass 0,086 0,086
7 IxP gN/gCOD Mass of nitrogen per mass of COD in products from biomass 0,06 0,06
KINETIC PARAMETERS
8 µh 1/d Maximum specific growth rate for heterotrophic biomass 4 3−13,2
9 KS gCOD/mc Half-saturation coefficient for heterotrophic biomass 10 10−180
10 KOH gO2/mc Oxygen half-saturation coefficient for heterotrophic biomass 0,2 0,01−0,15
11 KNO g (NO3-N) /mc Nitrogen half-saturation coefficient for denitrifying heterotrophic biomass 0, 5 0,1−0,2
12 bH 1/d Decay coefficient for heterotrophic biomass 0,78 0,09−4,38
13 ηg dimensionless Correction factor for µh under anoxic conditions 0,8 0,6−1
14 ηh dimensionless Correction factor for hydrolysis under anoxic conditions 0,4 0,4
15 ka mc/(g cell. COD*d) Ammonification rate 0,08 0,08 16 kh 1/d Maximum specific hydrolysis rate 2 2
17 Kx gSBCOD/gCODcell.
Half-saturation coefficient for hydrolysis of slowly biodegradable substrate
0,1 0,04
18 µa 1/d Maximum specific growth rate for autotrophic biomass 0,65 0,34−0,65
19 KNH gNH3-N/mc Ammonia half-saturation coefficient for autotrophic biomass 1 0,6−3,6
20 KOA gO2/mc Oxygen half-saturation coefficient for autotrophic biomass 0,5 0,5−2,0
ABES - Associação Brasileira de Engenharia Sanitária e Ambiental 10
VI Simpósio Ítalo Brasileiro de Engenharia Sanitária e Ambiental
21 bA 1/d Decay coefficient for autotrophic biomass 0,1 0,05−0,15
PARAMETERS OF SETTLER MODEL 22 V0 m/d Maximum Vesilind settling velocity 712 712
23 Fns dimensionless Not settling fraction of influent suspended solids 10-4 10−4
24 rhin mc/d Hindered settling zone parameter 3,7 10−4 3,7 10−4
25 rflo mc/d Flocculant settling zone parameter 2,8 10−3 2,8 10−3
SENSITIVITY ANALYSIS RESULTS FOR KINETIC PARAMETERS According to the IAWPRC indications, the analysed parameters for the sensitivity analysis are:
1. Maximum specific growth rate for heterotrophic biomass µh; 2. Decay coefficient for heterotrophic biomass (bH); 3. Maximum specific growth rate for autotrophic biomass µa; 4. Maximum specific hydrolysis rate kh; 5. Correction factor for hydrolysis under anoxic conditions (ηh); 6. Half-saturation coefficient for heterotrophic biomass (KS);
The sensitivity analysis showed that the components of the model are more sensitive to maximum specific growth rate for autotrophic biomass (µa) and to the decay coefficient for heterotrophic biomass (bH). Table 5 gives the more significant results for these two parameters and Figures 6 and 7 show the qualitative path of main components versus these parameters.
Tab. 5 Results of sensitivity analysis for bH and µa. Equations
SS = 3,8135 bH + 3,1313 (R2 = 0,9969) XS = 2,937 bH + 9,3827 (R2 = 0,9882) XBH = −589,52 bH + 923,33 (R2 = 0,9973) XBA = 1,2076 bH + 19,949 (R2 = 0,9966)
bH
XND = 3,2843 bH + 3,8799 (R2 = 0,9853) SS = −2,8427 µa + 7,9498 (R2 = 0,9953) SNO = 5,0199 µa − 0,5983 (R2 = 0,9994) SNH = −19,298 µa + 18,56 (R2 = 0,999) XS = −0,2128 µa + 11,762 (R2 = 0,9994) XBH = 36,9 µa + 444,49 (R2 = 0,9994)
µa
XBA = 13,396 µa + 12,083 (R2 = 0,999)
ABES - Associação Brasileira de Engenharia Sanitária e Ambiental 11
VI Simpósio Ítalo Brasileiro de Engenharia Sanitária e Ambiental
0,0
2,0
4,0
6,0
8,0
10,0
12,0
14,0
0,3
0,35
0,4
0,45
0,5
0,55
0,6
0,65
0,7
0,75
0,8
µ
a
mg N/l SNO
SNH
SND
XND
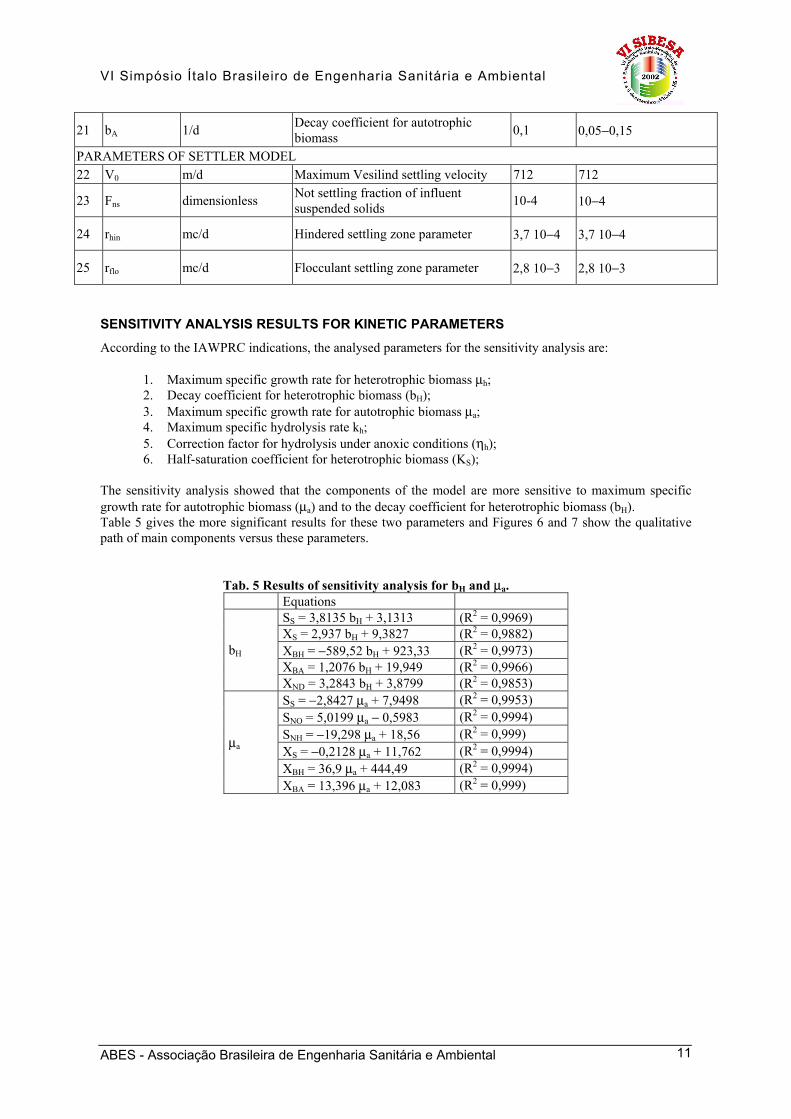
Fig. 6 Qualitative path of the main components versus µa
0,0 1,0 2,0 3,0 4,0 5,0 6,0 7,0
0,3 0,4
0,5 0,6
0,7
0,8
0,9
b H
mgN/l SNO SNH SND XND
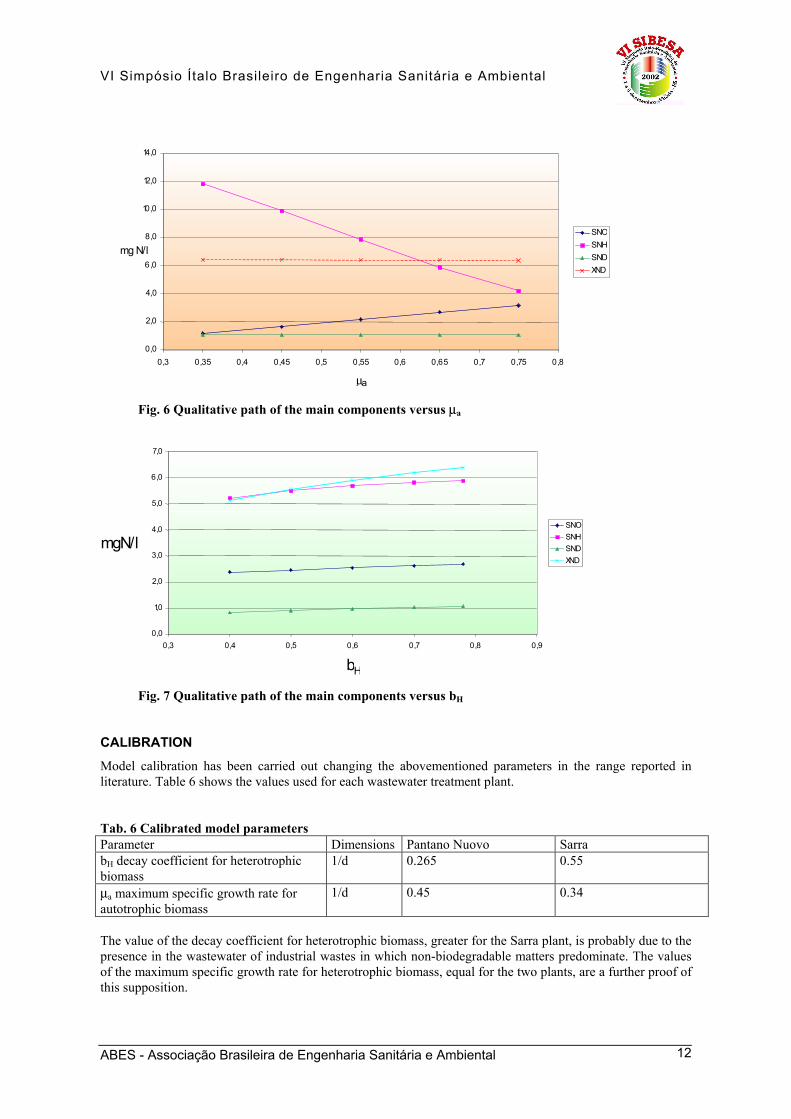
Fig. 7 Qualitative path of the main components versus bH
CALIBRATION Model calibration has been carried out changing the abovementioned parameters in the range reported in literature. Table 6 shows the values used for each wastewater treatment plant. Tab. 6 Calibrated model parameters Parameter Dimensions Pantano Nuovo Sarra bH decay coefficient for heterotrophic biomass
1/d 0.265 0.55
µa maximum specific growth rate for autotrophic biomass
1/d 0.45 0.34
The value of the decay coefficient for heterotrophic biomass, greater for the Sarra plant, is probably due to the presence in the wastewater of industrial wastes in which non-biodegradable matters predominate. The values of the maximum specific growth rate for heterotrophic biomass, equal for the two plants, are a further proof of this supposition.
ABES - Associação Brasileira de Engenharia Sanitária e Ambiental 12
VI Simpósio Ítalo Brasileiro de Engenharia Sanitária e Ambiental
Also the nitrification process shows traces of the wastewater characteristics; in fact, for Sarra the process works at 50%.
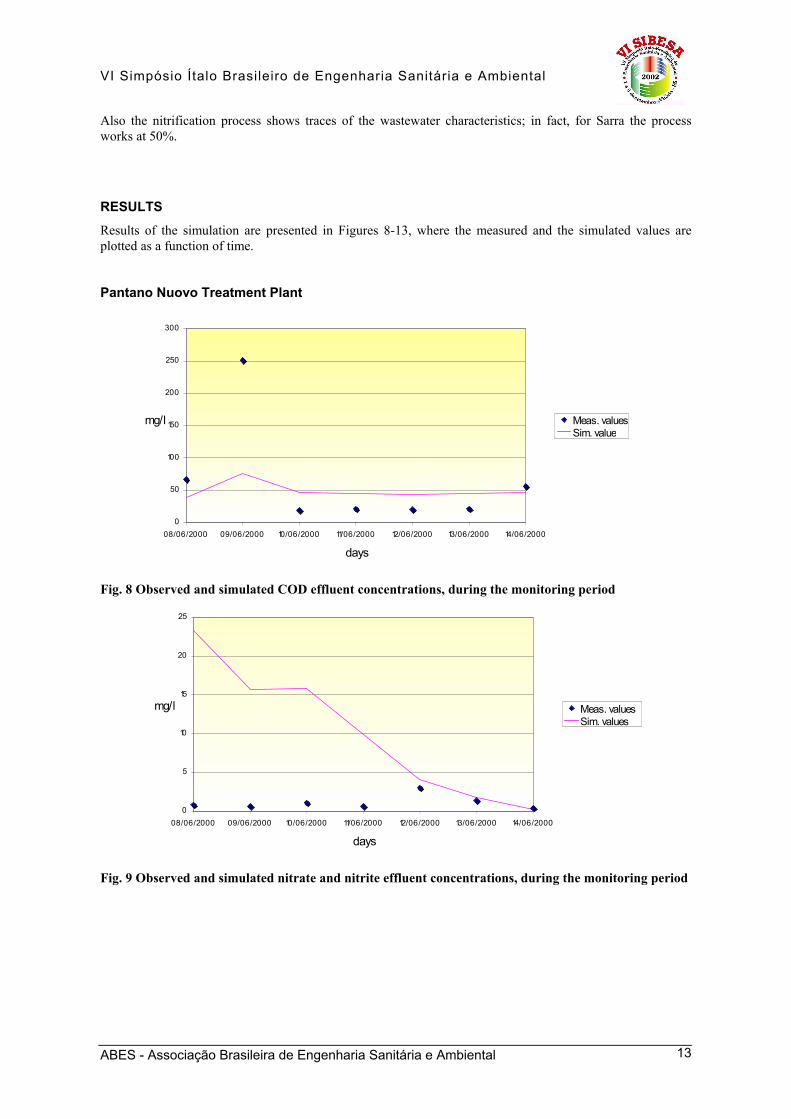
RESULTS Results of the simulation are presented in Figures 8-13, where the measured and the simulated values are plotted as a function of time. Pantano Nuovo Treatment Plant
0
50
100
150
200
250
300
08/06/2000 09/06/2000 10/06/2000 11/06/2000 12/06/2000 13/06/2000 14/06/2000
days
mg/l Meas. values Sim. value
Fig. 8 Observed and simulated COD effluent concentrations, during the monitoring period
0
5
10
15
20
25
08/06/2000 09/06/2000 10/06/2000 11/06/2000 12/06/2000 13/06/2000 14/06/2000
days
mg/l Meas. values Sim. values
Fig. 9 Observed and simulated nitrate and nitrite effluent concentrations, during the monitoring period
ABES - Associação Brasileira de Engenharia Sanitária e Ambiental 13
VI Simpósio Ítalo Brasileiro de Engenharia Sanitária e Ambiental
0 1 2 3 4 5 6 7 8
08/06/2000 09/06/2000 10/06/2000 11/06/2000 12/06/2000 13/06/2000 14/06/2000
days
mg N/l Meas. values Sim. values
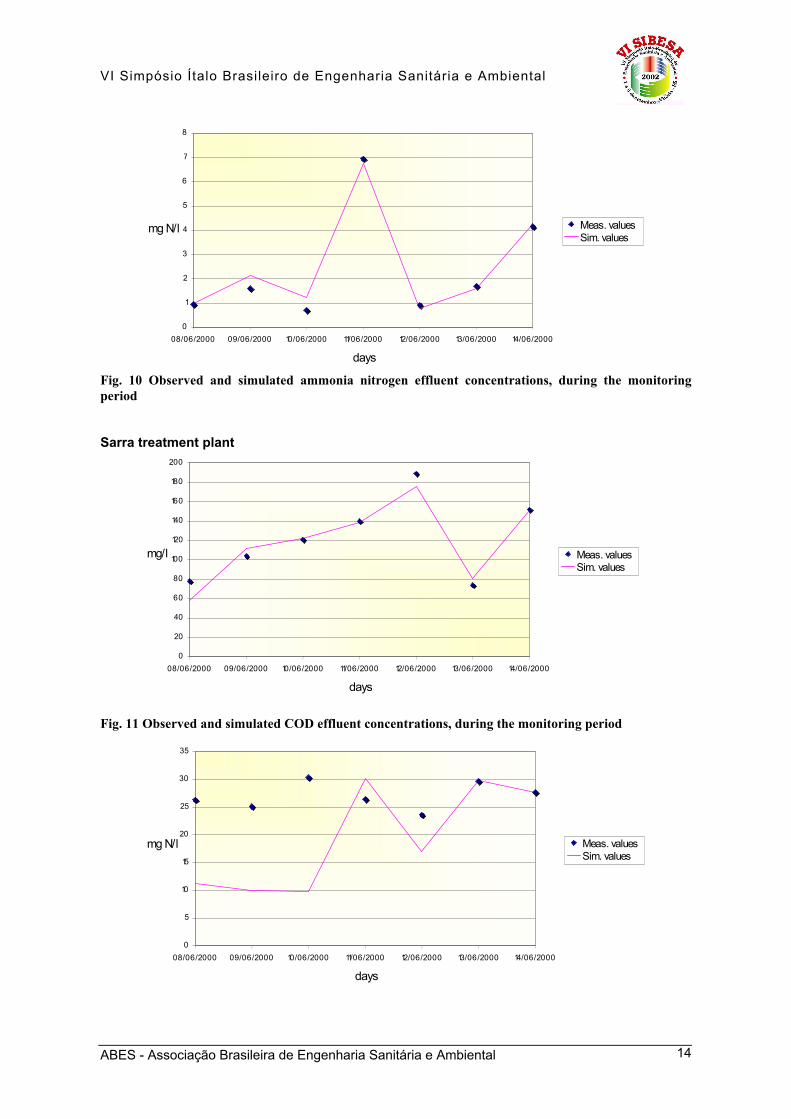
Fig. 10 Observed and simulated ammonia nitrogen effluent concentrations, during the monitoring period Sarra treatment plant
0 20 40 60 80
100 120 140 160 180 200
08/06/2000 09/06/2000 10/06/2000 11/06/2000 12/06/2000 13/06/2000 14/06/2000
days
mg/l Meas. values Sim. values
Fig. 11 Observed and simulated COD effluent concentrations, during the monitoring period
0
5
10
15
20
25
30
35
08/06/2000 09/06/2000 10/06/2000 11/06/2000 12/06/2000 13/06/2000 14/06/2000
days
mg N/l Meas. values Sim. values
ABES - Associação Brasileira de Engenharia Sanitária e Ambiental 14
VI Simpósio Ítalo Brasileiro de Engenharia Sanitária e Ambiental
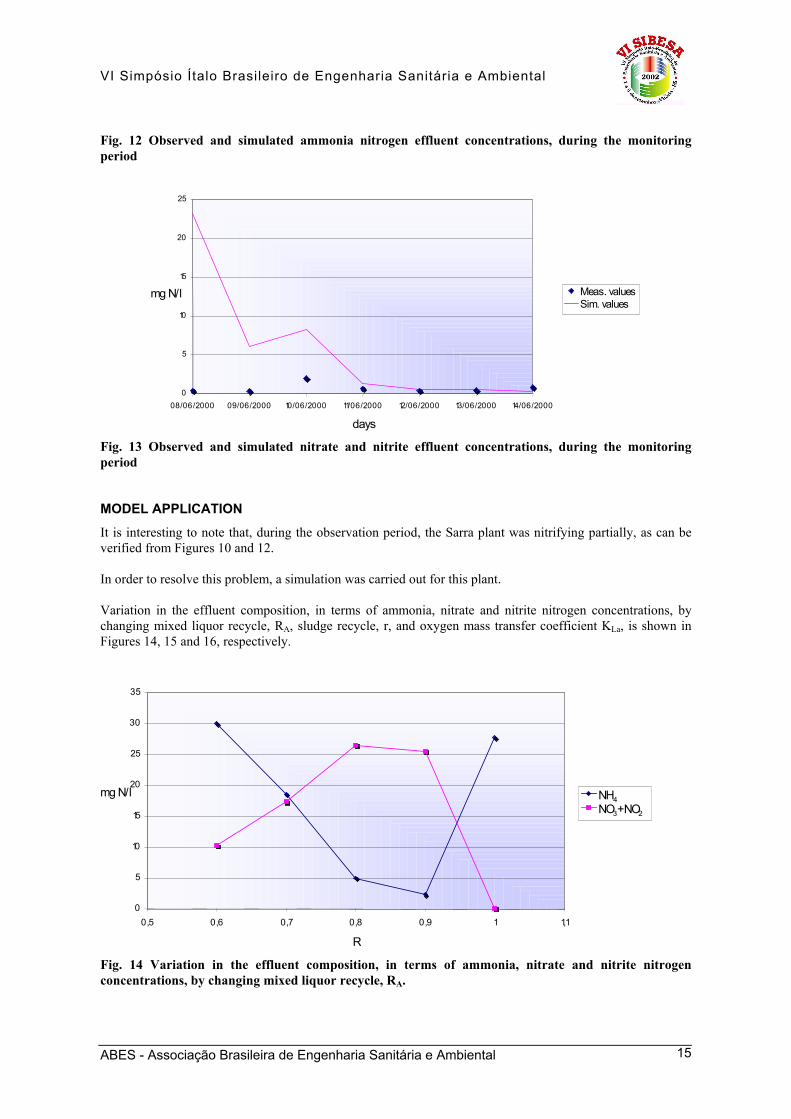
Fig. 12 Observed and simulated ammonia nitrogen effluent concentrations, during the monitoring period
0
5
10
15
20
25
08/06/2000 09/06/2000 10/06/2000 11/06/2000 12/06/2000 13/06/2000 14/06/2000
days
mg N/l Meas. values Sim. values
Fig. 13 Observed and simulated nitrate and nitrite effluent concentrations, during the monitoring period
MODEL APPLICATION It is interesting to note that, during the observation period, the Sarra plant was nitrifying partially, as can be verified from Figures 10 and 12. In order to resolve this problem, a simulation was carried out for this plant. Variation in the effluent composition, in terms of ammonia, nitrate and nitrite nitrogen concentrations, by changing mixed liquor recycle, RA, sludge recycle, r, and oxygen mass transfer coefficient KLa, is shown in Figures 14, 15 and 16, respectively.
0
5
10
15
20
25
30
35
0,5 0,6 0,7 0,8 0,9 1 1,1 R
mg N/l NH4 NO3+NO2
Fig. 14 Variation in the effluent composition, in terms of ammonia, nitrate and nitrite nitrogen concentrations, by changing mixed liquor recycle, RA.
ABES - Associação Brasileira de Engenharia Sanitária e Ambiental 15
VI Simpósio Ítalo Brasileiro de Engenharia Sanitária e Ambiental
23
23,5 24
24,5 25
25,5 26
26,5 27
27,5 28
0,5 1 1,5 2 2,5 3 3,5 RA
mg N/l
0
0,05
0,1
0,15
0,2
0,25
0,3
0,35
NH4 NO3+NO2
NH4 NO3+NO2
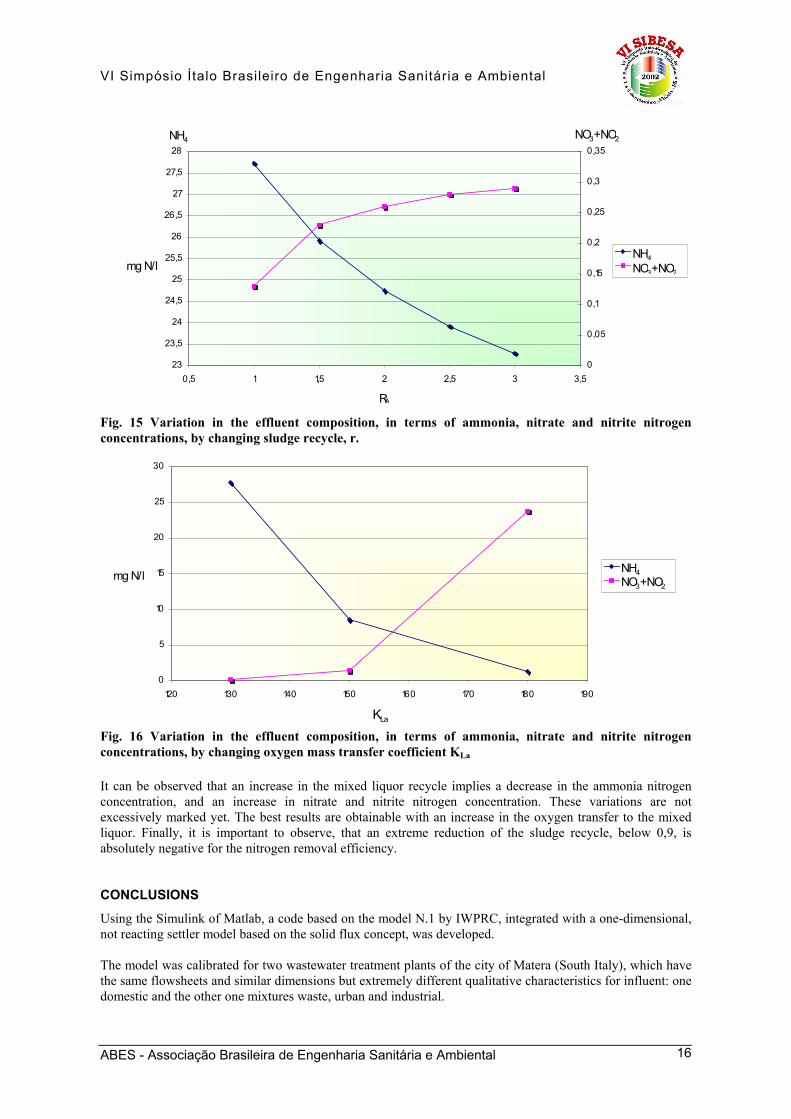
Fig. 15 Variation in the effluent composition, in terms of ammonia, nitrate and nitrite nitrogen concentrations, by changing sludge recycle, r.
0
5
10
15
20
25
30
120 130 140 150 160 170 180 190 KLa
mg N/l NH4 NO3+NO2
Fig. 16 Variation in the effluent composition, in terms of ammonia, nitrate and nitrite nitrogen concentrations, by changing oxygen mass transfer coefficient KLa
It can be observed that an increase in the mixed liquor recycle implies a decrease in the ammonia nitrogen concentration, and an increase in nitrate and nitrite nitrogen concentration. These variations are not excessively marked yet. The best results are obtainable with an increase in the oxygen transfer to the mixed liquor. Finally, it is important to observe, that an extreme reduction of the sludge recycle, below 0,9, is absolutely negative for the nitrogen removal efficiency.
CONCLUSIONS Using the Simulink of Matlab, a code based on the model N.1 by IWPRC, integrated with a one-dimensional, not reacting settler model based on the solid flux concept, was developed. The model was calibrated for two wastewater treatment plants of the city of Matera (South Italy), which have the same flowsheets and similar dimensions but extremely different qualitative characteristics for influent: one domestic and the other one mixtures waste, urban and industrial.
ABES - Associação Brasileira de Engenharia Sanitária e Ambiental 16
VI Simpósio Ítalo Brasileiro de Engenharia Sanitária e Ambiental
A weekly monitoring campaign was carried out for the two plans. The measured parameters are: COD, BOD5, ammonia nitrogen, nitrates, TSS, inlet and outlet flow, and biomass concentration in reactor. The sensitivity analysis showed that all the components of the model have an elevated sensibility to bH and µA. Varying these parameters, the developed model was calibrated with effluent concentration data of the two plants. Specifically, for the plant treating industrial waste the values of bH and µA are 0.55 and 0.34 respectively. For the other plant the values are 0.261 and 0.45 respectively. The outputs of the model show good agreement with experimental data. For operational purposes, an application of the model was developed for the Sarra plant, which, during experimental observation, was partially nitrifying. By varying operational parameters, such as sludge and mixed liquor recycle and oxygen transfer coefficient, it was possible to achieve a complete nitrification. Following studies will concern the correlation of model outputs with the inputs of the river water quality model, overcoming the problem, typical of many stand alone software described in the literature, posed by the remarkable diversity of the parameters describing each segment. REFERENCES 1. TAKACS I., PATRY G. G. AND NOLASCO D. (1991), A dynamic model of the clarification-
thickening process. Water Resources, 25(10), p. 1263-1271. 2. Matlab, User’s Guide, (1999), The Mathworks, Inc., online version. 3. HENZE M., GRADY C. P. L., GUJER W., MARAIS G. V. R. AND MATSUO T. (1987), Acrivated
sludge model No. 1. Scientific and Technical Report No. 1 IAWPRC, London, England.
ABES - Associação Brasileira de Engenharia Sanitária e Ambiental 17