Embed Size (px)
Citation preview
United Nations Department of Economic and Social Affairs/Population Division Living Arrangements of Older Persons Around the World 15
II. LIVING ARRANGEMENTS: PATTERNS AND TRENDS The present chapter presents the basic data on living arrangements of older persons. Aspects covered include the prevalence of solitary living, co-residence with others—with a focus on residence with children and grandchildren—and institutional living. This chapter also includes trend data where available, and a discussion of differences in living arrangements according to important demographic characteristics—gender, age and marital status—as well as by geographical region. The chapter’s aim is primarily descriptive. The issue of how living arrangements vary according to other social and economic characteristics is taken up in chapter III. A. CLASSIFICATION OF LIVING ARRANGEMENTS The basic comparative scheme used in this study encompasses five mutually exclusive categories: 1. Living alone 2. Living with spouse only 3. Living with a child (including adopted children), child-in-law or grandchild 4. Living with another relative (other than a spouse or child/grandchild) 5. Living with unrelated people only, apart from the older person’s spouse Those living with a child/grandchild may also be living with other relatives or non-relatives, and those living with other relatives may also have a non-relative in the household. An important feature of this scheme is that it is determined by familial relationships of household members, not household headship, which can assume different meanings according to the cultural context. This classification scheme is related to that suggested by Shanas and others (1968) and later modified by Palmore (1975) to ignore the marital status of adult children. The marital status of children is important in some contexts and is sometimes used as the criterion for distinguishing “nuclear” from “extended” households. However, with respect to the ability of children to provide support to parents, other characteristics, such as children’s
age, may be at least as important as marital status. In some societies, the traditional pattern was for a married child to remain with parents; but in others, an unmarried child often fulfilled this role. In addition, many of the data sets employed in this study did not provide information about the children’s marital status. Another methodological issue is that it is not always possible to distinguish between those living with children and those living with other relatives. In many developing countries, a small percentage of those classified below as living with other relatives, but not with offspring, might actually have been residing with a child. Annex III provides an assessment of the extent of this source of misclassification. In later sections of this chapter, the “with child/grandchild” category (category 2) is further divided into (a) those living with children; and (b) those living with grandchildren, in the absence of the middle generation, or skipped generation households. Also, those living with children are divided into those living with older adult children and those living only with younger children, who are more likely still to depend on parents for support. A final alternative presented in the report is the classification used in the analysis of Salud, Bienestar y Envejecimiento (SABE) project data in chapter IV. That classification distinguishes between older persons living with non-married children and those living with at least one married child, under the assumption that co-residence with married children, more frequently than co-residence with non-married children, responds to the needs of parents rather than of the children.
B. LIVING ALONE The percentage living alone is the most widely available statistic concerning living arrangements of older persons. The greater availability of data for this topic is largely a by-product of the way that data on households and their members have traditionally been tabulated.1 However, older persons living alone also

United Nations Department of Economic and Social Affairs/Population Division 16 Living Arrangements of Older Persons Around the World
constitute a group that is of natural social and policy concern. Those living alone are more likely to need outside assistance in the case of illness or disability, are at greater risk of social isolation and, even in countries with well-developed systems of social security, are disproportionately likely—especially older women—to be poor (Casey and Yamada, 2002). The proportion of the older population living alone ranges from less than 1 per cent in Bahrain in 1991 to almost 40 per cent in Denmark in 1994, among the 134 countries or areas for which data are available (table II.1). In general, the proportion is lowest in countries or areas of Asia and Africa and highest in countries in Europe or whose populations are mainly of European origin (figure II.1). Percentages tend to be higher in
Latin America and the Caribbean than in the other developing regions, and values are on average a little lower in Asia than in Africa. However, there is a considerable range of values within all regions, and a few countries in the developing regions have values more typical of the European countries (figure II.2). For instance, although the median percentage living alone in Africa is only 8 per cent, in Ghana 22 per cent live alone. Several Caribbean countries and, in Asia, Israel also have proportions over 20 per cent. Conversely, about one fourth of European countries have values under 20 per cent, with the lowest values of 10-15 per cent found in Malta, Spain and Serbia and Montenegro. In general, within Europe, the proportions living alone are lowest in the Southern region.
TABLE II.1. PROPORTION OF THE HOUSEHOLD POPULATION AGED 60 YEARS
OR OVER LIVING ALONE BY SEX, AND SEX DIFFERENTIALS
Percentage alone Sex
differential
Country or area Date Total Male Female F - M Africa
Benin..................................... 2001 10.3 9.0 11.7 2.7 Burkina Faso ......................... 1998/99 2.3 2.3 2.4 0.1 Cameroon.............................. 1998 8.3 8.0 8.6 0.6 Central African Republic ...... 1994/95 12.5 8.6 16.3 7.7 Chad...................................... 1996/97 11.2 5.0 17.8 12.7 Comoros................................ 1996 1.5 1.1 1.8 0.7 Côte d'Ivoire.......................... 1998/99 4.0 5.0 2.9 -2.0 Egypt..................................... 2000 8.3 3.9 13.1 9.2 Ethiopia................................. 2000 5.0 1.6 8.6 7.0 Gabon.................................... 2000 11.0 12.3 9.9 -2.4 Ghana.................................... 1998 21.6 20.2 22.7 2.5 Guinea................................... 1999 2.2 1.6 3.0 1.3 Kenya.................................... 1998 17.3 9.0 25.2 16.2 Madagascar ........................... 1997 8.0 4.4 11.4 7.0 Malawi .................................. 2000 11.4 8.4 13.9 5.5 Mali....................................... 2001 6.8 5.1 9.8 4.7 Morocco................................ 1992 5.7 2.3 9.2 6.9 Mozambique ......................... 1997 14.3 11.0 18.1 7.1 Namibia................................. 1992 4.2 4.6 3.9 -0.7 Niger ..................................... 1998 3.5 1.5 6.0 4.5 Nigeria .................................. 1999 6.4 3.3 10.7 7.4 Réunion................................. 1982 14.8 10.0 18.3 8.3 Rwanda ................................. 2000 6.5 4.4 8.1 3.7 Senegal.................................. 1997 1.3 1.5 1.1 -0.4 South Africa .......................... 1998 8.1 8.0 8.2 0.2 Sudan (north) ........................ 1978/79 9.8 5.6 15.4 9.8 Togo...................................... 1998 8.0 6.9 9.0 2.1 Tunisia .................................. 1991 2.7 1.9 3.7 1.8 Uganda.................................. 1995 12.1 11.9 12.2 0.3 United Rep. of Tanzania ....... 1999 7.5 7.3 7.8 0.5 Zambia .................................. 2001/02 8.8 5.5 12.3 6.7

TABLE II.1 (continued)
United Nations Department of Economic and Social Affairs/Population Division Living Arrangements of Older Persons Around the World 17
Percentage alone Sex
differential
Country or area Date Total Male Female F - M Zimbabwe ............................. 1999 8.8 8.1 9.4 1.3
Asia Armenia ................................ 2000 8.7 3.8 12.1 8.3 Bahrain.................................. 1991 0.7 0.6 0.9 0.3 Bangladesh............................ 1999/00 1.8 0.6 3.3 2.7 China..................................... 1990 8.1 .. .. .. China, Hong Kong SARa ...... 1996 10.8 10.8 10.8 0.0 China, Macao SARa .............. 1991 10.4 10.7 10.2 -0.5 Cyprus................................... 1992 14.0 9.3 18.0 8.7 Democratic People’s Republic of Korea ............... 1990 4.6 0.3 8.7 8.4 India ...................................... 1998/99 3.3 1.8 5.0 3.2 Indonesia............................... 1997 7.3 2.4 11.9 9.5 Iran (Islamic Republic of) ..... 1996 9.0 3.7 15.1 11.4 Israel ..................................... 1995 24.0 11.8 33.7 21.9 Japan ..................................... 2000 12.7 .. .. .. Jordan.................................... 1991 7.0 3.3 10.7 7.4 Kazakhstan............................ 1999 15.9 7.5 21.3 13.8 Kyrgyzstan ............................ 1997 9.3 5.3 12.2 6.8 Malaysia................................ 1991 6.8 4.7 8.7 4.0 Myanmar............................... 1990 4.6 3.1 5.9 2.8 Nepal..................................... 2001 4.5 2.6 6.6 4.1 Occupied Palestinian Territory.............................. 1997 6.0 1.8 9.4 7.6 Pakistan................................. 1990/91 2.7 2.9 2.3 -0.6 Philippines ............................ 1998 5.3 4.0 6.4 2.4 Republic of Korea ................. 1988 7.7 .. .. .. Singapore .............................. 1995 3.3 1.6 2.7 1.1 Sri Lanka............................... 1990 2.9 1.4 4.6 3.2 Syrian Arab Republic............ 1978 4.2 1.9 6.8 4.9 Thailand ................................ 1995 4.3 2.9 5.5 2.6 Turkey................................... 1998 8.5 4.4 12.5 8.0 Uzbekistan ............................ 1996 7.6 3.6 10.8 7.2 Yemen................................... 1991/92 4.0 2.3 6.0 3.8
Europe Austria................................... 1995 30.7 12.9 42.0 29.1 Belgium................................. 1994 29.3 16.2 38.9 22.7 Bulgaria................................. 1992 19.0 11.9 24.8 12.9 Czech Republic ..................... 1991 33.6 17.4 44.2 26.8 Denmark ............................... 1994 39.1 24.7 50.0 25.3 Estonia .................................. 1989 29.6 15.5 36.4 20.9 Finland .................................. 2000 35.2 21.0 45.3 24.3 France ................................... 1994 28.7 15.1 38.4 23.3 Germany ............................... 1994 33.6 15.1 45.5 30.4 Greece ................................... 1994 18.3 8.9 26.1 17.2 Hungary ................................ 1990 24.3 13.0 32.0 19.0 Ireland ................................... 1994 26.4 21.4 30.4 9.0 Isle of Man............................ 1996 31.7 .. .. .. Italy ....................................... 1994 22.6 10.0 31.9 21.8 Latvia .................................... 1989 24.0 13.2 29.3 16.1 Lithuania ............................... 1989 23.1 12.2 29.4 17.2 Malta ..................................... 1980 10.5 .. .. .. Netherlands ........................... 1994 34.5 16.9 47.4 30.5 Norway ................................. 1990 32.7 20.1 42.5 22.4 Poland ................................... 1988 20.7 10.4 27.5 17.1 Portugal................................. 1994 15.8 9.2 20.6 11.5 Romania ................................ 1992 20.3 10.6 27.7 17.1

TABLE II.1 (continued)
United Nations Department of Economic and Social Affairs/Population Division 18 Living Arrangements of Older Persons Around the World
Percentage alone Sex
differential
Country or area Date Total Male Female F - M Russian Federation................ 1989 24.8 10.1 31.3 21.2 Serbia and Montenegro ......... 1991 14.8 7.9 20.1 12.2 Slovenia ................................ 1991 20.4 9.0 27.4 18.4 Spain ..................................... 1994 14.0 7.4 19.2 11.8 Sweden.................................. 1990 37.1 24.3 47.3 23.0 Switzerland ........................... 1990 29.8 14.9 40.9 26.0 United Kingdom.................... 1994 34.7 21.5 44.7 23.2
Latin America and the Caribbean Argentina .............................. 1980 10.9 8.2 12.9 4.7 Aruba .................................... 1981 12.2 10.3 13.7 3.4 Barbados ............................... 1980 22.6 23.7 21.8 -1.9 Belize .................................... 1980 13.4 15.6 11.2 -4.4 Bolivia................................... 1998 13.2 11.7 14.4 2.7 Brazil..................................... 1996 8.8 5.3 11.7 6.4 British Virgin Islands............ 1980 20.3 22.9 17.5 -5.4 Cayman Islands..................... 1989 14.8 14.4 15.1 0.7 Chile...................................... 1992 8.8 8.2 9.2 1.0 Colombia............................... 2000 7.1 6.7 7.4 0.6 Costa Rica ............................. 1984 7.8 7.5 8.0 0.5 Cuba...................................... 1981 9.3 10.1 8.5 -1.6 Dominica............................... 1981 17.4 19.3 16.0 -3.3 Dominican Republic ............. 1999 6.1 6.4 5.9 -0.6 Ecuador ................................. 1990 9.0 8.7 9.2 0.5 El Salvador............................ 1992 7.2 8.4 6.2 -2.2 French Guiana....................... 1982 29.6 31.7 27.6 -4.1 Grenada................................. 1981 19.5 22.3 17.7 -4.6 Guadeloupe ........................... 1990 22.6 .. .. .. Guatemala ............................. 1998/99 6.3 4.6 7.8 3.2 Haiti ...................................... 2000 8.5 8.3 8.6 0.4 Honduras............................... 1988 5.6 5.9 5.3 -0.6 Martinique............................. 1990 21.7 .. .. .. Mexico .................................. 2000 8.5 7.2 9.6 2.4 Montserrat............................. 1980 24.5 24.9 24.2 -0.7 Netherlands Antilles.............. 1992 14.8 14.4 15.2 0.8 Nicaragua .............................. 1997/98 5.2 5.8 4.6 -1.3 Panama.................................. 2000 11.3 14.1 8.5 -5.6 Paraguay ............................... 1990 5.4 5.8 5.1 -0.6 Peru....................................... 2000 8.7 8.1 9.2 1.1 Saint Kitts and Nevis ............ 1980 25.3 29.8 22.1 -7.7 Saint Lucia ............................ 1980 17.8 19.4 16.7 -2.7 Trinidad and Tobago............. 1980 14.9 15.6 14.4 -1.2 Turks and Caicos Islands ...... 1980 15.3 13.6 16.7 3.1 United States Virgin Islands ................................. 1990 23.5 21.2 25.3 4.1 Uruguay ................................ 1996 15.6 12.4 17.9 5.5 Venezuela.............................. 1990 6.4 7.6 5.4 -2.2
Northern America Bermuda................................ 1991 21.6 15.8 26.0 10.2 Canada .................................. 1991 24.4 13.7 32.9 19.2 United States of America ...... 2000 25.9 14.9 34.5 19.6
Oceania Cook Islands ......................... 1991 9.3 11.9 6.3 -5.6 Fiji......................................... 1983/85 2.0 1.5 2.4 0.9 New Zealand ......................... 1991 27.6 17.1 36.1 19.0
Sources: See annex table A.IV.3. a Special Administrative Region.

United Nations Department of Economic and Social Affairs/Population Division Living Arrangements of Older Persons Around the World 19
Source: Table II.1.
Gender differentials Older women are usually more likely than older men to live alone, especially where the overall proportion living alone is high. In only 25 countries, among the 127 with gender-specific data available in table II.1, does a greater proportion of older men than of older women live alone. Most of the exceptions are in the Caribbean region. The gender difference ranges from 7.7 percentage points in favour of men in Saint Kitts and Nevis to 30.5 percentage points in favour of women in the Netherlands (table II.1). The size of the gender difference is strongly related to the overall proportion of older persons living alone (figure II.3). The Pearson correlation between the percentage living alone and the size of the gender difference is 0.70 (0.83 if Caribbean countries are excluded). The outliers of Caribbean countries are clearly visible. The strength of the relationship is due, in large part, to the large gender differences among older persons living alone in more developed countries.
Figure II.2. Distribution of countries according to the proportion of older persons living alone, by major area
Per
cent
age
livin
g al
one,
per
sons
age
d 60
+
0
10
20
30
40
10th
25th
median
75th
90th
Percentile:
Africa Asia Latin Americaand the Caribbean
Europe andNorth America
Source: Table II.1. NOTE: Values lower than the 10th or higher than the 90th percentile are shown as separate dots.
The reason more women live alone is, basically, that women are less likely to be currently married, mainly because of widowhood. Among those who are unmarried, more older men than women live alone in most countries.
Figure II.1. Levels of solitary living around the world: proportion of persons aged 60 years or over

United Nations Department of Economic and Social Affairs/Population Division 20 Living Arrangements of Older Persons Around the World
Specifically, of the 50 countries with data on marital status, in 42, women were more likely to live alone if persons of all marital statuses are considered, but in only 7 countries were unmarried women more likely to be living alone than unmarried men (annex table A.IV.1).
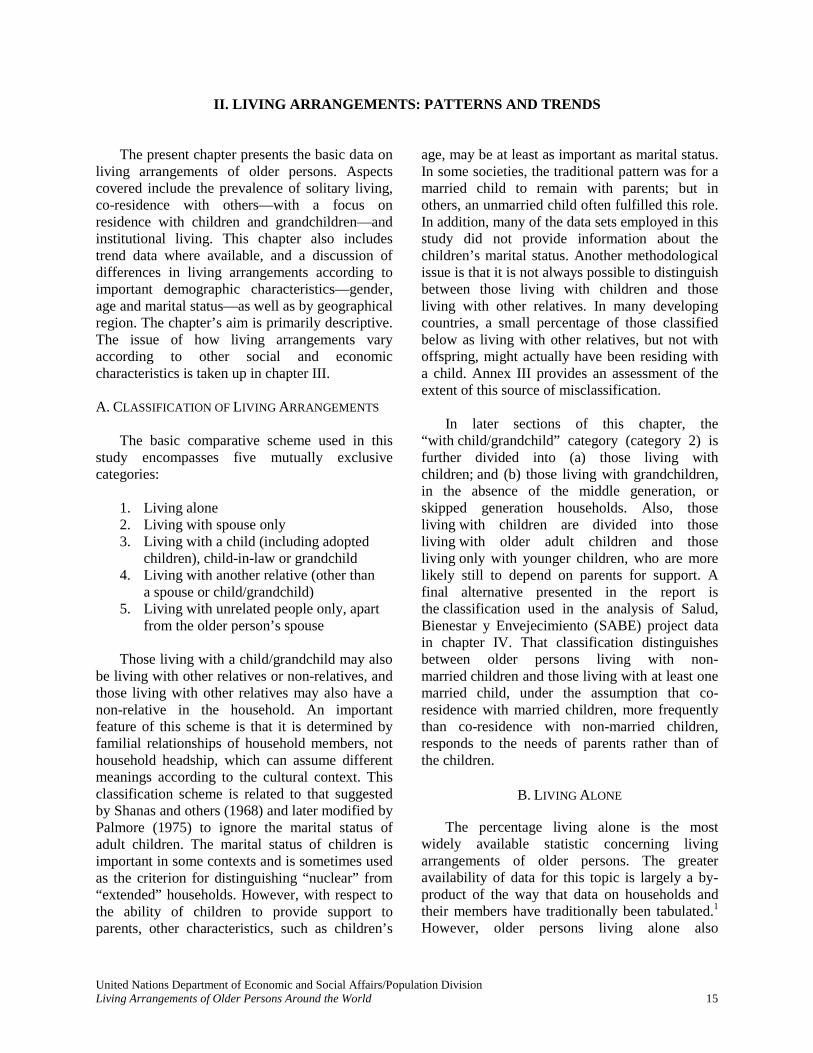
There is a large gap between the marital status of older men and women (figure II.4), and this gap grows with age. This universal pattern is due to two main factors: husbands are usually older than their wives; and life expectancy is higher for women. This ensures that most men are married into their older years, while women are more often widowed. In addition, in most countries, men are more likely to remarry after the death of a spouse or after divorce. Thus, women are at particular risk of living alone in old age,
especially if they are left childless. Traditionally, however, it has been part of a woman’s role to foster close emotional ties with offspring, who, in turn, are expected to provide them with support when they become dependent and old. If it turns out to be the man who survives into old age without being married, he may face a higher risk of living alone.
Even though differences in marital status are the main reason for the gender differences in solitary living, marital status does not explain the large interregional differences in the percentage of older persons living alone. Indeed, the marital status of older men and women varies much less among regions (figure II.4) than does the percentage of older persons living alone (figure II.2).
Figure II.3. Gender difference in the proportion of older persons living alone by the proportion of older persons living alone, selected countries and years
-10.0
-5.0
0.0
5.0
10.0
15.0
20.0
25.0
30.0
35.0
0.0 5.0 10.0 15.0 20.0 25.0 30.0 35.0 40.0 45.0
Proportion living alone (percentage)
Gen
der
diff
eren
ce (
fem
ale-
mal
e pe
rcen
tage
poi
nts)
○ Caribbean countries
Source: Table II.1.
United Nations Department of Economic and Social Affairs/Population Division Living Arrangements of Older Persons Around the World 21
Proportion of the world’s older men and women living alone
Information on solitary living among the older population is available, for at least one date, for countries containing over 90 per cent of the world’s older population. Table II.2 presents estimates of solitary living for the world and regions, based on the latest available information for each country. In deriving the estimates, countries for which no information was available were assumed to have the same proportions living alone as the weighted average for other countries in the same region.2 The only regions for which the estimate is based on less than two thirds of the older population are Middle Africa and Oceania; consequently, the estimates for those regions are subject to considerable uncertainty. For the world as a whole, the proportion of the older population living alone is estimated to be 14 per cent, 8 per cent for men and 19 per cent for women. The percentages are lowest in South-Eastern and South-central Asia (4-6 per cent). Eastern and Western Asia, and all regions within Africa and Latin America and the Caribbean, have levels of solitary living in the range of 7-10 per cent, but in Europe, Northern America and Oceania, the average is much higher, about 25 per cent. Within Europe, the regions show markedly different proportions living alone, from 19 and 24 per cent in Southern and Eastern Europe, respectively, to 32 and 34 per cent in Western and Northern Europe, respectively. The average proportion of older women living alone (19 per cent) is more than double the proportion for older men (8 per cent), worldwide. Gender differences are particularly high in Western Europe, where the proportion of older women who live alone (43 per cent) is almost triple the corresponding proportion of older men (15 per cent). In Africa and Asia, the proportion living alone is about 80 per cent higher among older women than among older men3; in Latin America and the Caribbean, that proportion among older women is about 40 per cent higher than among older men. The only region to show a higher percentage of men than of women living alone is the Caribbean (10 per cent of men, 9 per cent of women).
Figure II.4. Proportion of older persons currently married, world and major areas
Source: United Nations (2002b). NOTE: Figures are weighted averages of countries with information available. Reference date varies among countries.
Age differentials
Age differentials in the proportion living alone result from several mechanisms. One major factor has already been mentioned: the rise with age of the likelihood of being widowed. Widowhood does not immediately result in solitary living, though, unless the married couple was already living apart from others. The age pattern of living with others, especially children, is in turn influenced by both life-cycle and cultural factors that affect whether adult children establish separate households. Among the life-cycle factors, levels and timing of fertility largely determine the degree of overlap of life stages of the parental and the children’s generations. People aged 60 or over may still be caring for younger children, especially if childbearing was completed at a relatively late age. Conversely, when childbearing occurs early, parents are more likely to reach older ages when their children are already settled with their own families. In addition, institutional contexts may constrain or facilitate co-residence at different ages. For example, an economy centred around family farms and small family businesses provides an incentive for adult children to remain with the parents, while the existence of formal pension systems may reduce the need for co-residence in older age. Other cultural and economic conditions may also constrain or facilitate co-residence of adult children and parents. For example, in cases where adult women work away from home, the older
78 86
76 79 76 76 74
44 40 45 42 43 45 49
0 10 20 30 40 50 60 70 80 90
100
World Africa Asia Europe Latin America and the
Caribbean
Northern America
Oceania
Percentage Male Female

United Nations Department of Economic and Social Affairs/Population Division 22 Living Arrangements of Older Persons Around the World
generation may be a crucial provider of childcare, especially if reliable and affordable alternatives are in short supply. Such circumstances may favour co-residence even after the older generation’s children are grown, extending it at least through the period during which grandchildren are of pre-school ages. A final mechanism reflects cultural norms regarding the care of infirm older persons. Moving to a nursing home or other institution, instead of moving in with relatives, can be an option for older persons who need help with activities of daily living, or who can benefit from specialized medical care that is difficult or impossible to deliver at home. Whether that option is chosen depends both on social norms regarding its acceptability and on the availability and affordability of good-quality institutions—whose availability is, in turn, partly dependent upon broad-based social support and funding. In societies where institutionalization is either unavailable or strongly stigmatized, the prevalence of co-residence with children and other relatives is likely to increase among the oldest old, who are more likely to need assistance. Among the considerations just mentioned, the age pattern and level of the proportion of older persons living alone are likely to differ between societies where children typically move out of the parental home as young adults and those where it is usual for one or more adult children to remain with the parents. In the former case, the proportion of older persons who live alone will tend to rise with increasing age, as the youngest children leave home and as mortality claims the spouse. In such a regime, the proportion living alone may fall again at the highest ages, as the onset of disability or poor health makes solitary living untenable. In such circumstances, some persons may join the households of children or other relatives, while others may enter nursing homes or other institutions.4 By contrast, where it is usual for an adult child to remain in the parents’ home, the proportion of the older population living alone is expected to be low at all ages, with at most small differences according to age. The onset of disability or frailty in old age in such cases would not usually require a change of household, although it might require significant adjustment of responsibilities and activities within the household.
TABLE II.2. PROPORTION OF PERSONS AGED 60 YEARS OR OVER WHO LIVE ALONE: ESTIMATES FOR THE WORLD, MAJOR AREAS
AND REGIONS, BY SEX (Percentage)
Major area or region Total Men Women
World ......................................... 14 8 19 Africa ......................................... 8 6 11 Eastern.................................. 9 6 13 Middlea................................. 10 8 12 Northern ............................... 8 4 12 Southern ............................... 8 8 8 Western ................................ 7 5 10 Asia ............................................ 7 5 9 Eastern ....................................... 9 7 11 South-eastern........................ 6 3 9 South-central ........................ 4 2 6 Western ................................ 9 5 14 Europe........................................ 26 13 35 Eastern.................................. 24 11 31 Northern ............................... 34 21 44 Southern ............................... 19 9 26 Western ................................ 32 15 43 Latin America and the Caribbean ................................. 9 7 10 Caribbean ............................. 10 10 9 Central America ................... 8 7 9 South America...................... 9 7 11 Northern America ...................... 26 15 34 Oceaniaa ..................................... 25 16 34
Sources: Table II.1, weighted by numbers of persons aged 60 years or over in 1995, from United Nations (2003b). NOTE: For the population in households. Countries with missing information were assumed to have the same percentages living alone as the region-specific population-weighted average for countries with data. Except as noted separately, data on the percentage of older persons living alone were available for countries contributing at least two-thirds per cent of the older population of the regions shown, and for 93 per cent of the total older population of the world. The population-weighted average date to which the underlying observations pertain (see table II.1) is 1992. a Imputed on the basis of data that covered under half of the region’s population.
As expected, the age differential in the proportion living alone is largest in countries where solitary living is most common (annex table A.IV.2 and figure II.5). There are some similarities in the age pattern across countries, though, with the proportion living alone usually increasing as age advances until older people reach their late seventies or early eighties and often decreasing thereafter. In countries with very low levels of solitary living, the proportion living alone tends to reach a peak at lower ages, while for countries with very high proportions living

United Nations Department of Economic and Social Affairs/Population Division Living Arrangements of Older Persons Around the World 23
alone, the proportion tends to increase further at older ages.5
Figure II.5. Proportion of older persons living alone, by age
Age
60-64 65-69 70-74 75-79 80-84 85+
Per
cen
tag
e
0
10
20
30
40
50
60
Total percentageliving alone:
25+
10-24
5-9
< 5
Source: Annex table A.IV.2. NOTE: Unweighted averages for countries grouped according to the proportion of those aged 60 years or over who live alone.
The age pattern of solitary living is affected by the level of widowhood as married older persons usually do not live alone. If only unmarried older persons are considered, the proportion living alone typically reaches a peak at a younger age than for all older persons. For instance, in Asia and in Latin America, the level of solitary living peaks, on average, at ages 80-84 for all older persons; but among the unmarried in these regions, the level is highest at around age 70 and declines thereafter (annex table A.IV.2 and figure II.6). In Europe, while the age at which the overall proportion living alone peaks in the eighties, the peak among unmarried older persons occurs in the late 60s. In the case of the United States of America, however, the proportion living alone increases until older ages even among the unmarried, starting to decline only after age 85. Several factors may account for these age patterns. The fact that the age patterns of living alone among the unmarried are different from those among the entire older population implies that the increase in widowhood with advancing age has a major effect on the age pattern as well as the level of solitary living among the older population. Among the unmarried, the slight increase in solitary living up to around age 70
probably reflects the fact that some of the younger old still have dependent children, who over time leave to establish a separate household. The declines in solitary living at the highest ages may reflect more than one set of factors. For one thing, the present situation may reflect cohort effects: the oldest old of today belong to cohorts with less education and a more modest wage-earning history. This makes them less likely to be able to afford to maintain a household separate from children, and they may also be more likely to hold traditional views favouring co-residence. Another important factor is that the oldest old have a higher prevalence of disability and chronic illness and are more likely to be offered care by kin. If the age of onset of the most prevalent forms of disability increases (decreases), age patterns of co-residence could experience a downward (upward) shift at younger ages. The institutional setting may matter, too. Indeed, in two of the most affluent countries listed in annex table A.IV.2—Finland and the United States, which have comparatively well-developed social-security networks with a broad coverage for the older population—the age pattern of living alone differs from that in most of the other countries, in that the proportion of the unmarried who live alone rises with increasing age up to ages 80-84, and declines only slightly at age 85 years or over. Information on the age pattern of solitary living among older persons may help in anticipating the future trajectory of the overall rate of living alone. Since the difference between the minimum and maximum values of the fraction co-residing by age can be fairly large (on the order of 10 to 15 percentage points in the United States, for example), changes in the age distribution of the older population could have significant effects on the overall fraction living alone, even in the absence of changes in the age-specific probabilities of living alone.6 The direction and magnitude of these age-structure effects depend on the relative size of consecutive cohorts of older persons, as determined by the past history of fertility and mortality. The long-term trend is one of ageing of the older population (figure 0.1), owing to the combined effects of lower fertility and lower mortality. However, in many developed countries, the large “baby boom” cohorts born after the Second World War will begin

United Nations Department of Economic and Social Affairs/Population Division 24 Living Arrangements of Older Persons Around the World
Figure II.6. Proportion of older persons living alone, by age and major area: total and unmarried
Source: Annex table A.IV.2. NOTE: Averages for Asia include only the four countries for which data were available up to ages 85+. to pass into the age group 60-69 after 2005. In some countries, such as the United States, the fact that this will increase the proportion of the “younger old” will at first tend to slow if not reverse the longer-term trend towards higher levels of solitary living, but later on, as these cohorts attain higher ages, it will have the opposite effect. In parts of the developing world, the size of the first few cohorts attaining age 60 by 2020 will create a similar bulge in the age distribution.
Trends in solitary living For most countries, data regarding long-term trends in solitary living are not available. However, for the period from the 1980s to the 1990s, trend information is available for a substantial number of countries from all major areas of the world. Data on solitary living at age 60 years or over are available for at least two times for 62 countries: 18 countries in Africa; 12 in Asia; 13 in Europe; 16 countries in Latin America and the Caribbean; plus Canada and
the United States in Northern America and Fiji in Oceania. Statistics for two times (the earliest and the latest available) are shown in table II.3. Additional trend data are provided in annex table A.IV.3, which includes some countries for which time series data were available for age group 65 or over, but not for age group 60 years or over. On average, the time points in table II.3 are about 14 years apart. In Africa, the distance between the two time points ranges from a minimum of 5 years in Benin, Madagascar, Mali and Zimbabwe to a maximum of 20 years in Cameroon and Kenya. In Asia, the distance between time points ranges from 4 years in Kazakhstan to 24 years in Bangladesh. In Europe, the distance ranges from 3 years in Denmark and Greece to 14 years in Austria, while in Latin America and the Caribbean, it ranges from 5 years in Haiti to 30 years in Mexico and Panama. In Canada, Fiji and the United States of America, the distance between time points is around 10 years.
A. All persons aged 60 years or over
Age
60-64 65-69 70-74 75-79 80-84 85+
Per
cen
tag
e
0
10
20
30
40
50
60
AfricaAsiaEuropeLatin America and CaribbeanUSA
B. Unmarried persons aged 60 years or over
Age
60-64 65-69 70-74 75-79 80-84 85+
Per
cen
tag
e
0
10
20
30
40
50
60
70
80

United Nations Department of Economic and Social Affairs/Population Division Living Arrangements of Older Persons Around the World 25
TABLE II.3. TRENDS IN SOLITARY LIVING AT AGE 60 YEARS OR OVER,
BY SEX, SELECTED COUNTRIES AND PERIODS
Percentage alonea
Country Date Total Male (M)
Female (F) F–M
Africa Benin.......................................... 1996 8.5 7.5 9.5 2.0 2001 10.3 9.0 11.7 2.7
Burkina Faso.............................. 1992/93 3.0 3.2 2.7 -0.5 1998/99 2.3 2.3 2.4 0.1
Cameroon................................... 1978 11.7 10.8 12.7 1.9 1998 8.3 8.0 8.6 0.6
Côte d'Ivoire............................... 1980/81 1.8 2.2 1.4 -0.8 1998/99 4.0 5.0 2.9 -2.1
Egypt.......................................... 1980 9.5 2.6 15.9 13.3 2000 8.3 3.9 13.1 9.2
Ghana......................................... 1979/80 11.9 13.1 10.5 -2.6 1998 21.6 20.2 22.7 2.5
Kenya......................................... 1978 13.3 10.1 17.3 7.2 1998 17.3 9.0 25.2 16.2
Madagascar ................................ 1992 7.2 3.9 10.4 6.5 1997 8.0 4.4 11.4 7.0
Malawi ....................................... 1992 9.3 6.7 11.9 5.2 2000 11.4 8.4 13.9 5.5
Mali............................................ 1995/96 5.1 4.1 6.6 2.5 2001 6.8 5.1 9.8 4.7
Niger .......................................... 1992 4.1 1.2 7.5 6.3 1998 3.5 1.5 6.0 4.5
Nigeria ....................................... 1990 7.2 5.4 10.1 4.7 1999 6.4 3.3 10.7 7.4
Rwanda ...................................... 1992 4.8 2.9 6.7 3.8 2000 6.5 4.4 8.1 3.7
Senegal....................................... 1978 2.5 3.0 2.0 -1.0 1997 1.3 1.5 1.1 -0.4
Tunisia ....................................... 1978 4.5 2.2 7.2 5.0 1991 2.7 1.9 3.7 1.8
United Republic of Tanzania ..... 1992 6.8 5.4 8.5 3.1 1999 7.5 7.3 7.8 0.5
Zambia ....................................... 1992 7.4 4.0 11.8 7.8 2001/02 8.8 5.5 12.3 6.8
Zimbabwe .................................. 1994 6.1 6.8 5.3 -1.5 1999 8.8 8.1 9.4 1.3
Asia Bangladesh................................ 1975/76 3.2 2.0 5.1 3.1 1999/00 1.8 0.6 3.3 2.7
India ........................................... 1992/93 2.6 1.5 3.9 2.4 1998/99 3.3 1.8 5.0 3.2
Indonesia.................................... 1974/75 5.5 1.9 8.9 7.0 1997 7.3 2.4 11.9 9.5
Japan .......................................... 1980 8.4 4.1 11.6 7.5 2000 12.7 .. .. ..
Kazakhstan................................ 1995 17.2 6.0 23.0 17.0 1999 15.9 7.5 21.3 13.8

TABLE II.3 (continued)
United Nations Department of Economic and Social Affairs/Population Division 26 Living Arrangements of Older Persons Around the World
Percentage alonea
Country Date Total Male (M)
Female (F) F–M
Malaysia..................................... 1983/85 5.8 3.4 8.2 4.8 1991 6.8 4.7 8.7 4.0
Nepal.......................................... 1996 3.8 2.5 5.1 2.6 2001 4.5 2.6 6.6 4.0
Philippines ................................ 1978 3.0 2.4 3.6 1.2 1998 5.3 4.0 6.4 2.4
Republic of Korea ...................... 1974/75 4.4 1.8 6.2 4.4 1988 7.7 .. .. ..
Sri Lanka.................................... 1975 5.0 5.8 4.4 -1.4 1990 2.9 1.4 4.6 3.2
Thailand ..................................... 1975 2.3 1.4 3.0 1.6 1995 4.3 2.9 5.5 2.6
Turkey........................................ 1978/79 5.8 2.5 8.9 6.4 1998 8.5 4.4 12.5 8.1 Europe
Austria ....................................... 1981 31.6 13.1 42.6 29.5 1995 30.7 12.9 42.0 29.1
Belgium...................................... 1981 28.0 15.5 37.1 21.6 1994 29.3 16.2 38.9 22.7
Denmark .................................... 1991 37.4 21.8 49.4 27.6 1994 39.1 24.7 50.0 25.3
Finland ....................................... 1990 35.4 19.6 45.7 26.1 2000 35.2 21.0 45.3 24.3
France ........................................ 1982 27.8 14.1 37.5 23.4 1994 28.7 15.1 38.4 23.3
Germany .................................... 1987b 32.5 12.8 44.0 31.2 1994 33.6 15.1 45.5 30.4
Greece ........................................ 1991 14.5 7.7 20.1 12.4 1994 18.3 8.9 26.1 17.2
Ireland........................................ 1981 24.4 14.6 31.6 17.0 1994 26.4 21.4 30.4 9.0
Italy............................................ 1981 22.1 11.1 29.3 18.2 1994 22.6 10.0 31.9 21.9
Norway ...................................... 1980 28.9 17.2 38.3 21.1 1990 32.7 20.1 42.5 22.4
Poland ........................................ 1978 19.6 9.2 26.5 17.3 1988 20.7 10.4 27.5 17.1
Spain .......................................... 1981 12.5 5.7 17.4 11.7 1994 14.0 7.4 19.2 11.8
Sweden....................................... 1981 31.5 20.0 41.0 21.0 1990 37.1 24.3 47.3 23.0
Latin America and the Caribbean Argentina ................................... 1970 10 10 11 1 1980 10.9 8.2 12.9 4.7
Bolivia ....................................... 1976 12 10 13 3 1998 13.2 11.7 14.4 2.7
Brazil ......................................... 1970 7 5 9 4 1996 8.8 5.3 11.7 6.4
Chile........................................... 1970 6 7 6 -1 1992 8.8 8.2 9.2 1.0

TABLE II.3 (continued)
United Nations Department of Economic and Social Affairs/Population Division Living Arrangements of Older Persons Around the World 27
Percentage alonea
Country Date Total Male (M)
Female (F) F–M
Colombia.................................... 1973 6 6 6 0 2000 7.1 6.7 7.4 0.7
Costa Rica.................................. 1973 6 5 6 1 1984 7.8 7.5 8.0 0.5
Dominican Republic .................. 1970 7 8 6 -2 1999 6.1 6.4 5.9 -0.5
Ecuador...................................... 1974 8 8 7 -1 1990 9.0 8.7 9.2 0.5
Guatemala .................................. 1981 5.5 5.4 5.6 0.2 1998/99 6.3 4.6 7.8 3.2
Haiti ........................................... 1994/95 8.5 8.9 8.1 -0.8 2000 8.5 8.3 8.6 0.3
Mexico ....................................... 1970 8 6 10 4 2000 8.9 7.3 10.2 2.9
Nicaragua................................... 1971 8.1 9.4 7.0 -2.4 1997/98 5.2 5.8 4.6 -1.2
Panama....................................... 1970 12 15 9 -6 2000 11.3 14.1 8.5 -5.6
Paraguay .................................... 1972 7 7 8 1 1990 5.4 5.8 5.1 -0.7
Peru............................................ 1977/78 8.4 8.9 7.8 -1.1 2000 8.7 8.1 9.2 1.1
Venezuela .................................. 1977 6.0 6.1 6.0 -0.1 1990 6.4 7.6 5.4 -2.2
Northern America Canada ....................................... 1981 22.5 12.3 30.8 18.5 1991 24.4 13.9 32.9 19.0
United States of America ........... 1990 26.1 14.4 34.8 20.4 2000 25.9 14.9 34.5 19.6
Oceania Fiji.............................................. 1974 3.1 2.3 4.1 1.8
1983/85 2.0 1.5 2.4 0.9
Sources: See annex table A.IV.3. b For the household population. a Former Federal Republic of Germany.

United Nations Department of Economic and Social Affairs/Population Division 28 Living Arrangements of Older Persons Around the World
Figure II.7. Proportion of older persons living alone at two time points, averages for major areas
6.9 5.6
7.8
24.3
26.6
8.0 6.8
8.3
25.2
28.3
0
5
10
15
20
25
30
Africa Asia Latin America and the Caribbean
Northern America Europe
Percentage
1970s/1980s
1990s/2000s
Source: Table II.3. NOTE: The first time point refers to the earliest year in the 1970s or 1980s for which data were available. The second time point refers to the latest year in the 1990s or 2000s for which data were available. Unweighted averages.
The proportion of older persons living alone increased in the majority of the countries over time in all regions of the world, suggesting the existence of a global trend of this kind of living arrangement among the older population. Figure II.7, which displays a regional country-average proportion of persons age 60 years or over living alone at dates in the 1970s-1980s and in the 1990s or later, reinforces the idea of a
worldwide increase in the prevalence of solitary living among the older population. In general, the fraction of older persons living alone increased for both men and women. The only exception was among men in Latin America and the Caribbean where the proportion living alone remained practically the same over time (figure II.8).
Figure II.8. Proportion of older persons living alone at two time points, by sex, averages for major areas
5.3
2.9
7.9
13.4 14.0
8.8 7.7 7.8
32.8
35.4
6.0
3.2
7.8
14.4 16.0
10.0 8.6 8.6
33.7
37.3
0
5
10
15
20
25
30
35
40
Africa Asia Latin America and the
Caribbean
Northern America
Europe Africa Asia Latin America and the
Caribbean
Northern America
Europe
Percentage
1970s/1980s
1990s/2000s
Males Females
Source: Table II.3. NOTE: The first time point refers to the latest year in the 1970s or 1980s for which data were available. The second time point refers to the latest year in the 1990s or 2000s for which data were available.

United Nations Department of Economic and Social Affairs/Population Division Living Arrangements of Older Persons Around the World 29
Figure II.9. Proportion of older persons living alone in selected developed countries: trends since 1960
Year
1950 1960 1970 1980 1990 2000 2010
Per
cent
age
livin
g al
one
5
10
15
20
25
30
35
40
45
Ireland
Italy
United States
Netherlands
Canada
Germanya
Source: Annex table A.IV.3. NOTE: For age 65 years or over. Based on the household population. a Former Federal Republic of Germany. However, the average pace of change in the developing countries is modest, suggesting that a substantial gap between most developing countries and most developed countries is likely to remain for the foreseeable future. Furthermore, not all countries show clear evidence of a trend, and in a few cases the proportion living alone declined. Decreases of at least 2 percentage points are indicated in Cameroon, China (at age 65 years or over, see annex table A.IV.3), Nicaragua and Sri Lanka. In Cameroon, data reviewed below show that the decline in solitary living was accompanied by a rise in the proportion living with children, but in China the proportion living with children declined. China experienced a substantial increase in the percentage living as a couple, without children, which might be a reflection of delayed widowhood due to mortality decline.7 For some of the more developed countries, additional trend data are available for the period since 1960, for persons aged 65 years or over (annex table A.IV.3). Trends for several countries with relatively long time series are shown in figure II.9. Although the proportion living alone rose rapidly in all the countries between 1960 and the late 1970s, in several cases—including Canada, Italy and the United States of America—the trend slowed or halted around 1980. The
proportion has also declined recently in Austria, Germany and Great Britain, after reaching peak levels that exceeded 45 per cent of the over-65 household population (Tomassini and others, 2004). In other cases—including Ireland and the Netherlands—the proportion living alone continued to grow up to the most recent available date in the 1990s. The reasons for these differing trends require further investigation, but are likely to have involved a combination of improvements in mortality in these countries, which tended to decrease the proportions widowed within each age group, declines in the proportion who never married,8 and trends in the age at which children left home. Regarding the last-mentioned factor—departure of young adults from the parental home—there is indeed a strong relationship between late home-leaving by children and the proportion of older persons living alone (figure II.10),9 and in some countries recent decades have seen a marked reversal of an earlier trend for children to depart from home at younger ages. Lately, in many countries in Northern America and Western, Northern and Southern Europe, children have tended to remain with their parents longer. The recent increases in proportions of older children who are still at home are especially large in Southern Europe (United Nations, 2004b; Goldscheider, 1998; Takahashi and Voss, 2000; Cordon 1997). In Italy, for instance, the proportion of men aged 25-29 who were living with their parents increased from about 50 per cent in 1986 to 66 per cent in 1994, and that of women increased from 25 to 44 per cent (Cordon, as cited in Takahashi and Voss (2000)). In Canada, 41 per cent of young adults aged 20-29 were living with their parents in 2001, up from 28 per cent in 1981 (Statistics Canada, 2004). In the United States of America, the proportion of youths aged 18-24 living in their parents’ household increased from 42 to 46 per cent between 1960 and 1980 and during most of the 1980s and 1990s that proportion was in the range of 53-54 per cent; there were signs of a small decline between 1999 and 2002 (Goldscheider, 1998; United States Bureau of the Census, 2003). In addition, cohorts entering old age in recent decades are the parents of that country’s large post-Second World War baby-boom generation.

United Nations Department of Economic and Social Affairs/Population Division 30 Living Arrangements of Older Persons Around the World
Their larger numbers of children, coupled with the trend towards later marriage of those children, have been linked to increasing levels of co-residence among older widowed women (Macunovich and others, 1995). Figure II.10. Proportion of older persons living alone, by the proportion of young people who had not left home by
age 30: European countries in the 1990s
Sources: For proportion living alone, table II.1; for proportion leaving home, Billari, Philipov and Baizán (2001). NOTE: Countries include Austria, Belgium, Czech Republic, Finland, France, Hungary, Italy, Latvia, Lithuania, Netherlands, Norway, Poland, Portugal, Slovenia, Spain, Sweden, Switzerland, United Kingdom and the former Federal Republic of Germany. For leaving home, data pertain to cohorts born around 1960; values for males and females were averaged.
For these developed countries, the trend towards later departure of the young is not a response to the needs of older parents. Rather, it has been attributed primarily to increased economic difficulties for young people—difficulties in finding a steady and well-paid job, often combined with rising housing costs (Goldscheider, 1998). Although the trend towards later home-leaving might appear to signal a return to a more traditional familial arrangement, it has not been associated with other “traditional” family behaviour, since it has been taking place in tandem with delayed marriage, greater marital instability and lower fertility. In Japan, where there was historically a strong expectation that a son would remain with parents after marriage, delayed home-leaving by unmarried children has been viewed not as a return to tradition, but rather as a new social problem of “parasite singles” (Takahashi and Voss, 2000). In Italy, there has
been a similar derogation of stay-at-home young men as “mother’s boys,” although the parents and children involved usually say they are happy with the arrangement (Palomba, 2001). C. CO-RESIDENCE WITH CHILDREN AND OTHERS
The present section employs the five-category household classification presented earlier, which comprises: 1. Living alone 2. Living with spouse only 3. Living with a child (including adopted children), child-in-law or grandchild 4. Living with another relative (other than a spouse or child/grandchild) 5. Living with unrelated people only, apart from the older person’s spouse In a later section, those living with children/grandchildren (category 3), are further divided into those living with at least one child, and those in skipped-generation households, with one or more grandchildren present but with the middle generation missing. Older persons living with children are also further divided, into those living with children under age 25 only and those living with at least one child aged 25 years or over. In the 87 countries for which data were available, the proportion of older persons living in “couple-only” households ranged from 1 per cent in Senegal to 56 per cent in Denmark10 (table II.4), the mean being 17.9 per cent and the median being 10.9 per cent. The variation between countries within regions was also significant: In Latin America and the Caribbean, for instance, the proportion living in “couple-only” households ranged from about 6 per cent in Nicaragua to about 24 per cent in Argentina; in Asia, the proportion ranged from about 3 per cent in Sri Lanka to more than 34 per cent in Japan. The proportion of older persons living either alone or with spouse only—independently of others—ranges from 3 per cent in Senegal to 95 per cent in Denmark. There is a large difference in this regard between the more and less developed countries. In all the European countries for which data were available, at least half of older persons
Percentage of children still in parents' home at age 30
0 5 10 15 20 25 30
Per
cent
age
livin
g al
one,
age
s 60
+
10
15
20
25
30
35
40

United Nations Department of Economic and Social Affairs/Population Division Living Arrangements of Older Persons Around the World 31
are living independently, as are 75 per cent of those in the United States of America. In Japan, a country where there has been traditionally a strong expectation that the eldest son would remain with the parents, nearly half of older persons were living independently by the year 2000. By contrast, among the developing countries of Africa, Asia and Latin America and the Caribbean, only in one, Kazakhstan, is the percentage above 40; the mean values were only 16 per cent in Africa, and about 20 per cent in Asia and in Latin America and the Caribbean.
Figure II.11. Distribution of countries according to the proportion of older persons living with a child or
grandchild, by major area
Source: Table II.4. NOTE: Values lower than the 10th or higher than the 90th percentile are shown as separate dots.
The proportion of older persons living with a child or grandchild ranges from 4 per cent in Denmark to almost 90 per cent in Bangladesh, with an average of 62 per cent and a median of 70 per cent. Although there is substantial variation within each region, values for Europe do not overlap with those in the less developed regions. In Africa, the proportions range from about 50 per cent in Gabon to more than 85 per cent in Guinea. In Asia, the range goes from 48 per cent in Japan and Kazakhstan to 90 per cent in Bangladesh; and in Latin America and the Caribbean, the proportion ranges from 46 per cent in Argentina to 76 per cent in Nicaragua. In Europe, values range from 4 per cent in Denmark to 43 per cent in Spain. The United States of America, with a
proportion of 18 per cent, falls in the lower half of the European range (table II.4 and figure II.11). Considering the 75 countries for which it is possible to distinguish between older people living with other relatives and those living only with non-relatives, the proportion living with other relatives ranges from 0.2 per cent in the Democratic People’s Republic of Korea and Finland to 24 per cent in the Comoros, with an average of 7.2 per cent. The proportion is low in most countries, falling below 6 per cent in roughly half of the countries. In a few countries, however, this kind of living arrangement is quite prevalent, with proportions above 15 per cent: in Latin America, this is the case in Mexico and Venezuela; and in Africa, this is the case in Cameroon, the Comoros, Côte d’Ivoire, Gabon and Namibia (table II.4). Finally, regarding older individuals and couples living with non-relatives only, the proportion ranges from 0.1 per cent in Armenia and Uzbekistan to 8.6 per cent in Thailand, with an average of 2.1 per cent. In about two thirds of the countries, the proportion in such arrangements is under 3 per cent. Although these figures might be expected to increase in the future, especially if childlessness and divorce increase among the older population, the situation was relatively rare in the 1990s. In general, then, living with a child or grandchild is the most common type of living arrangement among older persons in Latin America and the Caribbean, Asia, and Africa. In Europe and Northern America, however, the most common category is the couple-only household. Estimates of the distribution of older persons’ living arrangements for the world and regions are shown in table II.5. These estimates are based on the observations in table II.4, which includes countries representing 83 per cent of the world’s older population. Account was also taken of the information about the percentage living alone, which was available (from table II.1) for countries that include an additional 10 per cent of the world’s older population.11 Population-weighted averages were calculated for each region, based on the country-specific percentages in each living
Per
cent
age
livin
g w
ith c
hild
ren
or g
rand
child
ren
0
20
40
60
80
100
0
20
40
60
80
100
10th
25th
median75th
90th
Percentile:
Africa Asia Latin Americaand the Caribbean
Europe andNorth America

United Nations Department of Economic and Social Affairs/Population Division 32 Living Arrangements of Older Persons Around the World
arrangement and the estimated numbers of older persons in 1995, from the United Nations estimates and projections of population (United Nations, 2003b). In calculating the averages for the world and major areas, countries that lacked information about living arrangements were presumed to have the same distribution of living arrangements as the average for the region. The estimated proportions of older persons living with a child or grandchild are 74 per cent in Africa and Asia and 62 per cent in Latin America and the Caribbean, compared with 26 per cent in Europe and 19 per cent in Northern America (table II.5). On the other hand, the proportions living with spouse only are 43 and 47 per cent, respectively, in Europe and Northern America, compared with 16 per cent in Latin America and the Caribbean and Asia, and 9 per cent in Africa. The proportions living with other relatives or non- relatives are of some significance
in Latin America and the Caribbean (14 per cent) and Africa (8 per cent), particularly Middle Africa (16 per cent). Especially in African and Asian countries, it is likely that many, and in some cases most, older persons who are not living with children have no children with whom they might reside. Information about numbers of children ever born and numbers of children still alive has been gathered in censuses and surveys in a substantial number of countries, and data pertaining to women in their late forties are available from many sample surveys (see box I and annex table A.IV.4). The available data suggest that levels of childlessness range from under 5 per cent of older women to over 25 per cent. In about three fourths of countries, 10 per cent or more of older women have no living children, with the median percentage being 15.

TABLE II.4. PERCENTAGE DISTRIBUTION OF THE POPULATION AGED 60 YEARS OR OVER, ACCORDING TO HOUSEHOLD COMPOSITION
Living independently of others Living with child or grandchild
Child
Country Date Total Alone Couple
only Total Total Aged 25+
years Aged <25
years Grandchild but not child
With other
relative
With non-
relative
Africa
Benin........................................................... 2001 15.5 10.3 5.2 76.7 67.4 38.1 29.3 9.3 6.7 1.1 Burkina Faso ............................................... 1998/99 9.4 2.3 7.1 82.8 76.0 34.4 41.6 6.8 6.9 1.0 Cameroon.................................................... 1998 14.9 8.3 6.6 66.9 58.6 38.9 19.7 8.3 16.6 1.6 Central African Republic ............................ 1994/95 26.5 12.5 14.0 60.6 48.8 30.6 18.2 11.8 12.1 0.8 Chad............................................................ 1996/97 19.3 11.1 8.2 70.4 60.1 26.9 33.3 10.3 9.1 1.2 Comoros...................................................... 1996 5.4 1.5 3.9 68.3 61.8 42.6 19.2 6.5 24.0 2.2 Côte d'Ivoire................................................ 1998/99 7.2 4.0 3.2 71.3 64.1 44.2 20.0 7.2 18.0 3.4 Egypt........................................................... 2000 20.4 8.3 12.1 75.2 73.7 58.9 14.8 1.5 4.0 0.4 Ethiopia....................................................... 2000 9.6 5.0 4.6 82.0 66.2 33.4 32.9 15.8 6.2 2.2 Gabon.......................................................... 2000 25.4 11.0 14.4 50.8 42.2 31.2 11.0 8.6 17.8 6.1 Ghana.......................................................... 1998 26.6 21.6 5.0 67.7 49.8 27.5 22.3 17.9 5.5 0.2
Guinea......................................................... 1999 6.4 2.2 4.2 85.7 79.4 46.0 33.3 6.3 7.1 0.7 33 Kenya.......................................................... 1998 32.1 17.3 14.8 63.6 49.7 25.7 24.0 13.9 2.9 1.5 Madagascar ................................................. 1997 16.3 8.0 8.3 76.6 60.2 36.9 23.3 16.4 5.0 2.1 Malawi ........................................................ 2000 23.1 11.4 11.7 71.5 46.5 23.1 23.4 25.0 5.0 0.6 Mali............................................................. 2001 25.1 6.8 18.3 70.2 61.6 22.0 39.6 8.6 4.3 0.3 Morocco...................................................... 1992 12.9 5.7 7.2 78.9 76.9 62.4 14.4 2.0 6.9 1.3 Mozambique ............................................... 1997 28.6 14.3 14.3 61.8 50.4 26.0 24.4 11.4 9.2 0.4 Namibia....................................................... 1992 10.2 4.3 5.9 70.1 58.2 39.9 18.2 11.9 15.8 3.9 Niger ........................................................... 1998 8.9 3.5 5.4 84.9 70.9 41.2 29.6 14.0 5.5 0.8 Nigeria ........................................................ 1999 14.4 6.4 8.0 78.8 69.5 35.5 34.1 9.3 5.4 1.3 Rwanda ....................................................... 2000 12.8 6.5 6.3 83.9 58.5 23.9 34.7 25.4 2.4 0.8 Senegal........................................................ 1997 2.5 1.3 1.2 83.0 80.1 62.7 17.4 2.9 13.6 0.8 South Africa ................................................ 1998 19.5 8.1 11.4 72.0 54.1 44.5 9.7 17.9 6.7 1.7 Togo............................................................ 1998 13.4 8.0 5.4 76.3 65.9 41.8 24.1 10.4 9.7 0.6 Tunisia ........................................................ 1991 11.3 2.7 8.6 84.2 .. .. .. .. 2.9 1.6 Uganda........................................................ 1995 20.6 12.0 8.6 70.9 48.4 24.7 23.7 22.5 7.7 0.8 United Republic of Tanzania ...................... 1999 15.0 7.6 7.4 72.8 60.4 36.3 24.1 12.4 11.1 1.2 Zambia ........................................................ 2001/02 18.6 8.8 9.8 74.8 53.5 32.1 21.4 21.3 5.3 1.2 Zimbabwe ................................................... 1999 18.0 8.8 9.2 74.6 56.2 32.4 23.8 18.4 5.9 1.5

TABLE II.4 (continued)
Living independently of others Living with child or grandchild
Child
Country Date Total Alone Couple
only Total Total Aged 25+
years Aged <25
years Grandchild but not child
With other
relative
With non-
relative
Asia
Armenia ...................................................... 2000 24.9 8.7 16.2 71.9 70.0 66.8 3.1 1.9 3.2 0.1 Bahrain........................................................ 1991 5.9 0.7 5.2 86.8 .. .. .. .. 4.0 3.3 Bangladesh.................................................. 1999/00 6.1 1.8 4.3 89.8 88.1 66.9 21.3 1.7 3.4 0.7 Democratic People’s Republic of Korea ..... 1990 13.6 4.6 9.0 86.0 .. .. .. .. 0.2 0.2 India ............................................................ 1998/99 11.5 3.3 8.2 83.2 81.4 70.9 10.5 1.8 5.0 0.3 Indonesia..................................................... 1997 24.2 7.3 16.9 68.9 62.8 48.3 14.5 6.1 5.9 1.0 Japan ........................................................... 2000 47.2 12.7 34.5 48.3 .. .. .. .. 4.4 0.2 Jordan.......................................................... 1991 17.3 7.0 10.3 77.8 .. .. .. .. 3.5 1.4 Kazakhstan.................................................. 1999 48.2 15.9 32.3 48.2 45.1 41.0 4.1 3.1 3.0 0.6 Kyrgyzstan .................................................. 1997 22.9 9.3 13.6 74.1 69.4 56.8 12.6 4.7 2.6 0.3 Malaysia...................................................... 1983/85 16.7 5.8 10.9 79.8 70.4 .. .. 9.4 3.1 0.4
Myanmar..................................................... 1990 10.3 4.6 5.7 76.8 .. .. .. .. 8.7 4.2 34 Nepal........................................................... 2001 14.2 4.5 9.7 81.1 78.2 61.0 17.2 2.9 4.3 0.3 Pakistan....................................................... 1990/91 7.9 2.7 5.2 86.8 85.8 67.8 18.0 1.0 4.9 0.4 Philippines .................................................. 1998 15.6 5.3 10.3 74.7 66.2 55.3 10.9 8.5 7.5 2.1 Republic of Korea ....................................... 1983/85 15.5 2.1 13.4 79.7 76.4 .. .. 3.3 1.4 3.4 Sri Lanka..................................................... 1990 6.2 2.9 3.3 85.2 .. .. .. .. 5.9 2.7 Thailand ...................................................... 1990 10.0 3.7 6.3 77.7 .. .. .. .. 3.7 8.6 Turkey......................................................... 1998 37.9 8.5 29.4 58.9 57.5 47.9 9.7 1.4 2.7 0.5 Uzbekistan .................................................. 1996 19.8 7.6 12.2 77.9 75.2 64.0 11.3 2.7 2.3 0.1 Yemen......................................................... 1991/92 14.7 4.0 10.7 76.0 74.8 51.1 23.7 1.2 8.8 0.7
Europe
Austria......................................................... 1995 65.4 30.7 34.7a 31.3 .. .. .. .. --3.2b-- Belgium....................................................... 1994 82.8 29.3 53.4a 15.2 .. .. .. .. --2.1b-- Bulgaria....................................................... 1992 62.2 19.0 43.2 32.2 32.0 .. .. 0.2 4.4 1.2 Czech Republic ........................................... 1990 77.8 33.6 44.2 17.5 .. .. .. .. 4.0 0.7 Denmark...................................................... 1994 94.9 39.1 55.8a 4.1 .. .. .. .. --1.0b-- Estonia ........................................................ 1989 62.6 29.6 33.0 29.4 .. .. .. .. 5.0 3.1 Finland ........................................................ 1990 78.3 35.4 42.9 17.9 .. .. .. .. 0.2 3.6 France ......................................................... 1994 82.1 28.7 53.4a 15.3 .. .. .. .. --2.6b-- Germany...................................................... 1994 84.8 33.6 51.1a 13.5 .. .. .. .. --1.7b-- Greece ......................................................... 1994 63.0 18.3 44.7a 34.7 .. .. .. .. --2.4b--

TABLE II.4 (continued)
Living independently of others Living with child or grandchild
Child
Country Date Total Alone Couple
only Total Total Aged 25+
years Aged <25
years Grandchild but not child
With other
relative
With non-
relative
Ireland ......................................................... 1994 54.8 26.4 28.4a 36.1 .. .. .. .. --9.1b-- Italy ............................................................. 1994 62.9 22.6 40.4a 34.6 .. .. .. .. --2.4b-- Latvia .......................................................... 1989 55.4 24.0 31.4 35.6 .. .. .. .. 5.6 3.4 Netherlands ................................................. 1994 88.8 34.5 54.3a 10.1 .. .. .. .. --1.1b-- Portugal....................................................... 1994 59.5 15.8 43.8a 35.5 .. .. .. .. --5.0b-- Romania ...................................................... 1992 60.1 20.3 39.8 30.4 .. .. .. .. 4.6 4.8 Spain ........................................................... 1994 51.3 14.0 37.2a 43.3 .. .. .. .. --5.4b-- United Kingdom.......................................... 1994 83.5 34.7 48.8a 13.4 .. .. .. .. --3.1b--
Latin America and the Caribbean
Argentina .................................................... 1980 34.7 10.9 23.8 46.3 44.5 38.0 6.5 1.8 13.9 5.1 Bolivia......................................................... 1998 35.4 13.2 22.2 57.7 50.3 38.1 12.2 7.4 4.7 2.2
Brazil........................................................... 1996 27.1 8.7 18.4 63.8 58.1 44.4 13.7 5.7 6.4 2.6 35 Chile............................................................ 1992 23.0 8.8 14.2 58.7 54.2 47.2 7.0 4.5 12.2 6.1 Colombia..................................................... 2000 17.8 7.1 10.7 69.0 63.8 55.6 8.2 5.2 9.3 4.0 Costa Rica ................................................... 1984 19.4 7.8 11.6 65.1 61.5 47.7 13.8 3.6 10.8 4.7 Dominican Republic ................................... 1999 16.1 6.0 10.1 73.8 60.0 44.8 15.2 13.8 6.5 3.7 Ecuador ....................................................... 1982 19.3 8.6 10.7 66.7 60.6 44.7 15.9 6.1 9.7 4.3 Guatemala ................................................... 1998/99 17.5 6.3 11.2 72.3 66.0 47.7 18.3 6.3 5.8 4.4 Haiti ............................................................ 2000 15.9 8.5 7.4 66.7 53.2 38.2 15.0 13.5 11.0 6.5 Mexico ........................................................ 1990 19.8 7.4 12.4 62.4 60.1 41.0 19.1 2.3 16.3 1.5 Nicaragua .................................................... 1997/98 11.5 5.2 6.3 76.0 66.4 55.3 11.1 9.6 9.0 3.5 Panama........................................................ 1980 23.2 12.3 10.9 61.3 54.6 42.6 12.0 6.7 11.6 3.9 Paraguay...................................................... 1990 15.2 5.4 9.8 72.1 65.3 49.6 15.8 6.8 8.9 3.7 Peru ............................................................. 2000 22.1 8.7 13.4 70.0 63.8 53.2 10.6 6.2 6.1 1.7 Venezuela.................................................... 1981 14.5 8.0 6.5 64.7 59.3 45.7 13.6 5.4 16.1 4.7
Northern America
United States of America ............................ 2000 74.6 25.9 48.7 17.8 16.3 14.6 1.7 1.5 4.6 3.0
Oceania Fiji............................................................... 1983/85 10.2 2.0 8.2 85.1 78.1 .. .. 7.0 2.9 1.8
Sources: See annex table A.IV.5 (except for Japan: Comprehensive Survey of Living Conditions of the People on Health and Welfare, from Kono (2003)). NOTE: For the household population. a Living with a partner but not children; can include other relatives or non-relatives.
b Living with other adults, but not with partner or children.

United Nations Department of Economic and Social Affairs/Population Division 36 Living Arrangements of Older Persons Around the World
TABLE II.5. PERCENTAGE DISTRIBUTION OF THE POPULATION AGED 60 YEARS OR OVER ACCORDING TO HOUSEHOLD COMPOSITION, WORLD, MAJOR AREAS AND REGIONS
Region Alone Couple only
With children or
grand-children
With other relatives or
non-relativesa Total
World ............................................ 14 25 56 5 100 More developed regions................ 25 43 27 5 100 Less developed regions ................. 7 13 75 5 100 Africa ............................................ 8 9 74 8 100
Eastern ...................................... 9 9 74 8 100 Middleb ..................................... 10 9 66 16 100 Northern.................................... 8 10 76 6 100 Southern.................................... 8 11 72 9 100 Western ..................................... 7 7 77 8 100
Asia ............................................... 7 16 74 4 100 Eastern ...................................... 9 20 70 1 100 South-eastern............................. 6 13 73 9 100 South-central ............................. 4 9 83 100 Western ..................................... 9 25 61 4 100
Europe........................................... 26 43 26 4 100 Eastern ...................................... .. .. .. .. .. Northern.................................... 34 48 15 3 100 Southern.................................... 19 39 38 4 100 Westernc .................................... 32 51 15 2 100
Latin America and Caribbean ....... 9 16 62 14 100 Caribbean .................................. .. .. .. .. .. Central America ........................ 7 12 64 17 100 South America .......................... 9 17 61 13 100
Northern America ......................... 26 47 19 8 100 Oceania ......................................... .. .. .. .. ..
Source: Table II.4, weighted by numbers of persons aged 60 years or over in 1995, from United Nations (2003c). NOTE: See text for explanation of the assumptions employed for countries lacking date about living arrangements. Except as noted separately, data on the living arrangements of older persons were available for countries comprising at least 65 per cent of the older population of the regions shown, and for 83 per cent of the total older population of the world. Estimates are not shown for regions where information on living arrangements was available for under one third of the population. a In general, most persons in this combined group live with other relatives. For countries where it is possible to separate those living with other relatives from those who live with non-relatives only, in Africa, 86 per cent of those in the combined group live with other relatives, as do 74 per cent in Asia and 72 per cent in Latin America and the Caribbean (weighted averages). b Imputed on the basis of data that covered between one third and one half of the region's population. c Imputed on the basis of data that covered between one half and 65 per cent of the region's population.

United Nations Department of Economic and Social Affairs/Population Division Living Arrangements of Older Persons Around the World 37
Figure 1.
Distribution across countries of reported levels of childlessnessamong women aged 60 years or over
Per
cen
tag
e
0
5
10
15
20
25
30
35
Zero childrenever born
Zero livingchildren
Source: For each country, the most recent date in annex table A.4, excluding percentages based on ever-married instead of all-women samples. NOTE: The figure shows the distribution of country values of the proportion of childless women aged 60 years or over. The central 50 per cent of observations fall in the range indicated by the “box”. The horizontal line within the box marks the median. The 10th and 90th percentiles are indicated by the “whiskers” extending from the box. Values lower than the 10th or higher than the 90th percentile are shown as separate dots. The plots pertaining to the children ever born and to living children do not pertain to the same set of dates and countries, as more information was available on the numbers of children born than on the number living.
Figure 2.
Distribution across countries of levels of childlessness at ages 45-49, for more and less developed countries, around 1970 and around 2000
Per
cen
tag
e w
ith
zer
o c
hild
ren
eve
r b
orn
0
5
10
15
20
25
1970 2000
More developedcountries
Less developedcountries
20001970
Source: United Nations (2004b). NOTE: The figure shows the distribution of country values of the proportion of childless women aged 60 years or over. The central 50 per cent of observations fall in the range indicated by the “box”. The horizontal line within box marks the median. The 10th and 90th percentiles are indicated by the “whiskers” extending from the box. Values lower than the 10th or higher than the 90th percentile are shown as separate dots. The set of countries for which information was available for the earlier date are not identical to the set for which information was available at the later date.
BOX II.1. CHILDLESSNESS
Even where customs favour co-residence of older parents and children, such an arrangement is not possible for everyone. All societies include a minority of older people who have borne no children, or whose children have died. Figure 1 and annex table A.4 provide a summary of information on childlessness of the older population, based on data reported to the United Nations Statistics Division. In about half the countries with data available, 15 per cent or more of women aged 60 years or over had no living children. In a few cases, over one fourth of older women were childless. At the other extreme, in some countries under 5 per cent of older women had no children (figure 1 and annex table A.4). Most of those with no living children had never given birth: the median proportion with no children ever born was 12 per cent.a It should be noted that most of the data in figure 1 pertain to dates in the 1980s or earlier. More recent survey and census information on childlessness for women in their late forties shows that percentages childless have generally been decreasing since 1970 (figure 2). This trend appears in both more developed and less developed countries, although the more developed countries tend to have higher rates of childlessness at both dates shown. In some countries, particularly in Africa, declines in infertility probably owe much to improved control of fertility-impairing disease. In the developed countries, the declines in childlessness correspond to increases, in the decades after the Second World War, in the proportions who ever married and who married early. However, in many of those same countries, the proportions of women born after around 1960 who are remaining childless are larger than the proportions for the women of their parents’ generation. Therefore, although the proportions childless among those over age 60 will continue to decline for a while, that trend will eventually reverse (United Nations, 2003a; Frejka and others, 2001).
a Levels of childlessness may be overstated in some cases. Older women sometimes underreport the number of children ever born, for reasons that are not completely understood but that may include a failure to mention infants who died long ago. Underreporting for that reason would presumably not affect the reported number of living children. Sometimes, too, if insufficient care is taken at the time a census or survey is conducted, responses may be counted as representing “no children” when in fact no answer was obtained – if, for instance, the enumerator left the item blank or entered an ambiguous mark. The latter problem is probably less likely to occur in recent censuses and surveys, since once a problem of this sort is recognized, steps are taken to prevent its recurrence.

United Nations Department of Economic and Social Affairs/Population Division 38 Living Arrangements of Older Persons Around the World
Correlation between different forms of living arrangements
Both solitary living, for those who are unmarried, and living separately as a couple, for those who are married, represent an independent style of living—a degree of separation from a broader group of relatives and other individuals. How are these two forms of living arrangement related? If older people tend to live independently, whether married or not, then there should be a strong positive correlation across countries between these two types of arrangement. Among the 75 countries with available data, the proportions in the two arrangements are indeed strongly correlated, with a correlation coefficient of 0.81 (table II.6). This suggests, among other things, that it might be possible to estimate with reasonable accuracy the proportion living as a couple, if one knew only the proportion living alone, which would be useful since, as discussed earlier, the proportion living alone is often the only form of living arrangements for which data exist. However, there are some countries for which such an estimate would be quite far off. For about 60 per cent of the countries in table II.4, the proportion of older persons living as a couple can be estimated within 5 percentage points based only on knowledge of the proportion living alone. Countries where the proportion living alone is very low also have relatively low proportions of couples living independently, and the deviation from the average pattern, represented by the regression line in figure II.12, is usually only a few percentage points. Where the proportion living alone is higher, however, the proportions living as a couple are more variable, and there are some countries that deviate greatly from the average pattern. In Ghana, more than 21 per cent of older persons live alone, but only 5 per cent live in couple-only households, a proportion much lower than the “expected” value of 32 per cent, based on the average pattern across countries. Conversely, some countries have proportions living as a couple that are between 15 and 20 percentage points higher than expected on the basis of the proportion living alone; this is the case in Bulgaria, Greece, Japan, Portugal, Spain and Turkey. The fact that the latter countries all
have above-average proportions of older men and women who are currently married (United Nations, 2002c), may explain why they have relatively high proportions of persons living as a couple compared with those of persons living alone. The proportion living with a child or grand-child shows a strong negative correlation, of approximately -0.9, both with the proportion living alone and with the proportion living in a couple-only household (table II.6). If the only available information about living arrangements was the proportion living alone, the proportion living with children or grandchildren could be estimated somewhat more accurately, on average, than could the proportion living as a couple. However, there are once again some countries that depart markedly from the average pattern (figure II.12), with Ghana—which has a much higher proportion living with direct descendants than would be predicted from the proportion living alone—showing the greatest deviation. In Argentina, the Comoros and Portugal, the proportion living with children or grandchildren is 15-20 percentage points lower than expected based on the proportion living alone. The other correlations shown in table II.6 concern relationships involving the less-common arrangements of living with other relatives and with non-relatives. None of these correlations is large. The proportion living with other relatives has a weak negative association (coefficients of approximately -0.2 to -0.3) with the proportions living alone or as a couple, essentially no association with the proportion living with children or grandchildren, and a modest positive correlation with the proportion living with non-relatives. The proportion living with non-relatives shows no relationship to the proportion living alone or as a couple, and a weak negative association with the proportion living with children or grandchildren.
Differences by gender Older women’s living arrangements often differ from those of older men. In most of the 86 countries for which data on gender are available, older men are more likely than older women to

United Nations Department of Economic and Social Affairs/Population Division Living Arrangements of Older Persons Around the World 39
live in couple-only households or with children, while older women tend to be more likely to live alone, with a relative, or with an unrelated person (annex table A.IV.5). The proportion of men who live in couple-only households is higher than that of women in nearly all countries, with the difference ranging from essentially no difference in Bahrain, Mali and Pakistan, to 31 percentage points in the Czech Republic, with a mean of 6.7 percentage points and a median of 4.2 percentage points. Men are more likely than women to live with a child in almost two thirds of the countries, with the difference in the proportions ranging from 11 percentage points favouring women in South Africa to 16 percentage points favouring
men in Chad, with a mean and a median of 2.0 percentage points favouring men. Women are relatively more likely to live with other relatives in all but 8 of the 74 countries with this information available, with the difference in the proportions ranging from 15.5 percentage points favouring women in Côte d’Ivoire to 2.5 percentage points favouring men in Mozambique, with a mean of 3.3 and a median of 2.5 percentage points favouring women. Sex differences in the proportion living with non-relatives were generally small, with a mean of only 0.3 and a median of only 0.4 percentage points favouring women. The difference in the proportions ranged from 3.1 percentage points favouring women in Myanmar to 1.9 percentage points favouring men in Namibia.
TABLE II.6. PEARSON'S CORRELATION COEFFICIENTS BETWEEN LIVING ARRANGEMENTS OF OLDER PERSONS
Household composition Alone Couple
only Child or
grandchild Other
relative Non-
relative
Alone............................... 1.00 Couple only ..................... 0.81 1.00 With child/grandchild...... -0.90 -0.91 1.00 With other relative........... -0.20 -0.31 -0.03 1.00 With non-relative............. 0.04 0.03 -0.24 0.35 1.00
Source: Table II.4. Note: Number of countries with available data was 75, excluding the European countries for which the classification did not distinguish between those living with other relatives and those living only with non-relatives.
Figure II.12. Association between the proportions of older persons living alone and the proportions living in couple-only households and with children/grandchildren
B. Percentage living alone and with children/grandchildren
Living alone (percentage)
0 10 20 30 40
Wit
h c
hild
/gra
nd
child
(pe
rcen
tage
)
0
20
40
60
80
100
A. Percentage living alone and as independent couple
Living alone (percentage)
0 10 20 30 40
Co
up
le-o
nly
ho
use
ho
lds
(per
cent
age)
0
10
20
30
40
50
60
y = 1.6 + 1.4 x^
y = 87.5 - 2.2 x^
Source: Table II.4.

United Nations Department of Economic and Social Affairs/Population Division 40 Living Arrangements of Older Persons Around the World
TABLE II.7. PERCENTAGE DISTRIBUTION OF POPULATION AGED 60 YEARS OR OVER BY HOUSEHOLD COMPOSITION, BY SEX: AVERAGE FOR MAJOR AREAS AND THE
UNITED STATES OF AMERICA
Major area or country Alone Couple
only Child/
grandchild Other
relative Non-
relative
Male (M) Africa ................................... 6.1 10.6 75.6 6.3 1.4 Asia ...................................... 2.8 14.9 78.1 2.9 1.3 Europe.................................. 14.7 54.6 24.5 3.8 2.5 Latin America and Caribbean............................. 7.8 14.8 65.2 8.3 3.8 United States of America ..... 14.9 60.1 16.8 4.3 3.9 Female (F) Africa ................................... 9.9 6.2 71.1 11.2 1.5 Asia ...................................... 7.9 8.8 76.0 5.5 1.9 Europe.................................. 34.7 29.5 28.7 4.1 3.0 Latin America and the Caribbean............................. 8.7 10.6 65.6 11.2 4.0 United States of America ..... 34.5 39.7 18.5 4.9 2.4 Sex differential (F-M) Africa ................................... 3.8 -4.4 -4.5 4.9 0.1 Asia ...................................... 5.1 -6.1 -2.1 2.5 0.6 Europe.................................. 20.0 -25.1 4.2 0.4 0.5 Latin America and Caribbean............................. 0.8 -4.3 0.3 2.9 0.2 United States of America ..... 19.6 -20.4 1.7 0.6 -1.5
Sources: Table II.4 and annex table A.IV.5. NOTE: Unweighted averages for countries with data; for the household population.
Averages for regions show that older women are more likely than older men to live alone and with other relatives in all regions, whereas older men are more likely to live in couple-only households (table II.7). In Africa and Asia, older men are more likely to live with a child or grandchild, whereas the reverse is true in Europe and the United States of America. In Latin America and the Caribbean, the likelihood of living with a child/grandchild is about the same for both older men and older women. Gender differences in the likelihood of living with unrelated persons are negligible in the four regions but favour older men in the United States of America.
Differences by marital status In the 40 countries for which information on marital status as well as living arrangements is available, married older persons are more likely than the unmarried to live with children or grandchildren. Unmarried older persons are
relatively more likely to live in households either with other relatives or without relatives but with an unrelated person. The difference in the proportions of married and unmarried older persons living with a child/grandchild ranged from a low of -15 percentage points in Latvia to a high of 26 percentage points in Ghana (annex table A.IV.6). The mean difference was 5.5 percentage points, and the median difference 3.7 points. In the case of those living with other relatives, the proportion is higher among the unmarried in all but two countries (Finland and Colombia), with a maximum difference (proportion among the married minus that among the unmarried) of -21 percentage points in Venezuela. The mean difference was -7.8 percentage points, and the median was -6.2 percentage points. For those living with unrelated persons, the mean difference was only -2.6 percentage points, but that is a substantial difference (65 per cent) relative to an average of 4.0 per cent of unmarried older persons in such households.

United Nations Department of Economic and Social Affairs/Population Division Living Arrangements of Older Persons Around the World 41
Considering the regional averages, the proportion of older people living with other relatives or with unrelated persons is higher among the unmarried than among the married in, all four regions shown in table II.8—Africa, Asia Europe and Latin America and the Caribbean—as well as in the United States of America. For those living with a child or grandchild, the proportion is higher among those who are married in Africa, Asia and Latin America and the Caribbean, and among those who are unmarried in Europe and the United States of America.
Gender and marital status have a combined effect on co-residential arrangements. As previously noted, older women are more likely to live alone than older men but the opposite is true for the unmarried only. A similar situation exists for the likelihood of living in a couple-only household: among all older persons, men are much more likely to live in couple-only households than are older women (see annex table A.IV.5), but the opposite is true if only the married older persons are considered (see annex table A.IV.7).
TABLE II.8. PERCENTAGE DISTRIBUTION OF POPULATION AGED 60 YEARS OR OVER BY HOUSEHOLD
COMPOSITION AND MARITAL STATUS, AND MARITAL STATUS DIFFERENTIALS: AVERAGE FOR MAJOR
AREAS AND THE UNITED STATES OF AMERICA
Married (M)
Major area or country Couple
only Child/
grandchild Other
relative Non-
relative
Africa ................................................ 13.2 83.9 2.7 0.2 Asia ................................................... 15.2 82.2 2.2 0.4 Europe............................................... 72.1 23.0 3.2 1.7 Latin America and the Caribbean...... 20.7 70.9 5.6 2.8 United States of America .................. 81.4 16.0 2.1 0.5
Unmarried (U)
Alone Child/
grandchild Other
relative Non-
relative
Africa ................................................ 16.9 71.6 9.6 1.9 Asia ................................................... 10.8 79.2 7.7 2.3 Europe............................................... 59.4 31.7 4.8 4.1 Latin America and the Caribbean...... 17.6 57.3 18.9 6.2 United States of America .................. 64.5 20.2 8.4 6.8
Differential (M - U)
Child/
grandchild Other
relative Non-
relative
Africa ................................................ 12.3 -7.0 -1.7 Asia ................................................... 3.1 -5.5 -2.0 Europe............................................... -8.7 -1.6 -2.4 Latin America and the Caribbean...... 13.6 -13.3 -3.5 United States of America .................. -4.2 -6.3 -6.3
Source: Annex table A.IV.6. NOTE: For the household population. Unweighted averages for countries with data.
An important gender contrast exists among unmarried older persons: older unmarried women are much more likely than are unmarried men to live with a child. This is in contrast to the gender differences that were observed for all older persons taken together (compare annex tables A.IV.5 and A.IV.7). On average, in the 40 countries with data available, the difference in the proportion of unmarried older women and that of
unmarried older men who live with children/grandchildren is 11.3 percentage points (figure II.13). Contrary to what might have been expected, but consistent with the findings regarding living with children, unmarried older women are not more likely than unmarried older men to live with other relatives or with unrelated people. For the 40 countries, the average difference between the proportion of unmarried

United Nations Department of Economic and Social Affairs/Population Division 42 Living Arrangements of Older Persons Around the World
men and that of unmarried women living with either other relatives or non-relatives is less than 2 percentage points (figure II.13).
For married older persons, the gender difference between the living arrangements of older men and those of older women shows a tendency opposite to the gender difference seen among the unmarried. Married men are more likely than married women, by 5.6 percentage points on average, to be living with
a child or grandchild. It might be surprising at first glance to see that there is any gender difference in living arrangements of the currently married, since for each member of an older couple the living arrangement, according to the classification used here, should be the same. However, it is not always the case that both members of a couple are over age 60. In particular, it is not unusual for men currently over age 60 to be married to a woman under age 60; some older women also have a younger spouse, although this occurs less often.
Figure II.13. Average gender difference (percentage of men - percentage of women)
in specific living arrangements, for married and unmarried older persons
5.6
-1.1
-0.2
-11.3
1.3
1.9
-14 -12 -10 -8 -6 -4 -2 0 2 4 6 8
Percentage points
Unmarried
Married
With child/grandchild
With other relative
With non-relative
More common among men More common among women
Source. Annex table A.IV.7.
Skipped-generation households
The data reviewed so far show that in most developing countries, a large majority of older persons are living with their offspring. This larger group includes some households in which grandparents are caring for grandchildren in the absence of the middle generation. In fact, in many developing countries, skipped-generation households are common. In the Latin American and Caribbean countries, on average 6.6 per cent of older persons are living in such households, and in Africa the average is 12.2 per cent. The countries with the highest
prevalence of such households are Malawi, Rwanda, Uganda and Zambia, with 21-25 per cent of all older persons living with grandchildren (see table II.4). In addition, the proportions exceed 15 per cent in Ghana, Ethiopia, Madagascar, South Africa and Zimbabwe; and the two Caribbean countries with data available—the Dominican Republic and Haiti—have values almost as high (about 14 per cent). Although skipped-generation households tend to be less common in Asia, in several cases over 5 per cent of older persons are in such households, and in Malaysia and the Philippines 8-9 per cent. Information about skipped-generation households was available for only two of the more developed countries, but the

United Nations Department of Economic and Social Affairs/Population Division Living Arrangements of Older Persons Around the World 43
percentages were in these cases lower than those observed in most of the developing countries (0.2 per cent in Bulgaria and 1.5 per cent in the United States of America).
In all regions, the proportions living in skipped-generation households are higher among older women than among older men (table II.9). In Malawi, Rwanda and Uganda, 30-34 per cent of older women are in skipped-generation households; for men, the highest proportion is 18
per cent, in Malawi (annex table A.IV.5). For the countries in annex table A.IV.5, the average proportion of older men in skipped-generation households is about 7 per cent, compared with almost 12 for women (table II.9). At the same time, men are, with few exceptions, more likely to live in households with one or more of their children. On average, for the countries in annex table A.IV.5, the proportion of older men living in “child-present” households is 67 per cent, compared with 59 per cent for women, an 8 percentage-point difference (table II.9).
TABLE II.9. PROPORTION OF THE POPULATION AGED 60 YEARS OR OVER LIVING WITH CHILDREN,
AND PROPORTION IN SKIPPED-GENERATION HOUSEHOLDS: AVERAGE FOR MAJOR AREAS (Percentage)
Total with child or grandchild With child Skipped generation
Major area Total
(1) Male
(2) Female
(3) Total (4)
Male (5)
Female (6)
Total (7)
Male (8)
Female (9)
Africa................................ 73.6 75.6 71.1 61.0 66.7 55.0 12.2 8.6 15.7
Asia................................... 75.7 78.1 76.0 71.5 72.4 69.9 3.6 2.9 3.2 Latin America and the Caribbean....................... 65.4 65.2 65.6 58.9 62.5 59.3 6.6 6.3 9.9
Totala ................................ 72.3 73.8 71.2 62.9 67.3 59.4 8.6 6.8 11.7
Sources: Table II.4 and annex table A.IV.5. NOTE: For the household population. Unweighted averages for countries with data. Because some items of information were not available for some of the countries, the means for columns (1)-(3) are based on a larger number of cases than the means for columns (4)-(9).
a Total averages include countries from Africa, Asia and Latin America and the Caribbean.
Co-residence with young and adult children In many cases, notions about nuclear versus extended family households are not addressed well by the “with child” category because it mixes together adult children with younger children who still depend heavily on parental support. Although some studies of living arrangements of older persons in Asia have used a single with-child category, others have made a distinction between those living with children under age 20 or 25, and those living with older, “adult”, children, aged 20 years or over or aged 25 years or over (for example, DaVanzo and Chan, 1994; Martin, 1989). In order to obtain some insight into the dependence relationship between parents and children living together, an alternative classification is presented in table II.10 which breaks down the with-child category into “young” children (under age 25) and “adult” children (aged
25 years or over). The present section examines the frequency of co-residence with older and younger children, and chapter III examines the association between this aspect of living arrangements and households’ levels of material well-being. In interpreting the results, it is worth noting that, by the time they reach age 60, most parents have at least one child aged 25 years or over, so that, if all the children remained with their parents, the proportion living with an older child could be nearly as high as the proportion living with any child. Only those children born when the mother was aged 35 years or over will still be under age 25 when the mother turns 60, and it is uncommon—especially in developing countries—for a woman to bear her first child when she is over age 35. However, the proportion who still have any child younger than age 25 can vary

United Nations Department of Economic and Social Affairs/Population Division 44 Living Arrangements of Older Persons Around the World
considerably. That proportion is in general higher in countries where fertility is high and the transition to lower fertility began later, because widespread use of family planning typically results in a large decline in fertility rates at ages over 35, and a decline in the average age at last birth. In “natural fertility” populations, where couples do not deliberately limit the number of births, women’s average age at last birth has been found to be around 39 or 40 years, but in most countries where fertility has fallen to low levels, women on average bear their last child before age 35. In many developing countries, especially where levels of contraceptive use were low, women’s median age at last birth remained above 35 years in the late 1980s and 1990s (McCauley and others, 1994). The countries with the highest proportions of older persons living with adult children are mainly in Asia, with a prevalence that exceeds 66 per cent in Armenia, Bangladesh, India and Pakistan. Other countries with prevalence over 60 per cent are Nepal and Uzbekistan in Asia and Morocco and Senegal in Africa (table II.4). The countries with the highest proportions of older persons living with young children only are mainly found in Africa. This may be due, at least in part, to the higher fertility rates still prevalent in this region compared with other regions where demographic transition started earlier. The prevalence exceeds 34 per cent in Burkina Faso, Mali, Nigeria and Rwanda. In Asia, the proportions living with young children only do not exceed 24 per cent (in Yemen), while in Latin America and the Caribbean, the proportions are all lower than 20 per cent (table II.4). In the United States of America–the only developed country with this information available—the proportion living with young children only is 1.7 per cent. With the exception of a few cases in Africa—Burkina Faso, Chad, Mali and Rwanda—in all countries with available data, the proportion of older persons living with adult children is higher than the proportion living with young children only (table II.4). This is true for both older men and women, except in Africa, where older men are generally more likely to be living with young
children only than with an adult child (annex table A.IV.5). The regional averages for Africa, Asia and Latin America and the Caribbean show significant gender differences among older persons in co-residence with adult or young children. While the proportions living with adult children are significantly higher among females than males, the opposite is true regarding to co-residence with young children only (table II.10).12 The main factors that account for this gender differential are, first, the age difference between spouses. Since husbands are on average older than their wives, men also tend to be older than women at the time their children are born. Thus the proportion of older fathers who still have a child under age 25 tends to be higher than for mothers. For example, one study found that, in Thailand in 1986, 49 per cent of men aged 60 years or over had a child who was still under age 25, while only 27 per cent of older women had a child that young (Knodel, Chayovan and Siriboon, 1992). An additional factor contributing to the gender difference is the younger age-structure of older men compared with that of older women owing to men’s higher mortality.
Differences by age and gender Age differences in proportions living alone were discussed above in some detail. Those patterns have their counterparts in age patterns for other living arrangements. Figure II.14 shows average patterns for men and women in 50 developing countries and 11 European countries. Proportions of older men living only with spouse tend to increase from age 60 up to ages in the seventies. Men are more likely than women to be in a couple-only arrangement, especially over age 65 or age 70. At the highest ages, the proportions living as a couple often decline, especially for women, who are likely to outlive their spouse. As was noted earlier, couple-only households are the most common type of arrangement in developed countries, and the figure shows that, for European men, this tends to be true even at ages over 80. For women in the European countries, though, solitary living

United Nations Department of Economic and Social Affairs/Population Division Living Arrangements of Older Persons Around the World 45
becomes the most common arrangement by the late seventies.
In the developing countries, co-residence with children is by far the commonest arrangement at all older ages. In the European countries, co-residence is much less prevalent, even among the younger old. For instance, at ages 60-64, when the proportions living with children are highest, under 40 per cent of the European men, on average, and about one third of women were still living with a child. The comparable averages in the developing countries are nearly 75 per cent for men, and nearly two thirds for women. The proportion living with children declines as age increases, but co-residence often becomes more common again at the highest ages. This suggests that some older parents—especially mothers—join children’s households once they reach very high ages, when health and financial problems are likely to be more severe. Both the decline from age 60 to age 75 or 80 and the subsequent increase are more pronounced in the European countries, probably because in developing countries many parents never stop living with children. In such a setting, the possibilities for the very old to re-join a child
are limited because most of those who could live with a child have already been doing so. However, a relatively flat age profile in percentages co-residing does not necessarily imply stability over time for individuals. For instance, a follow-up study in Taiwan Province of China found that, over a 3-year period, nearly 20 per cent of older women moved either into or out of co-residence with a married son. The study also confirmed that the net direction of change was into co-residence among the oldest old, and the reverse among the younger old (Hermalin and Yang, 2004).13
For men in developing countries, the proportion living in a skipped-generation household tends to increase with advancing age. For women the percentages in skipped-generation households are higher than for men, except at ages 80 or above. Skipped-generation households are most common among women in the age range 65-79, but for women the differences by age are small. In the developing countries, particularly for women, there is an increase with age in the proportion living with other relatives. The proportion living with non-relatives also shows a very small increase, although this arrangement remains, in most countries, quite uncommon.
TABLE II.10. PROPORTION OF THE POPULATION AGED 60 YEARS OR OVER LIVING WITH AT LEAST ONE ADULT
CHILD, OR WITH YOUNG CHILDREN ONLY: AVERAGE FOR MAJOR AREAS (Percentage)
Total with child At least one adult childa Young children only
Major area Total (1)
Male (2)
Female (3)
Total (4)
Male (5)
Female (6)
Total (7)
Male (8)
Female (9)
Africa................................ 61.0 66.7 55.0 36.7 29.8 43.9 24.3 36.9 11.1
Asia .................................. 71.5 72.4 69.9 58.2 53.0 63.4 13.1 19.3 6.5 Latin America and the Caribbean ...................... 58.9 62.5 59.3 45.9 42.2 51.9 14.9 20.2 7.4
Totalb ................................ 62.9 67.3 59.4 43.8 37.6 50.0 19.3 29.7 9.4
Sources: Table II.4 and annex table A.IV.5. NOTE: For the household population. Unweighted averages for countries with data. Because some items of information were not available for some of the countries, the means for columns (1)-(3) are based on a larger number of cases than the means for columns (4)-(9). a Aged 25 years or over. b Total averages include countries from Africa, Asia and Latin America and the Caribbean.
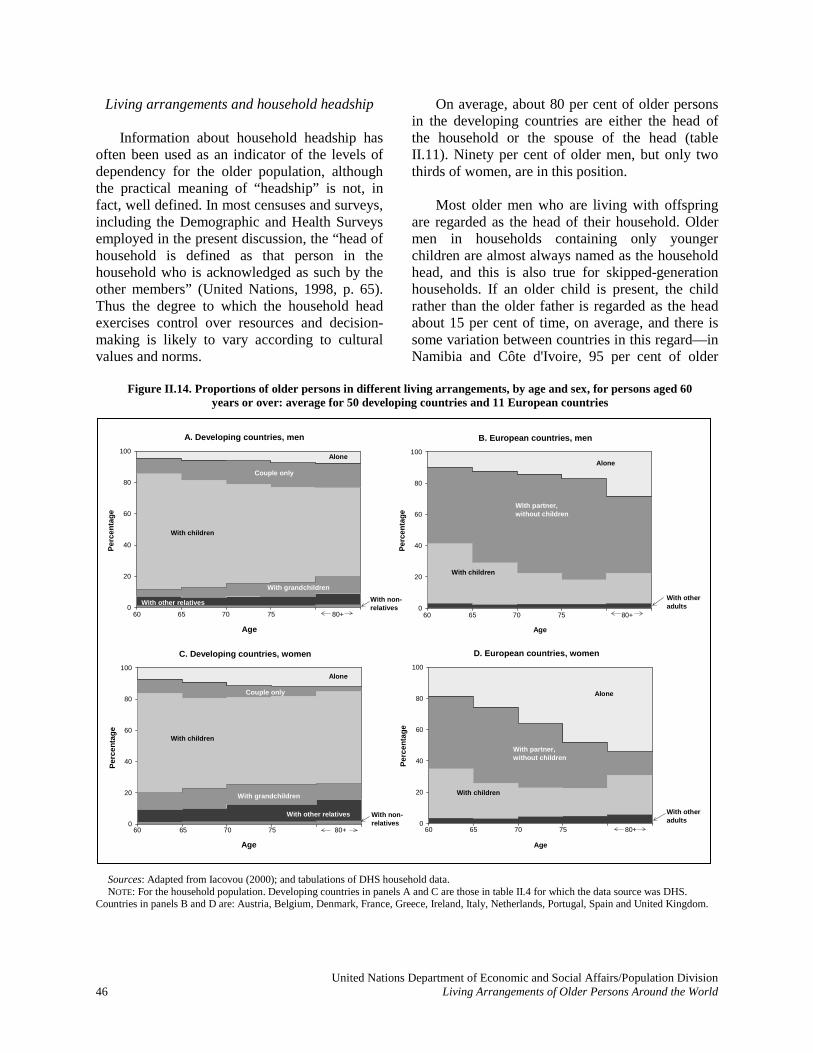
United Nations Department of Economic and Social Affairs/Population Division 46 Living Arrangements of Older Persons Around the World
Living arrangements and household headship Information about household headship has often been used as an indicator of the levels of dependency for the older population, although the practical meaning of “headship” is not, in fact, well defined. In most censuses and surveys, including the Demographic and Health Surveys employed in the present discussion, the “head of household is defined as that person in the household who is acknowledged as such by the other members” (United Nations, 1998, p. 65). Thus the degree to which the household head exercises control over resources and decision-making is likely to vary according to cultural values and norms.
On average, about 80 per cent of older persons in the developing countries are either the head of the household or the spouse of the head (table II.11). Ninety per cent of older men, but only two thirds of women, are in this position. Most older men who are living with offspring are regarded as the head of their household. Older men in households containing only younger children are almost always named as the household head, and this is also true for skipped-generation households. If an older child is present, the child rather than the older father is regarded as the head about 15 per cent of time, on average, and there is some variation between countries in this regard—in Namibia and Côte d'Ivoire, 95 per cent of older
Figure II.14. Proportions of older persons in different living arrangements, by age and sex, for persons aged 60 years or over: average for 50 developing countries and 11 European countries
Sources: Adapted from Iacovou (2000); and tabulations of DHS household data. NOTE: For the household population. Developing countries in panels A and C are those in table II.4 for which the data source was DHS. Countries in panels B and D are: Austria, Belgium, Denmark, France, Greece, Ireland, Italy, Netherlands, Portugal, Spain and United Kingdom.
C. Developing countries, women
Age
Per
cen
tag
e
0
20
40
60
80
100
A. Developing countries, men
Age
Per
cen
tag
e
0
20
40
60
80
100
60 65 70 75
With other relatives
With children
Alone
Couple only
With grandchildren
80+
With non-relatives
With non-relatives
60 65 70 75
With other relatives
With children
Alone
Couple only
With grandchildren
80+
B. European countries, men
Age
Per
cen
tag
e
0
20
40
60
80
100
60 65 70 75
With other adults
With children
With partner, without children
Alone
80+
D. European countries, women
Age
Per
cen
tag
e
0
20
40
60
80
100
60 65 70 75
With children
With partner,without children
Alone
With other adults
80+

United Nations Department of Economic and Social Affairs/Population Division Living Arrangements of Older Persons Around the World 47
fathers in such a situation are the head of the household, but in Bangladesh, the Comoros and Nepal, the proportion is approximately 70 per cent (see annex table A.IV.8). Only when older men are living with relatives other than offspring, or with non-relatives only, are they very likely to be in a subordinate position in the household.
For married couples heading a household, it is generally the man who is regarded as the head.14 The nearly 40 per cent of older women who are household heads are therefore typically women without a spouse. Nearly two thirds of women in skipped-generation households are the head of those households.
TABLE II.11. PROPORTION OF OLDER PERSONS WHO ARE THE HOUSEHOLD HEAD OR SPOUSE OF THE HEAD, BY LIVING ARRANGEMENT AND GENDER: AVERAGE FOR 50 DEVELOPING COUNTRIES
(Percentage)
Alone Couple
only
With children
aged 25+
With children <25 only
With grandchild,
no child
With other
relatives
With non-
relatives Total
Men
Head or spouse of head ....... 100 100 85 99 100 45 55 90 Head ................................ 100 96 83 96 96 43 55 88 Spouse............................. 4 2 3 4 1 1 3
Women Head or spouse of head ....... 100 100 52 93 100 28 39 67
Head ................................ 100 4 27 37 64 20 23 37 Spouse............................. 96 25 56 36 8 16 30
Total Head or spouse of head ....... 100 100 66 98 100 34 44 79
Head ................................ 100 61 51 82 77 28 35 62 Spouse............................. 39 15 16 23 5 8 17
Source: Demographic and Health Surveys. NOTE: Figures for head and spouse categories may not sum to total, owing to rounding. Averages are based on latest available DHS data for 50 countries and pertain to the household population.
Compared with men, women living with older children are much less likely to be the head or spouse of the head—only about half of women compared with 85 per cent of men are the household head or spouse. This difference suggests that when the husband dies, it is often not the older women who comes to be regarded as the head, but rather an adult child or child-in-law with whom the widow is living. Older women who are living with other relatives or non-relatives are even less likely to be regarded as the household head than are older men in those situations. Figure II.15 illustrates changes in headship with advancing age, by gender. Even at ages 80 or over, about 80 per cent of men in developing countries are the head of their household. The male headship rate usually shows a decline at higher ages, and there are of course variations
between countries—for instance, the decline with age tends to be greater in Asia than in other regions (not shown). Since most older men in developing countries are living with a child, the age pattern implies that the co-resident children usually do not take over the role of head so long as the father remains alive. In the developed countries, too, most men are regarded as the head of their household, as is shown for Canada in figure II.15. For women in developing countries, the average proportion heading a household shows a slight rise with age until the late seventies. This age trend is due to the increase—which is small in most developing countries—in the proportion who live alone. The proportion of women heading a household that includes other people shows little change with age up to the late seventies, after which it tends to decline. The age pattern for women suggests, once again, that when the husband dies, headship tends to pass to the younger generation rather than to the

United Nations Department of Economic and Social Affairs/Population Division 48 Living Arrangements of Older Persons Around the World
widow. In most of the more developed countries, like Canada, as shown in figure II.15, household headship rates for women rise much more sharply with increasing age, owing to the
increasing proportions who live alone. As in the developing countries, there is little difference with increasing age in the proportion of women heading households that include other people.
TABLE II.12. PROPORTION OF OLDER PERSONS IN DIFFERENT LIVING ARRANGEMENTS AT TWO TIME POINTS, BY SEX:
AVERAGES FOR MAJOR AREAS AND TOTAL NUMBER OF DEVELOPING COUNTRIES (Percentage)
All countries Africa Asia Latin America and
the Caribbean Living arrangement Earlier Later Earlier Later Earlier Later Earlier Later
Total Alone............................ 7.2 7.8 7.7 8.3 5.7 6.7 7.4 7.9 Couple only.................. 9.4 10.7 8.3 8.2 12.0 15.9 9.5 11.4 With child..................... 64.8 63.0 62.9 62.2 71.8 68.5 62.8 60.4 With grandchilda .......... 8.7 9.5 11.3 12.9 4.0 3.6 7.7 7.6 With other relative........ 7.9 7.1 8.5 7.3 5.6 4.5 8.5 8.8 With nonrelative........... 1.9 1.8 1.3 1.2 0.8 0.8 4.0 4.0 Men Alone............................ 5.3 5.9 5.8 6.3 2.6 3.3 7.0 7.7 Couple only.................. 12.4 13.4 9.9 10.1 18.0 20.4 12.8 14.7 With child..................... 68.8 67.4 69.4 68.8 71.3 69.0 64.2 61.4 With grandchilda .......... 6.5 7.2 8.0 9.0 3.3 3.5 5.8 6.4 With other relative........ 5.3 4.7 5.5 4.7 4.0 3.2 6.3 6.2 With nonrelative........... 1.7 1.5 1.3 1.1 0.7 0.6 3.9 3.7 Women Alone............................ 9.2 9.9 9.9 10.4 9.0 9.6 7.7 8.9 Couple only.................. 8.0 8.6 6.6 6.4 10.3 12.1 9.2 10.7 With child..................... 60.0 58.7 55.8 55.3 69.2 67.7 61.4 58.0 With grandchilda .......... 11.2 12.4 14.8 16.6 4.0 3.8 9.4 10.6 With other relative........ 9.9 8.7 11.8 10.1 6.5 5.8 8.3 8.1 With nonrelative............ 1.8 1.7 1.2 1.2 1.0 0.9 4.2 3.8
Source: Annex table A.IV.9. NOTE: For the household population. Calculations for males and females are based on data from Demographic and Health Surveys only. Excludes data for China (ages 65 or over) and Japan. a Households with the older person’s grandchild(ren) but not child(ren).
Trends in household composition
In order to investigate trends in the household composition of older persons, available data were tabulated for dates earlier than those shown in table II.4, from Demographic and Health Surveys conducted in the 1990s, national censuses carried out during the 1980s and, for a few countries, the World Fertility Survey carried out during the 1970s. Information for at least two points in time was compiled for a total of 33 developing countries: 17 in Africa, 7 in Asia and 9 in Latin America and the Caribbean.
Because the period between successive Demographic and Health Surveys is usually short, the distance between the different points in time for most countries is relatively small, and changes tend to be minor in such short periods of time. Only in the four cases for which the earlier point corresponds to a World Fertility Survey and the later point to a Demographic and Health Survey (Dominican Republic, Indonesia, Peru and Turkey) was the observation period longer than 10 years, ranging from 19 to 23 years. In several cases, the earliest and latest surveys are only four or five years apart (see annex table A.IV.9).

United Nations Department of Economic and Social Affairs/Population Division Living Arrangements of Older Persons Around the World 49
Considering the whole group of countries, there is a trend towards independent forms of living arrangements—alone or with spouse only—at the expense of co-residential forms of arrangements, especially those with children and other relatives (annex table A.IV.9). This same pattern can be observed, with few exceptions, for both men and women and at the regional level (table II.12). There is an important exception to the general trend towards lower levels of co-residence, however, in the case of co-residence with grandchildren in skipped-generation households. The proportion in skipped-generation households increased in most countries, especially in Africa. The growing toll of HIV/AIDS is likely to be responsible for much of that trend, as orphaned children often come to live with grandparents. Most of the countries with high prevalence of HIV in the adult population experienced an increase in the prevalence of skipped-generation households among the older population. Even though most of the surveys are less than 10 years apart, there was an increase in prevalence of skipped-generation households of 2.7 percentage points, on average, in the countries where adult HIV prevalence had been 10 per cent or above in 2001 (table II.13).
D. INSTITUTIONAL LIVING Most people live in private households their whole lives, but in many of the developed countries, living in an institution when old has become an option for those who have difficulty
managing on their own or who need specialized medical services (see, for example, Lima and Goldscheider, 2001). Data on institutional living are still fairly poor and, when they exist at all, may understate the actual prevalence, especially in less developed countries. This report examines data for 82 countries spanning the more and less developed regions (table II.14). The data come mainly from censuses, and pertain to persons who were not members of private or domestic households. This can include persons living in arrangements other than old-age homes or medical institutions; the category generally includes religious institutions, military barracks and dormitories of schools and universities. In some countries, boarding homes or hostels may be included (United Nations, 1989a, 1998).
TABLE II.13. AVERAGE CHANGE IN PROPORTION OF OLDER PERSONS IN SKIPPED-GENERATION HOUSEHOLDS FOR
COUNTRIES GROUPED ACCORDING TO THE PREVALENCE OF HIV AMONG ADULTS, 2001
Prevalence of HIV among adults, 2001
Change in percentage of older persons in skipped-generation
households from earlier to later survey
10 per cent or over........... 2.7 2-9 per cent...................... 1.5 Less than 2 per cent......... -0.2
Sources: Annex table A.IV.5 and United Nations (2004a). NOTE: Countries with HIV prevalence of at least 10 per cent are: Cameroon, Kenya, Malawi, Zambia and Zimbabwe. Those with HIV prevalence of 2-9 per cent are: Benin, Burkina Faso, Côte d'Ivoire, Dominican Republic, Ghana, Haiti, Nigeria, Rwanda and United Republic of Tanzania. The remaining countries in annex table A.IV.5 had adult HIV prevalence of under 2 per cent, or lacked relevant information.

United Nations Department of Economic and Social Affairs/Population Division 50 Living Arrangements of Older Persons Around the World
Figure II.15. Proportion of household heads among older persons, by age and sex: average for 50 developing countries and Canada
Sources: DHS data, special tabulations, based on latest survey dates for 50 developing countries in annex table A.IV.8; for Canada, United Nations Demographic Yearbook database.
NOTE: For the household population.
Developing countries, women
Age
Per
cen
tag
e
0
20
40
60
80
100
0
20
40
60
80
100
Head living alone
Head living with others
Spouse of head
Neither head norspouse of head
Developing countries, men
Age
Per
cen
tag
e
0
20
40
60
80
100
0
20
40
60
80
100
60 65 70 75
Head living alone
Head living with others
Spouse of head
Neither head norspouse of head
80+ 60 65 70 75 80+
Canada 1991, women
Age
Per
cen
tag
e
0
20
40
60
80
100
0
20
40
60
80
100
Head living aloneHead living with others
Not head
Canada 1991, men
Age
Per
cen
tag
e
0
20
40
60
80
100
0
20
40
60
80
100
60 65 70
Head living alone
Head living with others
Not head
75+ 60 65 70 75+

United Nations Department of Economic and Social Affairs/Population Division Living Arrangements of Older Persons Around the World 51
TABLE II.14. PROPORTION OF THE POPULATION AGED 60 YEARS OR OVER LIVING IN AN INSTITUTION, BY SEX: SELECTED YEARS
(Percentage)
Country or area Date Total Male Female
Africa Botswana..................................................... 1981 0.8 1.3 0.3 Cape Verde ................................................. 1990 0.2 0.2 0.1 Lesotho ....................................................... 1995 0.4 .. .. Nigeria ........................................................ 1991 0.4 0.4 0.3 Réunion....................................................... 1982 2.4 1.8 2.8 Seychelles ................................................... 1977 0.6 0.6 0.6 Zimbabwe ................................................... 1992 1.5 1.5 1.3
Asia Bangladesh.................................................. 1981 1.8 2.4 1.1 China........................................................... 1990 0.8 1.4 0.3 China, Hong Kong SARa ............................ 1996 4.1 2.9 5.3 China, Macao SARa .................................... 1991 3.6 3.3 3.8 Cyprus......................................................... 1992 2.4 1.7 3.0 Iran (Islamic Republic of) ........................... 1996 0.2 0.2 0.1 Israel ........................................................... 1995 3.6 2.6 4.4 Japan ........................................................... 2000 3.8 2.7 4.6 Malaysia...................................................... 1991 1.1 1.5 0.8 Mongolia..................................................... 2000 0.2 0.4 0.1 Myanmar..................................................... 1983 2.0 3.4 0.7 Occupied Palestinian Territory ................... 1997 0.2 0.2 0.3 Philippines .................................................. 1995 0.2 0.1 0.2 Republic of Korea ....................................... 1986 3.5 3.3 3.7 Singapore .................................................... 1980 2.0 2.0 2.0 Tajikistan .................................................... 1989 1.5 .. .. Viet Nam..................................................... 1989 0.3 0.4 0.2
Europe Austria......................................................... 1986 3.4 2.1 4.2 Belarus ........................................................ 1999 0.5 0.6 0.4 Belgium....................................................... 1981 4.3 2.5 5.5 Bulgaria....................................................... 1992 0.4 0.3 0.4 Channel Islands........................................... 1996 7.9 5.2 9.9 Czech Republic ........................................... 1991 2.0 1.3 2.4 Denmark ..................................................... 1991 4.2 2.9 5.2 Estonia ........................................................ 1989 1.4 1.2 1.5 Faeroe Islands ............................................. 1977 1.5 1.1 1.9 Federal Republic of Germany (former)....... 1987 3.0 1.4 3.9 Finland ........................................................ 2000 3.7 2.3 4.7 France ......................................................... 1999 4.5 3.2 5.7 German Democratic Republic (former) ...... 1981 3.4 2.2 4.0 Greece ......................................................... 1991 1.6 1.5 1.7 Hungary ...................................................... 1996 1.7 1.3 2.0 Ireland ......................................................... 1981 7.2 5.9 8.3 Isle of Man.................................................. 1996 6.7 4.2 8.6 Italy ............................................................. 1981 2.4 1.5 3.0 Latvia .......................................................... 1989 1.5 1.4 1.6 Lithuania ..................................................... 1989 0.2 0.2 0.3 Luxembourg................................................ 1981 5.4 3.1 7.0 Norway ....................................................... 1980 4.0 2.9 4.9 Poland ......................................................... 1988 1.0 0.7 1.1 Portugal....................................................... 1991 1.9 1.5 2.2 Romania ...................................................... 1992 0.3 0.3 0.3 Russian Federation...................................... 1989 0.5 0.7 0.7 Serbia and Montenegro ............................... 1991 0.4 0.3 0.5

TABLE II.14 (continued)
United Nations Department of Economic and Social Affairs/Population Division 52 Living Arrangements of Older Persons Around the World
Country or area Date Total Male Female
Slovenia ...................................................... 1991 0.4 0.3 0.5 Spain ........................................................... 1981 2.0 1.4 2.3 Sweden........................................................ 1990 1.7 1.2 2.1 Switzerland ................................................. 1990 6.7 4.3 8.4 United Kingdom
Great Britain............................................ 1981 3.2 2.2 3.9 Northern Ireland ...................................... 1981 3.9 2.9 4.5
Latin America and the Caribbean Aruba .......................................................... 1981 2.6 1.9 3.1 Bahamas...................................................... 1990 1.1 1.2 1.1 Barbados ..................................................... 1980 2.8 2.5 2.9 Bolivia......................................................... 1992 1.1 1.3 0.9 Brazil........................................................... 1980 1.3 0.3 1.4 Cayman Islands........................................... 1989 2.0 2.0 2.0 Cuba............................................................ 1981 0.9 1.2 0.6 French Guiana............................................. 1982 4.2 4.1 4.4 Guadeloupe ................................................. 1990 1.5 1.4 1.5 Martinique................................................... 1990 2.4 2.1 2.7 Mexico ........................................................ 2000 0.4 0.3 0.5 Netherlands Antilles.................................... 1992 3.8 3.7 4.0 Puerto Rico ................................................. 1990 1.3 1.2 1.4 Trinidad and Tobago................................... 1990 1.4 1.0 1.8 United States Virgin Islands........................ 1990 2.2 2.2 2.2 Uruguay ...................................................... 1985 3.3 3.9 2.9
Northern America Bermuda...................................................... 1991 4.0 3.6 4.3 Canada ........................................................ 1991 6.4 4.5 7.8 Greenland.................................................... 1976 10.0 7.4 12.0 St. Pierre and Miquelon .............................. 1982 7.0 3.6 9.0 United States of America ............................ 1990 4.1 2.7 5.1
Oceania Australia...................................................... 1986 8.2 6.5 9.5 Cook Islands ............................................... 1991 5.7 6.2 5.1 New Zealand ............................................... 1991 7.5 6.1 8.6 Tonga .......................................................... 1984 0.5 0.4 0.7
Sources: United Nations (1989a and 1997a); United Nations Statistics Division; Economic Commission for Europe: Population Activities Unit Project on Population Ageing (http://www.unece.org/ead/pau/age/tabul.htm); United States of America Bureau of the Census 1990 Public-Use Microdata Samples (PUMS) microdata files. a Special Administrative Region.
A wide range of countries, mainly from Eastern Europe, Asia and Latin America, have low levels of institutional living among older persons. Countries with the highest levels are mainly those from Northern
and Western Europe, Northern America and Oceania (figure II.16). Sweden is a noticeable exception, perhaps because of its strong support of home health services (Rostgaard and Fridberg, 1998).
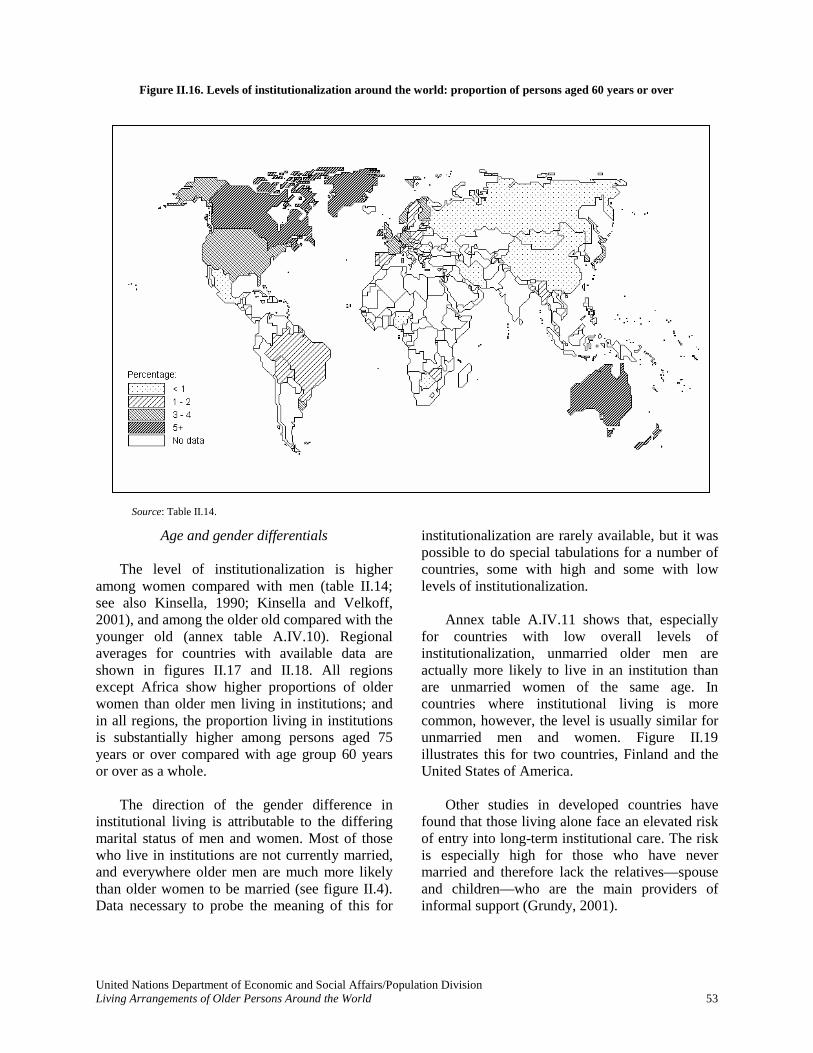
United Nations Department of Economic and Social Affairs/Population Division Living Arrangements of Older Persons Around the World 53
Source: Table II.14.
Age and gender differentials The level of institutionalization is higher among women compared with men (table II.14; see also Kinsella, 1990; Kinsella and Velkoff, 2001), and among the older old compared with the younger old (annex table A.IV.10). Regional averages for countries with available data are shown in figures II.17 and II.18. All regions except Africa show higher proportions of older women than older men living in institutions; and in all regions, the proportion living in institutions is substantially higher among persons aged 75 years or over compared with age group 60 years or over as a whole. The direction of the gender difference in institutional living is attributable to the differing marital status of men and women. Most of those who live in institutions are not currently married, and everywhere older men are much more likely than older women to be married (see figure II.4). Data necessary to probe the meaning of this for
institutionalization are rarely available, but it was possible to do special tabulations for a number of countries, some with high and some with low levels of institutionalization. Annex table A.IV.11 shows that, especially for countries with low overall levels of institutionalization, unmarried older men are actually more likely to live in an institution than are unmarried women of the same age. In countries where institutional living is more common, however, the level is usually similar for unmarried men and women. Figure II.19 illustrates this for two countries, Finland and the United States of America. Other studies in developed countries have found that those living alone face an elevated risk of entry into long-term institutional care. The risk is especially high for those who have never married and therefore lack the relatives—spouse and children—who are the main providers of informal support (Grundy, 2001).
Figure II.16. Levels of institutionalization around the world: proportion of persons aged 60 years or over

United Nations Department of Economic and Social Affairs/Population Division 54 Living Arrangements of Older Persons Around the World
Figure II.17. Proportion of older persons living in institutions,
by sex, unweighted averages for major areas
Source: Table II.14.
Figure II.18. Proportion of older persons living in institutions,
by age, unweighted averages for major areas
Source: Annex table A.IV.10.
Figure II.19. Proportion of older population living in institutions, by age group,
sex and marital status in Finland and the United States of America, 1990
2.1
5 .9
10.8
2 .7
8 .3
14.4
3 .8
5 .8
10.7
5 .1
8 .4
14.8
0
2
4
6
8
10
12
14
16
6 0 + (To t al) 6 0 +(Unmarried )
75+(Unmarried )
6 0 + (To t al) 6 0 +(Unmarried )
75+(Unmarried )
Percentag e
M ale
Female
FinlandUnit ed St at es o f America
Source: Annex table A.IV.10.
1.2 1.9 2.9 2.0
5.4 6.6
2.6 4.5
6.4 4.1
13.7
9.9
0 2 4 6 8
10 12 14 16
Africa Asia Europe Latin America and the Caribbean
Northern America
Oceania
Percentage
60 and over 75 and over
1.0 1.8 1.9 1.9
4.4 4.8
0.9 1.9
3.4 2.1
7.6
6.0
0 1 2 3 4 5 6 7 8 9
Africa Asia Europe Latin America and the Caribbean
Northern America
Oceania
Percentage
Male Female

United Nations Department of Economic and Social Affairs/Population Division Living Arrangements of Older Persons Around the World 55
Trends Policies promoting “ageing in place” appear to have halted and sometimes reversed earlier trends towards higher rates of institutionalization in many of the developed countries. Since 1980, many countries have changed their policies and regulations regarding long-term care, in an effort both to restrain costs and to respond to the preference of most older persons for remaining at home (Hennessy, 1995; Walker and Maltby, 1997). While the proportion of older persons in institutions has been growing in some countries, in many cases, especially where the proportion of the over-65 population institutionalized had been relatively high in 1980, that proportion subsequently changed little or even declined (figure II.20). Data for the over-85 population show declines between the period 1990 to 1991 and between the period 2000 to 2001 in the proportion living in communal arrangements in the United Kingdom, Italy, Netherlands, Sweden and the United States of America; the proportions increased in Austria and Portugal (Tomassini and others, 2004). Increases in the proportions of the older population who are currently married may have contributed to the declines in proportions institutionalized, since, as noted earlier, those who are unmarried are relatively more likely to enter institutions. In addition, there is evidence that age-specific rates of severe disability have been falling in many of these countries; and over the coming decades, trends in disability will be an important determinant of growth in the need for institutional care (Jacobzone, Cambois and Robine, 2000; Kinsella and Velkoff, 2001). However, it is doubtful that the trends in disability has been the main determinant of the recent trends in institutional care. Within the developed countries, differences in rates of institutionalization appear to be due more to policies that control the number of institutional beds than to demographic factors or to other aspects of the system governing eligibility for such care (Doty, 1988; Ribbe and others, 1997). Trends toward lower rates of institutionalization have also meant that
institutional care is reserved, more and more, for those with the greatest need for more intensive care, who tend to be the oldest and the frailest (Doty, 1988; Hennessy, 1995). In the developed countries, the question of how to provide for long-term care of older persons who need assistance, and the escalating costs of providing such care, have become pressing policy concerns that have implications for the young as well as the old. According to Hennessy (1995):
“[W]hile ‘ageing in place’ is broadly accepted as a societal objective, it is not seen as a goal for which it is the responsibility—or even within the capacity—of public authorities alone to bring about. The way that we live our own lives, organize our own lifetime savings and expenditure, and how we live together (or not) as families is inextricably bound up with public policies for the care of frail elderly people.”
Often, promoting informal family care has been an explicit part of policies on long-term care (Hennessy, 1995; Karlsson and others, 2004; Ogawa and Retherford, 1997). While most developed countries provide universal coverage of medical care for older persons, the situation is different with respect to the non-medical care that many older persons need in order to remain at home. In many developed countries, children as well as spouses bear legal responsibilities for a significant part of the costs of caregiving (Jenson and Jacobzone, 2000; Lamura, 2003); and, although informal care by family members remains the main source of support in both developed and developing countries today, projections for the future give grounds for concern about the coming contraction of the “female caregiving potential” as the ratio of potential carers—primarily middle-aged women—to the number of older persons declines, while the trend towards women’s greater labour-force participation is expected to continue (Comas-Herrera and others, 2003). Hennessy (1995) states: “The need of families to be able to combine employment of both partners with other social responsibilities is not confined to elderly care, and is perhaps one of the more pressing priorities for
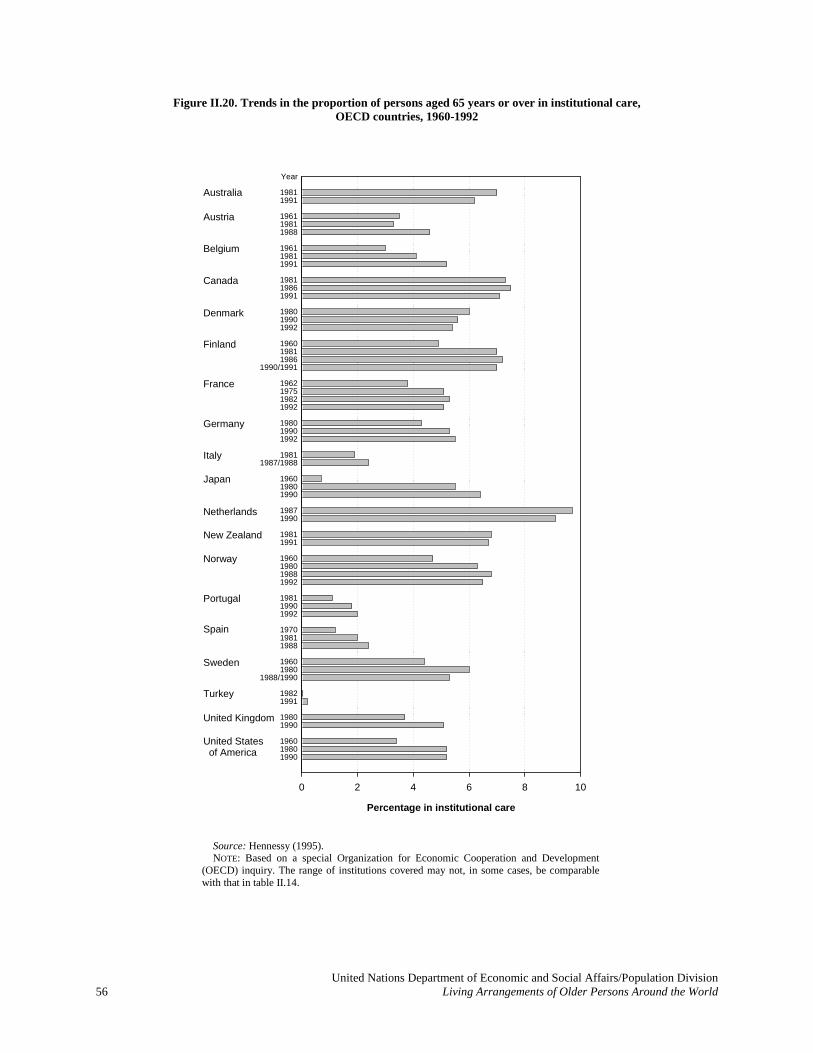
United Nations Department of Economic and Social Affairs/Population Division 56 Living Arrangements of Older Persons Around the World
Figure II.20. Trends in the proportion of persons aged 65 years or over in institutional care, OECD countries, 1960-1992
Percentage in institutional care
0 2 4 6 8 10
Year
19811991
196119811988
196119811991
198119861991
198019901992
196019811986
1990/1991
1962197519821992
198019901992
19811987/1988
196019801990
19871990
19811991
1960198019881992
198119901992
197019811988
19601980
1988/1990
19821991
19801990
196019801990
Australia
Austria
Belgium
Canada
Denmark
Finland
France
Germany
Italy
Japan
Netherlands
New Zealand
Norway
Portugal
Spain
Sweden
Turkey
United Kingdom
United States of America
Source: Hennessy (1995). NOTE: Based on a special Organization for Economic Cooperation and Development (OECD) inquiry. The range of institutions covered may not, in some cases, be comparable with that in table II.14.

United Nations Department of Economic and Social Affairs/Population Division Living Arrangements of Older Persons Around the World 57
social policy as a whole in future decades”. As policies regarding long-term care continue to evolve, ongoing research is attempting to answer questions about the impacts of these policy changes—on costs, on informal and formal caregivers, and on those needing and receiving care—and on how these vary among countries (see, for instance, Karlsson and others, 2004; Lamura, 2003; Comas-Herrera and others, 2003; Jenson and Jacobzone, 2000; Jacobzone, 1999). The Madrid Plan of Action on Ageing, 2002 (United Nations, 2002e, chap. I, resolution 1, annex II), endorsed the “promotion of ‘ageing in place’ in the community, with due regard to individual preferences and affordable housing options for older persons” (para. 98). However, the Plan of Action also noted that such policies have sometimes been adopted based on financial considerations and on the assumption that families will supply the bulk of care. As stated in paragraph 104 of the Plan of Action: “Without adequate assistance, family caregivers can be overburdened. In addition, formal community care systems, even where they exist, often lack sufficient capacity because they are poorly resourced and coordinated. As a result, residential care may be the preferred option of either the frail older person or the caregiver. In view of this range of issues, a continuum of affordable care options, from family to institutional, is desirable. Ultimately, the participation of older persons in assessing their own needs and monitoring service delivery is crucial to the choice of the most effective option.”
E. SUMMARY AND CONCLUSIONS
This chapter shows that living arrangements of older persons vary greatly both among countries and regions, and within countries, according to demographic characteristics such as age, gender and marital status.
Living with a child or grandchild is the most common type of living arrangement among older persons in Latin America and the Caribbean, Asia and Africa, while in Europe, and the United States, the most common category is the couple-only household, followed by individuals living
alone. In Africa and Asia, on average about three quarters of those aged 60 years or over are living with a child or grandchild. In Latin America and the Caribbean, the proportion averages about two thirds. In Europe, by contrast, the average is about one fourth. While there is considerable variation in this proportion within regions, for countries with data available, there is no overlap between the range of proportions living with offspring in Europe and the range of proportions living with offspring in the developing regions. The larger group of older persons living with their offspring includes some households in which grandparents are caring for grandchildren in the absence of the middle generation. In fact, in many developing countries “skipped-generation” households are common. In the Latin American and Caribbean countries, on average 6.6 per cent of older persons are living in such households, and in Africa the average is 12.2 per cent. In addition, many households with co-resident children include only children under age 25, many of whom probably still depend at least partially on the parents’ support. Co-residence with a child aged 25 years or over tends to be most common in the developing countries of Asia: on average, nearly 60 per cent of older persons in this region are living with an older child. In Latin America and the Caribbean the average is 46 per cent, and in Africa, 37 per cent (table II.10). Solitary living received special attention in the present chapter because of the greater risk posed by this arrangement of social isolation and of needs going unmet at the onset of serious disease and disability. In addition, data are more widely available for the proportion living alone than for other particular living arrangements. Across countries, there is a strong correlation between proportions living alone and proportions in other forms of living arrangements of older persons. The proportion living alone tends to be higher in Latin America and the Caribbean than in the other developing regions, and higher in Africa than in Asia (table II.2). However, a considerable variation exists within all regions, and some countries in the developing regions have values comparable with those of the European countries.

United Nations Department of Economic and Social Affairs/Population Division 58 Living Arrangements of Older Persons Around the World
Trends Especially in the developing regions, data on trends are mostly limited to the recent past, for dates since 1980. Even though the period of observation is in many cases quite short, the available information points to systematic changes over time in many countries. The proportion of older persons living alone increased in the majority of the countries over time in all regions of the world, suggesting the existence of a global trend of this kind of living arrangement among the older population. In some of the more developed countries, trend data regarding solitary living are available for a longer period, starting around 1960. In all these cases, the proportion living alone rose rapidly between 1960 and the late 1970s. Although that trend continued through the 1990s in some cases, in others—the trend slowed or halted around 1980. The reasons for these differing trends require further investigation, but are likely to have involved a combination of increases in proportions of older person who were married—owing to the combined effects of improvements in mortality and increases in the proportions who ever married—and trends in the age at which children left home. In fact, since approximately 1980, in many developed countries there has been a substantial increase in the proportions of children in their twenties, or older, who are still living with their parents. Despite these exceptions, the general trend for both men and women in the older population has been towards independent forms of living arrangements—alone or with spouse only—at the expense of co-residential forms of arrangements, especially those with children and other relatives. An important exception to the general trend away from co-residence concerns co-residence with grandchildren in the absence of children (skipped-generation households). That proportion increased in most countries, especially in Africa. The growing toll of HIV/AIDS is likely to be responsible for much of this latter trend, as orphaned children often come to live with grandparents. Countries with high HIV prevalence
experienced the greatest increase in prevalence of skipped-generation households. Gender differences and the importance of marital status Older women’s living arrangements often differ from those of older men. In most countries, older men are more likely than older women to live in couple-only households, while older women are more likely than older men to live alone, with grandchildren in a skipped-generation household, with a relative other than children, or with an unrelated person. In the developing countries, older men are more likely than women to live with a child of any age, but women are more likely to live with a child over age 25. In Europe and the United States of America, older women are more likely than men to be living with a child of any age. Older women are often substantially more likely to live alone than are older men, especially where the overall proportion living alone is high. Indeed, the size of the gender difference is strongly related to the overall proportion of older persons living alone. The reason more women live alone is, basically, that women are less likely to be married. Worldwide, nearly 80 per cent of men aged 60 years or over are currently married, while among women the comparable proportion is approximately 45 per cent (figure II.4). The gender gap in proportion married is especially large at the oldest ages. The main reasons for these large differences in marital circumstances at higher ages are lower mortality levels for women, and the fact that nearly everywhere women tend to marry men who are older than themselves. Among unmarried older persons, more men than women live alone in most countries. If it turns out to be the man who survives into old age without being married, he may face a higher risk of living alone. Gender and marital status also have a combined effect on other residential arrangements. Among all older persons, men are
United Nations Department of Economic and Social Affairs/Population Division Living Arrangements of Older Persons Around the World 59
much more likely to live in couple-only households than are women, but the opposite is true if only the married older persons are considered. Among unmarried older persons, older women are much more likely than older men to live with a child. This is in contrast to the gender differences that were observed for all older persons taken together (married and unmarried). Married older persons are usually more likely than the unmarried to live with children. This may mainly reflect the circumstance that those who are married tend to be relatively younger, and the younger old are more likely to have dependent children still living with them. The proportion living with a child or grandchild is higher among married older persons in Africa, Asia and Latin America and the Caribbean, and higher among the unmarried in Europe and the United States of America. Unmarried older persons are relatively more likely to live in households either with other relatives or without relatives but with an unrelated person. Differences by age Age differentials in the proportion living with children result from several mechanisms, including cultural and economic conditions that may constrain or facilitate co-residence of adult children and parents; levels and timing of fertility, which largely determine the degree of overlap of life stages of the parental and the children’s generations; institutional contexts; and cultural norms. Over a wide range of countries, the proportion of older persons who live alone increases, as age advances, until older people reach their late seventies or early eighties. The proportion often decreases thereafter. The amount of difference according to age is much greater in countries where the overall proportion living alone is high than where it is low. Household headship Most older persons in both more developed and less developed countries are the head of their household or the spouse of the head. This is more commonly the case for older men than women,
though. In developing countries, about 90 per cent of older men and two thirds of older women are reported to be the household head or spouse. Older persons living with grandchildren in skipped-generation households, and those who live with children younger than 25 years of age, are almost always the household head or spouse. Compared with men, women living with older children are much less likely to be the head or spouse of the head. Older persons who live with relatives other than offspring, or with non-relatives, are usually not the head of the household. In most countries, the household headship rate for men remains very high even at ages over 80 years, although the rate usually is lower for the oldest old than for the younger old, and the amount of decline with advancing age varies appreciably between countries. Among women in developing countries, the proportion who are the head or spouse of the head declines rapidly with advancing age. The age pattern suggests that when the husband dies, it is typically not the older women who comes to be regarded as the head, but rather an adult child or child-in-law with whom the widow is living. In the developing countries, the proportion of women who are themselves the household head often rises slightly with age, and in developed countries it does so to a much greater extent. In both cases, that increase is due to the rise with age in the proportions of women who live alone. The proportion of women who are head of a household containing other people is substantial in some countries, but this proportion changes little with advancing age. Institutional living Most people live in private households their whole lives, but in many of the developed countries, living in an institution when old has become an option for those who have difficulty managing on their own or who need specialized medical services. Data on institutional living are still fairly poor in terms of coverage and timeliness, and it is also difficult to judge the quality and comparability of the information that is available. Some institutions provide purely custodial care or offer a semi-independent lifestyle with assistance with housekeeping and

United Nations Department of Economic and Social Affairs/Population Division 60 Living Arrangements of Older Persons Around the World
meal preparation, while others offer advanced medical services to a largely bedridden population. Countries with the highest levels of institutional living are mainly those from Northern and Western Europe, Northern America and Oceania. For the entire older population (ages 60 years or over), the highest proportions institutionalized are in the range of 5-10 per cent, but the proportions are substantially higher at ages 75 years or over, when debilitating health problems are much more prevalent. In most countries, the level of institutionalization is higher for women than for men. The chances of living in an institution are also greater for unmarried older persons than for those who have a spouse. Studies in developed countries have shown that the spouse tends to be the main caregiver for older persons who are unable to manage on their own, and those who lack a spouse are evidently at greater risk of entering an institution when they need care. Women’s greater likelihood of being widowed is thus the main reason for their greater likelihood of institutionalization. Especially for countries with low overall levels of institutionalization, unmarried older men are actually more likely to live in an institution than are unmarried women of the same age. In the developed countries, the question how to provide for long-term care of older persons who need assistance, and the escalating costs of providing such care, have become pressing policy concerns that have implications for the young as well as for the old. Since 1980, many of the developed countries have changed their policies and regulations regarding long-term care, in an effort both to restrain costs and to respond to the preference of most older persons to remain at home. These policies promoting “ageing in place” appear to have halted and sometimes reversed earlier trends towards higher rates of institutionalization in many of these countries. Often, promoting informal family care has been an explicit part of policies on long-term care. Although informal care by family members remains the main source of support in both developed and developing countries today,
projections for the future give grounds for concern about the coming contraction of the “female caregiving potential” as the ratio of potential carers—primarily middle-aged women—to the number of older persons declines, while the trend towards women’s greater labour-force participation is expected to continue.
NOTES
1Household composition has traditionally been tabulated for households as the unit of observation, rather than with respect to the age and sex of individuals within the households. However, tabulations of numbers of households by household size and the age and sex of household heads permit the identification of the number of individuals in single-person households, by age and sex. This provides a numerator for the percentages discussed in the present section. Separate tabulations of household populations by age and sex provide the denominators. Such tabulations were included in United Nations Demographic Yearbook for 1987 (United Nations, 1989a) and for 1995 (United Nations, 1997), as well as in some other data sources. 2In several countries, including China and Japan, information about the percentage living alone was not available for males and females separately, for the date shown in table II.1. For the purpose of deriving the regional averages, gender-specific estimates compatible with the figure for both sexes combined were estimated, based on the relationship between gender-specific and total percentages observed for other dates for these countries, or for the age group 65 years or over. 3There are important variations in terms of gender differentials among regions within Africa and Asia. For instance, while there is essentially no gender difference in Southern Africa, in Northern Africa as well as South-eastern and South-central Asia, the proportion living alone among older women is about three times higher than among older men. 4However, persons who have entered institutions are not represented in the data examined in this section, which pertain to the population living in households. 5This finding is consistent with other research based on both historical and present-day populations (Hirosima, 1997; Légaré and others, 1998; Kinsella, 1990; Macunovich and others, 1995; Ruggles, 1994; but see also Liefbroer and de Jong-Gierveld, 1995). 6In fact, age patterns of solitary living tend not to remain constant; since the increase in living alone over time has been proportionately higher among the old old (over age 85) than among the young old (Ruggles, 1994; Tuma and Sandefur, 1988). 7For Nicaragua and Sri Lanka, information about changes in co-residence with children was not available. 8Examination of trends in marital status of the older population for the countries in figure II.9 in most cases shows an increase in the proportions currently married at ages 65+, although in Canada, the Netherlands and the former Federal Republic of Germany the changes were small (2 percentage points or less) over the period shown. In the countries with larger changes, the proportion of the over-65 group who were currently married increased in Ireland from 39 per cent in 1961 to 48 per cent in 2002; in Italy from 50 per cent in 1961 to 56 per cent in 1999; and in the United States of America from 51 per cent in 1960 to 56 per cent in 2000. More than one factor is implicated in these changes. In many of the developed countries (especially Ireland), the proportions who ever married increased substantially following the Second World War, and that trend, as well as the decline in mortality, is tending to increase the proportion

United Nations Department of Economic and Social Affairs/Population Division Living Arrangements of Older Persons Around the World 61
of the older population who are currently married. At the same time, an increase in divorce and separation has been having a countervailing effect. 9In some countries where relatively high proportions of children remain with parents at age 30, this may be an indication less of late home-leaving than of lifelong co-residence. 10For most of the Northern and Western European countries with data available for presentation in table II.4, the "couple" category represents those living with a partner but not with children and included other persons who might be present. 11In order to take account of the information about the percentages living alone, a regression procedure was employed to estimate percentages in other living arrangements, based on the observed proportion living alone and on selected social and demographic variables that are associated with living arrangements cross-nationally. The procedure was as follows. First, employing the data in table II.4, a series of cross-national OLS multiple regressions was run, in which the dependent variables were, respectively, the percentage of older persons living as a separate couple, the percentage living with a child or grandchild and the percentage living with other relatives or non-relatives. The predictor variables were the same in all three regressions: the percentage of older persons living alone; a set of dummy variables representing region; the percentage urban; expectation of life at birth; GDP per capita; and a “kin availability ratio”. The data sources and definitions of the latter variables were as given in the notes to table III.2. The R2 for the regression analysis was 0.86 in the case of the percentage living as a couple, 0.93 for the percentage living with a child or grandchild and 0.65 for the percentage in other arrangements. Next, for those
countries having information about the percentage living alone (table II.1), but lacking information about other types of living arrangement (46 countries), the coefficients estimated from the regression analyses were used as the basis for imputing percentages living as a separate couple, with a child or grandchild and with other relatives or non-relatives, based on the country’s observed percentage living alone and the country’s social and demographic characteristics. Those imputed values were then employed, along with the observed values for the countries in table II.4, in calculating the regional averages. In fact, the imputation procedure has very little effect on the estimates shown in table II.5. The estimates for regions and the world would have been nearly the same if those additional 46 countries had been treated in the same way as countries with no information about living arrangements, which were, for the purposes of calculating weighted averages, assumed to have the regional average living-arrangements distribution. 12In addition, the likelihood of living with adult/married children is significantly higher among unmarried than among married older persons (Knodel and Ofstedal, 2002). 13Rates of co-residential transition in Taiwan Province of China may be atypical, as this is among the settings where a rapid decline in intergenerational co-residence is underway. For instance, in 1989, among women aged 60 or over who had a son, 62 per cent were co-residing with a married son. By 1999, that proportion had fallen to 53 per cent (Hermalin and Yang, 2004). 14There are exceptions in all countries: in the two Caribbean countries with data—the Dominican Republic and Haiti—and in the Comoros and Kazakhstan, between 8 and 12 per cent of older men were classified as the spouse of the head (see annex table A.IV.8).