Embed Size (px)
Citation preview

ii
STUDYING THE EFFECT OF CHITOSAN AS DRAG REDUING AGENT IN
WATER FLOWING SYSTEM WITH DIFFERENT CONCENTRATION AND
PREPARATION USING DIFFERENT ACID TYPES
NUR KHADIJAH BINTI MOHAMAD NAJIB
A thesis submitted in fulfillment
of the requirements for the award of the degree of
Bachelor of Chemical Engineering
Faculty of Chemical & Natural Resources Engineering
Universiti Malaysia Pahang
MAY 2009

iii
I declare that this thesis entitled “Studying the effects of Chitosan as Drag Reducing
Agent in Water Flowing System with Different Concentration and Preparation with
Different Acid Types.” is the result of my own research except as cited in references.
The thesis has not been accepted for any degree and is not concurrently submitted in
candidature of any other degree.
Signature :
Name : Nur Khadijah Binti Mohamad Najib
Date : 2 May 2009

iv
I dedicate this thesis especially to my family, without whom none of this would have
been worth the challenge…
Supportive Parents;
Mohamad Najib Bin Othman & Salmiah Binti Shaari
Not-so-little Siblings;
Nur Mashitah, Nur Shatila, Mohd Ridzuan, Nur Aishah, Mohd Firdaus
My True Friends;
This is for all of you.
.

v
ACKNOWLEDGEMENT
Praise is to God for His help and guidance that we finally able to complete
this design project.
Predominantly I would like to extend my sincerest gratitude to Dr Hayder
A.Abdul Bari, my Undergraduate Research Project supervisor, for his willingness in
overseeing the progress of my research project from its initial phases till the
completion of it. Without his supports, I would not be able complete this research
successfully. Secondly, I would like to extend our words of appreciation to the
encouraging lecturers, and also my research team, for the roles they had played in
giving me guideline and valuable advices during the progress of this research and
this thesis as well.
The experiences and knowledge I have gained throughout the process of
completing this project will be the invaluable experience to better equip me for the
challenges which lie ahead. In particular, my truthful thankful is also extends to all
my colleagues and others who have provided assistance to me without anticipate any
return for it. Their views and tips are useful indeed. Unfortunately, it is not possible
to list all of them in this limited space.
Last but definitely not least to my family members and our closest
acquaintance, Azie, Finnie, Adda, Amy, and not forgotten for my love one, Mohd
Hafiz your worships, and for the audaciousness, as well as supporting me throughout
carrying out my studies in Universiti Malaysia Pahang (UMP).
vi
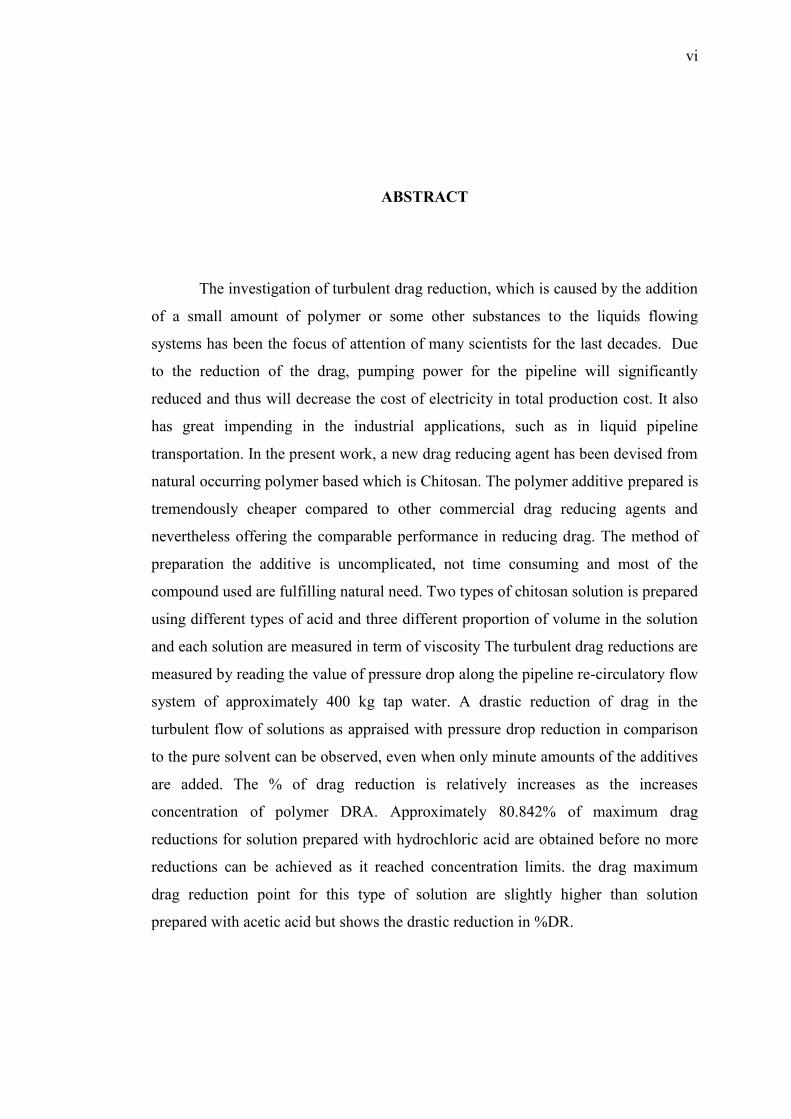
ABSTRACT
The investigation of turbulent drag reduction, which is caused by the addition
of a small amount of polymer or some other substances to the liquids flowing
systems has been the focus of attention of many scientists for the last decades. Due
to the reduction of the drag, pumping power for the pipeline will significantly
reduced and thus will decrease the cost of electricity in total production cost. It also
has great impending in the industrial applications, such as in liquid pipeline
transportation. In the present work, a new drag reducing agent has been devised from
natural occurring polymer based which is Chitosan. The polymer additive prepared is
tremendously cheaper compared to other commercial drag reducing agents and
nevertheless offering the comparable performance in reducing drag. The method of
preparation the additive is uncomplicated, not time consuming and most of the
compound used are fulfilling natural need. Two types of chitosan solution is prepared
using different types of acid and three different proportion of volume in the solution
and each solution are measured in term of viscosity The turbulent drag reductions are
measured by reading the value of pressure drop along the pipeline re-circulatory flow
system of approximately 400 kg tap water. A drastic reduction of drag in the
turbulent flow of solutions as appraised with pressure drop reduction in comparison
to the pure solvent can be observed, even when only minute amounts of the additives
are added. The % of drag reduction is relatively increases as the increases
concentration of polymer DRA. Approximately 80.842% of maximum drag
reductions for solution prepared with hydrochloric acid are obtained before no more
reductions can be achieved as it reached concentration limits. the drag maximum
drag reduction point for this type of solution are slightly higher than solution
prepared with acetic acid but shows the drastic reduction in %DR.

vii
ABSTRAK
Kajian tentang penguragan geseran dalam pengolakan cecair ini,yang mana
dengan penambahan sedikit campuran polimer asli atau sesuatu bahan pejal ke dalam
sistem pengaliran cecair telah menjadi tumpuan bannyak ahli sains dalam dekad ini.
Dengan pengurangan geseran ini, kuasa pam yang diperlukan untuk mengangkut
cecair telah berjaya dikurangkan dan juga turut megurangkan kos janakuasa elektrik
yang diperlukan. Dalam kajian ini, satu polimer ejen baru telah yang berasal dari
bahan semulajadi yang murah dan mudah didapati telah diformulasikan Cara
penyediaan ejen ini adalah sangat mudah dan murah tetapi dalam masa yang sama
berupaya mengurangkan geseran diantara cecair dan dinding paip setanding dengan
ejen komersial yang lain. Dua jenis ejen telah dihasilkan mengunakan dua jenis asid
yang berlainan untuk mengkaji kesan penggunaan asid lain terhadap campuran yang
dihasilkan. Alat untuk menguji pengurangan geseran didalam paip ini direka khas
untuk menunjukkan kadar perubahan tekanan yang terjadi pada suatu titik yang
ditentukan. Bedasarkan hasil yang didapati dari kajian ini, hampir 80.842% kadar
pengurangan geseran berjaya dihasilkan untuk penggunaan ejen yang diperbuat
dengan menggunakan asid hidroklorik berbanding 80.5% kadar maksimum yang
direkodkan untuk ejen yang diperbuat dari asid asetik pada nisbah 6% kadar asid
didalam larutan ejen. Akan tetapi, corak pengurangan yang dihasilkan dengan
penggunaan asid hidroklorik adalah tidak stabil berbanding corak yang ditunjukkan
oleh ejen sebaliknya. % pengurangan oleh ejen dari hidroklorik asid ini menurun
dengan mendadak apabila mencapai kadar maksimum penurunannya dan ia berbeza
berbanding larutan lain yang menunjukkan penurunan yang stabil. Ia mungkin terjadi
hasil daripada pemecahan molekul polimer ejen apabila melalui pam dan injap
didalam sistem aliran cecair itu. Oleh itu, dapat disimpulkan bahawa kaedah
penghasilan menggunakan asid asetik adalah lebih berkesan berbanding kaedah
penghasilan menggunakan asik hidroklorik.

viii
TABLE OF CONTENT
CHAPTER TITLE
PAGE
DECLARATION ii
DEDICATION iii
ACKNOWLEDGEMENTS iv
ABSTRACT v
ABSTRAK vi
TABLE OF CONTENTS vii
LIST OF TABLES x
LIST OF FIGURES xiii
LIST OF ABBRECIATIONS / SYMBOLS xvii
LIST OF APPENDICES xviii
1 INTRODUCTION
1.1 Background of Research 1
1.2 Problem Statement 3
1.3 Objectives of Study 3
1.4 Scopes of Research 4
1.5 Significant of Research 4
2 LITERATURE REVIEW
2.0 Introduction 5

ix
2.1 Types of Fluid Flows
2.1.1 Laminar Flow
2.1.2 Turbulence Flow
5
6
7
2.1 Pressure Drop due to Friction
2.1.1 Principle & Theory
9
9
2.3 Drag Reduction
2.3.1 Mechanism of Drag Reduction
14
15
2.4 Drag Reduction Agents
2.4.1 Polymeric Drag Reduction Agent
2.4.1.1 Advantages of PDRA
2.4.1.2 Disadvantages of PDRA
2.4.2 Surfactant Drag Reduction Agent
2.4.3 Suspended Solid DRA
18
20
22
22
23
25
2.5 Chitosan as Drag Reduction Agent
2.5.1 Other Usage of Chitosan
27
29
3 METHODOLOGY
3.0 Introduction 31
3.1 Material Used 32
3.2 Research Method
3.2.1 Preparation of Chitosan
3.2.2 Experimental Design
33
33
36
3.3 Experimental Calculation
3.3.1 Velocity and Reynolds Number
3.3.2 Drag Reduction
37
37
38
3.4 Experimental Procedure 39

x
3.4 Summary of Experimental Design
3.4.1 Summary of Chitosan Preparation
3.4.2 Summary of Experimental Test
40
40
42
4 RESULT AND DISCUSSION
4.1 Introduction 43
4.2 Interpretation of Drag Reduction 44
4.3 Result Discussion 45
4.3.1 Effects of Pipe Diameter 45
4.3.2 Effects of Velocity 47
4.3.3 Effects of Percentage Acid Added 50
4.3.4 Effects of Different Acid Types 54
4.3.5 Effects of Different Concentrations 58
5 CONCLUSION AND RECOMMENDATION
5.1 Conclusion 61
5.2 Recommendation 63
REFERENCES 64
APPENDIX A Experimental Calculation 67
APPENDIX A Experimental Data Table 71
APPENDIX C Result Analysis Graph 86

xi
LIST OF TABLES
TABLE NO. TITLE PAGE
3.1 Water Properties at T=298 K and 1 atm. 37
B.1 Detail Description of the Pipe: 72
B.2.1 Flow Detail for Pipe Diameter 0.5 inch 72
B.2.2 Flow Detail for Pipe Diameter 1.0 inch 73
B.2.3: Flow Detail for Pipe Diameter 1.5 inch 73
B.3.1.1 Drag Reduction Result for 0.5 inch Pipe Diameter 74
B.3.1.2 Drag Reduction Result for 1.0 inch Pipe Diameter 75
B.3.1.3 Drag Reduction Result for 1.5 inch Pipe Diameter 75
B.3.2.1 Drag Reduction Result for 0.5 inch Pipe Diameter 76
B.3.2.2 Drag Reduction Result for 1.0 inch Pipe Diameter 77
B.3.2.3 Drag Reduction Result for 1.5 inch Pipe Diameter 77
B.3.3.1 Drag Reduction Result for 0.5 inch Pipe Diameter 78
B.3.3.2 Drag Reduction Result for 1.0 inch Pipe Diameter 79
B.3.3.3 Drag Reduction Result for 1.5 inch Pipe Diameter 79
B.4.1.1 Drag Reduction Result for 0.5 inch Pipe Diameter 80
B.4.1.2 Drag Reduction Result for 1.0 inch Pipe Diameter 81
B.4.1.3 Drag Reduction Result for 1.5 inch Pipe Diameter 81
B.4.2.1 Drag Reduction Result for 0.5 inch Pipe Diameter 82
B.4.2.2 Drag Reduction Result for 1.0 inch Pipe Diameter 83
B.4.2.3 : Drag Reduction Result for 1.5 inch Pipe Diameter 83

xii
B.4.3.1 Drag Reduction Result for 0.5 inch Pipe Diameter 84
B.4.3.2 Drag Reduction Result for 1.0 inch Pipe Diameter 85
B.4.3.3 Drag Reduction Result for 1.5 inch Pipe Diameter 85

13
LIST OF FIGURES
FIGURE
NO. TITLE PAGE
2.1 Diagram of Laminar and Turbulent Flow in Pipeline 6
2.2 Drag Reduction occurs due to suppression of the energy
wickedness by Turbulent eddy currents near the pipe wall
during turbulent flow.
8
2.3 f vs Re plot depicting drag reduction. The polymer line is
for some particular polymer, molar mass and concentration.
Different concentrations, The line labeled
10
2.4: Prandtl-Karman plot for representing polymer drag reduction. 13
2.5 Characteristic of turbulent and laminar flow in the rough and
smooth pipe with correlates to friction factor of pipe
13
2.6 The diagram of the effect of drag reduction on the Newtonian
Turbulent flow
17
2.7 Effect of Chemical Drag Reducers (CDR) on Pipeline Pump
Pressure of Flow Rate
19
2.8 Typical data for drag reducing polymer solutions fall between
the turbulent friction line for pipe flow, and the laminar line,
21
2.9 Schematics on the Surfactants classifications, and their
Applications
24
2.10 Schematic diagram on the Chitosan structure 27
2.11 Schematic Representation of Chitin and various Chitosans 28
3.1 A Schematic Diagram of Experimental Rig 39

14
4.1 Basic Illustration on the Research Parameter Involves 44
4.2 Effect of Pipe Diameter to Percentage of Drag Reduction 45
4.3(a) Drag Reduction profile relationship for 0.5 inch pipe diameter
for different Chitosan concentration
47
4.3(b) Drag Reduction profile relationship for 1.0 inch pipe diameter
for different Chitosan concentration
47
4.3I Drag Reduction profile relationship for1.5 inch pipe diameter for
different Chitosan concentration
48
4.4 Graph of Solution Viscosities versus Volume Percentage of
Acetic Acid Added
50
4.5(a) Percentage of Drag Reduction obtained with addition of 100
ppm Additives versus Reynolds number.
50
4.5(b) Percentage of Drag Reduction obtained with addition of 300
ppm Additives versus Reynolds number
51
4.5I Percentage of Drag Reduction obtained with addition of 500
ppm Additives versus Reynolds number
51
4.5(d) Percentage of Drag Reduction obtained with addition of 700
ppm Additives versus Reynolds number
52
4.6: Graph of Solution Viscosities versus Volume Percentage of Acid
Added
54
4.7(a) Graph of drag reduction obtain for different percentage of
Hydrochloric acid added in the solution with 100 ppm in 1.5
inch Dp system.
54
4.7(b) Graph of drag reduction obtain for different percentage of
Hydrochloric acid added in the solution with 300 ppm in 1.5
inch Dp system
55
4.7I Graph of drag reduction obtain for different percentage of
Hydrochloric acid added in the solution with 500 ppm in 1.5
inch Dp system.
55
4.8: Graph of drag reduction obtain for different types of acid added
in for 6% volume fraction and concentration of 700 ppm
56
4.9(a) Graph of percentage drag reduction versus Reynolds number for
6% Acetic Acid in 0.5 pipe diameter
58
4.9(b): Graph of percentage drag reduction versus Reynolds number for
6% Acetic Acid in 1.0 pipe diameter
58
15
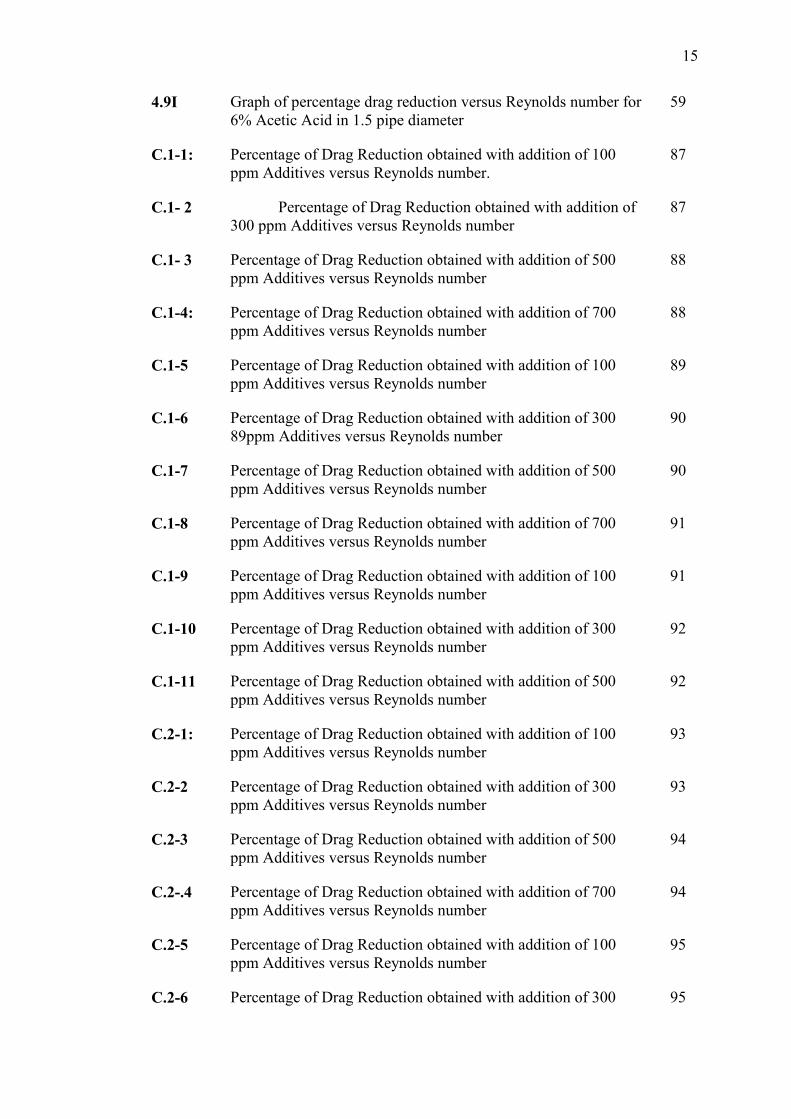
4.9I Graph of percentage drag reduction versus Reynolds number for
6% Acetic Acid in 1.5 pipe diameter
59
C.1-1: Percentage of Drag Reduction obtained with addition of 100
ppm Additives versus Reynolds number.
87
C.1- 2 Percentage of Drag Reduction obtained with addition of
300 ppm Additives versus Reynolds number
87
C.1- 3 Percentage of Drag Reduction obtained with addition of 500
ppm Additives versus Reynolds number
88
C.1-4: Percentage of Drag Reduction obtained with addition of 700
ppm Additives versus Reynolds number
88
C.1-5 Percentage of Drag Reduction obtained with addition of 100
ppm Additives versus Reynolds number
89
C.1-6 Percentage of Drag Reduction obtained with addition of 300
89ppm Additives versus Reynolds number
90
C.1-7 Percentage of Drag Reduction obtained with addition of 500
ppm Additives versus Reynolds number
90
C.1-8 Percentage of Drag Reduction obtained with addition of 700
ppm Additives versus Reynolds number
91
C.1-9 Percentage of Drag Reduction obtained with addition of 100
ppm Additives versus Reynolds number
91
C.1-10 Percentage of Drag Reduction obtained with addition of 300
ppm Additives versus Reynolds number
92
C.1-11 Percentage of Drag Reduction obtained with addition of 500
ppm Additives versus Reynolds number
92
C.2-1: Percentage of Drag Reduction obtained with addition of 100
ppm Additives versus Reynolds number
93
C.2-2 Percentage of Drag Reduction obtained with addition of 300
ppm Additives versus Reynolds number
93
C.2-3 Percentage of Drag Reduction obtained with addition of 500
ppm Additives versus Reynolds number
94
C.2-.4 Percentage of Drag Reduction obtained with addition of 700
ppm Additives versus Reynolds number
94
C.2-5 Percentage of Drag Reduction obtained with addition of 100
ppm Additives versus Reynolds number
95
C.2-6 Percentage of Drag Reduction obtained with addition of 300 95
16
ppm Additives versus Reynolds number
C.2-7 Percentage of Drag Reduction obtained with addition of 500
ppm Additives versus Reynolds number
96
C.2-8 Percentage of Drag Reduction obtained with addition of 700
ppm Additives versus Reynolds number
96
C.2-9 Percentage of Drag Reduction obtained with addition of 100
ppm Additives versus Reynolds number
97
C.2-10 Percentage of Drag Reduction obtained with addition of 300
ppm Additives versus Reynolds number
97
C.2-11 Percentage of Drag Reduction obtained with addition of 700
ppm Additives versus Reynolds number
97
C.2-12 Percentage of Drag Reduction obtained with addition of 700
ppm Additives versus Reynolds number
98

LIST OF SYMBOLS / ABBREVIATIONS
DRA - Drag Reducing Agent
DR - Drag Reduction, dimensionless
D.I - Internal pipe diameter, meter
%DR - Percentage Drag Reduction
m - Mass, kg
ppm - Parts per million
∆Pa - Pressure difference after adding additives, N/m2
∆Pb - Pressure difference before adding additives, N/m2
Re - Reynolds number, dimensionless
Q - Volumetric flow rate, m3/hr
ρ - Density, kg/m3
μ - Viscosity, kg/s.m
Dp Diameter Pipe
PDRA Polymer Drag Reduction Agent
MDR Maximum Drag Reduction
3
LIST OF APPENDICES
APPENDIX TITLE
PAGE
A Experimental Calculation
A-1: Calculation for Required Additives.
A-2: Calculation of Reynolds Number
A-3: Calculation for Drag Reduction
67
68
69
70
B Experimental Data Table
B-1: Detail Description of the Pipe
B-2: Flow Detail for Water Flow Only
B-3: Drag Reduction Obtained Using
Chitosan Prepared using Acetic Acid
B-4: Drag Reduction Obtained using
Chitosan Prepared by Hydrochloric Acid
71
73
73
74
80
C Result Analysis Graph
C-1: Drag Reduction Analysis for
Chitosan Prepared by Acetic Acid
C-2: Drag Reduction Analysis for
Chitosan Prepared by Hydrochloric Acid
86
86
95

1
CHAPTER 1
INTRODUCTION
1.1 Background of the Research
The study of turbulent drag reduction, which is caused by the addition of a
small amount of polymer or some other substances to the liquids flowing systems has
been the focus of attention of many scientists for the last decades. A reduction in
energy loss in turbulent pipe flow in water/solid transportation was reported more
than 65 years ago and since the first reports of drag reduction by Tom (1948), a large
number of researchers have worked in this area in order to find the most effectives
additives in reducing drag. Nadolink and Haigh (1995) have compiled a bibliography
on drag reduction phenomenon by polymers and other additives and there are more
than 4900 references revolves about the drag reducing dating from 1931 to 1994. (K.
Gasljevic et.al 1999)
The addition of small amount of drag-reducing materials such as polymers,
surfactants or fibers, a percentage of drag reduction up to 80% can easily be
achieved. This technique is considered to be the most convenient method of reducing
turbulent frictional drag in pipeline during transportation of fluids (Jiri Myska, 1997).
Due to the reduction of the drag, pumping power for the pipeline can be greatly
reduced and thus will decrease the cost of electricity in production cost. It also has

2
great potentials in the industrial applications, such as in saving pumping power in a
water-circulating device like a district heating/cooling system. Due to its importance,
the phenomenon has been the subject of much revise in the past, in both theoretical
and experimental field.
The basic definition of drag reduction is the reduction of the fluid mechanical
force in order to improve the efficiency of the engineering system. There are two
ways of reducing the drag, which are passive and active techniques. The passive way
is only involved installation and maintenance, while the active way is require certain
energy input. With the active techniques, the level of drag reduction can be achieved
up to 80% and that makes this method is more efficient compared to passive
technique. Mainly, there are three major types of drag reducing agent which is are
surfactant, polymers, and suspended solid.
The types of the additives can be differentiating based on the extensive
dissimilarity between their flow behaviors and their way of reducing the pressure
drop in the flowing system once they were introduced in the liquid. These include the
influence of preshearing, the effect of mechanical shear on degradation, and the
influence of tube diameter, maximum drag-reduction effectiveness, and the shape of
their mean velocity profiles. The differences suggest that the mechanisms for causing
drag reduction may be different for the two types of additives. (Jiri Myska, 1997)
In the present investigation, Chitosan is used as a polymeric additives
solution to reduce the drag of liquid flow in a pipeline and require a lower pressure
gradient to maintain the same flow rate. A higher flow rate would be obtained for the
same pressure gradient if such an additive was used. The various parameters such as
polymer concentration, polymer molecular weight, temperature, Reynolds number,
and solvent quality are known to be the important factors of drag reduction (DR).

3
1.2 Problem Statement
In the chemical process industries, it is usually a requirement to transport
fluid using pump over long distances from storage to another processing unit or to
another plant sites. During the process of pumping the liquids, there may be
substantial frictional pressure drop in the pipeline and also in the individual units
themselves. Thus, it is important to consider the problems of calculating the power
requirement for pumping through the pipe network, selection of optimum pipe
diameter, control of liquid flow rate and the number of pump station should be install
along the network.
The frictional pressure loss in the pipeline is due to the resistance encountered by
flowing fluid coming into contact with solid surface, such as pipe wall. Resulting
from that, fluid molecule will move randomly and will cause lots of energy loss as
eddy current and other indiscriminate motion. By reduction of the drag or the fluid
mechanical forces in the pipeline system, it may deduct a significant part of the plant
cost.
1.3 Objective of Study
The proposed research was studied to achieve the following objectives:
1. To investigate the effect of addition of different concentration of polymer drag
reducing agent to the drag reduction efficiency
2. To explore the other alternative of more economical and low potential of toxicity
polymer that can be used to reduce the drag reduction which is Chitosan.
3. To study on the most efficient Chitosan preparation as drag reduction agent.
4. To determine the most suitable acid types in chitosan preparation and to the
evaluate the optimum proportion of acid percentage in preparation of chitosan
5. To predict the effective viscosity value in producing high drag reduction

4
1.4 Scope of Study
In order to investigate the effect of chitosan solution as drag reducing agent in
water pipeline system, we have manipulated some restriction factor that involve in
limits the effect of drag reducer and also pressure drop effect. The restrictions that
involve in this research are listed like below:
1) Effect of different addition of Chitosan concentration in the solvent solution
which is based on weight basis (100,300,500 and 700 ppm)
2) Effect of different values of water flow rate in the pipeline system
3) Effect of different pipe diameter in water flowing system. (0.5,1.0 and 1.5
inch inside diameter)
4) Usage of different types of acid in Chitosan preparation and this involves sing
Hydrochloric Acid and Acetic Acid
5) Consequence of adding different proportion of acid in Chitosan solution for
both acid types. This proportion varied from value 2%, 4% and 6% based on
volume ratios.
1.2 Rationale and Significance
This research is developed based on the concern of power consumption
despite of mechanical drag in pipeline system and to improve the efficiency of liquid
transportation. The reduction of the frictional pressure during flow can greatly reduce
the cost of pumping power and cost of pumping station units. In addition, by using
Chitosan as natural occurring polymer drag reducer which can degradable and
environmental friendly is a healthy way to preserve the earth.
5
CHAPTER 2
LITERATURE REVIEW
Drag or also known as fractional pressure drop is an effect from the flowing
fluid or solution contacting with a solid surface, such as pipe wall. By adding of
drag-reducing polymer or surfactant additives may cause a spectacular frictional drag
reduction in the flow in the pipeline and thus reduce fluid mechanical force which is
exerted on an engineering system to improve its efficiency. By addition of these
Drag Reducing Agent, pressure losses in the pipeline can be reduce and in the
meanwhile the operating cost of the transportation can be save.
2.1 Types of Flow
Essentially, there are two types of flow exist which is laminar and turbulent
flow. The friction pressures experimental in laminar flow cannot be changed unless
the physical properties of the fluid are changed. In this research, the addition of drag
reducing agent in the flowing fluid is supposedly does not change fluid properties
and for this reason, they are effective only in turbulent flow. These two flow regimes
are defined by Reynold‟s number, the ratio of the fluid body forces viscous forces
(Re = VL/ ).
6
For the value of Reynold‟s number less than 2000 define laminar flow regime for
pipes. With the increases of Re number, pipe flow are transitions from laminar to
turbulent over a range of values from 2,000 to 10,500 and is fully turbulent above
10,500 (Stanford P. Seto, 2005). Reynold‟s number less than 2000 define laminar flow
regime for pipes. With the increases of Re number, pipe flow are transitions from
laminar to turbulent over a range of values from 2,000 to 10,500 and is fully turbulent
above 10,500 (Stanford P. Seto, 2005).
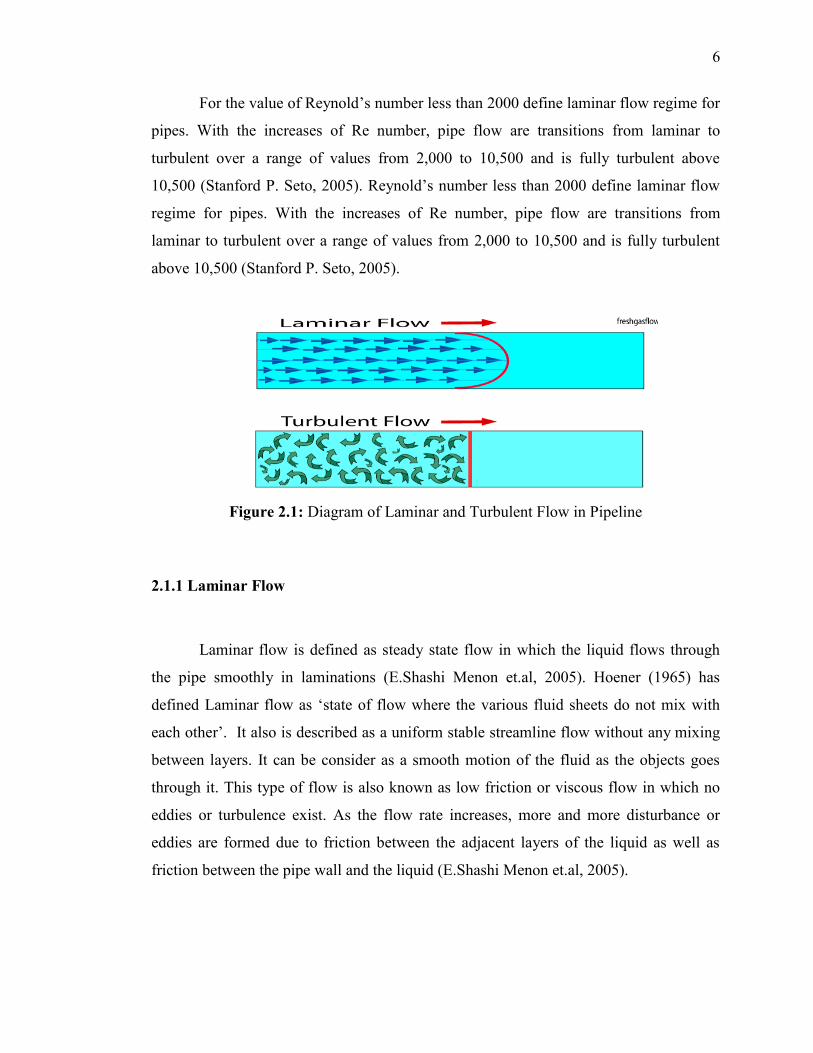
Figure 2.1: Diagram of Laminar and Turbulent Flow in Pipeline
2.1.1 Laminar Flow
Laminar flow is defined as steady state flow in which the liquid flows through
the pipe smoothly in laminations (E.Shashi Menon et.al, 2005). Hoener (1965) has
defined Laminar flow as „state of flow where the various fluid sheets do not mix with
each other‟. It also is described as a uniform stable streamline flow without any mixing
between layers. It can be consider as a smooth motion of the fluid as the objects goes
through it. This type of flow is also known as low friction or viscous flow in which no
eddies or turbulence exist. As the flow rate increases, more and more disturbance or
eddies are formed due to friction between the adjacent layers of the liquid as well as
friction between the pipe wall and the liquid (E.Shashi Menon et.al, 2005).
7
Laminar flow becomes turbulent flow (at a velocity which is dependent on the
geometry of the medium surrounding it) when the fluid begins to have a highly irregular
and random motion.
2.1.2 Turbulent Flow
Turbulent flow defined by Hoerner, (1965) as a state of "...a more or less
irregular "eddying" motion, a state of commotion and agitation, consisting of velocity
fluctuations superimposed to the main flow, within boundary layers..., and within the
wake behind solid bodies."Turbulence is a result of certain factors including surface
roughness, high velocities, and sound/mechanical waves.
Surface roughness and imperfections of a body in motion can cause the boundary layer
(the layers of fluid directly in contact with the object) of the fluid in which it is moving
to become turbulent more easily than if the surface were more smooth.
In this case, surface roughness will be considered negligible (Hoerner, 1965).
Turbulence as a result of high velocities is disregarded here as well. Friction factor of
the pipe wall represent an important factor to the degree of turbulences and thus the
amount of pressure drop along the pipeline. With the increase of friction in the pipeline,
the pressure in the liquid will decreases from the along the pipeline until the outlet. This
is called pressure loss due to friction in pipe flow.
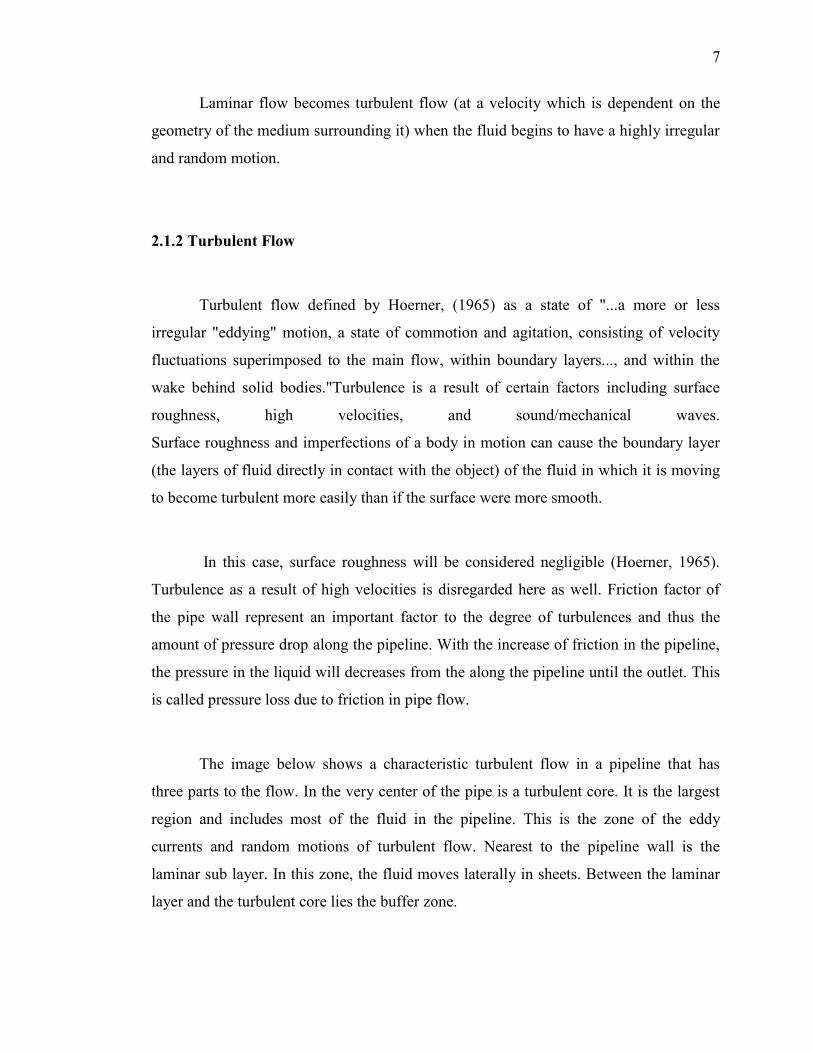
The image below shows a characteristic turbulent flow in a pipeline that has
three parts to the flow. In the very center of the pipe is a turbulent core. It is the largest
region and includes most of the fluid in the pipeline. This is the zone of the eddy
currents and random motions of turbulent flow. Nearest to the pipeline wall is the
laminar sub layer. In this zone, the fluid moves laterally in sheets. Between the laminar
layer and the turbulent core lies the buffer zone.

8
Figure 2.2: Drag Reduction occurs due to suppression of the energy wickedness by
Turbulent eddy currents near the pipe wall during turbulent flow.
Latest researches made into this area tell us that the buffer zone is really
important because this is where the first formation of turbulence. A section of the
laminar sub layer, called a “streak”, will occasionally move to the buffer region. At
there, the streaks begin to vortex and oscillate, moving faster as it gets closer to the
turbulent core. Finally, the streak becomes unstable and breaks up as it throws fluid into
the core of the flow. This ejection of fluid into the turbulence core is called turbulent
burst. The bursting motion and development of the burst in the turbulent core will result
wasted energy

9
2.2 Pressure Drop Due to Friction
As the water flows through the pipeline, there is friction exist between the
adjacent layers of water and contiguous layer of water and between the water molecule
and wall of pipe. The friction causes the lost energy that will convert from the pressure
energy to the heat.
The pressure is continuously decreases as the water flow down the pipe to the
downstream end of the pipeline. The amount of pressure loss due to the friction or also
known as head losses due to the friction are depends on the flow rate, properties of the
water (water specific gravity and viscosity), pipe diameter, pipe length, and internal
friction factor or roughness effect of the wall.
2.2.1 Principles and Theory
Friction drag behavior is typically correlated as friction factor vs. Reynolds number.
Recall that the relationship between pressure drop in a pipe and the fanning friction
factor is:
P 2 fUav
2 L
d (2.1)
Where:
ρ = fluid density,
P = pressure drop across the pipe,
f = fanning friction factor
d = diameter of the pipe.
Uav = mean fluid velocity in the flow direction averaged across the pipe‟s cross
section.
L = length of pipe used.

10
Another useful correlation quantity is the wall shear stress:
w Pd
4L (2.2)
Where
w = wall shear stress.
The Reynolds number is:
Re dUav
s (2.3)
Where:
s = kinematic viscosity of the fluid.
Fanning Friction Factor can be calculated using below equation:
Figure 2.3: f vs Re plot depicting drag reduction. The polymer line is for some
particular polymer, molar mass and concentration. Different concentrations, The line
labeled “PK” is for behavior of a Newtonian fluid.

11
Figure 2.3 shows characteristic behavior in turbulent flow for friction factor vs
Reynolds number correlations. The behavior of a Newtonian fluid, such as water is
shown. Two curves for polymers are given. One is for a polymer of a certain
concentration and molar mass. The other is the maximum achievable drag reduction.
This limit is called the maximum drag reduction asymptote (MDR).
Prandtl-Karman plots are an excellent way to analyze polymer turbulent drag
reduction data. In 1975 Virk collected all data available in literature pertaining to drag
reduction and explained them in terms of simple phenomenological equations. These
relationships were then used to create Prandtl-Karman plots. Prandtl-Karman plots are
generally used to depict drag reduction studies. These plots relate drag reduction
phenomena to flow and other polymer related variables. The axes of the plot are 1/ as the
ordinate and Re as their abscissa.
Newtonian and polymer solutions exhibit distinct flow regimes based on Re. In the
laminar flow regime solutions obey the Poiseuille law given by:
1
fRe f
16 (2.4)
With further increase in flowrate, when fully developed turbulent flow is attained
(Re>3000), different behaviors are obtained if the fluid is Newtonian or polymeric.
When the wall shear stress τw is below a critical value, τw*, there is no drag
reduction and the Prandtl-Karman (PK) coordinates follow the PK law for Newtonian
solvents in turbulent flows which is given by:
1
f 4.0log10 Re f 0.4 (2.5)
It is easy to show that this function form is nearly equivalent to friction factor Reynolds
number equations given in fluid mechanics textbooks for Newtonian fluids.

12
However, once the critical shear stress τw* is exceeded for the polymer solution, it
will not obey equation (2.5). Instead, the friction factor will decrease at any particular
Reynolds number relative to a Newtonian fluid. Virk (1975) shows that this decrease is
well correlated by the equation:
1
f 4.0 log10 Re f 0.4 log10 Re f
*
(2.6)
Equation (2.6) contains two empirical constants that depend on the material properties of
the polymer solution (such as the identity of the polymer, its concentration and its molar
mass).
Note that
Re f *
is simply related to the material property τw* through the following
equations:
Re f *
2u
*d
s Where
u*
w*
(2.7)
Since τw* and are material properties of the polymer solution, they are very
useful for engineering design, they can be measured on a small-scale system and applied
to a large-scale system.
The amount of drag reduction that can be achieved does not increase without bound. At
some concentration and molar mass no further increase is possible. Virk has found that
the maximum is well described by the equation:
1
f 19.0 log10 Re f 32.4 . (2.8)
This equation is called the maximum drag reduction asymptote (MDR).
13
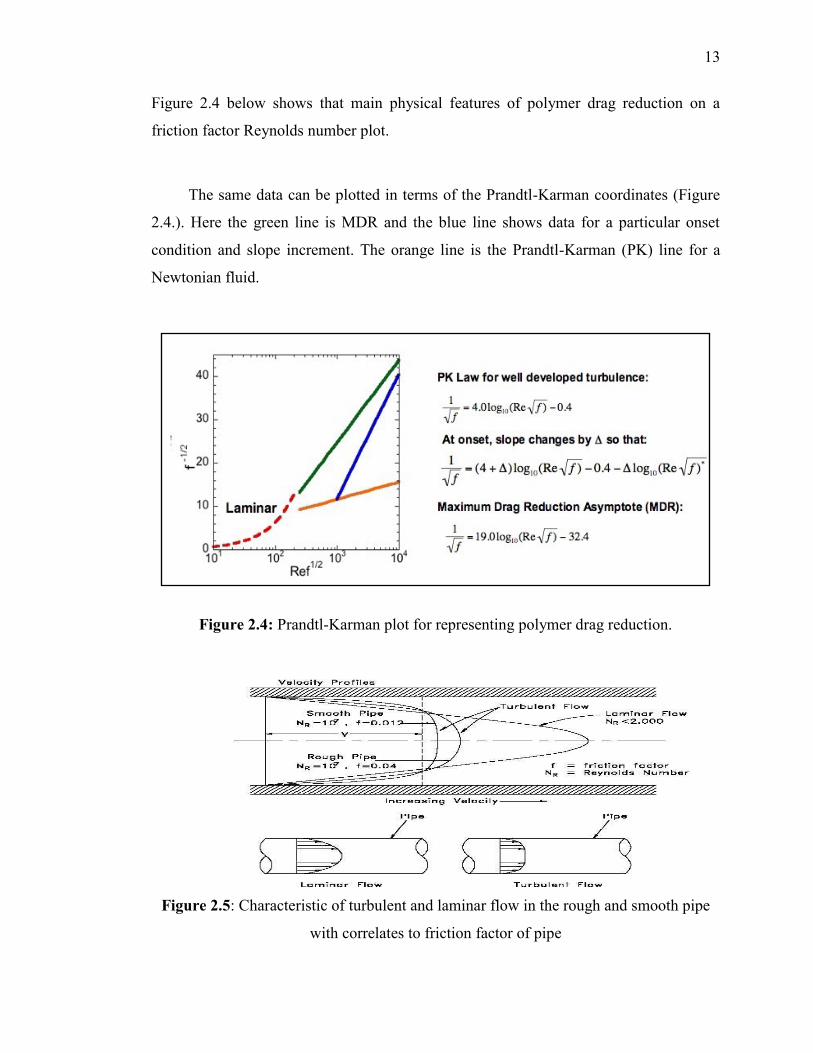
Figure 2.4 below shows that main physical features of polymer drag reduction on a
friction factor Reynolds number plot.
The same data can be plotted in terms of the Prandtl-Karman coordinates (Figure
2.4.). Here the green line is MDR and the blue line shows data for a particular onset
condition and slope increment. The orange line is the Prandtl-Karman (PK) line for a
Newtonian fluid.
Figure 2.4: Prandtl-Karman plot for representing polymer drag reduction.
Figure 2.5: Characteristic of turbulent and laminar flow in the rough and smooth pipe
with correlates to friction factor of pipe

14
2.3 Drag Reduction
Drag reduction is a phenomenon which by small addition of a small amount of
additives (e.g a few part per million, ppm) can greatly reduce the turbulent friction of a
fluid. The main aims for drag reduction are to improve fluid-mechanical efficiency by
using active agent known as drag reducing agents and to increase the flow performance
by using the same amount of energy supplied (D.Mowla, A.Naderi, 2006). Percent of
drag reduction (%DR) or the effectiveness of the DRA can defined as the ratio of
reduction in the frictional pressure difference when the flow rates are held constant to
the frictional pressure difference without DRA, and then multiplied by 100, as shown in
Eq. (2.9) (D.Mowla et al., 2006).
% DR = (∆Pb - ∆Pa) / ∆Pb x 100% (2.9)
Drag reduction are applicable in both oil and water phase system and the
reducers used in oil phase are typically ultra-high molecular weight poly (alpha-olefins),
while water soluble drag reducers are typically polyacryl amide polymers. For two-
phase and multiphase slug or bubble flow applications, the continuous liquid phase is the
phase which can be drag-reduced. Water soluble drag reducers are used in water
flooding operations, high water-cut production lines, spent water disposal, and transport
of oily water. In recent times, the application of drag reduction has been taken a step
further into the offshore environment and multiphase applications. The application of
drag reduction also extent in managing and increase production; significantly lower
discharge pressure, and in some instances, change the flow regime, and improve
operations.

15
2.3.1 Mechanism of Drag Reduction
In spite of the extensive research in the area of drag reduction over the past four
decades, there is no universally accepted model that explains the exact mechanism bring
to the about pressure drop reduction. A complete mechanism would have to address the
role of the additives structure, the composition and additives-solvent interactions in the
drag reduction phenomena. Even though a comprehensive mechanism does not exist,
several postulates that explain on the mechanism of the drag reduction have been
presented (Mc Cormick, 1973)
Two theoretical concepts have been put forward by Hannu Eloranta et.al (2006)
in order to explain the drag reduction mechanism by polymers. The first concept
proposes a mechanism based on the extension of polymers. It postulates that stretching
of randomly coiled polymers, primarily in regions with strong deformations such as the
buffer layer, increases the effective (extensional) viscosity. The second theory claims is
that drag reduction is caused by the elastic rather than the viscous properties of
polymers.
Lumley (1969, 1973) has suggested that stretching of polymer chains in regions
with strong deformations (e.g., the buffer layer) will increases the extensional viscosity
of the base fluid. Resulting from that, small eddies near the wall are damped out with a
subsequent reduction in the viscous drag. De Gennes (1990) postulated that the
characteristic of the drag reduction phenomenon to the shear waves caused by the
elasticity of polymer chains. These waves are argued to suppress turbulent velocity
fluctuations at small-scales thereby reducing the viscous drag.
In the Ptasinki et.al (2001) experimental work, it has been proved that the
turbulent shear stresses are substantially suppressed by polymer chains respective of the
fact the polymer chains themselves contribute to the extra stress tensor in the momentum

16
equation. These studies exposed that disentanglement of polymer chains is indeed an
essential element in the ability of a polymer to reduce viscous drag.
Other interesting work of Vreman, (2007) showed that polymers dissipate these
energies through a relaxation process with the highest dissipation taking place in the
buffer layer. These studies suggest that the drag reduction is maximum when there is
strong shear covering in the buffer layer (i.e., when small-scale eddies dominating
turbulence near the wall are separated from large-scale eddies so that large eddies cannot
penetrate into the near wall region).
Landahl (1977) developed a two-scale mechanistic model of turbulence based on
the classical hydrodynamic stability concept. He did not agree on the postulate that state
the shearing of large scale eddies by the mean flow can cause an inflection in the local
velocity profile, leading to small scale instability, which in turn can further extend into a
bursting occurrence. According to his model, additive drag reduction is mainly due to
inhibition (stabilization) of this instability mechanism by aligned elongated molecules,
which lowers the formation of turbulent. Based on constitutive rheological relations of
fiber suspensions, the model offers explanations for onset and maximum drag reduction
(MDR) conditions.
Recently, the direct stimulation system (DNS) model has been developing to
quantitatively analyze the turbulence transport mechanism. Den Toonder (1995) has
proposed the that the polymers become extended by the flow at a certain Reynolds
number, depending on the time scale of the polymer molecules in relation to the time
scale of the turbulence. Hence, this “onset” phenomenon is determined by elastic
properties of the fluid. When the polymers are extended, viscous anisotropic effects
introduced by the extended polymers in the relation between the stress and the
deformation cause a change in turbulent structure and the anisotropy production leading
to a reduction in drag. At this stage, elasticity plays a counterproductive role in the drag-
reduction process
17
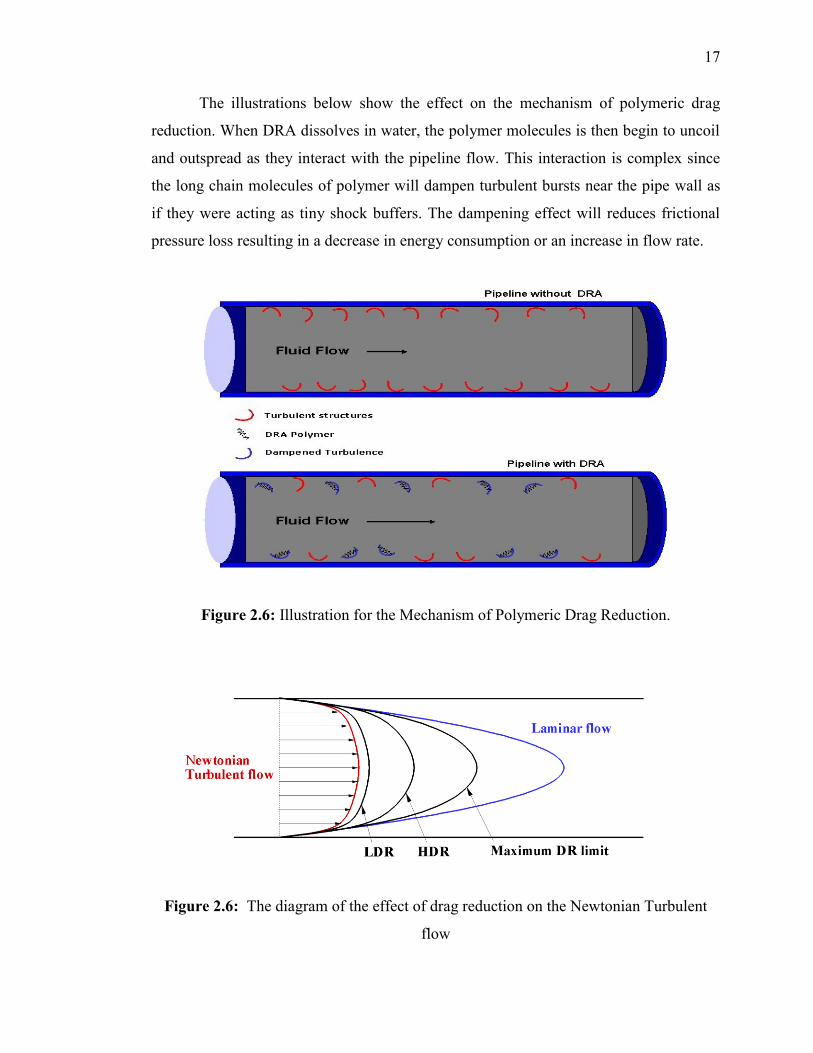
The illustrations below show the effect on the mechanism of polymeric drag
reduction. When DRA dissolves in water, the polymer molecules is then begin to uncoil
and outspread as they interact with the pipeline flow. This interaction is complex since
the long chain molecules of polymer will dampen turbulent bursts near the pipe wall as
if they were acting as tiny shock buffers. The dampening effect will reduces frictional
pressure loss resulting in a decrease in energy consumption or an increase in flow rate.
Figure 2.6: Illustration for the Mechanism of Polymeric Drag Reduction.
Figure 2.6: The diagram of the effect of drag reduction on the Newtonian Turbulent
flow

18
2.4 Drag Reducing Agents (DRAs)
Drag reducing agents are defined as any material that reduces frictional pressure
during fluid flow in a conduit or pipeline. Where fluid is transported over long distance,
these friction losses result in inefficiency that increases equipment and operations cost.
DRA can be divided into three main groups based on their characteristic. The main
divisions of the additives are polymer, surfactants, and fibers drag reducing agents. It
has been observed that with the small addition of the additives, will reduce a great
number of pressure drops in the pipeline and thus will improve fluid flow.
Polymer drag reducer also proved to reduce transverse flow gradient, and then
effectively creating laminar flow in the pipe. This phenomenon is usually occurring
close to the pipe wall where axial flow velocity profile has a very steep gradient in
which significant pressure losses happen (Stanford P. Seto, 2005).Therefore, by
lowering these internal fluid losses will increase the bulk throughout of the pipeline for a
given pumping energy and will significantly reduce the operating cost for the
transportation. The selection of the type of drag reducing agent are depends on the fluid
type and the general use of the fluid.

19
Figure 2.7: Effect of Chemical Drag Reducers (CDR) on Pipeline Pump Pressure of
Flow Rate
Figure 2.6 above shown the effect of addition the drag reducing agent in the
pipeline to the reduce pressure drop. Pressure drop per unit length in the pipeline are
increase with the increase of fluid flow rate due to the friction exist between the wall and
the liquid. As the flow begin to tumble due to shearing, it will create transverse flow in
which faster moving particle are transported into region of lower velocity and vice versa.
This formation of turbulent flow will causes a greater drag in the pipeline and
demands higher pumping energy into the flow to maintain the velocity of the flow. With
the addition of DRA in the turbulent region, the result that will be obtain are a reduced
pumping pressure compare to the system without the addition of the DRA. The system
with DRA will reduces the fluid turbulence, especially right next to the pipe wall,
downstream of valves in the pipeline and at the junction points. By decreasing the fluid
turbulence, pipeline drag is reduced and higher product all through the system can be
achieved at the same lower pumping power.
Pump Pressure
Fluid Flow Rate

20
2.4.1 Polymer Drag Reducing Agent
Polymer drag reduction agents is one of the most potential additives because, as
Tom‟s reported that by addition only a few tens of ppm by weight in a particular solvent
can result drag reduction of up to 80%. Drag reducing polymers have been successfully
applied for potential benefits in various industrial processes and operations, such as
long-distance transportation of liquids, oil-well operations, sewage and flood water
disposal, fire fighting, transport of suspensions and slurries, irrigation, water-heating,
cooling circuits, jet cutting, and marine and biomedical operations.
The most successful application of drag-reduction phenomenon has been in
reducing the drag in crude oil transport through Trans Alaskan Pipelines (TAPS) and
other pipelines in several countries (J. W. Hoyt, 1972). Within 10 years, effectiveness of
the additives has increased up to 12 times from the earlier accomplishment in 1979.
Basically, there are three ways of introducing a polymer solution in the water
flow. Firstly, in homogeneous drag reduction, the polymer is allowed to mix
homogeneously into the solvent before the fluid is pump through the pipeline network.
In the second case of heterogeneous drag reduction, a highly concentrated polymer
solution is injected in the center or at the wall of the pipe, then disperses completely by
turbulent diffusion to result a homogenous solution some distance downstream the
injector. In the third case, a concentrated polymer solution is injected into the center line
of a turbulent flow at a high enough concentration that a single coherent unbroken
polymer thread forms at the injector and continuous downstream for several hundred
pipe diameters. Polymer drag reducing agent are really effective in high molecular
weight polymers (>105) unfortunately, it will get degraded in turbulent flows and lose
their effectiveness after a short interval of time or flow.

21
Figure 2.8: Typical data for drag reducing polymer solutions fall between the turbulent
friction line for pipe flow, and the laminar line,
.

22
2.4.1.1 Advantages of Polymer DRA
The advantage of polysaccharide polymers is their high mechanical stability
against degradation when compared to flexible synthetic polymers with similar
molecular weights. Besides, polymer DRA are also has excellent resistance to heat, light
and chemical exposure (D.Mowla et al, 2006). Graft copolymerization methods have
been introduced (Deshmukh) in order resist the biological degradation. This method will
enhance both drag-reduction effectiveness and shear stability.
Polymer additives also nontoxic material and renewable resource commodity thus the
abundant usage of Chitosan will not bring destructive to microorganism.
2.4.1.2 Disadvantages of Polymer DRA
Beside the advantages given below, there also disadvantages using these types of
DRA. Polymer drag reducers are requires particular injection equipment, as well as
pressurized delivery systems. Due to the high solution viscosity of these DRAs, they are
also limited to about 10% polymer as a maximum concentration in a carrier fluid. Thus,
transportation costs of the DRA are considerable, since up to about 90% of the volume
being transported and handled is inert material.
In additional, some polymeric DRAs are also suffer from the problem that the
high molecular weight polymer molecules can be irreversibly degraded and this will
reduced the size and so the effectiveness of this DRA when it was subjected to
conditions of high shear, such as when they pass through a pump. Moreover, some
polymeric DRAs can cause undesirable changes in emulsion or fluid quality, or cause
foaming problems when used to reduce the drag of multiphase liquids.

23
2.4.2 Surfactant Drag Reducing Agent
Surfactants are usually organic compounds that are amphiphilic, meaning they
contain both hydrophobic groups (their "tails") and hydrophilic groups (their "heads").
Therefore, they are soluble in both organic solvents and water. Surfactant can reduce the
surface tension of a liquid thus will reduce the turbulent friction and improve the fluid
flow. To reduce the surface tension, however, surfactant molecules have to migrate to
the interface, and this takes some finite amount of time. The formulation will eventually
reach equilibrium (static) surface tension after certain time. This takes several seconds or
even several hours depending on the type of surfactant and the concentration of solutions
used. (Lixin Cheng et al., 2007).
The surfactants can be classified into two groups depends on their nature of the
polar group, which are nonionic and anionic, amphoteric or zwitterionic nature.
Nonionic surfactants have no charge, anionic surfactants have a negative molecular
charge, cationic surfactants have a positive molecule charge, and amphoteric or
zwitterrionic surfactants have both positive and negative charges. Anionic and nonionic
surfactants provide most of industrial surfactant requirements and are the most common
(Lixin Cheng et al., 2007).
With the increasing of surfactant concentration, surface tension will decrease
asymptotically and the asymptotic limit is usually referred to as the critical micelle
concentration (cmc) of the surfactants. Critical micelle concentration (cmc) is decribed
by micelle formation, or micellization, which is the property of surface-active solutes
that lends to the formation of colloid-sized clusters, i.e. at a particular concentration,
additives form aggregates in the bulk phase or a surfactant cluster in solution that are
termed micelles.

24
The types of micelles are depends on the type and surfactants concentration,
solution temperature, presence of other ions and water-soluble organic compounds in the
solutions. Unfortunately, most of the surfactants at higher concentrations can cause a
change to the physical properties of the solution and also cause strong surface films
between adjacent molecules. Some of the surfactant solution are not biodegradable and
with abundantly used, it can bring harm to environment.
Figure 2.9: Schematics on the Surfactants classifications, and their Applications