Embed Size (px)
Citation preview

II. INTEROFFICE TRANSPORT
The FCC has defined the interoffice transport UNE to comprise links between ILECs’and requesting carriers’ wire centers or switches, and between ILEC switches.1 The availabilityof competitive interoffice transport is most reasonably evaluated at the level of the individual“wire center serving area.” A “wire center” is an end office where local loops terminate at anILEC switch.2 A “wire center serving area” is the geographic area served by those loops.3 SeeFigure 1.
0%
10%
20%
30%
40%
50%
60%
0-5 5-10 10-15 15-20 20+ 30+ 40+
Access Lines (in Thousands)
Pe
rce
nt o
f all
Wire
Ce
nte
rs
Figure 1. RBOC and GTE Wire Center Distribution by Size
Local competitors began deploying fiber networks in urban markets nearly 15 years ago.Since 1996, both the number of alternative suppliers of interoffice transport, and the areas servedby such suppliers, have grown significantly.
For the reasons set out below, it is reasonable, and conservative, to conclude thatcompetitive interoffice transport is available to and from ILEC wire centers that (a) containcompetitive fiber and (b) have attracted one or more collocated CLECs. We have been able toestablish – conservatively, and with a high degree of confidence, that CLEC collocation in“dense” wire centers is a very reliable indicator of the presence of competitive fiber in those wire
1 See 47 C.F.R. § 51.319(d)(1)(i) (defining dedicated transport as “transmission facilities . . . between wirecenters owned by incumbent LECs or requesting telecommunications carriers, or between switches owned byincumbent LECs or requesting telecommunications carriers.”); id. § 51.319(d)(1)(ii) (defining shared transport as“transmission facilities . . . between end office switches, between end office switches and tandem switches, andbetween tandem switches, in the incumbent LEC network.”).
2 See Newton’s Telecom Dictionary 671 (11th ed. 1996).3 See id. Wire centers vary widely in size, from fewer than 500 lines in rural areas, to over 300,000 in the
most densely populated urban areas.

II-2
centers. A reasonable threshold for “dense” wire centers lies in the range of 20,000+ to 40,000+lines served, but varies from region to region.
A. Economic and Regulatory Background
When the Bell System was broken apart in 1984, the objective was to separate actually orpotentially competitive portions of the national network from those that were still thought to bepart of a natural economic monopoly.4 MCI argued at that time that the dividing line lay at theClass 5 switch.5 In other words, it maintained that the entire interoffice transport market – alltransport currently encompassed by the FCC’s interoffice transport UNE – was capable ofattracting facilities-based competitors – companies like MCI itself. Though its own network wasstill quite limited at the time, MCI enthusiastically endorsed that conclusion. Delineatingbetween local and long-distance at the level of the Class 5 switch, MCI insisted, was a practice“well-established in the telecommunications industry.”6
To accelerate entry into the long-distance market, however, the Department of Justicedecided to draw the initial line one tier higher up in the network – at the level of the Class 4 switch.LATAs were defined accordingly.7 The Department adopted 100,000 telephone stations as the“guideline minimum size” for a LATA.8
The Department and Judge Greene recognized, however, that competition could extend wellbelow that level, and they welcomed the possibility.9 State regulators began to reach similarconclusions soon thereafter.10 New York authorized interoffice competition in 1985,11 and that yearTeleport built facilities in lower Manhattan, where the most concentrated wire centers in thenation reside. By 1990, CLECs had deployed 20 networks in 15 cities.12 In 1991, the FCC
4 The decree accordingly restricted the BOCs “from engaging in any non-monopoly business so as toeliminate the possibility that they might use their control over exchange services to gain an improper advantage overcompetitors in such businesses.” United States v. AT&T, 552 F. Supp. 131, 143 (D.D.C. 1982).
5 See Objections of MCI Communications Corporation to Application for Approval of Exchange Areas,United States v. Western Elec. Co., No. 82-0192 (D.D.C. Nov. 3, 1982).
6 Id. at 9.7 No LATA was to “be smaller than the geographic region . . . served by an existing AT&T Class 4 Office.”
Competitive Impact Statement at 30, United States v. Western Elec. Co., No. 74-1698 (D.D.C. Feb. 10, 1982).8 See Response of the United States to Comments Received on the BOC LATA Proposals at 16-17, United
States v. Western Elec. Co., No. 82-0192 (D.D.C. Nov. 23, 1982).9 See, e.g., United States v. AT&T, 552 F. Supp. at 175 & n. 185 (“eventually . . . bypass technology may
permit interconnection to all subscribers. . . . If and when bypass technology becomes technically and economicallyfeasible for widespread use, it should have the effect of reducing telephone costs and charges across the board, to thebenefit of consumers, the economy, and the nation.”); Competitive Impact Statement at 31, United States v. WesternElec. Co., No. 74-1698 (D.D.C. Feb.10, 1982) (“Technological change presently underway, however, may cause thelocal distribution function of the divested BOCs to lose its monopoly character and, perhaps, eventually result in itsderegulation.”).
10 By August 1986, sixteen states had decided to permit intraLATA competition. See Semilof, IntraLATA
Competition: Lata Barrier Falls, Network World, Aug. 25, 1986, at 11.11 See Case 28891, Teleport Communications (NYPSC Jan. 7, 1985).12 See U.S. Department of Commerce, U.S. Industrial Outlook at 33-7 (1990).
II-3
found that “[r]ecent changes” – “most importantly, fiber optic technology” – “have facilitated thedevelopment of competition in the provision of [local access] facilities and services.”13
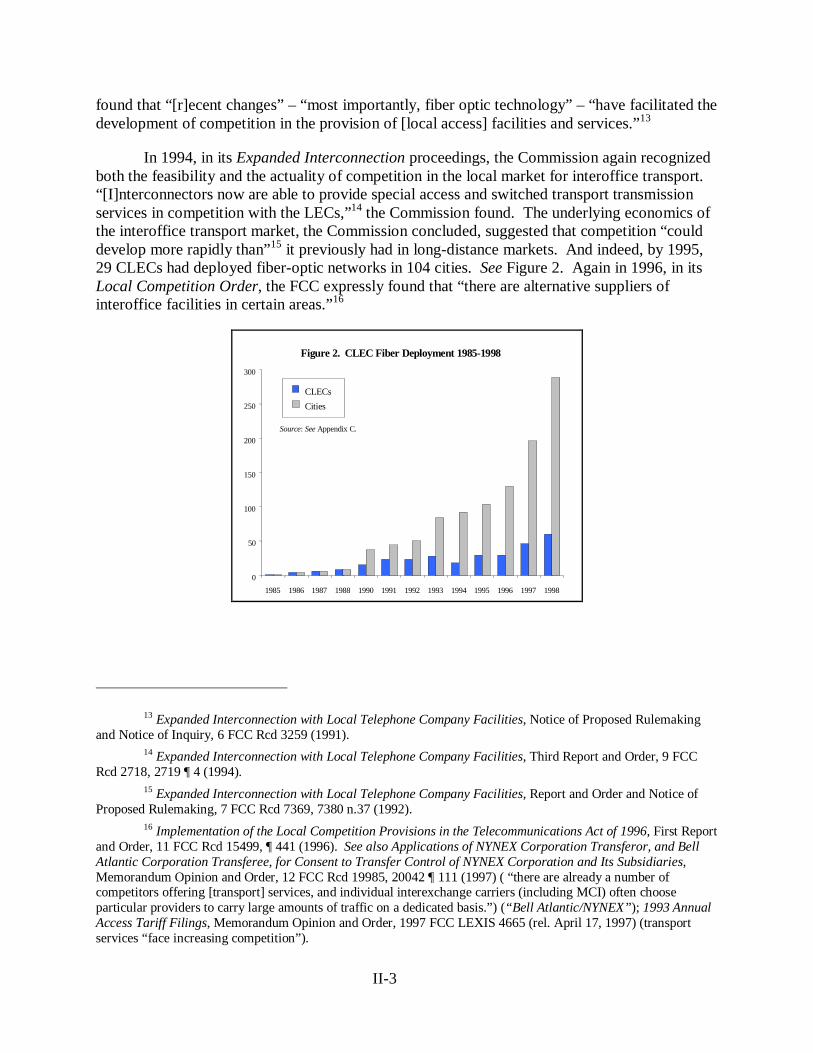
In 1994, in its Expanded Interconnection proceedings, the Commission again recognizedboth the feasibility and the actuality of competition in the local market for interoffice transport.“[I]nterconnectors now are able to provide special access and switched transport transmissionservices in competition with the LECs,”14 the Commission found. The underlying economics ofthe interoffice transport market, the Commission concluded, suggested that competition “coulddevelop more rapidly than”15 it previously had in long-distance markets. And indeed, by 1995,29 CLECs had deployed fiber-optic networks in 104 cities. See Figure 2. Again in 1996, in itsLocal Competition Order, the FCC expressly found that “there are alternative suppliers ofinteroffice facilities in certain areas.”16
Figure 2. CLEC Fiber Deployment 1985-1998
0
50
100
150
200
250
300
1985 1986 1987 1988 1990 1991 1992 1993 1994 1995 1996 1997 1998
CLECs
Cities
Source: See Appendix C.
13 Expanded Interconnection with Local Telephone Company Facilities, Notice of Proposed Rulemakingand Notice of Inquiry, 6 FCC Rcd 3259 (1991).
14 Expanded Interconnection with Local Telephone Company Facilities, Third Report and Order, 9 FCCRcd 2718, 2719 ¶ 4 (1994).
15 Expanded Interconnection with Local Telephone Company Facilities, Report and Order and Notice ofProposed Rulemaking, 7 FCC Rcd 7369, 7380 n.37 (1992).
16 Implementation of the Local Competition Provisions in the Telecommunications Act of 1996, First Reportand Order, 11 FCC Rcd 15499, ¶ 441 (1996). See also Applications of NYNEX Corporation Transferor, and BellAtlantic Corporation Transferee, for Consent to Transfer Control of NYNEX Corporation and Its Subsidiaries,Memorandum Opinion and Order, 12 FCC Rcd 19985, 20042 ¶ 111 (1997) ( “there are already a number ofcompetitors offering [transport] services, and individual interexchange carriers (including MCI) often chooseparticular providers to carry large amounts of traffic on a dedicated basis.”) (“Bell Atlantic/NYNEX”); 1993 AnnualAccess Tariff Filings, Memorandum Opinion and Order, 1997 FCC LEXIS 4665 (rel. April 17, 1997) (transportservices “face increasing competition”).
II-4
Since 1996, the availability of alternative facilities has continued to grow rapidly. Newcompetitors such as Qwest, Level 3, Enron, MFN, and IXC “are in the midst of a fiber-buildingfrenzy.”17 Electric utilities – which “own the third-largest telecom infrastructure in the nation”18
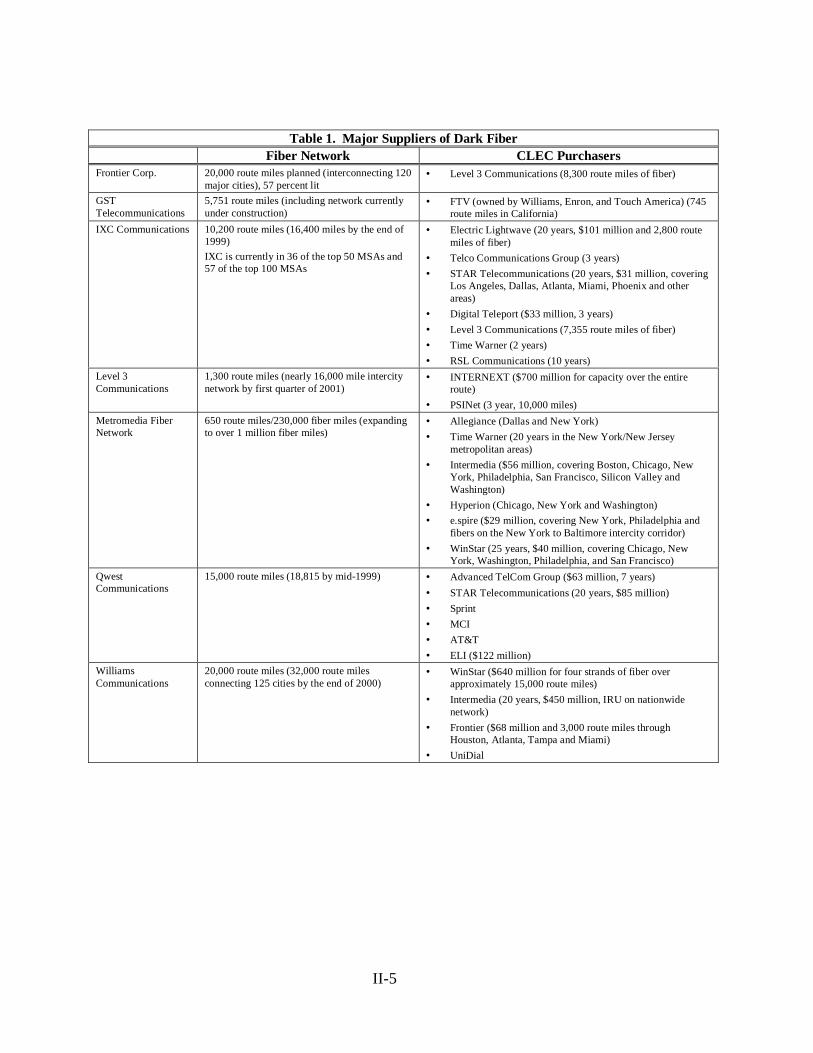
– and cable companies19 have also sold fiber to CLECs.20 Dark fiber has become a commoditythat CLECs can purchase in a rapidly expanding wholesale market.21 See Table 1. The use offixed wireless radio technologies also has grown rapidly.22 As described below, companies likeWinStar and Teligent have built local networks using predominantly fixed wireless links, whileestablished CLECs such as AT&T and MCI WorldCom are using fixed wireless connections toextend their existing fiber networks. (See Table 3, infra.)
17 J. Akasie, Lighting Up, Forbes, Apr. 19, 1999.18 Id.19 See, e.g., Frontier Communications Press Release, Frontier Turns Up Western Half of the “Optronics”
Network; Capacity Swap with WTCI Adds 1,661 Network Miles and a Third Ring in the Northwest, June 22, 1998(discussing Frontier’s exchange of fiber with TCI subsidiary on the Seattle-Billings-Denver route); Williams PressRelease, Williams Acquires High-Capacity Fiber Route from MediaOne, Extends National Network to KeySoutheast Markets, July 27, 1998 (describing Williams’ purchase of fiber in Florida from MediaOne).
20 See, e.g. id. (Montana Power’s subsidiary, Touch America, wholesales fiber); American Electric Power,AEP Communications, http://www.aep.com/global/communications/comm.html (American Electric Powerwholesales fiber capacity to IXCs, CLECs and wireless providers); ICG Communications, ICG Telecom Group,http://www.icgcom.com/telecom/corpinfo/AboutUs.html; ICG Communications Press Release, ICGCommunications Announces Fiber Network Project in Atlanta, Jun. 11, 1997 (ICG acquires fiber from SouthernCalifornia Edison, Alabama Power, and American Electric Power).
21 According to some estimates, “35% of the fiber already in the ground is ‘dark.’” C. Mack, Fiber Frenzy,Forbes, Apr. 19, 1999, at 252. Since June 1998, “the wholesale spot price of bandwidth is down 35%, thanks toample supply.” Id. Bandwidth is now sold as a commodity through numerous clearinghouses, including Arbinet,AT&T Global Clearinghouse, GRIC Communications, IXTC WweXchange, and Ratexchange RTBX. See K.Henderson, Market Makers Push “Telecommodities,” Phone+ Magazine, Dec. 1998.
22 The FCC recognized as early as 1991 that wireless radio was being used to bypass LEC networks. See,e.g., Expanded Interconnection with Local Telephone Company Facilities, Notice of Proposed Rulemaking andNotice of Inquiry, 6 FCC Rcd 3259 n.3 (1991) (End users also use microwave and other radio-based facilities in lieuof LEC access services in some cases.”); see also Expanded Interconnection with Local Telephone CompanyFacilities, Report and Order and Notice of Proposed Rulemaking, 7 FCC Rcd 7369, 7372 (“technological advances”such as “fiber optic and radio networks” “compete with existing LEC services.”).
II-5
Table 1. Major Suppliers of Dark FiberFiber Network CLEC Purchasers
Frontier Corp. 20,000 route miles planned (interconnecting 120major cities), 57 percent lit
• Level 3 Communications (8,300 route miles of fiber)
GSTTelecommunications
5,751 route miles (including network currentlyunder construction)
• FTV (owned by Williams, Enron, and Touch America) (745route miles in California)
IXC Communications 10,200 route miles (16,400 miles by the end of1999)
IXC is currently in 36 of the top 50 MSAs and57 of the top 100 MSAs
• Electric Lightwave (20 years, $101 million and 2,800 routemiles of fiber)
• Telco Communications Group (3 years)
• STAR Telecommunications (20 years, $31 million, coveringLos Angeles, Dallas, Atlanta, Miami, Phoenix and otherareas)
• Digital Teleport ($33 million, 3 years)
• Level 3 Communications (7,355 route miles of fiber)
• Time Warner (2 years)
• RSL Communications (10 years)
Level 3Communications
1,300 route miles (nearly 16,000 mile intercitynetwork by first quarter of 2001)
• INTERNEXT ($700 million for capacity over the entireroute)
• PSINet (3 year, 10,000 miles)
Metromedia FiberNetwork
650 route miles/230,000 fiber miles (expandingto over 1 million fiber miles)
• Allegiance (Dallas and New York)
• Time Warner (20 years in the New York/New Jerseymetropolitan areas)
• Intermedia ($56 million, covering Boston, Chicago, NewYork, Philadelphia, San Francisco, Silicon Valley andWashington)
• Hyperion (Chicago, New York and Washington)
• e.spire ($29 million, covering New York, Philadelphia andfibers on the New York to Baltimore intercity corridor)
• WinStar (25 years, $40 million, covering Chicago, NewYork, Washington, Philadelphia, and San Francisco)
QwestCommunications
15,000 route miles (18,815 by mid-1999) • Advanced TelCom Group ($63 million, 7 years)
• STAR Telecommunications (20 years, $85 million)
• Sprint
• MCI
• AT&T
• ELI ($122 million)
WilliamsCommunications
20,000 route miles (32,000 route milesconnecting 125 cities by the end of 2000)
• WinStar ($640 million for four strands of fiber overapproximately 15,000 route miles)
• Intermedia (20 years, $450 million, IRU on nationwidenetwork)
• Frontier ($68 million and 3,000 route miles throughHouston, Atlanta, Tampa and Miami)
• UniDial
II-6
B. A Methodology for Determining Where CLEC Fiber Offersan Alternative to ILEC Interoffice Transport
CLECs have deployed fiber in all major metropolitan areas, and the overwhelmingmajority of second and third tier markets. Indeed, CLEC fiber networks extend far beyond thelevel of “interoffice” transport – these networks serve not only ILEC and CLEC offices, but agreat number of private switches too. Indeed, they serve nearly 15 percent of all commercialoffice buildings in the country.23
Since 1996, the number of CLECs that have deployed fiber networks has grown from 29to 60, and the number of cities served by this fiber has grown from 130 to 289. See Figure 2.Within the top 50 MSAs, CLECs have deployed nearly 30,000 miles of fiber. See Appendix A.Forty seven of the top 50 MSAs are served by at least three CLEC fiber networks; 29 are servedby five or more CLECs; 16 are served by seven or more.24 See Appendix A. CLECs havedeployed fiber in all but 15 of the MSAs ranked between 51 and 150.25 See Appendix B.
CLEC fiber provides competitive interoffice transport to the ILEC wire centers that itreaches. CLEC fiber invariably reaches all major interexchange carrier POPs as well. AndCLECs can provide transport between the ILEC switches to which they connect, by using theCLEC switch as a tandem. In practice, however, there is little if any use of the UNE fortransport between pairs of ILEC switches.26 CLECs that require transport among ILEC switchesgenerally hand off the traffic to the ILEC. CLECs actually use the interoffice transport UNEmainly to make connections: (1) between a CLEC switch and an ILEC switch, or (2) betweenCLEC facilities collocated in an ILEC central office and an interexchange carrier point ofpresence (POP).
Nobody doubts that competitive alternatives are available in some segments of the marketfor interoffice transport. The practical difficulty lies in determining precisely where. Regulatorsdo not maintain comprehensive maps of precisely where CLEC fiber routes run nationwide.27
The maps that are available quickly become obsolete – this is a very dynamic market, andCLECs are continuously extending their networks.
23 Compare New Paradigm Resources Group, 1999 CLEC Report, at Ch. 6 p. 23 (10th ed. 1999) (“1999CLEC Report”) (104,097 office buildings served by CLECs) with U.S. Dep’t of Commerce, Statistical Abstract ofthe United States 1998, 118th ed., at Table 1229 (Oct. 1998) (705,000 commercial office buildings nationwide).
24 Royce Holland, CEO of Allegiance Telcom, states: “In Tier I markets today there is a tremendous glut ofcapacity.” W.T. Scott, et al, ING Baring Furman Selz LLC, Investext Rpt. No. 2787890, Telecommunications/FiberVs. Fiberless (Sept. 30, 1998).
25 MSAs 51-150 range in population from 489,000 to 1.1 million. See Rand McNally, Commercial Atlas &Marketing Guide 1999, 130th ed. at 60 (1999).
26 The only important exception is when one of the ILEC switches is collocated with an IXC POP.27 The FCC, for example, collects information only on the amount of fiber CLECs have deployed, not on
where it has been deployed. See J. Kraushaar, FCC Fiber Deployment Update End of Year 1997 at 2 (Sept. 1998).Moreover, CLECs generally do not provide this information. For example, at least 65 of approximately 120facilities-based CLECs profiled in the 1999 CLEC Report do not even report how much fiber they have in each citythey serve, and only a handful of CLECs provide fiber maps of any variety. See 1999 CLEC Report at Ch. 11.
II-7
But complete maps are not needed. Both the ILECs and the Commission compilereliable data, frequently updated, on where CLECs have obtained collocation.28 And we havebeen able to establish – conservatively, and with a high degree of confidence, that CLECcollocation in “dense” wire centers is a very reliable indicator of the presence of competitiveinteroffice transport.29 Different ILECs serve different demographic areas, and what constitutesa “dense” wire center in each ILEC’s territory may therefore vary. In the following analysis, wepresent three alternative definitions of “dense” wire centers: centers with 20,000+, 30,000+, and40,000+ lines.
A CLEC that is going to provide its own interoffice transport will, with very fewexceptions, initiate the transport at a collocation cage.30 Royce Holland, one of the foundingfathers of the CLEC industry, describes the strategy as follows:
We enter the market and put in switches, routers, both central office and frame-relayswitches. We co-locate in a huge number of COs. We’ve targeted over 500 centraloffices to be in within the next few years. It represents a huge addressable market andthen we go out and lease capacity initially, and as we reach the crossover point in termsof traffic, we either lease dark fiber or overbuild it. For instance, in New York, thecrossover point is 40,000 lines. We have already moved to stage two, in which weacquired dark fiber from Metromedia Fiber Network.31
It therefore makes sense to begin any analysis of competition for interoffice transportwith the fact of collocation. The FCC’s December 1998 Local Competition Report finds thatCLECs (as of mid-year 1998) had operational collocation arrangements in some 5000 wirecenters.32
Three major ILECs – Bell Atlantic, SBC, and U S WEST – have compiled quitecomprehensive, and reasonably current information on CLEC fiber routes within their regions.33
These fiber-route maps can be superimposed on top of the corresponding ILEC wire-center-boundary maps. And we can superimpose maps that show which wire centers have attracted
28 All proprietary information regarding competitors’ taking of collocation and ILEC UNEs was keptstrictly confidential, and is presented only in aggregate form in this report.
29 Under the FCC’s Expanded Interconnection regime, CLECs were indeed required to bring in fiber tocentral offices in which they obtained collocation. See, Expanded Interconnection with Local Telephone CompanyFacilities, Report and Order and Notice of Proposed Rulemaking, 7 FCC Rcd 7369, 7409-10, 7413-14 (1992).
30 See, e.g., W.T. Scott, et al, ING Baring Furman Selz LLC, Investext Rpt. No. 2787890,Telecommunications/Fiber Vs. Fiberless (Sept. 30, 1998) (quoting WinStar CEO, Bill Rouhana: “The fundamentalunderpinning of the strategy of most fiber-based companies in the industry today is that we will build to a centraloffice, and we will co-locate with a regional bell operating company.”).
31 Id. (quoting Allegiance Telecom CEO Royce Holland).32 FCC, Industry Analysis Division, Local Competition, at 6 (Dec. 1998) (“FCC Local Competition
Report”).33 Together, these three BOC regions comprise 35 states and the District of Columbia and 47 percent of all
BOC and GTE wire centers.

II-8
CLEC collocation. We can then count – one by one – the wire centers through which CLECfiber passes, and in which CLECs have also obtained collocation.
What we find is a reasonably good fit between wire centers with CLEC collocation andwire center serving areas that contain CLEC fiber.34 In SBC’s region, for example, we’re able toconfirm that at least 90 percent of wire centers with collocation serve areas in which CLEC fiberis also found. In Bell Atlantic’s region, we can confirm that the figure is at least 75 percent. InU S WEST’s region, we can confirm that the figure is at least 65 percent.
This good fit becomes better still if we restrict the focus to “dense” wire centers. SeeTable 2.
Table 2. Wire Centers with Collocation by RegionTotalwire
centers
Wirecenters
withcollocation(% of total)
Wirecenters with
40,000+lines
(% of total)
Wirecenters with
40,000+lines and
collocation(% of total)
Wirecenters with
30,000+lines
(% of total)
Wirecenters with
30,000+lines and
collocation(% of total)
Wirecenters with
20,000+lines
(% of total)
Wirecenters with
20,000+lines and
collocation(% of total)
Ameritech 1136 341 (30%) 176 (16%) 150 (13%) 258 (23%) 198 (17%) 365 (32%) 260 (23%)Bell Atlantic 2418 359 (15%) 302 (13%) 189 (8%) 447 (18%) 243 (10%) 669 (28%) 305 (13%)BellSouth 1598 250 (16%) 149 (9%) 117 (7%) 244 (15%) 176 (11%) 377 (24%) 225 (14%)GTE 3873 142 (4%) 78 (2%) 47 (1%) 138 (4%) 74 (2%) 256 (7%) 105 (3%)SBC 2088 325 (16%) 321 (15%) 253 (12%) 410 (20%) 286 (14%) 548 (26%) 311 (15%)U S WEST 1230 235 (19%) 138 (11%) 118 (10%) 199 (16%) 159 (13%) 285 (23%) 200 (16%)Total: 12,343 1652(13%) 1164 (9%) 874 (7%) 1696 (14%) 1136 (9%) 2500 (20%) 1406 (11%)
For example, in wire centers with 20,000+ lines in SBC’s region, collocation implies thenearby presence of CLEC fiber at least 90 percent of the time. In Bell Atlantic’s region, thecorresponding figure is at least 72 percent. In US West’s region the figure is at least 74 percent.Analyzing instead wire centers with 30,000+ lines yields a figure of at least 91 percent for SBC,at least 81 percent for Bell Atlantic, and at least 76 percent for U S WEST. Analyzing wirecenters with 40,000+ lines yields a figure of at least 92 percent for SBC, at least 80 percent forBell Atlantic, and at least 77 percent for U S WEST.
Similar conclusions emerge from a closer study of individual markets, both large andsmall.
• In the Los Angeles MSA, 72 wire centers serve 40,000+ lines. Of these, 20 haveat least one collocated CLEC. An analysis of fiber route maps shows that CLECfiber passes through at least 15 of the 20 wire center areas with collocation. SeeMap 1.
34 In some instances, our maps show fiber within a wire center serving area that does not pass straightthrough the wire center itself. It is reasonable, however, to include such instances as wire centers served by fiber,for two reasons. First, our maps are incomplete, and there may indeed be competitive fiber running directly fromCLEC networks to ILEC wire centers. Second, to the extent that such connections do not already exist, it is clearthat CLECs easily could make them, particularly in light of the short distances (within the same wire center servingarea) and attractive economics (dense wire centers) involved.
II-9
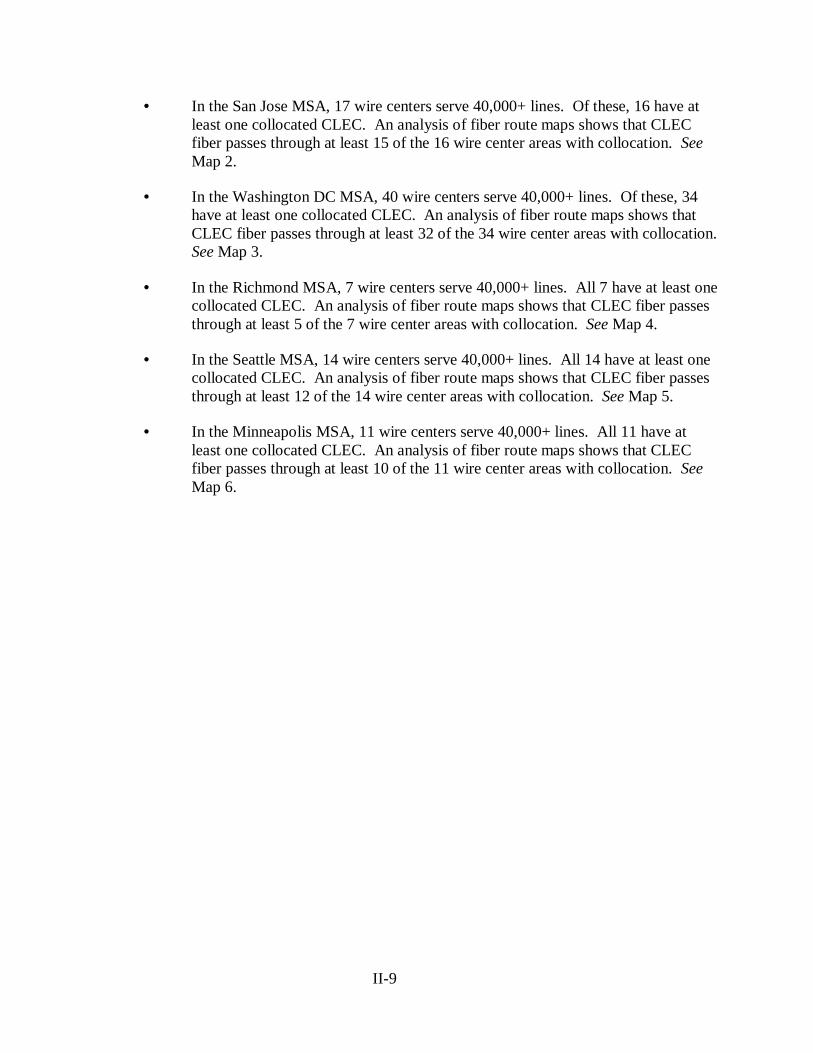
• In the San Jose MSA, 17 wire centers serve 40,000+ lines. Of these, 16 have atleast one collocated CLEC. An analysis of fiber route maps shows that CLECfiber passes through at least 15 of the 16 wire center areas with collocation. SeeMap 2.
• In the Washington DC MSA, 40 wire centers serve 40,000+ lines. Of these, 34have at least one collocated CLEC. An analysis of fiber route maps shows thatCLEC fiber passes through at least 32 of the 34 wire center areas with collocation.See Map 3.
• In the Richmond MSA, 7 wire centers serve 40,000+ lines. All 7 have at least onecollocated CLEC. An analysis of fiber route maps shows that CLEC fiber passesthrough at least 5 of the 7 wire center areas with collocation. See Map 4.
• In the Seattle MSA, 14 wire centers serve 40,000+ lines. All 14 have at least onecollocated CLEC. An analysis of fiber route maps shows that CLEC fiber passesthrough at least 12 of the 14 wire center areas with collocation. See Map 5.
• In the Minneapolis MSA, 11 wire centers serve 40,000+ lines. All 11 have atleast one collocated CLEC. An analysis of fiber route maps shows that CLECfiber passes through at least 10 of the 11 wire center areas with collocation. SeeMap 6.

II-10
INSERT MAP 1

II-11
INSERT MAP 2

II-12
INSERT MAP 3

II-13
INSERT MAP 4

II-14
INSERT MAP 5

II-15
INSERT MAP 6

II-16
This analysis is very conservative, in several important respects.
To begin with, the available fiber maps are by no means a complete representation of allCLEC and third party fiber. They do not include the fiber of all CLECs within a given area. Themaps generally do not include fiber that public utilities or cable companies have deployed,although CLECs often have obtained fiber from these sources. The maps were prepared at least6-9 months ago, and do not include fiber constructed since this time, or fiber that is now underconstruction. The fiber routes themselves are incomplete, and do not include many networkspurs off of the main rings, many of which may run across wire center boundaries to a collocatedcentral office. In sum, it is very likely that CLEC fiber actually serves even more collocatedwire centers than our data indicate.35
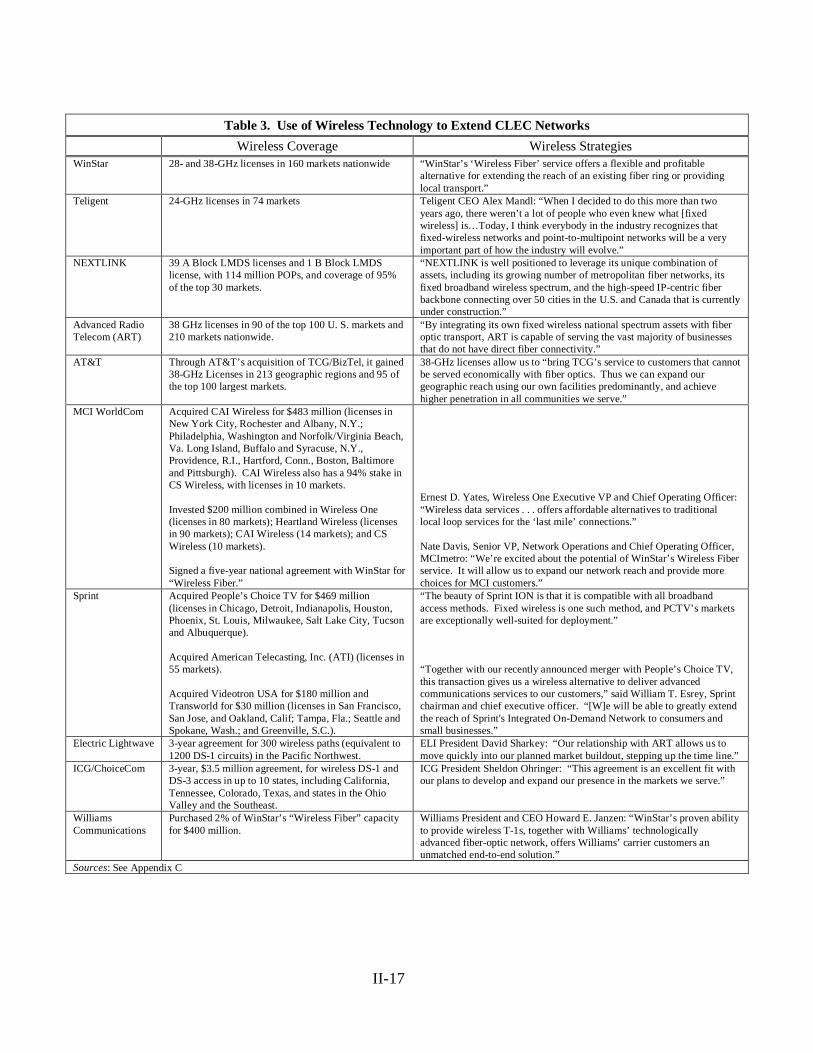
Second, we are considering here only fiber-optic interoffice transport. Other transporttechnologies are available, and are used as well. Numerous CLECs have long used wirelessradio and microwave technologies to extend their networks.36 This trend has accelerated rapidlyin the past few years. Several CLECs – WinStar, Teligent, and NEXTLINK – are using fixedwireless connections in lieu of fiber to provide high-capacity connections.37 AT&T, MCIWorldCom, and Sprint all have made substantial recent investments in such technology toenhance their competitive local networks,38 as have many other CLECs.39 See Table 3.
35 Moreover, our analysis ignores the fact that CLECs may have fiber and serve customers in wire centersin which they do not obtain collocation.
36 In 1994, TCG advertised that “A Boston customer...didn't have time to wait for us to reach him withfiber. So we connected his office to our network through a microwave facility until the fiber loop was installed.”TCG, The People Behind a Decade of Vision in Local Telecommunications: 1984-1994 (1994).
37 See, e.g., WinStar, Carrier Services, http://www.winstar.com/indexCarrServ.htm (WinStar’s WirelessFiber offers other carriers “a quick and cost-efficient solution for extending the reach of an existing fiber ringproviding local transport.”); N. Swartz, InTeligent Challenger, Mar. 15, 1999, http://www.teligent.com (“We canput somewhere between four T1s worth of capacity all the way up to a DS3 worth of capacity in a building.”)(quoting Keith Kaczmarek, Teligent senior vice president, engineering & operations); NEXTLINK Press Release,NEXTLINK Closes WNP Acquisition, Apr. 27, 1999 (NEXTLINK will use LMDS “to build fixed wirelessextensions to its local fiber optic networks planned to cover most major cities in the United States.”).
38 With its purchase of TCG, AT&T acquired 38 GHz licenses that cover more than 200 U.S. markets,including 95 of the 100 largest domestic markets. See Teleport Prepares to Take on WinStar in 38 GHz CLECMarket, Communications Today, Nov. 3, 1997. MCI WorldCom recently acquired CAI Wireless. MCI Inks $414M Deal to Buy CAI, Times Union, Apr. 20, 1999, at E1. Sprint has acquired People’s Choice TV and AmericanTelecasting, which provide Sprint a “wireless alternative to deliver advanced communications services to [its]customers.” Sprint Press Release, Sprint Agrees to Acquire American Telecasting, Inc., Apr. 27, 1999. Sprint hasalso purchased VideoTron USA and Transworld, which both have fixed wireless licenses.
39 See, e.g., ART Press Release, Advanced Radio Telecom and Electric Lightwave Execute StrategicAgreement, Mar. 14, 1997 (ELI purchased wireless transport from ART).
II-17
Table 3. Use of Wireless Technology to Extend CLEC Networks
Wireless Coverage Wireless StrategiesWinStar 28- and 38-GHz licenses in 160 markets nationwide “WinStar’s ‘Wireless Fiber’ service offers a flexible and profitable
alternative for extending the reach of an existing fiber ring or providinglocal transport.”
Teligent 24-GHz licenses in 74 markets Teligent CEO Alex Mandl: “When I decided to do this more than twoyears ago, there weren’t a lot of people who even knew what [fixedwireless] is…Today, I think everybody in the industry recognizes thatfixed-wireless networks and point-to-multipoint networks will be a veryimportant part of how the industry will evolve.”
NEXTLINK 39 A Block LMDS licenses and 1 B Block LMDSlicense, with 114 million POPs, and coverage of 95%of the top 30 markets.
“NEXTLINK is well positioned to leverage its unique combination ofassets, including its growing number of metropolitan fiber networks, itsfixed broadband wireless spectrum, and the high-speed IP-centric fiberbackbone connecting over 50 cities in the U.S. and Canada that is currentlyunder construction.”
Advanced RadioTelecom (ART)
38 GHz licenses in 90 of the top 100 U. S. markets and210 markets nationwide.
“By integrating its own fixed wireless national spectrum assets with fiberoptic transport, ART is capable of serving the vast majority of businessesthat do not have direct fiber connectivity.”
AT&T Through AT&T’s acquisition of TCG/BizTel, it gained38-GHz Licenses in 213 geographic regions and 95 ofthe top 100 largest markets.
38-GHz licenses allow us to “bring TCG’s service to customers that cannotbe served economically with fiber optics. Thus we can expand ourgeographic reach using our own facilities predominantly, and achievehigher penetration in all communities we serve.”
MCI WorldCom Acquired CAI Wireless for $483 million (licenses inNew York City, Rochester and Albany, N.Y.;Philadelphia, Washington and Norfolk/Virginia Beach,Va. Long Island, Buffalo and Syracuse, N.Y.,Providence, R.I., Hartford, Conn., Boston, Baltimoreand Pittsburgh). CAI Wireless also has a 94% stake inCS Wireless, with licenses in 10 markets.
Invested $200 million combined in Wireless One(licenses in 80 markets); Heartland Wireless (licensesin 90 markets); CAI Wireless (14 markets); and CSWireless (10 markets).
Signed a five-year national agreement with WinStar for“Wireless Fiber.”
Ernest D. Yates, Wireless One Executive VP and Chief Operating Officer:“Wireless data services . . . offers affordable alternatives to traditionallocal loop services for the ‘last mile’ connections.”
Nate Davis, Senior VP, Network Operations and Chief Operating Officer,MCImetro: “We’re excited about the potential of WinStar’s Wireless Fiberservice. It will allow us to expand our network reach and provide morechoices for MCI customers.”
Sprint Acquired People’s Choice TV for $469 million(licenses in Chicago, Detroit, Indianapolis, Houston,Phoenix, St. Louis, Milwaukee, Salt Lake City, Tucsonand Albuquerque).
Acquired American Telecasting, Inc. (ATI) (licenses in55 markets).
Acquired Videotron USA for $180 million andTransworld for $30 million (licenses in San Francisco,San Jose, and Oakland, Calif; Tampa, Fla.; Seattle andSpokane, Wash.; and Greenville, S.C.).
“The beauty of Sprint ION is that it is compatible with all broadbandaccess methods. Fixed wireless is one such method, and PCTV’s marketsare exceptionally well-suited for deployment.”
“Together with our recently announced merger with People’s Choice TV,this transaction gives us a wireless alternative to deliver advancedcommunications services to our customers,” said William T. Esrey, Sprintchairman and chief executive officer. “[W]e will be able to greatly extendthe reach of Sprint's Integrated On-Demand Network to consumers andsmall businesses.”
Electric Lightwave 3-year agreement for 300 wireless paths (equivalent to1200 DS-1 circuits) in the Pacific Northwest.
ELI President David Sharkey: “Our relationship with ART allows us tomove quickly into our planned market buildout, stepping up the time line.”
ICG/ChoiceCom 3-year, $3.5 million agreement, for wireless DS-1 andDS-3 access in up to 10 states, including California,Tennessee, Colorado, Texas, and states in the OhioValley and the Southeast.
ICG President Sheldon Ohringer: “This agreement is an excellent fit withour plans to develop and expand our presence in the markets we serve.”
WilliamsCommunications
Purchased 2% of WinStar’s “Wireless Fiber” capacityfor $400 million.
Williams President and CEO Howard E. Janzen: “WinStar’s proven abilityto provide wireless T-1s, together with Williams’ technologicallyadvanced fiber-optic network, offers Williams’ carrier customers anunmatched end-to-end solution.”
Sources: See Appendix C

II-18
Finally, CLECs with fiber-optic networks have made clear that they can readily extendtheir existing networks reasonable distances to pick up large volumes of traffic. According toTCG, “[w]hen a company signs up for the service, TCG runs fiber-optic cable from its nearestline right into the building that houses the business.”40 NEXTLINK states that they will “pay allthe costs of taking the fiber optic lines” to their large business customers.41 MFN will “bring[its] fiber right up to [its] customers’ floors in their buildings.”42 Industry observersacknowledge that “[m]ost CLECs can justify running or leasing fiber facilities from theirregional switching centers (RSCs) out to a central location within a community.” 43
C. Competitive Interoffice Transport by Wire Center
Using the methodology set forth above, it is a straightforward matter to determine whichILEC wire centers are served by competitive interoffice transport. As of March 1999, CLECshad operational collocation arrangements in 1407 BOC and GTE wire centers with 20,000+lines, 1136 in wire centers with 30,000+ lines, and 874 in wire centers with 40,000+ lines. SeeTables 4-6.
Table 4. Competitive Interoffice Transport by RegionWire Centers with 20,000+ Access Lines Served by:
1 or moreCLEC collocation
nodes
2 or more 3 or more 4 or more
Ameritech 260 159 105 71Bell Atlantic 305 185 112 66BellSouth 225 136 85 56
GTE 106 64 22 8SBC 311 223 169 129U S WEST 200 N/A N/A N/A
40 D. Burrough, Businesses Are Top Beneficiaries of High-Tech Telecommunications, Phoenix BusinessJournal, Oct. 27, 1995, at 23.
41 S. Cruz, Yes, Virginia, There is Phone Competition, Las Vegas Business Press, Aug. 10, 1998, at 19.42 A. Lindstrom, Regional CLECs Plant Fiber Stakes in the Ground, America’s Network, Sept. 1, 1998.43 K. Kolderup, Voice Brings New Perspective to DSL, X-Change, Apr. 1999, http://www.x-
changemag.com/articles/941feat3.html.
II-19
Table 5. Competitive Interoffice Transport by RegionWire Centers with 30,000+ Access Lines Served by:
1 or moreCLEC collocation
nodes
2 or more 3 or more 4 or more
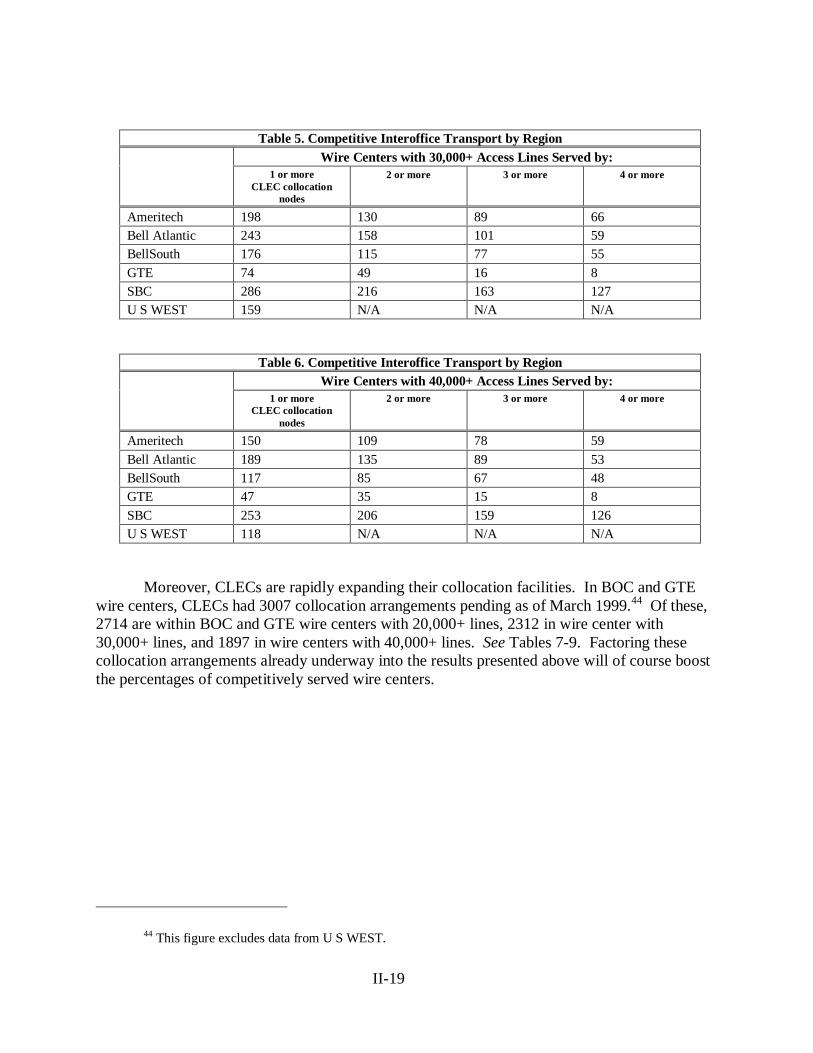
Ameritech 198 130 89 66Bell Atlantic 243 158 101 59BellSouth 176 115 77 55
GTE 74 49 16 8SBC 286 216 163 127U S WEST 159 N/A N/A N/A
Table 6. Competitive Interoffice Transport by RegionWire Centers with 40,000+ Access Lines Served by:
1 or moreCLEC collocation
nodes
2 or more 3 or more 4 or more
Ameritech 150 109 78 59
Bell Atlantic 189 135 89 53BellSouth 117 85 67 48GTE 47 35 15 8
SBC 253 206 159 126U S WEST 118 N/A N/A N/A
Moreover, CLECs are rapidly expanding their collocation facilities. In BOC and GTEwire centers, CLECs had 3007 collocation arrangements pending as of March 1999.44 Of these,2714 are within BOC and GTE wire centers with 20,000+ lines, 2312 in wire center with30,000+ lines, and 1897 in wire centers with 40,000+ lines. See Tables 7-9. Factoring thesecollocation arrangements already underway into the results presented above will of course boostthe percentages of competitively served wire centers.
44 This figure excludes data from U S WEST.

II-20
Table 7. Competitive Interoffice Transport by Region(Based on Actual and Pending Collocation)
Wire Centers with 20,000+ Access Lines Served by:1 or more
actual plus pendingCLEC collocation
nodes
2 or more 3 or more 4 or more
Ameritech 303 220 157 116
Bell Atlantic 473 317 230 155BellSouth 284 216 162 136
GTE 168 125 83 56SBC 379 293 217 177U S WEST 200 N/A N/A N/A
Table 8. Competitive Interoffice Transport by Region(Based on Actual and Pending Collocation)
Wire Centers with 30,000+ Access Lines Served by:1 or more
actual plus pendingCLEC collocation
nodes
2 or more 3 or more 4 or more
Ameritech 222 176 129 99Bell Atlantic 364 265 203 140BellSouth 212 178 141 121
GTE 109 88 64 46SBC 334 270 210 172U S WEST 159 N/A N/A N/A
Table 9. Competitive Interoffice Transport by Region(Based on Actual and Pending Collocation)
Wire Centers with 40,000+ Access Lines Served by:1 or more
actual plus pendingCLEC collocation
nodes
2 or more 3 or more 4 or more
Ameritech 161 135 108 86Bell Atlantic 274 214 171 120BellSouth 136 123 109 99
GTE 70 62 46 34SBC 284 244 199 169U S WEST 118 N/A N/A N/A
II-21
In the vast majority of wire centers in which CLECs have obtained collocation, they arenot in fact taking the interoffice transport UNE, but instead are relying on either their ownfacilities, those of a third party,45 or are leasing ILEC facilities pursuant to tariff. In SBC’sregion, for example, CLECs have obtained collocation in 330 wire centers, but are taking theinteroffice transport UNE from SBC in only 37 wire centers.46 In GTE’s region, CLECs haveobtained collocation in 142 wire centers, but are not taking the interoffice transport UNE in anyof them.
In 1982, the Department assumed that a 100,000-customer territory (LATA) was thesmallest area that could reasonably be expected to attract facilities-based service from competinginterexchange carriers.47 Solid empirical data now establishes the actuality of interoffice transportcompetition down to the level of many end offices. Our analysis is in fact very much moreconservative than DoJ’s was in 1982, because it centers on actual – not merely potential –competition. In 1982, MCI and Sprint were the only facilities-based competitive long-distancecarriers of any significance, and they provided facilities-based service only in limited areas. Today,by contrast, there are over 150 facilities-based CLECs. Many have deployed fiber facilities innumerous markets across the country. And we can say with high confidence that their competitiveinteroffice facilities extend to dense ILEC wire centers in which CLECs have actually chosen tocollocate.
As we have noted, MCI insisted in 1982 that interoffice transport could be competitiveright down to the level of every Class 5 end office – and not just down to the bigger ones.Whatever the facts back then, interoffice transport is plainly competitive today, so far as largerwire centers with collocated CLECs are concerned. Entry barriers for the last mile of theinteroffice market are far lower than they were for the “last LATA,” back in 1982. The costs ofproviding transport have dropped sharply in the intervening 17 years.48 LATAs are oftenhundreds of miles apart; most central offices, by contrast, are fewer than 10 miles apart. And aCLEC that collocates in a wire center can contend not just for long-distance traffic, but for all thelocal traffic and advanced services, too – a far larger market in terms of both dollars and trafficvolumes.49
45 In Illinois, 18 CLECs are provisioning all interoffice trunks themselves or though a third party. Bycomparison, only eight CLECs in Illinois rely exclusively on leasing trunks from Ameritech, whereas 19 CLECsprovision trunks jointly with Ameritech, or in combination with Ameritech and a third party. In Ohio, 14 CLECsare provisioning all interoffice trunks themselves or though a third party. By comparison, only five CLECs in Ohiorely exclusively on leasing trunks from Ameritech, whereas seven CLECs provision trunks jointly with Ameritech,or in combination with Ameritech and a third party.
46 In 143 of the 330 wire centers, CLECs are obtaining unbundled loops.47 See Response of the United States to Comments Received on the BOC LATA Proposals at 16-19, United
States v. Western Elec. Co., No. 82-0192 (D.D.C. Mar. 23, 1982). See also United States v. Western Elec. Co., 569 F.Supp. 990, 1019 n.149 (D.D.C. 1983).
48 Even in 1982, MCI argued that “[d]igital transmission, including fiber optics systems, drastically reducesterminal multiplex costs. This permits profitable short hauls to smaller and smaller markets.” Objections of MCICommunications Corporation to Application for Approval of Exchange Areas at 8, United States v. Western Elec.Co., No. 82-0192 (D.D.C. Nov. 3, 1982).
49 See, e.g., K.M. Leon, et al., ABN AMRO Chicago Corp. Investext Rpt. No. 1916888, Teleport

II-22
Thus, the “most significant” CLECs in the country – AT&T, MCI WorldCom, andSprint50 – are today doing precisely what MCI said they could do in 1982.51 AT&T has pursueda strategy of “migration of dedicated and terminating access facilities from LEC to TCGfacilities nationwide.”52 MCI WorldCom has “local phone facilities [that] cover nearly 90% ofthe local service areas in the U.S.”53 which enable the company to “bypass the RBOCs,” and“save on both access and termination charges.”54 Sprint acknowledges that it has alternativefacilities-based “access alternatives . . . including CLEC networks and fixed wireless.”55
Communications Group, Inc. – Company Report at *15 (May 6, 1997) (estimating potential CLEC revenues foraccess and private line services at $14.7 billion, public switched services at $82.4 billion, and other enhancedservices at $7 to $10 billion).
50 Bell Atlantic/NYNEX, 12 FCC Rcd at 20029-30 ¶ 82.51 As the FCC has noted, “[O]nce CAPs are interconnected to the central offices that handle heavy traffic,
they can gain a significant share of the access market by selling their services to the three largest IXCs.” ExpandedInterconnection with Local Telephone Company Facilities, Report and Order and Notice of Proposed Rulemaking, 6FCC Rcd 7369, 7422 n.253 (1992); see also Expanded Interconnection with Local Telephone Company Facilities,Second Report and Order and Third Notice of Proposed Rulemaking, 8 FCC 7374, 7380 ¶ 15 (1993) (“Increasedcompetition in the interstate special access market undoubtedly will result in some diversion of business from theLECs.”).
52 AT&T/TCG, Merger Presentation, Jan. 8, 1998, http://www.att.com/ir/ep.53 D. Pappalardo & D. Rhode, Ebbers’ Job Has Only Just Begun; Merging Worldcom, MCI Nets Will Prove
Challenging, Network World, Nov. 17, 1997 (quoting CEO John Sidgmore).54 D. Rohde, Price: Buyout to Benefit Customers, Network World, Nov. 17, 1997, at 11 (quoting Tim
Price, MCI President and COO).55 Remarks by Sprint Chairman & CEO William T. Esrey at Internet World, July 15, 1998,
http://www.sprint.com/Stemp/press/releases/9807/9807150597.html.