Embed Size (px)
Citation preview

II10EM Engineer recorded sound
Vol 221 No. 3
Oct 1 Nov 1976
11 Feef 6° hl7R r o
g;
2ßeCxEhu ti <.,,,nia}
7 toe T!NM tram-9
1 pram* IL Fauy
5 St;;YrdMl 114-A4001NprcÍ z3".
www.americanradiohistory.com

MCC/ Engineer
The four engineers on our cover are drawn from the diverse disciplines that combine to produce RCA's success in the recorded -music industry. They are, left to right, mechanical engineer Ben Chang, electrical engineer Greg Bogantz, in- dustrial engineer Harry Colebert, and rheologist Kumar Khanna. The record behind them is the first of a new series that has the famous "Little Nipper" on all RCA Records labels.
Mal Engineer A technical journal published by RCA Research and Engineering Bldg. 204 -2 Cherry Hill, N.J. 08101 Tel. PY -4254 (609- 779 -4254) Indexed annually in the Apr /May issue.
John Phillips
Bill Lauffer
Joan Toothill Frank Strobl
P.A. Gibson
Joyce Davis
Dr. J.J. Brandinger
A.W. Brook
Dr. D.J. Donahue
H.K. Jenny
A.C. Luther
H. Rosenthal
C.R. Turner
J.C. Volpe
Dr. W.J. Underwood
Dr. W.M. Webster
E.L. Burke
W.B. Dennen
C.C. Foster
RCA Engineer Staff
Editor Assistant Editor Art Editor
Contributing Editor
Composition
Editorial Secretary
Editorial Advisory Board
Div. VP, Engineering, Consumer Electronics VP, Engineering, RCA Americom Div. VP, Engineering, Picture Tube Division Manager, Technical Information Programs Chief Engineer, Engineering, Broadcast Systems
Staff VP, Engineering Div. VP, Solid State Power Devices
Chief Engineer, Engineering, Missile and Surface Radar
Director, Engineering Professional Programs
VP, Laboratories
Consulting Editors
Ldr., Presentation Services, Missile and Surface Radar
Mgr., News and Information, Solid State Division
Mgr., Scientific Publications, Laboratories
To disseminate to RCA engineers technical information of professional value
To publish in an appropriate manner important technical developments at
RCA. and the role of the engineer To serve as a medium of interchange of technical information between
various groups at RCA To create a community of engineering interest within the company by
stressing the interrelated nature of all technical contributions To help publicize engineering achievements in a manner that will promote
the interests and reputation of RCA in the engineering field To provide a convenient means by which the RCA engineer may review his
professional work before associates and engineering management To announce outstanding and unusual achievements of RCA engineers in a
manner most likely to enhance their prestige and professional status.
www.americanradiohistory.com
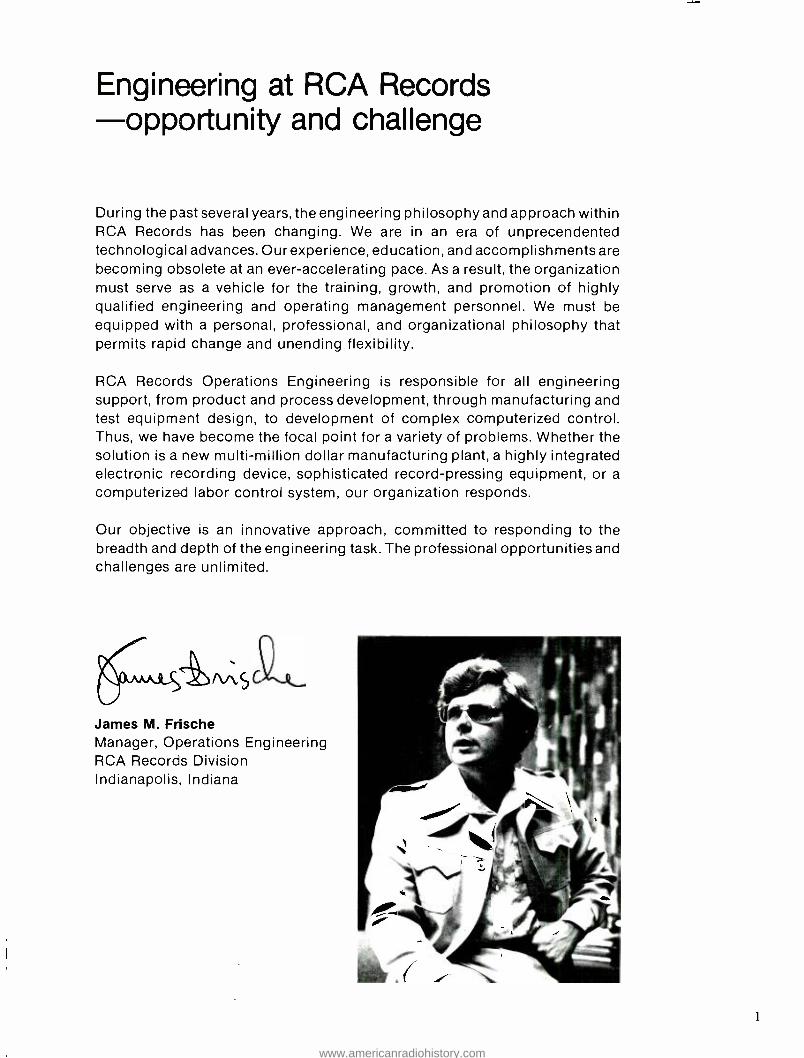
Engineering at RCA Records -opportunity and challenge
During the past several years, the engineering philosophy and approach within RCA Records has been changing. We are in an era of unprecendented technological advances. Our experience, education, and accomplishments are becoming obsolete at an ever -accelerating pace. As a result, the organization must serve as a vehicle for the training, growth, and promotion of highly qualified engineering and operating management personnel. We must be
equipped with a personal, professional, and organizational philosophy that permits rapid change and unending flexibility.
RCA Records Operations Engineering is responsible for all engineering support, from product and process development, through manufacturing and test equipment design, to development of complex computerized control. Thus, we have become the focal point for a variety of problems. Whether the solution is a new multi -million dollar manufacturing plant, a highly integrated electronic recording device, sophisticated record -pressing equipment, or a
computerized labor control system, our organization responds.
Our objective is an innovative approach, committed to responding to the breadth and depth of the engineering task. The professional opportunities and challenges are unlimited.
James M. Frische Manager, Operations Engineering RCA Records Division Indianapolis, Indiana
1
www.americanradiohistory.com

Recorded sound - a fusion of engineering disciplines at RCA Records
IMO
IMO
low
TOTAL COST
MACHINE WAITING - COST
operations research
OPTIMUM CREW SIZE
MINIMUM COST
SERVICE COST
LLLr. - Lll:r.L _ _LII:w.L
pre- recorded tapes
MOLDED RECORD
record manufacturing
capturing the sound
E21
digital electronics
www.americanradiohistory.com

J.F. Wells
J.F. Pfeiffer
G.A. Bogantzl J.F. Wells
S.K. Khanna
J.C. Ruda
LPL7U Engineer overview
Engineering and music at RCA Records
capturing the sound
Aesthetics of quad sound
The RCA Quadulator
record manufacturing
Polymer science -new materials for phonograph discs
Molding records automatically
pre- recorded tapes
J.C. Ruda The eight -track cartridge -putting it all together
G.A. Mattson R.E. Wartzok High -speed duplication of Stereo 8 tape
industrial engineering and operations research
A. Devarajan M. Martin) D. Mishra How operations research yields dividends at RCA Records
J. Frische D. Mishra Indirect labor control saves $750,000 /yr
A. Devarajan Anatomy of an equipment -selection decision
J. Freeman¡ D. Mishra Computerized labor control raises distribution efficiency
editorial input
A personal message concerning your future
special -short course
Dr. L. Shapiro 1 Digital electronics, Part II: Information theory, power, and bandwidth
general interest papers
J.N. Ostis 69 A transportable VFR air traffic control system
A. Acampora W.D. Henn 74 Polar -to- rectangular scan conversion improves radar display
Dr. S.T. Hsu A COS /MOS- loaded COS /MOS amplifier stage
H. Khajezadeh A.S. Rose Advances in integrated circuit reliability
on the job /off the job
W.R. Haldane Around the world in eight seconds -by amateur slow -scan tv
departments
pen and podium patents dates and deadlines news and highlights
Copyright 1976 RCA Corporation All rights reserved 3
www.americanradiohistory.com

Engineering and music at RCA Records J.F. Wells
Where it's been; how we do it now; where it's going.
PARTICIPATING IN all the aspects of the recorded music industry requires RCA Records to engage in a wide variety of activities ranging from music publishing, artist and repertoire development, and recording- studio design and operation; through mastering and manufacturing record and tape products on a major scale; to promoting and distributing these products using both normal in- dustry marketing channels and direct -mail service to individual customers.
A unique engineering organization provides technical direction and support for these divergent activities through equipment and process development, operations and facilities planning, and manufacturing and industrial engineering. On the eve of the 100th anniversary of the phonograph record (1977), it is fitting to review the role of Record Engineering in bringing recorded music to its present state of development.
Past developments
Little research and development in record manufacturing was done after RCA's purchase of the Victor Talking Machine Co. in 1929 until the Second World War caused a
shortage of shellac, one of the basic ingredients of record compound. At this time, H.I. Reiskind was assigned the task of developing a compound using plastics instead of shellac. In 1942, he organized a Record Engineering Department and within a few years built this into a group of about forty people.
Research led to the development of the 45 -rpm record in
1948, and in 1950 RCA joined CBS in manufacturing LP
records. About this time, a rapid expansion of the record industry occurred, requiring new production processes and equipment.
Over the last twenty -five years, research and development on heat transfer and molding, together with statistical analysis, reduced the molding time of a 12 -inch LP record from 68 seconds down to 20, and that of a 7 -inch 45 -rpm record from 45 to 15 seconds. These reductions have
doubled the plant capacity with relatively small ex- penditures for capital equipment. Similar savings were achieved through increasing the number of records that may be made from a pair of stampers (matrices) and reducing the cost and amount of compound required for
Reprint RE- 22 -34 Final manuscript received August 9, 1976.
4
each record. Also, during this time period, a disc equaliza- tion curve developed by Record Engineering for RCA New Orthophonic" records was adopted by the Record
Industry Association of America for all U.S. -made records. This meant that records made by different producers would all produce the same sound, using RCA's as a
standard, when played on a phonograph. This standard subsequently became world -wide.
H.E. Roys succeeded Mr. Reiskind in 1956 and pioneered in the development of stereophonic records and tape products for the consumer market. Record Engineering contributed to the introduction of the first tape cartridge available to the public and later to the eight -track endless loop concept, now the most popular tape format for recorded music in the U.S.
Another accomplishment then was a new record profile called "Gruve /Gard," which reduced record weight from 185 to 135 grams. It was proposed by RCA Recording Manager Don Richter and developed by Record Engineer- ing to be accepted throughout the industry.
In 1966, Warren Rex Isom became Chief Engineer of RCA Records. Under his direction, the cost and complexity of the eight -track cartridge was reduced significantly and RCA began releasing material in music -cassette format. Isom also further reduced the amount of material required for a 12 -inch record by at least 30 grams by introducing the "Dynaflex" profile, also accepted by many major record companies.
Mr. Isom also pioneered in the development of quadraphonic sound for the American market, first by
www.americanradiohistory.com

introducing the Q -8 cartridge to the industry in 1970, and two years later by bringing the CD -4 discrete system for records to this country.
The present unified approach
In October, 1973, James M. Frische was appointed to direct the efforts of the previous Record Engingeering, Manufacturing Engineering, and Facilities Planning Groups into one organization designated Operations Engineering. This consolidation has eliminated some duplication of effort and coordinated the goals of all engineering personnel; the September issue of TREND contains an organization chart showing the new Operations Engineering setup.
Presently, Operations Engineering is organized into several support groups. Equipment and Process Develop- ment, led by Joseph C. Ruda, and Electronic /Recording Development, led by Joe Wells, are responsible for developing or specifying new pieces of recording and manufacturing equipment and the methods by which they are used.
Devendra Mishra directs the Engineering Services Group, which includes Systems Engineering, Manufacturing Engineering (V. John Lacis, Manager) and Industrial Engineering (Melvin K. Martin, Manager). This group provides a systems approach to manufacturing changes, directs the installation and implementation of new equip- ment and procedures, and determines direct and indirect labor standards for record- and tape- manufacturing. The group also prepares requests for capital appropriations for both manufacturing and engineering.
Operation and Facilities Planning, led by August Skele, is responsible for long -range planning and requests for major capital expenditures as well as rearrangements of existing building facilities.
John Savoldi, Administrator, Packaging and Standards, provides needed experience in methods of packaging and shipping. He also oversees the maintenance of manufac- turing standards for domestic and international operations as needed.
All engineering groups provide technical support to recording, manufacturing and international operations as needed.
The need for this unified engineering approach was highlighted vividly in 1974 when RCA Records envisioned upgrading or replacing all its manufacturing facilities to increase our use of automated equipment and so produce the cost -savings necessary to compete in the present economy. Coordinating such an all- encompassing program would have been difficult with the previous organizational setup.
The recorded music industry - what makes it unique
Music publishing and marketing form a two billion - dollar segment of the overall publishing industry. The industry, by the very nature of the product it
markets, has several unique characteristics.
Each selection is a new product -its demand is
characterized by its life cycle. This means that the standard statistical techniques used for sales forecasting can not be of much practical value.
The market is highly competitive, both because of the large number of suppliers and the relative ease with which full consumer satisfaction is obtained. For example, each customer is fully satisfied with one copy and any price reduction does not increase the individual customer's demand.
The relative number of successes among the selections produced is normally low. These few successes not only help recoup all the costs in the release of a selection, but also produce windfall profits for the artists and the recording company. On the other hand, the failures are numerous and these do not even pay the direct costs incurred in their production. In short, many records are released at a
low or modest profit with the hope of generating a
few that will be widely popular.
The total industry sales, and the market share of the individual companies in it, has been highly impulsive for several reasons. First, the demand is very much orchestrated by the tastes of the consumers at the point in time the product is introduced. Secondly, personal marketing- making superstars of the recording artists -has been an avowed objective in
almost all companies in the industry. The music industry ranks almost at the top o' the list in the proportion of expenditures for advertising and promotion. Finally, the tremendous amount of free advertisement in the form of radio and tv airplay can make or break a selection.
Because of its tempermental nature, the entire music industry operation must be highly flexible. Success in the industry depends on management's ability to sense popular tastes, anticipate public interest in a variety of subjects and types of music, cultivate singers who seem to have potential for wide appeal, capitalize on unforeseen opportunities, and not go overboard with too many unsuccessful projects.
Above all, the timing of each introduction should be right and the product should receive adequate exposure. This is highly important to the engineers in all aspects of the music industry. The entire process must be fast, yet still be high in quality and production volume.
5
www.americanradiohistory.com

Fig. 1 - Music is transferred from tape to the master disc by means of motional feedback controlled cutter on lathe with variable pitch and depth.
Fig. 3 - Preplate tank produces thin nickel coating at low current flow for faithful replication of master.
The individual articles found later in this issue describe some of the accomplishments of this unified engineering organization, but it is
important to describe the overall process here to see where these individual contributions fit in.
The manufacturing process -start to finish
Jack Pfeiffer describes some of the initial steps in making a
quadraphonic record or tape cartridge, including planning and directing the recording session and the multitrack remixing. The same procedures, in somewhat simplified form, are used to cut a stereo or monaural master tape. From these two- or four -track master tapes, a
lacquer master or duplicating master tape is prepared in the recording studio.
If the final product is to be on tape, the duplicating master is prepared on one -inch tape, recorded at 71 Inds; it contains the program material in relatively the same format as the cartridge or cassette product it will produce. Glenn Mattson and Rick Wartzok discuss high -speed duplication of these tapes and Joe Ruda describes how cartridges are assembled.
6
Fig. 2 - Master disc is about to receive silver coating that provides conductivity for further plating.
If the end product is to be records rather than tapes, the initial step is to produce the master record, a very flat aluminum disc with a
uniform nitro -cellulose coating. This blank is
placed on a precision cutting turntable (Fig. 1)
and the sound is recorded in a continuous spiral groove by means of a magnetic cutting head using motion feedback. A chisel- shaped sapphire or diamond cutting stylus is used and the groove spacing and depth is automatically controlled according to the lateral and vertical excursions. The RCA Quadulator, described by Bogantz and Wells, is a modulation system developed at RCA Records for cutting CD -4 record masters.
After shipment to Indianapolis, the lacquer master receives a critical incoming inspection and a thorough cleaning. Then a silver- nitrate spray (Fig. 2) makes the lacquer electrically conductive and an initial nickel coating, or preplate, is electroplated onto the surface (Fig. 3). From this point, additional nickel is built up (Fig. 4) to provide the rigidity needed for subsequent handling.
www.americanradiohistory.com

Now the lacquer master is carefully separated from the nickel part, which becomes the metal master. Records could actually be pressed from this master, but in order to multiply the number of records that can be made from each lacquer, several metal molds are made by electroplating the metal master. These molds are really metal records and are played for quality analysis of the process up to this point. At this step, the mold is polished (Fig. 5) to remove "horns," which are the replication of lacquer material that was removed during cutting and then deposited along the top edge of the groove.
One more electroplating step produces the final metal part or "stamper." The back of this part is carefully ground smooth to prevent imperfections from being transmitted through to the surface and the center hole is carefully aligned with the music grooves to prevent record eccentricity. Then the stamper is formed (Fig. 6) to produce the desired record profile. Joe Ruda's second article describes the steps that ensue after the stampers go into the press for record molding.
In other areas of our engineering activity, Kumar Khanna describes current techniques used in developing record compounds, and a
series of articles covers packaging, warehousing and other auxiliary operations that take place at RCA Records.
Fig. 4 - Additional nickel buildup is provided by eight -position plating tank.
Ongoing improvements
In January, 1976, we began installing 24
injection- compression presses for 7 -inch 45- rpm records; they are now in full operation. At the same time, we moved our equipment for electroplating and finishing the metal parts for all records into a new matrix facility with controlled air flow in order to reduce con - tamonation in this critical manufacturing step. A twin -screw extruder for granulating a more homogeneous record compound was also installed.
In May of this year, the first two ten -slave high- speed tape duplicating systems designed by Operations Engineering were ordered. Design improvements are also increasing cartridge assembly -line speeds from their present 36 units per minute to a projected 53 per minute.
In August, the final step of automating 12 -inch record manufacturing was authorized -a new facility for 80 automatic presses. This plant is
expected to become operational during 1978.
In order to improve service and reduce costs in
the RCA Music Service, which includes the RCA Record and Tape Club, we are designing a new system that will integrate the paperwork /information part of the order processing with a minicomputer- controlled automatic dispensing and collating system.
These typical projects forecast the long -term demand for the unified engineering structure embodied in Operations Engineering at RCA Records.
Fig. 5 - Metal mold is polished to remove "horns" produced in master
cutting.
Fig. 6 - Hydraulic press forms center and edge of stamper for proper record contour.
7
www.americanradiohistory.com

8
Aesthetics of quad sound J.F. Pfeiffer
No formula exists for taking musical elements and plugging them in to create an effective display of quad sound.
THE QUADRAPHONIC effect of recorded sound -attacking the listener from virtually every direction is a kind of super stimulus. And if not the ultimate musical event, it presents a performance as a panoply of sound unmatched by any other system. It puts that whopping misnomer high fidelity into a new perspective of quantity and quality: higher fidelity to a live performance and new avenues of sonic adventure.
Aesthetic considerations
Elsewhere in this issue, we can read about the technical elegance of a quad recording and reproducing system. The elusive aesthetic elements of a musical perfor- mance are considered here -what they are and how they are infused into a
master tape so that all the technical effort will have some purpose. The elements are
John F. Pfeiffer, Executive Producer. Classical Labels. RCA Records. New York. N Y.. obtained his formal musical education at Bethany College. Lmdsborg. Kan- sas. and the University of Arizona in Tucson. He obtained the BSEE from the University of Arizona in 1949. During 1955 -1957 he took graduate work in electrical engineer- ing at Columbia University. Mr. Pfeiffer joined RCA in 1949 as an engineer in Camden and New York. Joining the Artists and Repertoire Department of RCA Records in t950. he has been producing Red Seal records up to the present time
Reprint RE- 22 -3 -5
Final manuscript received June 21. 1976.
elusive because they cannot be defined and are constant for no two musical events. The aesthetic judgments a musi- cian exercises in deciding the tone quali- ty. dynamics, texture, weight, attack, vibrato, and the infinite variations possi- ble from moment to moment are struc- tured into the overall concept of the music he is performing. To deliver a
recording of that performance in a way that leaves the listener with no doubts about the musical intentions involves aesthetic judgments controlled not only by musicians but also by producers and engineers.
What are the areas of control that require aesthetic judgment?
I Placement of musical elements. The dis- tribution about the listening area is critical. and featured elements, supporting bodies. and accents require directional balance. definition. and variations in perspective.
2) Quality or testae of instruments and yoicecv. The weight. presence. and tone color of the various featured, supporting. and accent elements Corm the tonal fabric that describes the musical event. draws the listener's attention appropriately. and separates the sonic activity to give him a
choice of listening focus.
3).4mhiem quality. The dimensions of the sound space, the perspectives within it. and the special acoustical effects possible in quad contribute to the listener's total perception and therefore his appreciation of the musical content.
4) .Special effects. Movements of sonic elements within the field defined by the four speakers. echo effects. synthetic mul- tiplications of sounds. acoustic space enlargement or contraction. ambience modifications. special tonal aberrations through specialized devices a variety of measures are accessible in quad recording to significantly affect the listener's enjoyment of a musical performance.
Achieving aesthetic values
These aesthetic judgements are applied in a variety of ways to four distinct operations:
I ) An integrated planning procedure
2) The actual recording sessions
3) Editing of tapes from sessions
4) Mixdown of the edited tape
These operations culminate in a master tape of a quad recording as delivered to the lacquer channel for master cutting or to the tape duplicating operation.
The essential planning
In this phase. each musical selection must be considered in relation to the most
effective quad display possible. Planning coordinates the creative contributions of musician, engineer, and producer -with the producer acting as interpreter between the other two and a kind of catalyst to bring musical and technical elements into creative interaction. Charts are developed which detail the desired placement and movements of musical elements so that recording procedures can be dictated. If the project involves special musical arrangements. degrees of control are written into the arrangement. for example:
I ) Featured elements are musically isolated so that the ear is not confused.
2) The orchestral or vocal texture is main- tained on a level of simplicity to eliminate many attention- attracting elements oc- curing at the same time.
3) Vocal and instrumental choirs are musically separated to allow the texture of each to emerge with identity.
41Since the perception of a sonic voice in movement about the listening space cannot he realized if the voice has a massive quality or large low frequency content. the arranger selects the appropriate sonic quality for effective perception.
5) If the recording is to be carried out in an overdub procedure (instruments and voices recorded separately and synchronously on tracks of a multitrack tape recorder). the musical arrangements are made to imple- ment this procedure efficiently and economically.
Recording of classical selections presents
the major decision of whether to display in a surround -sound configuration or to create a concert -hall ambience where all the direct sonic activity is concentrated conventionally to the front. Virtues of surround -sound are many. Placing the listener in the center of an orchestral or choral body gives a greater sense of presence and articulation and affords him the opportunity to select the musical element of choice. A greater degree of musical excitement is generated in this configuration, and some types of
www.americanradiohistory.com

program music lend themselves to an imaginative sonic treatment involving instrumental placement, featured elements, and movement within the field.
Planning charts are again essential to arrange orchestral seating (where possi- ble), make proper track assignments, and plan necessary isolation between in- strumental groups.
The recording session
Two separate procedures are followed: the overdub operation results in max- imum isolation between musical elements while the simultaneous performance often produces a more homogeneous musical result. Considering the overdub procedure:
I) The rhythmic instruments are generally recorded first since they form the sonic skeleton by determining tempi and their variations. The instruments are isolated acoustically and microphones are placed close to instruments. Electronic instruments and those electronically amplified are fed directly into the recording console for total isolation. Recording is carried out on as many tracks as necessary for later mixdown distribution.
2) Accompanying elements are then recorded in as many operations as the required isolation dictates. Conductor and musicians follow the pre- recorded rhythm tracks by using headphones energized from the record head of the tape machine. In this way, the added recordings will synchronize with those first recorded. Again, micro- phone techniques emphasize presence since no studio ambience is desired. Instruments, however, which have been charted to remain together for the final quad spread can be recorded together without inordinate con- cern for separation.
3) Featured elements, voices, or instruments are individually overdubbed for the degree of separation necessary for quality and directional flexibility in the final mix.
4) Accent instruments and voices such as percussion effects, electronic textures, vocal accents, sound effects or any pre- recorded contributions are tracked individually for maximum mixdown control.
The studio selected can be only large enough to accommodate the largest group which will record at any one time. Its acoustic properties should emphasize minimum reverberation, uniformity of response, and lack of standing waves or echoes. The multitrack tape recorders (currently up to 24 tracks) produce a series of monophonic recordings which are later blended together and transferred
Typical mixdown studio at RCA Records, New York. Master Engineer, Edwin Begley. operates console with author supervising.
to a four -track master recording on '/2-
inch tape. In view of this, some ap- propriate noise reduction system is im- portant to achieve clarity and definition in the final mix with a reasonable signal - to -noise ratio. It is also important to use the same tracks for instrumental and vocal elements when recording an album of selections. A pattern of track distribu- tion can be set up in the mixdown operation this greatly simplifies the procedure.
In recording selections with the musicians performing simultaneously:
I) An adequate size studio of minimum reverberation is chosen, the size being determined by the performing forces and the degree of acoustic isolation necessary. The performers are arranged physically as close to the charted distribution as possible so that leakage between sound sources does not distort the final distribution. Desired isola- tion is accomplished by physical separation and the use of acoustic baffles and sound booths in which the performer (usually a featured vocalist or instrumentalist) monitors the other performers through headphones.
2) Microphones with cardioid sensitivity patterns are exclusively utilized. The number of microphones used is reduced to an absolute minimum, and they are placed in as close proximity to the sound source as possible. Acoustic reflecting surfaces can be used to collect and focus sound into microphones where large sections are en- countered.
3) Recording on multitrack tape recorders permits mixdown flexibility in distribution and quality manipulation. Large sections
are recorded stereophonically on two or more tracks, and featured elements and others requiring directional control are recorded on separate tracks with maximum acoustic isolation.
4) If a particular concert hall ambience is
desired, microphones are located in the hall so that early reflections from large surfaces are collected on two or more tracks and reverberation components on other tracks are isolated from the direct sound tracks. Close pickup with a minimum of microphones for the direct components gives control possibilities in mixdown so that a desired blend of direct, reflective, and reverberant sound is obtainable and the direct components can he distributed ap- propriately.
Editing for master work tape
The tapes resulting from an overdub session can only be edited in cases where the final recording has been done in a number of "takes ", each of which has a transfer of all previously recorded tracks in the same track alignment. Overdub sessions generally produce one approved multitrack tape per selection since each successive track recorded is repeated on the same track until an acceptable perfor- mance is added. Tapes resulting from simultaneous- performance recording ses- sions can be edited from different "takes" providing the track assignment remains constant so that musical elements do not shift at splice points. Tapes representing approved performances for each selec- tion are then sequenced in the desired order for the disc to be released.
9
www.americanradiohistory.com
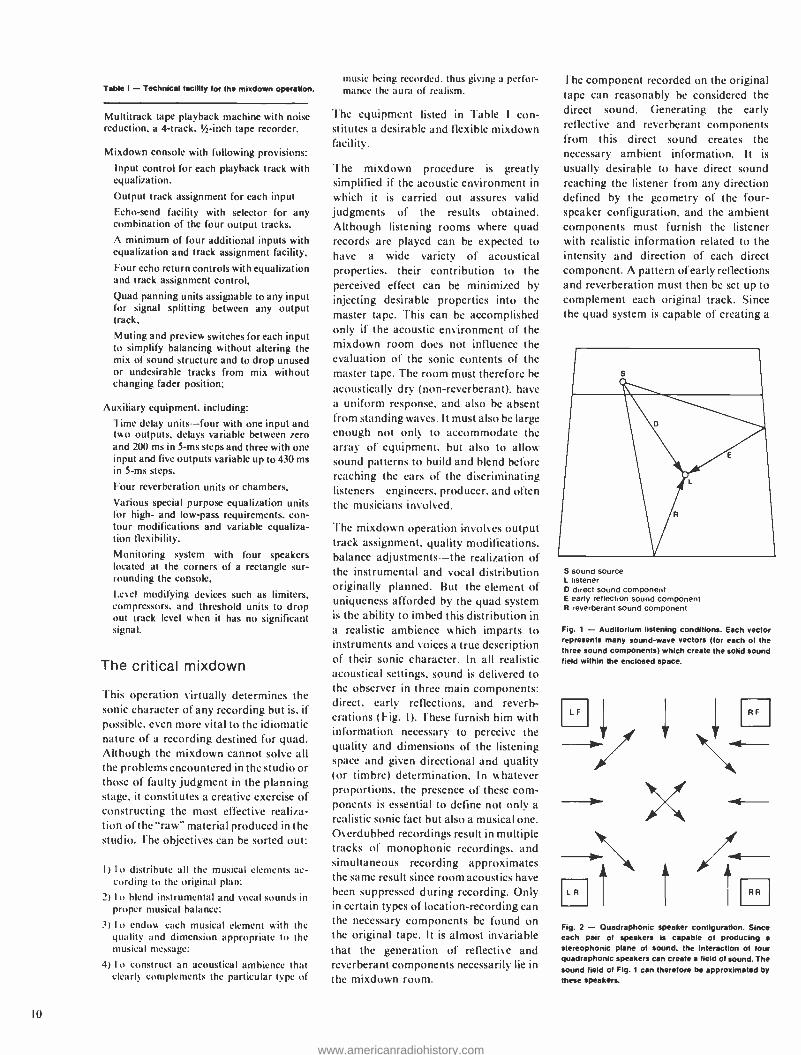
Table I - Technical facility for the mixdown operation.
Multitrack tape playback machine with noise reduction, a 4- track. 1h-inch tape recorder.
Mixdown console with following provisions:
Input control for each playback track with equalization.
Output track assignment for each input
Echo -send facility with selector for any combination of the four output tracks.
A minimum of four additional inputs with equalization and track assignment facility. hour echo return controls with equalization and track assignment control.
Quad panning units assignable to any input for signal splitting between any output track.
Muting and preview switches for each input to simplify balancing without altering the mix of sound structure and to drop unused or undesirable tracks from mix without changing fader position:
Auxiliary equipment. including:
Time delay units --four with one input and two outputs. delays variable between zero and 200 ms in 5 -ms steps and three with one input and five outputs variable up to 430 ms in 5 -ms steps.
Four reverberation units or chambers.
Various special purpose equalization units for high- and low -pass requirements. con- tour modifications and variable equaliza- tion flexibility. Monitoring system with four speakers located at the corners of a rectangle sur- rounding the console.
Level modifying devices such as limiters, compressors, and threshold units to drop out track level when it has no significant signal.
The critical mixdown
This operation virtually determines the sonic character of any recording but is, if possible. even more vital to the idiomatic nature of a recording destined for quad. Although the mixdown cannot solve all the problems encountered in the studio or those of faulty judgment in the planning stage. it constitutes a creative exercise of constructing the most effective realiza- tion of the "raw" material produced in the studio. The objectives can be sorted out:
I ) I o distribute all the musical elements ac- cording to the original plan:
2) I o blend instrumental and vocal sounds in proper musical balance:
3) I o endow each musical clement with the quality and dimension appropriate to the musical message:
4) I o construct an acoustical ambience that clearly complements the particular type of
IO
music being recorded, thus giving a perfor- mance the aura of realism.
The equipment listed in Table I con- stitutes a desirable and flexible mixdown facility.
The mixdown procedure is greatly simplified if the acoustic environment in which it is carried out assures valid judgments of the results obtained. Although listening rooms where quad records are played can be expected to have a wide variety of acoustical properties, their contribution to the perceived effect can be minimized by injecting desirable properties into the master tape. This can be accomplished only if the acoustic environment of the mixdown room does not influence the evaluation of the sonic contents of the master tape. The room must therefore be
acoustically dry (non -reverberant). have
a uniform response. and also be absent from standing waves. It must also be large enough not only to accommodate the array of equipment, but also to allow sound patterns to build and blend before reaching the ears of the discriminating listeners engineers. producer, and often the musicians involved.
The mixdown operation involves output track assignment, quality modifications, balance adjustments the realization of the instrumental and vocal distribution originally planned. But the element of uniqueness afforded by the quad system is the ability to imbed this distribution in a realistic ambience which imparts to instruments and voices a true description of their sonic character. In all realistic acoustical settings, sound is delivered to the observer in three main components: direct. early reflections, and reverb- erations (Fig. I ). These furnish him with information necessary to perceive the quality and dimensions of the listening space and given directional and quality (or timbre) determination. In whatever proportions, the presence of these com- ponents is essential to define not only a
realistic sonic fact but also a musical one. Overdubbed recordings result in multiple tracks of monophonic recordings, and simultaneous recording approximates the same result since room acoustics have been suppressed during recording. Only in certain types of location- recording can the necessary components be found on the original tape. It is almost invariable that the generation of reflective and reverberant components necessarily lie in the mixdown room.
The component recorded on the original tape can reasonably be considered the direct sound. Generating the early reflective and reverberant components from this direct sound creates the necessary ambient information. It is
usually desirable to have direct sound reaching the listener from any direction defined by the geometry of the four - speaker configuration, and the ambient components must furnish the listener with realistic information related to the intensity and direction of each direct component. A pattern of early reflections and reverberation must then be set up to complement each original track. Since the quad system is capable of creating a
S sound source L listener D direct sound component E early reflection sound component R reverberant sound component
Fig. 1 - Auditorium listening conditions. Each vector represents many sound -wave vectors (for each of the three sound components) which create the solid sound field within the enclosed space.
LF
LR
X
RF
RR
Fig. 2 - Quadraphonic speaker configuration. Since each pair of speakers is capable of producing a
stereophonic plane of sound. the interaction of lour quadraphonic speakers can create a field of sound. The sound field of Fig. 1 can therefore be approximated by these speakers.
www.americanradiohistory.com
LF
ATRF
RLR1
LF
RRF2
2ATRR
2 ATR
LR
RRR2
RLF1
RF
2ATLR
RLR2
2ATLFT- RRF1
RLF2
RRR1
RR
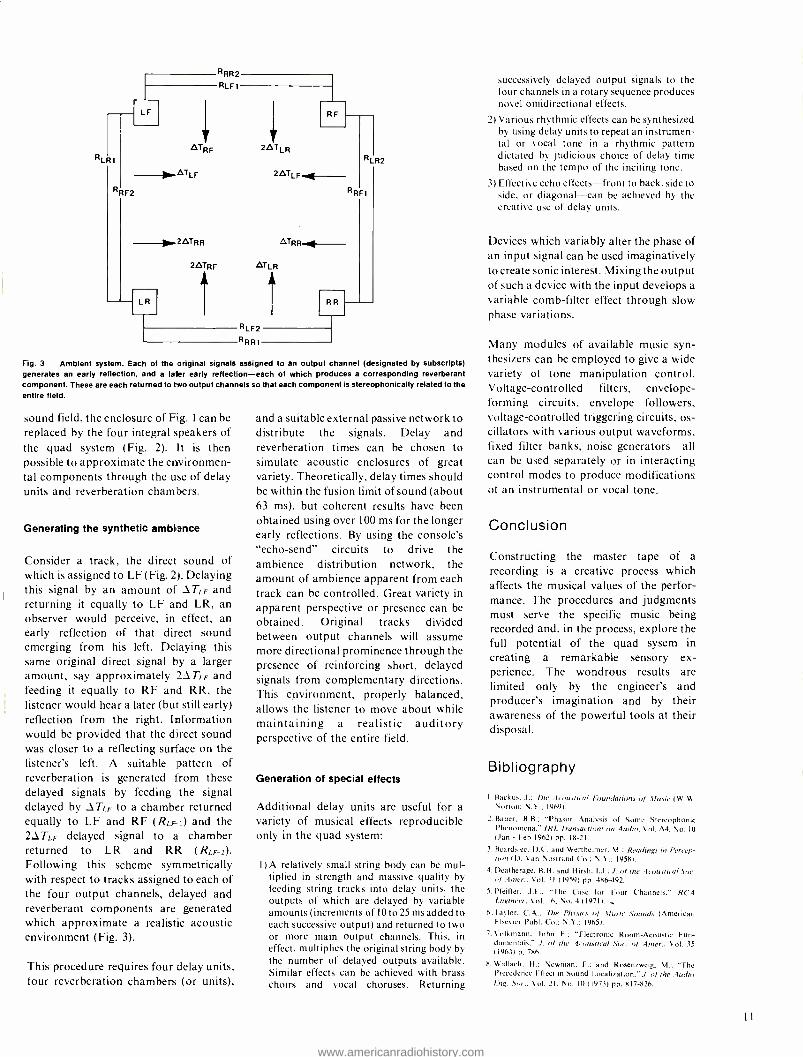
Fig. 3 - Ambient system. Each of the original signals assigned to an output channel (designated by subscripts) generates an early reflection, and a later early reflection -each of which produces a corresponding reverberant component. These are each returned to two output channels so that each component is stereophonically related to the
entire field.
sound field, the enclosure of Fig. 1 can be replaced by the four integral speakers of the quad system (Fig. 2). It is then possible to approximate the environmen- tal components through the use of delay units and reverberation chambers.
Generating the synthetic ambience
Consider a track, the direct sound of which is assigned to LF (Fig. 21. Delaying this signal by an amount of ¿TLF and returning it equally to LF and LR, an observer would perceive, in effect, an early reflection of that direct sound emerging from his left. Delaying this same original direct signal by a larger amount, say approximately 2,1TLF and feeding it equally to RF and RR, the listener would hear a later (but still early) reflection from the right. Information would be provided that the direct sound was closer to a reflecting surface on the listener's left. A suitable pattern of reverberation is generated from these delayed signals by feeding the signal delayed by JTLF to a chamber returned equally to LF and RF (RLF -I) and the 2 TLF delayed signal to a chamber returned to LR and RR (RLF -2).
Following this scheme symmetrically with respect to tracks assigned to each of the four output channels, delayed and reverberant components are generated which approximate a realistic acoustic environment (Fig. 3).
This procedure requires four delay units, four reverberation chambers (or units),
and a suitable external passive network to distribute the signals. Delay and reverberation times can be chosen to simulate acoustic enclosures of great variety. Theoretically, delay times should be within the fusion limit of sound (about 63 ms), but coherent results have been obtained using over 100 ms for the longer early reflections. By using the console's "echo- send" circuits to drive the ambience distribution network, the amount of ambience apparent from each track can be controlled. Great variety in apparent perspective or presence can be obtained. Original tracks divided between output channels will assume more directional prominence through the presence of reinforcing short, delayed signals from complementary directions. This environment, properly balanced, allows the listener to move about while maintaining a realistic auditory perspective of the entire field.
Generation of special effects
Additional delay units are useful for a variety of musical effects reproducible only in the quad system:
I ) A relatively small string body can be mul- tiplied in strength and massive quality by feeding string tracks into delay units, the outputs of which are delayed by variable amounts (increments of IO to 25 ms added to each successive output) and returned to two or more main output channels. This, in effect, multiplies the original string body by the number of delayed outputs available. Similar effects can be achieved with brass choirs and vocal choruses. Returning
successively delayed output signals to the four channels in a rotary sequence produces novel omidirectional effects.
2) Various rhythmic effects can be synthesized by using delay units to repeat an instrumen- tal or vocal tone in a rhythmic pattern dictated by judicious choice of delay time based on the tempo of the inciting tone.
3) Effective echo effects -front to back, side to side, or diagonal--can be achieved by the creative use of delay units.
Devices which variably alter the phase of an input signal can be used imaginatively to create sonic interest. Mixing the output of such a device with the input develops a variable comb- filter effect through slow phase variations.
Many modules of available music syn- thesizers can be employed to give a wide variety of tone manipulation control. Voltage- controlled filters, envelope - forming circuits, envelope followers, voltage- controlled triggering circuits, os- cillators with various output waveforms, fixed filter banks, noise generators -all can be used separately or in interacting control modes to produce modifications of an instrumental or vocal tone.
Conclusion
Constructing the master tape of a recording is a creative process which affects the musical values of the perfor- mance. The procedures and judgments must serve the specific music being recorded and, in the process, explore the full potential of the quad sysem in
creating a remarkable sensory ex- perience. The wondrous results are limited only by the engineer's and producer's imagination and by their awareness of the powerful tools at their disposal.
Bibliography
I. Ruck tia. .1.; /hr ie msiira/ Foundations u% Music (WIN. Norton; N.Y.; 1969).
2. Bauer, B.B.; "Phasor Analysis of Some Stereophonic Phenomena," IRE Transactions on Audio. Vol. A4, No. 10
(Jan - Feb 1962) pp. 18 -21.
3. Beardslee. D.C. and Wertheimer. M.; Readings in Percep- tion (D. Van Nostrand Co.; N.Y.: 1958).
4. Deatherage, B.H.. and Hirsh. I.J.; J. of the Acoustical Soc. of .4nter.. Vol. 31 (19591 pp 486-492.
5. Pfeiffer, J.F., "The Case for Four Channels," RCA Engineer, Vol. 16, No. 4 (1971).
6.Taylor, C.A.. The Physics o/ Music .Sounds (American Elsevier Publ. Co.; N.Y.; 1965).
7. Volkmann. John E.; "Electronic Room -Acoustic Fun- damentals," J. of the Arotuvica/ Soc. of Amer., Vol. 35 ( 1963) p. 786.
8. Wallach. H.; Newman. E.: and Rosenzweig, M.; "The Precedence FI)ect in Sound Localization." J. of the Audio Eng..Sai., Vol. 21. No. 10 (1973) pp. 107 -826.
II
www.americanradiohistory.com

The RCA Quadulator
G.A. Bogantzl J.F. Wells
RCA Records Engineering has developed a new modulation system for cutting of master lacquers for discrete quadraphonic (CD -4) records. This new system, called the RCA Quadulator, uses phase -lock -loop circuitry for wider dynamic range and lower distortion than previous systems, and is of far simpler construction.
CD-4 -a technique for recording discrete quadraphonic sound on records -was originated by the Victor Co. of Japan' and introduced to the U.S. market by RCA Records in 1972. Since that time, CD-4 records have been released by a number of other American labels, including the Warner- Elektra- Atlantic group, Project 3, A & M, Fan- tasy, and recently Arista. This wider use of the CD -4 technique led us to a recent comparison of record industry practices.
In Japan, lacquer mastering facilities are most often adjacent to pressing plants and are relatively few in number. In the U.S., however, lacquer mastering facilities are associated with recording studios and independent mastering laboratories, and so are found in larger numbers. In addi- tion, the proprietary nature of an un- released album is an important considera- tion worthy of some security precautions, including the in -house transfer to disc.
These and other considerations prompted the design of a new cutting system for CD-
12
4 records -the RCA Quadulator, which is tailored to at least a segment of the American record mastering market. A bit of serendipitiy also led to the develop- ment of a phase- lock -loop modulator circuit which has previously been described.`
Goals
To meet the needs of an independent recording studio or mastering laboratory, the following design goals for the new cutting system were considered impor- tant:
Simplicity of concept and operation
Quality and conformance to published standards
Compatibility with stereo channels
Space conservation
Ease of maintenance
Reasonable cost
We reviewed all components of previous cutting systems3'4'5'6 with the idea of
incorporating those devices which had the most positive audible effect on the finished records, as well as those which were required by industry standards.''"
To this end, records were cut with and without each of the components. These contained a variety of musical selections and were evaluated by a team of trained listeners.
Concepts
Before discussing the particulars of the circuitry incorporated in the Quadulator, it is worthwhile to review the earlier approaches taken and assess those areas which were inconsistent with our perceived goals. The fundamental goal was for simplicity. If it was not possible to substantially reduce the complexity of the hardware, the interfacing with other equipment, and the operation of the unit, there would be no point in designing new equipment at all. Performance of the existing equipment was satisfactory, so
www.americanradiohistory.com

there was no particular intent on our part to improve upon that. However, we did speculate that there might be some per- formance improvements to be gained simply through the reduction of signal processing circuitry.
While the accomplishments of the Victor Co. of Japan in advancing the state of the disc recording art through development of CD -4 are substantial, the American concept of disc mastering contrasts with that of Europe and Japan.
Outside the U.S., it is common practice for disc mastering to be done at the pressing location. The duplicating master is essentially surrendered to the disc cutting engineer, and it is his responsibili-
Gregory A. Bogantz, Member. Engineering Staff, RCA Records, Indianapolis, Ind., received the BSEE and MSEE from Purdue University in 1969 and 1970. Prior to coming to RCA, he was service manager of Production Audio Service in Lafayette, Indiana. He joined RCA in
1973 specializing in disc record technology, where he
does mastering of all new test and technical series records for RCA and custom clients. Mr. Bogantz is
currently concentrating on QuadraDisc cutting, processing, and playback and has authored several papers on these topics. He is a member of the Audio Engineering Society.
RCA Reprint RE- 22 -3 -1
Final manuscript received July 14, 1976
ty to cut a master as close to the tape as possible. There is little or no interaction of A &R people with the disc cutter; no "post -tape production" is practiced, so there are really no logistics problems with having disc mastering done at the press- ing facility.
There is also the further technical advan- tage of not having to transport cut lacquers great distances between cutting and pressing facilities which eliminates many sources of lacquer degradation. We know, for example, that lacquers may be damaged by exposure to temperature and pressure differentials, both of which are likely to be encountered in air shipments. All this means that in Europe and Japan there are relatively few disc transfer
Joseph F. Wells, Mgr., Quality Assurance and Electronic /Recording Development, RCA Records, In- dianapolis, Ind., graduated from Duke University with the BSEE in 1949, and attended the Technological Institute of Northwestern University. Upon graduation, he was employed by RCA Records as maintenance engineer and later as a recording engineer. In 1958, he
was appointed Manager, Recording- Chicago. Mr. Wells was instrumental in founding Midwest Section, Audio Engineering Society, and served as Central Vice Presi- dent in 1966; he was elected a Fellow in 1975. In 1972, Mr.
Wells was appointed Manager, Electronic and Recording Development in Indianapolis, and in 1976 was appointed to his present assignment where he is responsible for quality control and electronic and magnetic develop- ment for RCA's recording studios as well as record and recorded tape manufacturing operations. He is a
member of Tau Beta Pi and served on Panel 6 of National Quadraphonic Radio Committee. Mr. Wells is a member of Electronic Industries Association Panel on Records
and Phonographs and the Engineering Committee of the Recording Industry Association of America.
channels. They can be operated more efficiently by scheduling them for nearly continuous use. In view of this situation, JVC has taken a no- holds- barred ap- proach to their equipment design with cost and size of minimal importance, resulting in systems which have been rather cumbersome and understandable only by highly skilled cutting engineers specializing in CD -4 technology. And since their few CD -4 channels are scheduled for heavy use, there is no need to be able to use them for the other formats of full speed 33-1/ 3 and 45 rpm.
But technical advantages to the contrary, the American way of doing things just isn't the same. We regularly practice post - tape production and have our "favorite" disc cutters who can give us "just what we want off the ref," even if we didn't quite get it together on the tape we sent him. And then there's this incredible new sound we've just discovered that nobody is going to hear until we've got the shelves loaded with product -especially not that lathe jockey we tried last time who simply couldn't relate to what we wanted at all.
Anyway, our attitudes justify the ex- istence of many disc cutting facilities in the U.S., large and small. And a lot of good stuff is coming out of the smaller houses that just can't afford to tie up a lot of equipment and space for nothing but CD -4 cutting.
Design simplifications
The primary area of simplification centered on the fm modulation system required for the CD -4 carriers. A full technical description may be found in
Ref. 2. The basic concept is described - briefly on page 17.
There are some other areas where simplification was possible with less drastic design changes. Earlier hardware was built more or less to broadcast standards which involved 600 -ohm balanced lines running from one circuit area to another within a chassis as well as between chassis. This necessitated the use of many line amplifiers and other im- pedance matching devices such as transformers.
The Quadulator was conceived as a whole processor unto itself with only those interconnections and patch points necessary for interfacing with signal
13
www.americanradiohistory.com

sources and cutter amplifiers as well as
some user and service conveniences. Furthermore, the constant -voltage ap- proach was adopted for interfacing, allowing high impedance bridging -type inputs and low impedance outputs, both unbalanced. This is in keeping with newer studio equipment design philosophies embodied in noise reducers and equalisers. The simplification is signifi- cant in terms of elimination of interfacing transformers and line amps, which is
desirable since the unit is operated at half -speed meaning half -frequency. It was a fairly simple matter to achieve flat response. low phase shift, and low distor- tion all the way down to IO Hi with direct and R -C coupling where appropriate.
Aside from the modulator, the rest of the circuitry is relatively straightforward analog and was easily adaptable to operational amplifier techniques. This
allowed further size reduction since mul- tiple amplifiers could be obtained in a
single package.
Another area of simplification, affecting not only the modulation system but also the ancillary equipment, centers on the elimination of the automatic carrier level control (CLC). phis device automatically changes the level of the recorded carrier to accommodate possible carrier loss on play hack during a highly modulated part of the disc. To control this level, a second prey iew head was installed on the transfer tape machine. Additional playback elec- tronics were necessary to drive the CLC circuits in the modulation system.
An obvious alternative to this device is
simply to cut higher carrier level all the time. JVC chose to use the CLC because of concern for the high continuous power dissipation in the early cutting heads. There was also some concern that pickups would have trouble coping with this high level continuously. Listening tests con- vinced us that there was no problem with high carrier level as far as current pickups are concerned, and new cutters from both Neumann and Ortofon are capable of handling a higher continuous level than older designs. Helium cooling is required in either case. Elimination of the CLC saves circuitry in the cutting system and saves adding an additional head and playback electronics to the tape machine.
Another major simplification was to abandon the correlation of the baseband signals. Correlation (or tracing simula-
14
tion) involves predistorting the baseband signals to cancel later distortion incurred when the rounded playback stylus attempts to trace the waveform cut by the chisel- shaped cutting stylus. Theoretical- ly, baseband correlation is desirable and its effects are measurable. However, it is
less beneficial since the recent adoption of the Shibata -type playback stylus which introduces even less scanning loss than the elliptical stylus which was developed over ten years ago specifically to address the problem of tracing distortion.
The decision to eliminate the baseband correlator (J VC's Neutrex I)* was
reached after extensive listening tests with all sorts of material. We were not con- vinced the correlator was necessary and its exclusion meant a tremendous saving in circuitry and alignment time. Had we
included it, the Quadulator would probably be about 50% larger than its current size. Should the user desire this feature, however, it is available as an
outboard option and may be added with a
minimum of modification to the standard unit.
Interfacing simplifications and conveniences
In keeping with our goals of ease of interfacing and compatibility with ex- isting stereo cutting facilities, we wanted a minimum of modifications to be
necessary to ancillary equipment. To this end, we found it desirable to add some circuitry to the Quadulator which had not been previously employed. If an engineer is planning to use his stereo cutting channel for both stereo cutting at real - time and CD -4 cutting at half- speed, he's
not going to want to call in a maintenance man to swap equalizer boards in his
cutter amp and tape transfer deck, realign all the levels and equalization, and just generally waste a lot of time making the speed conversion. It would be nice if the CD -4 processor could be patched in just as if it were an equalizer or noise reducer.
To that end, the Quadulator contains a
conversion equalizer for the cutting amplifier we call the RIAA converter. ** Used in conjuction with the existing full - speed equalization in the owner's cutting
*Neutrex is an industry bull word for a pre- distortion correlation generator des eloped by JVC.
** I his relates to the Record Industry- Association al America
and National Association ul Broadcasters Standards for
cqualiintion.
amplifiers, this circuit allows the lathe to be operated at half speed.
Similarly, we have added an NAB converter ** to allow a conventional tape
machine to be operated at half speed with no modifications necessary to its regular full -speed electronics, provided they're already good at very low frequencies. A 15 and 7.5 in. / s tape deck can therefore be
used to transfer tapes recorded at 30 or 15
in./ s. Since there is a different conversion required for 30 in. /s tapes than for 15
in.; s, the NAB converter provides front - panel switch selection of either speed.
It is, of course, necessary to provide a
preview head on the tape machine and a
means of driving the variable pitch and depth controls on the lathe. No provisions are made in the Quadulator for these functions as disc -cutting facilities are already equipped with some means of control from their stereo equip- ment. It should be noted that the same
delay distance between preview head and program head is used in both half -speed
and real -time cutting, since both the tape
and disc are slowed by the same speed
ratio for low -speed operation.
Either of the RIAA and NAB converters can be easily switched off if the user
already has half -speed equalization available to him which he would rather use. The total speed conversion (tape and disc) was divided into the two sections to allow the flat signals coming from the
NAB converter to be processed by noise
reduction units which require nominally flat response at their inputs to track properly. Also, flat- response test signals
may be recorded by injecting them after the NAB converter but before the RIAA unit.
In keeping with our goal to make the
Quadulator as simple as possible, we have
chosen not to require lathe modifications for the operation of the carrier correla- tion unit (Neutrex). As already mentioned, it was decided to eliminate the
baseband correlator altogether, but carrier correlation was found to be
necessary. It is a simple device but it requires adjustment to the record diameter which is being cut.
This adjustment could be done automatically through some sort of coupling with the lathe, but in the interest of simplicity, we elected to leave it as a
manual control. This also gives the
www.americanradiohistory.com

0
Fig. la - Quadulator front view.
cutting engineer some additional freedom if he cares to experiment with different settings on certain types of program material. The action of the circuit will be
described later.
Ease of operation and service aids
A glance at the front panel of the Quadulator (Fig. 1) will reveal that there isn't an abundance of knobs. In fact, it
has only 28 controls not including several calibration trimmers which are used only for initial setup. That's about the same number of knobs and switches typically found on a stereo set of parametric equalizers, for example. Some may find that frustrating and others consider it a
relief, depending on one's inclination toward knob -twisting. If your're feeling intimidated, take comfort in the fact that one of the those 28 is merely a power switch and won't require your undivided attention as you cut a side. If you like the hands -on approach better, the jack hay may be used to patch in all manner of external limiters, equalizers, or whatever.
The jack bay is included largely as a
service aid to enable isolation of several modules of the unit, but it also allows the built -in three -hand limiters to be by- passed or patched into the sum and difference channels instead of the program inputs where they are normally connected. Also, system inputs and out- puts appear at the jack bay as well as on the rear panel (as XLR connectors) for increased hook -up flexibility.
1=7 .aa a ..E «o,.,.c
Fig. lb - Rear view. Rear connectors provide inputs from tape machine, outputs to
cutter amps, and interfacing with outboard equalizers and noise reducers.
Considerable size and cost reduction was
achieved by having the four panel meters on the main control module (Audio Level
Control module) serve triple duty. The three pushbuttons in the lower left corner switch the meters to read either program input levels, carrier amplitudes and Neutrex levels, or sum and difference levels.
The program input function is most useful for setting playback levels and equalization adjustments of the tape machine. It reads levels after the NAB converter, allowing the tape EQ to be set for flat response as read on these meters, since the tape machine's own meters will
not be properly calibrated for half -speed operation.
I he carrier amplitude and Neutrex cor- rection signal level indications are mostly for initial setup purposes, but the carrier levels may he monitored while cutting if
the operator wishes to manually ride them for a possible performance im- provement on some material.
the sum and difference level indicators arc most useful during cutting to monitor the limits of modulation. As the operator becomes familiar with the unit, he will
note that a tradeoff can be made of baseband level versus carrier modulation for cleanest performance. Modulation limits may be dictated by haseband levels alone if the program has little front -hack separation. Conversely, if the program has a lot of difference information due to a "super- quady" mix or there are more subtle causes such as a reverb delay or
phaser use, the modulation limits may be
mostly a function of the carrier modula- tion level. These differences are hard to detect by merely watching the program levels. The difference meters are also useful for optimizing azimuth adjustment of the tape machine during setup of a new tape. Minimizing the difference readings assures the best azimuth adjustment for transfer.
Ease of maintenance has been con- sidered, too. The unit is completely modularized, and any module may be operated outside the rack by the use of extender cards. The internal controls never need to be touched unless a part is
replaced or the unit is interfaced with a
different cutting channel. Almost all the active devices in the Quadulator are plugged into sockets for ease of troubleshooting and repair.
Probably the most time -consuming part of setting up a CD-.4 modulation system in the past has been the adjustment of the hasehand delay time and the optimiza- tion of the Neutrex circuitry. These problems art addressed in the Quadulator by simply making the delay time easily changeable in small in- crements. This is accomplished by mov- ing a tap point to the appropriate position on the delay line. The delayed input to the Neutrex is adjusted in the same way.
Determination of the correct operating points is accomplished by the cut -and -try method. Test cuts are made and com- pared to a standard test record. A
15
www.americanradiohistory.com
modified demodulator is used to feed a dual -trace oscilloscope and level meters. The scope gives a sufficiently accurate indication of the delay of the baseband signal (trace A) in relation to the retrieved carrier modulation (trace B). Adjustment is usually only a matter of a few hours and never needs to be repeated unless the cutter head or amplifier is changed.
Neutrex is optimized in the same way, through cutting and trying. This method is based on the rather unscientific, but very practical. attitude of "it's right if it
sounds right" a philosophy not altogether new to the recording industry. High quality playback gear is used both to measure the Neutrex action and to evaluate it subjectively.
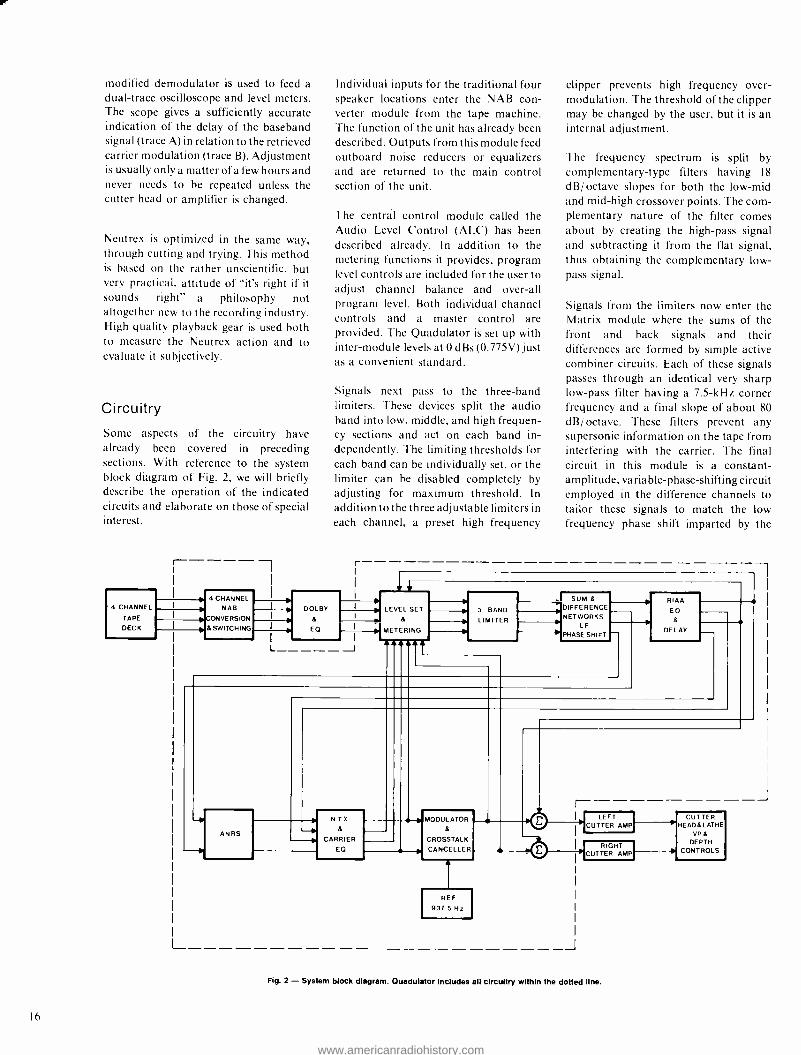
Circuitry
Some aspects of the circuitry have already been covered in preceding sections. With reference to the system block diagram of Fig. 2, we will briefly describe the operation of the indicated circuits and elaborate on those of special interest.
4 CHANNEL
TAPE
DECK
16
Individual inputs for the traditional four speaker locations enter the NAB con- verter module from the tape machine. The function of the unit has already been described. Outputs from this module feed outboard noise reducers or equalizers and are returned to the main control section of the unit.
The central control module called the Audio Level Control (ALC) has been described already. In addition to the metering functions it provides, program level controls are included for the user to adjust channel balance and over -all program level. Both individual channel controls and a master control are provided. The Quadulator is set up with inter -module levels at 0 dBs (0.775V) just as a convenient standard.
Signals next pass to the three -band limiters. These devices split the audio band into low, middle, and high frequen- cy sections and act on each band in- dependently. The limiting thresholds for each band can be individually set, or the limiter can be disabled completely by adjusting for maximum threshold. In addition to the three adjustable limiters in each channel, a preset high frequency
clipper prevents high frequency over - modulation. The threshold of the clipper may be changed by the user, but it is an internal adjustment.
The frequency spectrum is split by complementary -type filters having 18
dB/ octave slopes for both the low -mid and mid -high crossover points. The com- plementary nature of the filter comes about by creating the high -pass signal and subtracting it from the flat signal, thus obtaining the complementary low - pass signal.
Signals from the limiters now enter the Matrix module where the sums of the front and back signals and their differences are formed by simple active combiner circuits. Each of these signals passes through an identical very sharp low -pass filter having a 7.5 -kHz corner frequency and a final slope of about 80 dB/ octave. These filters prevent any supersonic information on the tape from interfering with the carrier. The final circuit in this module is a constant - amplitude, variable- phase- shifting circuit employed in the difference channels to tailor these signals to match the low frequency phase shift imparted by the
- 4 CHANNEL I NAB
ON VE RS ION I &SWITCHING
DOLBY
EO
LEVEL SET 8
MET R NG
3 -BAND LIMITER
SUM 8 bIFFE RENCE
NETWORKS LF
PHASE SHIFT
ANRS
RIAA
EO
DELAY
REF
937.5 Hz
J
Fig. 2 - System block diagram. Quadulator includes all circuitry within the dotted line.
CUTTER HEADS LATHE
VP& DEPTH
CONTROLS
www.americanradiohistory.com

cutter head to the baseband signals. This maintains good low frequency separa- tion. Switches are provided for turning off the sum and difference signals.
The sum signals now go to the RIAA Converter module where theyare proper- ly equalized for interfacing with the full - speed equalization in the user's cutter amplifier. This pre -equalization may be
optionally switched off. A delay line is
provided for the baseband signals to compensate for the time lag the difference signals experience through the recording and playback chain.' Time delay may be
incremented in 8 -µs steps. Front panel calibration controls are provided for adjusting the baseband levels to match the stereo cutting chain.
The difference signals from the Matrix module are routed next to the Automatic Noise Reduction System (AN RS) modules where upward compression is
performed on them as required by in- dustrystandard. The AN RS is similar to Dolby 'noise reduction encoding as it requires adjustment to a certain operating level and has a predetermined dynamic tracking characteristic. There is
an active midrange band and an active high frequency band. The low frequencies are left unaltered. A complete description of the system is given in Ref. 6. The AN RS units may be switched off for test
purposes.
The difference signals now enter the Neutrex (NTX) module where they are combined with a correction signal derived from the sum channels. Another set of taps on the delay line in the RIAA module feed these sum signals into the Neutrex unit. Operation of this device can be understood by referring to Fig. 3.
The figure illustrates a playback stylus at several positions on a groove wall which contains a low -frequency signal (hase- band) and a superimposed high frequen- cy signal (carrier).
Two phenomena may be noticed from this diagram. One is that the curvature of the carrier waveform is on the same order as that of the stylus. This leads to severe
tracing distortion, resulting in a retrieved carrier waveform that is hardly sinus- oidal. But since the carrier is frequency modulated, its information does not de- pend on its waveform, merely its frequen- cy, so this tracing distortion is of little concern. However, another effect can also be seen. Since the playback stylus is
STY S TP
\--GROOVE WAL
Fig. 3 - Graphical representation of angle modulation of carrier by baseband signal during playback. Distortion is correctable with Neutrex. Note that, at points B and D, the stylus tip is tangent to direction of record motion and the retrieved carrieris in sync with the baseband as it was cut. At points A and C, however, the carrier is being angle modulated around the curvature of the playback stylus due to the slope of the baseband signal.
Phase -locked -loop modulation scheme
Unlike the conventional serrasoid modulators used in early JVC designs, the Quadulator employs a modified phase -locked loop (PLL) circuit in which two VCOs are referenced to a master oscillator and allowed to be individually modulated by mixing audio with the error -signal voltage applied to the VCOs. This seeming contradiction is possible by making the natural frequency of the loops lower than the lowest desired modulating frequency.
The purpose in synchronizing the two oscillators at all is to eliminate the annoying heterodyning which is heard if the two carriers are not matched in the absence of modulation. The interference is a problem due to imperfect cutter heads and pickups which have insufficient left -to -right separation at the carrier frequencies. The resultant mixing of carriers is akin to co- channel interference or multipath reception in fm broadcasting and produces a similarly annoying distortion.
REF SIG GEN
TO OTHER
CHANNEL
I
PHASE COMPAR
ATOR
LOOP FILTER
FREQ DIVIDER
N
ERROR SIG. AMP
VCO
MODULATED 1 CARRIER
Referring to the PLL modulator diagram, the 1/N divider in the feedback line from the VCO allows the system to be implemented with existing hardware. By dividing the carrier frequency, the VCO's deviation is also divided. N is chosen sufficiently large that for a given maximum desired deviation of the VCO, the phases of the two inputs tò the phase comparator will remain within the useful range of that device. This assures that the system will remain phase -locked at all times. Then, in the absence of a modulating signal, the two carriers will quickly return to phase lock with the stable reference and, therefore, be synchronized with themselves.
17
www.americanradiohistory.com

not the same shape as the cutting stylus, the carrier wavefronts contact the stylus at different places. At points B and D representing the peak and trough of the lower frequency, the contact point on the stylus is directly tangential to the motion of the disc as was the case when the cutting stylus inscribed the waveform. But at points A and C where the stylus is
riding along a side of the larger waveform, the carrier wavefronts tend to impinge at different points on the playback stylus which are not tangential to the direction of record motion. This means that the carrier is not being retrieved in the same synchronism with the baseband as it was cut. In fact, the carrier is being angle- modulated around the curvature of the playback stylus due to the slope of the baseband signal. Since the carrier is 1'm, this angle modulation can he looked upon as crosstalk (up talk) from the baseband. As such, it represents distortion of the carrier information and is undesirable.
Now that this mechanism is understood, the solution to the problem is rather simple. If a sample of the baseband information were appropriately delayed in time and equalized to complement this tracing- induced angle modulation, this sample could be added to the carrier modulation so as to counteract the trac- ing distortion. This is just what the Neutrex does.
Proper Neutrex delay time depends on the cutter head and amplifier and must be
adjusted when the Quadulator is installed as explained earlier. The need for com- pensation increases with signal frequen- cy, requiring about a 6 dB, octave boost. The amount of up talk is a function of the retrieved wavelengths seen by the stylus, so it depends on the record diameter as
well as the frequency of the baseband signal. It is necessary to increase the compensation as diameter decreases. This is accomplished with the front -panel Diameter control which is used to manually increment the compensation with each inch of diameter change.
Also included in the Neutrex module is
the fm -pm -fm equalizer necessary for properly preemphasizing the carrier modulation to conform with published standards.
The last module is the Modulator (Fig. 4).
The difference signals enter from the
18
Fig. 4 - Inside view of modulator. Notice large degree of circuitry integration. Reference oscillator is
lower right quarter of board.
Neutrex and are used to modulate the I5- kHz carriers for the left and right channels as explained earlier. A full explanation of the operation of this unit is given in Ref. 2. This reference describes the PLL modulation principle particular- ly as it is applied to the JVC Mark Ill modulation system. The circuit used in the Quadulator differs from the system described in the reference by doing away with the bandpass filter JVC uses
between the VCO output and the phase detector input. It was found experimen- tally that this filter contributed nothing audible to the performance of the circuit and so was omitted for simplicity.
Also included in the modulator module is
a carrier crosstalk -canceller (CTC) cir- cuit. This is a sort of "band -aid" for the cutter head to improve the cutter's in- herent left -right separation at very high frequencies. Separation between carriers is important because lack of it can cause Type Il distortion as explained earlier. The CTC takes a sample of the left carrier signal, shifts it in phase anywhere over a
±180° range and injects it into the right channel output in an attempt to cancel the crosstalk in the cutter head. A similar circuit injects some of the right carrier into the left channel. These circuits obviously must be matched to the cutter head and have to be adjusted when the unit is installed. The adjustments are very difficult and, thankfully, are becoming much less necessary with the introduction of better cutter heads.
The final circuit in the module is the
active mixer. This combines the carrier, CTC signal, and baseband information from the delay line to form the compositie output used to drive the cutter amplifier. The module contains a front -panel detented control for manual adjustment of the carrier amplitude. Also included are trimmers for calibration of the nor-
mal carrier level and calibration of the composite output for proper interfacing with the user's cutting amplifiers.
Conclusions
I he RCA Quadulator converts four in- dependent channels of audio information from a tape machine into the format nec- essary to drive a normal stereo disc - cutting channel for the recording of CD -4 records. We believe it is a substantial simplification over previously available equipment in terms of circuitry, inter- facing, operation, and serviceability. It is
unquestionably more compact. We have taken special care to assure that this simplification has not resulted in any audible performance sacrifices. The con- cept of simplicity extends even to the unit's name. Tired of calling the thing a
QuadraDisc Modulation System, we
contracted that to Quadulator. As a
happy consequence of the lack of com- plexity, the unit's cost has been simplified as well.
References
I. Inoue. I: l akahashi. N., and Owaki. I: "A Discrete Four - (houncl Disc and Its Reproducing System," J. u( Audio Engineering Sm... Vol. 19. No. 7 (Jul -Aug 1971) pp. 576- 583.
2. Ishigaki. Y. Fukui. K.: and Boganti. G.: "New Modulation technique for CD-4 Recording :' J. of Audi Engineering .Sur.. Vol. 24. No. 2 (Mar 1976) pp. 112 -116.
3. Owaki, 1.: Muraoka. i.; and Inoue. T.; "Further Im- pro\ements in the Discrete Four -Channel Disc System CD- 4." ./. u/ Audiu Engineering Soc.. Vol. 20. No. 7 (Jun 1972)
pp. 361 -369.
4. Inoue. I.: Owaki. I.: Ishigaki, Y. :and Goh, K.:"Hall -Speed Cutting of C'I)-4 and Other Improvements :' J. of Audio Engineering Soc., Vol. 21. No. 8 (Oct 1973) pp. 625 -629.
5, Kakuhun. Y.: Muramoto. S.: and Eargle. J.M.:' The CD-4 Mark II Modulation S stern.- J. of Audio Engineering .Sur.. Vol. 22. No. 6 (.Iul -Aug 1974) pp. 416 -421.
6. Muraoka. 1. and Inoue. I .: "Noise Reduction in the CD-4 System." J. of Audio Engineering Soc., Vol. 3 (Mar 1975)
pp. 113 -122.
7."Standards for Quadraphonic Disc Records :' Record Industry Association of America. Inc. (Sep 12, 1973) Bulletin No. F7.
s. "Standards for Reproducing Discrete Four -Signal Disc Records :' Electronic Industries Association Standard No. RS-425 (Sep 1975).
www.americanradiohistory.com

Polymer science - new materials for phonograph discs
S.K. Khanna
Samson Kumar Khanna. Senior Rheologist, RCA
Records, Indianapolis, Ind., graduated from Punjab
University in India and received the B. Sc. with honours in Chemical Technology from Borough Polytechnic in
England. He carried out post -graduate research for the MS in polymer rheology at Cranfield Institute of Technology in England. He was a material scientist with Associated Electrical Industries. Research Center. in the
United Kingdom and was senior engineer in the Technical Development Department with Gulf Oil
(Canada) Chemical Division. He is now engaged in
rheological research on vinyl resins. compounds and modified styrenes for RCA Records. He is also active in
the development work for materials for the RCA Records. International Division. He has published various papers on polymers and melt rheology and holds two patents.
Reprint RE- 22 -3 -2 Final manuscript received July 6, 1976
Polymer rheology studies have resulted in lighter, stronger, more flexible materials for
phonograph discs and have aided our understanding of such F -oblems as improper molding. warpage of discs, wear life of the discs, and pressing cycle times.
R f I EOLOGY is the study of deforma- tion and flow of materials. The develop- ment of melt flow data provides a positive means for understanding and predicting processing properties. In the following discussion, the case of compression molding of phonograph discs (in stereo
and CD -4 quad) will be examined where
rheological techniques have been applied to the process and product design problems.
Recent literature1 1° indicates that much effort has been spent in the analysis of resins. Though PVC and copolymers of vinyl chloride -vinyl acetate are extensive- ly used. information on the application of melt flow data in compounding is not widely published. The compounding of vinyl compound formulations to a great extent is treated more as "art" than science. This is particularly true in the phonograph record molding industry.
To understand the basic problems and to reduce the inefficiency in the compounds, we investigate rheological properties as
related to process parameters. Generical- ly, such properties and relationships are:
I) Polymer properties
2)Compound additives and modifiers
3) Process variables (including shear and heat history)
The rheological parameters are used to scientifically develop compounds for disc molding processes. The experimental in- vestigations described in this paper show the flow measurement techniques used in
understanding the materials and the
processes needed to develop an ideal compound.
Experimental investigations
The equipment used in measuring rheological properties were:
Instron capillary rheometer
Weissenberg rheogoniometer
Mechanical spectrometer
Rhcovibron
The melt viscosities of the compounds were measured with the Instron. Weissenberg. and Mechanical spec-
trometer devices over the range of temperatures which related to the nature
of the compound and the fabrication processes. The Rabinowitsch and Bagley
corrections were not applied, since they
are small for polyvinyl chloride.' (The methods used for determining the melt
viscosity and melt elasticity are described
in Refs. II, 12, and 13).
The dynamic tests were made by using a
Rheovibron, applying the techniques given in Ref. 14.
Compounds for stereo and CD -4 discs
At present, vinyl chloride acetate
copolymers are the most widely used
materials for phonograph record press-
ing. The acetate makes the resin softer and, therefore, acts as an internal plasticizer. Different copolymer acetate
levels are used by record companies according to their processing conditions. In the record industry, blends of two copolymers of different molecular weight
are commonly used along with acetate or P.V.C. homopolymer with acetate
copolymers. Such polymer combinations assist in the control of "anfill" (molding voids) though usually at some penalty to sound quality (signal -to -noise ratio). What actually happens in this process
was not clearly known.
The melt flow properties of a 15% acetate
copolymer were measured by using a
19
www.americanradiohistory.com
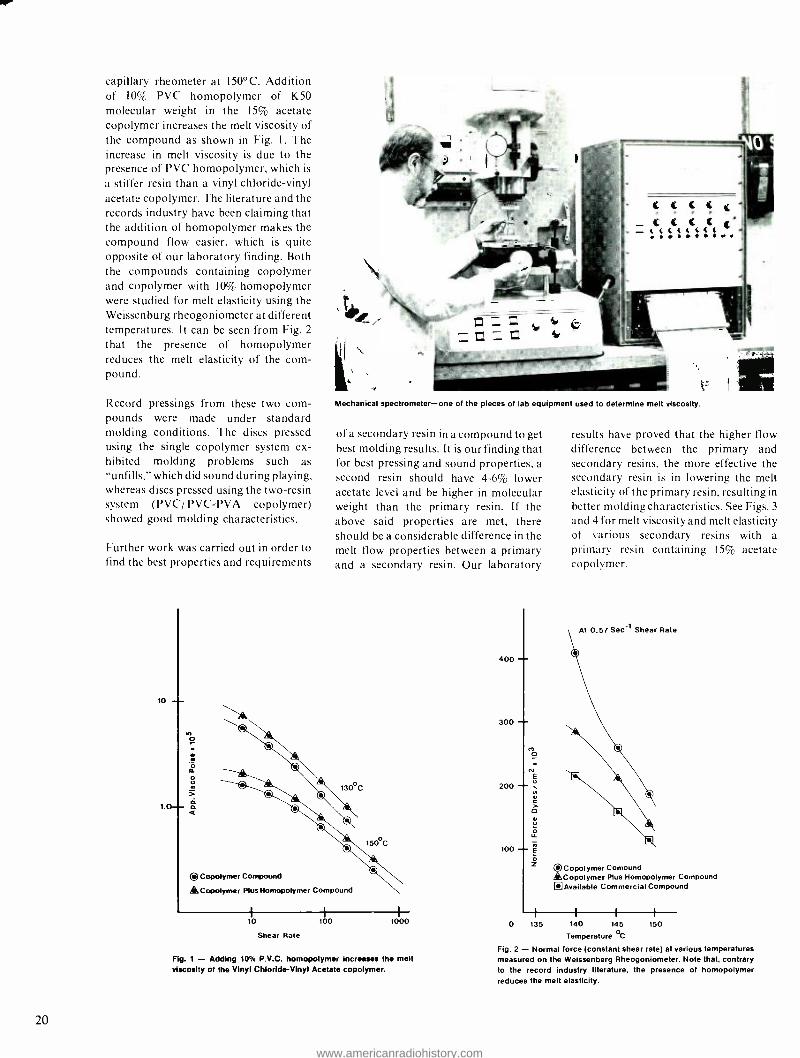
capillary rheometer at 150°C. Addition of 10% PVC homopolymer of K50 molecular weight in the 15% acetate copolymer increases the melt viscosity of the compound as shown in Fig. I. The increase in melt viscosity is due to the presence of PVC homopolymer, which is
a stiffer resin than a vinyl chloride -vinyl acetate copolymer. The literature and the records industry have been claiming that the addition of homopolymer makes the compound flow easier, which is quite opposite of our laboratory finding. Both the compounds containing copolymer and copolymer with 10% homopolymer were studied for melt elasticity using the Weissenburg rheogoniometer at different temperatures. It can be seen from Fig. 2
that the presence of homopolymer reduces the melt elasticity of the com- pound.
Record pressings from these two com- pounds were made under standard molding conditions. The discs pressed using the single copolymer system ex- hibited molding problems such as "unfïlls," which did sound during playing, whereas discs pressed using the two -resin system (PVC/ PVC -PVA copolymer) showed good molding characteristics.
Further work was carried out in order to find the best properties and requirements
10
1.0
20
Mechanical spectrometer -one of the pieces of lab equipment used to determine melt viscosity.
of a secondary resin in a compound to get best molding results. It is our finding that for best pressing and sound properties, a second resin should have 4 -6% lower acetate level and be higher in molecular weight than the primary resin. If the above said properties are met, there should be a considerable difference in the melt flow properties between a primary and a secondary resin. Our laboratory
*Copolymer Compound
®Copolymer Plus Homopolymer Compound
10
Shear Rate
100 1000
Fig. 1 - Adding 10% P.V.C. homopolymer increases the melt viscosity of the Vinyl Chloride -Vinyl Acetate copolymer.
400 --
300 - Ó
E
200 ^- m
O m iJ
0 LL
100- ö z
results have proved that the higher flow difference between the primary and secondary resins, the more effective the secondary resin is in lowering the melt elasticity of the primary resin, resulting in better molding characteristics. See Figs. 3
and 4 for melt viscosity and melt elasticity of various secondary resins with a primary resin containing 15% acetate copolymer.
At 0.57 Sec-1 Shear Rate
*Copolymer Comound ®Copolymer Plus Homopolymer Compound I] Available Commercial Compound
O 135 140 145 150
Temperature °C
Fig. 2 - Normal force (constant shear rate) at various temperatures measured on the Weissenberg Rheogoniometer. Note that, contrary to the record industry literature, the presence of homopolymer reduces the melt elasticity.
www.americanradiohistory.com
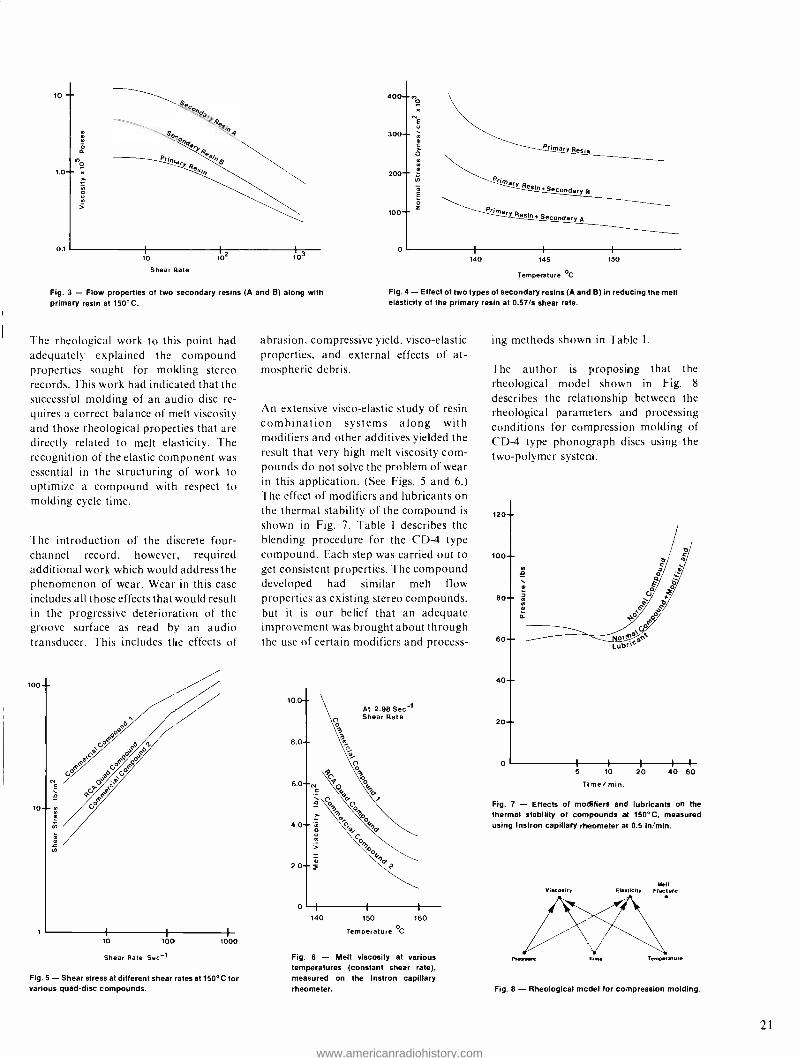
10
1.0
0
P\nrar q
H,
8
A
e
10
Shear Rate
102 103
Fig. 3 - Flow properties of two secondary resins (A and B) along with primary resin at 150° C.
The rheological work to this point had adequately explained the compound properties sought for molding stereo records. This work had indicated that the successful molding of an audio disc re- quires a correct balance of melt viscosity and those rheological properties that are directly related to melt elasticity. The recognition of the elastic component was essential in the structuring of work to optimize a compound with respect to molding cycle time.
The introduction of the discrete four - channel record, however, required additional work which would address the phenomenon of wear. Wear in this case includes all those effects that would result in the progressive deterioration of the groove surface as read by an audio transducer. This includes the effects of
loo
lo c
I I
10 100 10I 00
Shear Rate Sec -1
Fig. 5 - Shear stress at different shear rates at 150°C for various quad -disc compounds.
400- r, o
E
i
300-
200-
100-
Primar
Primary Resi.
Resin Secondary B
Primary Resini Secondary A
140 145 150
Temperature °C
Fig. 4 - Effect of two types of secondary resins (A and B) in reducing the melt elasticity of the primary resin at 0.57 /s shear rate.
abrasion, compressive yield, visco- elastic properties, and external effects of at- mospheric debris.
An extensive visco- elastic study of resin combination systems along with modifiers and other additives yielded the result that very high melt viscosity com- pounds do not solve the problem of wear in this application. (See Figs. 5 and 6.) The effect of modifiers and lubricants on the thermal stability of the compound is
shown in Fig. 7. Table I describes the blending procedure for the CD-4 type compound. Each step was carried out to get consistent properties. The compound developed had similar melt flow properties as existing stereo compounds, but it is our belief that an adequate improvement was brought about through the use of certain modifiers and process-
10.0-
8.0-
6.0-N c
á
4.0- -m
o
0
>
m
co
a.
At 2.98 Sec -I Shear Rate
oy
co
140 150
Temperature oC
160
Fig. 6 - Melt viscosity at various temperatures (constant shear rate), measured on the Instron capillary rheometer.
ing methods shown in Table I.
The author is proposing that the rheological model shown in Fig. 8
describes the relatiionship between the rheological parameters and processing conditions for compression molding of CD -4 type phonograph discs using the two -polymer system.
120-
100-
á
80-
ñ
60-
40-
20-
I I I 5 10 20
Time/ min.
I I
40 60
Fig. 7 - Effects of modifiers and lubricants on the thermal stability of compounds at 150 °C, measured using Instron capillary rheometer at 0.5 in /min.
Pressure
Melt Yiscositr Elasticity Fracture
Fig. 8 - Rheological mcdel for compression molding.
21
www.americanradiohistory.com
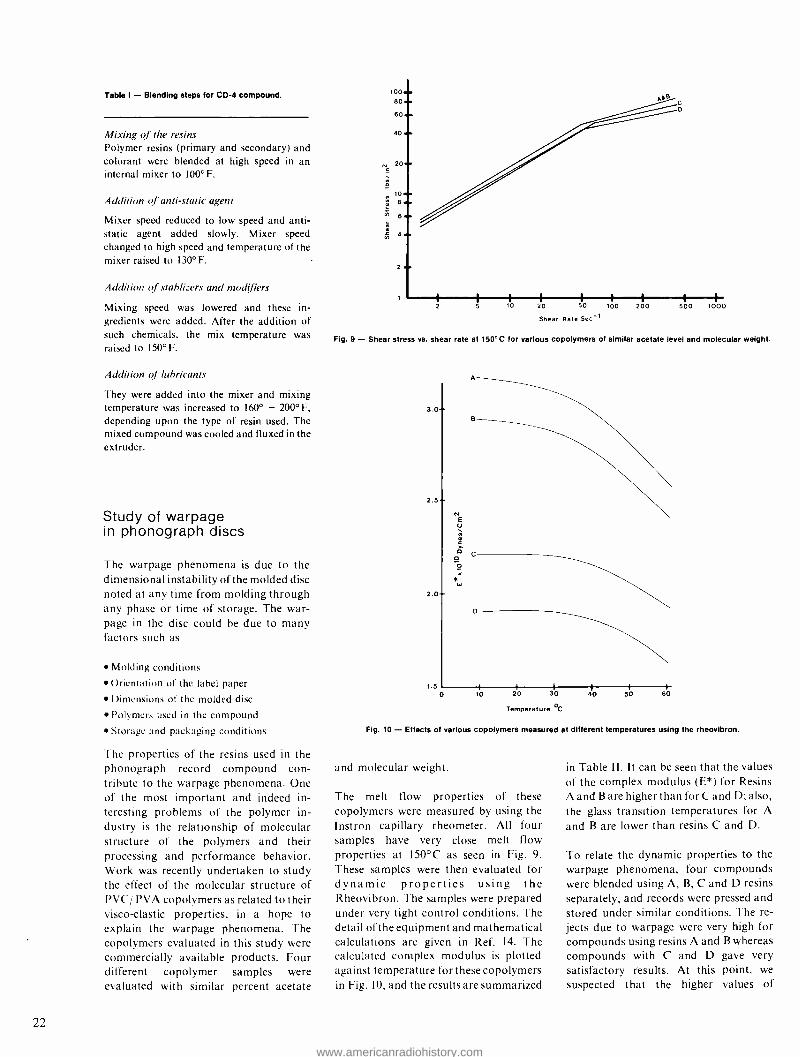
Table I - Blending steps for CD -4 compound.
Mixing of the resins Polymer resins (primary and secondary) and colorant were blended at high speed in an internal mixer to I00 °F.
Addition of anti- static agent
Mixer speed reduced to low speed and anti- static agent added slowly. Mixer speed changed to high speed and temperature of the mixer raised to 130° F.
Addition of stablizers and modifiers
Mixing speed was lowered and these in- gredients were added. After the addition of such chemicals, the mix temperature was raised to 150°F.
Addition of lubricants
They were added into the mixer and mixing temperature was increased to 160° - 200° F,
depending upon the type of resin used. The mixed compound was cooled and fluxed in the extruder.
Study of warpage in phonograph discs
The warpage phenomena is due to the dimensional instability of the molded disc noted at any time from molding through any phase or time of storage. The war- page in the disc could be due to many factors such as
Molding conditions
Orientation of the label paper
Dimensions of the molded disc
Polymers used in the compound
Storage and packaging conditions
The properties of the resins used in the phonograph record compound con- tribute to the warpage phenomena. One of the most important and indeed in- teresting problems of the polymer in- dustry is the relationship of molecular structure of the polymers and their processing and performance behavior. Work was recently undertaken to study the effect of the molecular structure of PVC/ PVA copolymers as related to their visco- elastic properties, in a hope to explain the warpage phenomena. The copolymers evaluated in this study were commercially available products. Four different copolymer samples were evaluated with similar percent acetate
22
100
60
40
rv 20-
1o 8 .1.
6
4-
2
2 1 I I 1 1
10 20 50 100 200
Shear Rate Sec
o
1 I
500 1000
Fig. 9 - Shear stress vs. shear rate at 150"C for various copolymers of similar acetate level and molecular weight.
A --
e -
3.0
2 5
2.0
1 s
U
° e-
D
0 10 20 30
Temperature °C
40 50 60
Fig. 10 - Effects of various copolymers measured at different temperatures using the rheovibron.
and molecular weight.
The melt flow properties of these copolymers were measured by using the Instron capillary rheometer. All four samples have very close melt flow properties at 150 °C as seen in Fig. 9.
These samples were then evaluated for dynamic properties using the Rheovibron. The samples were prepared under very tight control conditions. The detail of the equipment and mathematical calculations are given in Ref. 14. The calculated complex modulus is plotted against temperature for these copolymers in Fig. 10, and the results are summarized
in Table 11. It can be seen that the values of the complex modulus (E *) for Resins A and B are higher than for C and D; also, the glass transition temperatures for A
and B are lower than resins C and D.
To relate the dynamic properties to the warpage phenomena, four compounds were blended using A, B, C and D resins separately, and records were pressed and stored under similar conditions. The re-
jects due to warpage were very high for compounds using resins A and B whereas compounds with C and D gave very satisfactory results. At this point, we
suspected that the higher values of
www.americanradiohistory.com
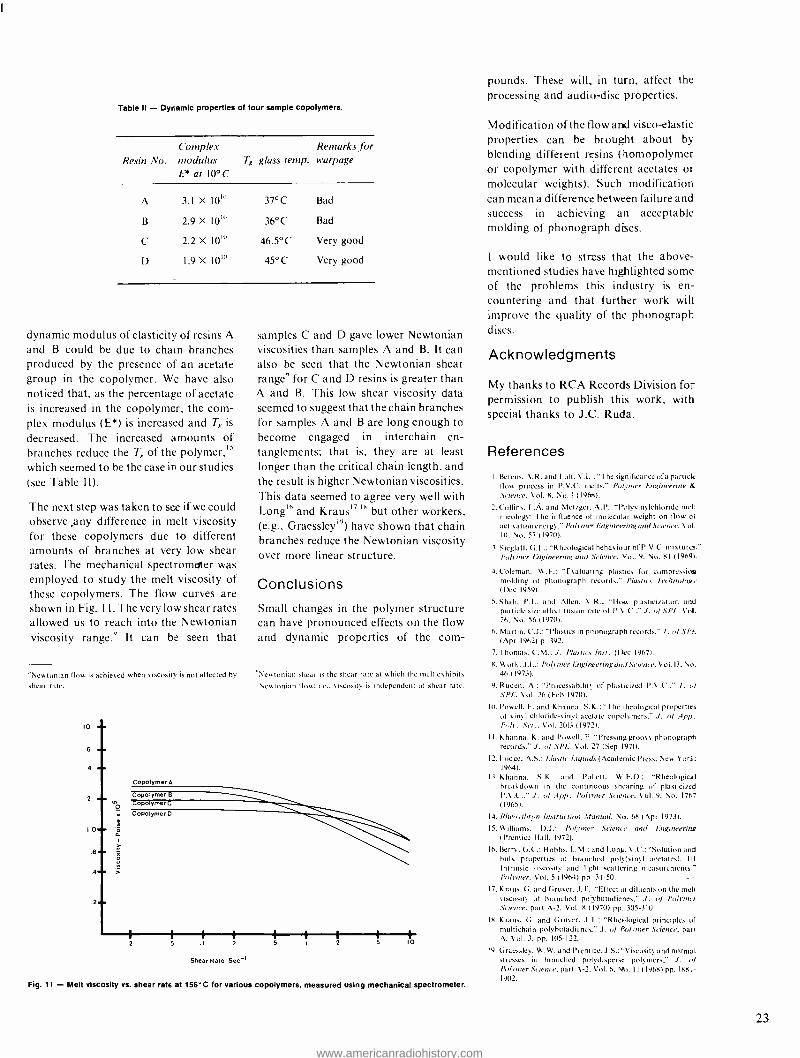
Table II - Dynamic properties of four sample copolymers.
Comple.r Remarks for Resin No. modulus TR glass temp. warpage
E at 10°C
A 3.1 x 10"' 37°C Bad
B 2.9 X 10¹⁰ 36°C Bad
C 2.2 X 10¹⁰ 46.5°C Very good
U 1.9 X IO"' 45°C Very good
dynamic modulus of elasticity of resins A
and B could be due to chain branches produced by the presence of an acetate group in the copolymer. We have also noticed that, as the percentage of acetate is increased in the copolymer, the com- plex modulus (E *) is increased and Tx is
decreased. The increased amounts of branches reduce the Tg of the polymer," which seemed to be the case in our studies (see Table II).
The next step was taken to see if we could observe any difference in melt viscosity for these copolymers due to different amounts of branches at very low shear rates. The mechanical spectrometer was employed to study the melt viscosity of these copolymers. The flow curves are shown in Fig. 1 I . The very low shear rates allowed us to reach into the Newtonian viscosity range.° It can be seen that
"Newtonian flow is achieved when viscosity is not affected by
shear rate.
10 em
6 mee
4
2
o
1.0e .o
a
6 Aem ï
CopolymerA
opolymer poymerC
Copolymer D
samples C and D gave lower Newtonian viscosities than samples A and B. It can also be seen that the Newtonian shear rangeh for C and D resins is greater than A and B. This low shear viscosity data seemed to suggest that the chain branches for samples A and B are long enough to become engaged in interchain en- tanglements; that is, they are at least longer than the critical chain length, and the result is higher Newtonian viscosities. This data seemed to agree very well with Long16 and Kraus17'" but other workers, (e.g., Graessley19) have shown that chain branches reduce the Newtonian viscosity over more linear structure.
Conclusions
Small changes in the polymer structure can have pronounced effects on the flow and dynamic properties of the com-
'Newtonian shear is the shear rate at which the melt exhibits
Newtonian Ilow; i.e., viscosity is independent of shear rate.
2 5 2
Shear Rate Sec-1
5 2 5 10
Fig. 11 - Melt viscosity vs. shear rate at 156 C for various copolymers, measured using mechanical spectrometer.
pounds. These will, in turn, affect the processing and audio -disc properties.
Modification of the flow and visco- elastic properties can be brought about by
blending different resins (homopolymer or copolymer with different acetates or molecular weights). Such modification can mean a difference between failure and success in achieving an acceptable molding of phonograph discs.
I would like to stress that the above - mentioned studies have highlighted some of the problems this industry is en- countering and that further work will
improve the quality of the phonograph discs.
Acknowledgments
My thanks to RCA Records Division for permission to publish this work, with special thanks to J.C. Ruda.
References
I. Bercno. \.R. and Folt. V.I. :" fhe significance of a particle flow process in P.V.C. melts," Polymer Engineering & .Science. Vol. 8, No. I (1468).
2. Collins. E.À. and Metzger. A.P.: "Polyvinylchloride melt rheology: The influence of molecular weight on flow of activation energy." Puhmer Engineering and Science. Vol. Il). No. 57 (1970).
3. Sieglaff, (ì.L.; "Rheological behaviour of P.V.C. mixtures," Polymer Engineering anti Science. Vol. 9, No. 81 ( 1969).
4. Coleman. W.E.: "Evaluating plastics for compression molding of phonograph records." Plastics Ter /vudugy (Dec 1959).
5. Shah, P.L. and Allen, V.R.; "Hies plasticization amt particle size affect fusion rate of P.V.C'.," J. u(SPE. Vol. 26, No. 56 (1970).
6. Martin. C'.J.: "Plastics in phonograph records," J. u/ .S PE (Apr 1962) p. 392.
7. lhomas. C.M.; J. PlasNrs Inst. (Dec 1967).
8. Work. J.)..: Pulrmer Engineering and Science. Vol. 13, No. 46(1973).
9. Ruden. A.: "Prucessabilit' of plasticized P.V.C.." J. u/ SPE. Vol. 26 (Feb 1970).
Ill. Powell, E. and Khanna. S.K.: The theological properties o) vinyl chloride -vinyl acetate copolymers.' J. if App. Pull'. Sri.. Vol. 2013 11972).
I I. Khanna. K. and Powell. E. "Pressing groovy phonograph records. J. of ATE, Vol. 27 (Sep 1171).
12. Lodge, A.S.: Elastic liquids (Academic l'ress: New York; 1964).
13. Khanna. S. K. and Pallett, W.F.O.; "Rheological breakdown in the continuous shearing of plasticized P.V.C.." J. uf App. Palmer Science, Vol. 9. No. 1767 (1965).
14. Rlreuvihrpn In.wrucfivn Manual, No. 68 (Apr 1973).
15. Williams, D.J.; Polymer Silence and Engineering 1 Prentice -Hall. 1972).
16. Berry, G.C'.; Hobbs. L.M.; and Long. V.C.: "Solution and hulk properties of branched polyy(vinyl acetates). IVI
Intrinsic viscosity and light scattering measurements.' Polymer. Vol. 5 (1964) pp 31 -50. -
17. Kraus. G. and (iruver..1.T., "Effect of diluents on the melt viscosity of branched p :Nbutadienes,' J. o/ Polymer Science. part A -2. Vol. x ( 1970) pp. 305 -310.
18. Kraus. G. and Gruver. J.l.; "Rheological principles or multichain polybutadienex,' J. of Polymer Science. part A. Vol. 3. pp. 105 -122.
19. (iraessle_v. W.W. and Prentice, J. S.; "Viscosity and normal stresses in branched palydisperse polymers. J. of Polymer Science, part A-2. Vol. 6. Mo. I I (1968) pp. 1887- 1902.
23
www.americanradiohistory.com

Molding records automatically J.C. Ruda
Record molding has come a long way from the early days of "muscle power;" the fully - automatic presses in use today can produce a high -quality 12 -inch record every twenty seconds.
THE BASIC METHOD used to mold phonograph records has not changed since the founders of the Victor Talking Machine Co. started molding discs around the turn of the century. During the years, however, improvements in materials, controls and equipment have accounted fora steady progress of quality and economy in the record industry. From the manually "muscled" presses of those early years to the fully- automatic molding press of today, significant elements have been brought together and kept record manufacturing in pace with advancements in reproduction hardware. During this same time record manufac- turing has maintained an enviable economical position, especially when the inflationary pressures on a mature in- dustry are considered.
The record and its demands on the molding process
To the uninitiated, the concept of molding records brings forth the notion of shaping thin discs. In reality the emphasis is on molding grooves, the mechanical translation of audio in- telligence, and completing the product in disc form. This emphasis is the fun- damental requirement of the particular process refinements that make record - molding unique.
Disc records date back prior to the turn of the century. I n those early days the gross effect of the signal was the prime concern, as the contemporary playback equipment exhibited only a shadow of the original audio information. As time went on and improved playback equipment reduced the gap between the original and reproduced information. the software replication process was refined to im- prove the fidelity of the program recorded.
Today's record is composed of grooves whose varying width approximates the thickness of a human hair, as seen in Fig. I . Surface defects existing on the record's groove walls, as well as particles existing below the surface to the depth that can be
"read" by the playback stylus, will cause noise. Defects less than one -half micron in size are significant especially when coupled with a number of occurrences that then present disturbances to the listener. Molding, then, as well as the other operations that produced the com- pound and pressing masters (scampers),
must therefore be exercises in precision and process reliability.
Brief history of record -pressing automation
Paralleling the developments in record fidelity (and the consequent sales in-
(At same magnification) (At 1/10 magnification on left)
Fig. 1 - Comparison of human hair (left). quad (center) and stereo record grooves.
24
creases) were the industry's efforts toward automating the basic record - molding process. The forerunner attempts in the late 1930's involved incor- porating air cylinders and timer controls in press operations. This reduced the need
for muscle in opening and closing presses,
and also provided more uniform control of the molding cycle, previously per- formed by manual valves. Several other elements of the press operation became
individually powered during the 1940's.
These efforts, coupled with the introduc- tion of plastic record compounds in the later 1940's, set the stage for the first automatic press. The product of the day was 7 -inch, 45 -rpm records, and in 1953
RCA placed the first four fully - automated presses in production, manufacturing these records. In 1956
additional presses were installed; this equipment helped maintain RCA's com- petitive position on this product until the presses were discontinued in late 1975. In the same time frame as the RCA developments, injection molding was also developed within the industry for the same product.
By the late 1950's the I2 -inch record began to be the major seller, and automa- tion efforts were directed to that new product line. Evaluations conducted by several organizations in the industry con- cluded that compression- molding was
still the only viable method for producing the larger -sized record. In the mid -60's RCA completed development of one of the first integrated 12 -inch automatic presses, and installed it in a new plant in England. In late 1972 a new effort was
launched, and a second- generation press
that embodies all the requirements of modern manufacturing was completed, with a three -press production setup on stream in mid -1976. Development details of this project will be reviewed later in this paper.
Molding -process review
Compression molding
Compression molding is the oldest record -molding technology -records have been made by this method at least as
long as disc records have been made. The modern -dav automatic press coordinates the molding with a series of preparatory and finishing operations to effectively replace all the old cyclic manual
www.americanradiohistory.com

RECORD COMPOUND
EXTRUDER
PLASTIC FORM
LABEL SINGULATION PRESSING
WATER -STEAM t-WARM WATER -
CONDENSATE
EDGING STACKING
2 3
Fig. 2 - The four -step compression- molding process turns out a 12 -inch record every 20 to 30 seconds.
functions. Fig. 2 shows the four steps in compression- molding records.
In the first step of the process, vinyl record compound is prepared to "flowability" by extrusion. The quantity required to mold each record controls the cyclic operation of the extruder. At the exit of the extruder, the plastic (300 to 325° F) is shaped into a form to facilitate handling into the press. At this step labels are also singulated (individually separated from the stack of labels). The plastic form and labels are then transferred to the press to begin the second step of the process.
Compression- molding with the plastic placed in the center of the mold provides a systematic means of expelling the air from the cavity between the mold halves. Since, however, we are molding more than a disc -there are grooves that are at right angles to the flow of material, and the material has some elasticity- proper heating of the molds is necessary to eliminate minute pockets of air that could produce voids in the finished record. In practice, it has been found necessary to heat the molds at least 15 °F hotter than the plastic. This softens the plastic at its interface with the stamper. Properly- executed records made with specially- designed compounds do not have any sound penalty caused by voids.
Compression- molding also requires more material than is used in the record. It is
necesary to flow a certain amount of material out of the cavity in order to allow for thickness variations inherent with the process and eliminate sink marks and air voids near the outside diameter of the
record. I n pract ice, approximately 25% of the compound placed into the mold cavity is squeezed out at the OD in the form of flash. Once the plastic has filled the cavity, cooling is necessary to com- plete the rigid product.
After the mold has been sufficiently cooled, the press is opened and the molded record with flash is transferred to the edging station for the third step of the process. There, the flash is trimmed and the record is prepared for transfer to the stacking station. The flash trimmed from the record is reprocessed for use as record material.
At step four, stacking, an auxiliary opera- tion is introduced to provide a flat reference spacer if more than 25 records accumulate. Several factors, which are not consistent, can cause slight variations from flatness in the records. Since a drooping semi -cooled record gravitates toward a solid reference point supporting it, a growing stack of records would "settle," accumulating record -thickness variations, and eventually reach an out - of- tolerance condition. Hence the need for spacers. At this station, the record can be inserted into a packaging sleeve if the process is sufficiently free from random faults to allow statistical inspection techniques.
The normal cycle time experienced in the record industry for compression -molding I2 -inch records is 30 seconds. Some successful developments have yielded 20- to 23- second cycles. Analysis of all the elements involved indicates that an optimum cycle of l6 seconds is possible.
Joseph C. Ruda, Manager. Equipment and Process Development Engineering. RCA Records, Ind anapolis, received the BS in physics from the University of Scranton in 1957. He joined the record industry in 1959 and served in various engineering duties at Capitol Records and Philips Recording Corrany prior to joining RCA in 1972. Since 1964, he has led Engineering departments in project. process and development activities.
Reprint RE- 22 -3 -6 Final manuscript received April 23. 1976.
25
www.americanradiohistory.com
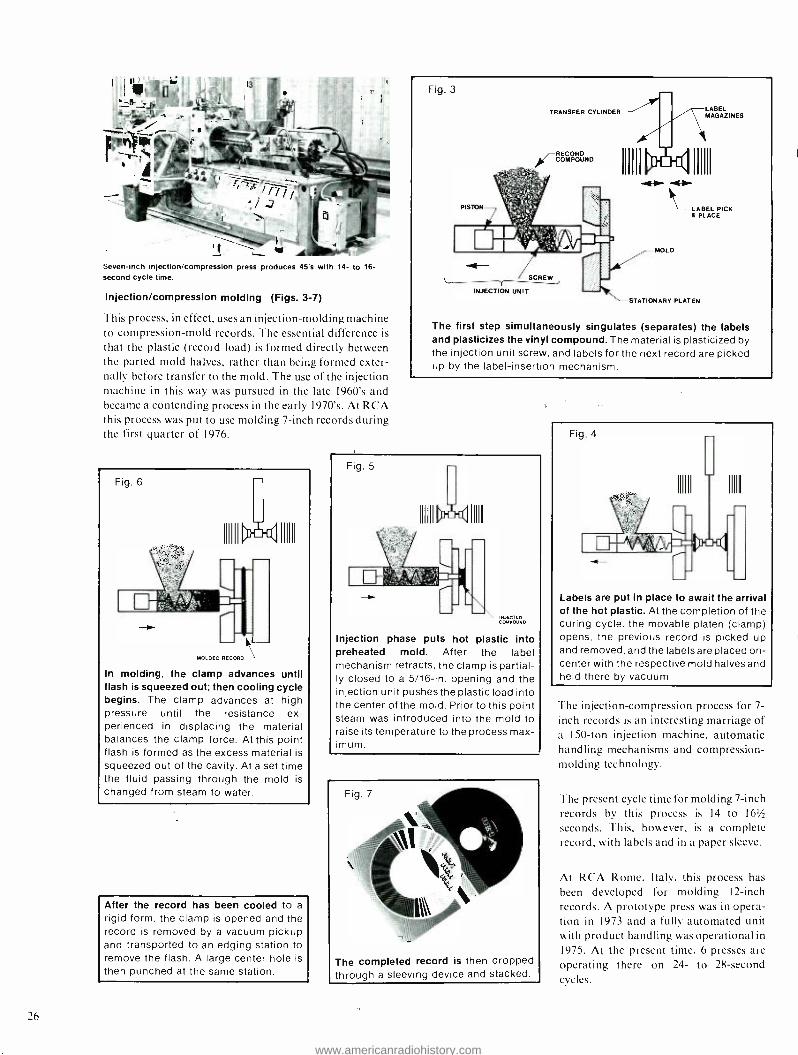
L Seven -inch injection /compression press produces 45's with 14- to 16-
second cycle time.
Injection /compression molding (Figs. 3 -7)
This process, in effect, uses an injection- molding machine to compression -mold records. The essential difference is
that the plastic (record load) is formed directly between the parted mold halves, rather than being formed exter- nally before transfer to the mold. The use of the injection machine in this way was pursued in the late 1960's and became a contending process in the early 1970's. At RCA this process was put to use molding 7 -inch records during the first quarter of 1976.
Fig. 6
l' - ' '
MOLDED RECORD -, In molding, the clamp advances until flash is squeezed out; then cooling cycle begins. The clamp advances at high pressure until the resistance ex- perienced in displacing the material balances the clamp force. At this point flash is formed as the excess material is
squeezed out of the cavity. At a set time the fluid passing through the mold is
changed from steam to water.
After the record has been cooled to a
rigid form, the clamp is opened and the record is removed by a vacuum pickup and transported to an edging station to remove the flash. A large center hole is
then punched at the same station.
Fig. 3
TRANSFER CYLINDER
//-- RECORD COMPOUND
PISTON-,
E `SCREW
INJECTION UNIT
1111 H t
MOLD
LABEL MAGAZINES
1111
-LABEL PICK 8 PLACE
STATIONARY PLATEN
The first step simultaneously singulates (separates) the labels and plasticizes the vinyl compound. The material is plasticized by the injection unit screw, and labels for the next record are picked up by the label- insertion mechanism.
Fig. 5
ECTED COMPOUND
Injection phase puts hot plastic into preheated mold. After the label mechanism retracts, the clamp is partial- ly closed to a 5/16 -in. opening and the injection unit pushes the plastic load into the center of the mold. Prior to this point steam was introduced into the mold to raise its temperature to the process max- imum.
The completed record is then dropped through a sleeving device and stacked.
Fig. 4
Labels are put in place to await the arrival of the hot plastic. At the completion of the curing cycle, the movable platen (clamp) opens, the previous record is picked up and removed, and the labels are placed on- center with the respective mold halves and held there by vacuum.
The injection -compression process for 7-
inch records is an interesting marriage of a 150 -ton injection machine, automatic handling mechanisms and compression - molding technology.
The present cycle time for molding 7 -inch records by this process is 14 to 1611
seconds. This, however, is a complete record, with labels and in a paper sleeve.
At RCA Rome, Italy, this process has been developed for molding I2 -inch records. A prototype press was in opera- tion in 1973 and a fully automated unit with product handling was operational in 1975. At the present time, 6 presses are operating there on 24- to 28- second cycles.
www.americanradiohistory.com

Injection molding
Approximately half of the seven -inch records produced in the United States and Europe are molded by the injection process. In the United States these are all molded in styrene; Europe's product is
vinyl. The first large -scale production using this method can be traced to in- stallations made in the early I950's. Many attempts have also made in the industry to injection -mold I2 -inch audio records, but no practical process has been developed to date.
The injection process requires the exer- tion of large forces, and, as a conse- quence, larger equipment is required. Injection pressures on the order of 12,000 lb/ in are required to push the plastic into a closed mold, where air in the cavity is
displaced by the material through normal venting methods. Should this force be applied to the full projected area of a 12-
inch record while the plastic is still fluid, it would require a clamping force in excess of 600 tons to keep it from being forced open. Special techniques using vacuum - cavity evacuation and a profile - controlled injection phase may make the process technically feasible, but the equipment required would still be large, especially when compared to the 100 -140 ton clamping forces required in
compression- molding.
Manufacturing 7 -inch records, however, has adapted well to injection molding, since the physical characteristics of the product are compatible with the process. The material is plasticized to a very fluid state in the injection unit. Melt temperatures 50 °F higher than the com- pression process are used, so heat - sensitive materials (such as vinyl) require a much higher -performing stabilization additive to withstand process conditions. The molding is performed by pushing the material into the mold cavity after the mold halves have been fully closed. The mold is maintained at a constant temperature (on the order of90 to 125° F) determined by specific process parameters. Various channeling designs are used in the industry for heat ex- change; these are directly related to the cycle time. The air from the cavity is
forced out through very thin vents (less than 0.001 inch wide). This small size is
necessary to produce a "flashless" record. Though the cavity is filled to the pressing master (stamper) clamp rings and injec-
tion pressures as high as 15,000 lb/ in' are used, a significant amount of air is left in
the cavity. The high injection pressure and rate, coupled with the cool molds tend, however, to orient this trapped air into a virtually continuous void. This void results in a radius at the meeting line between the land and groove of the record. 1f this radius is controlled, and the grooves are not too small, no conse- quence to the playback quality is ex -, perienced.
Current technology uses two or three stacked cavities per mold with a center ejector pin for separating the sprue (material remaining in the injection manifold). Some processes introduce labels into the mold, while others apply labels after molding. The state of the art produces cycle times between 12 and 21
seconds; cycles as fast as 8 seconds are known to be possible.
Development of a 12 -inch automatic record press
Late in 1972 RCA Records instituted a
project to develop an optimum press for molding I2 -inch records. Whatever measure of success has been or will be
achieved as a result of this project, is in
large measure based on what was learned from previous efforts. At the inception of the project all the known principles used in automatic molding presses were reviewed. At that time, several completed systems were in use in the industry beside RCA's own. None of the completed efforts were wholly satisfactory in that compromises with quality and productivity were a fact of life with them. During the development and evaluation of alternatives, five principles were es- tablished to serve as base guidelines.
I. The design of the automatic press should provide proper performance with respect to product quality inherently with each func- tion. The occurrence of random faults in- herent with a mechanism design will not be acceptable.
2. The interface between man and machine shall he such that all manual elements can be performed easily and quickly without special skill, but with confidence. Adequate clearances and task methods required should give maximum practical protection to pressing masters (stampers) and labels during manual loading in the machine. Safety will underlie all elements.
3. The system logic should allow trouble- shooting to be performed in an easily - followed procedure; fault occurrences
should he monitored and prevented from causing a catastrophic machine failure. All control components shall be easily rcplacahlc (without a high possibility of generating a new fault with the replace- ment), to allow for trouble -shooting by substitution and a quick return to the production mode.
4. All components and mechanisms shall be durable enough to withstand the rigors of production without unreasonable deteriora- tion.
5. The appearance of the equipment shall be pleasing; it should be maintainable with reasonable housekeeping practices.
The four process steps
hhe automatic compression -molding process for records is a composite of several operations, which can be organized into four basic process steps. (See Fig. 2.)
S7e/) I Plasticising the record material load, label singulation.
Step 2
Step 3
Step 4
Molding the record (with flash).
Removing the flash (edging).
Stacking the records.
Transport
The general configuration of the machine is largely determined by its methods of transport between operations. The goals determined for the transport system were I) positive and unvarying transfer positions and 2) a system capable of optimum speeds without harmful effects to the product or machine. After prototype testing, a straight -line transfer method between the four major stations was chosen. A rigid tubular transfer frame was designed, incorporating three fixed positions on the same center dis- tance. (See Fig. 8). Each position was fitted with a mechanism designed for holding the piece being transferred, and a
latching/ unlatching system motivated by pneumatic cylinders was retained from the first -generation press. Guidance was
20" 20
RECORD STACK
EDGER (TO STACK)
PRESS (TO ':= DGER)
FORM CARRIER (TO PRESSI
Fig. 8 - Transport trame for automatic 12 -inch press must move between stations with high repeatability.
27
www.americanradiohistory.com

Fig. 9 - Label loading -twelve -inch automatic press. Plastic form carrier is between stack of labels being put in and stack already in place.
accomplished by suspending the frame by connectors to bearing wheels riding on top of hardened rods. The result was a transport system that was strong, light enough to move quickly, and capable of repeating locations accurately.
Station 1
The choice of the extruder parameters was the result of testing various screw designs and heater types with many com- binations of material formulations. The most significant requirement that emerged was the ability to control melt temperature at the low end while still performing adequate plasticizing, as a lower melt temperature could allow for optimum cycles and improve stability conditions. The extruder design finally chosen was a simple 1- 3 /4 -in. single - screw machine with steam heater bands.
In bringing together all the elements of Station I the following goals were im- posed:
Align both labels to a common axis
Provide quick and positive label loading
Closely control the plastic load volume (faults related to plastic volume can occur)
Form the plastic load into a repeatable shape without voids and with the major surfaces parallel to the press platen (faults can he caused by elasticity in a non -uniform plastic load form, and voids)
Eliminate all residual elastic forces that could occur between the plastic load form and the carrier device (label off- centers can he caused by these elastic forces).
The system developed places the label magazine and the plastic- forming cavity
28
Fig. 10 - Edging station removes flash with pivoted knife while turntable rotates record.
on the same axis as a composite assembly. (See Fig. 9). The label magazines are on center with, and form the top and bottom of, the plastic form cavity. This produces positive label pickup, as the plastic at- taches itself to the exposed label surface during extrusion, and singulation is
assured unless labels are attached to each other by means other than related to the mechanism. The top and bottom label magazines, being part of the same assembly, are aligned to each other in a
fixed manner. The assembly then is
located so that is insures centering with the press when the label/ plastic form "sandwich" is transported to the press. The pieces which hold the "sandwich" during transport to the press make up the plastic -form cavity. With the form being "molded" into the transport pieces, very little elasticity is experienced. The ex- truder nozzle tip comprises the final cavity component.
Upon a signal, with the carrier frame in
"home" position, the label magazines advance and engage the transport pieces and the extruder nozzle. A separate pneumatic cylinder maintains pressure on the label stack in each magazine. The air pressure is set lower on one of the cylinders to allow for its displacement when the cavity is filled with material. Movement of a few thousandths of an inch actuates a switch, which stops extru- sion. The pressure on the label stack is
relieved, and just prior to the transport signal, the label magazines are retracted. The plastic form with labels attached to top and bottom surfaces is now held by the carrier, and this "sandwich" is moved to the center of the press.
The label magazines are also designed to accept labels pre -loaded onto center pins; a quick- release clamp changes full for spent label pins. (See Fig. 9).
Station 2
The following goals were determined for Station 2.
Positive control of the plastic form to prevent dropping or pulling it off center
Good clearance for pressing master (stamper) changes
Piston seal replacement possible without major disassembly
Press deflection under 0.003 inch at max- imum load.
The basic press design was returned from the first- generation project; the overall dimensions and clearances provided the access required. Calculations indicated that at the maximum potential condition, the deflection of the stationary platen would he 0.0025 inch. This confirmed previous measurements of product molded under lesser conditions, which indicated that deflection was within this requirement. The press cylinder, however, which originally was an inserted casting using a seal fixed to the piston, was redesigned to a weldment with the seal fixed to the top of the cylinder. This change circumvented the problem of potentially porous castings, reduced cost, and significantly reduced the task of seal replacement.
When the plastic form is transferred to the center of the press, the press cylinder moves up to engage the form. With the form and labels held by the press, the
www.americanradiohistory.com
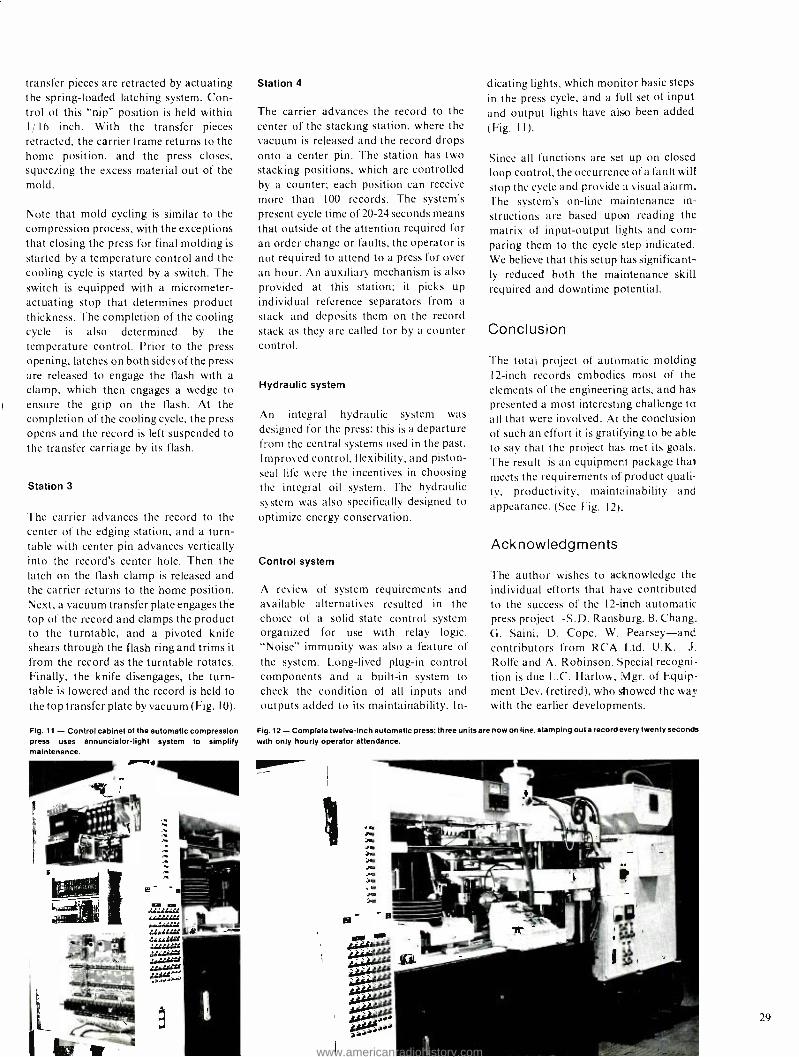
transfer pieces are retracted by actuating the spring- loaded latching system. Con- trol of this "nip" position is held within I / 16 inch. With the transfer pieces retracted, the carrier frame returns to the home position, and the press closes, squeezing the excess material out of the mold.
Note that mold cycling is similar to the compression process, with the exceptions that closing the press for final molding is
started by a temperature control and the cooling cycle is started by a switch. The switch is equipped with a micrometer - actuating stop that determines product thickness. The completion of the cooling cycle is also determined by the temperature control. Prior to the press opening, latches on both sides of the press are released to engage the flash with a
clamp, which then engages a wedge to ensure the grip on the flash. At the completion of the cooling cycle, the press opens and the record is left suspended to the transfer carriage by its flash.
Station 3
The carrier advances the record to the center of the edging station, and a turn- table with center pin advances vertically into the record's center hole. Then the latch on the flash clamp is released and the carrier returns to the home position. Next, a vacuum transfer plate engages the top of the record and clamps the product to the turntable, and a pivoted knife shears through the flash ring and trims it from the record as the turntable rotates. Finally, the knife disengages, the turn- table is lowered and the record is held to the top transfer plate by vacuum (Fig. 10).
Fig. 11 - Control cabinet of the automatic compression press uses annunciator -light system to simplify maintenance.
Station 4
The carrier advances the record to the center of the stacking station, where the vacuum is released and the record drops onto a center pin. The station has two stacking positions, which are controlled by a counter; each position can receive more than 100 records. The system's present cycle time of 20 -24 seconds means that outside of the attention required for an order change or faults, the operator is
not required to attend to a press for over an hour. An auxiliary mechanism is also provided at this station; it picks up individual reference separators from a
stack and deposits them on the record stack as they are called for by a counter control.
Hydraulic system
An integral hydraulic system was
designed for the press; this is a departure from the central systems used in the past. Improved control, flexibility, and piston - seal life were the incentives in choosing the integral oil system. The hydraulic system was also specifically designed to optimize energy conservation.
Control system
A review of system requirements and available alternatives resulted in the choice of a solid -state control system organized for use with relay logic. "Noise" immunity was also a feature of the system. Long -lived plug -in control components and a built -in system to check the condition of all inputs and outputs added to its maintainability. In-
dicating lights, which monitor basic steps
in the press cycle, and a full set of input and output lights have also been added (Fig. I I ).
Since all functions are set up on closed loop control, the occurrence of a fault will
stop the cycle and provide a visual alarm. The system's on -line maintenance in-
structions are based upon reading the
matrix of input- output lights and com- paring them to the cycle step indicated. We believe that this setup has significant- ly reduced both the maintenance skill required and downtime potential.
Conclusion
The total project of automatic molding I2 -inch records embodies most of the elements of the engineering arts, and has presented a most interesting challenge to all that were involved. At the conclusion of such an effort it is gratifying to be able to say that the project has met its goals. The result is an equipment package that meets the requirements of product quali- ty, productivity, maintainability and appearance. (See Fig. 12).
Acknowledgments
The author wishes to acknowledge the individual efforts that have contributed to the success of the 12 -inch automatic press project -S.D. Ransburg, B. Chang, G. Saini, D. Cope, W. Pearsey -and contributors from RCA Ltd. U.K. J. Rolfe and A. Robinson. Special recogni- tion is due L.C. Harlow, Mgr. of Equip- ment Dev. (retired), who showed the way with the earlier developments.
Fig. 12- Complete twelve -inch automatic press; three units are now on line, stamping out a record every twenty seconds
with only hourly operator attendance.
29
www.americanradiohistory.com

i'
The eight -track cartridge: putting it all together J.C. Ruda
Manufacturing an eight -track tape costs roughly twice as much as an equivalent record. High production volumes mean that costs per part are figured in thousandths of cents; here's how product design and production keep the cartridges cost - competitive.
THE DESIRE TO provide pre- recorded programs for the automobile's captive audience sired the eight -track cartridge. RCA Records became in- volved with the product at its outset, when Lear Jet Corp., the system's originator, approached us in 1963. After becoming committed to the concept, RCA joined forces with Lear Jet and the automotive industy in developing im- provements and detailed specifications for the new product. This was necessary for the eight -track system to function well and survive in the automobile, yet still be used easily with a minimum amount of attention by the driver. This commitment to automotive use remains intact today.
Eight -track cartridge manufacturing started in 1965, and from that time forward, concerns for process reliability
BASE
COVER
PLATFORM
PINCH ROLLER ASSY.
PRESSURE PAD ASSY.
MYLAR RETAINER
RCA CARTRIDGE
r.
e O
and cost were added to improvements in function. Though product design, process methods and equipment have reached a high level of efficiency, further ongoing exercises are still being aimed at specific economic goals.
Cartridge design evolution
Two generations of redesign have evolved the cartridge from an assembly of 11
components (not including the magnetic and splicing tape) down to a composite of 6 (Fig. I). This simplification resulted from efforts in function optimization and substituting composite components for monolithic. Other cost -saving exercises reduced the material required per compo-
Joe Ruda's biographical sketch is with his other article in this issue.
BASE
COVER
PLATFORM
CORE
PINCH ROLLER HUB
PINCH ROLLER TIRE
PRESSURE PAD ASSY.
MYLAR RETAINER
WAFER
WASHER
STRIPPER
LEAR CARTRIDGE
cok
Fig. 1 - RCA improved upon the eleven- component Lear cartridge, redesigning It into a simplier and cheaper six- component unit.
30
nent retained and introduced less -costly equivalent components. The evolution from the Lear cartridge cut out several components -the wafer was eliminated by adding radial ribs in the cover mold, the tape spool post thrust washer was eliminated by incorporating mating con- ical bearing surfaces on the tape spool and cartridge base, and the stripper was eliminated by improving the pressure roller.
The pressure roller, which serves as the idler backup to the tape -deck drive capstan, has evolved from an assembly of an outer "tire" and inner hub, to an insert molding of the hub and tire, and finally to a monolithic plastic pressure roller. Specific molding process controls were required to produce functionally accep- table plastic pressure rollers, but the net results of the exercise was a significant cost savings made while maintaining superior product function.
The tape spool was changed from a two - piece assembly of hub (core) and tape support platform to a one -piece molding. To accomplish this a special cam -action mold was developed to allow the parts to be ejected. Also, the part design was interfaced with the tape -winding opera- tion in a way that eliminated the need for cycling the cartridge prior to shipment, but still maintained acceptable first -play quality. Eliminating "running in" in this manner saved an operation and reduced the potential for product damage during high -speed cycling, while keeping wow and flutter within acceptable limits. (Wow and flutter are defined here as an audio distortion caused by a modulating tape tension.)
The cartridge housing design was changed from an initial assembly with a five -post interference fit, to one with two hinged points and a drive -screw fastener,
Reprint RE- 22 -3 -7 Final manuscript received June 21, 1976.
www.americanradiohistory.com

Fig. 2 - Protilometer measures molded pressure rollers shown In drawing at rear.
and eventually to a nesting cover and base fixed by ultrasonic welding. This evolu- tion reduced the housing material by
65 %, made the product stronger and allowed automatic assembly. Finally, the Mylar retainer, which keeps the tape in
the wind plane, was simplified for another cost savings.
Molding
Though RCA Records does not mold its own cartridge components at this time, managing our owned tools includes ex- ercises aimed at optimizing the molder's process.
The tolerances needed to meet assembly requirements, coupled with the minimal cross -section thickness of today's "thin - wall" housing, require stringent process control and tooling integrity. Extra care is required to set and maintain balance in
the mold runner systems, as well as the various cavity cross -sections. These fac- tors affect the flow pattern of plastic into the mold cavities and are important in
controlling dimensions, warpage and heat -distortion capability.
An interesting exercise is involved in
molding the plastic pressure rollers. To effectively control potential skew (tape deviation from a linear path) and wear, the tape- contact surface of the roller must have a "crowned" profile within certain dimensional limits. Accomplishing this crowned profile is entirely in the realm of the injection process method, as it cannot be achieved by mold design. Effective process control required an easily -used measurement method, so a high - resolution profilometer was developed and provided to each molder to trace the roller contact surface. (See Fig. 2).
Assembly
Duplication
A cartridge begins its growth as a pre- recorded product at this process step, where 7500 -ft reels of 1/4- inch -wide x
.75 -gauge tape are recorded continuously with individual cartridge programs, each between 100 and 460 ft long. Signal elements are recorded between each program for use in the breakdown opera- tion. For further description see "Design of a high -speed duplicating system," by
Wartzok and Mattson, in this issue.
Breakdown
The 7500 -ft reels of prerecorded tape are separated into individual programs in this
operation. (Fig. 3). RCA -developed
winding machines, operating at 200 in./ s,
marry the program tape with the car- tridge spool -the driving hub engages the cartridge spool by means of protrusions extending through slots in the spool platform. These protrusions also serve as
a filler at the spool's ID to create the slack required to operate an endless -loop car- tridge. As stated previously, this has eliminated the separate cycling operation previously required. The signal elements recorded between each program are used here to stop the winding operation and automatically cut the tape. Operators, usually manning three machines, load spools, start the first few winds manually, and press the winding operation button. Then they unload the wound tape spools and insert them into preassembled bases in preparation for the next assembly -line process.
Preassembly
The cartridge -base preassembly opera- tion starts by automatically unloading the base components from their shipping containers. The bulk base unloader (Fig. 4) uses vacuum cups to hold each base in
the layer and withdraw the entire layer from the container, moving it laterally over a moving conveyor. When the vacuum is released, two rows of bases are separated by a gating device to feed two preassembly lines. Withdrawal continues either as long as the bases are required, as
sensed by a photocell limit control on
Fig. 3 - Tape breakdown operation separates 7500 -ft tape reels into individual programs.
3 l
www.americanradiohistory.com
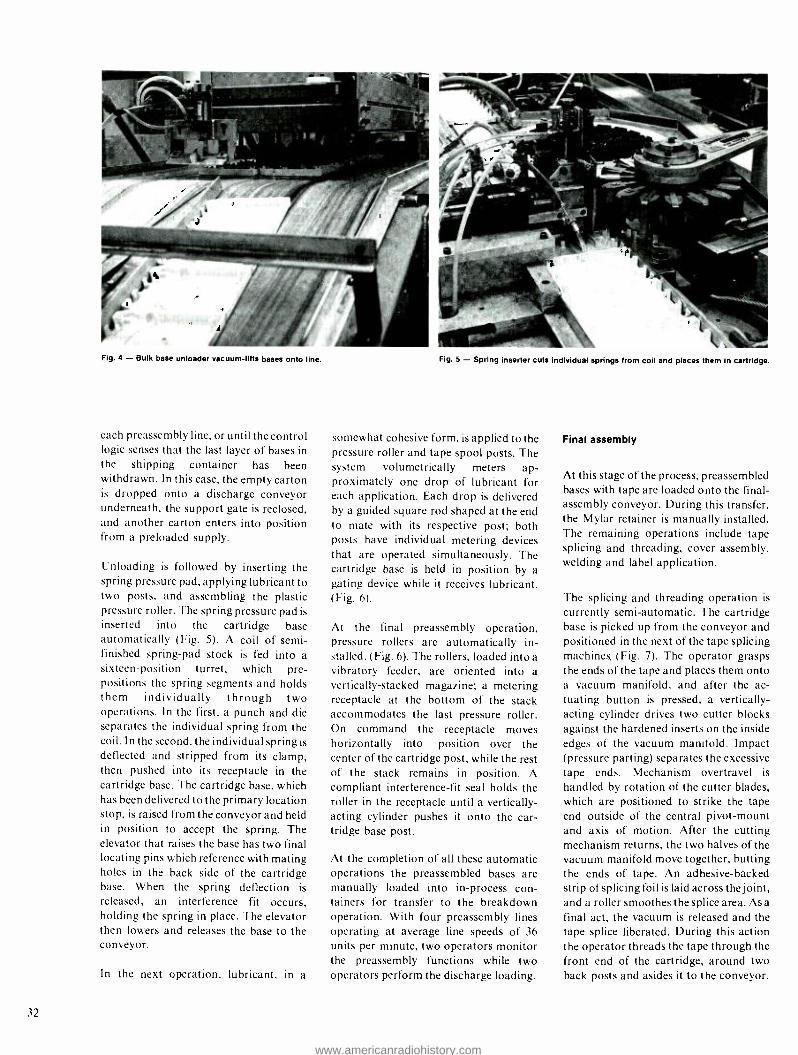
Fig. 4 - Bulk base unloader vacuum -lifts bases onto line.
each preassembly line, or until the control logic senses that the last layer of bases in the shipping container has been withdrawn. In this case, the empty carton is dropped onto a discharge conveyor underneath, the support gate is reclosed, and another carton enters into position from a preloaded supply.
Unloading is followed by inserting the spring pressure pad, applying lubricant to two posts, and assembling the plastic pressure roller. The spring pressure pad is
inserted into the cartridge base automatically (Fig. 5). A coil of semi- finished spring -pad stock is fed into a
sixteen -position turret, which pre- positions the spring segments and holds them individually through two operations. In the first, a punch and die separates the individual spring from the coil. In the second, the individual spring is
deflected and stripped from its clamp, then pushed into its receptacle in the cartridge base. The cartridge base, which has been delivered to the primary location stop, is raised from the conveyor and held in position to accept the spring. The elevator that raises the base has two final locating pins which reference with mating holes in the back side of the cartridge base. When the spring deflection is
released, an interference fit occurs, holding the spring in place. The elevator then lowers and releases the base to the conveyor.
In the next operation, lubricant, in a
32
Fig. 5 - Spring inserter cuts individual springs from coil and places them in cartridge.
somewhat cohesive form, is applied to the pressure roller and tape spool posts. The system volumetrically meters ap- proximately one drop of lubricant for each application. Each drop is delivered by a guided square rod shaped at the end to mate with its respective post; both posts have individual metering devices that are operated simultaneously. The cartridge base is held in position by a
gating device while it receives lubricant. (Fig. 6).
At the final preassembly operation, pressure rollers are automatically in- stalled. (Fig. 6). The rollers, loaded into a
vibratory feeder, are oriented into a
vertically- stacked magazine; a metering receptacle at the bottom of the stack accommodates the last pressure roller. On command the receptacle moves horizontally into position over the center of the cartridge post, while the rest of the stack remains in position. A compliant interference -fit seal holds the roller in the receptacle until a vertically - acting cylinder pushes it onto the car- tridge base post.
At the completion of all these automatic operations the preassembled bases are manually loaded into in- process con- tainers for transfer to the breakdown operation. With four preassembly lines operating at average line speeds of 36
units per minute, two operators monitor the preassembly functions while two operators perform the discharge loading.
Final assembly
At this stage of the process, preassembled bases with tape are loaded onto the final - assembly conveyor. During this transfer, the Mylar retainer is manually installed. The remaining operations include tape splicing and threading, cover assembly, welding and label application.
The splicing and threading operation is
currently semi -automatic. The cartridge base is picked up from the conveyor and positioned in the next of the tape splicing machines. (Fig. 7). The operator grasps the ends of the tape and places them onto a vacuum manifold, and after the ac-
tuating button is pressed, a vertically - acting cylinder drives two cutter blocks against the hardened inserts on the inside edges of the vacuum manifold. Impact (pressure parting) separates the excessive tape ends. Mechanism overtravel is
handled by rotation of the cutter blades, which are positioned to strike the tape
end outside of the central pivot -mount and axis of motion. After the cutting mechanism returns, the two halves of the vacuum manifold move together, butting the ends of tape. An adhesive -backed strip of splicing foil is laid across the joint, and a roller smoothes the splice area. As a
final act, the vacuum is released and the tape splice liberated. During this action the operator threads the tape through the front end of the cartridge, around two back posts and asides it to the conveyor.
www.americanradiohistory.com
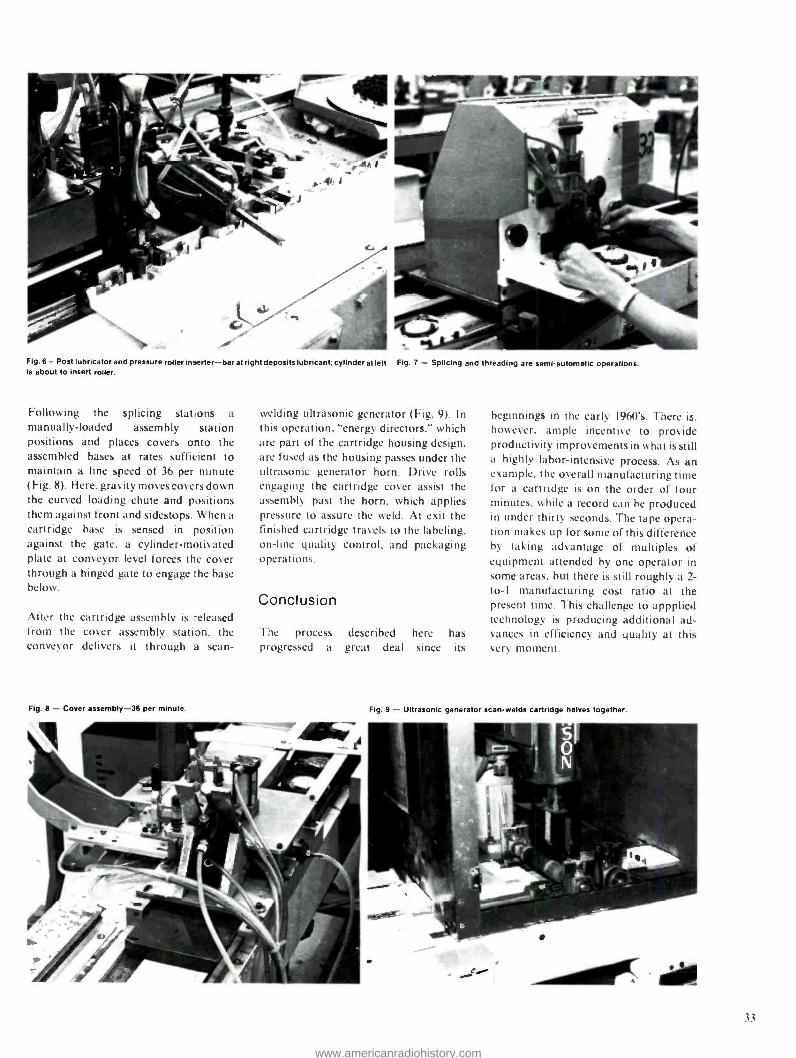
Fig. 6 - Post lubricator and pressure ro:ler inserter -bar at right deposits lubricant;cylinderatleft is about to insert roller.
Following the splicing stations a
manually -loaded assembly station positions and places covers onto the assembled bases at rates sufficient to maintain a line speed of 36 per minute (Fig. 8). Here, gravity moves covers down the curved loading chute and positions them against front and sidestops. When a
cartridge base is sensed in position against the gate, a cylinder -motivated plate at conveyor level forces the cover through a hinged gate to engage the base below.
After the cartridge assembly is released from the cover assembly station, the conveyor delivers it through a scan-
Fig. 8 - Cover assembly -36 per mirute.
Fig. 7 - Splicing and threading are semi- automatic opera:ions.
welding ultrasonic generator (Fig. 9). In this operation, "energy directors." which are part of the cartridge housing design. are fused as the housing passes under the ultrasonic generator horn. Drive rolls engaging the cartridge cover assist the assembly past the horn, which applies pressure to assure the weld. At exit the finished cartridge travels to the labeling. on -line quality control, and packaging operations.
Conclusion
The process described here has progressed a great deal since its
beginnings in the early 1960's. There is, however, ample incentive to provide productivity improvements in what is still a highly labor- intensive process. As an example. the overall manufacturing time for a cartridge is on the order of four minutes, while a record can be produced in under thirty seconds. The tape opera- tion makes up for some of this difference by taking advantage of multiples of equipment attended by one operator in some areas, but there is still roughly a 2- to-I manufacturing cost ratio at the present time. This challenge to appplied technology is producing additional ad- vances in efficiency and quality at this very moment.
Fig. 9 - Ultrasonic generator sun -welds cartridge halves together.
33
www.americanradiohistory.com

34
High speed duplication of Stereo 8 tape G.A. Mattson) R.E. Wartzok
RCA Records Engineering has designed and built a new duplicating system for tape used in Stereo 8 cartridges. Not simply
a replacement, the new system records at twice the speed of the present duplicating equipment and produces higher
quality audio tapes.
Lu
z fit
á
AUTO TEST
PANEL
CC Ó rr mz <O
MASTER TRANSPORT
PLAY HEAD
8 -CHAN PLAYBACK
AMP
TWO SLAVES SHOWN TYPICAL OF 10 OR 20
rn
m
w w
SLAVE TRANSPORT & CONTROL
R EC HEAD
ICOU N T E R
RESET
8 -CHAN RECORD
AMP
8 -CHAN AUDIO BUS
AUTO TEST BUS
AU TO TEST OSC
ONE UNIT SERVES ALL SLAVE TRANSPORTS.
SLAVE TRANSPORT & CONTROL
COUNTER RESET
8 -CHAN RECORD
AMP
Fig. 1 - System for duplicating Stereo 8 tape at 32X real time. Under control of the audio test panel, the master transport feeds audio to be recorded at as many as 20 slave transport positions. The auto test oscillator provides a check on the overall quality of the duplicated tape.
Richard E. Wartzok, Member, Engineering Staff, Record Division, Indianapolis, Ind.. received the BSEE and MSEE from Purdue in 1971 and 1973, respectively. He
joined RCA Records in 1974 and has been working in the Recording and Electronic Development Group on such
designs as a four -channel quality- assurance listening system for the new record pressing facilities and a
listening -control system for the Engineering Lab. During the development of the new tape -duplication system, Mr.
Wartzok was responsible for the design of the record and
reproduce amplifiers, and he completed the design of the
slave transport control electronics. His main area of
electronic design responsibility has remained in the tape
product area. He is a member of Tau Beta Pi, Eta Kappa Nu, and the Audio Engineering Society.
Glenn A. Mattson. Member. Engineering Staff, Record Division, Indianapolis, Ind. received the BSME in 1955
from Michigan Technological University. He received the Professional Engineering License in 1960. Mr. Matt- son was Development Engineer with Westinghouse Electric Corp. for ten years developing machines for coil winding and transformer manufacture. He joined RCA,
Consumer Electronics, in 1965, where he designed a
loudspeaker manufacturing line and performed much of the design on the toroidal winding machines used in
manufacturing the in -line deflection yoke. In 1973, Mr.
Mattson was transferred to the RCA Record Division and
has designed machines in Stereo -8 cartridge assembly, and is also coordinator of drafting design assignments.
RCARecords, Lear Jet Corpora- tion, Motorola Inc., and Ford Motor Co. developed and pioneered the 8 -track tape cartridge format more than ten years ago. At that time, RCA became the first large producer of Stereo -8 cartridges, and the original equipment (with modifications) used for duplicating tape in these facilities has been operating ever since.
The need for a more efficient tape duplicating system along with the problem of maintaining wornout duplicators recently prompted RCA Records to review the availability of new high- quality duplicating equipment. Re- quirements for the new equipment were submitted to several equipment suppliers. The most stringent of these requirements was to duplicate at twice the speed of the present system with the same, or better, audio quality. After a thorough review of several proposals, we decided on an in- house design as the best way to achieve the required performance.
System design
Modern high -volume tape duplicating systems, including the system currently being used at RCA Records, reproduce a master tape by re- recording it onto bulk tape via several duplicating slave machines. The master tape is connected end -to -end to form a continuous running loop. The I- inch -wide master tape con- tains the entire 8 -track program for a
Stereo 8 cartridge. As the tape loop circulates on the master transport, the slaves record complete programs end -to- end on the bulk tape reel (pancake). For increased efficiency, the duplication speed is many times greater than normal playing speed; speeds of 16X normal, as currently used at RCA, and 32X normal are typical. This corresponds to duplicating speeds of 60 inches -per- second (in. /s) and 120 in. /s, respectively, for an 8 -track tape, which is to be played back at 3.75 in./ s. The now- recorded'/- inch tape pancake is cut into individual programs and loaded into cartridges.'
Reprint RE- 22 -3 -3 Final manuscript received June 4, 1976.
www.americanradiohistory.com

To take advantage of the proven efficien- cy and economy of duplicating tape in
this manner and to maintain processes
that fit the present manufacturing methods for Stereo 8 cartridges, the new
duplicating system was chosen to be of this same type i.e., a master transport feeding ten or twenty slaves. To improve efficiency and quality, the new system would provide double the duplicating speed (from 16X to 32X), simple operating functions, and test signals for accurate quality control monitoring. Likewise, more durable equipment com- ponents and simplified servicing features were used in the design to reduce maintenance costs. A block diagram of the new system is shown in Fig. I.
Functionally, the design of the new 32X duplicating system provides either of two operating modes. In batch mode, all the slaves are loaded with tape as a group and then started together. In the more efficient sequential mode, each slave is
loaded, readied, and started progressively by the next pass of the master tape loop. This mode allows a single worker to service up to twenty slaves with no slave stopped for more time than required for unloading and reloading.
In either case, the starting of the slaves is
automatically synchronized by control logic in the auto control panel (ACP). The ACP produces the start signals based
on optically sensed foil tape markings on the master tape. The ACP also controls all the functions of the master transport and its tape loading station.
For checking the overall recorded quality of a duplicated tape, a composite test signal, known as auto -test, is recorded after the last program at the end of each tape pancake. This provides a direct check on the condition of the system and the tape.
To provide this auto -test feature in the
sequential mode, in which each slave
operates independently, it is necessary to provide separate 8- channel record amplifiers to drive the 8 -track record head on each slave. The current system uses a single 8- channel record amplifier for a group of ten slaves. With separate amplifiers, each slave can select its input from the master tape program and switch to the auto -test signal as required at the end of a pancake. This switchover time is
determined individually at each slave by a
counter in its record amplifier package.
The counter is preset by signals from thumbwheel switches on the ACP to the number of programs that will fit on a
pancake. The counter counts down from this number with each pass of the master tape via a count signal from the ACP. When the counter reaches zero, the switchover to auto test occurs and is
maintained to the end of the tape. At this point the slave stops, the counter is reset,
and the slave is ready for the next run.
In addition to the sequential mode auto - test feature, the individual record amplifier arrangement, despite its larger initial cost, has important performance and maintenance advantages over the single- record -amplifier/ line concept. The electrical characteristics of each channel in the amplifier can be individually optimized for its corresponding track in the record head for flattest frequency response and accurate recorded level.
This is in contrast with aligning for the
average characteristics of ten heads as
required in the single amplifier arrange- ment. Furthermore, with individual record amplifiers, any slave can he
removed from the line for servicing without disturbing the remaining slaves
in that line.
Tape transport design
Since the slave tape transport was the
most complex and critical item in the duplicating system, it received the first, major thrust of our development concen- tration. To determine the direction and concept of design, we studied the present production slaves to find their weaknesses and their advantages; we also reviewed the principles used on some currently marketed tape transports. After analyzing the current state -of- the -art, and the performance specifications, the design was initiated. Some of the basic specifications for the duplicator tape transport were:
I) Accommodate reel or pancake size up to 14-
inch O.D. using / -inch wide tape of 0.5 mil to 1.0 mil.
2) Run at operational speed of 120 in., s.
3) Achieve wow and flutter less than 0.1% NAB (unweighted) at playback at 33/4 in. s
from 0.5 Hz to 200 Hz. Flutter within 0.65% p -p during recording with reproduce head on transport at 0.5 Hz to 10 Hz.
4) Maintain maximum temperature rise at the tape pancake of 9 °F.
5) Meet OSHA Standards.
6) Provide efficient threading.
7) Provide magnetic side tape cleaning.
8) Hold head -loop tensions at 6.5 oz. ± 10% throughout at pancake of tape.
Tape path design
Layouts were made and a satisfactory tape path was determined. The necessary components to serve the functions were designed and detailed. These included:
Tape cleaner--a clock motor drives a clean- ing tape over the magnetic side of the tape.
Pinch roller mechanism -2-inch-diameter rubber tire to force the tape against the capstan.
Reel locks -hold down the pancakes of tape.
Tape guides.
Tape end sensor.
Packer arm.
The mechanical components were designed for minimum wear and max- imum reliability. For example, ball -type bearings were used in reciprocating devices.
Because of the experience with the pre- sent duplication system, dual -driven capstans were continued in the new versions. The tests of the first prototype transport showed several performance shortcomings:
I ) fhe capstan diameter differential was too critical, and a minor ratio change would cause a dramatic increase or decrease in loop tension.
2)-1-here was very little external control over loop tensions.
3) Undulating tensions at the beginning and end of the supply pancake were directly magnified as tension undulations in the loop (head) area. The undulations were showing up as an increase in wow and flutter. Through the middle of a pancake, wow and flutter readings were acceptable (about O.08%): however, performance at the beginning and end of the reel was unsatisfac- tory.
Further evaluations showed that perfor- mance would be improved if the inertias
Closeup of master playback transport with new pinch - roller assemblies and 8- channel playback preamp in- stalled at the center bottom of the deck. The tape drops into the basket immediately below- the deck.
35
www.americanradiohistory.com

of the payoff and take -up assemblies were
reduced. Material was removed from the reel -lock devices that clamp the tape
pancake, and the motors were replaced with low- inertia types. Next, the tape -end sensor was modified to become a dancer - arm system that would dampen vibrations that came from the take -up pancake.
Each modification improved the perfor- mance, allowing the wow and flutter specifications to be surpassed and the head- tension fluctuations to be within acceptable limits. The modifications re-
quired to obtain the gains in performance created the need for a completely new version of the experimental transport.
Prototype -II
A second prototype went into the design stage and some considerations were to
I) Decrease the overall size slightly.
2) Improve the appearance.
3)Improve mechanical assemblies including reel locks, packer arm, tape cleaner, and tape -end sensor.
4) Improve electronic circuitry and packaging.
5) Design and build a cabinet.
Special attention was given to finishes and color of top components by using black anodized and clear anodized finishes on the aluminum, plus con- touring some surfaces to improve the aesthetics. The tape cleaner was recessed
into the top plate, and inclined surfaces were provided to lift the tape naturally
Complete prototype slave unit with the Iront door removed to show the electronics.
into the guides. The reel locks were
redesigned to center the tape pancake and securely lock it in position. The packer arm actuating mechanism was redesigned to reduce its critical adjustments with more positive engagement for retraction. The tape -end sensor was given a
symmetrical design for improved appearance. The aluminum top plate under the tape pancakes was hard anodized to protect the finish plus add to the overall appearance with its dark grey color that contrasted with the clear finish of the main plate.
The prototype -II mechanical assembly was ordered and the electrical com- ponents were designed while the prototype -1 was placed in production with the present (16X) equipment. Smaller (half size) capstans made the prototype compatible with present production equipment. During the "line" operation of Prototype -1. several problems occurred which prompted changes in the second prototype.
Prototype -11 was mounted in a cabinet angled at 30 °. The angle generated various opinions of its value. Methods engineering evaluated and backed the decision of an inclined transport but recommended an angle of 20 °to help the operator see the head for cleaning. Other recommendations included cabinet height and depth to meet optimum human engineering principles.
Control electronics
The control electronics, completed dur- ing prototype development, consists of a
power -supply package and a card -rack package mounted on the cabinet rack below the transport deck. On the bottom of the deck plate, a small connector chassis allows all of the deck -mounted motors and electrical components to be
Bottom -side view of the prototype slave transport deck. Note that all electrical components plug into the connec- tor chassis at the upper center. Two connectors on the chassis provide hookup to the electronics package in the cabinet.
CloNUp of the slave electronics package showing the record amplifier on top. the transport control electronics in the middle, and the transport power supply on the
bottom.
connected individually. Two main cables then connect this chassis, and thus all the
deck components, to the control packages in the cabinet below. This arrangement allows any deck corn - ponents to be easily removed for servic- ing and places the electronic control plug -in cards in an accessible area.
Furthermore, torque control adjustments and other control functions are available at the front of the cabinet. The control circuitry is all solid- state. The power for the motors is controlled with triac circuits coupled with optical isolators to the logic circuitry. The variable torque control for the reel motors is provided by transistor voltage control circuits with signals from potentiometers on the packer arm. The logic circuitry uses CMOS integrated circuits for high noise immunity.
Some additional operating features provided by the control electronics are
end -of -tape sensing, braking in the event of a power failure, and the ground -fault indication. Emergency braking occurs at
power failure by triac switching of dc
storage capacitors into the motor windings. This prevents tape spillage during emergency and ordinary stopping.
Record amplifier design
The 8- channel record amplifier package installed in each slave machine was
designed in a compact ten -module package consisting of the eight identical plug -in single- channel record amplifier modules, the counter and bias oscillator module, and the power supply module. All alignment controls for level, equaliza- tion and bias were brought to the front panel of the record amplifier modules.
www.americanradiohistory.com
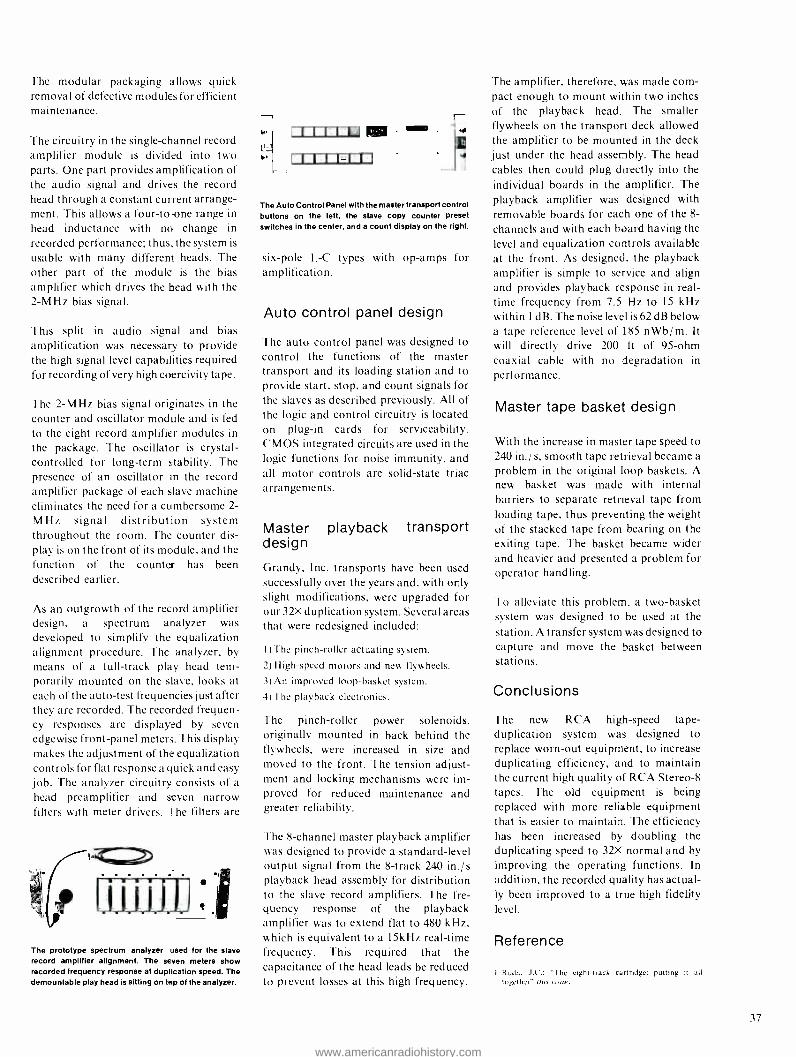
The modular packaging allows quick removal of defective modules for efficient maintenance.
The circuitry in the single -channel record amplifier module is divided into two parts. One part provides amplification of the audio signal and drives the record head through a constant current arrange- ment. This allows a four -to -one range in
head inductance with no change in
recorded performance; thus, the system is
usable with many different heads. The other part of the module is the bias amplifier which drives the head with the 2 -MHz bias signal.
This split in audio signal and bias amplification was necessary to provide the high signal level capabilities required for recording of very high coercivity tape.
The 2-M Hz bias signal originates in the counter and oscillator module and is fed to the eight record amplifier modules in
the package. The oscillator is crystal - controlled for long -term stability. The presence of an oscillator an the record amplifier package of each slave machine eliminates the need for a cumbersome 2-
M Hz. signal distribution system throughout the room. The counter dis- play is on the front of its module, and the function of the counter has been described earlier.
As an outgrowth of the record amplifier design, a spectrum analyzer was developed to simplify the equalization alignment procedure. The analyzer, by means of a full -track play head tem- porarily mounted on the slave, looks at each of the auto -test frequencies just after they are recorded. The recorded frequen- cy responses are displayed by seven edgewise front -panel meters. This display makes the adjustment of the equalization controls for flat response a quick and easy job. The analyzer circuitry consists of a head preamplifier and seven narrow filters with meter drivers. The filters are
The prototype spectrum analyzer used for the slave record amplifier alignment. The seven meters show recorded frequency response at duplication speed. The demountable play head Is sitting on tap of the analyzer.
CLECLii7111
I 1 1 t.;'.
The Auto Control Panel with the master transport control buttons on the left, the slave copy counter preset switches in the center, and a count display on the right.
six -pole L -C types with op -amps for amplification.
Auto control panel design
The auto control panel was designed to control the functions of the master transport and its loading station and to provide start, stop, and count signals for the slaves as described previously. All of the logic and control circuitry is located on plug -in cards for serviceability. CMOS integrated circuits are used in the logic functions for noise immunity, and all motor controls are solid -state triac arrangements.
Master playback transport design
Grandy, Inc. transports have been used successfully over the years and, with only slight modifications, were upgraded for our 32X duplication system. Several areas that were redesigned included:
I) The pinch -roller actuating system.
2)H igh-speed motors and new flywheels.
3)An improved loop- basket system.
4)The playback electronics.
The pinch -roller power solenoids, originally mounted in back behind the flywheels, were increased in size and moved to the front. The tension adjust- ment and locking mechanisms were im- proved for reduced maintenance and greater reliability.
The 8- channel master playback amplifier was designed to provide a standard -level output signal from the 8 -track 240 in. /s playback head assembly for distribution to the slave record amplifiers. The fre- quency response of the playback amplifier was to extend flat to 480 kHz, which is equivalent to a 15kHz real -time frequency. This required that the capacitance of the head leads be reduced to prevent losses at this high frequency.
The amplifier, therefore, was made corn- pact enough to mount within two inches of the playback head. The smaller flywheels on the transport deck allowed the amplifier to be mounted in the deck just under the head assembly. The head cables then could plug directly into the individual boards in the amplifier. The playback amplifier was designed with removable boards for each one of the 8-
channels and with each board having the level and equalization controls available at the front. As designed, the playback amplifier is simple to service and align and provides playback response in real - time frequency from 7.5 Hz to 15 kHz within I dB. The noise level is 62 dB below a tape reference level of 185 nWb/ m. It will directly drive 200 ft of 95 -ohm coaxial cable with no degradation in
performance.
Master tape basket design
With the increase in master tape speed to 240 in./ s, smooth tape retrieval became a problem in the original loop baskets. A
new basket was made with internal barriers to separate retrieval tape from loading tape, thus preventing the weight of the stacked tape from bearing on the exiting tape. The basket became wider and heavier and presented a problem for operator handling.
To alleviate this problem, a two -basket system was designed to be used at the
station. A transfer system was designed to capture and move the basket between stations.
Conclusions
The new RCA high -speed tape - duplication system was designed to replace worn -out equipment, to increase duplicating efficiency, and to maintain the current high quality of RCA Stereo -8
tapes. The old equipment is being replaced with more reliable equipment that is easier to maintain. The efficiency has been increased by doubling the duplicating speed to 32X normal and by
improving the operating functions. In addition, the recorded quality has actual- ly been improved to a true high fidelity level.
Reference
I. Ruda. J.C.; "The eight -track cartridge: putting it all together" rhi.t issue.
37
www.americanradiohistory.com

How operations research yields dividends at RCA Records A. Devarajan M. Martin D. Mishra
Often criticized as too impractical for real -world decision -making, operations research can produce real savings, as these three case studies show.
o PER AIIONS RESEARCH is often described as the application of quantitative analysis for management decision making. Under this definition, the first operations researcher probably was that long- forgotten Italian. who, in the early fifteenth century, invented double -entry bookkeeping. But nobody talks of double -entry bookkeeping as operations research in the present time. The discipline in the currently un- derstood form originated during World War II under the stewardship of the Nobel Prize- winning British scientist, Dr. P.M.S. Blackett. During its early years, the applications were predominantly restricted to weapon- systems deployment and were characterized by an inter- disciplinary group approach and model- ing. the transition from the military to industry was accompanied by the "opulent universities" jumping onto the O.R. bandwagon and developing elegant and exotic mathematical models in- tended to simulate real -life decision - making problems. The proliferation of theoretical research work was surpassed only by the number of publications that extolled one aspect or another of a
particular technique or refinement. However, practice has lagged behind theory. and the performance that operations research promised has been
rather elusive.
Operations research theory vs practice
This gulf between theory and practice. promise and performance. has been recognized in recent years by academicians and operations research practitioners. Professor C. Jackson Grayson,' the chairman of the Price Commission during Phase II of President Nixon's Economic Stabilization
Reprint RE- 22 -3 -11
Final manuscript received May 3. 1976.
38
Program and a distinguished authority on operations research. places the responsibility mainly on the operations researchers:
I. Most operations researchers "simply do not understand the constraint of time on deci- sion making." The elegant operations research models are so time- consuming to build. test and use that managers charged with decision- making in real time cannot use them for selecting alternative strategies.
2. I he models That operations researchers build often call for substantial investment in data collection. the available data is not usually in the form models call for. and practitioners do not want to modify "theoretically correct" models to suit data collected for other purposes.
3. I he real -life problems of industry are often too difficult and complicated to he represented even by a complex model. I hus the practitioner has to necessarily adopt some simplifying assumptions. Such simplification strips the model of realism to such an extent that often the decisions made by the "scat of the pants" method are as good as the ones obtained from applying the model.
4. And finally. if simplification is necessary to select between alternative strategics. there are always simpler. less elegant. less sophisticated techniques of cost comparison a%ajlable for quick and dirty solutions in the required response tine.
In short. throughout the development of operations research. the emphasis "has been on techniques rather than on principles, on mechanics rather than on decisions, on tools rather than on results and above all, on efficiency of the part rather than on performance of the whole."2
Our dividend from O.R. - three case studies
Under the above scenario, we at RCA Records are proud that, at least in a
modest way. we have used model - building and quantification in a pur- poseful manner to provide answers to real business problems in our operations. The
constraint of time. lack of available data and. above all. the extremely dynamic nature of the music business often places expedience over elegance; and more often than not. simple straightforward cost comparisons have provided answers to the problems of time. Consciously. technique has been subordinated to purpose if a simple analysis could do the job, it has been preferred. In spite of this partiality towards being a service to help management decision -making rather than biasing ourselves toward blind professionalism, we can identify several applications which could truly be
considered better than crude attempts at quantification.
The rest of this article summarizes three diverse applications of operations research. Each solution corrected problems that existed during the last three years and yielded significant economic benefits.
Devendra Mehra and Dave D Ian's biographical sketches appear with their other articles in this issue.
Mel Martin, Manager. Industrial Engineering. Records Division, Indianapolis. Indiana. received a BS in In- dustrial Engineering from Purdue University in 1964 and an MS in Industrial Operations from I.U.P.U.I. in 1974.
Prior to joining RCA Records. Mr. Martin's work included industrial- engineering and supervisory activities with the metal -generation and paper- conversion industries. He started with RCA Records Engineering in 1969 in the Manufacturing Standards section. and later moved to SelectaVision where he partricipated in VideoDisc development as a Systems Engineer and Product Cost Estimator. In 1973 he transferred to the Industrial Engineering department and became its Manager in
1975.
www.americanradiohistory.com

Case study I - Queueing theory approach helps reduce labor costs The record manufacturing facility at LaSalle Street (Indianapolis) includes 132 manual presses for 12 -inch records and 41 manual presses for 7 -inch records. A machine operator, whose work consists of loading raw materials (compound and labels) and handling records, is assigned to two presses. In addition, each line of twelve presses is assigned a matrix setter, who has the general responsibility of keeping presses in a running condition. The matrix setter's work includes install- ing new production orders, changing stampers (a metal negative of the record that transfers music content), distributing parts (labels, stampers and production tickets), loading compound and assisting with the maintenance of record quality. The assignment of matrix setters to a line of presses evolved through experience. Management recognized that improved production and cost reductions would occur by using the matrix- setter work force more efficiently. Management and Engineering agreed that the key to im- proving this efficiency would be develop- ing a relationship between press waiting time and service time, which led to this study.
The decision problem
The decision problem is to determine the most economical assignment of matrix setters for a given production volume (number of presses running). The ob- jective is to minimize the total cost of matrix setter labor and machine waiting time. The problem situation is com- parable to the classical machine service queueing model (multi -channel, finite queue). In the terminology of queueing theory, the presses requiring service by a matrix setter represent the arrival of customers, and the job performed by matrix setters is synonymous with service.
Constraints
Management believed that the need to maintain a level of high -quality records and a separate level of normal- quality records made a totally centralized pool of matrix- setters impractical. It was also true that manual 7 -inch presses were about to be abandoned for new automatic presses. Hence, for the study, the press floor was divided into the east (or high -quality pool) with 84 presses,
and the west (or normal -quality pool) with the remaining 89 presses. Within each pool, two sub -pools were created for 12 -inch and 7 -inch records, respectively. The 7 -inch/ 12 -inch split was made in
order to avoid a complete reanalysis after 7 -inch record pressing was moved.
Describing the system in queueing theory terms
A queueing system is defined by its input or arrival process, queueing discipline and service mechanism. The basic system parameters were identified as follows:
Arrival process -The pattern of arrivals (presses needing service) into the system can be specified by the time between two successive breakdowns or needs for service. Arrivals occur from the population of presses running, and were found to have a
Poisson distribution.
Queueing discipline -This characteristic describes the order in which presses are
served. It is conceivable, depending upon the situation, that presses could be served using the discipline of FCFS (first -come, first -serve), LCFS (last -come, first -serve) or SIRO (service in random order). Since priority rules defining the order of service did not exist, and since presses could be
served in three ways (FCFS, LCFS and SIRO), the general service discipline (GD) was used.
Service mechanism -This parameter is
defined by the time required to complete the repair, and the number of servers (channels) used. Upon investigation, it was found that service time could be described by the
1600
1400
1200
CO
1000
E 800 R
H
T
600
400
200
Poisson distribution. At a particular point in time, queue size is determined by the number of non -productive presses, and the number of channels is determined by the number of matrix setters.
Defining the queueing system in this manner made mathematical analysis a
realistic and expedient solution without significantly compromising accuracy.
Solution procedure
A computer program performed a stan- dard queueing- theory analysis using the operating characteristics just given as its
inputs. The variable inputs to the program were the various values of the number of presses, the number of matrix setters, and the traffic intensity (breakdown rate per machine divided by the matrix setter's mean service rate).
Results
For each set of varying inputs the com- puter program yielded the expected number of presses waiting for service in
the queue and operating in the system. Subsequently, the expected waiting time per press in the queue and in the system were computed using the expected number of machines breaking down per unit time.
The most economical crew sizes were determined through the use of crew
TOTAL COST
MACHINE WAITING COST
OPTIMUM CREW SIZE
MINIMUM COST
2
SERVICE COST
3 4 5
CREW SIZE
Fig. 1 -1 - The cost of keeping a press idle while waiting for service decreases exponentially with the size of the service
crew, and the cost of that crew increases linearly with Its size. The total cost is the sum of the two, and it has a minimum point. In this case, the optimum crew size is four. The number of presses is 74, service traffic intensity is 0.03107. 39
www.americanradiohistory.com

optimization tables, which presented the machine waiting cost and service cost for the various crew -size possibilities at different production volume levels. The crew optimization table represents a family of curves, which enables operating costs to be minimized. Fig. l -1 shows a set
of curves constructed from the data for 74 presses running with a traffic intensity of .03107. Curve A represents the service cost, which increases linearly with crew size. Curve B represents machine waiting cost, which decreases exponentially with crew size. Curve C represents the total
cost and is the sum of curves A and B. It can be seen that the lowest total cost occurs with a crew size of four.
The overall impact of the pooled work force concept and queueing analysis was a reduction of 12 matrix setters per day.
Case study Il - Optimizing postal classifications saves $500,000 /yr This case study describes how a simple straightforward simulation of mail classification, coupled with plain com- mon sense, helped the company choose the most cost -effective mail classification strategy for its outbound mail.
Mail order business - the club approach
Any mail -order business, as the name implies, has to heavily depend upon the U.S. Postal Service for its transportation and delivery functions. The recorded - music industry had been traditionally using the Special Fourth Class classifica- tion for mailing prerecorded tapes and records to the members under the Club Marketing approach.
Fulfillment practices
The paperwork generated for picking club -member orders has been automated for several years. The computer - generated customer invoice serves as the picking document. Picking and packing are done under two different operational methods, depending on volume. The high- volume album selections are picked in bulk and packed using automatic packaging machines; the others are picked individually and packed manual- ly. The hulk- picking/ machine -packing mode accounted for the major volume of packages mailed, and since the picking and packaging operations were dis- tributed over several parallel channels, the integrity of the zip code sequence was non -existent as the mail came out of the packaging operation.
Accordingly, separate sorting operations had to be performed to satisfy Special Fourth Class mailing requirements and to provide service to customers within a reasonable time period. These sorting operations generally involved a 10 -way primary sorting into postal tubs based on the first digit of the zip code and an elaborate secondary sorting into three-
40
digit sectional center codes. (There are over 500 such sectional centers.) This secondary sorting was made into mail bags, which were then closed, tied, identified, palletized and loaded into the mail truck.
The battle between Fourth Class and Third Class
At least for the past four years, it has been recognized that there is postage cost savings in shipping single tapes as Bulk Third Class Mail instead of the traditional Special Fourth Class Mail. Typically, the Special Fourth Class has a flat charge per piece of mail up to one pound, beyond which the charge is in- crementally adjusted with weight. The Third Class Bulk Mail charge is based on the total bulk weight mailed at any one time, provided each piece is under one pound. Table 2 -1 gives the recent rates under the Third and Fourth Class Postage structure.
It was obvious that there was postage cost savings in mailing by Third Class for the 8 -track tape singles weighing about 51/2 oz per package and the cassette singles and doubles weighing 5 ozs and 71V ois per package, respectively, provided that there
were economic ways of satisfying the Bulk Third Class mailing constraints.
Third Class mailing constraints
The postal regulations' prescribe that the Bulk Third Class rate above will be applied to mailings of identical pieces separately addressed to different ad- dressees in quantities of not less than 50 pounds or of not less than 200 pieces. The packages of tapes and cassettes mailed by our Tape and Cassette Clubs easily satisfy these requirements and also the other general conditions, such as shape (rec- tangular) and size (minimim 3 in. X 4 in.). In addition, the postal regulations require mailers to unitize mail on a destination basis. Specifically, ten or more pieces of identical mail going to a single five -digit zip code must be bagged together in a No. 2 mail hag (which takes up to 30 pieces). Similarly, out of what is left over, ten or more pieces going to the same three -digit sectional- center code should be bundled together. 'I-he remainder gets further con- solidated as above into state bags and ultimately into mixed -state bags.
Satisfying the postal requirements for Bulk Third Class shipments and main-
Table 2 -1 - Postal rate structure gives an advantage to mailing tapes by Third Class, since they weigh 5 to 7 -1/2 oz. However, additional presorting costs required tor Third Class must also be considered.
Postage rates
Bulk Third Class Special Fourth Class Al the tinte of analysis
(3/74)
Current
(7 18 76)
S.32 per lb or frac- tion. Maximum weight per piece - I
Ib. Postage calculated on total hulk weight mailed at one time.
$.36 per lb or frac- tion. Maximum weight per piece- lb. Postage cal- culated on total bulk weight mailed at one time.
$.17 per piece of mail up to 1 lb. additional weight at $.08 lb. Postage calculated on number of pieces mailed.
$.25 per piece of mail up to I lb., Additional $.10 Ih through seven lb.
Postage calculated on number of pieces mailed.
www.americanradiohistory.com
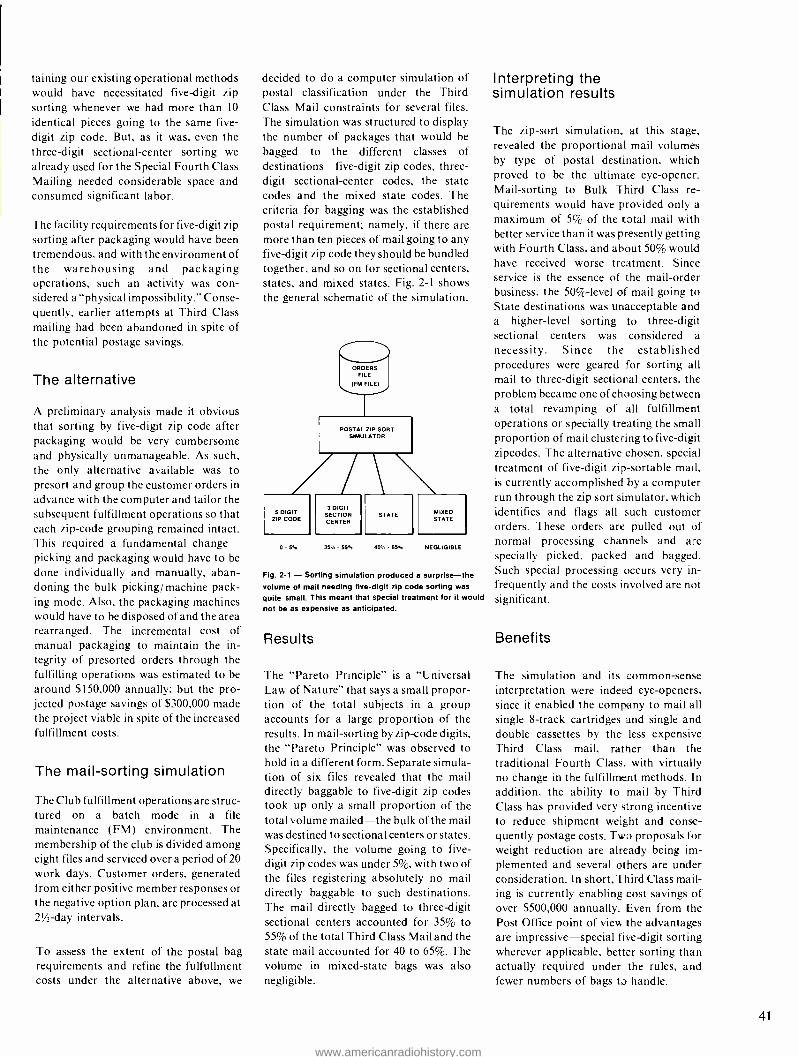
taining our existing operational methods would have necessitated five -digit zip sorting whenever we had more than 10
identical pieces going to the same five - digit zip code. But, as it was, even the three -digit sectional- center sorting we
already used for the Special Fourth Class Mailing needed considerable space and consumed significant labor.
The facility requirements for five -digit zip sorting after packaging would have been tremendous, and with the environment of the warehousing and packaging operations, such an activity was con- sidered a "physical impossibility." Conse- quently, earlier attempts at Third Class mailing had been abandoned in spite of the potential postage savings.
The alternative
A preliminary analysis made it obvious that sorting by five -digit zip code after packaging would be very cumbersome and physically unmanageable. As such, the only alternative available was to presort and group the customer orders in
advance with the computer and tailor the subsequent fulfillment operations so that each zip -code grouping remained intact. This required a fundamental change picking and packaging would have to be done individually and manually, aban- doning the bulk picking/ machine pack- ing mode. Also, the packaging machines would have to be disposed of and the area rearranged. The incremental cost of manual packaging to maintain the in- tegrity of presorted orders through the fulfilling operations was estimated to be around $150,000 annually; but the pro- jected postage savings of $300,000 made the project viable in spite of the increased fulfillment costs.
The mail- sorting simulation
The Club fulfillment operations are struc- tured on a batch mode in a file maintenance (FM) environment. The membership of the club is divided among eight files and serviced overa period of 20 work days. Customer orders, generated from either positive member responses or the negative option plan, are processed at 2'/ -day intervals.
To assess the extent of the postal bag requirements and refine the fulfullment costs under the alternative above, we
decided to do a computer simulation of postal classification under the Third Class Mail constraints for several files. The simulation was structured to display the number of packages that would be bagged to the different classes of destinations five -digit zip codes, three - digit sectional- center codes, the state codes and the mixed state codes. The criteria for bagging was the established postal requirement; namely, if there are more than ten pieces of mail going to any five -digit zip code they should be bundled together, and so on for sectional centers, states, and mixed states. Fig. 2 -1 shows the general schematic of the simulation.
0 - 5 °° 35% - 55% 40 %- 65% NEGLIGIBLE
Fig. 2 -1 - Sorting simulation produced a surprise -the volume of mail needing five -digit zip code sorting was
quite small. This meant that special treatment for it would not be as expensive as anticipated.
Results
The "Pareto Principle" is a "Universal Law of Nature" that says a small propor- tion of the total subjects in a group accounts for a large proportion of the results. In mail- sorting by zip -code digits, the "Pareto Principle" was observed to hold in a different form. Separate simula- tion of six files revealed that the mail directly baggable to five -digit zip codes took up only a small proportion of the total volume mailed -the bulk of the mail was destined to sectional centers or states. Specifically, the volume going to five - digit zip codes was under 5 %, with two of the files registering absolutely no mail directly baggable to such destinations. The mail directly bagged to three -digit sectional centers accounted for 35% to 55% of the total Third Class Mail and the state mail accounted for 40 to 65 %. The volume in mixed -state bags was also negligible.
Interpreting the simulation results
The zip -sort simulation, at this stage, revealed the proportional mail volumes by type of postal destination, which proved to be the ultimate eye- opener. Mail -sorting to Bulk Third Class re- quirements would have provided only a maximum of 5% of the total mail with better service than it was presently getting with Fourth Class, and about 50% would have received worse treatment. Since service is the essence of the mail -order business, the 50%-level of mail going to State destinations was unacceptable and a higher -level sorting to three -digit sectional centers was considered a
necessity. Since the established procedures were geared for sorting all mail to three -digit sectional centers, the problem became one of choosing between a total revamping of all fulfillment operations or specially treating the small proportion of mail clustering to five -digit zipcodes. The alternative chosen, special treatment of five -digit zip- sortable mail, is currently accomplished by a computer run through the zip sort simulator, which identifies and flags all such customer orders. These orders are pulled out of normal processing channels and are specially picked, packed and bagged. Such special processing occurs very in- frequently and the costs involved are not significant.
Benefits
The simulation and its common -sense interpretation were indeed eye -openers, since it enabled the company to mail all single 8 -track cartridges and single and double cassettes by the less expensive Third Class mail, rather than the traditional Fourth Class, with virtually no change in the fulfillment methods. In addition, the ability to mail by Third Class has provided very strong incentive to reduce shipment weight and conse- quently postage costs. Two proposals for weight reduction are already being im- plemented and several others are under consideration. In short, Third Class mail- ing is currently enabling cost savings of over $500,000 annually. Even from the Post Office point of view the advantages are impressive -special five -digit sorting wherever applicable, better sorting than actually required under the rules, and fewer numbers of bags to handle.
41
www.americanradiohistory.com

Case Study Ill - Linear regression analysis helps conserve steam Making reasonably accurate forecasts of energy requirements and controlling their variations in actual operations has become increasingly important in the face
of the energy crisis. This case study presents a successful application of the computer -aided forecasting technique of regression analysis for steam conserva- tion. The computer's ability to economically assimilate large amounts of data proved to be an indispensable aid to statistical analysis.
The system
The record manufacturing facility at LaSalle Street consists of 132 manual presses for 12 -inch records plus 41
manual and 12 automatic presses for 7-
inch records. Steam heats the press molds between which the plasticized compound flows under compression to produce a
"groovy" record. In the 12 -inch record press cycle of 30 seconds, steam is
provided for 10 -14 seconds at a pressure of 150 -160 lb/ in`. Two 25,000 -1b/ hr boilers provide steam for all the presses and the rest of the building. Steam usage is regulated for the entire press floor, not for individual presses.
The problem
Theoretical computation of the steam consumed per cycle had been known for years but had never been confirmed in
actual operation. In addition, forecasting steam usage and exercising control had never been scientifically possible because the actual steam consumption rates for the 7- and 12 -inch records, as well as line
loss due to friction, were unknown.
The model
Our model assumed that the steam con- sumed is determined by the number of l- and 12 -inch records produced, with a
constant steam loss in the distribution system. It gave
Y= a +b,x, +62x2.
where
Y = total consumption of steam per day (3 shifts), in thousands of pounds
= daily 7 -inch record production, in
thousands of units
x2 = daily 12 -inch record production, in
thousands of units
42
h, = consumption of steam per 7 -inch record, in pounds
b2 = consumption of steam per 12 -inch record, in pounds
a = constant = no -load steam consump- tion per day = average steam lost per day in the distribution system (pipe loss), in
thousands of pounds
The daily 7 -inch and 12 -inch production figures and the corresponding steam con- sumption were gathered for the previous six months. A simple computer program developed the prediction equation and the statistical characteristics.
Prediction equation
The data put into the computer program produced the following prediction equa- tion:
Y = 53.3 + 1.72x, + 4.06x2
Table 3 -1 compares actual values with ones predicted by this equation.
Table 3 -1 - Linear- regression model predicted steam usage closely, with a standard error of roughly 3% of the daily steam use.
Steam usage, thousands of pounds
Actual Predicted Actual Predicted
965 995 1080 1095
1038 1032 1032 1018
510 495 989 963
1080 1040 1050 1000
1104 1061 1014 1020
1104 1096 995 1018
1085 1117 953 980
1098 1098 977 971
570 587 1002 983
1020 1020 935 939
1044 1019 923 964 1122 1072 935 1040
Interpreting the test results
Supplementary statistics are generally used to test the validity of the equation results. They are:
I. Coefficient of determination (R2): This in- dex shows how good the equation is; it indicates the proportion of the variation in steam consumption explained by the equa- tion. The value of R2 = 0.95 obtained in this case means that a very large proportion of the steam consumption is explained by the production of 7- and 12 -inch records. A
degree of correlation of 1.00 is perfect.
2. F -test: This value pertains to the reliability of the relationship between each indepen-
dent variable and the dependent variable. For 2 and 21 degrees of freedom F(.0I) _ 5.78, but the value of F obtained from the rggression fit is 190.6, indicating that the two variables included are very significant.
3. Standard error of the estimate and con- fidence intervals: The standard error represents the error or imprecision in fitting the historical data. It normally expects about one -third of the actual results (steam consumption) to be outside a range of plus or minus one standard error from the estimate of the regression equation and one- twentieth to be outside a range of plus or minus two standard errors from the regres- sion estimate. Naturally, the smaller the standard error of estimate, the better the regression results. The standard error of the initial regression equation tested is 35,632. This means that if we estimate one day into the future, we can expect, with 65% con- fidence, that the actual steam consumption will be within a range of ±35,632Ib from the predicted value. (This standard deviation is
roughly 3% of normal daily steam use.)
Expected benefits
Linear regression has proven to be simple but a powerful tool for measuring effective steam usage. Now that a base has been established, we can use it to evaluate the impact of new molds or plastic compounds, on steam consump- tion or follow the trend in pipe loss.
Acknowledgments
We are sincerely grateful to a number of progressive individuals who have made these O.R. applications possible. J. Schoditsch was instrumental in locating the computer program for the queueing problem and assisting technically. The benefits of the Postal Mail Classification optimization were achieved through the enlightened leadership of D. Whiteherse and P. Finn, and the data processing support from J. Kocialski and T. Smith. Thanks are also due to J.C. Ruda whose painstaking search for the truth main- tained this investigation on the right course. C.O'D. Knue made the linear regression tool an effective means for monitoring steam consumption.
References
I. Grayson, C.J., Jr.; "Management sciences and business
practice Harvard Business Review, Jul - Aug 1973.
2. Drucker, P.F.; Management - Tasks, Responsibilities, Practices," Harper & Row, New York, 1975.
3. Taha, H.A. ; Operations Research -An Introduction, McMillan, New York, pp. 501 -537.
4. Mail Classification & Rates. Parts 134 and 135 (Issue 112),
U.S. Government Printing Office, Washington, D.C.
www.americanradiohistory.com

J.M. Frischei D. Mishra
At RCA Records, the indirect labor payroll (materials handling, inspection, cleaning, maintenance, etc.) amounts °o over $6 million. Applying engineered work standards to this
part of the labor force has provided substantial savings.
RECENTLY industry leaders have predicted that wage inflation will con- tinue, unit labor and material costs will
rise, and that price increases will not offset other costs. If we allow prices and costs to rise, prosperity could be easily lost. It is now universally recognized that productivity holds the key to both in- dividual prosperity and industrial success. Productivity is the only major
avenue left for controlling costs, boosting profits, and improving our economic climate. Two basic approaches for enhancing labor productivity are capital investment and control of labor through standards. This paper deals with the successful application of engineered in- direct labor standards for a major cost reduction in record and tape manufac- turing operations.
PROFESSIONAL 1985 MANPOWER
MAINTENANCE
CLERICAL OPERATION MUSIC SERVICE
INDIRECT LABOR: MANUFACTURING
INDIRECT LABOR: FINISHED GOODS WAREHOUSING
1965 DIRECT LABOR: TAPE MANUFACTURING
1955 DIRECT LABOR: RECORD MANUFACTURING
1968 1970 1972 1974 YEAR
1976 1978 1980
Fig. 1 - Evolution of labor control programs at RCA Records.
For many years the Record Division has been reducing labor costs by introducing labor -saving equipment, work study and simplification, improved manufacturing control and many other means. Fig. 1
depicts the up -to -date application of engineered labor standards in RCA Records Manufacturing and Distribu- tion, along with a forecast of potential applications. By the late sixties, practical- ly all the direct labor operations in record and tape manufacturing had been stan- dardized by Industrial Engineering. The early seventies saw the control of indirect labor in finished -goods warehousing.
A new frontier
An examination of the manufacturing costs and the past successful experiences with engineered direct labor standards convinced management that a system of indirect labor control would yield con- siderable dividends anc provide a solu- tion to the growing problem of productivity stagnation. Industrial Engineering was called upon to formulate a program to standardize and control all the indirect labor functions in manufac- turing, which constituted about 42% of total overhead costs, excluding employee service expense for direct labor. The
Reprint RE- 22 -3 -8
Final manuscript received May 28, 1976.
43
www.americanradiohistory.com

MATERIAL (60 %)
OVERHEAD (27 %)
RECORDED TAPE MANUFACTURING $
MATERIAL (40,o)
DIRECT LABOR AND E.S.E.
(22 °/o )
OVERHEAD (3a' -)
FIXED COST (17 %)
SUPERVISION (18 °%o)
FFICE LERICAL (B io)
INDIRECT LABOR AND E.S.E.
(42 °/o)
RECORD MANUFACTURING RECORD AND TAPE OVERHEAD COST $ COST $, EXCLUDING ESE ON
DIRECT LABOR
Fig. 2 - Cost breakdown for manufacturing records and tapes. Indirect labor forms a major part of overhead costs, which in turn make up a substantial portion of manufacturing costs.
annual labor to be standardized and controlled amounted to nearly $6.500,- 000. Fig. 2 gives a breakdown of record and pre- recorded tape manufacturing costs. In addition to the substantial potential for cost reduction, the diverse techniques required for a system of in- direct labor control provided a
formidable, motivating challenge to the Industrial Engineering Department.
System objectives
The primary objective of the system was established as:
James M. Frische, Manager. Operations Engineering, RCA Records. received a BS in Industrial Engineering in
1964 and an MS in Industrial Engineering in 1965 from Purdue University. He continued his education at Butler University in Indianapolis, where he joined the staff as a
part -time lecturer in the Graduate School of Business. In
1973, he received an MBA there. Mr. Frische joined RCA
in the Indianapolis Factory Engineering organization in
1966 and continued in Engineering until 1971, when he
became the Manager of Quality Control for the Record Plant. In 1972, he became Manager of Divisional Manufacturing Controls and Quality. He returned to the
Engineering organization in 1973 and established the
new Operations Engineering Group, which combined all
Record Division engineering efforts. Mr. Frische is a
member of AIIE, AES, Tau Beta Pi, and Alpha Pi Mu
engineering societies and honoraries; he was selected as
an Outstanding Young Man of America in 1974.
Design, develop and implement a manage- ment system for planning, scheduling and performance- monitoring of indirect labor in
order to increase productivity and maintain or improve customer service.
Five secondary objectives were also set up:
I. Develop work measurement standards for equitable work distribution and work efficiency measurement.
2. Systematize and streamline work flow to improve productivity and reduce the manufacturing cycle.
3. Develop and document operational procedures, and provide a basis for
Devendra (Dave) Mishra, Manager, Engineering Services, RCA Records, Indianapolis, received the Bachelor of Technology in Mechanical Engineering and Post- Graduate Diploma in Production Engineering from the Indian Institute of Technology at Kharagpur in 1966
and 1967, respectively. Upon the completion of his M.S.
in Industrial Engineering and Operations Research at
Purdue University in 1968, he joined RCA as an Industrial Engineer. Currently, he is responsible for the Industrial, Manufacturing and System Engineering Departments. He has been primarily engaged in developing con- tinuous assembly and packaging facilities for recorded - tape cartridges, improving productivity in warehousing and distribution operations, indirect labor control in
manufacturing, computerized and automated data gathering, specifying MIS requirements for manufac- turing and distribution, and scientific inventory manage- ment.
44
employee and supervisory training.
4. Permit more effective flexible budgeting with the help of manning charts and es- tablish operational cost standards.
5. Identify cost -reduction opportunities in the system of information and product flow, through work -simplification, methods im- provement, facility changes, automation, computerization, etc.
Economic justification
Management viewed the engineering and management cost of developing and im- plementing an indirect labor control system as an investment aimed at enhanc- ing labor productivity. The three basic components of economic justification are the cost- reduction potential, the cost of developing and operating the system, and the corresponding time dimension. It was realized that selecting appropriate work - measurement techniques affected the magnitude of the savings and the cost of
Fig. 3 - Factors determining cost- reduction potential.
Operational fat'tors
Production volume or activity level Number of operations within a department Degree of repetitiveness Cycle duration Degree of automation
Equipment utilization (if applicable) Task complexity Learning cycle .lob instruction
Degree of supervision required
Lviernal. /aacors
Load- forecasting accuracy
l.oad variability (seasonality. trend, random)
Service requirements Supervision style
Employee factors
Existing labor type Availability of skill (on the payroll) Turnover Absenteeism Ratio of male to female employees
Work environment factors
Workplace comfort Safety condition Air pollution
Others
Existence of productivity measurement I ype of productivity measurement
www.americanradiohistory.com

the program. A comprehensive attempt was therefore made to objectively analyze the economic justification for the program.
Determining the cost reduction potential
Traditional approaches for determining the productivity of indirect labor have been twofold, namely:
I. Performance against budgets established by historical experience
2. Ratio of indirect labor to direct labor costs
Generally, improvements in productivity have been obtained when management set improvement goals and then en- deavored to achieve them. Some of these approaches have been unscientific and intuitive, but quite effective in the short run, although their long -range im-
plications have been unfavorable. The ratio of indirect labor to direct labor costs, as a productivity index, can be quite erroneous in cases where capital investment has reduced direct labor or where purchased components have replaced in -house manufactured items. A
partially- objective approach for determining potential savings through the establishment of indirect labor stan- dards has been developed by analyzing the job and its environment. Fig. 3 lists some basic factors to be considered.
Fig. 4 presents the plant -wide population of'indirect labor and projects the cost - reduction potential possible with stan- dardized and controlled labor. A sub- jective estimation of the savings potential was made possible by ranking the factors mentioned above and assigning weights. The gross savings impact was projected to be $750,100 per year, a 15(ìí- reduction in
the indirect labor cost base.
Selecting a
work -measurement technique
The following work -measurement tech- niques are available for indirect labor control in manufacturing:
Predetermined standards Detailed Work Factor. Ready Work Factor. MTM, etc.
Standard data
Time study
Work sampling
Multiple linear regression analysis
Historical or budgetary standards
Fig. 5 illustrates an idealized cost -benefit relationship of the various work - measurement techniques. Curve A
represents the sum of the following basic costs:
I)The amortization cost of developing and implementing the work -measurement system. The useful life of a labor work - measurement is expected to be three to eight
Fig. 4 - Determining the potential savings for engineered standards is the first step in the process. Note that reductions are not always possible (Listing gives only partial sampling of areas examined for savings; total, however, is complete.)
Activity description
No. of indirect labor
employees
Present observed
labor eff. %
Major functional*
characteristics
Labor Indirect labor standards impact standards Expected Expected Expected coverage labor employee savings,
attainable % % reduction $1000'sr yr
Production control
Stock handlers 14.0 65 HR,HV,HL,MP 90 90 3.0 28.0
Material control
Collation 19.0 45 SR,HV,ML,MP 85 85 7.0 73.5
Warehousing 25.6 60 SR,HV 85 85 6.0 66.1
Receiving 8.0 SR,HV,ML,MP 85 85
Tool crib 12.0 70 NR,HV,ML,LP 70 90 1.0 10.6
Record quality control
Inspection 36.5 65 SR,HV,HL,LP,CS,HS 85 85 6.5 57.2
Maintenance 1.0 65 SR,LV,LL,LP,CS,HS Very low Group leaders 6.0 70 NR,HV,LL,MP Very low
Operating services
Cleaner/ sweepers 23.8 65 HR,HV,LL,HP 85 85 4.0 35.7
Maintenance mechanics 36.0 Reduction through management goal 2.0 29.0
Tape manufacturing
Material handlers 14 75 HR,HV,LL,MP I 00 95 3.0 32. I
Group leaders 23 75 NR,HV,LL,HP 80 85 2.0 18.5
Total 490.8 74.0 756.1
*,HR = Highly repetitive. SR = Semi -repetitive, NR = Non -repetitive HV = High volume, MV = Medium volume, LV = Low volume Hl. = High load variability, ML = Medium load variability, LL = Low load variability HP = High load predictability, MP = Medium load predictability, LP = Low load predictability, CS = Critical service, HS = High skill
45
www.americanradiohistory.com

ó U
46
PREDETERMINED TIME STANDARDS
1\
MULTIPLE REGRESSIO
ANALYSIS
OPTIMU OST 1
STOP WATCH TIMING
WORK SAMPLING
C TOTAL CC ST
COST OF 'NACCURACt
HISTORICAL OR BUDGETARY
STANDARDS
DECLINING ACCURACY - A
COST OF WORK MEASUREMENT TECHNIQUE
Fig. 5 - Work- measurement techniques -cost vs inaccuracy. Extreme accuracy is not cost -effective.
years. depending on the rate of capital investment poured into a function.
2) I he annual operating cost of maintaining labor standards and the management con- trol system.
Curve B represents the cost of inaccuracy in labor standards or the opportunity cost for an operation standardized with a
given work -measurement technique.
Curve C is the total cost curve, the sum of A and B. The most economical strategy for an operation to be standardized and controlled is indicated by the least -cost portion of curve C. Although the cost - benefit ratio is the ideal selection criterion for the best work- measurement tech- nique. other factors can prove to be
overriding considerations, such as in-
Fig. 6 - The work -measurement technique chose.. depends on number of factors.
dustrial engineering skills available, caliber of supervision, accuracy of labor standards required for disciplinary ac-
tion, management urgency for program savings, etc. Fig. 6 briefly gives a com- parative evaluation of the well -known work -measurement techniques.
Determining the program cost
The program costs were categorized as
follows:
One-time costs Enginering cost of data gathering. develop- ing labor standards. and implementing a
reporting system.
Operating ctist.1
Engineering cost of maintaining labor stan- dards
Management cost of the program coordinator
Operating clerical cost for the management reporting system
No attempt was made to quantify the
supervisor's time necessary in the
development and operation of the system.
Engineering costs were projected based
on the work -measurement technique selected and the operational and environmental factors presented in Fig. 3.
('riceriu
Historical production standards
Multiple regression analysis
Work sampling
Stop -watch tinting
Pre -determined lime standards
Engineering effort required for system development and implementation Minimal Low- Medium Medium Medium High
system maintenance Minimal Low- Medium Medium Medium High
Complexity of labor standard None Low Medium Med -High
Degree of work measurement accuracy Low Medium High High Very High
Provision of basis for methods improvement None None Low Medium Very Good
Training and skill required for operating management Low Low Medium Med -High High
Employee and management acceptability of standards (ease of understanding and administration)
Fair Fair -Good Fair -Good Very Good Good
Ease of labor standards enforcement Low Fair Good Good Good
Effectiveness in realising maximum savings
Very Low Fair Fair Good Very High
Program implementation cycle Very Short Short Medium Med -Long Very Long
Lime to realve savings Very Short Short Med -I.ong Long Long
Effectiveness in
manpower forecasting and scheduling. performance appraisal. and management reporting
Fair Average Ave -High High High
www.americanradiohistory.com

The work- measurement techniques selected, estimated engineering cost, assignment of industrial engineers, and a
time -table for all relevant stages of the program were all summarized in one projection, known as the "manufacturing indirect labor control status." It provided a powerful feedback tool for monitoring the progress of the total program.
The operating cost of the coordinator and clerical crew necessary for the manage- ment control system was estimated to be
$65,000 per year. The clerical staffing was
dictated by organizational con- siderations, the indirect labor population and the complexity of the control system.
Profitability of the investment
The classical technique of "payback period" capital budgeting quantified the indirect labor control program's return on investment. The initial investment, or engineering cost of developing and im- plementing the program, was $124,000.
Annual cash inflow = (depreciation ignored)
cost reduction - engineering cost of main- taining labor standards - management cost of coordinator and clerical staff =
$756,100- $47,000- $65,000 =
$644,100
Payback period (rears) =
Initial investment
Annual cash inflow
$124,400
$644,100 0.19 year or 2.3 months
Thus, it would take 2.3 months for the new program to recoup the money invested in its
development.
Anatomy of the
program development
A seven -step systems approach was rigid- ly followed in developing indirect labor control sytems in all major areas of manufactuirng.
Step 1-Investigate present system
Review existing methods, procedures and flow of information and product.
Review existing manpower forecasting, scheduling and control procedures, labor and production reporting systems, and financial budgets.
Make a preliminary identification of bases
for measuring production output that are meaningful to operating management, financial operations and engineering.
Identify business characteristics load variability, service requirements, ability to forecast.
Establish a datum and a method for determining project savings. Interview employees, assess their tasks and prepare task descriptions for all operations.
Step 2- Systems analysis
Analyze the indirect labor operations, apply techniques of work simplification and facili- ty and methods improvement; revise the operations where economically justified.
Review task descriptions with supervisor and employees, and finalize them.
'Vote: Operations should be revised only if
overall schedule is not disrupted.
Step 3- Develop work- measurement standards
Establish variables determining the produc- tion output for an activity.
Through a suitable work -measurement technique (Figs. 5 and 6) quantify work and establish indexes of hourly output with statistical significance.
Establish allowances for personal need, fatigue and delay, and obtain approval from Industrial Relations.
Develop manning charts for varying production levels.
Step 4 Develop an integrated manage- ment control system
Develop systems for monitoring labor efficiency (of the individual, operation and department), reporting production, plann- ing manpower, and scheduling.
Determine clerical manpower requirements for maintaining the management control system.
Step 5-System implementation
Document the new system to include methods of operations, output indexes, work -organization plan, management system for labor control, etc. Train supervisors and employees in the system of labor standards, production -reporting, time -keeping and efficiency measurement. In addition, train supervisors to use load forecasting, manpower scheduling, and productivity reporting.
Conduct a dry run and revise the system where necessary.
Step 6 -Internal audit
In conjunction with Financial Operations, measure the effectiveness and realization of the program objectives.
Step 7- Maintain standards
Continually maintain indirect labor stan- dards in order to reflect the current mode of operations. Audit the indirect labor stan- dards at established intervals.
In order to improve management of human resources, an indirect- labor- control program should contain not only a system of developing and applying standards to specific operations, but also a system for scheduling labor based on a
load forecast and a yardstick for measur- ing labor utilization. Fig. 9 shows the tool used for variable budgeting and forecasting. The report objectively measures personnel performance, scheduling effectiveness, and the
amounts of non- productive and lost time. The labor standards (unit of measure) are extended by a load forecast derived from historical trend data, yielding the man- power requirement. Earned hours are computed by taking the actual produc- tion volume times the corresponding labor standard. Finally, two basic perfor- mance indicators are developed as shown below:
c'i standard = measured hours - total available hours
7 departmental efficiency = earned hours measured hours
Absenteeism, load forecast error, excuses granted by supervisors and employee turnover significantly affect the utiliza- tion of indirect labor. The report was
generated weekly and proved indispen- sable for maintaining a high degree of indirect labor utilization.
Planning, scheduling and control To maximize program -goal accomplish- ment, the entire program was divided into individual projects on specific indirect labor functions. In conjunction with management, specific goals were set for cost reduction, selection of work - measurement techniques, assignments of industrial engineers, industrial engineer- ing manpower requirements (for data gathering, standards development, im- plementation and maintenance of stan- dards), duration of engineering study, and commencement date for cash flow. This plan combined project schedules and resource requirements and served as a very useful tool for management control of the program. A PERT network proved to be of academic interest only because it
did not display the industrial engineering resources and responsibilities.
47
www.americanradiohistory.com
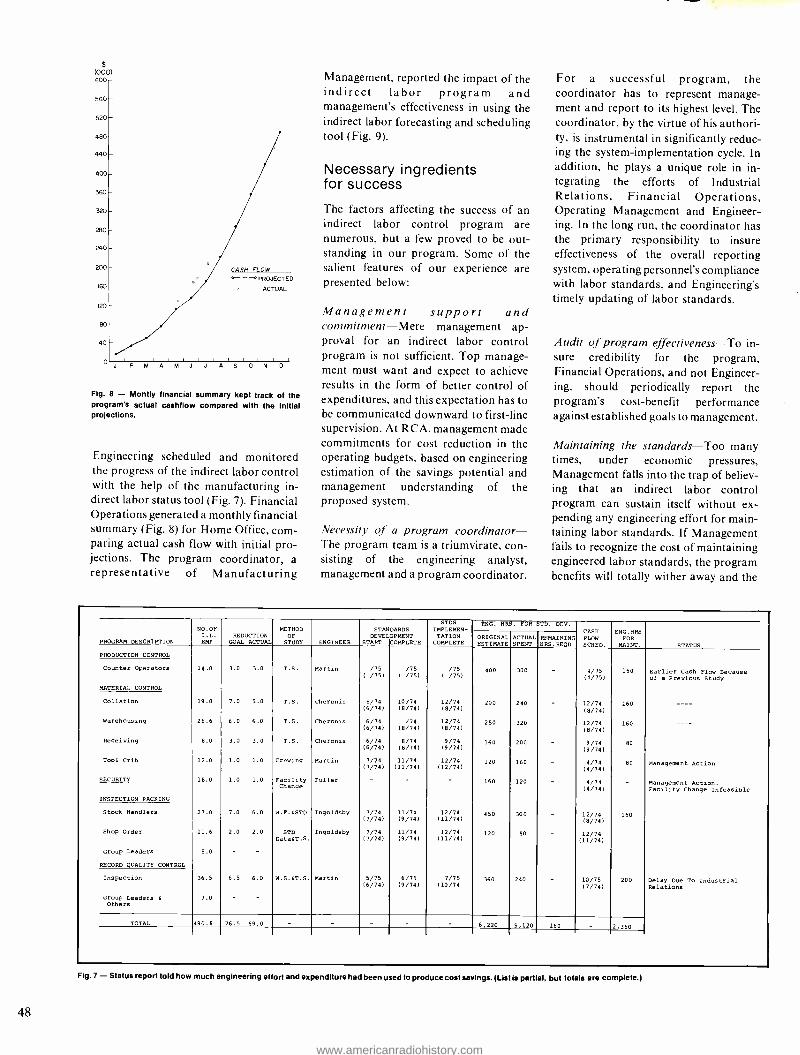
$ (000) 600-
560
520
490
440
400
360
320
280
240
200
160
120
90
40
F M A M J J A S O N D
Fig. 8 - Montly financial summary kept track of the program's actual cashflow compared with the initial projections.
Engineering scheduled and monitored the progress of the indirect labor control with the help of the manufacturing in- direct labor status tool (Fig. 7). Financial Operations generated a monthly financial summary (Fig. 8) for Home Office, com- paring actual cash flow with initial pro- jections. The program coordinator, a representative of Manufacturing
Management, reported the impact of the indirect labor program and management's effectiveness in using the indirect labor forecasting and scheduling tool (Fig. 9).
Necessary ingredients for success
The factors affecting the success of an indirect labor control program are numerous, but a few proved to be out- standing in our program. Some of the salient features of our experience are presented below:
Management support and commitment -Mere management ap- proval for an indirect labor control program is not sufficient. Top manage- ment must want and expect to achieve results in the form of better control of expenditures, and this expectation has to be communicated downward to first -line supervision. At RCA, management made commitments for cost reduction in the operating budgets, based on engineering estimation of the savings potential and management understanding of the proposed system.
Necessity of a program coordinator - The program team is a triumvirate, con- sisting of the engineering analyst, management and a program coordinator.
For a successful program, the coordinator has to represent manage- ment and report to its highest level. The coordinator, by the virtue of his authori- ty, is instrumental in significantly reduc- ing the system- implementation cycle. In addition, he plays a unique role in in- tegrating the efforts of Industrial Relations, Financial Operations, Operating Management and Engineer- ing. In the long run, the coordinator has the primary responsibility to insure effectiveness of the overall reporting system, operating personnel's compliance with labor standards, and Engineering's timely updating of labor standards.
Audit of program effectiveness -To in- sure credibility for the program, Financial Operations, and not Engineer- ing, should periodically report the program's cost -benefit performance against established goals to management.
Maintaining the standards -Too many times, under economic pressures, Management falls into the trap of believ- ing that an indirect labor control program can sustain itself without ex- pending any engineering effort for main- taining labor standards. If Management fails to recognize the cost of maintaining engineered labor standards, the program benefits will totally wither away and the
PROGRAM DESCRIPTION
NO.OF I.L. EME
REDUCTION GOAL ACTUAL
METHOD OF STUDY ENGINEER
STANDARDS DEVELOPMENT
START COMPLETE
STDS IMPLEMEN- TATION
COMPLETE
ENG. HRS. FOR STD. DEV. CASH FLOW ACHED.
ENG.RRS FOR
MAINT. STATUS ORIGINAL ESTIMATE
ACTUAL SPENT
REMAINING HRS.REQD
PRODUCTION CONTROL
Counter Operators 14.0 3.0 3.0 T.S. Martin /75 /75 /75 400 300 - 4/75 150 Earlier Cash Flow Because ( /75) ( /75) ( /75) (4/75) of a Previous Study
MATERIAL CONTROL
Collation 19.0 7.0 5.0 T.S. Cheronis 8/74 10/74 12/74 200 240 - 12/74 160 - - -- (6/74) (8/74) (8/74) (8/74)
Warehousing 26.6 6.0 6.0 T.S. Cheronis 6/74 /74 12/74 250 320 - 12/74 160 - - -- (6/74) (8/74) (8/74) (8/74)
Receiving 8.0 3.0 3.0 T.S. Cheronis 6/74 8/74 9/74 160 200 - 9/74 80 (6/74) (8/74) (9/74) (9/74)
Tool Crib 12.0 1.0 1.0 Crewing Martin 7/74 11/74 12/74 120 160 - 4/74 80 Management Action (7/74) (11/74) (12/74) (4/74)
SECURITY 18.0 1.0 1.0 Facility Fuller - - - 160 120 - 4/74 - Management Action. Change
(4/74) Facility Change Infeasible
INSPECTION PACKING
Stock Handlers 27.0 7.0 6.0 W.F.&STD Ingoldsby 7/74 11/74 12/74 450 300 - 12/74 160 (7/74) (9/74) 111/74) (8/74)
Shop Order 11.6 2.0 2.0 STD Ingoldsby 7/74 11/74 12/74 120 80 - 12/74 DataST.S. (7/74) (9/74) (11/74) (11/74)
Group Leaders 8.0 - -
RECORD QUALITY CONTROL
Inspection 36.5 6.5 6.0 W.S.&T.S. Martin 5/75 6/75 7/75 360 240 - 10/75 200 Delay Due To Industrial (6/74) (9/74) (10/74 (7/74) Relations
Group Leaders c
Others
TOTAL 490.8 76.5 69.0 - - - - - 6,220 5 120 160 - 2 350
Fig. 7 - Status report told how much engineering effort and expenditure had been used to produce cost savings. (List is partial, but totals are complete.)
48
www.americanradiohistory.com
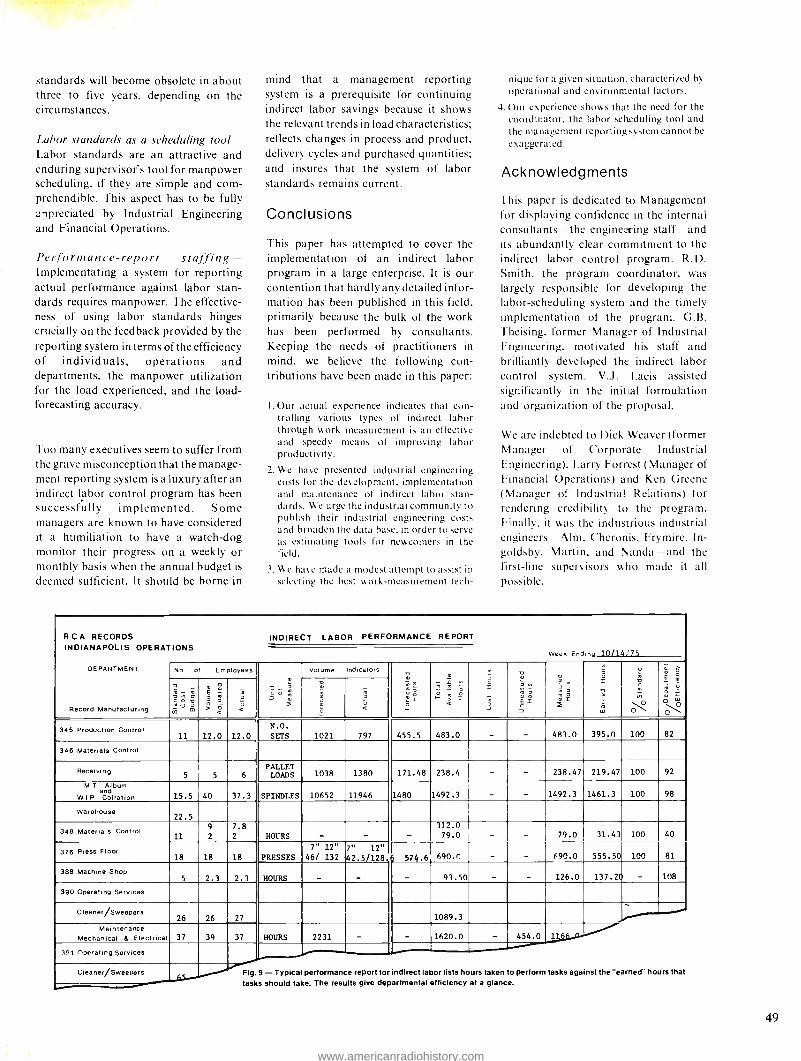
standards will become obsolete in about three to five years, depending on the circumstances.
Labor standards as a scheduling tool- Labor standards are an attractive and enduring supervisor's tool for manpower scheduling, if they are simple and com- prehendible. This aspect has to be fully a-tpreciated by Industrial Engineering and Financial Operations.
Performance-report staffing - Implementating a system for reporting actual performance against labor stan- dards requires manpower. The effective- ness of using labor standards hinges crucially on the feedback provided by the reporting system in terms of the efficiency of individuals, operations and departments, the manpower utilization for the load experienced, and the load - forecasting accuracy.
Too many executives seem to suffer from the grave misconception that the manage- ment reporting system is a luxury after an indirect labor control program has been
successfully implemented. Some managers are known to have considered it a humiliation to have a watch -dog monitor their progress on a weekly or monthly basis when the annual budget is
deemed sufficient. It should be borne in
mind that a management reporting system is a prerequisite for continuing indirect labor savings because it shows the relevant trends in load characteristics; reflects changes in process and product, delivery cycles and purchased quantities; and insures that the system of labor standards remains current.
Conclusions
This paper has attempted to cover the implementation of an indirect labor program in a large enterprise. It is our contention that hardly any detailed infor- mation has been published in this field, primarily because the bulk of the work has been performed by consultants. Keeping the needs of practitioners in mind, we believe the following con- tributions have been made in this paper:
I. Our actual experience indicates that con- trolling various types of indirect labor through work measurement is an effective and speedy means of improving labor productivity.
2. We have presented industrial engineering costs for the development, implementation and maintenance of indirect labor stan- dards. We urge the industrial community to publish their industrial engineering costs and broaden the data base. in order to serve as estimating tools for newcomers in the field.
3. We have made a modest attempt to assist in selecting the best work -measurement tech-
nique for a given situation, characterized by operational and environmental factors.
4. Our experience shows that the need for the
coordinator, the labor scheduling tool and the management reporting system cannot be
exaggerated.
Acknowledgments
This paper is dedicated to Management for displaying confidence in the internal consultants -the engineering staff -and its abundantly clear commitment to the
indirect labor control program. R.D. Smith, the program coordinator, was
largely responsible for developing the
labor- scheduling system and the timely implementation of the program. G.B. Theising, former Manager of Industrial Engineering, motivated his staff and brilliantly developed the indirect labor control system. V.J. Lacis assisted significantly in the initial formulation and organization of the proposal.
We are indebted to Dick Weaver (former Manager of Corporate Industrial Engineering), Larry Forrest (Manager of Financial Operations) and Ken Greene (Manager of Industrial Relations) for rendering credibility to the program. Finally, it was the industrious industrial engineers Alm, Cheronis, Frymire, In- goldsby, Martin, and Wanda and the first -line supervisors who made it all possible.
RCA RECORDS INDIANAPOLIS OPERATIONS
DEPARTMENT
Record Manufacturing
INDIRECT LABOR PERFORMANCE REPORT
Week Ending 1O /74[75
No of Employees
o
Volume Indicators
ÓI á I Éi = w
O t .
c
O O
°ó v , O m
-'
> á á LL
- <
345 Production Control 11 12.0 12.0
N.O.
SETS 1021 797 455.5 483.0 - - 483.0 395.0 100 82
346 Materials Control
Receiving 5 5 6
PALLET LOADS 1038 1380 171.48 238.4 - 238.47 219.47 100 92
M T Album and
WIP Collation 15.5 40 37.3 SPINDLES 10652 11946 1480 1492.3 - - 1492.3 1461.3 100 98
Warehouse 22.5
348 Materials Control 11 2
7.8
2 HOURS - - -
312.0 79.0 - - 79.0 31.43 100 40
376 Press Floor 18 18 18 PRESSES
7" 12"
46/ 132
-
7" 12" 42.5 /128,
-
574.6-
-
690.0
93.50
-
-
-
-
690.0
126.0
555.50
137.20
100
-
81
108 388 Machine Shop
5 2.3 2.3 HOURS
390 Operating Services
Cleaner/Sweepers 26 26 27 1089.3
hours that
Maintenance Mechanical 8 Electrical 37 39 37 HOURS 2231 - - 1620.0 - 454.0 11
the "earned-
3g1 Operating Services I' performance report for indirect labor lists hours taken to perform tasks against - Typical Cleaner /Sweepers Fig.9
L
49
www.americanradiohistory.com

5(1
Anatomy of an equipment -selection decision A. Devarajan
"For rational decision making, we require some kind of measurement. As much as
possible, this measurement should be based on numbers, not on words. " -Executive Decisions and Operations Research, M.K. Starr and D.W. Miller
IN MAKING decisions on equipment procurement, considerable emphasis has been placed on investment justification, as evidenced by the capital - appropriations approval mechanism. The disciplines of industrial engineering and financial management have well - known quantitative yardsticks for choos- ing between available investment alter- natives with respect to concepts of profitability, such as payback period and discounted cash flow analysis. After the financial feasibility is established, however, it is a formidable task to select the best available equipment from a range of alternatives that all satisfactorily per- form the function required by the invest- ment. Specifically, in selecting equipment manufactured by one vendor against competitive equipment produced by
Dave A. Devarajan, Engineering Staff, RCA Records, Indianapolis. Ind., specializes on consultancy -type assignments of a technical /financial nature. A Mechanical Engineering graduate from Kerala Universi- ty in India, he has done postgraduate work in industrial engineering in Paris and holds an MS in Industrial Management from Purdue University. He has over 14
years of operational, teaching and consulting ex- perience in industrial engineering in India and the United States. A Senior Member of the American Institute of Industrial Engineers, he is a Registered Professional Engineer and a Certified Public Accountant.
Reprint RE- 22 -3 -9
Final manuscript received April 6, 1976.
others, the decision- making process has been subjective and has lacked quantitative analysis. But under the in- tegrated management of Operations Engineering, we at RCA Records have attempted to develop new approaches to quantify the predominantly qualitative equipment -selection problem.
Scope of the problem
After the financial viability of the proposal has been generally established, there are two approaches to select an equipment for a particular function:
The RFQ approach
In this method, engineers fully design and specify the machine in -house and invite vendors to quote on the machine com- plete to the specification. This is a request for quotation (RFQ), and the vendor is
expected to provide his price to produce the equipment exactly per specifications. The background engineering work re- quired to produce the drawings and specifications will be extensive and the purchaser should have expertise equal to or greater than the supplier's. The selec- tion process itself is simple choose the vendor that quotes the lowest price.
The RFP approach
Here, the engineer generally describes the problem, specifies the performance re-
quirements and invites vendors to submit their proposals. This is a Request for Proposals (REP). Each vendor can and will submit comprehensive proposals, which may be at variance in one or several aspects with those of other vendors. Selecting the best piece of equipment from the several available is very often done purely on an "I like it" basis.
Full design of an equipment and selection of the vendor based on price (RFQ approach) is of limited value for com- panies except those in the machinery - manufacturing business. We get involved in this kind of selection occasionally when new electronic gear or a new machine developed in -house is to be procured in quantities. In all other cases, equipment procurement is limited to selecting one proposal from a range of several proposals, all satisfying our minimum performance requirements (RFP ap- proach). Establishing relevant criteria for evaluation and measuring them against a defined scale are of paramount impor- tance in such a selection process.
Measurement - objective and subjective
The progress of scientific systems is in no small measure attributable to the development of objective tools for physical measurement. However, the measurement of human and subjective quantities is in an elementary stage com- pared with physical measurement. Since measurement provides information and this information is the logical basis for decision- making, the quality of the deci- sion will depend greatly upon the quality of measurement. Most decisions that count require a value assessment in- tegrating tangible and intangible factors. The need for a measurement system for such decisions is obvious.
A case study - selecting a packaging machine
In selecting this machine, we encountered a decision problem that needed an in- tegration of tangible and intangible measurements. The economic viability of the packaging process and the necessity for a packaging machine had already been established through the concept of return on investment. Not being in the machinery manufacturing business, we could establish performance criteria only in general terms by way of specifications. Obviously, we had to resort to the request for proposal (RFP) equipment procure- ment approach. The response to the invitation for submitting proposals was good, proving that there was competition in the marketplace and in addition, presenting us with a decision -making problem. This decision process involved the following steps:
www.americanradiohistory.com

Table I - Descriptive evaluation of filmwrap packaging machine features. In this step, the group decides what features are important and describes them for each machine.
Feature description Machine B
1. Wrap design
2. Purpose basic machine was designed for:
Application for cartridge - wrapping
3. Features of machine design a. Cartridge
feeding
b. Film feed &
cut -off
c. Cartridge movement through machine during folding of film
d. Heat- sealing
e. No- product, no -film feature
4. Film material specs:
5. Other machine features:
a. Adaptability for tearstrip application
b. Loading of film rolls
Cigarette -type wrap: product pushed against center of sheet forming a horizontal U, ends of sides tucked and top and bottom folded in overlap sequence; third side also tucked and folded. Hot bar seal for the three sides.
Originally designed for cigarette - package wrapping.
Three wrap machines presently used for cartridge -wrapping by one of our competitors.
Veritical hopper feeding, cartridges singulated and peeled off from bot- tom using flight lugs.
Continuous film feed; film folded over cartridge as mandrel and cut off using rotary knife.
Accomplished by friction of the package with the belt conveyor.
Hot sealing bars seal the three folded sides.
Since the product acts as mandrel, this feature is inherent in the machine.
Polypropylene film -Hercules BX
film is reported to be the only suitable available film. (Mobil film is
reported to be a good substitute.)
Machine D
Double point end fold: tube formed around product and seamed; ends of two sides tucked, and top and bottom folded in overlap sequence. Hot bar seal for the seam and for the two sides.
Originally designed for a variety of applications in food and other in- dustries.
No cartridge -wrapping application yet.
Vertical hopper feeding, cartridges singulated and peeled off from bot- tom using flight lugs.
Continuous film feed and cut -off using rotary knife. The piece of film is then folded over cartridge.
Accomplished by an overhead chain conveyor with flight lugs that push the product thru the ploughs.
Hot bars seal the overlapping seam and the two folded sides.
Existence of product is sensed separately and film cut only if the product exists in the area.
Can use a variety of cellophane and polypropylene films.
Tearstrip attachment could be easi- Tearstrip attachment could be easi- ly installed. ly installed.
Film rolls have to be loaded at a high Film is loaded almost at the floor level. level.
Evaluation
Both wrap designs have been ex- tensively used for various wrapping applications over the years.
Both machines were initially designed for other purposes but are adaptable for our purpose.
Machine B is superior because of its actual application on cartridge mail wrapping.
The two machines are equivalent in
every respect.
Machine B appears to have more positive control of film even though Machine D also was observed to perform exquisitely.
Machine D is superior because of the positive flight lugs propelling the product through the folding ploughs.
The two machines are equivalent in
this respect.
Machine B has more positive "no product, no film" feature.
With Machine B, we will be limited in our sources for basic film supply. Machine D can use a variety of films and, therefore, is superior.
The two machines are equivalent.
Machine D is superior in this respect.
Step I Making a descriptive evaluation of the machine features available in the range of machines considered
Step 2 Selecting key aspects for evaluation
Step 3 Establishing the measurement system
Step 4 Applying the measurement
Step 5 Decision
Making the descriptive evaluation
Some of the responses to the RFP were
rejected after a cursory evaluation as
beyond the price range used as basis for the initial economic evaluation or otherwise unsuitable. From a total of about a dozen responses, the list was
shortened to four "probables" at this preliminary phase. Visits were then made
to facilities where these "contenders" were operating. On the basis of the
observations made during the visits, dis- cussions with the vendors and the facts
presented in the proposals, com- prehensive descriptions of the machines, feature by feature, were developed. Table
I presents a part of this descritpive evaluation.
Selecting key aspects
The importance of economic factors such
as price, delivery and speed was obvious. In addition to these, several other factors were included to recognize the versatility of the equipment, design features per-
taining to performance and safety, and
prior experience. The descriptive evalua- tion under Step I was very useful at this
51
www.americanradiohistory.com
52
The scientifically- chosen "winner"
stage of defining these key factors. Economic factors such as price, delivery and speed could have been combined under one head; but the importance of delivery and speed was considered even greater than the advantage they could pros ide in quantifiable monetary terms.
Establishing the measurement system
the method ol assigning objects to classes
(Ranking Method) was considered too subjective for the purpose on hand and therefore inferior to the method of assign- ing numbers to factors (Point Evaluation Plan). Much like in a Job Evaluation System, the key aspects identified in Step 2 were subjected to an introspective evaluation to establish their relative value for the overall function of the equipment. This subjective evaluation was further refined to establish numbers as weights or the importance attached to each
factor. For each attribute considered, five levels or degrees of accomplishment were
defined. Now we had a complete set of relevant factors, their relative magnitude of importance and a scale against which any object could be measured; in short, we were ready for the actual application of the measurement. Table II shows the definition of attributes and the levels that we assigned in this evaluation.
Applying the Measurement
Selecting key aspects, establishing weights. and defining the levels of ac- complishment gave us a quantitative basis for a qualitative decision. In order
to reduce bias, the measurement system was developed by a four- person group whose members represented widely - varying backgrounds and responsibilities. Assigning the degrees of accomplishment was also done on a
group- decision basis. Table III shows the factors evaluated, weights assigned and the point values scored by each of the machines considered.
The decision
With the point values for all factors added, the equipment choice was
obvious. Decision- making became a
question of selecting the machine with the highest points. As one added precaution, we checked the sensitivity of the decision to reassigning levels and weights in those cases where there was not complete con- fidence in the original assignment.
Conclusion
The foregoing decision -making problem involves integrating qualitative and quantitative factors into an overall value judgment. Obviously, the factors con-
Table II - Definitions of attributes and degrees for fitmwrap packaging machines. In this step, the group decides how much credit each feature is worth.
1. Price: Total cost of procurement of the system for film- wrapping single or double cartridge, complete with envelope dispenser, film - registration unit, hopper- feeding of cartridges, and shrink tunnel.
Attribute $45,000 and over 40,000 to 45,000 35,000 to 40,000 30,000 to 35,000 25,000 to 30,000
Degrees 1
2
3
4
5
2. Delivery: Committed delivery date for the completed and duly - inspected equipment at our facilities. Based on the Feb 2, 1976 implementation date, the machine should be here before January 1.
Any delays beyond that date are penalized in the evaluation.
Attribute Apr 1 - Apr 30 Mar 1 - Mar 31
Feb 1 - Feb 29 Jan 1 - Jan 31
Before Jan 1
Degrees 1
2
3
4
5
3. Speed: Operating speed at which the machine is expected to run reliably when wrapping Stereo -8 single cartridges. The minimum speed required to meet our capacity requirements is 45 units /min; each
increase of ten units /min can produce labor cost -savings of $3000 annually.
Attribute (Units/Min) 40 to 50 51 to 60 61 to 70 71 to 80 81 to 90
Degrees
1
2
3
4
5
4. Ability to handle different films: Machine's facility for multiple - sourcing of the film required for wrapping. The machines may han- dle different films with or without requirements for change parts.
Attribute Degrees Can handle only one type 1
polypropylene made by one supplier Can handle any poly- 2
propylene film, but will require change parts
Can handle any poly- 3
propylene film, does not require change parts Can handle any film 4
(polyethylene, poly- propylene, cellophane or paper) but requires change parts
Can handle any film- 5
no change parts required
5. Single- source responsibility for entire system: Manufacturer's willingness to be responsible for the total package including envelope dispenser, shrink tunnel, wrapper, etc.
Attribute
Will take responsibility only for wrapping unit
Will take responsibility for the entire system, but part of the system is adapted from existing outside hardware
Will take full responsibil- 5
ity for the entire system
Degrees
1
4
6. Design:
6.1 Simplicity of design: Ap- plication of machine design principles that could be easily com- prehended by machine operators, repair mechanics, engineers, etc.
Attribute Degrees
Extremely difficult design- 1
design features are so difficult to comprehend that it requires an engineer to understand them
Difficult design - only skilled mechanics can understand it with experience
2
www.americanradiohistory.com

sidered relevant, the weights assigned and the levels of accomplishment should be
tailored to individual situations. As in this case, a group approach to selecting factors and weights will somewhat temper the intrusion of human variabili- ty. A point evaluation system like this one
could be developed to evaluate any equip- ment or system, such as machine tools, plastic extrusion presses and computer sytems. It presents a low -cost alternative to developing full and detailed specifications for procurement, and at the same time obtains the best value for the investmi ut with a certain amount of objective_ ,rid confidence.
Acknowledgment
The author wishes to acknowledge the contributions of J. Savoldi, L. Mehaffey and D. Peele, who participated in the
packaging -machine selection process as
the members of the evaluation team. Thanks are also due to J. Frische and D. Mishra for their encouragement during the evaluation phase and the preparation of this paper.
Table Ill - Point evaluation of filmwrap packaging machine. After the other steps have been done to quantity the
decision, this step produces the "winner" by simple arithmetic.
Attribute Attribute Weight A
Machine points B C D
1. Price 5 20 15 15 10
2. Delivery 5 25 10 20 10
3. Speed 15 15 30 60 45
4. Ability to handle different films 10 30 10 10 30
5. Single- source responsibility 10 10 50 50 40
6. Design: 6.1 Simplicity 10 40 20 20 50
6.2 Positive features 15 30 60 60 30
7. Prior use 10 10 50 40 20
8. Other features: 8.1 Facility for 3 & 4 cartridges 3 12 12 9 9
8.2 Safety features 7 35 35 35 28
8.3 User recommendation 7 28 7 14 35
8.4 Space requirement 3 12 9 12 6
Totals 100 267 308 345 313
Average design-mechanics 3 building wrapping machines in
with average skill can general and filmwrap machines for understand machine after 8 -track cartridges in particular some experience
Simple design- 4
mechanics can easily understand machine
Extremely simple design- 5
even machine operators can understand most features
6.2 Positive design features: Pos- itive features of machine's design that enable positive control of the cartridge and film, and inherently advantageous design features (continuous motion vs iintermittent, rotary vs reciprocating, etc.)
Attribute
Has built only wrap machines
Has built wrap machines and integrated with other auxiliary systems
Has built filmwrap machines for specific 8 -track cartridge mailing application (including envelope dispensers etc.)
8. Other major features
Degrees
1
3
5
Attribute
Very few positive features
A few positive features
Average amount of positive features
Considerable positive features
Almost full of positive features
Degrees
1
2
3
4
5
8.1 Facility to handle 3's & 4's
Attribute Degrees
Can handle singles only 2
Can handle singles 3
and doubles
Can handle sizes 4
1,2,3, and 4
Can handle various sizes 5
8.2 Safety features and OSHA requirements
7. Prior use for similar application: Extent of prior experience the machine manufacturer has in
Attributes Unsafe features that can- not be guarded exist
Degrees 1
Few unsafe features but could be guarded
All unsafe areas fully guarded
3
5
8.3 Recommendation of users re- garding reliability anc maintenance
Attribute
Leaves much to be desired
Satisfactory
Reasonably good over a few years
Very good over a few 4
years use
Extremely good based on 5
use over a large number of years
Degrees
1
2
3
8.4 Space requirements
Attribute Degrees
Extremely large and 1
difficult to lay out Requires average space, 2
but does not fit reasonably well
Requires average space, 3
lays out reasonably well
Only small area required 4
Extremely small area re- 5
quired, fits very well 51
www.americanradiohistory.com
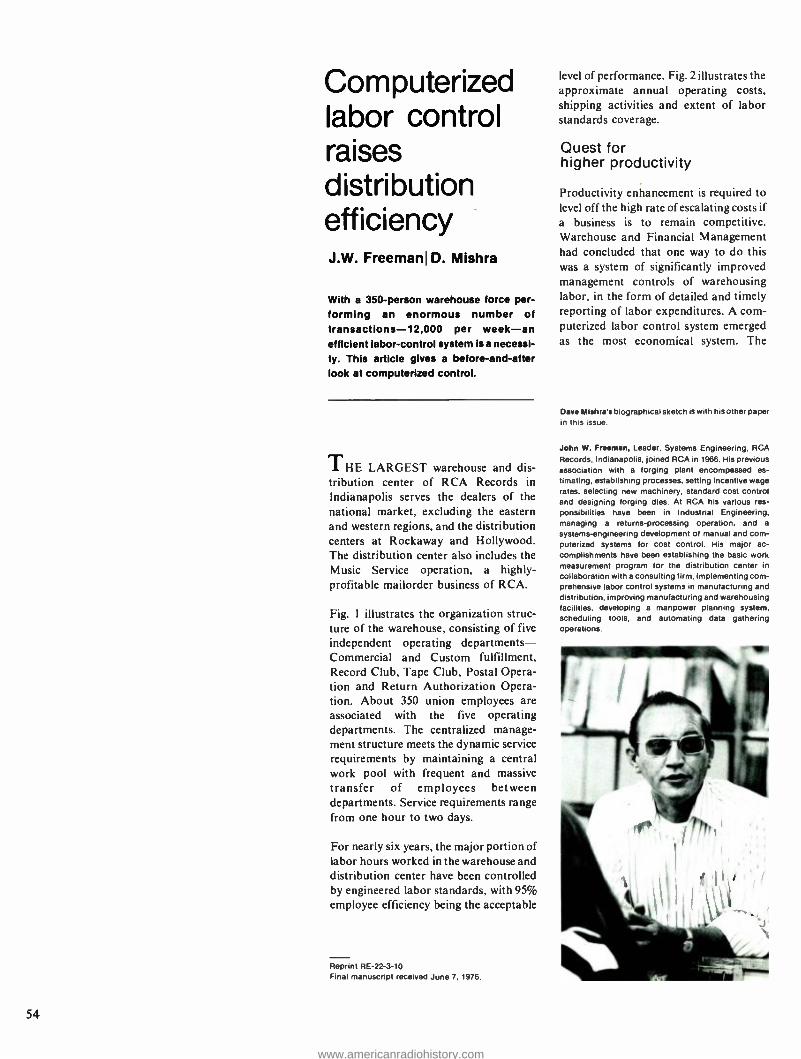
Cornputerized labor control raises distribution efficiency J.W. Freemanl D. Mishra
With a 350- person warehouse force per- forming an enormous number of transactions- 12,000 per week -an efficient labor- control system is a necessi- ty. This article gives a before -and -after look at computerized control.
THE LARGEST warehouse and dis- tribution center of RCA Records in Indianapolis serves the dealers of the national market, excluding the eastern and western regions, and the distribution centers at Rockaway and Hollywood. The distribution center also includes the Music Service operation, a highly - profitable mailorder business of RCA.
Fig. I illustrates the organization struc- ture of the warehouse, consisting of five independent operating departments - Commercial and Custom fulfillment, Record Club, Tape Club, Postal Opera- tion and Return Authorization Opera- tion. About 350 union employees are associated with the five operating departments. The centralized manage- ment structure meets the dynamic service requirements by maintaining a central work pool with frequent and massive transfer of employees between departments. Service requirements range from one hour to two days.
For nearly six years, the major portion of labor hours worked in the warehouse and distribution center have been controlled by engineered labor standards, with 95% employee efficiency being the acceptable
Reprint RE -22 -3-10 Final manuscript received June 7, 1976.
54
level of performance. Fig. 2 illustrates the approximate annual operating costs, shipping activities and extent of labor standards coverage.
Quest for higher productivity
Productivity enhancement is required to level off the high rate of escalating costs if a business is to remain competitive. Warehouse and Financial Management had concluded that one way to do this was a system of significantly improved management controls of warehousing labor, in the form of detailed and timely reporting of labor expenditures. A com- puterized labor control system emerged as the most economical system. The
Dave Mishra's biographical sketch is with his other paper In this Issue.
John W. Freeman, Leader, Systems Engineering, RCA Records, Indianapolis, joined RCA in 1966. His previous association with a forging plant encompassed es- timating, establishing processes, setting incentive wage rates. selecting new machinery, standard cost control and designing forging dies. At RCA his various res- ponsibilities have been in Industrial Engineering, managing a returns -processing operation, and a
systems -engineering development of manual and corn - puterized systems for cost control. His major ac- complishments have been establishing the basic work measurement program for the distribution center in collaboration with a consulting firm, implementing com- prehensive labor control systems in manufacturing and distribution, improving manufacturing and warehousing facilities, developing a manpower planning system, scheduling tools. and automating data gathering operations.
www.americanradiohistory.com
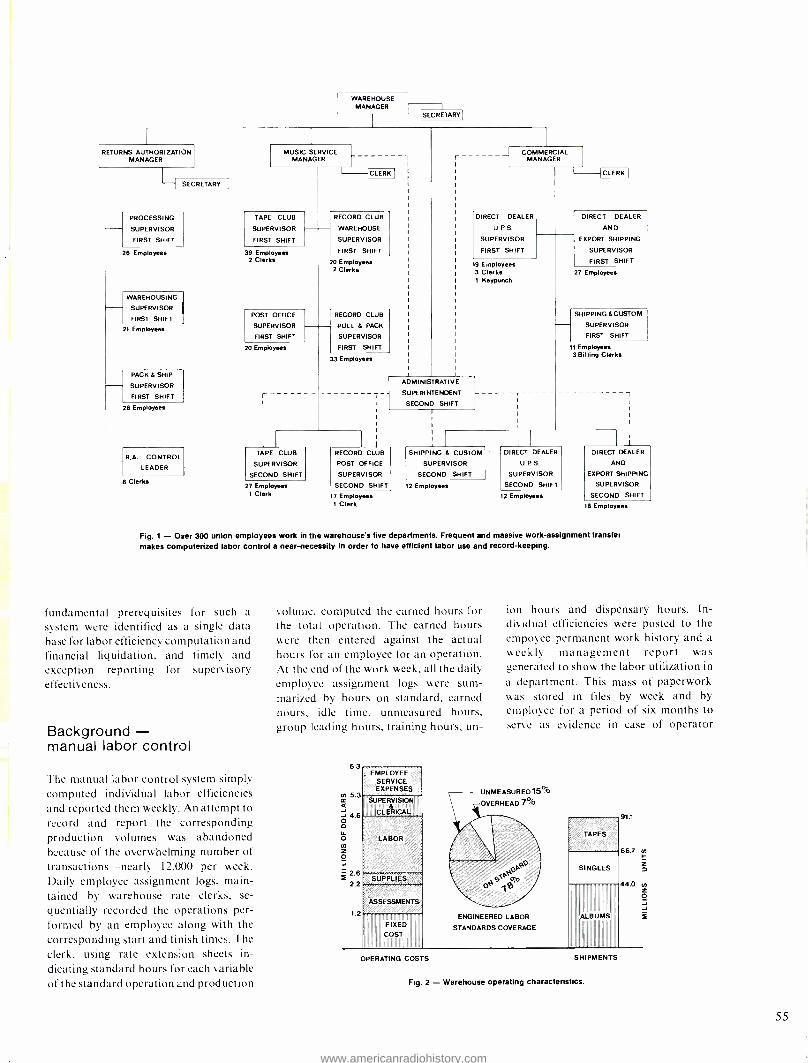
WAREHOUSE MANAGER
SECRETARY
RETURNS AUTHORIZATION MANAGER
-I SECRETARY
PROCESSING
SUPERVISOR
FIRST SHIFT
26 Employees
WAREHOUSING
SUPERVISOR
FIRST SHIFT
21 Employees
PACK & SHIP
SUPERVISOR
FIRST SHIFT
26 Employees
MUSIC SERVICE MANAGER
TAPE CLUB
SUPERVISOR
FIRST SHIFT
39 Employees 2 Clerks
POST OFFICE
SUPERVISOR
FIRST SHIFT
I {CLERK I
RECORD CLUB
WAREHOUSE
SUPERVISOR
FIRST SHIFT
20 Employees 2 Clerks
20 Employees
r
RECORD CLUB
PULL & PACK
SUPERVISOR
FIRST SHIFT
33 Employees
r COMMERCIAL MANAGER
DIRECT DEALER
U. PS.
SUPERVISOR
FIRST SHIFT
9 Employees 3 Clerks I Keypunch
ADMINISTRATIVE
SUPERINTENDENT
SECOND SHIFT
(CLERK I
DIRECT DEALER
AND
EXPORT SHIPPING
SUPERVISOR
FIRST SHIFT
27 Employees
SHIPPING &CUSTOM
SUPERVISOR
FIRST SHIFT
1 Employees 3 Billing Clerks
TAPE CLUB RECORD CLUB SHIPPING & CUSTOM DIRECT DEALER DIRECT DEALER R.A. CONTROL
LEADER SUPERVISOR POST OFFICE SUPERVISOR U.P S. AND
SECOND SHIFT SUPERVISOR SECOND SHIFT SUPERVISOR EXPORT SHIPPING 8 Clerks
27 Employees SECOND SHIFT 2 Employees SECOND SHIFT SUPERVISOR 1 Clerk 7 Employees 2 Employees SECOND SHIFT
1 Clerk 18 Employees
Fig. 1 - Over 300 union employees work in the warehouse's live departments. Frequent and massive work- assignment transfer makes computerized labor control a near -necessity in order to have efficient labor use and record -keeping.
fundamental prerequisites for such a
system were identified as a single data
base for labor efficiency computation and
financial liquidation, and timely and
exception reporting for supervisory effectiveness.
Background - manual labor control
The manual labor control system simply computed individual labor efficiencies and reported them weekly. An attempt to record and report the corresponding production volumes was abandoned because of the overwhelming number of transactions nearly 12,(X)0 per week.
Daily employee assignment logs, main- tained by warehouse rate clerks, se-
quentially recorded the operations per- formed by an employee along with the
corresponding start and finish times. The
clerk, using rate extension sheets in- dicating standard hours for each variable of the standard operation and production
volume, computed the earned hours for the total operation. The earned hours were then entered against the actual hours for an employee for an operation. At the end of the work week, all the daily employee assignment logs were sum- marized by hours on standard, earned hours, idle time, unmeasured hours, group leading hours, training hours, un-
6.3
m s.3 á
4.6 ó Ó
ó 7.1
2.6
2.2
1.2
EMPLOYEE SERVICE EXPENSES
SUPERVISION
CLERICAL
ASSESSMENTS
FIXED
COST
ion hours and dispensary hours. In- dividual efficiencies were posted to the
empoyee permanent work history and a
weekly management report was
generated to show the labor utilization in
a department. This mass of paperwork was stored in files by week and by employee for a period of six months to serve as evidence in case of operator
UNMEASURED15%
OVERHEAD 7%
ENGINEERED LABOR
STANDARDS COVERAGE
v'TAPES
OPERATING COSTS
SINGLES
ALBUMS
SHIPMENTS
Fig. 2 - Warehouse operating characteristics.
911
66.7
44.0
D
55
www.americanradiohistory.com

AREA: SNORTS 1E" Recorda
PRODUCTION REPORT SORT
ASIDE BOX LOT OTT'S ACCUMULATED AT TABLE
093.00.006)
ER. STAMP
APPROVED B.. ,;// /
OPERATION TOTAtc KKS/r100 DARNED
Sort 6 Place in Accumulation Rack (Per Tate Box)aReaoler
Tote Box - 41350.
7lNtU711 I711Ì1111)4/'rr 06 /Nil. PA) )S) N Po ,,,ON H4 IN{ Ils nil 9 9 A er f / a,7
Sort I Place in Accumulation Rack (Per Tote Box) Prom SUminkvrap - 60cc.
IB1 06 CIII NI 01V 761 7M1
ñlda 0Ai Mf l .5 G
Al
''// 3 /Y7 BOX LOT ACCUMULATED - 5 COUNT Ctn.
IL
BOX LOT ACCUMULATED - 10 COUNT Ctn.
71
BOX LOT ACCUMULATED - 30 COUNT Ctn. Iry P. rw n4u M27AU nu
Ir." I' 2/C2 ;93 BOX LOT ACCUMULATED - 35 COUNT Ctn.
An
EMP. pi DWLDYR8
NAM I' b)(I)E RIP. M0._43,ß ME PERFORMANCE
ENDING
SOMMARY
G - %- 77
DATE TOTAL HAS Soul
LM ')051'
Qp STD Vathod UNABASURED OVERHEAD
an Std
Earned
Urd
Lass
To Dal.
6 j,,.
l::ndl ids- Marabous-
ing ACCUm Mise GL Nain Dise Union Mica
USANO. igned
MON ' o S .6- 70 .S 3, 2 7,0Z-
Mg g'0 --3 73 735- /n o.7 o
Wau 8.0 qo 7+1'5 9-3/ß
y--{ló. 0 s . . 7 / 7. (p `f 7, /0 G -_Tliu
MI
DATE 6-19-74
TO: D. J. Garry
SUBJECT: Department 392 Labor Performance Report
Activity: Processing Warehousing%
Week Ending 6 -16 -74
A. Total Hours in Department
B. Hours on Standard
C. Earned Hours'
D. Department Efficiency
Accumulation
878.31 605.77 581.15 95.9%
E. Percent of Total Hours:
I. Measurable (Total X Less 0.11.%)
2. On Standard 3. Off Standard
4. Unmeasured
85.5% 69.0% 2.5%
14.0..
F. Off Standard Hours:
1. Due to Special Handling 2. Due to Equipment 3. Due to Methods Change
21-76
Total Off Standard Hours 21.76
G. Unmeasured Hours: 123.61
H. Overhead Hours:
1. Group Leading, Training 2. Unassigned (Idle)
J. Dispensary, Union Business, Misc. 4. Stock Rearrangements
5. inventory 6. Other
80.00 25.11 22.06
127.17
O.H. % of Total Hours 14.5%
Foreman
cc: H. Allison J. Snyder
H. Colebert G. Theisíng
D. Donaldson
Fig. 3 - Manual labor control created a mass of paperwork to account for nearly 12,000 transactions per week.
56
efficiency disputes. Fig. 3 illustrates the ingredients of the manual system.
Manual system's disadvantages
Productivity measurements were in- complete because of the absence of production volumes against the cor- responding expenditure of labor. Cumbersome communications and logistics meant that the labor hours transferred from one department to another were never accurately captured. Problem -analysis was invariably un- justifiable because of the monumental clerical effort required to analyze productivity and its determinants.
The manual clerical operation was prone to errors, making labor enforcement a
difficult responsibility.
The manual labor- reporting system was not reconciled with the warehouse labor liquidation system (also manual) for budgetary control. The input to the financial system was the daily time ticket tilled out by the employee; it consisted of the operations performed and hours ex- pended. In addition, the employees were expected to identify some of the special work performed by one of the ap- proximately 125 shop orders existing within the department.
A new system for labor control
General objectives
I stablish une data hase for labor efficiency reporting and financial liquidation.
Increase labor productivity by accurate and timely reporting of employee, operation and departmental efficiencies.
Reduce clerical effort by automating the labor control system.
Automate the gathering of production sulume and integrate it with the cor- responding labor utili,ed.
Pro%idc a basis for establishing standard labor and material costs for warehousing operations.
Specific objectives
For supervision, report the following:
use of hours for each employee permanently assigned to a supervisor, no matter where
www.americanradiohistory.com

that employee actually worked during that week or any portion of that week.
actual hours by area and shift, along with the distribution of these hours by major operations (i.e., pull orders, shipping preparation, etc.).
hours broken down by classification: hours on standard, earned hours, unmeasured hours (i.e., union business, dispensary, etc.), idle hours and absenteeism hours.
For Operating and Financial Manage- ment, report the following:
total activity volumes with associated labor hours.
a financial accounting system to account for departmental labor and material costs.
Taking the old system's deficiencies and our new objectives into account, we
developed a new system computerized labor control.
Computerized labor control system
The computerized labor control system basically reports labor efficiency, activity volumes and financial liquidation. The heart of the system is the job ticket, with its unique six digit alpha -numeric code. The first three digits are permanently assigned, indicating I) the physical area of the warehouse where operation is
performed, 2) the product line or ac- count, and 3) the type of product.
First position (Alpha Character)
A. Post office
H. Special packing
C. Shipping
D. Commercial
E. Tape Club
G. Record Club
H. Outside warehouse
I. Return authorization
.I. Automatic fulfillment system.
Second position (Numeric)
I. Club
2. Commercial
3. Custom
4. Premium
5. Reader's Digest
6. Export
7. Random House
8. Time -Life
9. Mixed
O. Other
STC LPA
AREA PROD MEDIUM OPERATION
G I 4 006
OPERATOR* BASE QUANTITY
I RACKS
2 SEL
3 CTNS
4 SUR LOC
REC/PA BXLTS MFG
DATE /TIME - IN
TYPE HOURS
DATE /TIME -OUT
S:0 * 082520
MISC CODE /TIME
2
3
4
Fig. 4 - Computerized job ticket.
Third position (Numeric)
I.7" records
2.7" Disc jockey record
3. 12" Disc jockey record
4. 12" record
5. Promotional literature
6. Stereo -8 cassette
7. Cassette
8. Tape
9. Mixed
The fourth digit is assigned within each area and signifies the major operation being performed, i.e., put away stock, order fill, etc. If the fourth digit is 9, the operation is unmeasured, indicating a
labor standard does not exist. If 9 is
repeated in the fifth and sixth positions, the operation is characterized as late/ left early /absent. The fifth and sixth digits are assigned sequentially and identify the exact operation within the major opera- tion, type of product, product line, and area. Industrial Engineering assigns the last two digits for measured operations and the control clerks make the assign- ment for randomly occurring un- measured operations. A typical code would be G14406, meaning that the operation is pull and collate 12 " Record Club product from Record Club bins. A pre -assigned alpha character used in con- junction with the six digit code identifies any overhead -type hours that occur during a job assignment such as,
union business, dispensary, no materials, etc. Fig. 4 shows a typical job ticket.
Overview of the system in operation
When an employee starts a new assign- ment the clerk selects the appropriately - coded card for that assignment, stamps the date and time, and records the employee number on that card. If the
shop order number has not been
preprinted on the card, the clerk enters the number. If, during the assignment, overhead -type hours occur, the clerk enters the respective miscellaneous code
and hours. If lunch occurs during the assignment time, the clerk enters the
lunch code and time on the card. At the
end of the assignment the clerk stamps the date and time ending on the cards and
starts a new card for that employee. The volume(s) are entered by the clerk for variable(s) required. It should be noted that absenteeism, lateness and early departure are all treated as work assignments, in order to account for all scheduled hours.
the cards are keyed onto tape and the tape(s) transferred to computer operations. The data is edited for employee number, card format, job code and other information filled in by the
employees clerks. The error suspense
report, consisting of five error messages
per card, is corrected by warehouse supervisors and is rekeyed onto tape. The corrected errors are passed against the error edit program again, making trans- actions ready for generating reports.
The weekly labor reporting programs simply sort the data and print out the three main reports -weekly labor perfor- mance report, operator performance report and labor hours production volume report.
The data from the weekly runs is accum- mulated and compiled for the monthly reports. When the financial month - ending date is established, the data for the last week is split between data for the current financial month and data for the next month, based on the week of the year and day of the week in which the hours and material were used.
57
www.americanradiohistory.com
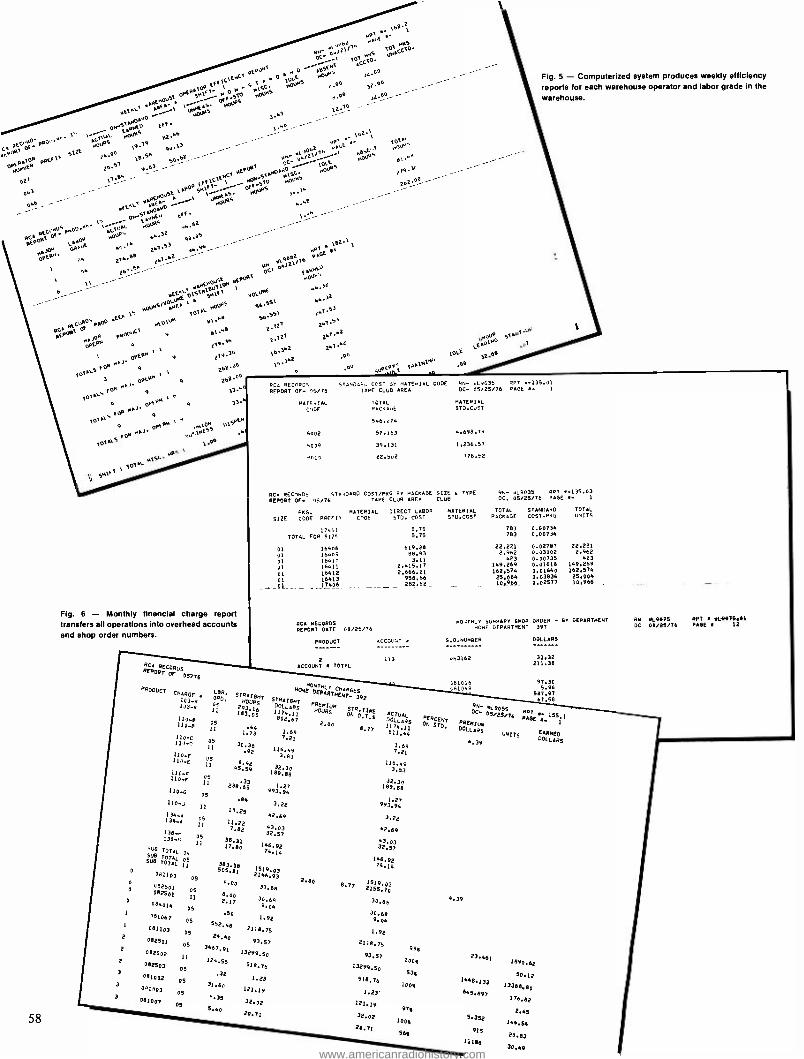
9009 0607
021
0]
06
008.'0
PM- 40V11'
8 L4P00 SH\ , _.S a
L
w1 r 6/r f 06.04 01 000 i0096
- ,C
' or.
S HpJSE 1 45. MM.-
vf ENL1 v
E'p0 /'¡1 "OrPS 514M0 SU
P0SVM00: ' 1 'C1JAL AOU9
PEPOPI
OF' ABOP
6.
08 6,62
NOJ RS ]2
PAUE n
MA30,A OPEP. .
58
,7
u 216.80 2 1 O 26n.5
o os
HOJpS
1p1L HOJPti
21q.3'
) 4e % ' // / ' . P9 8A
vLyO;/Tb PAGE
P1 04/2 EBRPf,U
9Opt NOJM
1 v4NENOJS: BJ1j0M 1
w.)2
64.)2
21'S6
241'53
241 w2
241.42
EEwLpjStPSH1FS NOL1pAE
'PfA -,WS 0.0\ { :
4010$
1D
80.98 y6.S511
BE: 6 2.tz
21q'36 21.36 2b2.00
26z'p0 ,,..o
3]
Fig. 6 - Monthly financial charge report transfers all operations into overhead accounts and shop order numbers.
1
2
2
3
3
3
RCA ECORDS REPORRT
OF 05776
MONTH P9oDUCi
CHARGE LOO Siß MOMS DEPARTMEN7GE392
103 R 11 293URSr 5000 6S
PREMIUM 11 183,04 1174,11 HOURS SPOT:
110 -8 802,67 7f 110-: 05 .44 2.00
11
2,721
16.362
166''' 90
00
18° ]266 .64
Fig. 5 - Computerized system produces weekly efficiency reports for each warehouse operator and labor grade in the
warehouse.
RCA RECORDS REPORT Or- 05/76
MATEE IAL CODE
8002
5009
9010
5TAN04i0 [CST BY MATERIAL CODE ON- KLOG35 OPT - 135.01 TAPE CLUB AREA
TOTAL MATERIAL PACOAUE 5T0.CUST
546,274
57.163 4,698.79
35,131 1.236.57
22,502 776.52
DC- 05/25/76 PAGE 8- 1
RCA RECORDS STA40800 COST /PKG BY PACKAGE SIZE 6 TYPE
REPORT OF- 05/76 TAPE CLUB AREA CLUB
PKG. MATERIAL
SIZE CODE POEFI CODE
RN- ,4L9035 OPT 8- 135.03 OC. 05/25/76 PAGE 8- 1
DIRECT LABOR MATERIAL TOTAL STANDARD TOTAL
570. COST STD.005T PACKAGE COSTPKG UNITS
17411 5.75 TOTAL FOR SIZ'_ 5.75
01 16406 619.28
01 16409 B8.93
01 1641n 3.11
01 16411 2,415.17
01 16412 2,666.21
01 16413 958.66 y_01 17406 282.62
RCA RECORDS REPORT DATE 08/25/76
PRODUCT ACCOUNT A
2
ACCOUNT 8 TOTAL 113
783 0.00734 793 0.00734
22.221 2,962
423 149,269 162,574 25,004 10.966
0.02787 0.03002 0.00735 0.01618 0.01640 0.03834 0.02577
22.221 2.962 423
149,269 162,574 25.004 10.966
HO.,TMLY SUMMARY SHOP ORDER --8Y DEPARTMENT HOME DEPARTMENT 397
S.O.NUMBEP DOLLARS
110-F OS 110-F II
11D-G os
110-J 11
134-A
1.73 1.69
7.21 30.36
.92 116.49 3.03
8.42 45,59 32.30 189.88
238.65
.84
10.25
134-' 11.22
7.82
38.31 17.80
136-N OS 136-N 11
SUB TOTAL 4
SU8 7pT;L 0
5 70T AL 11
081103 OS
082501 OS 082501 ll
084014 OS
081067 os
091103 os
082501 OS
082502 11
082503 Os
081002 05
0A1003 OS
De1D6n OS
1.27 993.94
3.22
42.69
47.03 32.57
146.92 74.14
383.08 1519 505,81 2146,93
03
F,00 30,69
6.07 2.77 30.69
9.04 .50
1.92 552.48
2116,75
28.40 93,57
3467,91 13299.50
124.55 516.76
.32 1.23
31.60 121.19
9.35 32,02
5,40 20.71
2.00
8.77
063162
081016 C61049
ACTU.fL DOLLARS 1174.11 811.44
1.69 7.21
116.49 3.83
3 189.88 2,30
993.94
3.22
42.69
43.03 32,47
146,92 71.14
8.77 2155,)0 1519.03
30,66
30.68
9.04
1.92
2118,75
93,57
13299.áo
518.76
1.23
121,19
32,02
20.71
999
1004
534
1004
974
1009
564
33.32 211.38
97.30 5.96
587.97 67.58
RM- BL9055
REBCENT GC- 05 /24 /76 :PE P. "S " ON 570. PREMIUM
1 DOLLARS
UNITS EARRED
4.39 DOLLARS
RN 069075 OPT A 11L9976,91
DC 08/25/76 PAGE Y 12
4.39
23.461
1448,133
645.697
5.352
915
1,186
1890,62
50.12
13368.80
176.82
2.45
144.5.
20.03
30.49
www.americanradiohistory.com
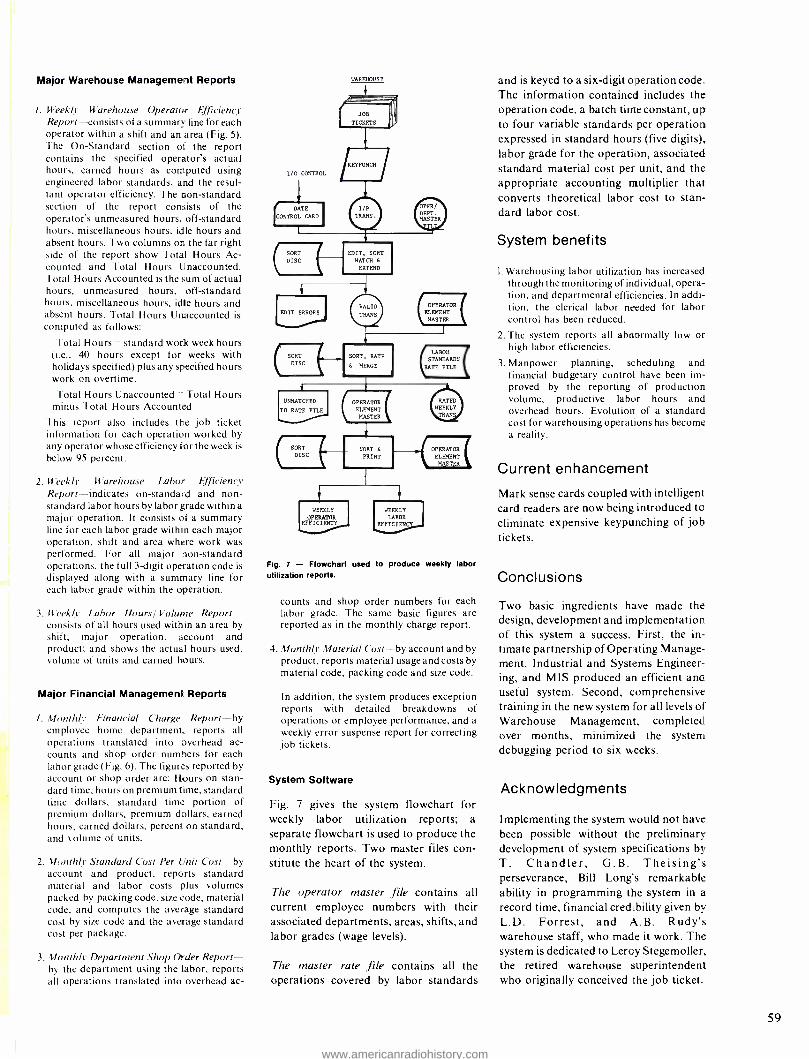
Major Warehouse Management Reports
I. Weekly Warehouse Operator Efficiency Report -consists of a summary line for each operator within a shift and an area (Fig. 5). The On- Standard section of the report contains the specified operator's actual hours, earned hours as computed using engineered labor standards, and the resul- tant operator efficiency. The non -standard section of the report consists of the operator's unmeasured hours, off -standard hours, miscellaneous hours, idle hours and absent hours. Two columns on the far right side of the report show Total Hours Ac- counted and Total Hours Unaccounted. Total Hours Accounted is the sum of actual hours, unmeasured hours, off -standard hours, miscellaneous hours, idle hours and absent hours. Total Hours Unaccounted is computed as follows:
Total Hours = standard work week hours (i.e., 40 hours except for weeks with holidays specified) plus any specified hours work on overtime.
Total Hours Unaccounted = Total Hours minus Total Hours Accounted
This report also includes the job ticket information for each operation worked by any operator whose efficiency for the week is
below 95 percent.
2. Weekly Warehouse Labor Efficiency Report- indicates on- standard and non- standard labor hours by labor grade within a major operation. It consists of a summary line for each labor grade within each major operation, shift and area where work was performed. For all major non -standard operations, the full 3 -digit operation code is
displayed along with a summary line for each labor grade within the operation.
3. Weekly Labor Hours! Volume Report - consists of all hours used within an area by shift, major operation, account and product; and shows the actual hours used, volume of units and earned hours.
Major Financial Management Reports
I. Monthly Financial Charge Report -by employee home department, reports all operations translated into overhead ac- counts and shop order numbers for each labor grade (Fig. 6). The figures reported by account or shop order are: Hours on stan- dard time, hours on premium time, standard time dollars, standard time portion of premium dollars, premium dollars, earned hours, earned dollars, percent on standard, and volume of units.
2. Monthly Standard Cost Per Unit Cost -by account and product, reports standard material and labor costs plus volumes packed by packing code, size code, material code, and computes the average standard cost by size code and the average standard cost per package.
3. Monthly Department Shop Order Report - by the department using the labor, reports all operations translated into overhead ac-
I/O CONTROL
DATE
CONTROL CARD
WAREHOUSE
JOE TICKETS
EDIT, SORT MATCH &
EXTEND
EDIT ERRORS OPERATOR
ELEMENT MASTER
LABOR STANDARDS
RATE FILE
UNMATCHED
TO RATE. FILE
WEEKLY
OPERATOR EPPICIENTY
WEEKLY
LABOR EFPIC
Fig. 7 - Flowchart used to produce weekly labor utilization reports.
counts and shop order numbers for each labor grade. The same basic figures are reported as in the monthly charge report.
4. Monthly Material Cost -by account and by product, reports material usage and costs by material code, packing code and size code.
In addition, the system produces exception reports with detailed breakdowns of operations or employee performance, and a weekly error suspense report for correcting job tickets.
System Software
Fig. 7 gives the system flowchart for weekly labor utilization reports; a separate flowchart is used to produce the monthly reports. Two master files con- stitute the heart of the system.
The operator master file contains all current employee numbers with their associated departments, areas, shifts, and labor grades (wage levels).
The master rate file contains all the operations covered by labor standards
and is keyed to a six -digit operation code. The information contained includes the operation code, a batch time constant, up to four variable standards per operation expressed in standard hours (five digits), labor grade for the operation, associated standard material cost per unit, and the appropriate accounting multiplier that converts theoretical labor cost to stan- dard labor cost.
System benefits
I. Warehousing labor utilization has increased through the monitoring of individual, opera- tion, and departmental efficiencies. In addi- tion, the clerical labor needed for labor control has been reduced.
2. The system reports all abnormally low or high labor efficiencies.
3. Manpower planning, scheduling and financial budgetary control have been im- proved by the reporting of production volume, productive labor hours and overhead hours. Evolution of a standard cost for warehousing operations has become a reality.
Current enhancement
Mark sense cards coupled with intelligent card readers are now being introduced to
eliminate expensive keypunching of job tickets.
Conclusions
Two basic ingredients have made the design, development and implementation of this system a success. First, the in-
timate partnership of Operating Manage -, ment, Industrial and Systems Engineer- ing, and MIS produced an efficient and useful system. Second, comprehensive training in the new system for all levels of Warehouse Management, completed over months, minimized the system debugging period to six weeks.
Acknowledgments
Implementing the system would not have been possible without the preliminary development of system specifications by T. Chandler, G.B. Theising's perseverance, Bill Long's remarkable ability in programming the system in a record time, financial credibility given by L.D. Forrest, and A.B. Rudy's warehouse staff, who made it work. The system is dedicated to Leroy Stegemoller, the retired warehouse superintendent who originally conceived the job ticket.
59
www.americanradiohistory.com

editorial input
60
a personal message
concerning your future
The RCA Engineer is a journal "by and for the RCA engineer." I would like to explain, in this brief message, what the RCA Engineer is doing for you.
Most engineers are concerned aboutstaying viable- keeping the tools of the trade sharp in order to
provide lifelong effective service. Beyond the initial educational effort, engineers should be
engaged in many activities to keep technical capability and motivation high. This topic will be
addressed in more detail in future issues of the RCA Engineer.
In the meantime, however, the journal has been undergoing changes which are directly aimed at
assisting your efforts to stay viable by:
selecting important areas of the electronics business and explaining the ongoing advances. You
will find that keeping abreast with areas outside your specialty will increase your professional confidence. [Automotive electronics- covered in the last issue (Aug - Sep, 1976) is a good example of a potentially important business area.]
showing the most important areas of technical activity within RCA. Someday, an opportunity for transfer to another activity may reach you, possibly because you have kept up with its technology and the people involved in it. [Electro- optics -to be covered in the next issue (Dec 1976, Jan
1977) -is a good example of technical activity that pervades most of RCA's product lines.]
demonstrating new methods, technologies, approaches -some of which may assist you to solve immediate problems. [Most technical articles provide this kind of information, but "Advances in
integrated- circuit reliability" (this issue, p. 80), "Design for production" (Jun -Jul 1976, p. 25), and
"Glassing microcircuits by chemical vapor deposition" (Feb - Mar 1976) are outstanding examples.]
assisting you in finding other experts covering RCA's awesome breadth of technology- opening the path for more interpersonal communications, the most potent method of effective technical information exchange. [Our upcoming microprocessor issue (Feb - Mar, 1977) will introduce you to several experts in this field.]
offering tutorials in new areas which are expected to become important business sectors -to help
you gain the initial understanding and to motivate your further pursuit in more depth through other means. [See the series on Digital Electronics by Shapiro (Aug - Sep, 1976, p. 56, and this issue, p. 61).]
These are some of the ways the RCA Engineer assists you. And what are your contributions?
Continue bending your habits from leafing through the magazine to reading in more depth. If you force a more thorough study of the material presented, you will soon find that motivation and interest in keeping up with other fields increases rapidly; your capability to understand and assimilate material will grow; your perspective on RCA business will broaden and you will reach higher levels of self- confidence which will strongly support your lifelong engineering career.
The RCA Engineer staff is dedicated to providing all possible support to assist your professional growth. Of course, your inputs and recommendations, either through your local TPA's or directly to staff members, will be most welcome and helpful aids in this endeavor.
-H.K. Jenny
www.americanradiohistory.com

Short course in DIGITAL ELECTRONICS, Part 2 - Information theory, power, and bandwidth Dr. L. Shapiro
This second in our series of articles on digital signal processing explores the critical interrelationships among message capacity, bandwidth, noise, and power. These considerations are then applied to time- division and frequency- division multiplexing. The
article concludes with a brief discussion of holding circuits, and signal compression and
expansion in the process of demodulation. The next article in this series will introduce the
subject of digital filters and flay the groundwork for the design of IIR (infinite impulse response) filters.
INFORMATION THEORY is usually treated as an extension of probability theory and dates back to 1948 and 1949
when two basic papers by Claude Shan- non established this new discipline. This approach to communications allows a
quantitatively evaluated probability to be assigned to each message; that is, an event that has a lower probability of occurrence will have a greater amount of information associated with that event. For example, a snowstorm in the Sahara Desert would -c associated with a lot of information, whereas just another hot, dry day at the same location would convey very little information.
A little closer to home, the letter e (in the English language) occurs in typical messages with a frequency of 13.1 %. The next most commonly occurring letter is t,
which occurs with a frequency of 10.5 %. The least commonly occurring letters are q and z, which occur with frequencies of 0.14% and 0.08 %* respectively. Consider- ing the greatly unequal probability of occurrence, a question naturally arises as to whether equal amounts of power and bandwidth should be assigned to the transmission of these various letters. For example, we have twenty -six characters in the English alphabet, and the probability for the occurrence of any particular character can certainly be very far from 1/ 26 or 3.85 %.
These probabilities can be modified further because certain letters continue to
Reprint RE- 22 -3 -20
Dr. Shapiro's biography and photo appear with the first article of this series.
'These figures vary somewhat with the source, see Ref. ( I ) and
bibliography.
appear in particular combinations. Thus, the letter q is almost always followed by the letter u. Similarly, such suffixes as ion and ed as well as the articles a, an, and the occur repeatedly. Continuing further, we find that certain combinations of words occur more often than others. As a result, the actual information content of a message can be reduced to a much smaller amount than the (assumed) foregoing probability of 1/ 26 or 3.85% per letter. The term redundancy is often associated with the above considerations to indicate the presence of message material which only repeats, but does not add to, the actual information content of a message.
Information theory and digital signal processing
In applying information theory to digital signal processing, we will select only a few of the important concepts from informa- tion theory and begin by assuming an equal probability for the occurrence of particular signals (within a message) at
n -
VOLTS
4
any particular moment. This situation may, or may not, actually be the case depending upon the coding system that is
used (e.g., whether this be outright cryp- tography, or a simpler pulse- modulation scheme). The equal- probability assump- tion, however, will simplify our subse- quent development of bandwidth and power relationships. The extension to unequal signal probabilities is fairly straightforward and is treated by Reza.'
Information content defined
Consider the message shown in Fig. 1.
The message consists of m pulses, each having n possible levels numbered from zero to n -1. Thus, and individual pulse may represent any one of n distinct levels of information. With m such pulses, we
have a total number of nm possible combinations of information.
There is, however, something about the total number of above different informa- tion combinations (n'") which is disturb- ing to our experience and intuition. The quantity n "' implies that information content goes exponentially with the length of the message, m. Our intuition. on the other hand, tells us that, really, the information content of the message should go directly with the message length, m. ** The simplest way to resolve this difficulty is to take the bull by the horns, and define information content, H, as the logarithm of n"', e.g.,
H= log ri"=m log n (li
making H directly proportional to m.
Since the message duration, T, is equal to mr (where r is the width of the slot assigned to each individual pulse, see Fig,.
1), Eq. 1 may be modified as follows:
Ed. note - As an interesting aside, note that for our English language example, information content per unit message
length often varies inversely with message length.
T=mr
TIME m -I m (IN UNITS OF T SECONDS)
Fig. 1 - Representative message having m pulses, each with n available levels. Each pulse is allotted a time slot. The complete message duration, T, is the product of the number of pulses and the time allotted for each pulse.
61
www.americanradiohistory.com

H = (T/ r) log n (2)
For the usual case [digital signals], the logarithm is taken to the base 2, and the units of H are given in bits
H= (TI r) loge n
English language example
(3)
It may be of interest to explore the number of bits needed to represent a
single letter in the English language (assuming equal probability of oc- currence for each letter). In principle, the signal has any one of twenty -six possible levels, i.e., n= 26 (see Fig. 2). Using Eq. I, (with ni = I ), and taking the logarithm to the base 2, we obtain 4.7 bits. Since it is
often inconvenient to work with fractional bits, we go to the next higher power of 2, which in this case would be 32,
and make use of a signal having 32
separate levels. Information content (Eq. I) now directly evaluates to 5 bits.
25 -
22 - 20 -
n
(SECONDS)
Fig. 2 -A twenty -six -level pulse.
We may note, in passing, that some theorists have estimated that if all possi- ble redundancy in the English language (in the usual text format) is taken into account, the actual information content in bits per letter becomes approximately one. This represents a very substantial challenge to our experts in the informa- tion theory business for encoding methods which would take advantage of this redundancy and thereby reduce sub- stantially the power and /or bandwidth required for the transmission of messages.
Elements of coding
-binary is often best
We now wish to break up our single
62
twenty -six level pulse into two pulses having the same number of possible information combinations. We find that each of these two pulses needs six possible levels. Eq. I now becomes
H = 1og262 = 2 1og26 = 5.17 bits
Proceeding further, we may also use a
group of three pulses, each having three levels. This allows for a total of twenty - seven possible information com- binations. Eq. 1 becomes
H = log23 t = 3 1og23 = 4.75 bits
Finally, we may go directly to a binary code and represent our twenty -six level signal by means of a group of five (binary) pulses. This gives us a total of thirty -two different information combinations. Eq. I becomes
H = 1og225 = 5 1og22 = 5.00 bits
From the above computations, you might infer that the number of bits in a
particular signal is independent of the structuring of that signal, e.g., whether the information be incorporated in a
single pulse of many levels, or a group of pulses having fewer levels each. However, this is by no means the whole story. In fact, considerations of available power and existing signal/ noise ratio often limit our choice of available coding methods. In many cases, the last- mentioned (binary) code proves to be the most desirable.
Information capacity, C
C is directly related to bandwidth and signal /noise
Another important property of a message
involves the number of pulses that can be
transmitted per second. In evaluating this characteristic, we divide information con- tent H (Eq. 3) by the message duration T and obtain our system capacity in bits/ se-
cond.
C H/T= (II r)log2n (4)
The inequality sign is based on the fact that system capacity C is the maximum rate of information transmission, while the expression on the right of Eq. 4 does not necessarily conform with this max-
imum rate. However, for convenience, the equality is often used.
It is interesting to note that Eq. 4 is the product of a coefficient, 1/ r, with the logarithm of n, the total number of available levels in each pulse. Now r represents the spacing of the pulses in our message and, for very narrow pulses, would represent a channel bandwidth I / r or that corresponding to the raised -cosine characteristic.* In the present notation, r corresponds to Tof the first article in this series.
The second factor on the right -hand side
of Eq. 4 involves the logarithm of n, and n defines the number of available levels in each pulse. The number of available levels, however, is intimately tied to the existing signal/ noise ratio in the system, since these levels must be sufficiently separated (in amplitude or power) to override any anticipated noise. (Conversely, any excess power would, in general, be wasted.) We may, therefore, construe the second factor as representing a signal / noise level. In plain words, then, Eq. 4 tells us that the system capacity is
proportional to the product of bandwidth and the logarithm of a quantity related to the signal/ noise ratio.
Quantization
Quantization noise is most bothersome at
low signal levels.
In quantizing a signal, we constrain it to conform to one or the other of a fixed set
of amplitude levels. This is illustrated in Fig. 3, where both the original analog signal and the quantized digital form of this signal are shown. Evidently, a certain amount of original information has been
lost in the quantizing process since the
final quantized signal is incapable of
'See the first article in this series. The assumption here is that the actual pulse width is very much less than the time slot r
assigned to it.
7 6 5
n 4 3 2
ANALOG (sl (QUANT ZED SIGNAL
,.'.L
4111111 GIG SIZED SIGNAL
2 3 4 5 6 7 8 9 (IN UNITS OFrI
Fig. 3 - The quantization process. The final digitized signal is obtained by quantizing and sampling (in either order) the original analog signal.
www.americanradiohistory.com

(Aar)
(A.%)
A fls)
(A- 0/21
(A II
o
- 0/2
ORIGINAL ANALOG SIGNAL
Fig. 4 - Development of quantization noise and peak signal excursion. A and A ±1 represent available (quantized) signal levels.
producing exactly the analog signal from which it was obtained. This loss of information, which may or may not be serious, is termed quantization noise and may be evaluated quantitatively. Thus, referring to Fig. 4, we see that the pulse at time ti is constrained to the amplitude A, although the actual original analog infor- mation at that moment is somewhere between A and (A + a /2).
The departure of the quantized signal level, A, from the original signal level is E,
quantization noise. Note that E a/21 and varies over the range (A - a /2) to (A + a/ 2).
Quantization noise and signal /noise ratios
It is a simple matter to obtain the mean - square quantization noise (E2) and the rms quantization noise Erns:
E2 = 1 a/2
_
a -a; _
E, frt. = E
(5)
(6)
We can now obtain the peak- signal/ rms- quantization -noise ratio. Thus, if our peak signal amplitude is P. and we have M available quantized signal levels, we obtain*
P =aM and
Although it would seem at first glance that P =a(M- I), this
is not actually the case if we permit the peak signal excursion to
reach from -a/ 2 to M+ al 2. The total excursion then becomes
aM (see Fig. 4).
P P SIN= -- 2_ = M (7)
E,ms (a/2 113
The corresponding power ratio is ob- tained by squaring Eq. 7.
Sol No= (SI N)2= 12M2
or, in dB,
So/ No= 10 logio 12M2 (dB) = 10 {loglo 12 + 2 logloM} (dB) = 10.8 + 20 logo M (dB) (8)
We see that, in units of decibels, our power signal/ noise ratio is proportional to the logarithm (to the base 10) of the number of levels M. Further information from manipulation of Eq. 8 can be obtained when a single pulse of M levels is
replaced by a group of m pulses, each having n levels, e.g., M is replaced by n". We now obtain
So/ No= 10.8 + 20 logio n" = 10.8 + 20 m logo n (dB) (9)
For our binary code, n = 2, and we obtain
So/ No = 10.8 + 6 m (dB) (10)
showing that our peak -signal/ rms- quantization -noise ratio is favorably in- fluenced by the number of pulses used by our binary code.
Signal power
Bipolar pulses require less average power.
For practical purposes, such as hardware design and establishment of power re- quirements, we must know the average as well as the signal power. Thus, we need to develop expressions for signal/ noise ratio in which average rather than peak signal power appears. We start by comparing the power required to transmit a message consisting of single- polarity pulses (positive or negative) with that required for bipolar pulses having the same number of available amplitude levels ( Fig. 5). For the case of the single -polarity pulse with four equally likely levels, the average normalized power is given by
S = 1/4(9a2 + 4a2 + a2 + 0) = 3.5a2 (watts) (11)
while for the bipolar pulse, the average power is given by
3 n=4 3/2
0 2 1/2 0 a
1/2
3/2 0
SINGLE POLARITY PULSE
Fig. 5 - Comparison pulse. There are lour case.
BIPOLAR PULSE
of single- polarity pulse with bipolar available information levels in each
S = %4(9a2/4 + a2/4 + a2/4 + 9a2/4) = 1.25 a2 (watts) (12)
Substantially less power is needed to transmit a message consisting of bipolar pulses. We will therefore deal with bipolar pulses in our subsequent discus- sion. Fortunately, the average power for a bipolar pulse of n levels can be for- mulated in closed form so that a single expression, consisting of only one term, may replace a series containing (possibly) many terms.
S = a2[(n2 - 1) / 12] (13)
It is sometimes convenient to solve Eq. 13
for n
n = [1 + (12S/ a2)]1/2 (14)
It should be noted that two -level pulses are used in certain important cases such as binary pulse -code modulation (PCM), pulse position modulation (PPM), and pulse- duration modulation (PDM). Assuming that, on the average, the signal is likely to be present at either level, systems using single- polarity pulses will have an average normalized power of a2 /2 watts, while systems using bipolar pulses will have an average normalized power of a2/4 watts. Where modulation schemes require an unequal likelihood for the signal to be present at either level, the average power expressions must be modified accordingly.
Capacity vs. bandwidth and noise
We can now proceed with our further development of system capacity. In Eq. 4, we replace the coefficient, 1/ r, by 2B where B represents the bandwidth of the original analog information. In effect, this equates B to 1/ 2 r which represents the minimum bandwidth required to
63
www.americanradiohistory.com

transmit (without intersymbol in- terference) a series of impulse -type pulses uniformly separated by time intervals r."
C= 2B log2 M (bits/s) (15)
We now replace our single pulse of M levels with a group of m pulses each having n levels
C = 2B login "'
= 2mB login (bits / s) (16)
It is evident that we have multiplied the bandwidth by m corresponding to the number of pulses used to represent the original pulse of M levels. We may further replace n with its representation in terms of average signal power and level spacing from Eq. 14.
C = m log2 [I + (12S/a`')] (bits/ s)
(17)
Equation 17 reveals the relative impor- tance of bandwidth versus average signal power as a means of increasing capacity. For example, if we wish to double the capacity of a system, we could either double the bandwidth, B, or else square argument of the logarithm. In the latter case, the necessary additional power is
I2S 144S2 - + a
a a (18)
Thus, as a general rule, to increase capacity, it is more advantageous to increase the bandwidth of a system rather than to increase the average signal power.
We may now go one step further in our development for the capacity of a system by defining a quantity N equal to the mean normalized noise power (other than quantization noise) in the system. As indicated above, this noise determines the allowable spacing of amplitude levels necessary for the signal to be able to override existing noise. It is not possible to override all noise, since noise generally has a distribution including a small, but finite, number of very high amplitude pulses. However, a knowledge of the noise distribution makes it possible to evaluate the probability of error for a given mean -noise power and level spac- ing.
The level spacing may be related to the mean -noise power as follows:
64
f, (t)
--F
T 2T
t
Fig. 6 - Series of sample pulses in which the sample width is much less than the sampling interval.
fl(t)
f3(1)
fe(f) s 0
INPUT
SWITCHES IN TIME SYNCHRONIZATION
TRANSMISSION CHANNEL
full)
f3(t)
i fglt)
OUTPUT
Fig. 7 - Time -division multiplexing system. T is defined as the time interval between successive samples of the signal in any one channel.
a' = K "N (19) Time -division multiplexing (TDM)
where K2 is a constant chosen to maintain a very low error rate.'
Using Eq. 19 in the expression for capaci- ty as given in Eq. 17, we obtain
C = m log2 [1 + (12S /K 2 N)] (20)
Equation 20 indicates that we have been able to separate out a signal/ noise ratio consisting of average signal power and mean noise power. In effect, Eq. 20
represents a very informative relationship combining the important parameters of bandwidth, signal/ noise ratio, and the important constant K2.
The theoretical limit (K2 = 12)
We now note that as a result of work done by Shannon it can be shown that the theoretical limit for C occurs when the quantity 12/ K2 becomes unity. This con- dition, however, can be achieved only at the price of complex encoding and in- definitely long time delays. In practice, values of 12/ K` are typically in the neighborhood of 1/ 7. This means that the signal power must be increased by a factor of 7 to make up for this reduction. In effect, we are requiring an 8.4 -dB increase in power over that needed for the theoretical maximum capacity case. However, a substantial reduction of this additional power is difficult to achieve and represents another challenge for our communications experts.
Basic mechanism
If sample pulses are maintained at a width, r, which is much less than the sample interval time T (as in Fig. 6) it is
possible to transmit many pulses during a single sampling interval.* In such a case, time -division multiplexing becomes possible and we may be able to transmit many signals essentially simultaneously. Such a system is shown in Fig. 7, in which transmitting and receiving terminals han- dle eight inputs in synchronization.
Various methods have been developed for achieving and maintaining the syn- chronization that is necessary for such a system to operate properly. Special syn- chronizing pulses are often included in
each frame (which is defined as the period of time Tcorresponding to the sampling interval for any one channel). In the system shown in Fig. 7, for example, as many as twelve pulses may be needed to allow for synchronizing pulses and spares. The final signal passing through the transmission medium may therefore appear as shown in Fig. 8.
A word of apology k perhaps in order regarding our easalierish use of the notation T. In article one of this series, it
initially represented the sampling interval of T seconds
between adjacent digital samples. In the first part of this
article. it represented the duration of the complete message.
and now reverts hack to sampling interval but only for
particular signal or channel! In doing so. howcser, we has
attempted to follow the general use of this notation so that 1h,
reader may he better prepared to follow the current literature
SYNCHRONIZING PULSES 1
fl (t) f2(t) - - - - - - - _ - - - f8(t) SPARES
O
I -41- T 2T 3T
n n
fi (t) f2 (t)
T
7T I I T
T=121". FRAME TIME Fig. 8 - Example of signal for a TDM system handling eight channels. There is provision for two synchronizing pulses and two spares.
www.americanradiohistory.com
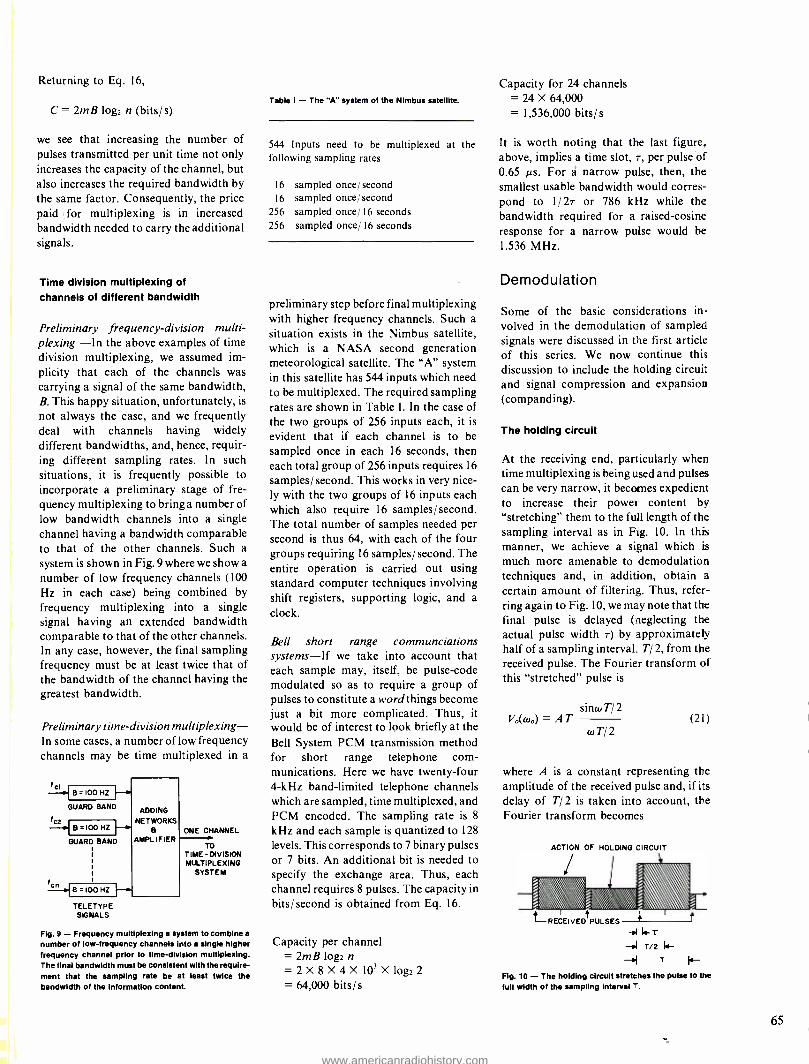
Returning to Eq. 16,
C = 2mB log2 n (bits /s)
we see that increasing the number of pulses transmitted per unit time not only increases the capacity of the channel, but also increases the required bandwidth by the same factor. Consequently, the price paid for multiplexing is in increased bandwidth needed to carry the additional signals.
Time division multiplexing of channels of different bandwidth
Preliminary frequency- division multi- plexing -In the above examples of time division multiplexing, we assumed im- plicity that each of the channels was carrying a signal of the same bandwidth, B. This happy situation, unfortunately, is
not always the case, and we frequently deal with channels having widely different bandwidths, and, hence, requir- ing different sampling rates. In such situations, it is frequently possible to incorporate a preliminary stage of fre- quency multiplexing to bring a number of low bandwidth channels into a single channel having a bandwidth comparable to that of the other channels. Such a
system is shown in Fig. 9 where we show a
number of low frequency channels (100 Hz in each case) being combined by
frequency multiplexing into a single signal having an extended bandwidth comparable to that of the other channels. In any case, however, the final sampling frequency must be at least twice that of the bandwidth of the channel having the greatest bandwidth.
Preliminary time- division multiplexing - In some cases, a number of low frequency channels may be time multiplexed in a
rcJ B =100 HZ I--.
GUARD BAND ADDING
fc2 NETWORKS B.100 HZ
GUARD BAND AMPLIFIER
fCe B - 100 HZ -- TELETYPE SIGNALS
ONE CHANNEL
TO TIME - DIVISION MULTIPLEXING
SYSTEM
Fig. 9 - Frequency multiplexing a system to combine a
number of low- frequency channels into a single higher frequency channel prior to time -division multiplexing. The final bandwidth must be consistent with the require- ment that the sampling rate be at least twice the bandwidth of the Information content.
Table I - The "A" system of the Nimbus satellite.
544 Inputs need to be multiplexed at the following sampling rates
16 sampled once / second 16 sampled once / second
256 sampled once/ 16 seconds 256 sampled once/ 16 seconds
preliminary step before final multiplexing with higher frequency channels. Such a situation exists in the Nimbus satellite, which is a NASA second generation meteorological satellite. The "A" system in this satellite has 544 inputs which need to be multiplexed. The required sampling rates are shown in Table I. In the case of the two groups of 256 inputs each, it is
evident that if each channel is to be sampled once in each 16 seconds, then each total group of 256 inputs requires 16
samples/ second. This works in very nice- ly with the two groups of 16 inputs each which also require 16 samples /second. The total number of samples needed per second is thus 64, with each of the four groups requiring 16 samples/ second. The entire operation is carried out using standard computer techniques involving shift registers, supporting logic, and a
clock.
Bell short range communciations systems If we take into account that each sample may, itself, be pulse -code modulated so as to require a group of pulses to constitute a word things become just a bit more complicated. Thus, it would be of interest to look briefly at the Bell System PCM transmission method for short range telephone com- munications. Here we have twenty -four 4 -kHz band -limited telephone channels which are sampled, time multiplexed, and PCM encoded. The sampling rate is 8
kHz and each sample is quantized to 128
levels. This corresponds to 7 binary pulses or 7 bits. An additional bit is needed to specify the exchange area. Thus, each channel requires 8 pulses. The capacity in bits/ second is obtained from Eq. 16.
Capacity per channel = 2mB log2 n = 2 X 8 X 4 X 103Xlog22 = 64,000 bits /s
Capacity for 24 channels = 24 X 64,000 = 1,536,000 bits /s
It is worth noting that the last figure, above, implies a time slot, r, per pulse of 0.65 µs. For a narrow pulse, then, the smallest usable bandwidth would corres- pond to 1/ 27 or 786 kHz while the bandwidth required for a raised -cosine response for a narrow pulse would be
1.536 MHz.
Demodulation
Some of the basic considerations in- volved in the demodulation of sampled signals were discussed in the first article of this series. We now continue this discussion to include the holding circuit and signal compression and expansion (companding).
The holding circuit
At the receiving end, particularly when time multiplexing is being used and pulses can be very narrow, it becomes expedient to increase their power content by "stretching" them to the full length of the sampling interval as in Fig. 10. In this manner, we achieve a signal which is
much more amenable to demodulation techniques and, in addition, obtain a
certain amount of filtering. Thus, refer- ring again to Fig. 10, we may note that the final pulse is delayed (neglecting the actual pulse width r) by approximately half of a sampling interval.. T/ 2, from the received pulse. The Fourier transform of this "stretched" pulse is
sinmT/2 V(cuo)=AT
aT/2 (21)
where A is a constant representing the amplitude of the received pulse and, if its
delay of T/ 2 is taken into account, the Fourier transform becomes
ACTION OF HOLDING CIRCUIT
:
\ \ \ \ \ \ \ k. \\\\\\\\\ L RECEIVED PULSES 4
-olla-r -Dl T/2 k-
T 14-
Fig. 10 - The holding circuit stretches the pulse to tore
full width of the sampling interval T.
65
www.americanradiohistory.com

sincoT / 2 V0( coo) = AT e j0 Tr2
wT/2 which can be construed as the action of a filter in producing this output upon receipt of our narrow pulse. The frequen- cy response of this filter is shown in Fig. 11, where we see that, although it does not meet the actual filter requirements of the system for separating out the baseband spectrum, it does perform useful filtering and eases requirements on additional filtering.
IVo(W)l ¡FILTER
}. SAMPLED SPECTRUM
2fs
- BASEBAND SPECTRUM
Fig. 11 - Frequency response of the holding circuit. This response may be construed as the action of an
equivalent filter.
Signal compression and expansion (companding)
In many systems, quantization noise is a serious matter at the low signal levels. This is particularly the case where the information being transmitted is speech or music. Referring to Eq. 8, we see that the peak signal/ quantizaion noise power ratio (in dB) is proportional to the logarithm of M, the total number of signal levels available for quantization. It would be an advantage then, to increase M as far as possible in order to reduce the effect of this quantizaion noise. However, much the same effect may be obtained by means of a nonlinear amplifier with a characteristic such as shown in Fig. 12.
Here, the lower amplitudes are favored with more available levels at the expense of the higher amplitudes. Since, in many
AVAILABLE LEVELS
OUTPUT
INPUT
Fig. 12 - Amplifier characteristic of compressor amplifier. This amplifier operates to increase the number of available quantizing levels to the lower input amplitudes at the expense of the higher input amplitudes.
66
instances, it is the lower amplitudes that are most vulnerable to message deteriora- tion due to quantization noise, the effect of logarithmic compression is to make it appear that the lower amplitudes have a great many more available quantization levels than would otherwise be the case. Thus, quantization noise is reduced at lower amplitudes where it is most troublesome.
The amplifier that performs the function of Fig. 12 is called a compressor. A
corresponding expander amplifier at the receiving end straightens out the signal. The two units, one at each end of the transmission line, are referred to collectively as a compander. Their effect is to provide a large number of quantizing levels at the lower signal amplitudes at the expense of the higher signal amplitudes.
The process of companding, in one form or another, continues to be an essential part of systems handling information subject to human evaluation (such as speech, music and pictures). Companding is of less value in data transmission where, in addition to other disadvantages, it introduces intermodulation distortion due to its inherent nonlinearity. However, when properly used in a voice circuit companding can improve the signal -noise ratio by about 25 dB.4
Final remarks
This article began by exploring informa- tion theory and developing the notions of information and capacity. The problem of quantization noise and other types of noise were considered and related to required accuracy of transmission. In- terestingly, excessive quantization noise appears in a picture as spurious contours and in a musical program as a high frequency hiss (as amplitude levels jump from one position to another).
Much work has been done to remove quantization noise from video and audio programs so that clean, acceptable results may be obtained with minimum invest- ment in bits (hence, bandwidth and power).
Another area of great activity has been that of simply speeding up the signal processing stage. This requirement has followed from the enormous amount of information needing to be processed
together with certain applications (such as telephone and radar) where processing must be done in real time to be of value. In this connection, TDM systems are presently being pushed to the maximum capacity that is economically feasible - and this maximum, in turn, is being attacked by bright engineers seeking to make a major breakthrough. For some time now, there has been this well - developed effort in high -speed datá processing. In a future article we will
examine the Fast Fourier Transform (FFT) which has played a central role in many important applications requiring prompt handling of large amounts of information.
References
I. Reza, F.M.: An introduction lo information theory, ( McGraw -Hill, New York; 1961). This reference includes an extensive bibliography of the early papers in this field.
2. See the preceding article in this series.
3. Schwartz., Mischa; Information, transmission, and nuise, 2nd ed. Chapter 5 (McGraw -Hill; New York; 1970).
4. Hamsher, D.H. (Editor); Communications system engineering handbook (McGraw -Hill; New York; 1967).
Bibliography
Information theory
Information theory is a very live subject at the present time.
Readers working in this area are advised to monitor the IEEE Transactions on Information Theory which is published bimonthly. The following books are recommended for a
general introduction into the subject:
Great ideas in information theory, language and cybernetics by Jagjit Singh, Dover. 1966, is an excellent, highly readable semi- popular approach. A good deal of material is well covered.
Information theory by S. Goldman, Prentice -Hall, 1953, isa classic. There should be a well -worn copy on the desk of each person active in this field.
Science and information theory, second edition by Leon Brillouin, Academic Press, 1962, is a scholarly com- prehensive text for the reader wishing more insight into the various concepts and manipulations. First year graduate level.
An introduction to information theory by Fazlollah M. Reza, McGraw -Hill, 1961, is a comprehensive higher -level treatment of the subject for readers with a good mathematical background. The treatment is exhaustive.
Information theory by Robert B. Ash. Wiley, 1965, is a
graduate -level text.
Bandwidth, power, and noise
Unfortunately. there is no single professional IEEE group dealing directly with this aspect of digital signal processing. Pertinent material may be found in the Transactions of perhaps a dozen different professional groups.
Waveform quantization and coding, Edited by Nuggehally S.
Jayant, is a comprehensive reprint of basic papers just published by the IEEE Press, under the sponsorship of the IEEE Acoustics, Speech, and Signal Processing Society and the IEEE Communications Society. The writer strongly recommends its purchase and study.
There are a number of excellent texts dealing with the digital aspects of bandwidth, power and noise. The following texts are recommended in ascending order of level of treatment:
www.americanradiohistory.com
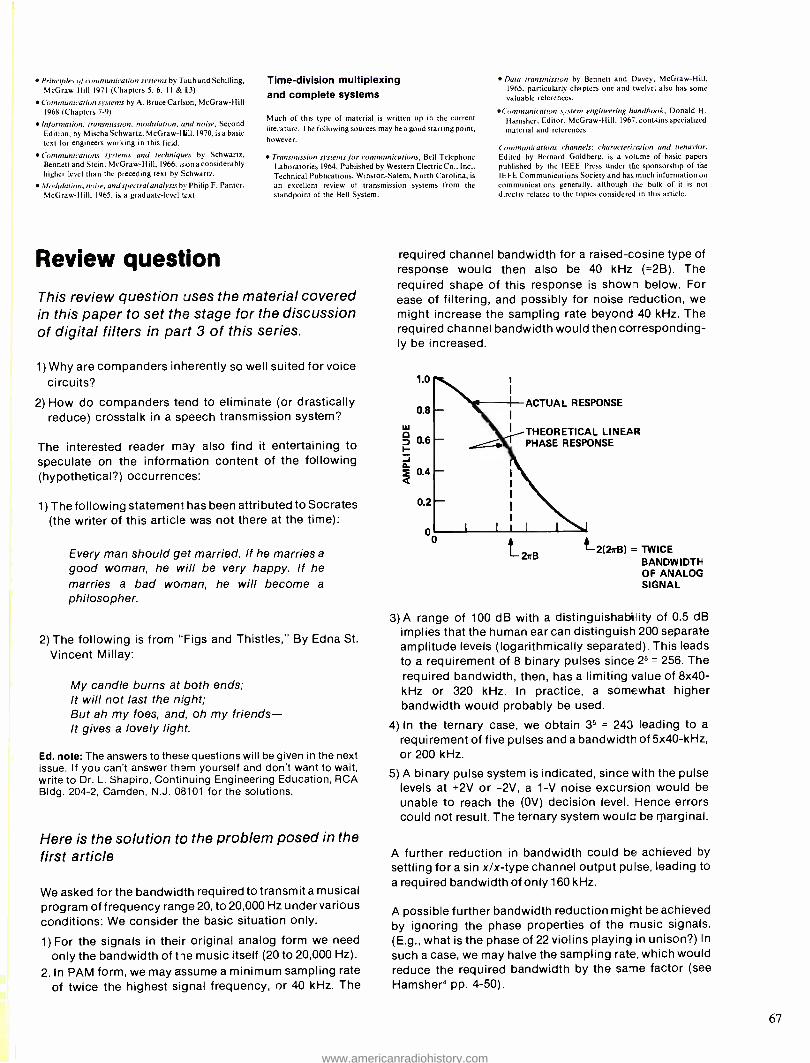
Principles of communication systems by 1 aub and Schilling. McGraw -Hill 1971 (Chapters 5, 6, 11 & i3)
Communication. systems by A. Bruce Carlson, McGraw -Hill 1968 (Chapters 7 -9)
l,rformation. transmission, modulation, and noise, Second Edition, by Mischa Schwartz, McGraw -HiIl, 1970, is a basic
text tor engineers working in this field.
Communications systems and techniques by Schwartz, Bennett and Stein. McGraw -Hill, 1966. isan a considerably higher level than the preceding text by Schwartz.
,tludulaiiiun, noise, and spectral analysis by Philip E. Punter, McGraw -Hill, 1965, is a graduate -level text.
Review question
Time -division multiplexing and complete systems
Much of this type of material is written up in the current literature. the following sources may be a good starting point, however.
Transmission systems fin communications, Bell Telephone Laboratories 1964. Published by Western Electric Co.. Inc., Technical Publications, Winston -Salem, North Carolina, is
an excellent review of transmission systems from the
standpoint of the Bell System.
This review question uses the material covered in this paper to set the stage for the discussion of digital filters in part 3 of this series.
1) Why are companders inherently so well suited for voice circuits?
2) How do companders tend to eliminate (or drastically reduce) crosstalk in a speech transmission system?
The interested reader may also find it entertaining to speculate on the information content of the following (hypothetical ?) occurrences:
1) The following statement has been attributed to Socrates (the writer of this article was not there at the time):
Every man should get married. If he marries a
good woman, he will be very happy. If he marries a bad woman, he will become a
philosopher.
2) The following is from "Figs and Thistles," By Edna St.
Vincent Millay:
My candle burns at both ends; It will not last the night; But ah my foes, and, oh my friends - It gives a lovely light.
Ed. note: The answers to these questions will be given in the next issue. If you can't answer them yourself and don't want to wait, write to Dr. L. Shapiro, Continuing Engineering Education, RCA Bldg. 204 -2, Camden, N.J. 08101 for the solutions.
Here is the solution to the problem posed in the first article
We asked for the bandwidth required to transmit a musical program of frequency range 20, to 20,000 Hz under various conditions: We consider the basic situation only.
1) For the signals in their original analog form we need
only the bandwidth of the music itself (20 to 20,000 Hz).
2. In PAM form, we may assume a minimum sampling rate
of twice the highest signal frequency, or 40 kHz. The
Data transmission by Bennett and Davey, McGraw -Hilt, 1965. particularly chapters one and twelve: also has some
valuable references.
(onurmnicanon ar.stenr engineering handbook Donald H.
Hamsher, Editor, McGraw -Hill, 1967, contains specialized material and references.
Communications channels: characterization and behavior, Edited by Bernard Goldberg, is a volcme of basic papers
published by the IEEE Press under the sponsorship of the
IEEE Communicutions Society and has much information on
communications generally. although the bulk of it is not
directly related to the topics considered in this article.
required channel bandwidth for a raised -cosine type of response would then also be 40 kHz ( =2B). The required shape of this response is shown below. For ease of filtering, and possibly for noise reduction, we might increase the sampling rate beyond 40 kHz. The required channel bandwidth would then corresponding- ly be increased.
0.8 ACTUAL RESPONSE
THEORETICAL LINEAR PHASE RESPONSE
0.2
2aB - 2(27rB) = TWICE
BANDWIDTH OF ANALOG SIGNAL
3) A range of 100 dB with a distinguishability of 0.5 dB implies that the human ear can distinguish 200 separate amplitude levels (logarithmically separated). This leads to a requirement of 8 binary pulses since 25 = 256. The required bandwidth, then, has a limiting value of 8x40 - kHz or 320 kHz. In practice, a somewhat higher bandwidth would probably be used.
4) In the ternary case, we obtain 35 = 243 leading to a
requirement of five pulses and a bandwidth of 5x40 -kHz, or 200 kHz.
5) A binary pulse system is indicated, since with the pulse levels at +2V or -2V, a 1 -V noise excursion would be
unable to reach the (0V) decision level. Hence errors could not result. The ternary system woulc be marginal.
A further reduction in bandwidth could be achieved by settling for a sin x/x -type channel output pulse, leading to a required bandwidth of only 160 kHz.
A possible further bandwidth reduction might be achieved by ignoring the phase properties of the music signals. (E.g., what is the phase of 22 violins playing in unison ?) In
such a case, we may halve the sampling rate, which would reduce the required bandwidth by the same factor (see
Hamsher4 pp. 4 -50).
67
www.americanradiohistory.com

Glossary - a collection of terms from Part 1 and Part 2 of this series
Aliasing: A phenomenon arising as a result of the sampling process in which high frequen- cy components of the original analog signal (whether information or noise) appear as lower frequencies in the sampled signal. Aliasing occurs when the sampling rate is less than twice the highest frequency existing in the original analog signal.
Analog /digital converter: A circuit which samples an analog signal at specified periods of time to produce a discrete signal which is
then quantized.
Analog signal: A signal that is continuous in both time and amplitude.
Binary code: A language in which each symbol (or pulse) has only one of two possible meanings (or levels). Each symbol (or pulse) then represents one bit.
Binary signal: A digital signal with only two available amplitudes or levels, variously called on /off, one /zero, or high /low. A binary signal may be "positive" in the sense that the "one" level may be a positive voltage, or it may be "negative' in the sense that the "one' level may be a negative voltage. In either case the "zero" level is
ground. A binary signal may also be "bipolar ", in which case the "one" is usually a positive voltage while the "zero" is a negative voltage of the same amplitude.
Bit: A unit of information corresponding to the selection of one of two equally likely possible alternatives. It appears when the logarithm inherent in the definition of infor- mation (H), below, is taken to the base 2:
H = (TIT) loge n where T is message duration (seconds); r is
the width of slot assigned to each pulse (seconds); and n is the number of information -bearing levels in each pulse.
Bipolar pulse: A two -level pulse with both levels being equal in magnitude but opposite in polarity. The "one" is usually assigned to the positive level and the "zero" to the negative level.
Compander: A device consisting of a com- pressor at the transmitting end and an expander at the receiving end which operate as nonlinear amplifiers to obtain a more advantageous amplitude -quantizing relationship for the reduction of noise. The process of companding is particularly im- portant with audio signals. The principles have also been effectively used in the processing of picture information.
Capacity: The capacity (C) of a system is the maximum number of bits it can process, or transmit, per second, e.g., C= H/ T where T is time required for the processing or transmission and H is information content (in units of bits).
Continuous amplitude signal: A signal that is able to assume any amplitude value, usually between certain prescribed limits.
Continuous time signal: A signal that is defined for all values of time, usually between certain prescribed limits.
68
Digital signal: A discrete signal in which the available amplitude values constitute a dis- crete series, each member of which can be represented by a number having a finite number of digits. The terms digital and discrete are sometimes loosely used interchangeably.
Delta function (Dirac delta function): A func- tion defined by the following relationships:
¡0 ,fort 0
arbitrarily large, for t = 0
S(t) =
f S(t) dt = 1.0
As a consequence,
ff(t) S(t) dt = f(0)
The delta function is also called the impulse function.
Digital' analog converter: A circuit which transforms a digital signal into an analog signal, usually by some type of filtering action.
Discrete signal: A signal defined only at a particular set of time values. Between these values the amplitude may be zero or have an amplitude of no additional information value.
Encoding: The process of translating a message from one language to another; e.g., we may translate a message of M possible meanings conveyed by a signal pulse of M possible levels, into two pulses such that these M possible meanings may be represented by various combinations of these two pulses. That is, M = m2. Here, m represents the required number of levels in each of the two pulses involved in the translation. The value of m is selected as required to establish the equality.
Fourier methods: See the first article of this series including the Appendix.
Frequency- division multiplexing (FDM): A system in which a number of separate channels are assigned to different frequency bands within an overall channel bandwidth. This is conveniently done by appropriate choice of carrier frequencies. The individual channels are then separated out at the receiving end with filtering techniques.
Frequency domain: A graphical way of representing signals in which the horizontal axis is calibrated in units of frequency. Alternatively it may be applied to a mathematical representation of signals in which the variable is in units of frequency.
Holding circuit: A circuit used at the receiving terminal in time division multiplexing which lengthens the individual pulses (after separa- tion and routing to their respective
channels) to the full sampling time interval in order to aid in the demodulation process.
Impulse function: See delta function.
Information content: The information content of a message (H) is defined in terms of the probability of the occurrence of the event in question, e.g., H= log (1 / pk) where pk is the probability for the occurrence of the particular event. For the case where M events are equally likely, the probability for the occurrence of any one of these events is
I / M and we obtain H = log M. If M has been encoded in the form of nm, we can write H = m log n. For the commonly occurring case where the logarithm is taken to the base 2, we obtain the information H in bits.
Linear system: One in which the behavior of the system is not dependent upon the amplitude of the input signal, or upon the simultaneous presence of other signals.
Negative pulse: A two -level pulse in which the "one" level is a negative voltage and the "zero" level is at ground potential.
Normalized power: The power that would be developed by the signal across a one -ohm resistor.
Positive pulse: A two -level pulse in which the "one" level is a positive voltage and the "zero" level is at ground potential.
Quantization: The process of constraining the values of a signal, whether continuous or discrete, to assume one or another of a discrete set of values. By quantizing a discrete signal we obtain a digital signal.
Quantization noise: A type of noise inherent in the quantizing process due to the difference in amplitude between the original analog signal and the quantized signal. This implies an uncertainty regarding the original infor- mation, which is then construed as quantiza- tion noise.
Single - polarity pulse: A two -level pulse in which one of the levels is at ground potential. The ground potential level is normally designated as the "zero" level.
Time -division multiplexing (TDM): A system in which the sample pulses are very narrow as compared to the sampling time. It is hence feasible to insert a number of such pulses, corresponding to different information channels, into the time period between the successive samples of any one channel. We hence obtain a sequence of pulses during each sampling period. The pulses are routed to their respective channels at the receiving end.
Time domain: A graphical way of representing signals in which the horizontal axis is calibrated in units of time; alternatively , it may be applied to a mathematical represen- tation of signals in which the variable is in units of time.
Z- transform: A modification of the Fourier transform for use with digital signals in which the Laplace variable s is replaced by z = e'r. The meaning and utilization of this transform will be developed in the next article of this series.
www.americanradiohistory.com
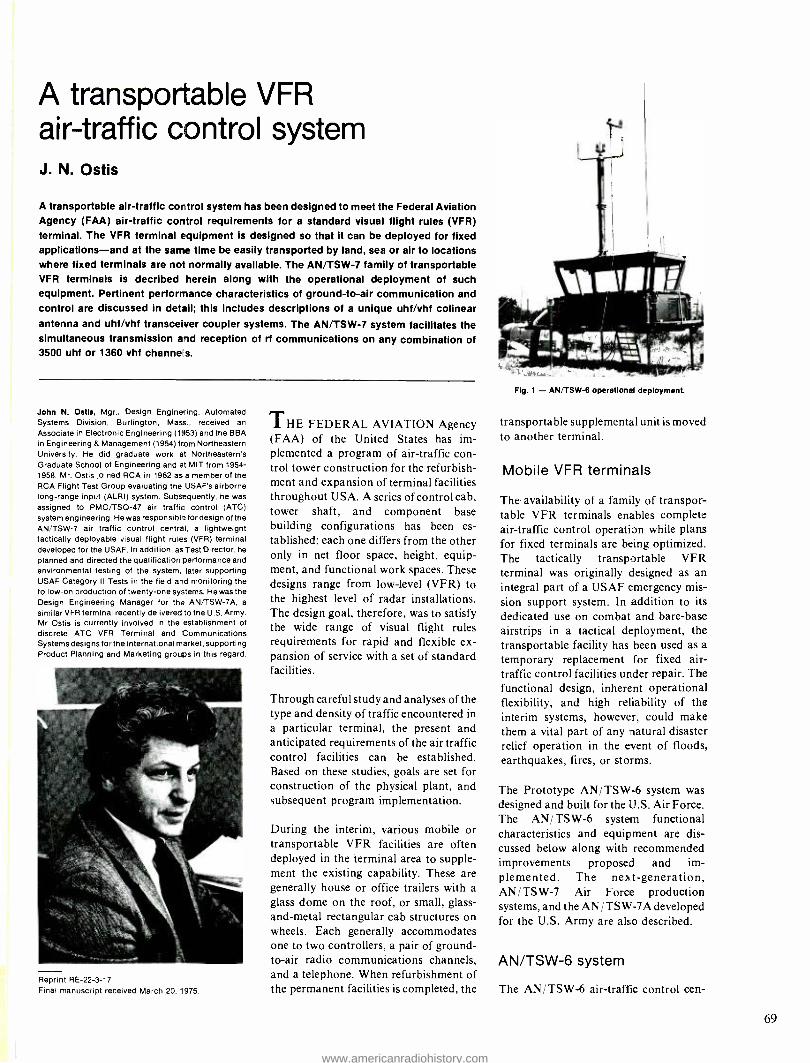
A transportable VFR air-traffic control system J. N. Ostis
A transportable air -traffic cor trol system has been designed to meet the Federal Aviation Agency (FAA) air -traffic control requirements for a standard visual flight rules (VFR) terminal. The VFR terminal equipment is designed so that it can be deployed for fixed applications -and at the same time be easily transported by land, sea or air to locations where fixed terminals are not normally available. The AN /TSW -7 family of transportable VFR terminals is decribed herein along with the operational deployment of such equipment. Pertinent performance characteristics of ground -to -air communication and control are discussed in detail; this includes descriptions of a unique uhf /vhf colinear antenna and uhf /vhf transceiver coupler systems. The AN /TSW -7 system facilitates the simultaneous transmission and reception of rf communications on any combination of 3500 uhf or 1360 vhf channels.
John N. Ostis, Mgr., Design Enginering, Automated Systems Division, Burlington, Mass., received an
Associate in Electronic Engineering (1953) and the BBA in Engineering & Management (1954) from Northeastern University. He did graduate work at Northeastern's Graduate School of Engineering and at MIT from 1954- 1956. Mr. Ostis joined RCA in 1962 as a member of the RCA Flight Test Group evaluating the USAF's airborne long -range input (ALRI) system. Subsequently, he was
assigned to PMO/TSQ -47 air traffic control (ATC) system engineering. He was responsible for design of the AN /TSW -7 air traffic control central, a lightweight tactically deployable visual flight rules (VFR) terminal developed for the USAF. In addition, as Test Director, he
planned and directed the qualification performance and environmental testing of the system, later supporting USAF Category II Tests in the field and monitoring the follow -on production of twenty -one systems. He was the Design Engineering Manager for the AN/TSW -7A, a
similar VFR terminal recently delivered to the U.S. Army. Mr Ostia is currently involved in the establishment of discrete ATC VFR Terminal and Communications Systems designs for the international market, supporting Product Planning and Marketing groups in this regard.
Reprint RE- 22 -3 -17 Final manuscript received March 20, 1975.
THE FEDERAL AVIATION Agency (FAA) of the United States has im- plemented a program of air -traffic con- trol tower construction for the refurbish- ment and expansion of terminal facilities throughout USA. A series of control cab, tower shaft, and component base building configurations has been es- tablished; each one differs from the other only in net floor space, height, equip- ment, and functional work spaces. These designs range from low -level (VFR) to the highest level of radar installations. The design goal, therefore, was to satisfy the wide range of visual flight rules requirements for rapid and flexible ex- pansion of service with a set of standard facilities.
Through careful study and analyses of the type and density of traffic encountered in a particular terminal, the present and anticipated requirements of the air traffic control facilities can be established. Based on these studies, goals are set for construction of the physical plant, and subsequent program implementation.
During the interim, various mobile or transportable VFR facilities are often deployed in the terminal area to supple- ment the existing capability. These are generally house or office trailers with a glass dome on the roof, or small, glass - and -metal rectangular cab structures on wheels. Each generally accommodates one to two controllers, a pair of ground - to -air radio communications channels, and a telephone. When refurbishment of the permanent facilities is completed, the
Fig. 1 - AN/TSW-6 operational deployment.
transportable supplemental unit is moved to another terminal.
Mobile VFR terminals
The availability of a family of transpor- table VFR terminals enables complete air -traffic control operation while plans for fixed terminals are being optimized. The tactically transportable VFR terminal was originally designed as an integral part of a USAF emergency mis- sion support system. In addition to its dedicated use on combat and bare -base airstrips in a tactical deployment, the transportable facility has been used as a temporary replacement for fixed air - traffic control facilities under repair. The functional design, inherent operational flexibility, and high reliability of the interim systems, however, could make them a vital part of any natural disaster relief operation in the event of floods, earthquakes, fires, or storms.
The Prototype AN /TSW -6 system was designed and built for the U.S. Air Force. The AN /TSW -6 system functional characteristics and equipment are dis- cussed below along with recommended improvements proposed and im- plemented. The next -generation, AN /TSW -7 Air Force production systems, and the AN /TSW -7A developed for the U.S. Army are also described.
AN /TSW -6 system
The AN /TSW -6 air -traffic control cen-
69
www.americanradiohistory.com

140
120
100
m 80
z O V
60
40
20
319.,, -c
RI-707/7 UHF Rx
CU- 1189/T COUPLER (NOMINAL)
I I I I I 1 I 1 1 I I 1
6 5 4 3 2 1- F +1
Af IN MHz
2 3 4 5 6
Fig. 2 - Uhl receiver and coupler rejection characteristics.
tral was the VFR facility of a visual flight rules/ instrument flight rules (VFR/ IFR) air -traffic control, navigation, and long - range 'point -to -point communications system. Fig. I depicts a typical operational deployment of the AN /TSW -6 system built ten years ago. Its basic use was that of a permanent airport VFR terminal facility. Entirely self- contained, with integral primary power and environmental control facilities, the system was autonomous; it could be operated independently or as an integral subsystem of any IFR system, fixed or transportable. Terminal equip- ment included the following:
Four vhf transmitter -receiver units.
Five uhf transceivers.
Collinear uhf and vhf antenna and coupler system.
Ultra- high- frequency direction finder (DF). High- frequency transceiver and antenna coupler system.
Landline (telephone) equipment. Radiotelephone uhf intercommunications system.
In addition to the above, there were three discrete console assemblies, Local, Data and Ground Controller, designed as in- dividual units. Identical communications selector panels facilitated mutually in- clusive and simultaneous use of all ten radio channels. The AN /TSW -6 system represented a "first " -housing the cited equipment and accommodating three VFR controllers in a glass and metal
70
140
120
100
80
60
40
20
0 6 5 4 3 2 1- f +1
dF IN MHz
2 3 4 5 6
Flg. 3 - Uhl receiver and coupler rejection characteristics 141.8.
shelter 3.68m X 2.12m X 2.23m (L X W X
H).
In tìhf and vhf systems of the AN /TSW -6,
interference between commonly coupled communication equipment was reduced through receiver preselection, i.e., the off - channel rejection characteristics of the tunable bandpass filters integral to the antenna couplers and the rf selectivity of the receivers themselves.
Figs. 2 and 3 are graphical presentations of the selectivity characteristics of typical AN /TSW -6 uhf and vhf transceivers and antenna couplers. From these data, spec- tral limits of receiver interference from mutually coupled transmitters at es- tablished receiver thresholds (squelch settings) and transmitter powers could be approximated with reasonable accuracy. For example, considering a uhf receiver squelched to 1.0 -12V, (- 107 -dBm), 151 -
dB of attenuation would be required to reduce a transmitter output of 25 watts (44 -dBm) to this level; incorporating a system margin of 10-dB, this becomes 161 -dB. This level of attenuation should eliminate receiver interference from a collocated transmitter at any frequency. Referring to the figures, it is evident that a frequency separation of at least 5 -MHz would be required to achieve this degree of decoupling.
Dynamic measurements were made of antenna pattern distortion due to prox- imity effects of another antenna or a finite
obstruction. An AT -197 uhf discone was used in the latter investigations on an antenna cross -arm configuration similar to the AS- I573/ TSW -6 antenna assem- bly. In both cases it was determined that deviations in azimuth circularity on the order of ±4.5 -dB or more could be expected for physical separations of one wavelength and ±3.2 -dB for three wavelengths. The pattern distortion data has been reproduced in Fig. 4. It was concluded that when antennas are in- stalled in coplanar fashion on crossarms, or displaced less than 10 -12 wavelengths from a conducting mast assembly,
270° 90°
180°
PLOT NO. I AT -I97 OBSTRUCTED AT
PLOT NO. 2 UNOBSTRUCTED AT -197
Fig. 4 - AT -197 antenna pattern distortion.
www.americanradiohistory.com

allowance must be made for proximity effects.
Reasonably accurate predictions of radio transmission path loss, or more specifically, the ratio of radiated power to received power, can be made by consider- ing the modifying effects of the at- mosphere on the transmission loss ex- pected in free -space. Free -space transmis- sion assumes propagation in a uniform, non -absorbing atmosphere wherein the transmission losses are due solely to the spherical radiation of power; the earth being far removed or its reflection coefficient negligible.
Assuming standard atmospheric refrac- tion, a transmitting antenna at height h, and a receiving antenna at h, may be considered to be within radio line -of -sight (LOS) if they are separated by less than
(2h0'12 + (2h0I'2 statute miles.
Neglecting refraction, the optical or geometric horizon may be expressed as d = (3h/ 2)112 and the resultant LOS path by
(3h1/2)/ + (3h, /2)'n statute miles.
This computation is depicted in Fig. 5.
Dynamic investigations of ground -to -air uhf communications utilizing the AT -197 uhf discone antenna singularly mounted on the cross -arm assembly, the two - element stack antenna and a four -element collinearly phased AS -505 G/R uhf antenna, clearly reflected the superiority of the directional antennas. Although station passes at high altitudes (i.e. with the aircraft directly overhead) indicated reduced signal levels from these high -gain antennas, at no time were com- munications exchanges disrupted or
deteriorated in quality.
Worthy of note were the persistent received signal levels 1.0 3.0 microvolts realized from typical military airborne uhf communications systems at ranges of approximatley 0.85 optical LOS (i.e. neglecting refraction) utilizing the more directive antennas. With the aircraft at 20,000 ft, communications were maintained at these levels
consistently beyond 150 nautical miles.
The minimum system effective radiated power (ERP) required was also con- sidered. Assuming the maximum range of the serviceable volume specified for the terminal to be 44.7 miles (radio LOS at 1,000 ft), with an airborne receiver threshold of 3.5 -0 ( -96 dBm), the minimum effective radiated power re- quired from the terminal at 400 MHz was calculated from the expression for path attenuation between isotropic antennas as:
P, = Pf2d2(4.56 X 10) P, = (2.45 X 10⁻¹³)(1.477 X 10¹²)
P, = 0.3619 watts
where f = frequency in MHz d = distance in miles
Allowing for a margin of an order of magnitude in addition to antenna directivity or gain, with transmitter power outputs in excess of 10 watts, the system incorporated a more than ade- quate ERP for normal operations.
As a result of the analysis and tests of the AN /TSW -6 uhf/ vhf communications system, an antenna and coupling system was recommended which would significantly improve the operational capabilities of the system, permitting closer (2 -MHz) channel spacings to be
UNE OF SIGHT
(R+h)2 = R2+ - IF h «2R, THEN:
d = %2Rh+h2
J 2 (3960) h
d 5280
d =J
WHERE:
R = RADIUS OF EARTH (3960 mi)
h = HEIGHT OF ANTENNA IN FEET
d = HORIZANCE DISTANCE IN MILES
Fig. 5 - Line of sight (LOS) computation (neglecting refraction).
utilized. The proposed system incor- porated a different type of coupling technique and a new collinear, high -gain antenna system enhancing long -range communications coverage. This effected a reduction in mutual interference as follows:
Increased broad -band isolation between commonly coupled transceivers.
Further reduction in the magnitude of radiated spurious signals by utilizing sharper transceiver preselection filters.
Increased decoupling between integral uhf and vhf antennas.
Elimination of antenna H -plane pattern dis- tortion.
Basically, the recommended uhf/ vhf antenna system consisted of three uhf and two vhf antennas, collinearly stacked to form a single antenna mast structure.
The antenna coupling system was com- posed of vhf and uhf hybrid couplers and highly selective, passive filters, tunable over the spectrum of interest. The nominal decoupling between hybrid in- puts or integral antennas, in conjunction with the off -channel rejection characteristics of the recommended filters, would assure at least 65-dB of isolation between collocated or common- ly coupled equipment at frequency separations of 2.0 -MHz.
Inherent in this method of obtaining a minimum of 20-dB of broadband isola- tion between units and 45 -dB of selective filtering at frequency separations of 2.0 MHz was an additional 3.0-dB transmis- sion loss, with cabling and filter insertion losses comparable to those of the original system. This loss occurs in the hybrid coupling system. However, the proposed antenna system served to obviate any operational compromise; rather, the system low -altitude communications coverage was enhanced by the directivity of these antennas. The antenna and coupling systems were subsequently im- plemented into the three origianl AN /TSW -6 systems. These were then renomenclatured AN/ TSW -6A.
AN /TSW -7 system
Basically a next generation system to the AN /TSW -6, the AN /TSW -7 configura- tion took advantage of the latest ad- vances in hardware design. This included new, completely solid -state multichannel uhf transceivers, updated vhf trans- ceivers, regulated dc power supplies,
71
www.americanradiohistory.com

automatic sensing and transfer circuitry, and a newly developed multichannel uhf/ vhf radio direction finding system with digital display, bearing storage, and remoting capability.
The new, uhf/ vhf collinearly stacked communications antenna system and ancillary couplers were an improvement over the AN /TSW -6A configuration described above. These improvements enabled simultaneous operation on any combination of communications channels in random transmit and receive modes with measured frequency separations approaching 1.0 and 0.5 MHz in the uhf and vhf spectrum, respectively.
Fig. 6 indicates the AN /TSW -7 typically deployed. Like predessor systems, it
facilitates VFR terminal air -traffic con- trol operations worldwide. Subjected to more stringent environmental, shock, and vibration requirements than that of the AN /TSW -6, the system can with- stand any mode of tactical transport.
Salient features of the system are listed in Table 1. The integral equipment comple- ment includes the following:
Five uhf transceivers installed, plus accom- modations for two additional: 3500 50 -kHz channels, 225.00 - 399.95 MHz; transmitter power 20 watts; receiver sensitivity 2.5 µV for 10 dB S +N /N ratio. Four vhf transceivers: 1360 25 -kHz channels, 116.000 - 149.975 MHz; transmitter power 25 watts; receiver sensititivy 3.0µV for 6 -dB S +N /N ratio.
Uhf /vhf Radio Direction Finder (RDF): 1360 vhf channels 1 16.000 - 149.975 MHz, 3500 uhf channels 225.00 - 399.95 MHz; sensitivity, vhf l0 -µV /meter, uhf 25- AV /meter; system accuracy ± 1.0 degree. Primary power: 3 phase 4 -wire 120/ 208 volts, 50, 60 or 400 Hz; or 28 Vdc plus 1.0 kW, single phase, 115 VAC 50/60 Hz. Landline (telephone) system, seven dial /ring -down, CB -LB pairs, 2- wire /4- wire, three direct -line pairs plus terminations for an additional sixteen pairs; audio power output (min.) -8 dBm, input (min.) -28 dBm; range, 5 miles WD -1 /TT field wire, hum, crosstalk and residual noise -59 dBm, minimum. Uhf/vhf collinear antenna system: three uhf /vhf antenna modules plus one anciliary AT -197 uhf discone antenna.
The system included three controller con- soles, each with full radio com- munications channel control capability. A pair of telephone control panels was situated between consoles for easy con- troller access. Two barometers were in- stalled within the Data Controller's (mid-
Table I - System performance features.
Uhf/ vhf antenna module - Uhf (2- element) Vhf dipole
Freq. Range
Gain
Beamwidth
Beamtilt
Circularity
Common to both:
vswr - lmpedence -
Integral decoupling:
Antenna couplers:
Tunable bandpass filters:
Range
Insertion loss
Selectivity @ Of= 2 MHz
Power rating
225 - 400 MHz
3.5 dB;
25 - 50°
5 + 2°
±0.5 dB
2.0:1
50 ohms
uhf to vhf antenna
uhf to adjacent uhf
116 - 150 MHz
1.5 dB,
50 - 100°
±0.75 dB
Polarization - vertical
Power rating - I kW
30 dB
45 dB
vhf to adjacent vhf 25 dB
Ferrite, four -port hybrid junctions, 50 W each port, isolation into mached loads, 45 dB, minimum.
uhf vhf
225 - 400 MHz 116 - 150 MHz
2.0 dB max 3.0 dB max.
=45 dB =40 dB
100W 50W
72
Fig. 6 - AN/TSW -7 operational deployment.
die) console along with 20 flightstrip holders. The Local Controller's console includes a wind velocity and direction display, RDF control and indicator assembly, and remote control units for the uhf and vhf tactical emergency transceivers. The Ground Controller's console incorporated an identical wind velocity and direction display, the com- munications selector panel assembly common to all consoles and a NAVAID monitor unit and alarm assembly.
The communications antenna system consists of three identical uhf / vhf anten- na modules collinearly stacked on a pair of mast base sections, the upper one of which accommodates the antenna entry or access connectors. An obstruction light assembly with provisions for mounting an AT -197 uhf discone antenna for the two auxiliary uhf channels tops the structure. Each uhf/ vhf antenna module is itself a collineated antenna assembly. It conists of a two -element, collinearly phased, broadband uhf anten- na and a vhf broadband dipole con- solidated in one integral, non -separable section. Guying and erection equipment, transit and stowage elements complete the antenna complement. The antenna assembly is mounted on a base plate on the ground at the corner of the shelter. The mast base sections raise the lowest radiating element of the bottom -most antenna above the shelter roof, with the shelter fully elevated (1.22 meters) on the levelling jacks.
Utilizing an antenna coupling system similar to that heretofore described, the antenna system accomodates up to seven
www.americanradiohistory.com

Fig. 7 - UN /TSW -7A deployed.
uhf transmit -receive channels plus one continuous guard channel monitor - receiver, four vhf transmit- receive channels and corresponding guard receiver.
The versatility of the system is apparent. The uhf/ vhf antenna modules are in- terchangeable and may be added or substracted as directed by the radio com- munications equipment complement, itself a variable. With the auxiliary uhf discone antenna installed, coupling radios to common antennas in pairs results in the accommodation of eight uhf and six vhf communications channels. By
cascading hybrid couplers, this could be doubled. Clearly, this modular concept in the design and implementation of a ground -to -air communications antenna system lends itself to any uhf/ vhf com- munications complex, be it VFR, IFR, enroute or terminal communications facility. With the initial installation of a single antenna module of this type, the
Sn-..
ái ,"
. 4
as. s
. - -- - .
`.
a..-?rg,aa-, - x: ..
Fig. 9 - AN /TSW -7A interior console structure.
system could cover the uhf and vhf communications spectrum with primary and backup channels. As the need for additional channels increases, the re- quirement is readily satisfied by adding to the antenna and incorporating the additional coupling and radio equipment within the basic terminal structure itself. There is no need of a `transmitter shack' or separate `antenna farm'. The possible savings in real estate, physical facilities and remoting equipment are substantial.
AN /TSW -7A system
The versatility described is evident in the AN /TSW -7A system recently developed for the U.S. Army. This tactically transportable V FR terminal incorporates the basic shelter, antenna system, con- troller consoles, communications access and monitoring equipment, landline system, NAVAID monitor and DC power supplies of its predecessor. Utiliz- ing standard lightweight avionics equip- ment (SLAE) radios from Army inven- tory, the system provides three each ground -to -air communications channels in the vhf/ fm spectrum, 30.00 - 75.95 MHz (920 50 -kHz channel); the vhf am spectrum, 116.000 - 149.975 MHz (1360 25 -kHz channels); and the uhf spectrum, 225 - 399.95 MHz (3500 50 -kHz channels). The system incorporates a one -for -one backup transceiver for each primary unit, making a total of eighteen transceivers installed in the shelter along with one hf/ ssb transceiver tunable over 27,999 channels in the 2 - 30 -MHz fre- quency band. Figs. 7 thru 9 portray the system typically deployed in the field during qualification performance and flight testing, and the shelter interior showing integration of equipment.
Uhf and vhf /a.m. transceivers are
Fig. 8 - AN/TSW -7A shelter.
singularly connected to individual anten- nas through tunable bandpass filters as are the vhf/ fm equipment to center -fed whip antennas and associated tunable antenna couplers. The hf /ssb channel incorporates an automatically tunable HF coupler and a 4.85 - 9.7 meter whip antenna displaced apploximatley 34 meters from the shelter. The system fulfills Army requirements for a VFR terminal capable of world -wide deploy- ment and autonomous operation as well as with virtually any GCA radar facility. It is logistically supportable with SLAE equipment common to the U.S. Army airframes in the terminal area itself.
Summary
The prototype of a family of tactically deployable, transportable VFR terminal air -traffic control systems has been described, along with its functional limitations and the development of viable solutions and equipment. Successor systems have also been detailed and their utility in fixed installations proposed for consideration. The basic concept of the compact mobile terminal facility for in- itial installation at terminals under con- sideration, where fixed facilities are not available or as an adjunct to those in existence, was introduced. Restating this concept, the lightweight, readily transportable and rapidly deployable, fully equipped VFR and communications terminal is most functionally useful and is
necesary in certain situations to im- plementing an air strip in an austere contingency area -temporarily replacing terminal facilities under repair, sup- porting natural or civil disaster relief operations, and in providing training and mobility exercises for the rapid deploy- ment associated with military or civilian emergency alerts.
73
www.americanradiohistory.com

74
Polar -to- rectangular scan conversion improves radar display A. Acampora W.D. Henn
This integrator approach simplifies the method of presenting polar- coordinate informa- tion on a rectangular- coordinate display. In a radar plan -position indicator display, it
produces a highly linear conversion with only half the error of the previous methods used.
Alfonso Acampora, Advanced Systems, RCA Global Communications. Inc., New York, N.Y., obtained the BEE (Magna Cum Laude) in 1957 and the MEE in 1959 from the Polytechnic Institute of Brooklyn. At that time. he
joined RCA Defense Electronics Products Advanced Communications Laboratory in New York City. His work there included development of solid -state FDM multiplex systems. multi- channel data modems. digital phase - locked circuitry for high -speed transmission systems, and advanced demodulation techniques- particularly in
the area of fm threshold extension. In 1969. Mr. Acam- pora joined RCA Global Communications, where he had project responsibility for the development of a narrow - band video system For his participation in this program, he received the David Sarnoff Outstanding Achievement Award. Currently. Mr. Acampora has responsibilities in microprocessor applications and data systems engineering. He is a member of Tau Beta Pi. Eta Kappa Nu. and Sigma Xi.
William D. Henn, Principal Member. Engineering Staff. Advanced Development 8 Design Group, RCA Global Communications. Inc.. New York. N.Y.. received the BEE from Manhattan College in 1961 and the MEE in 1963 from New York University. He has also completed work toward the ScD in Engineering at the New Jersey Institute of Technology. From 1966 to 1968. he was at the RCA Advanced Communications Laboratory in New York City. when he joined the Advanced Design Group at
Globcom and was assigned to tasks involving digital tape butter design and alternate voice /data controllers. In 1972. he was given the television camera design responsibility for the Videovoice communications system and is presently working on applying microprocessor technology to data communications. Prior to joining RCA. Mr. Henn was a member of the Manhattan College faculty. where he taught un- dergraduate courses in electrical engineering.
Authors Acampora (left) and Henn.
A PLAN -POSITION INDICATOR ( PPI) display is well- suited for presenting information requiring polar plots. Radar, for example, uses a PPI to display range and azimuth information. A PPI display on the screen of a cathode ray tube (CRT) is in a form most closely oriented to the user's experience. That is, the viewer sees
the display as if he were in the center, and all displayed objects or targets exhibit the same relative bearings the user would observe directly.
The conventional PPI display utilizes a
mechanical yoke arrangement. It is possi- ble to generate a PPI display on an x -y deflection system by using internal radar sweep and rotational signals in conjunc- tion with external converters and mul- tipliers. However, these techniques are cumbersome and complex, respectively. The circuit configuration to be described is a simple implementation which none- theless offers a highly linear, stable generation of the signals required to convert radial and angular polar positions into rectangular form.
Conventional radar PPI operation
In the conventional PPI, an electron beam is magnetically deflected radially (from the center to the edge) by a
trapezoidal sweep current applied to a
yoke coil. In addition, the yoke is rotated around the neck of the CRT usually by means of an electromechanical servo system that is synchronized with the rotation of the antenna.
The most common synchro employs five signal wires, three of which are sin B
Reprint RE- 22 -3 -12 Final manuscript received October 2, 1975.
waveforms each separated by 120° phase
displacement and modulated by a carrier frequency (usually 60 Hz, but sometimes 400 Hz). The remaining two signal wires
are used for the carrier reference signal and a ground. These signals are used to rotate the yoke via a synchro motor. Several PPI displays can be driven by one
system, but each display requires a
rotating yoke with a motor and mechanical coupling.
The sweep waveform in the conventional PPI is a constantly time varying sawtooth type signal, R(t), whose rate is adjusted to correspond to a predetermined range scale. A reflected signal received from a
target modulates the electron beam to produce an increased intensity at a point on the display corresponding to the range
and azimuth of the target.
Specialized circuits are usually incor- porated in the sweep generator to give the
(A)
IB)
(c)
4 1-zL
Fig. 1 - Range trace generation using x -y signals.
www.americanradiohistory.com

o
t2
o
II
I,
I I
I I
I I
11
I
Fig. 2 - X -V signal format for producing a rotating range trace.
sawtooth waveform a trapezoidal characteristic, thus counteracting the yoke coil inductive/ resistive effects. Additionally, the sweep signal is further intentionally distorted to accommodate the large, flat -faced CRT. Both these techniques endeavor to improve range accuracy. However, azimuthal accuracy suffers from the slippage of synchronous motors, plus the jitter and non - uniformity of the gearing from the anten- na mast to the synchro, as well as the gearing from the servo motor io the yoke.
X -Y signal requirement for PPI
In some PPI's, instead of rotating the coil, special circuits are used in conjunc- tion with fixed orthogonal coils to create a rotating magnetic field, and hence, a rotating range trace. The fixed deflection yoke can be the same as used in Type B
azimuth range radar indicators, although the general case can include the elec- trostatic deflection mechanisms of con- ventional and storage oscilloscopes, electro- mechanical x -y plotters, as well as silicon target tubes and other devices.
Fig. I illustrates the method of producing a rotating range trace with an orthogonal deflection system. In Fig. la, a linear deflection signal (current or voltage) is
applied to the x -axis only, over a period of time T, as shown. A horizontal range trace will be produced by the electron beam moving linearly from the center to the edge in the same period. In the case of magnetic deflection, the beam will actual- ly be perpendicular to the magnetic field axis, but this is incidental to the operation being presented. In Fig. lb the deflection sawtooth is applied to both x- and y -axes (in some proper amplitude proportions)
RADAR SYNCHRO
SIGNALS
SYNCHRO
TO
SIN-COS CONVERTER
SIN 9 4 QUA R SIN 9
COS
MULTIPLIER
R COS -Er 4 QUAD
MULTIPLIER
SWEEP FROM RADAR
I I
FROM fl RADIAL SA WTOOTH
SWEEP GENERATOR DRIVE
such that, in a Lissajous sense, the trace is
positioned between the two axes. In order for the trace to describe a straight line, both deflection signals must be applied simultaneously over the period T. In Fig.
lc, the deflection is applied to the vertical axis only, and the trace is now orthogonal to its original position. The trace can thus be made to rotate through an angle of 90 °, if during a periodic succession of sweep intervals, the x deflection signal is
slowly decreased from maximum to zero, while the y deflection signal is
simultaneously increased from zero to maximum. Full 360° rotation is obvious- ly obtained if the deflection signal polarities are reversed properly.
It is well known that orthogonally deflecting an electron beam with properly adjusted sinusoidal and cosinusoidal signals produces a deflected beam that has constant angular speed and traces a
perfect circle. For the range trace of Fig. I
to have constant length, and rotate at a
constant speed, the envelopes of the sawtooth sweep signals must therefore be
sinusoidal. Fig. 2 depicts the total deflec- tion signal system where the sawtooth signals are applied to both x and y simultaneously but with sinusoidal envelope variations. The two envelopes differ in phase by 90 °, as shown, and have equal peak amplitudes (if the x -t'
deflection sensitivities are equal).
Present x -y signal generation techniques
A PP1 with a rotating yoke system has numerous applications where it is
desirable to use x -v deflection devices. Such applications include:
a) Remote presentations on standard os- cilloscopes.
Fig. 3 - Conventional system approach.
b) Recording one full scan on a suitable storage device for viewing.
c) Recording one scan on storage devices for subsequent rectangular slow -scan transmis- sion over narrowband facilities.
The current approach, which relies on transforming the five -wire synchro signal to sine and cosine signals, using com- mercially available converters, is shown in Fig. 3. As shown, the sweep signals are coupled directly from the internal radar deflection circuits. The final and most critical step is to multiply this deflection signal with the sine and cosine signals in
four quadrant multipliers, yielding ap- proximately the waveforms of Fig. 2.
Some of the problems encountered in this approach result from the nonlinearity of the radar sweep signals, which are usually intentionally distorted to accommodate the large flat -faced CRT's used in the display. This can be overcome by regenerating a linear sawtooth which is
synchronized to the radial sweep drive pulse or blanking pulse. This is shown by the dotted alternative in Fig. 3. Other problems relate to the multiplier chains, which are complex in their design and construction and somewhat non -linear. For example, the requirement to match the characteristics of the two multipliers is difficult to achieve because each mul- tiplier exhibits non -uniform multiplica- tion characteristics in each of the four quadrants. Furthermore, dc instabilities cause drifts in the resulting output signals, with corresponding origin offsets in the polar display.
New integrate -durfip technique
At RCA Global Communications, Inc., a
circuit has been developed and tested which, unlike the previously described approaches, does not require a linear
75
www.americanradiohistory.com

SIN A OR
COS A
SWEEP
OR BLANKING DRIVE
PULSES
FET OR OTHER SUITABLE CHARGE DUMPING DEVICE
R SIN A OR
R COS A
AMPLITUDE
PART OF
/SIN rat OR COS rat
0
TIME
n ( (ntl)T
Fig. 4 - New system combines sweep generator and multiplier using an operational amplifier. Fig. 5 - Integrator input signal representation.
sweep signal or a multiplier. In fact, it combines the regeneration and mul- tiplication into one operation using a
simple operational amplifier, feedback - coupled as an integrator.
Fig. 4 is an illustration of a very -high -gain inverting amplifier having an input resistor R and a feedback capacitor C. This well -known configuration produces an output signal which is the time integral of the input signal multiplied by an integration constant determined by the values of R and C. Additionally, a charge dumping device (shown in Fig. 4as a field effect transistor), is coupled across the capacitor. The FET can be replaced by a
relay or other suitable discharging device. In the static case ( with a dc bias applied to the input), the output of the device will be
zero as long as the FET is conducting. When the FET is turned off, the output will rise linearly in a ramp waveform. If the FE"I is turned on by a periodic sequence of pulses of period T (whose duration is suitable to fully discharge the capacitor), then the output will be a
periodic linear sawtooth signal of cons- tant amplitude and period.
In the actual operation of polar -to- rectangular conversion, the two devices in the configuration, one with a
sinusoidal input, the other with a
cosinusoidal (quadrature) input, are used to generate the waveforms of Fig. 2.
The charge dumping pulses are derived from the radar blanking pulse train and fed to each FET simultaneously. In a
simplified analysis, after the charge dumping interval, the output sawtooth from each device rises linearly to the instantaneous value of the input sinewave signal. The output envelope, from the device fed by the sine wave, is a sine wave,
76
and equally, the output envelope of the device fed by the cosine wave is a cosine. Because of the charge dumping opera- tion, the feedback does not integrate the
input signal to effect the envelope, but rather to effect the instantaneous saw -
tooth. The next section details the mathematics of the operation and yields results pertaining to the linearity (range error) and azimuthal errors, which, for all practical considerations, are neglibible.
Analysis
In the radar application, there are two important parameters. One is the azimuthal heading, B, of the antenna mast. Signals defining this angle are
present in the synchro system, and are
available as sinusoidal and cosinusoidal functions of B. The second critical parameter is the sweep interval, T, related to the radar range.
In the system under discussion, the two integrators will operate on the sine and cosine signals respectively over an in- tegration interval T, from some nT to (n +I) T, where n is an arbitrary integer used to count successive sweep intervals from any convenient starting point. The analysis does not require any special relationships between the period of the angular rotation and the sweep interval.
The only assumption made is that any one integration interval is completely independent of the past. That is, the dumping process is complete in its dis- charge of the capacitor, and that the output from the integrator has exactly a
zero -level initial condition at the start of each integration interval, T.
From this viewpoint, it is correct to analyze the operation with a time
waveform shown in Fig. 5 as applied to a
continuously active integrator. That is,
the input to the integrator is an arbitrary interval of a sine wave (or cosine wave) that is non -zero only over the period nT to (n+I)T.
The waveform can be conveniently ex- pressed with the aid of the unit step
function. Performing the required in- tegration (by parts) results in two equations, one from the x- deflection and one from the y- deflection, which are
analytically expressed as:
E, = 2k /w cos /2 [w(r + nT)] sin '/Z[w(r -nT)] (I)
E, = 2k w sin '/ [(D(r + nT)] sin '/ [w( - nT)] (2)
where k is constant (related to the in- tegrator), to is the angular velocity of the antenna, and r is the dummy variable restricted to the interval shown in Fig. 5.
The actual resultant trace vector is
formed by
ER = (f_, + E,')`', or (3) ER = 2k w sin '/, [co( r - nT] (4)
Comparisons and approximations
Eq. 4 shows that the integrator gives a
resultant trace which is actually a part of a sine wave over the integration interval. However, if the product of the antenna rotation speed and the period of the radar pulse train (to 7) is small, Eq. 4 can be approximated by
ER = k (r - nT) (5)
Such an approximation is extremely valid, and an analysis in the next section
www.americanradiohistory.com

will derive the departure from linearity of Eq. 4 under typical radar parameters. Eq. 5 is also the result obtained from the multiplier approach.
The integrator cartesian waveforms, given by Eqs. I and 2, subjected to the same approximation (wT«l), yield equations which, when compared against those of the multiplier, show an in- teresting property of the integrator. Whereas the multiplier waveform is a ramp whose amplitude is modulated by the instantaneous value of sin tor, the integrator waveform is a ramp whose amplitude is modulated by the instan- taneous value of the sine wave evaluated at a point midway between the actual running variable r and the start of the interval nT. As will be seen, this averag- ing property actually reduces the azimuthal errors associated with the rotating yoke arrangement or the mul- tiplier approach.
Fig. 6 shows how the deflected beam departs from the initial true azimuthal bearing for both the conventional and integrator approaches. The trace vector from the multiplier initiates in the direc- tion of the radar pulse propagation, at an angle of wnT, and finalizes at a direction w(n +l) T, such that the trace vector rotates through an angle co T during the sweep interval.
The trace vector from the integrator also initiates in the direction of propagation. However, the final position is in a direc- tion w(n +1/2)T, such that the trace vector rotates through an angle to T/ 2 during the sweep interval.
Admittedly, the azimuthal change of oiT radians which the conventional (rotating yoke) PPI display undergoes during a
sweep interval is small in practical radar considerations, such that the error is
usually negligible. However, the in-
tegrator yields an azimuthal error that is
only half of the conventional ap- proaches', and in fact, a later discussion will show how this error can be eliminated entirely.
Other applications
The device described has numerous applications where time/ amplitude variant sawtooth signal generation is
required. For example, consider the case where raster scan information is derived from a source with time -base instabilities. Such a condition exists when line -by -line video information is recovered from a tape or disc storage system. Synchroniza- tion information recovered from the signals and applied to aperiodic deflections will result in severe geometric distortion due to the compression or expansion of the raster line. This is so because the typical aperiodic deflections have a fixed rate of deflection such that the amplitude of the resulting sawtooth signal is dependent upon the spacing of the drive pulse. Resonant deflections will
likewise give geometric distortions with the added complexities caused by the ringing associated with exciting a reso- nant circuit with non -uniformly spaced pulses.
Currently, sophisticated mechanical and servo electrical systems are employed to account for forms of speed variations in
playback devices. The requirements of these servos can be relaxed by using an integrator with a time -variable input as described in this paper. In a video recording system, a pilot tone or sync track can be recorded which, during playback, can be used to develop speed variation information (perhaps with a simple frequency discriminator). Apply- ing this time -base information in place of the sine or cosine inputs to the integrator will cause the rate of deflection to track the speed variation of the information.
1 SCAN /
/ CONVENTIONAL
LoT
ANTENNA
POSITION A r
START OF
PPI BEAM PATH / / USiNG
INTEGRATORS
Fig. 6 - Expanded theta scale showing azimuthal errors.
Therefore, the displayed raster will have no significant geometric distortions.
In another application, using an in- tegrator to develop a constant- amplitude sawtooth signal from a train of pulses with variable repetition rate will normally result in sawtooth amplitudes that are inversely proportional to the pulse rate. However, if the signal applied (in place of the sinusoid) is linearly related to the pulse rate, then the sawtooth amplitude will be held constant.
In the case of radar presentation, the azimuthal errors introduced by the system are very small, as noted previous- ly. If extreme precision is required, the sine and cosine signals can be processed in a sample- and -hold circuit such that the amplitude values of these signals at the initiation of a range trace are statically held for the duration of the sweep inter- val. In this way, the range trace will be a straight line at the true azimuthal heading of the antenna at the time the pulse was emitted (see Fig. 6). Accordingly, azimuthal errors can be eliminated.
Summary
The scan conversion methods described have been successfully applied to store PPI scan information from an AN/ FPS - 19 radar set on a silicon target storage tube with a stationary, orthogonal - deflection yoke. The storage system, part of an RCA Globcom Videovoice unit, capable of transmitting video informa- tion over voice -grade facilities, provided the means for remote radar PPI presen- tations. Comparisons with the multiplier approach to polar -rectangular conver- sion demonstrated the superiority of the integrator approach.
Although the device described has been directly applied to polar -rectangular scan conversion for radar PPI presentations, it has many properties as a general saw- tooth function generator.
Acknowledgment
The authors wish to thank Carl Wright from Patent Operations for the many helpful discussions during the course of this work.
Bibliography
I. Reinttes..1.1-. and Coate, J_1-_ cd._ Principles ul Radar. third cd.. Neu York. McGraw -Hill Hook Co., Inc. 11952)
77
www.americanradiohistory.com

A COS /MOS- loaded COS /MOS amplifier stage Dr. S.T. Hsu
A new type of MOS linear amplifier stage is discussed. This amplifier stage contains a pair of COS /MOS transistors as the amplifying element and a pair of COS /MOS transistors as
the load. This amplifier stage has large input Impedance and output admittance. The voltage gain of the amplifier stage is independent of the supply voltage and has excellent linearity. It is also shown that this amplifier stage has large bandwidth. The performance of this amplifier stage is compared with the simple COS /MOS- and MOST -loaded amplifier stages.
THE amplifier stage to be discussed consists of two pairs of COS / MOS transistors as is shown in Fig. 1. One pair is the amplifying element and the other is
the loading element. This amplifier stage can also be considered as a parallel connection of a p- channel and an n- channel MOST -loaded amplifier stage. The amplifier stage has large bandwidth, and is able to deliver a large amount of current to a load without introducing distortion to the signal. The voltage gain of the amplifier depends only on the geometry of the device used. The input impedance of the amplifier is very large and its output impedance can be very small. In conjunction with the voltage amplification feature of MOST's, this amplifier stage is excellent for signal processing.
The circuit diagram of the amplifier stage is shown in Fig. I, where QI and Q3 are n- channel and Q2 and Q4 are p- channel MOST's. It can be easily shown that the voltage gain of this amplifier stage A(w) is given by:
gml + gm2 A,.(w) (I )
gm3 + gm4 + GI +.jwC4%f
where g,, is the transconductance of Q, GI is the load conductance, and:
Cet! = (2+A/ AV)l (CI+C/2) + CdI+Cd2+Cg3+Cg4+CI. (2)
ln the above expression, A, is the voltage gain, C/ is the drain -to -gate capacitance, C/ is the load capacitance, and Ca and Cg
are the drain -to- source and the gate -to- source capacitances, respectively. We have assumed that the drain -to- source conductance of QI and Q2 is much smaller
78
than the transconductance of Q3 and Q4.
If we further assume that the MOST's are COS/ MOS pairs, the low- frequency voltage gain of the amplifier Au(0) is given by:
A,(0) = Z,L3/Z,L, = Z2L4/Z4L2 (3)
where L; is the channel length and Z; is
channel width.
The low- frequency voltage gain of the amplifier stage depends only on the device geometry. This amplifier stage, therefore, introduces no distortion to the signal. If the MOST's are not ideal COS/ MOS pairs, small distortion can be introduced, however.
From Eq. 1 the bandwidth of the amplifier stage wr is:
wc (gm3+gm4+Gl)/ Ceff (4)
and the gain bandwidth product GB is
given by:
GB = (gml+gm2)/ Ceff. (5)
A CD4007A dual COS / MOS with an inverter was chosen to demonstrate the loading effect on the distortion and the supply voltage dependence of the voltage gain of the amplifier. For a simple transistor -loaded MOS amplifier we con- nected the two n- channel MOST's of the COS / MOS pair of the CD4007A in parallel and the p- channel MOST of the inverter as a load. For a COS / MOS amplifier, the two COS /MOS stages were connected in parallel and the gate of the inverter was connected to its drain electrodes as a load. These circuit con-
figurations are shown in Fig. 2. The source resistance in both cases was 600 H.
With these arrangements Z1 is equal to 2Z3 and L, is equal to L3 in both configurations. When the CD4007A was connected as a simple transistor -loaded MOST amplifier, the supply voltage was adjusted to obtain the optimum operating condition. When the circuit was connected to a COS / MOS amplifier, the supply voltage was arbitrarily set to ± 5 V. The operating frequency was chosen to be equal to 10
kHz. If the load resistance is 10 MSZ, the voltage gain is found to be equal to 1.24 and 1.95 compared to 21x2 and 2 as was predicted by the simple theory for the transistor -loaded and the COS/ MOS amplifier stages, respectively. For the distortion measurement, the load resistance was set as 47 ff. The ex- perimental results are shown in Tables I
and 1 1. Table I shows that there is a large
Table I - Distortion of the output signal when a
CD4007A is connected as a transistor -loaded amplifier stage.
Second Third Harmonic Harmonic
(10 kHz) (20 kHz) (30 kHz)
30 mV -30 dB 100 mV - 20 dB -50 dB
Table II - Distortion of the output signal when the CD4007A used in Table I is connected as a COS /MOS amplifier stage.
Second Third Harmonic Harmonic
(10 kHz) (20 kHz) (30 kHz)
30
100 mV
300 mV
- 72 dB - 65 dB - 62 dB
VDD
Fig. 1 - COS /MOS- loaded COS /MOS amplifier.
sv v.=IOs
vD v6 VO
4711 q 4711
sv = V- -8V=
Fig. 2a - CD4007A con- nected as COS /MOS- loaded COS /MOS amplifier.
Fig. 2b - CD4007A con- nected as simple MOS- loaded MOST amplifier.
www.americanradiohistory.com
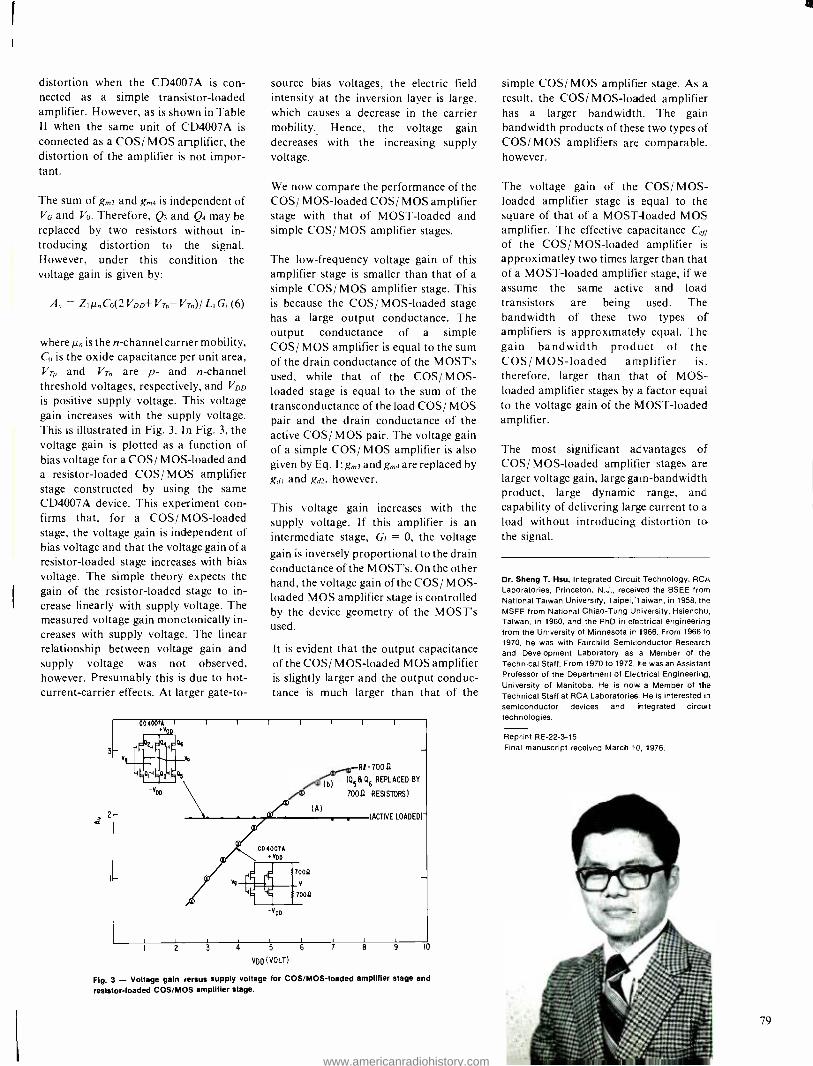
distortion when the CD4007A is con- nected as a simple transistor -loaded amplifier. However, as is shown in Table 11 when the same unit of CD4007A is connected as a COS/ MOS amplifier, the distortion of the amplifier is not impor- tant.
The sum of g,,,3 and g,a is independent of VG and Vo. Therefore, Q3 and Q4 may be replaced by two resistors without in- troducing distortion to the signal. However, under this condition the voltage gain is given by:
= ZiµCo(2VDD+VTr Vr)lLtGr(6)
where ,u is the n- channel carrier mobility, Co is the oxide capacitance per unit area, V7y, and Vi,, are p- and n- channel threshold voltages, respectively, and VDD
is positive supply voltage. This voltage gain increases with the supply voltage. This is illustrated in Fig. 3. In Fig. 3, the voltage gain is plotted as a function of bias voltage for a COS/ MOS- loaded and a resistor -loaded COS /MOS amplifier stage constructed by using the same CD4007A device. This experiment con- firms that, for a COS/ MOS- loaded stage, the voltage gain is independent of bias voltage and that the voltage gain of a resistor -loaded stage increases with bias voltage. The simple theory expects the gain of the resistor -loaded stage to in- crease linearly with supply voltage. The measured voltage gain monotonically in- creases with supply voltage. The linear relationship between voltage gain and supply voltage was not observed, however. Presumably this is due to hot - current- carrier effects. At larger gate -to-
source bias voltages, the electric field intensity at the inversion layer is large, which causes a decrease in the carrier mobility. Hence, the voltage gain decreases with the increasing supply voltage.
We now compare the performance of the COS/ M OS-loaded COS/ MOS amplifier stage with that of MOST- loaded and simple COS / MOS amplifier stages.
The low- frequency voltage gain of this amplifier stage is smaller than that of a simple COS/ MOS amplifier stage. This is because the COS/ MOS- loaded stage has a large output conductance. The output conductance of a simple COS/ MOS amplifier is equal to the sum of the drain conductance of the MOST's used, while that of the COS/ MOS- loaded stage is equal to the sum of the transconductance of the load COS / MOS pair and the drain conductance of the active COS / MOS pair. The voltage gain of a simple COS/ MOS amplifier is also given by Eq. 1; g,,,3 and g,a are replaced by gai and gel, however.
This voltage gain increases with the supply voltage. If this amplifier is an intermediate stage, Gr = 0, the voltage
gain is inversely proportional to the drain conductance of the MOST's. On the other hand, the voltage gain of the COS/ MOS- loaded MOS amplifier stage is controlled by the device geometry of the MOST's used.
It is evident that the output capacitance of the COS/ M OS-loaded MOS amplifier is slightly larger and the output conduc- tance is much larger than that of the
VDD
RV 700 ß
(b) 1058 06 REPLACED BY ArAiars 700a RESISTORS)
CD4007A VIM
-VDD
(A)
7009
V
7000
5 6
VDD (VOLT)
(ACTIVE LOADED)
10
Fig. 3 - Voltage gain versus supply voltage for COS /MOS- loaded amplifier stage and
resistor- loaded COS /MOS amplifier stage.
simple COS / MOS amplifier stage. As a result, the COS/ MOS- loaded amplifier has a larger bandwidth. The gain bandwidth products of these two types of COS/ MOS amplifiers are comparable. however.
The voltage gain of the COS/ MOS- loaded amplifier stage is equal to the square of that of a MOST -loaded MOS amplifier. The effective capacitance Ceg of the COS/ MOS- loaded amplifier is
approximatley two times larger than that of a MOST -loaded amplifier stage, if we assume the same active and load transistors are being used. The bandwidth of these two types of amplifiers is approximately equal. The gain bandwidth product of the COS/ MOS- loaded amplifier is. therefore, larger than that of MOS- loaded amplifier stages by a factor equal to the voltage gain of the MOST- loaded amplifier.
The most significant advantages of COS/ MOS- loaded amplifier stages are larger voltage gain, large gain- bandwidth product, large dynamic range, and capability of delivering large current to a load without introducing distortion to the signal.
Dr. Sheng T. Hsu, Integrated Circuit Technology, RCA
Laboratories, Princeton, N.J., received the BSEE from National Taiwan University, Taipei, Taiwan, in 1958, the MSEE from National Chiao -Tung University, Hsienchu, Taiwan, in 1960, and the PhD in electrical engineering from the University of Minnesota it 1966. From 1966 to
1970, he was with Fairchild Semiconductor Research and Development Laboratory as a Member of the Technical Staff. From 1970 to 1972, he was an Assistant Professor of the Department of Electrical Engineering, University of Manitoba. He is now a Member of the Technical Staff at RCA Laboratories. He is interested m
semiconductor devices and integrated circurt technologies.
Reprint RE- 22 -3 -15 Final manuscript received March 10, 1976.
79
www.americanradiohistory.com
Advances in integrated circuit reliability H. Khajezadehl A.S. Rose
In April 1975, RCA introduced the industry's first integrated circuit with hermetic performance in a low -cost dual -in -line plastic package assembly. This achievement is based on a unique noble -metal interconnect scheme with silicon- nitride chip passivation; the metallization technique is based on a three -step process involving titanium, platinum, and gold. Subsequent thermal, electrical, and moisture stress tests have confirmed earlier indications that predicted lifetimes greater than 10' hours can be anticipated for these types of integrated circuits when they are operated at a maximum rated temperature of 125 °C.
THE semiconductor industry has devoted considerable effort to improving the reliability of integrated circuits encap- sulated in dual -in -line plastic packages. Analysis of the failure modes of con- ventional aluminum- metallized in- tegrated circuit chips in plastic packages has led to a basic understanding of the physical and chemical failure mechanisms. This understanding has
resulted in significant improvements in plastic- package reliability. The scientific literature detailing these studies is ex- tensive and provides a chronological overview of the advances in the manufac- turing technology for plastic - encapsulated integrated circuits.1 -24 This paper reviews some of these developments for the three packaging systems described in Table I.
Heshmat Khajezadeh, Mgr., Bipolar Integrated Circuits Engineering, Solid State Divison, Somerville, N.J., received the BSEE from the Milwaukee School of Engineering in 1956. In 1959, after two and a half years of circuit development work on computer -controlled brak- ing systems for classification yards, he joined the RCA Solid State Division as production engineer in charge of processing of high -speed silicon planar transistors. In
1965, he joined the Integrated Circuit Acitivity as a
design engineer. In 1966, he was promoted to Engineer- ing Leader in charge of Bipolar IC Product Development. In 1969, he was promoted to Manager, Bipolar Integrated Circuits Product and Process Development. In 1974, he
was appointed to his present position, and is responsible for all linear and digital bipolar engineering. Mr. Kha- jezadeh has been issued five U.S. patents and has
authored seven technical papers. He is the recipient of the David Sarnoff Award for Outstanding Technical Achievement and the RCA Engineering Achievement Award for significant contributions to integrated- circuit technology. He is a member of IEEE.
Reprint RE- 22 -3 -16 Final manuscript received April 25, 1976.
Arnold Rose, Mgr., Packaging Technology Group, Solid State Division, Somerville, N.J., received the BS and MS
in chemical engineering from New York University in
1935 and 1939, respectively. He has worked in various phases of metallurgical research: from 1939 to 1940 at
the National Bureau of Standards; from 1940 to 1942 at
William's Gold Refining Company; and from 1942 to 1950
at the RCA Electron Tube Divison. He joined the Special Products Division of the ITE Circuit Breaker Company in
1950 as Supervisor, Research and Development Laboratory. He rejoined RCA Semiconductor Division in
1955 and was appointed Manager of the Materials Laboratory in 1957. In this position, he supervised the activity of an engineering group concerned with all phases of semiconductor device processing including crystal and epitaxial growth, diffusion processes, photolithographic techniques, device passivation, inter- connection systems, and circuit enclosure. In January 1968, he was appointed Manager, Engineering, for RCA's major hybrid circuit program on Project Safeguard. He is
currently responsible for developmental technology in
the assembly and packaging of semiconductor devices using automated multiconnection techniques.
80
System I - plastic -packaging system During the 1970 to 1972 time period, it
was recognized that mechanical and chemical modifications to the dual -in- line plastic -packaging system were es- sential for elimination of several major failure mechanisms. These modifications and their effect on plastic -package failure modes are summarized in Table II.
To determine the plastic -package reliability in a manufacturing environ- ment, and to provide the necessary feed- back for process control, real -time in- dicators were established which accelerate the observed failure mechanisms. These real -time indicators were then used to gauge the effects of the mechanical and chemical modifications listed in Table II on the reliability of plastic- packaged integrated circuits. These data, summarized in Table III, show that significant improvements in
the reliability of plastic packages have been achieved through these innovative modifications. However, it has been demonstrated unequivocally that semiconductor plastic molding com- pounds are inefficient barriers to moisture, and that the presence of the moisture at the IC chip surface is con- ducive to corrosion of the metallization."2' -28
The characteristic moisture ingression modes in plastic packages are by diffu- sion through the molding compound and by capillary action at the epoxy/ lead frame and mold parting -line interfaces. The corrosive effects of this moisture, which may exist as minute droplets in the micropores in the plastic or as a film at the chip metallization surface, have also been studied extensively. The principal corrosion mechanism, the formation of non -conductive aluminum oxides and hydroxides,29 results in the creation of open circuits.
www.americanradiohistory.com

Table I - Dual -in -line plastic -packaging systems.
Metallization Packaging Junction protective Chip frame Molding system Chip metallization passivation layer* attachment compound
Aluminum Si02 CVD PSG Gold wires Epoxy
II Trimetal Ti /Pt /Au Si02 + Si3N4 CVD PSG Gold wires Epoxy
III Trimetal Ti /Pt /Au Si02 + Si3N4 CVD PSG Gold- plated Epoxy copper beams
*Chemically vapor -deposited phosphorus -silicate glass.
Table lI - Mechanical and chemical modifications to Improve dual -in -line plastic -package reliability.
Failure mode Mechanical/ chemical
modification Effect
Bond lifts at frame fingers
Bond failure at heel of the bond
Bond failure caused by ther- mal expansion mismatch between molding compound and lead frame
Degradation of surface - dependent electrical para- meters
Aluminum corrosion
Frame coining to provide flat surface for bonding.
Bonding chuck redesign for in- creased uniform hold -down pressure.
Bonding capillary heel angle optimization and surface modification.
Molding -compound coefficient of thermal expansion reduced to 26
X 10-' cm cm/ °C and glass transi- tion temperature increased to 170° C.
Mold shrinkage rate increased to 0.009 cm /cm.
Optimize phosphorus content of metallization protective layer.
Optimize phosphorus content of metallization protective layer.
Reduce available alkali metal ion contamination in the molding compound.
Molding compound pH changed from acidic to approach neutrality (water extracted sample).
Improved bond strength by
efficient transfer of ul- trasonic energy to bond- wire/ frame-finger interface.
Improved bond strength.
Minimized lead- frame -to- encapsulant thermal mis- match. Enhanced package operat- ing capability at elevated temperature.
Uniform compressive stresses provided through- out molded package.
Improved stability of elec-
trical parameters.
Reduced aluminum corro- sion.
Table III - History of reliability improvement in plastic -packaged integrated circuits.
Test
1970
( %failures)
1971
Mechanical improvements
(Sz failures)
1972 -1974 Manufacturing history*
(failures ¡units)(% failures)
Temperature cycle, 200 cycles, -40 °C to +150 °C 43 0.7 86/ 124,709 (0.069 %) MIL Std. 883 Method I010C
Thermal shock 200 cycles, -65 °C to +150 °C 57 4.2 22/20,916 (0.11%) MIL Std. 883 Method I01IC
100 °C Continuity Test 0.5 7/350,000 (0.002%)
Pressure cooker 203 KN /in' (30 psia)
and 121 °C, 96 hours 70 21/6,736 (0.3I t,r;)
*New molding compound introduced in 1972.
A coating of phosphorus -doped chemically vapor -deposited (CVD) silicon dioxide (Si02) glass is widely used
in integrated -circuit fabrication for device passivation and mechanical protection.30 -35 The phosphorus has the effect of eliminating stress cracking which would otherwise occur in undoped CVD Si02 coatings and, additionally, serves as
a getter for alkali metal ions. Experimen- tal data have shown that control of the phosphorus level is critical, inasmuch as
phosphorus concentrations in the Si02 greater than an optimal two to three percent will result in increased aluminum corrosion rates and related open- circuit defects!' A trimetal technology which avoids this limitation of aluminum metallization'' has been introduced. This process eliminates the corrosion mechanism by removing the susceptible aluminum film and replacing it with deposited layers of titanium, platinum and gold.37
-34
System II - silicon nitride passivated trimetal system
The essential elements of this technology involve several basic processes:
Silicon nitride deposition
Ohmic contact formation
Interconnect metallization
Dieletric overcoating
Silicon nitride deposition
The silicon nitride (Si3N4) passivating layer is formed by a chemical vapor deposition process over the surface of the silicon wafer following completion of the device diffusion and oxidation sequences.
The Si3N4 is formed by the chemical reaction of silane (SiH4) and ammonia (NH3) at approximately 800 °Caccording to the reaction:
3SiH4 + 4N H3 --i Si3N4 + 12H2
The Si3N4 has been shown to be an
effective barrier against the penetration of moisture and ionic contaminants to the underlying device surfaces.
Ohmic contact formation
Contacts are effected to the silicon monolithic devices through openings created in the Si3N4/ Si02 dielectric layers
81
www.americanradiohistory.com

PLATINUM
SILICON CHIP SIL ICIDE
SILICON DIOXIDE
SILICON NITRIDE
TITANIUM
PLATINUM
GOLD INTERCONNECT
CVD PSG
Fig. 1 - Silicon nitride passivated trimetal structure.
by photolithographically defined etching procedures. This is followed by deposi- tion of a 600 A layer of platinum over the wafer surface. Sintering of the substrate at 600 °C results in the formation of PtSi in the contact areas. Subsequent etching in aqua regia dissolves Pt, leaving behind only the chemically inert PtSi, which provides excellent ohmic contacts to the device structures.
Interconnect deposition
The interconnection network and bond pads are formed by first sputtering a layer of titanium, approximately 1500 A thick, over the entire wafer. This Ti film provides adherence for the subsequent metallization to the Si3N4 and to the PtSi in the contact windows. A film of Pt 1500 A thick is then sputtered over the Ti to interpose a metallurgical barrier between the Ti and the final layer of gold. Defini- tion of the interconnection and bond pads in the Pt follows, using a photoresist and etching sequence. The Au, approximately 25,000 A thick, is electroplated only over the photoresist defined Pt to provide the required high- conductivity inter- connections and readily bondable termination pads. Removal of the Ti film by etching follows, utilizing the Pt/ Au patterned network as an etch -resist.
Dielectric overcoating
A protective layer of chemically vapor - deposited phospho- silicate glass (CVD PSG) is applied over the entire wafer to a thickness of approximately 15,000 A. This layer provides mechanical protec- tion to the gold interconnections and also performs an important role as an elec- trical insulator between the gold lines. A cross section of the completed device structure is shown in Fig. 1.
82
90
50
á 30
20
10
5
3
2
z
PRESSURE COOKER TEST CONDITIONS
121 °C, 30 psis
IC
ALUMINUM METLUALLIZATION
TI -P1 -AU METALLIZATION ZERG FAILURES AT 250 HOURS
30 50 100 300 500 AGE AT FAILURE -HOURS
Fig. 2 - Results of pressure -cooker tests comparing trimetal and aluminum metallized chips in dual -in -line
plastic packages.
Reliability considerations
Integrated circuit metallization systems are affected by the three following major failure mechanisms:
Electromigration
Corrosion
Electroplating
Electromigration
The phenomenon of electromigration is
among the potential failure modes of semiconductor metallizations. Extensive studies have established that this effect, involving molecular movement in a metallic conductor, varies with the device metallization technology and the conduc- tor configuration.'" H igh thermal gradients and excessive current density have been noted to promote destructive migration.I Design layouts which take these factors into consideration are un- iversally used, and metal migration is not a serious problem in IC usage. It has been estimated that the rate of electromigra- tion of a gold- surface metallization is
lower by an order of magnitude than that of a conventional aluminum conductor of similar design,42 thereby providing a
significant additional reliability margin.
Corrosion
Integrated circuits in dual -in -line plastic packages are conventionally exposed to autoclave testing to accelerate metalliza- tion corrosion failure mechanisms. This testing consists of exposure to moisture at elevated temperatures and pressures in a
pressure vessel.
The pressure- cooker data which demonstrate the complete resistance of the trimetal system to corrosion are shown in Fig. 2.
Data confirming the ability of trimetal chips in dual -in -line plastic packages to withstand extremely corrosive environments were obtained by actual exposure of the devices to both jungle and seashore conditions at Panama Canal Zone test sites, (see Table IV). "3 In this test, 63 trimetal chips in dual -in -line packages (System II) were exposed to 19,776 hours of severe environmental testing under reverse bias with zero failures. In contrast, it may be noted that one failure caused by aluminum corro- sion was detected in a hermetically sealed unit with conventional metallization.
Electroplating
A potentially serious failure mode which can occur with gold- surfaced semicon- ductor metallizations (Ti- Pt -Au, Ti -Pd- Au, -hi -W -Au, etc.) is the formation of electroplated migrative short circuits. The prerequisite for this phenomenon is
the presence of a continuous film of moisture containing a dissolved ionic contaminant such as chlorine between oppositely biased metallization stripes. To avoid shorting caused by the elec- troplating phenomenon, an overcoating of CVD PSG is deposited over the wafer surface, as described previously.
Electroplated shorts have occurred even
Table IV - Panama Canal Zone testing site results. (Tests began March, 1973). Last measurements taken in February, 1976. Tests continue. Conditions: T =27 °Gand RH = 90 to 98 %.)
Failure rufe Packaging 1 hits (y1000 hours at system Jungle Seashore Total Hours Unit-hours Failures 60 (%i ronJhlenee)
CA3046(1 i -Pt -Au metal in 47 16 63 23,476 1,479,00(
plastic package
C'A3t)45 Aluminum metal in hermetic 32 32 ceramic package
0 (1.062
23,476 751,000 I 0.27
www.americanradiohistory.com

Fig. 3 - SEM photograph of a trimetal chip after exposure to 85 °C, 85- percent relative humidity, reverse- bias test for 5,000 hours (100X).
on CVD PSG coated trimetal devices when they are sealed into hermetic con- tainers which have been found to contain small amounts of halogen- contaminated moisure." In marked contrast, similarly coated devices in molded dual -in -line plastic packages have been found to be free of such plated shorts. The effectiveness of the CVD PSG coating as a moisture barrier is derived from the compressive stresses applied uniformly to the overcoating by the surrounding molding compound. This compressive stress counteracts the relatively poor adhesion of such dielectric coatings to gold metallizations and, by insuring in- timate contact between glass and metal, the formation of a continuous electrolyte between closely spaced gold conductors is
prevented. Visual evidence of this phenomenon is presented in Fig. 3, which is an SEM photograph of a titanium - platinum -gold metallized integrated cir- cuit chip after molding compound re- moval. This device was exposed to 5,000 hours of 85 °C, 85Ç relative humidity, reverse -bias testing. It is evident that electroplating between gold conductors has not occurred during exposure to this severe environment.
A cross section of a titanium- platinum- gold conductor on an integrated- circuit chip covered by CVD PSG is shown in Fig. 4. This figure illustrates continuity of the glass layer over the metallization.
Data obtained on 85 °C, 85% relative humidity, reverse -bias accelerated stress testing are shown in Fig. 5. These data indicate the total lack of failures resulting from gold electroplating under this severe environmental testing condition at 5,000 hours as contrasted to the failure rate of conventional aluminum -metallized in- tegrated circuits.
Fig. 4 - SEM photograph of a cross section of titanium - platinum -gold metallization coated with a CVD PSG layer (500X).
999 99
90
á 70
TE
rc 30
20
IC
f
TEMPERATURE -HUMIDITY -BIAS TEST CONDITIONS
85 °C, 85% RH, 15V REVERSE BIAS
ALUMINUM METALLIZATION
T, -PI -Au METALLIZATION ZERO FAILURES AT 5000 HOURS
300 500 IOOC 3000 SOUL'
AGE AT FAILURE - HOURS
Fig. 5 - Results of temperature, humidity, and bias tests comparing trimetal and aluminum metallized chips in dual -in -line plastic packages.
Table V - Reliability data summary of trimetal chip in plastic package.
Test Conditions Sample
.size
Duration (hours / cycles)
Unit hours or unit cycles Failure,.
Operating life T, = I67°C 40 2000 h 80,000 0
T, = 167°C 120 1000 h 120.000 0
Ti = 167° C 20 500 h I0,01)O 0
Ti = 158°C 19 10(x) h 19,000 0
T, = 127°C 35 2000 h 70,000 0
Ti = 127°C' 57 1000 h 57,000 0
T, = I27°C 41 50() h 20,500 0
Total 332 376,500 tl
Temperature; 85 °C, 85% RH 200 5000 h I ,000,000 0
humidity bias I5V reverse 35 3000 h 105,000 0
bias 60 2000 h 120,000 0
19 1000 h 19,000 0
Total 314
l hermal fatigue T,on = 141 °C t = 0.5 min
15 40,000 cycles 600,000 0
Troff = 28 °C t = 2.5
Tson = 90 °C t = 3.0 min
15 10,000 cycles 150,0(10 0
Troff = 35 °C T = 3.0 min
Total 750.000 0
Table VI - Accelerated reliability test -data summary of trimetal chip in plastic package.
Test Conditions Sample
size
Duration (hours, cycles)
( nit hours or unit cycles
Catastrophic c
failures
Pressure 30 psia, I21°C 230 250 h 57,500 0
cooker 20 240 h 4,800 u
50 200 h 10,000 0
210 96 h 20,000 I*
Total 510 92,460
Thermal -65 °C to +150 °C 230 600 cycles 138,000 0
shock MIL Std. 883 50 400 cycles 20.000 0
Method 101 IC 183 200 cycles 36,600 0
210 200 cycles 42,000 0
Total 673 236,6(x) 0
Temperature -65 °C to +150 °C 230 1000 cycles 230,000 0
cycle MIL Std. 883 1400 200 cycles 280,000 0
Method 10100
Total 1630 510,000 u
*Failure caused by bondwire break at the frame.
83
www.americanradiohistory.com

Additional reliability data
A summary of additional reliability data accumulated for the trimetal chip in a
dual -in -line plastic package is shown in Tables V and VI. A monolithic transistor array (CA3046G) was chosen for this reliability evaluation to allow reverse - bias stress testing. This vehicle permits testing under reverse -bias conditions with minimal junction heating to insure reten- tion of the ambient humidity at the device surface.
Accelerated operating -life tests have been run on power integrated circuits employ- ing the silicon nitride passivation and titanium- platinum -gold metallization. The median- time -to- failure (MTF) es- timates obtained from these tests are plotted on Arrhenius paper as a function of junction temperature in Fig. 6. Ex- trapolation to the maximum rated temperature of I25 °C for this power integrated circuit indicates an MTF of approximately 3X10 hours.
400 350 300
á 250
50
25 10 10 ' 10' IO' 10` IO IOy
MEDIAN- TIME- TO-FAILURE (MTF1 -HOURS Fig. 6 - Mean -time -to- failure of power IC's fabricated with titanium, platinum gold metallization versus junc- tion temperature.
System Ill - recent developments
Automated assembly systems are being introduced into the semiconductor in- dustry to reduce assembly costs and deskill assembly operations.45.4b It is ax- iomatic that automation cannot be in- troduced at the expense of reliability. The assembly system to be described has been found to retain the advantages of the silicon nitride passivated trimetal in- tegrated circuits (System II) while providing a cost -effective, deskilled assembly operation.
This system utilizes trimetal wafers with elevated gold bond pads. A typical metallized wafer matrix is shown in the SEM photograph in Fig. 7 and an enlarged view of a typical electroformed gold bump is shown in Fig. 8.
84
Connections are made to the bond pads by tape- supported copper beams. The beams are 35 microns thick and 75
microns wide and are arranged so that their configuration matches the locations of the device bonding pads precisely .
The beams are bonded to the chip metallization pads simultaneously by means of a thermode which applies heat and pressure to each pad -to -beam loca- tion and insures the formation of a
boundary -free thermocompression bond. SEM photographs of these inner lead bonds are shown in Figs. 9 and 10.
Similarly, the outer portions of the beams are aligned by precision automatic equip- ment to the lead frames and thermocom- pression bonded. A metallographic sec- tion of a beam -to- lead -frame bond is
shown in Fig. I I. High bond strengths, typically 45 to 50 grams, are realized as a
result of these broad area contacts.
Following beam -to -lead -frame bonding,
Fig. 7 - SEM photograph of a typical metallized water matrix (80X).
Fig. 9 - SEM photograph of inner lead bonds (100X).
the multiple strip assembly is handled in conventional fashion through molding and subsequent processing operations. A completed integrated circuit fabricated by means of the automated assembly system is shown prior to molding in Fig. 12. The principal advantages gained from this type or automated assembly are increased throughput, reduced labor cost, decreased dependence on operator skills, and greater bond strengths than those obtainable with wire bonding.
Summary
The introduction of silicon nitride passivated titanium -platinum -gold metallized chips in dual -in -line plastic packages has eliminated corrosion as a major failure mode. Hermetic chips of this type, assembled into a mechanically and chemically sound plastic -packaging system, provide a reliability level not previously achievable with dual -in -line plastic- packaged devices.47 Test results
Fig. 8 - SEM photograph of bond bump metallization (600X).
Fig. 10 - SEM photograph of inner lead bond (700X).
www.americanradiohistory.com
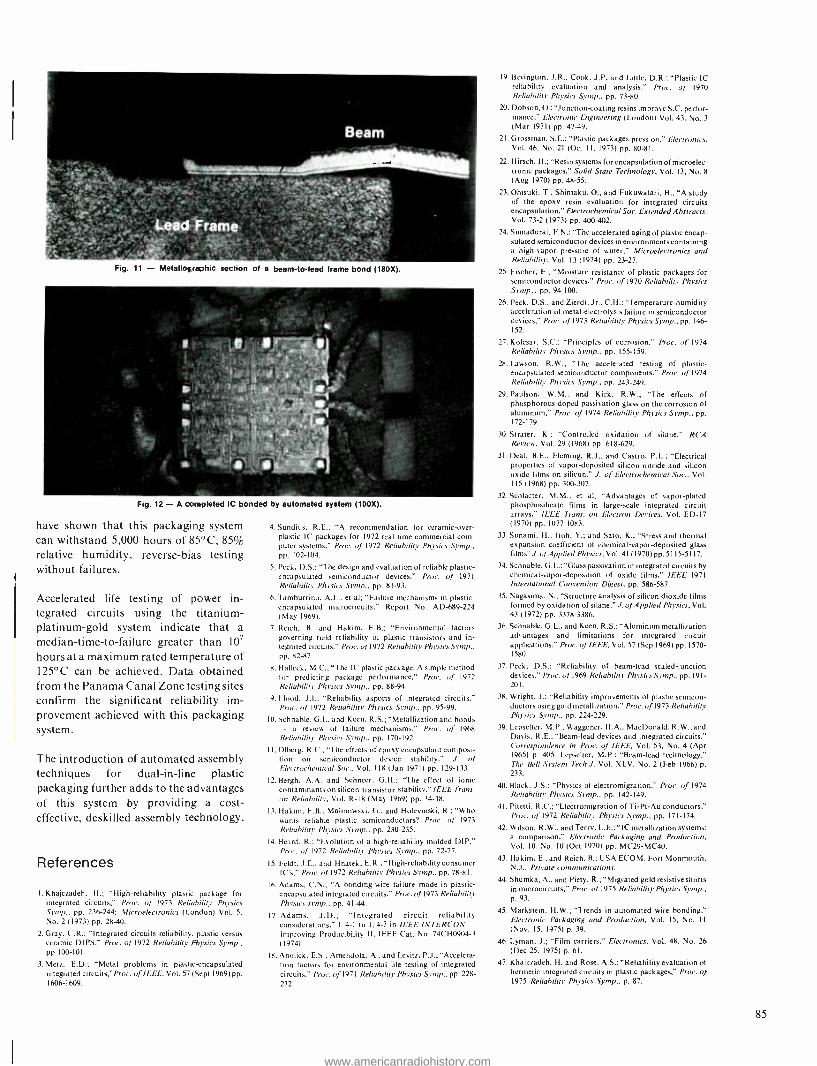
Fig. 11 - Metallo5,rashic section of a beam -to -lead frame bond (180X).
Fig. 12 -A completed IC bonded by automated system (100X).
have shown that this packaging system can withstand 5,000 hours of 85 °C, 85% relative humidity, reverse -bias testing without failures.
Accelerated life testing of power in- tegrated circuits using the titanium - platinum -gold system indicate that a median -time -to- failure greater than 10' hours at a maximum rated temperature of 125 °C can be achieved. Data obtained from the Panama Canal Zone testing sites confirm the significant reliability im- provement achieved with this packaging system.
The introduction of automated assembly techniques for dual -in -line plastic packaging further adds to the advantages of this system by providing a cost - effective, deskilled assembly technology.
References
I. Khajezadeh, H.; "High- reliability plastic package for integrated circuits.' Proc. of 1973 Reliability Physics Symp., pp. 236 -244; Microelectronics (London) Vol. 5,
No. 2 (1973) pp. 28-40.
2. Gray. C.R.; "Integrated circuits reliability, plastic versus ceramic DIPS," Proc. of 1972 Reliability Physics Symp., pp 100 -101.
3. Metz, E.D.; "Metal problems in plastic-encapsulated integrated circuits, "Proc. of IEEE, Vol. 57 (Sept 1969) pp. 1606 -1609.
4. Sundius, R.E.; "A recommendation for ceramic -over- plastic IC packages for 1972 real -time commercial com- puter systems.' Proc. of 1972 Reliability Physics Symp., pp. 102 -104.
5. Peck, D.S.; "The design and evaluation of reliable plastic - encapsulated semiconductor devices," Prot.. of 1971
Reliability Physics Symp., pp. 81 -93.
6. Tamburrino, A.L., et al; "Failure mechanisms in plastic - encapsulated microcircuits," Report No. AD-689 -224 (May 1969).
7. Reich. B. and Hakim, E.B.; "Environmental factors governing field reliability of plastic transistors and in- tegrated circuits," Proc. 0.11972 Reliability Physics Symp.,
pp. 82 -87.
8. Halleck, M.C.: "The IC plastic package. A simple method for predicting package performance," Proc. of 1972
Reliability Physics Symp., pp. 88 -94.
9. Flood. J.I.; "Reliability aspects of integrated circuits,' Proc. of 1972 Reliability Physics Symp., pp. 95 -99.
10. Schnable. G.L. and Keen, R.S.; "Metallization and bonds - a review of failure mechanisms,' Proc. of 1968
Reliability Physics Symp., pp. 170 -192.
I I.Olherg, R.C.; The effects of epoxy encapsulant composi- tion on semiconductor device stability," J. of Electrochemical Soc., Vol. 118 (Jan 1971) pp. 129 -133.
12. Bergh, A.A. and Schneer, G.H.; "The effect of ionic contaminants on silicon transistor stability," IEEE Trans. on Reliability, Vol. R -18 (May 1969) pp. 34 -38.
13. Hakim. E.B., Malinowski. G., and Holevinski, R.; Who wants reliable plastic semiconductors? Proc. of 1973
Reliability Physics Symp., pp. 230 -235.
14. Beard. R.; "Evolution of a high -reliability molded DIP." Proc. of 1972 Reliability Physics Symp., pp. 72 -77.
15. Feldt, J.E., and Hnatek. E.R.; "High- reliability consumer IC's," Proc. of 1972 Reliability Physics S Prop., pp. 78 -81.
16. Adams, C.N.; "A bonding -wire failure mode in plastic - encapsulated integrated circuits," Proc. 01 1973 Reliability Physics sinsp., pp. 41-44.
17. Adams. .I.D.; "Integrated circuit reliability considerations." 1. 4-1 to I 4-7 in IEEE INTERCON - Improving Producibility II, IEEE Cat. No. 74CH0904 -3
(1974).
18. Anolick, E.S.. Amendola, A., and Levitz, P.J.; "Accelera- tion factors for environmental life testing of integrated circuits." Proc. of 1971 Reliability Physics Symp., pp. 228-
232.
19. Bevington, J.R., Cook, J.P. and Little, D.R.; "Plastic IC reliability evaluation and analysis," Proc. of 1970 Reliability Physics Sump., pp. 73 -80.
20. Dobson, O.; "Junction -coating resins improve S.C. perfor- mance." Electronic Engineering (London) Vol. 43, No. 3
(Mar 1971) pp. 47-49.
21. Grossman. S.E.; "Plastic packages press on," Electronics, Vol. 46, No. 21 (Oct 11, 1973) pp. 80 -81.
22. Hirsch, H.; "Resin systems for encapsulation of microelec- tronic packages," Solid State Technology, Vol. 13, No. 8
(Aug 1970) pp. 48 -55.
23. Ohtsuki, T., Shintaku, O., and Fukuwatari, H.; "A study of the epoxy resin evaluation for integrated circuits encapsulation," Electrochemical Soc. Extended Abstracts, Vol. 73 -2 (1973) pp. 400-402.
24. Sinnadurai, F.N.; "The accelerated aging of plastic encap- sulated semiconductor devices in environments containing a high -vapor pressure of water," Microelectronics and Reliability, Vol. 13 (1974) pp. 23 -27.
25. Fischer, F.; "Moisture resistance of plastic packages for semiconductor devices," Proc. of 1970 Reliability Physics Sump., pp. 94 -100.
26. Peck, D.S., and Zierdt, Jr., C. H.; "Temperature- humidity acceleration of metal -electrolysis failure in semiconductor devices," Proc. of 1973 Reliability Physics Symp., pp. 146- 152.
27. Kolesar, S.C.; "Principles of corrosion," Proc. of 1974 Reliability Physics Sump., pp. 155 -159.
28. Lawson, R.W.; "The accelerated testing of plastic - encapsulated semiconductor components," Proc. of 1974
Reliability Physics Symp., pp. 243 -249.
29. Paulson, W.M., and Kirk, R.W.; "The effects of phosphorous -doped passivation glass on the corrosion of aluminum," Proc. of 1974 Reliability Physics Symp., pp. 172 -179.
30. Strater, K.; "Controlled oxidation of silane," RCA Review, Vol. 29 (1968) pp. 618 -629.
31. Deal, B.E., Fleming, R.J., and Castro, P.L.; "Electrical properties of vapor -deposited silicon nitride and silicon oxide films on silicon," J. of Electrochemical Soc., Vol. 115 (1968) pp. 300 -307.
32. Schlacter, M.M., et al; "Advantages of vapor -plated phosphosilicate films in large -scale integrated circuit arrays," IEEE Trans. on Electron Devices, Vol. ED -17 (1970) pp. 1077 -1083.
33. Sunami, H., Itoh, Y.; and Sato, K.; "Stress and thermal expansion coefficient of chemical -vapor -deposited glass films" J. of Applied Physics, Vol. 41 (1970) pp. 5115 -5117.
34. Schnable, G.L.; "Glass passivation of integrated circuits by chemical- vapor -deposition of oxide films," IEEE 1971
International Convention Digest, pp. 586 -587.
35. Nagasima, N.; "Structure analysis of silicon dioxide films formed by oxidation of silane," J. of Applied Physics, Vol. 43 (1972) pp. 3378 -3386.
36. Schnable, G.L., and Keen, R.S.; "Aluminum metallization advantages and limitations for integrated circuit applications." Proc. of IEEE. Vol. 57 (Sep 1969) pp. 1570- 1580.
37. Peck, D.S.; "Reliability of beam -lead sealed junction devices," Proc. of 1969 Reliability Physics Symp.. pp. 191- 201.
38. Wright, J.: "Reliability improvements of plastic semicon- ductors using gold metallization," Proc. of 1973 Reliability Physics Symp., pp. 224 -229.
39. Lepselter, M.P., Waggener, H.A., MacDonald, R.W., and Davis, R.E.; "Beam -lead devices and integrated circuits," Correspondence in Proc. of IEEE. Vol. 53, No. 4 (Apr 1965) p. 405. Lepselter, M.P.; "Beam -lead technology," The Bell System Tech.J. Vol. XLV, No. 2 (Feb 1966) p.
233.
40. Black. J.S.; "Physics of electromigration," Proc. of 1974
Reliability Physics Symp., pp. 142 -149.
41. Pitetti, R.C.; "Electromigration of Ti -Pt -Au conductors," Proc. of 1972 Reliability Physics Symp., pp. 171 -174.
42. Wilson, R.W., and Terry, L.E.; "IC metallization systems: a comparison." Electronic Packaging and Production, Vol. 10, No. 10 (Oct 1970) pp. MC29 -MC40.
43. Hakim, E., and Reich, B.; USA ECOM, Fort Monmouth, N.J., Private communications.
44. Shumka, A., and Piety, R.; "Migrated gold resistive shorts in microcircuits," Proc. of 1975 Reliability Physics Symp., p. 93.
45. Markstein, H.W.; "Trends in automated wire bonding," Electronic Packaging and Production, Vol. 15, No. II (Nov. 15, 1975) p. 39.
46. Lyman, J.; "Film carriers," Electronics, Vol. 48, No. 26 (Dec 25, 1975) p. 61.
47. Khajezadeh, H. and Rose, A.S.; "Reliability evaluation of hermetic integrated circuits in plastic packages," Proc. of 1975 Reliability Physics Symp., p. 87.
85
www.americanradiohistory.com
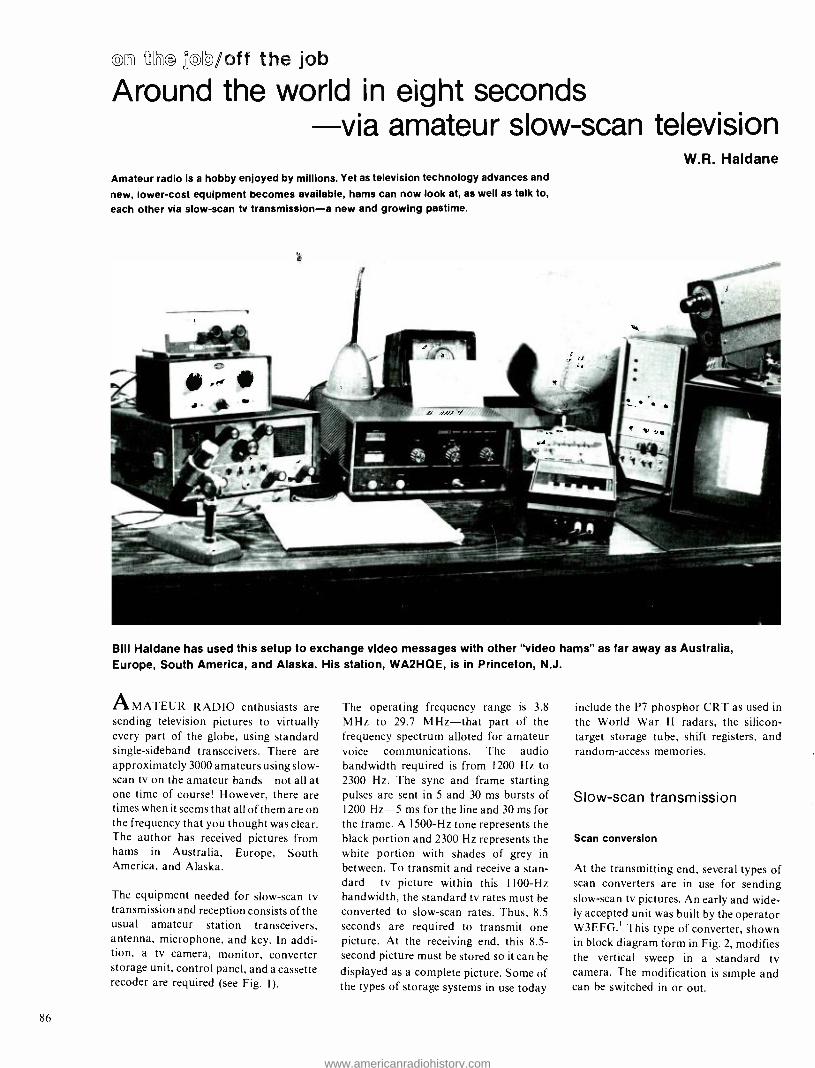
(DE 'RJ@ ©/" Around the world in eight seconds
via amateur slow -scan television W.R. Haldane
Amateur radio is a hobby enjoyed by millions. Yet as television technology advances and
new, lower -cost equipment becomes available, hams can now look at, as well as talk to,
each other via slow -scan tv transmission -a new and growing pastime.
Bill Haldane has used this setup to exchange video messages with other "video hams" as far away as Australia, Europe, South America, and Alaska. His station, WA2HOE, is in Princeton, N.J.
AMATEUR RADIO enthusiasts are sending television pictures to virtually every part of the globe, using standard single -sideband transceivers. There are approximately 3000 amateurs using slow - scan tv on the amateur bands -not all at one time of course! However, there are times when it seems that all of them are on the frequency that you thought was clear. The author has received pictures from hams in Australia, Europe, South America, and Alaska.
The equipment needed for slow -scan tv transmission and reception consists of the usual amateur station transceivers, antenna, microphone, and key. In addi- tion, a tv camera, monitor, converter storage unit, control panel, and a cassette recoder are required (see Fig. 1).
86
The operating frequency range is 3.8 MHz to 29.7 MHz -that part of the frequency spectrum alloted for amateur voice communications. The audio bandwidth required is from 1200 Hz to 2300 Hz. The sync and frame starting pulses are sent in 5 and 30 ms bursts of I200 Hz -5 ms for the line and 30 ms for the frame. A 1500 -Hz tone represents the black portion and 2300 Hz represents the white portion with shades of grey in between. To transmit and receive a stan- dard tv picture within this 1100 -Hz bandwidth, the standard tv rates must be converted to slow -scan rates. Thus, 8.5 seconds are required to transmit one picture. At the receiving end, this 8.5- second picture must be stored so it can be displayed as a complete picture. Some of the types of storage systems in use today
include the P7 phosphor CRT as used in the World War II radars, the silicon - target storage tube, shift registers, and random -access memories.
Slow -scan transmission
Scan conversion
At the transmitting end, several types of scan converters are in use for sending slow -scan tv pictures. An early and wide- ly accepted unit was built by the operator W3EFG.' This type of converter, shown in block diagram form in Fig. 2, modifies the vertical sweep in a standard tv camera. The modification is simple and can be switched in or out.
www.americanradiohistory.com

TV
CAMERA
MICROPHONE
SCAN CONVERTER
ANTENNA
RF AMPLIFIER
TRANSCEIVER
,
SPEAKER
L TAPE
RECORDER
TV
MONITO G
SCAN CONVERTER
STORAGE
Fig. 1 - Slow -scan tv transmission and reception requires additional equipment beyond the basic amateur setup. The narrow bandwidth available means that the standard tv rates must be converted to slow -scan rates (8.5 seconds tor a
complete picture) by a scan converter. Al the receiving end, the picture must be stored by a converter /storage system before it can be displayed as a complete picture.
MODIFIED FAST SCAN CAMERA
VERTICAL VIDEO
4:1 SWEEP DIVIDER CIRCUIT
15 Hz 60 Hz
o
PRE AMP.
SYNC
SEPARATOR
SAMPLE AND HOLD
LINE
SSTV VIDEO
15,750 Hz
RAMP GENERATOR
SCHMITT
TRIGGER
SYNC
SSTV FM
MODULATOR
FRAME SYNC
8-SECOND
OSCILLATOR
8-SECOND
RAMP
GENERATOR
TO TRANSMITTER
Fig. 2 - The first widely accepted scan converter modifies the vertical sweep in a standard tv camera. This method
requires the camera and monitor to be rotated 90 degrees.
CAMERA VIDEO
ANLOG TO DIGITAL CONVERTER
y
SYNC SEPARATOR
ONE LINE
MEMORY y
SYNC AND CONTROL
DIGITAL TO ANALOG CONVERTER
SSTV LM
MODULATOR
Fig. 3 - Digital scan converter works with unmodlfed tv camera.
In this early scan converter, the vertical scan rate of 60 Hz is divided by four, and a
sweep capacitor is added to provide the time for the lower sweep rate. The camera now has a new 15 -Hz vertical sweep rate, the 15,750 -Hz horizontal rate remaining unchanged. The new camera signal is
connected to a scan converter that samples and holds pulses of video for each new line at a 15 -Hz rate until the raster scan is completed in 8.5 seconds.
TO TRANS ITTER
The camera is rotated 90 degrees and mounted so that the 15 -Hz vertical scan is
now the slow -scan horizontal, and the old horizontal, sampled in a period of 8.5
seconds, forms the new vertical frame rate.
Later, a scan converter using digital techniques was built by Dr. R. Suding, WOLMD.2 With this method, shown in
Fig. 3, any standard tv camera can be
used without modification. Here, one complete fast -scan line is taken from every fourth fast -scan frame during the 8- second picture scan.
A digital -type converter available to amateurs is the Model 400 unit made by Robot Research, San Diego., Calif.
Picture quality
The quality of the slow -scan 8.5- second picture is very good -not as much detail is present as in standard 525 -line tv, but sufficient detail exists to identify an old friend or to recognize a new friend at a ham convention. The adopted standards are 128 lines of 128 pixels.* With blank- ing, this gives approximately 120 lines of 120 pixels in a I X 1 format_
For the amateur who likes to be seen as well as heard, the scan converter provides the tool necessary for him to be seen. However, most amateurs prefer to listen and look. To look, we need a storage system at the receiving end as described in
the following.
pixel is a single picture element. Ina scan system, this is the
smallest resolvable element on a scan line.
Reprint RE- 22 -3 -21
Final manuscript received October 13. 1976.
William R. Haldane, Instrumentation Technology, David Sarnoff Research Center, Princeton, New Jersey, joined RCA Service Company in 1952. From 1952 to 1959 he
was assigned to ComServLant in Norfolk, Va. In 1959 he
was group leader working on Princeton Universitys' "C" Stellarator project. In 1962 he was field supervisor and Manager for various experiments at the David Sarnoff Research Center until transferring ta the Laboratories for work in the Instrumentation Technology group. Mr.
Haldane holds a Professional Engineers License in the state of New Jersey and is a retired Commander in the
U.S. Naval Reserve.
87
www.americanradiohistory.com

SLOW SCAN FM FROM RECEIVER
VIDEO DISCR IMATOR
VIDEO AMPLIFIER
SYNC SEPARATOR
VERTICAL DEFLECTION
HORIZONTAL DEFLECTION
134 P7
PHOSPHOR
Fig. 4 - P7 monitoring system is inexpensive, but its picture is hard to see and photograph.
CAMERA VIDEO
WRITE
AMPLIFIER
RECEIVER AUDIO
STORAGE
TUBE
SYNC AND DEFLECTION GENERATOR
RECEIVER SAMPLE PULSE SLOW SCAN GENERATOR
READ
AMPLIFIER
MONITOR
TRANSMIT SLOW -SCAN
TO
TRANSMITTER
Fig. 5 - Silicon- target storage tube is expensive, but presents the best resolution to amateurs.
CAMERA VIDEO
1
F SELECT 1 FAST SCAN PRE AMP SLOW
SCAN FM DEMOD
A TO D
CONVERTER
1
GRAY SCALE
GENERATOR
RECEIVER AUDIO
EVEN LINE
INPU- REFRESH MUS MUX
ODD LINE
CAMERA VIDEO
SELECT
RECEIVER
MEMORY
SYNC AND CONTROL
Fig. 6 - Shift registers can also be used for the scan converter.
FAST SCAN
PRE AMP SLOW
SCAN
FM DEMOD
AUDIO
88
ANALOG TO
DIGITAL CONVERTER
GRAY SCALE
GENERATOR
FAST SCAN
GENERATOR
MEMORY
ADDRESS
SELECT
DISPLAY CONTROL
SLOW SCAN
GENERATOR
SLOW SCAN
GENERATOR
Fig. 7 - Commercially available system uses RAM's.
MONITOR
D TO A
CONVERTER
DIGITAL TO
ANALOG
CONVERTER
TRANSMITTER
MONITOR
Slow -scan monitoring
The P7 phosphor CRT
In a system using P7 phosphor storage, the room lighting must be subdued and the picture transmission must be repeated several times so that the viewer can mentally store the entire picture. A simple system using the P7 monitor is shown in Fig. 4. Most P7 monitors are 5 in. in diameter, although a few amateurs build their own 7 -in. diameter monitors. However, neither type can be converted for viewing on a standard tv. This type does not electrically store the picture.
The silicon target storage tube
The silicon target storage tube provides a picture storage time of IO minutes for viewing the slow -scan transmission. With the power off, the picture can be stored for months. This tube is similar to the vidicon camera tube. Instead of focusing light on the target, voltages are applied to charge the elements on the silicon wafer during the write mode, and then the voltages are read by sweeping them with the beam. Relatively large voltages are applied during write and very small charges are removed during the read mode. The standard 1 -in. tube has ap- proximately 1 X 1 cm of useful target area containing 600,000 elements. Each ele- ment can receive a different level to produce a picture with 10 grey scales ranging from black to saturated white. Comparing this to a digital system, it contains the equivalent of 4 X 600,000 bits of information. A block diagram of the silicon target storage system is shown in Fig. 5.
www.americanradiohistory.com

These 35 -mm photos of slow -scan tv pictures were taken from the author's silicon- storage tube setup. The pictures of the brother and sister at the far left were transmitted from Venezuela by their father. At right are a unique call sign from an operator in the midwest and a cartoon reproduced from a test tape made by a fellow ham at Princeton.
IC shift registers
Using shift registers for storage makes an ideal system for the slow -scan tv amateur enthusiast. Two systems using 1024 -bit shift registers have been built by the author. The 128 lines of 128 pixels for 16,000 bits plus the parallel 4 -bit word to produce 16 grey scales produce a good quality slow -scan picture. This requires 4
X 16,000 bits or sixty -four 1024 -bit shift registers. This system is shown in block diagram form in Fig. 6.3
IC random -access memories
Random -access memories (RAM's) are appearing on the slow -scan tv scene as of this writing. Several amateurs are building the storage units using 1024 -bit RAM's. Robot Research's Model 400, mentioned earlier, uses 4096 -bit RAM's. The unit contains all of the features needed to convert from fast -to -slow and slow -to -fast scan, providing 16,000 pixels with 16 shades of grey. Adding a standard tv camera, tv monitor, and audio cassette would complete the slow -scan tv station. The RAM system is similar to the shift - register unit described previously. A
block diagram of the RAM system used in the Model 400 is shown in Fig. 7.
Comparison of storage systems
The various slow -scan systems each have their advantages and disadvantages. Although the P7 phosphor system is
inexpensive and permits easy changing of the sweep speeds, the picture is difficult to
see and photograph. The silicon target storage tube is expensive and has some of the typical problems of vacuum tubes, but it provides the best resolution, and the stored picture is easy to see and photograph. Shift- register storage systems are stable and good for high speeds. The pictures remain while power is on, and they are easy to see and photograph. However, shift registers are relatively expensive and sweep rates are more difficult to change. RAM's have advantages and disadvantages similar to those of the shift registers; however, the speed of todays's RAM's is slower, thereby making it more difficult to in- crease resolution. RAM's are now appearing in the low -price surplus market.
Programming
Programming for slow -scan transmission is still in a primitive stage. Usually, an amateur first sends pictures of himself and his family and then the family pets. Sometimes simple cartoons having a
timely theme are transmitted. Views of the amateur's station equipment or weather satellite pictures have provided interesting subject matter.
If the picture to be transmitted is taken directly from the television camera, the subject must sit still for 8.5 seconds. To avoid this encumberance, most amateurs record sets of pictures on a cassette recorder. Since the audio bandwidth used is between 1200 to 2300 Hz, any cassette recorder with good tape -speed regulation is satisfactory for this purpose. Some of the latest scan converters available use a
memory system which will store the picture in one tv frame period, (I/ 30
second), then transmit the stored picture at the slow -scan rate. With this frame - freeze technique, the subject has to sit still for only I/ 30 second. Also, with the frame freeze, or frame -snatch capability, there is time in between the 8.5 seconds to change the subject matter.
Cassette recordings provide another in- teresting facet to programming. An amateur can pre- record his program at his home station. Then, if he travels to some remote station, he simply plays his pre- recorded cassette through the microphone at the remote station. Reversing this procedure, if he is at a
remote station equipped with a slow -scan system, he can record a program and play it back when he returns to his home station.
Conclusion
If your hobby is photography and amateur radio, then slow -scan TV will
add many hours of pleasure. If your hobby is photography, and you have always wanted to be a ham, slow -scan tv operation may offer the incentive you need to work for your amateur license.
References
I. Stone, R.F. and Schechner, A.B.; "Conversion from Fast - Scan to Slow -Scan Television," HA M Radio Magazine (Jul 1971) pp. 32 -43.
2. Suding, R.; "SSTV Scan Converter," 73 Magazine, (Aug 1974) pp. 73 -84.
3. Steber. G.R.; "SSTV to Fast -Scan Converter, Part I," QST ( Mar 1975) pp. 33140; also "SSTV to Fast -Scan Converter, Pan II,' QST (May 1975) pp. 28 -36.
89
www.americanradiohistory.com

Pen and Podium Recent RCA technical papers and presentations
To obtain copies of papers, check your library or contact the author or his divisional Technical Publications Administrator (listed on back cover) tor a reprint. For additional assistance in locating RCA technical literature, contact RCA Technical Communications, Bldg. 204 -2, Cherry Hill, N.J., extension PY -4256.
RCA Limited
M. Keelty Digital realization of a low bit rate MSK modem - Int. Conf. on Communications, Philadelphia, PA (6/14- 16/76)
P. Bural R. Dikshit FET mixers for communication satellite transponders - IEEE -MTT Microwave Symp., Cherry Hill, NJ (6/14- 16/76)
N. Epstein) P.Y. Chan' R. Dikshit Testing of a multichannel satellite transponder using automatic testing equipment (ATE) - IEEE -MTT Microwave Symp., Cherry Hill, NJ (6/14- 16/76)
R.J. McIntyre Avalanche photodetectors for optical communications - Nordic Laser and Electro -Optic Conf., Goteborg, Sweden (8/9- 12/76)
R.A. Crane' A.K. GhoshI S.Y.K. Tam Arc assisted electric discharge technique for high pressure CW -CO2 lasers - J. Appl. Physics, Vol. 47, No. 7 (7/76)
Broadcast Systems
A.J. Fandozzi Noise measuring techniques for television transmitters - IEEE Broadcast Sym- posium, Washington, DC (9/76)
Missile and Surface Radar
R.L. Boyell Defense against a missile or torpedo at- tack on a moving target by means of a counterweapon launched from that target - IEEE Transactions on Aerospace and Electronics Systems, Vol. AES -12, #4 (7/76)
Laboratories
W.R. Curtice I J.J. Risko Varactor -tunable pulsed avalanche - diode- oscillator for X -band operation - Electronics Lett., Vol. 12, No. 6 (3/18/76)
90
R.A. Bartolinil A. Bloomy H.A. Weakliem Volume holographic recording characteristics of an organic medium - Applied Optics, Vol. 15, No. 5 (5/76) p. 1261
T. Iwasa Chemical etching and fabrication of ridge waveguides on Bii2GeOzo single crystals - J. Appl. Physics, Vol. 47, No. 6 (6/76) p. 2746
D.E. Carlson Injection of ions into thin insulating films from a glow discharge - J. Appl. Physics, Vol. 47, No. 6 (6/76) p. 2754
P. Sheng Effect of director fluctuations on the nematic distribution factor - Solid State Communication, Vol. 18, (1976) p.1165
H.W. Lehmann R. Widmer Radio frequency sputtering of CdSe films - Thin Solid Films, Vol. 33, (1976) p. 301- 308
R.M. Moore' C.J. Busanovich F. Kozielec, Jr.I J.T. Fischer An experimental crystalline selenium vidicon - IEEE Trans. on Electronic Devices, Vol. ED -23, No. 6 (6/76) p. 534
H.S. Veloric) J. Mitchell, Jr. Capacitors for microwave applications - IEEE Trans. on Parts, Hybrids, and Packaging, Vol. PHP -12, No. 2 (6/76) p. 8
M.D. Miller I H. Schadel C.J. Nuese Lifetime controlling recombination centers in platinum- diffused silicon -J. Appl. Physics, Vol. 47, No. 6, (6/76) p. 2569
G.H. OlsenI V.S. Ban Use of thin carbon films for selective chemical etching and epitaxial deposition of III -V semiconductors - Appl. Phys. Lett. Vol. 28, No. 12 (7/76) p. 734
M. Ettenbergi H. Kressell J.P. Wittke Very high radiance edge- emitting LED - J. Quantum Electronics, Vol. 0E -12, No. 6 (6/76) p. 360
R.S. Crandall Measurement of the chemical potential of hydrogen in HxWO3 - Solid State Com- munications Vol. 18, (1976) p.1409
C.J. Neusel G.H. Olsenl M. Ettenberg Vapor -grown CW room -temperature GaAs /InyGai -y - Appl. Phys. Lett., Vol. 29, No. 1 (7/1/76) p. 54
M. Todal S. Osaka Optical imaging effect of Cr film - Japanese J. Appl. Phys., Vol. 15, No. 6 (6/76) p.1101
G.A. Alphonse' W. Phillips Read -write holographic memory with iron -doped lithium niobate - Ferroelectrics, Vol. 11, (1976) p. 397
W. Phillips Recent results on diffused lithium niobate- tantalate waveguides - Ferroelectrics, Vol. 10 &1976) p. 221
H.S. Sommers, Jr.l D.O. North The power spectrum of injection lasers: the theory and experiment on a nonlinear model of lasing - Solid State Electronics, Vol. 19, No. 8 (1976) p. 675
H. Kressell I. Ladany M. Ettenbergi H. Lockwood Light source for optical communications using fibers - Physics Today, Vol. 25, No. 5 (5/76)
I. Gorogi P.V. Goedertierl J.D. Knox I. Ladanyl J.P. Wittkel A.H. Firester Information scanning technology: Applications of CW AIGaAs injection lasers - Appl. Optics, Vol. 15, No. 6 (6/76) p. 1425
R. Mezrichl D. VilkomersonI K. Etzold Ultrasonic waves: Their interferometric measurement and display - Appl. Optics, Vol. 15, No. 6 (6/76) p. 1499
D. Meyerhofer Distortion of liquid crystals in the twisted field effect configuration - Mol. Cryst. Liq. Cryst., Vol. 34, (1976) p.13
D.E. Carlson C.E. Tracy Metallization of glass using ion injection - Amer. Ceramic Soc. Bull., Vol. 55, No. 5 (5/76) p. 530
M. Rayll P.J. Wojtowiczl H.D. Hanson Magnetic gas sensor - Proceedings, 21st Annual AIP Conf. on Magnetism and Magnetic Materials (1975)
W. Jantzl J.R. Sandercockl W. Wettling Determination of magnetic and elastic properties of FeBo3by light scattering - J. Phys.C: Solid State Phys., Vol. 9 (1976) p. 2229
E.K. Sichell B. Serin The Right -Leduc effect in superconduc-
www.americanradiohistory.com
tors - J. Low Temperature Phys., Vol. 24, Nos. 1/2 (1976) p. 145
H.B. Law The shadow mask color picture tube: how it began - eyewitness account of its early history - IEEE Trans. on Electron Devices, Vol. ED -23, No. 7 (7/76) p. 752
R.M. Moore Cost predictions for photovoltaic energy sources - Solar Energy, Vol. 18,
Pergamon Press (1976) p. 225
D.H.R. Vilkomerson Measuring pulsed picometer- displacement vibrations by optical in- terferometry - Appl. Phys. Lett., Vol. 29,
No. 3 (8/1/76)
M. Ettenberg' G.H. Olsen' C.J. Nuese The effect of gas phase stoichiiometry on the minority carrier diffusion - Appl. Phys. Lett., Vol. 29, No. 4 (8/1/76) p.141
P.K. Weimer A historical review of the development of television pickup devices (1930 -1976) - IEEE Trans. on Electronic Devices, Vol. 23, No. 7 (7/76) p. 739
K.M. Kim' H.E. Temple Growth of optically homogeneous single crystals of Pb5Ge04(VO4) from the melt - J. Crystal Growth, Vol. 34 (1976) p. 177
S.M. Perlow Third -order distortion in amplifiers and mixers- RCA Review, Vol. 37, No. 2 (6/76) p. 234
R.C. Alig Optical properties of a dense two - dimensional electron gas - RCA Review, Vol. 37, No. 2 (6/76) p. 206
G.A. Alphonse' W. Phillips Iron -doped lithium niobate as a read -write holographic storage medium - RCA Review, Vol. 37, No. 2 (6/76) p. 184
J.P. Wittkej M. Ettenbergj H. Kressel High radiance LED for single -fiber optical links - RCA Review, Vol. 37, No. 2 (6/76) p. 159
J.J. Hanak' R.W. Klopfenstein Model of target cross contamination dur- ing co- sputtering - RCA Review, Vol. 37,
No. 2 (6/76) p. 220
D.G. Fisher Sources of photoemission in Na3Sb thin films - J. Appl. Phys., Vol. 47. No. 8 (8/76) p. 3471
K. Knop Color pictures using the zero diffraction order of phase grating structures - Optics Communciations, Vol. 18, No. 3 (8/76) pp. 298 -303
M.T. Gale Sinusoidal relief gratings for zero -order reconstruction of black- and -white images
- Optics Communications, Vol. 18, No. 3
(8/76) pp. 292 -297
E.R. Levin' G.R. Awthl K.R. Bube
In situ SEM observations of sintering of gold compacts - Proceedings, 34th An- nual Mtg., Electron Microscopy Soc. of America, Miami Beach, FL (8/10/76) pp. 440 -441
K.R. Bube Influence of compositional and morphological factors upon thick -film metallization properties - Proceedings, Intl. Microelectronics Symp. (ISHM), Van- couver, B.C. (10/11-13/76)
C.E. Weitzeri R.T. Smith Silicon epitaxial strain and SOS /MOS transistor mobility - Extended Abstracts, 150th Electrochemical Soc. Meeting, Vol. 76 -2, p. 3, Las Vegas, NV (10/17- 22/76)
E.K. Sichell R.E. Miller Thermal conductivity of highly oriented pyrolytic boron nitride - 14th Intl. Ther- mal Conductivity Conf., Storrs, CT (6/2- 4/76), also in Thermal Conductivity 14, pp. 11 -17
J.L. Vossen Bibliography on metallization materials and techniques for silicon devices - American Vacuum Soc., Thin Film Divi- sion, Monograph #4 (6/30/76)
A. Kaiman! R.H. Roth B.H. SamslA.H. Simon Computer control system for television switching - N.Y. Conf. of SMPTE, New York City (10/15- 22/76), also in SMPTE Journal, Vol. 85, No. 10 (10/76)
R.H. Bergman 1024 -bit SOS read only memory - IEEE SOS Workshop Stanford U. (8/11/76)
A.E. Widmen R. Fehlmann H.P. Kleinknecht Liquid -phase epitaxial growth of multiple (AIGa)P -GaP hetero -junction structure - J. Crystal Growth, Vol. 35, No. 1, pp. 89 -97 (8/76)
A.M. Goodman Evidence for a finite transistion region at the interface between Si . and thermally grown Si02- Non -voltatile Semiconduc- tor Memory Workshop, Vail, Co (8/18/76)
A.M. Goodman' C.E. Weitzel The effect of electron beam aluminization on the Si- sapphire interface - 1976 IEEE SOS Technical Workshop, Stanford U.
(8/12/76)
G.R. Briggs CMOS -SOS chip for frequency synthesis tuning - IEEE -SOS Technical Workshop, Stanford U. (8/10- 13/76) PRRL -73 -TR -190
W.C. Stewart On differential phase contrast - J. of the Optical Soc. of America, Vol. 66, No. 8
(8/76) pp. 813 -818
G.W. Hughes R.J. Powell' M.H. Woods Oxide thickness dependence of high energy electron, VUV and corona induced change in MOS capacitors - Appi. Phys. Lett. Vol. 29, No. 6 (9/15/76) pp. 377 -79
E.K. Sichel' R.E. Miller Sputtering reactive metals for composite materials: Erbium and A1203- Thin Solid Films, Vol. 37, No. 1 (1976) pp. L19 -22
D.R. Carter' K.G. Hernqvist Advances in helium -cadmium lasers - Electro Optics /Laser '76 Conf., New York (9/16/76)
Advanced Technology Laboratories
W.F. Gehweilerj R.C. Steward 254 x 4 bit CMOS /SOS RAM array - IEEE SOS Technology Workshop, Stanford Un- iversity, Palo Alto, CA (8/11 -13/76)
H.W. Kaiser' W.F. Gehweiler CMOS /SOS arithmetic synthesizer - IEEE SOS Technology Workshop, Stan- ford University, Palo Alto, CA (8/11- 13/76)
R.L. Pryor' L.J. Palkuti (NRL) Radiation -hard CMOS /SOS standard cell circuits - Proceedings, IEEE Nuclear and Space Radiation Effects Conference, La Jolla, CA (7/27- 30/76)
W.F. Heagertyl G.J. Brucker Radiation effects in a CMOS /SOS /Al -gate D/A converter and on -ship diagnostic transistor - Proceedings, IEEE Nuclear and Space Radiation Effects Conf., La Jolla, CA (7/27- 30/76)
Automated Systems
C.W. Asbrand Photography in industry - EPIC (Evidence Photographers international) Chicago, IL (7/76)
E.W. Richter' V.D. Holaday Designing microwave ATE to meet UUT requirements - AUTOTESTCON '76, Arlington, TX (11/10 -12/76}
M.J. Cantella Observations of sky brightness spatial variations - SPIE Tech. Symp., San Diego, CA (8/23- 27/76)
M.J. Cantella Electrical input- output storage tubes - 1976 Special Summer Program on Photoelectronic Imaging Devices, San Diego, CA (8/12 -21/76)
M.J. Cantella High resolution camera turbes - 1976 Special Summer Program on Photoelec- tronic Imaging Devices, San Diego, CA (8/12- 21/76)
91
www.americanradiohistory.com

Patents
Avionics Systems G.A. Jones¡ R.A. Ito Controlling communications between computer devices over common bus - 3978451, Aug 31, 1976
Automated Systems R.E. Hanson; W.F. Fordyce Detecting malfunction in cylinders of in- ternal combustion engines - 3972230, Aug 3, 1976
L.R. Hulls; S.C. Hadden Engine diagnosis from frequency com- ponents in exhaust - 3977239, Aug 31, 1976
E.M. Sutphin, Jr. Filter which tracks changing frequency of input signal - 3978416, Aug 31, 1976
Government Communications Systems E. Lachocki Power supply with means to reduce on and off switching time of series regulated device - 3975672, Aug 17, 1976
E.J. Nossen' E.R. Starner Digital arithmetic synthesizer phase lock loop with direct doppler and frequency readout - 3973209, Aug 3, 1976
Advanced Technology Laboratories W.F. GehweilerlJ.I. Pridgen High -speed adder- 3970833, Jul 20, 1976
R.S. Braudy' H.H. Roberts, Jr. Transfer recording process - 3978247, Aug 31, 1976
Astro- Electronics J.E. Keigler' L. Muhlfelderí R.J. Cenker Orientation system for a spin -stabilized spacecraft - 3977633, Aug 31, 1976
Solid State Division A.L. Smith' D.D. Shaffer Manganese- and -magnesium- activated strontium sulfide phosphors - 3977991, Aug 31, 1976
92
S.W. Kessler, Jr. R.F. Keller Reinforced transcalent device - 3978508, Aug 31, 1976
A.G. Dingwall Low -power counting circuits - 3973178, Aug 3, 1976
R.D. Faulkner' C.M. Tomasetti Channel plate electron multiplier tube having reduced astigmatism - 3974411, Aug 10, 1976.
R.W. Longsderff] D.B. Kaiser Laser device and a method of fabrication - 3976956, Aug 24, 1976
R.W. Engstrom) D.E. Bowser Photodetector filter structure - 3976875, Aug 24, 1976
R . Kumbatovic Switching circuit - 3978349, Aug 31, 1976
A.G. Dingwall Shaped riser on substrate step for promoting metal film continuity - RE28952, Aug 31, 1976
N. Kucharewski Astable multivibrator circuit - 3973222, Aug 3, 1976
A.A. Ahmed Current mirror amplifier - 3973215, Aug 3, 1976
J.F. Alves, Ill Apparatus for indicating over -current condition in a transistor amplifier - 3974438, Aug 10, 1976
C.T. Wu Conversion of FSK to NRZ coding - 3976996, Aug 24, 1976
J.R. Tomcavage Wire mesh cathode - 3976909, Aug 24, 1976
Consumer Electronics L.D. Huff Signal pickup lifting /lowering apparatus - 3972533, Aug 3, 1976
G.D. Pyles Tape cartridge player mechanism 3973178, Aug 3, 1976
H.E. Haslaul G.A. Mattson Automatic coil winding machine and method - 3976256, Aug 24, 1976
Laboratories D.H. Vilkomerson Pressure sensitive field effect device - 3978508, Aug 31, 1976
R.C. Alig Surface acoustic wave device and method of making same - 3978436, Aug 31, 1976
E.O. Keizer Apparatus and methods for playback of color picture /sound records - 3972064, Jul 27, 1976
S. Liu Apparatus for mounting a diode in a microwave circuit -3972012, Jul 27, 1976
D.J. Channing E.B. Priestley Method of preparing a liquid crystal dis- play - 3973057, Aug 3, 1976
A.D. Ritzie Dual -mode adaptive parameter processor for continuous wave radar ranging systems - 3974438, Aug 10, 1976
E.J. Conlon' R. Destephanis' T.T. Hitch Wire placement fixture - 3972563, Aug 3, 1976
A.C. Irpil J.C. Saracel J.H. Scott IGFET on an insulating substrate - 3974515, Aug 10, 1976
H. Kressel' M. Ettenbergi I. Ladany Electroluminescent edge- emitting diode comprising a light reflector in a groove - 3974514, Aug 10, 1976
D. Redfield Solar cell with grooved surface 3973994, Aug 10, 1976
I. Ladany A.C. Limml J.T. O'Brien Method of making electrical contacts hav- ing a low optical absorption - 3975555, Aug 17, 1976
C. W. Mueller' E.C. Douglas Method of making a bipolar transistor - 3974560, Aug 17, 1976
A. R. Campbell Calculator timer with simple base -6 cor- rection - 3976867, Aug 24, 1976
C.P. Wu' E.C. Douglas' C.W. Mueller Method of obtaining the distribution profile of electrically active ions implanted in a semiconductor - 3976377, Aug 24, 1976
www.americanradiohistory.com

Dates and Deadlines
Upcoming meetings
OCT 21 -22, 1976 - Canadian Com- munications and Power Conf. (IEEE) Queen Eliz. Hotel, Montreal. Quebec, Canada Prog Info: Jean Jacques Archam- bault, CP /PO 958, Succ. "A ", Montreal, Que. H3C 2W3, Canada
OCT 25 -26, 1976 - Joint Engineering Mgmt. Conf. (IEEE et al) Hyatt Regency, Toronto, Ontario, Canada Prog Info: K.L. Coupland, Ministry of Colleges, 60 Sir William's Lane, Islington, Ontario M9A IV 3
OCT 25 -27, 1976 - Foundations of Com- puter Science (IEEE) Warwick Hotel, Houston, TX Prog Info: J.W. Carlyle, 4531 Boetter Hall, UCLA, Los Angeles, CA 90024
OCT 31 - NOV 3, 1976 -Joint Fall Meeting - American Ceramic Soc. Hotel St. Francis, San Francisco, CA Prog Info: C.L. Folkers, Lawrence Livermore Lab, L -460, POB 808, Livermore, CA 94550
NOV 1 -3, 1976 - Position Location and Navigation Symp. (PLANS) (AES, IEEE) Hilton Inn, San Diego, CA Prog Info: J.R. Iverson, POB 81127, San Diego, CA
NOV 1 -3, 1976 - Cybernetics and Society International Cont. (SMC,IEE) Mayflower, Washington, DC Prog Info: William H. von Alven, FCC, 1919 M St., NW, Washington, DC 20554
NOV 6 -10, 1976 - Engineering in Medicine and Biology (EMB, AEMB) Sheraton, Boston, MA Prog Info: AEMB, Suite 1350, 5454 Wisconsin Ave., Chevy Chase, MD 20015
NOV 8 -11, 1976 - Pattern Recognition Joint Conf. (IEEE et al) Del Coronado, Coronado, CA Prog Info: A. Rosenfeld, University of Maryland, Computer Sci. Center, College Park, MD 20742
NOV 9 -11, 1976 - Pulsed Power Inter- national Conf. (IEEE) South Park Inn, Lubbock, TX Prog Info: T.R. Burkes, Texas Tech. Univ., Dept. of EE, POB 4439, Lub- bock, TX 79409
NOV 9 -12, 1976 - Millimetric Waveguide Systems (IEE, IEEE, et a/) London, UK Prog Info: IEE, Savoy Place, London WC2R
NOV 10 -11, 1976 - Mini and Microcomputers (ICORD, IEEE), Toronto, Canada Prog Info: Mini and Microcom- puters, Hamza, POB 3243, Station B,
Calgary, Alberta, T2M 4L8, Canada
NOV 10 -12, 1976 - International Automatic Support Symp. (AUTO - TESTCON) (IEEE) Inn of Six Flags, Arlington, TX Prog Info: G.C. Sumner, General Dynamics, ROB 748 M.Z 2420, Fort Worth, TX 76101
NOV 15 -18, 1976 - Photovoltaic Specialists Conf. (IEEE) Hilton -Corp. Sq., Baton Rouge, LA Prog Info: Americo F.
Forestieri, NASA Lewis Research Ctr., 21000 Brookpark Rd., Mail Stop 302 -1, Cleveland, OH 44135
NOV 17, 1976 - Computer Networks - Trends and Applicaitons (IEEE) NBS, Gaithersburg, MD Prog Info: Ira Cotton, NBS, Washington, DC 20234
NOV 29 - DEC 1, 1976 - National Telecommunications Conf. (IEEE) Fair- mont, Dallas, TX Prog Info: John H. Tilley, Collins Radio Co., 1200 N. Alma Rd., Richardson, TX 75080
NOV 29 - DEC 1, 1976 - Mikroelektronik (IEEE) Munich, Germany Prog Info: R.H. Zaininger, RCA Labs, Princeton, NJ 08540
DEC 6 -10, 1976 - Submillimeter Waves and Their Applicaitons (IEEE) San Juan, Puerto Rico Prog Info: James Gallagher, Engineering Exp. Sta., Georgia Inst. of Tech., Atlanta, GA 30332
JAN 18 -20, 1977 - Reliability and Main- tainability (IEEE) Marriott, Phila, PA Prog Info: J.M. Wiesen, Dept. 1220, Sandia Labs, Albuquerque, NM 87115
JAN 28 -29, 1977 - SMPTE Winter TV Cony. St. Francis Hotel, San Francisco, CA Prog Info: SMPTE Winter TV Con- ference, 862 Scarsdale Ave., Scarsdale, NY 10583
FEB 7 -9, 1977 - Aerospace and Elec- tronic Systems Winter Cony. (WINCON) (IEEE) Sheraton -Universal, North Hollywood, CA Prog Info: H.S. Abrams, Litton Systems, Inc., G &CS Div., 5500 Canoga Ave., Woodland Hill's, CA 91364
FEB 16 -18, 1977 - Intl Solid State Cir- cuits (IEEE) Sheraton, Phila., PA Prog Info: John H. Wuorinen, Bell Labs, Whip- pany, NJ 07981
Calls for papers
MAR 16 -18, 1977 - Vehicular Technology (IEEE) Orlando Hyatt House, Orlando, FL Deadline Info: (abst.) 11/1 to Martin L.
Barton, POB 5837, MP -437, Orlando, FL 32805
APR 23 -28, 1977 - 79th Annual Meeting & Exposition (American Ceramic Society, Electronics Div.) Conrad Hilton Hotel, Chicago, IL Deadline Info: (abst.) 11/25 to Dr. Richard M. Rosenberg, E.I. du Pont de Nemours & Co., Inc., Photo Products, Bldg. 428, Buffalo Ave., Niagara Falls, NY 14302
MAY 9 -11, 1977 - Acoustics, Speech and Signal Processing Intl. (ASSP) Sheraton Hartford, Hartford, CT Deadline Info: (abst.) 11/1 to N. Rex Dixon. Thomas J. Watson Res. Ctr., POB 218, Yorktown Hts., NY 10598
MAY 16 -18, 1977 - Electronic Com- ponents Conf. Stouffer's Natl. Ctr. Inn, Arlington, VA Deadline Info: 11/8 to Charles M. Tapp, Sandia Labs, Dept. 2150, Albuquerque, NM 87115
MAY 23 -25, 1977 - Plasma Science Intl. (IEEE) Rensselaer Poly. Inst., Troy, NY Deadline Info: (abst.) 2/1 to R.L. Hickok, ESE Dept., MRC Bldg., RPI, Troy, NY 12181
MAY 25 -27, 1977 - Multiple Valued Logic Intl. Symp. (IEEE) U. of NC, Charlotte, NC Deadline Info: 12/1 to G. Metze, U. of Ill., Coordinated Sci. Lab , Urbana, IL 61801
JUN 1 -3, 1977 - Laser Engineering and Applications (QEC, OSA) Washington, DC Deadline Info: (abst.) to 1/7 Mel Cohen, Western Electric, POB 900, Princeton, NJ 08540
JUN 6 -10, 1977 - INTERMAG - Inter- national Magnetics Conf. (IEEE) L.A. Hilton, Los Angeles, CA Deadline Info: 1/5 to R.O. McCary, G.E. Res. Labs. R &D, POB 8, Schenectady, NY 12301
JUN 20 -22, 1977 - 14th Design Automa- tion Conference (ACM, IEEE) Inter- national Hotel, New Orleans, LA Deadline Info: (rough draft) 12/15 to David W. Hightower, MS907, Texas Instruments, Inc , POB 5012, Dallas, TX 75222
JUN 20 -24, 1977 - Intl. IEEE /AP Symp. and USNC /URSI Meeting (AP, USNC /URSI) Palo Alto, CA Deadline Info: 1/77 to K.K. Mei, Dept. of EE & CS, U. of Cal., Berkeley, CA 94720
JUN 21 -23, 1977 - Intl. Microwave Symp. (IEEE) Sheraton Harbor Island Hotel, San Diego, CA Deadline Info: 1/15 to Gerald Schaffner, Teledyne Ryan Aeronautical, 2701 Harbor Dr., San Diego, CA 92112
JUL 12 -14, 1977 - Computer Aided Design of Electronic & Microwave Circuits (U. of Hull, IEEE) U. of Hull, Hull, England Deadline Info: 12/15 to Conference Secretariat, Dept. of EE, U. of Hull, HU6 7RX, England
JUL 17 -23, 1977 - Intersociety Conf. on Transportation (TAB Transport. Comm., et al) McCormack Inn, Chicago, IL Deadline Info: (Ms) 12/1 to Lawrence A. Dondanville, DeLeuw, Cattier & Co., 165 W. Wacker Drive, Chicago, IL 60601
93
www.americanradiohistory.com

Engineering News and Highlights
Seven Burlington Engineers Get Technical Excellence Awards
Individual Award Winner -John Ostis (center) worked on the lightweight, collinearUHF /VHF antenna system for the AN /TSW- 74A Air Traffic Control Tower. The new antenna design gives RCA the lead in the industry. With him are Automated Systems' Division Vice President and General Manager, Dr. Harry Woll and Chief Engineer, Gene Stockton.
The Winning Team -of Delip Bokil, Carlton Johnson, Bradford Joyce, James Quinn, Norm Roberts, and John Tranfaglia designed one of the largest and most complex hybrids in the industry. Six units have been delivered to the customer. Shown are (left to right) engineering manager Jason Woodward; John Tranfaglia; Jim Quinn; (rear) Jack Hall, Leader, Design Drafting; (front) Norm Roberts; (rear) Jerry Bouchard, engineering manager; Delip Bokil; Carl Johnson; Harry Woll and Gene Stockton.
Technical Excellence at Moorestown -M &SR Awards Seven
Kolc Kruger Lewis
Don Kolc -for technical leadership on a highly competitive proposal. It was selected for its outstanding technical superiority despite its higher basic cost.
Iry Kruger -for concept and design of an ultra -lightweight airborne search radar antenna. The unique aluminum structure reduced the weight by half of the lightest previously known configuration.
94
Ottinger Riell
Dee Lewis -for resolving a major problem in the AEGIS AN /SPY -1 /Standard Missile 2 uplink communications system.
Bob Ottinger -for developing an AN /SPY- 1A Radar Control design which fully uses capabilities of four -face multifunction phased array radar.
Al Reill -for his efforts in requirements definition, interface requirements alloca-
Smith Stoll
tion and processing architecture of the ORTS computer.
Dick Smith -for successfully applying microprocessors in AEGIS to handle coordinate rotation, face -to -face target handover, and data formatting.
Mike Stoll -for significant contribution to, and simplification of logic design for the AN /SPY -1A Video Formatter.
www.americanradiohistory.com

Promotions
Missile & Surface Radar
J.L. Lewandowski from Mbr. Engrg. Staff to Sr. Mbr. Engrg. Staff (J. Ratkevic, Receivers -Signal Process. Equip.)
D. Lewis from Mbr. Engrg. Staff to Sr. Mbr. Engrg. Staff (K.C. Eddy, Inform. Process. Equip.)
D. Shaw from Mbr. Engrg. Staff to Sr Mbr. Engrg. Staff (W.C. Croly, Special Projects)
T. Sikos from Assoc. Mbr. Engrg. Staff to Mbr. Engrg. Staff (W. Rapp, Engrg. Programming)
O.B. Smith, Jr. from Mbr. Engrg. Staff to Sr. Mbr. Engrg. Saff (K.C. Eddy, info. Proc. Equip.)
R. Tomsic from Mbr. Engrg. Staff to Sr. Mbr. Engrg. Staff (K.C. Eddy, info. Proc. Equip.)
F. Brown from Sr. Mbr. Engrg. Staff to Ldr., Engrg. Systems Projects (R. Baugh, Com- bat Systems Element Design)
J. Cole from Sr. Mbr. Engrg. Staff to Ldr., Engrg. Systems Projects (D. Lyndon, USS Norton Sound Opns.)
D. Sarett from Princ. Mbr. Engrg. Staff to Ldr. Engrg. Sys. Projects (A.J. Sietz, Com- bat Sys. Projects)
T. Guckert from Assoc. Mbr. Engrg. Staff to Mbr. Engrg. Staff (J. Rapp, Engrg. Programming)
R. Tweedie from Sr. Mbr. Engrg. Staff to Mbr. Engrg. Staff (A. Massi, Program Requirements & Analysis)
J. Carnucci from Mbr. Engrg. Staff to Sr. Mbr. Engrg. Staff (S. Ronkin, Computer Program Development)
J. Fogelbach from Princ. Mbr. Engrg. Staff to Ldr., Design & Development (R.B. Orth, Wave Form -Signal Processing)
H. Ulrich from Sr. Mbr. Engrg. Staff to Ldr., Design & Development (B.J. Matulis, In- formation Processing Equip.)
D. Drumheller from Sr. Mbr. Engr. Staff to Ldr., Design & Development J.A. Bauer, Advanced Technology Labs. & Design)
R. Higbee from Sr. Mbr. Engr. Staff to Ldr., Design & Development (W.F. Tester, Range System Opns.)
M. DeToro from Principal Mbr. Engr. Staff to Ldr., Engrg. Sys. Projects (W.H. Shep- pard, AN/SPY-1A Project)
A. Cohen from Mbr. Engrg. Staff to Sr. Mbr. Engrg. Staff (T. Burke, AN /TPQ -27 Software Design)
M. Van Cleave from Assoc. Mbr. Engrg.
Dear Editor:
Now that I am rapidly approaching the status of Golden Age Citizenship, I note with some concern the warning published in Punch, August 4, 1976. Acccrding to a survey by the British Metrication Board, the latest statistics show that 93percent of Senior Citizens are going to their graves in ignorance of the simplest facts about Metrication. Let it be noted that the Metrication Board has the capacity and the resources to indoctrinate Senior Citizens before it is too late. Only those dwelling in registered Homes for Senile Elders or those undergoing Last Rites are exempt from instruction in Metrication.
In the light of these alarming revelations, and of my own advancing years, I found in Punch some of the British Metrication Board's answers to a few disturbing questions:
1. What can Metrication do for me? I have enough material possessions to last out my mortal span.
Answer from the Board:
Through Metrication you will achieve a state of grace, which will help you to compose your thoughts on the Hereafter.
2. What metric dimensions will I encounter in the Hereafter?
Answer from the Board:
The Pearly Gates measure 50.7 meters in width and 38.9 meters in height. The Heavenly Throne weighs 100 metric tonnes.
Each block of Heavenly Mansions covers 10 hectares. The wing span of a fully grown seraphim is 2.9 meters.
For your less fortunate associates, the average temperature in Hell is 2000° Celsius.
I believe that RCA Engineer should alert our older readers to the exigencies of modern times.
C.W. Sall Technical Publications Administrator RCA Laboratories Princeton, NJ
Staff to Mbr. Engr. Staff (W. Rapp, Engrg. Programming)
M. Timken from Princ. Mbr. Engrg. Staff to Ldr., Systems Engrg. (J.L. Sullivan, In- form. Systems)
W.Zimmerman from Sr. Mbr. Engrg. Staff to Ldr., Sys. Engrg. (J.C. Kulp, Software Engrg. Distrib. Sys.)
R. Smith from Princ. Mbr. Engrg. Staff to Ldr., Design & Development (H. W. Collar, Adv. Electronic Technology)
Consumer Electronics
David J. Carlson from Sr. Mbr. Engrg. Staff to Mgr., Television Systems Engrg. (J.P. Bingham, Engineering Development)
Degree Granted
Missile and Surface Radar
Edward M. Yanis Leader, Technical Definitions, AEGIS, has received the MBA (Summe Cum Laude) from Southern Il- linois University.
Staff Announcements
RCA Laboratories
Doris W. Flatley has been named a
Member of the Technical Staff, IC Technology.
Frederick L. Dixon has been named a
Member of the Technical Staff, Process and Applied Materials Laboratory.
Joseph P. Skudlarek has joined the scientific staff, Systems Research Laboratory.
RCA American Communications, Inc.
Philip Schneider, President, RCA American Communications, Inc., an- nounced the organization as follows: A. William Brook, Vice President, Engineer- ing; Carl J. Cangelosi, Chief Counsel; Dennis W. Elliott, Director, Finance; Paul W. Gaillard, Vice President, Marketing: Harold W. Rice, Vice President, Operations; Charles H. Twitty, Director, Industrial Relations.
95
www.americanradiohistory.com
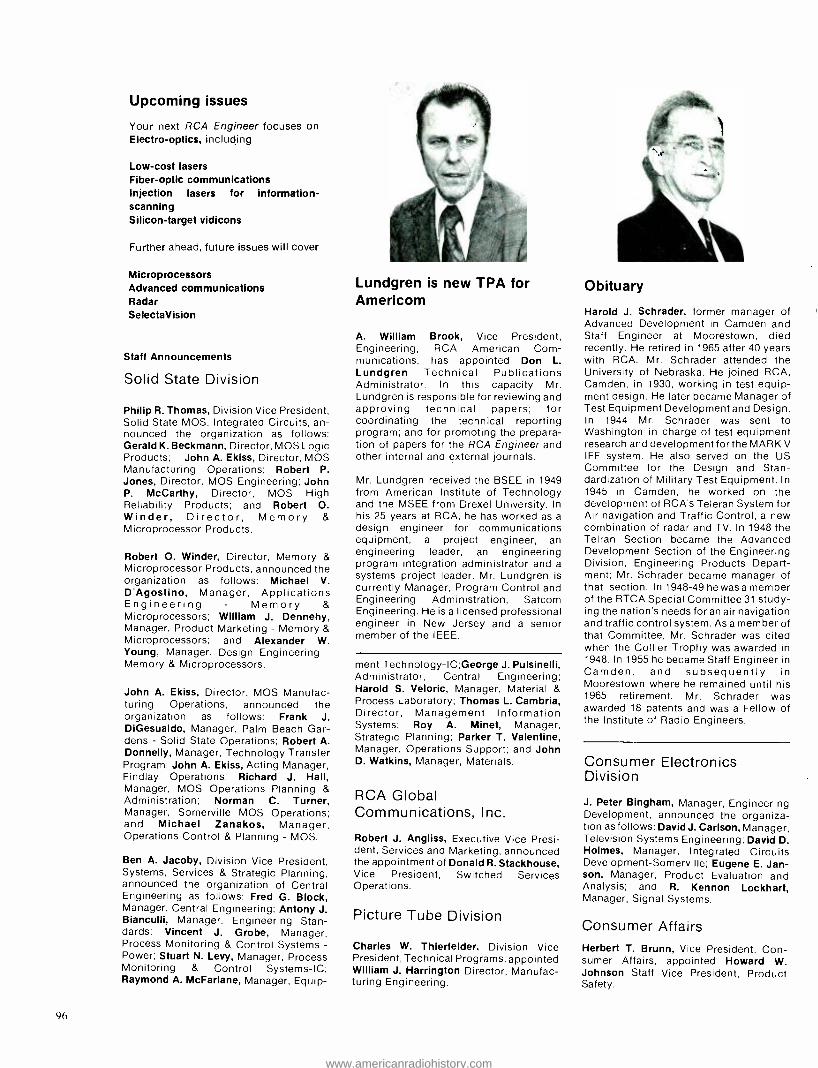
Upcoming issues
Your next RCA Engineer focuses on Electro- optics, including
Low -cost lasers Fiber -optic communications Injection lasers for information - scanning Silicon- target vidicons
Further ahead, future issues will cover
Microprocessors Advanced communications Radar SelectaVision
Staff Announcements
Solid State Division
Philip R. Thomas, Division Vice President, Solid State MOS, Integrated Circuits, an- nounced the organization as follows: Gerald K. Beckmann, Director, MOS Logic Products; John A. Ekiss, Director, MOS Manufacturing Operations; Robert P. Jones, Director, MOS Engineering; John P. McCarthy, Director, MOS High Reliability Products; and Robert O. Winder, Director, Memory & Microprocessor Products.
Robert O. Winder, Director, Memory & Microprocessor Products, announced the organization as follows: Michael V. D'Agostino, Manager, Applications Engineering - Memory & Microprocessors; William J. Dennehy, Manager, Product Marketing - Memory & Microprocessors; and Alexander W. Young, Manager, Design Engineering - Memory & Microprocessors.
John A. Ekiss, Director, MOS Manufac- turing Operations, announced the organization as follows: Frank J. DiGesualdo, Manager, Palm Beach Gar- dens - Solid State Operations; Robert A. Donnelly, Manager, Technology Transfer Program; John A. Ekiss, Acting Manager, Findlay Operations; Richard J. Hall, Manager, MOS Operations Planning & Administration; Norman C. Turner, Manager, Somerville MOS Operations; and Michael Zanakos, Manager, Operations Control & Planning - MOS.
Ben A. Jacoby, Division Vice President, Systems, Services & Strategic Planning, announced the organization of Central Engineering as follows: Fred G. Block, Manager, Central Engineering; Antony J. Bianculli, Manager, Engineering Stan- dards; Vincent J. Grobe, Manager, Process Monitoring & Control Systems - Power; Stuart N. Levy, Manager, Process Monitoring & Control Systems -IC; Raymond A. McFarlane, Manager, Equip-
96
Lundgren is new TPA for Americom
A. William Brook, Vice President, Engineering, RCA American Com- munications, has appointed Don L. Lundgren Technical Publications Administrator. In this capacity Mr. Lundgren is responsible for reviewing and approving technical papers; for coordinating the technical reporting program; and for promoting the prepara- tion of papers for the RCA Engineer and other internal and external journals.
Mr. Lundgren received the BSEE in 1949 from American Institute of Technology and the MSEE from Drexel University. In his 25 years at RCA, he has worked as a
design engineer for communications equipment, a project engineer, an engineering leader, an engineering program integration administrator and a systems project leader. Mr. Lundgren is currently Manager, Program Control and Engineering Administration, Satcom Engineering. He is a licensed professional engineer in New Jersey and a senior member of the IEEE.
ment Technology -IC;George J. Pulsinelli, Administrator, Central Engineering; Harold S. Veloric, Manager, Material & Process Laboratory; Thomas L. Cambria, Director, Management Information Systems; Roy A. Minet, Manager, Strategic Planning; Parker T. Valentine, Manager, Operations Support; and John D. Watkins, Manager, Materials.
RCA Global Communications, Inc.
Robert J. Angliss, Executive Vice Presi- dent, Services and Marketing, announced the appointment of Donald R. Stackhouse, Vice President, Switched Services Operations.
Picture Tube Division
Charles W. Thierfelder, Division Vice President, Technical Programs, appointed William J. Harrington Director, Manufac- turing Engineering.
Obituary
Harold J. Schrader, former manager of Advanced Development in Camden and Staff Engineer at Moorestown, died recently. He retired in 1965 after 40 years with RCA. Mr. Schrader attended the University of Nebraska. He joined RCA, Camden, in 1930, working in test equip- ment design. He later became Manager of Test Equipment Development and Design. In 1944 Mr. Schrader was sent to Washington in charge of test equipment research and development for the MARK V IFF system. He also served on the US Committee for the Design and Stan- dardization of Military Test Equipment. In 1945 in Camden, he worked on the development of RCA's Teleran System for Air navigation and Traffic Control, a new combination of radar and TV. In 1948 the Telran Section became the Advanced Development Section of the Engineering Division, Engineering Products Depart- ment; Mr. Schrader became manager of that section. I n 1948 -49 he was a member of the RTCA Special Committee 31 study- ing the nation's needs for an air navigation and traffic control system. As a member of that Committee, Mr. Schrader was cited when the Collier Trophy was awarded in 1948. In 1955 he became Staff Engineer in Camden, and subsequently in Moorestown where he remained until his 1965 retirement. Mr. Schrader was awarded 18 patents and was a Fellow of the Institute of Radio Engineers.
Consumer Electronics Division
J. Peter Bingham, Manager, Engineering Development, announced the organiza- tion as follows: David J. Carlson, Manager, Television Systems Engineering; David D. Holmes, Manager, Integrated Circuits Development -Somerville; Eugene E. Jan- son, Manager, Product Evaluation and Analysis; and R. Kennon Lockhart, Manager, Signal Systems.
Consumer Affairs Herbert T. Brunn, Vice President, Con- sumer Affairs, appointed Howard W. Johnson Staff Vice President, Product Safety.
www.americanradiohistory.com
Editorial Representatives The Editorial Representative in your group is the one you should contact in scheduling technical papers and announcements of your professional activities.
Commercial Communications Systems Division
Broadcast Systems W.S. SEPICH Broadcast Systems Engineering, Camden, N.J. K. PRABA Broadcast Systems Antenna Equip. Eng., Gibbsboro, N.J. A.C. BILLIE Broadcast Engineering, Meadow Lands, Pa.
Mobile Communications Systems F.A. BARTON* Advanced Development, Meadow Lands, Pa.
Avionics Systems C.S. METCHETTE* Engineering, Van Nuys, Calif. J.McDONOUGH Equipment Engineering, Van Nuys, Calif.
Government Systems Division
Astro- Electronics E.A. GOLDBERG Engineering, Princeton, N.J.
Automated Systems K.E. PALM* Engineering, Burlington, Mass. A.J. SKAVICUS Engineering, Burlington, Mass. L.B. SMITH Engineering, Burlington, Mass.
Government Communications Systems A. LIGUORI Engineering, Camden, N.J. H.R. KETCHAM Engineering, Camden, N.J.
Government Engineering M.G. PIETZ* Advanced Technology Laboratories, Camden, N.J.
Missile and Surface Radar D.R. HIGGS* Engineering, Moorestown, N.J.
Research and Engineering
Corporate Engineering H.K. JENNY* Technical Information Programs, Cherry Hill, N.J.
Laboratories C.W. SALL* Research, Princeton, N.J.
Solid State Division
Consumer Electronics
J.E. SCHOEN* Engineering Publications, Somerville, N.J. H.R. RONAN Power Devices, Mountaintop, Pa. S. SILVERSTEIN Power Transistors, Somerville, N.J. A.J. BIANCULLI Integrated Circuits and Special Devices, Somerville, N.J. J.D. YOUNG IC Manufacturing, Findlay, Ohio R.W. ENGSTROM Electro- Optics and Devices, Lancaster, Pa.
C.W. HOYT* Engineering, Indianapolis, Ind. R.J. BUTH Engineering, Indianapolis, Ind. P.E. CROOKSHANKS Television Engineering, Indianapolis, Ind. C.P. HILL Manufacturing Technology, Indianapolis, Ind.
SelectaVision Project F.R. HOLT SelectaVision VideoDisc Engineering, Indianapolis, Ind.
RCA Service Company
Distributor and Special Products Division
Picture Tube Division
RCA Communications
J.E. STEOGER* Consumer Services Engineering, Cherry Hill, N.J. R. MacWILLIAMS Marketing Services, Government Services Division, Cherry Hill, N.J. R.M. DOMBROSKY Technical Support, Cherry Hill, N.J.
C.C. REARICK Product Development Engineering, Deptford, N.J.
E.K. MADENFORD* Engineering, Lancaster, Pa. N. MEENA Glass Operations, Circleville, Ohio J.I. NUBANI Television Picture Tube Operations, Scranton, Pa.
C.W. BELL Engineering, Marion, Ind.
Alascom P.WEST* RCA Alaska Communications, Inc., Anchorage, Alaska Americom D.L. LUNDGREN* RCA American Communications, Kingsbridge Campus, N.J. Globcom W.S. LEIS* RCA Global Communications, Inc., New York, N.Y.
RCA Records J.F. WELLS* Records Eng., Indianapolis, Ind.
NBC W.A. HOWARD* Staff Eng., Technical Development, New York, N.Y.
RCA Ltd H.A. LINKE* Research & Eng., Montreal, Canada
Patent Operations J.S. TRIPOLI Patent Plans and Services, Princeton, N.J.
Electronic Industrial Engineering J. OVNICK* Engineering, N. Hollywood, Calif.
*Technical Publications Administrators (asterisked ' above) are
responsible for review and approval of papers and presentations.
www.americanradiohistory.com

RC/1 Engineer A TECHNICAL JOURNAL PUBLISHED BY CORPORATE TECHNICAL COMMUNICATIONS "BY AND FOR THE RCA ENGINEER"
Printed in USA Form No RE -22 -3
www.americanradiohistory.com