Embed Size (px)
Citation preview
IIFT Delhi, Student Research This report is published for educational purposes only by
students competing in the CFA Institute Research
Challenge.
Important disclosures appear at the back of this report
Oil & Gas
Ticker : PETRONET Recommendation : BUY
Price : INR 156.05 12 month Target price : INR 206.38
Earnings/Share
INR June September December March Year P/E
2008A 1.44 1.54 1.75 1.6 6.33 11.6x
2009A 1.41 1.38 1.4 2.72 6.91 5.9x
2010A 1.38 1.61 1.11 1.29 5.39 14.90x
2011A 1.48 1.75 2.28 2.75 8.26 15.28x
2012E 3.42 3.12 3.24 3.36 13.14 11.76x
Highlights
Increasing natural gas demand-supply deficit advantageous for Petronet: The rapid growth in
the Indian economy has led to an increasing gas demand and the supplies have not kept pace with
demand due to lack of new discoveries and failing of KG D6.This deficit is expected to be met
through imported LNG and Petronet is best placed to take advantage of this scenario.We expect
revenues to grow at a CAGR of 20.8% from FY11 to FY17.
Kochi terminal and Dahej expansion to drive volume growth: The upcoming 5 mmtpa LNG
terminal at Kochi is expected to serve the energy starved south Indian markets.The brownfield
expansion at Dahej along with the second jetty will add another 7mmtpa by FY15 .We expect long
term volumes to grow from 7.5 mmtpa in FY11 to 13 mmtpa by FY17.
Excess growth in LNG supply to reduce global spot LNG prices: The recent addition of
liquefaction facilities globally and reduced demand from US due to shale gas findings is expected
to dampen the spot LNG prices in the long term. This coupled with increase in the APM price is
likely to make imported LNG more affordable for the domestic Indian industrial buyers.We expect
increasing capacity utilizations for Petronet from 84% in FY11 to ~95% in FY17.
Strong Financial Performance : Boosted by robust revenue growth (CAGR of 20.8%) and stable
margins, the return on equity is expected to remain stable, with an increase of 180 bps from 25.2%
in FY11 to 27% in FY17. The EPS is also expected to triple in the forecast period. The debt/equity
is also expected to reduce to the desired level of 0.7 by FY17, as the new capacity additions start
generating cash flows.
Valuation: Petronet has been valued using two methods - Discounted cash flow and comparable
multiples.A real option valuation is also performed for upcoming LNG terminal at east coast,
leading to a target share price of INR 206.38 by the end of 2012. Our analysis suggests that
Petronet will offer long term upside if it can secure long term supply contracts.
Key risks to our target: Increase in the output of KG-D6 in the near term will reduce the demand
for imported LNG,Failure to secure long term supply contracts for the new capacity
additions,Government regulation of regasification tariffs and reduction in prices of alternative fuels.
Petronet stock has generated returns of +37.6% relative to S&P NIFTY index (-16.8%) and the
BSE oil & gas Index (-20.3%) in the past 1 year.
Petronet LNG
14/10/2011
Stock Performance
(as of 13/10/2011)1 m 3 m 6 m 1 y
Absolute -12.3% 8.1% 17.5% 37.6%
Rel. to Nifty -15.1% 17.2% 32.4% 54.4%
4.5 8 9
Forecast Summary INR FY11A FY12E FY13E FY14E FY15E FY16E FY17E
Revenues (Mn.) 132,652 183,447 225,868 255,744 363,206 433,524 488,010 EBIT (Mn.) 10,996 18093 22,896 25149 35,503 42078 47,012 Net Profit (Mn.) 6,196 10120 12,823 13655 19,873 24,134 27,098 EPS 8.3 13.5 17.1 18.2 26.5 32.2 36.1 DPS 2 2.5 3 4
52 Week Price Range INR 105.10 - 185.80
Average Daily Volume 2.12 Mn
Beta 0.83
Dividend Yield (Estimated) 1.6
Shares Outstanding 750 Mn
Market Capitalization INR 119,930 Mn
Institutional Holdings 17.74%
Insider Holdings 0
Book Value per Share INR 35.74
Debt to Total Capital 0.54
Return on Equity 25.20%
Market Profile

CFA Institute Research Challenge October 14, 2011
2
Business Description
Incorporated in the year 1998 and headquartered in New Delhi, Petronet LNG Ltd. (PLL) is a public limited
company promoted by four Navratna oil PSUs viz. Gas Authority of India(GAIL), Oil& Natural Gas
Corporation(ONGC), Indian Oil Corporation Limited (IOCL) and Bharat Petroleum Corporation Limited
(BPCL). GDFI, part of GDF Suez, a French national gas company acts as the technology partner. PLL is the
largest importer of natural gas in India. The company is in the business of storage and re-gasification
of LNG (Liquefied Natural Gas). Petronet has its presence in the downstream segment of the LNG value
chain(Refer Fig 1).It facilitates the conversion of imported LNG to Regasified LNG(R-LNG).
The company has a LNG receiving and regasification terminal with a capacity of 10 mmtpa (million metric
tonnes per annum) at Dahej, Gujarat. The terminal is strategically situated in Gujarat which is the biggest gas
consuming state in India.
The company has a 25 yr LNG long term supply contract for 7.5 mmtpa with Rasgas of Qatar. The Dahej
terminal is in close proximity to Qatar. The company also sources spot and medium term cargoes, on which it
charges a marketing margin. It also provides regasification services wherein companies can use Petronet’s
facilities for regasifying their LNG cargoes.
The company has a time charter agreement with a consortium led by Mitsui OSK Lines to transport Gas to
the Dahej terminal. The terminal is well connected with GAIL’s HVJ & DUPL pipelines covering seven
states and Gujarat State Petroleum Corporation’s (GSPL) network in Gujarat.
The company is currently constructing a similar LNG receiving, storage, and regasification terminal at Kochi,
with a capacity of 5 mmtpa. The terminal is expected to be operational by FY13. The company has signed a
long term supply agreement with Exxon Mobil for 1.44 mmtpa LNG from its Gorgon project, Australia over
a period of 20 years, for the Kochi terminal,with supplies starting from 2015.
The company has assured back-to-back off-take agreements with a take or pay obligation with GAIL, IOCL
and BPCL in the ratio of 60:30:10 respectively.
The four promoters GAIL, ONGC, IOCL and BPCL have a stake of 12.5% each in the company. GDFI holds
a 10% strategic stake and Asian Development Bank (ADB) has a stake of 5.2% .The remaining 34.8% is held
by public shareholders. ADB is in talks with GAIL to offload its stake in Petronet, subject to approval.
World Natural Gas Industry- Overview
Significant increase in Natural gas demand
The world realized the true potential of Natural Gas as a cleaner fuel in last two decades, resulting in a
significant increase in its demand.Globally, Natural gas contributes 24% of the primary energy consumption
basket(Refer Fig 2), while in India, it contributes only 11%(Refer Fig 3).USA, Japan and Korea are the major
importers of Natural gas.
Shale Gas Findings in USA and shift of focus to Asia
Due to the recent shale gas findings, LNG demand from USA has dipped and is expected to reduce rapidly in
near future. Other major gas consuming regions like Europe and China are also spreading their wings into
shale gas exploration. Major gas producing firms had already taken steps for capacity expansion, resulting in
a number of liquefaction terminals being constructed around the world. But due to the sudden turn of events,
these firms are now currently looking to Asia as their key target consumer.
Global Spot LNG prices at an all time high
The March 2011 earthquake in Japan resulted in a failure of a large number of its nuclear reactors, which
took a heavy toll on its electricity production. Therefore Japan's immediate LNG requirements have increased
rapidly, resulting in Japan purchasing LNG in spot markets to make up for the power shortfall, hence driving
up the spot LNG prices to an all time high of USD15-16 per mmbtu.
Indian Natural Gas Industry- Overview
India- yet to realize the true potential of Natural gas
India, despite being the 7th largest energy producer of energy in the world, more than 50% of the country's
population does not have access to electricity. India's GDP has grown at more than 8% in the last few years
and is expected to have high growth rates for atleast the next 20 years. The future growth of India depends on
meeting our growing energy needs and natural gas as a clean energy source holds the most promise. In India,
the primary energy source of energy has been coal(Refer Fig 3).According to Mercados Analysis, Natural gas
is projected to increase from 11% now to about 25% of the total energy basket by 2025-2030.
Figure 1: Petronet LNG
Value chain
Source: Company Data
Source: BP statistical review 2010
Source: BP statistical review 2010
Petronet
RAS Gas
Mitsui
OSK lines
RAS Gas
GAIL, IOCL,
BPCL

CFA Institute Research Challenge October 14, 2011
3
Widening Demand-Supply deficit
A study by Mercados estimates that the natural gas demand-supply deficit in India is expected to rise by more
than 5 times from 33 million metric standard cubic metres per day(mmscmd) in 2010-11 to 178 mmscmd in
2014-15.(Refer Fig 4)In order to cater to the increasing demand, India’s current natural gas supplies have to
increase at a rapid pace.
Depleting Domestic gas Supplies
The main producers of natural gas in India are Oil & Natural Gas Corporation Ltd. (ONGC), Oil India
Limited (OIL), JVs of Tapti-Panna-Mukta(PMT) and Ravva , Reliance Industries Limited (RIL). RIL has
discovered gas in the Krishna Godavari basin at its KG D6 block in the east cost of Andhra Pradesh. In
FY10, overall gas supply was 162.8mmscmd, of which 36mmscmd is LNG.(Refer Fig 5).The major source is
ONGC followed by RIL's KG D6 block, which was expected to ease the pressure on the gas deficit with a
total production of 86mmscmd in FY14E.
The ONGC and OIL fields are mature fields and are rapidly depleting. Appraisal & development of
other NELP (New Exploration Licensing Policy) discoveries and exploration activities are proceeding at a
sluggish pace. Only 2 (D1/D3 in KG Basin) out of over 50 NELP gas discoveries on the east coast are
currently productionized. The major obstacles are shortage of deep-water rigs, lack of technical expertise in
developing deepwater discoveries, controlled pricing, lack of clarity on taxation & allocation of gas.
KG D6, is currently languishing at 48 mmscmd, at less than 60% of its expected output. Reliance
Industries recently sold 30 percent stake sale in 21 oil and gas blocks, including the KG-D6 block, to British
energy giant BP for over $7 billion. BP’s deep water exploration expertise is expected to aid in stepping up
gas output from the D6 block. The two wells RIL drilled recently turned out to be almost dry.RIL is currently
drilling 3 more wells and any increase in production levels can come only after these 3 wells are drilled and
connected to the production system which is expected only by 2014.
Increasing natural gas demand
Power Sector: India’s power sector is mainly dependent on coal. Several new power stations are scheduled
to come up in the near future.Though natural gas is expensive than coal(Refer Fig 6),it can still provide fuel
diversification to power sector. Due to their smaller gestation periods and cost effectiveness, Gas based
power stations are expected to help meet India’s increasing peaking power requirement.
Fertiliser sector: Natural gas being more economical than Naphtha and Fuel Oil,(Refer Fig 6),the key
feedstock for fertilizers, and with reopening of existing plants, this sector will continue being a major market.
City Gas Distributions(CGD): With the creation of gas transmission infrastructure, CGD will play a crucial
role in driving future gas demand. Government is also encouraging the supply of CNG for transportation and
PNG for households. Higher petrol and diesel prices are providing impetus to CNG conversion.(Refer Fig 6)
Industrial sector: For industrial users,natural gas competes with oil and coal-based fuels. Firms generally
find it cost-effective to switch to gas if they can obtain supplies.Given the cost benefits of using natural gas
compared to other fuels(Refer Fig 6),Petrochemical,sponge iron and other industries are likely to increase
their consumption of natural gas in the future.
Please refer to Figure 7 in the appendix for a Projected, Sector-Wise Gas Demand, till 2014-15.
Source: Basic Statistics, Ministry of Petroleum &
Natural Gas, GoI
Source: Supply-Director General of Hydrocarbon
Demand-Mercados Analysis 2010
Source: Student Research
Fuel Oil
Coal
Henryhub
Spot
Petrol
Diesel
Naphtha
Natural gas

CFA Institute Research Challenge October 14, 2011
4
Pricing of Natural gas
No Regulation for pricing of imported R-LNG
Presently, there are broadly two pricing regimes for gas in India –
The price of Administered Price Mechanism(APM) gas is set by Governmentof India(GOI). APM gas
comes from the existing fields of Oil and Natural Gas Corporation (ONGC) and Oil India Limited (OIL).
Non-APM / free market gas could be broadly divided into two categories, domestically produced gas from
JV(Joint venture) fields and imported LNG. The pricing of JV gas is governed in terms of the Production
Sharing Contract(PSC) provisions, while the price of LNG is governed by the Sales Purchase Agreement
between the LNG seller and the buyer. The spot cargoes are purchased on mutually agreeable commercial
terms. But domestic gas supplies other than APM gas are also subject to heavy government influence. KG D6
gas is currently subject to government regulation and is priced on par with APM gas.(Refer Fig 8)
However, Imported R-LNG is not subject to any pricing regulation.
Imported LNG significantly expensive than domestic gas
Since global LNG prices are linked to price of crude oil, and with very high crude oil prices,the imported R-
LNG turns out to be significantly more expensive than the domestic gas(Refer Fig 8) and also more volatile
than domestic gas, which is tightly regulated by the government. Thus, RLNG is unable to compete with
domestic gas in catering to the needs of the price sensitive Power and Fertilizer sectors.
Gas price pooling
In its recently submitted Draft report on pooling of gas prices, a high-level government committee has
recommended a pooling mechanism for natural gas on a sectoral basis and it favors preferential allotment to
the fertilizer and power sectors on a priority basis.
Even though price of R-LNG is currently costlier than domestic gas, it is still much cheaper than naphtha,
fuel oil etc and hence, we see incremental LNG demand from sectors other than power and fertilizers, since
economic incentives exist to enforce switching from crude based sources of fuel to cheaper R-LNG.
Natural Gas Allocation
Highest priority for power and fertliser sectors for allocation of domestic gas supplies
The power tariffs and fertilizer pricing are controlled by the GOI.Consequently, power and fertiliser sectors
are the most price-sensitive to gas and hence are given high priority in allocation of domestic gas. Almost
85% of APM gas goes to the power & fertilizer sectors.Due to lower than expected output,KG D6 gas is
currently being supplied only to these priority sectors.(Refer Fig 9) Hence, other key sectors such as City gas
and Industrial sectors are currently facing a shortage of gas supplies.
No government allocation plan for imported LNG
Currently, there is no government defined allocation plan for imported R-LNG.Hence,with increasing
imports of R-LNG, other sectors have also gained access to gas. R-LNG is being used only in small amounts
by the power & fertilizer sectors whereas growing demand in the CGD segment is being serviced solely by
R-LNG imports.
In light of limited supplies of cheap domestic gas, we expect that companies operating in steel,
refinery/petrochem, sponge iron would be left with no choice but to use R-LNG.
Rapidly developing Pipeline Infrastructure in India
India has a total natural gas pipeline infrastructure of around 11,402kms with a designated capacity of
320mmscmd. Gas Authority of India Limited (GAIL) operates around 60% of the total pipeline
network(Refer Fig 10).However, the South Indian market lacks natural gas transmission infrastructure and
there has been an increasing gas demand in this region. GAIL has announced an aggressive expansion plan to
double its transmission capacity from 150mmscmd to 300mmscmd by FY14E.There are several pipelines
under construction in South India.The most important of those are a 16 mmscmd Kochi-Mangalore pipeline
and another 16 mmscmd Kochi-Bangalore-Dabhol pipeline, both being constructed by GAIL.
The development of pipeline infrastructure will provide great impetus to imported R-LNG as it opens up the
huge market of the gas starved south Indian states.
Sector Firm Fallback Total
Power 31.2 12 43.2
Fertiliser 15.5 - 15.5
Petrochem 1.9 - 1.9
Refinery 5 6 11
Steel 4.2 10 14.2
LPG 3 - 3
CGD 0.8 2 2.8
Small AP
customers 1 - 1
Total 62.6 30 92.6
Source: Gail, Student research
Source: Student Research
Figure 9: KG-D6 Gas allocation
( mmbtu)
Source: Ministry of Petroleum & Natural Gas,
GoI

CFA Institute Research Challenge October 14, 2011
5
Competitive Positioning of Petronet LNG
Dahej Terminal – First Mover Advantage
The 10 mmtpa LNG terminal at Dahej will continue to be the bedrock of Petronet’s operations going
forward owing to the numerous advantages.
Low capital costs of Dahej terminal translating into competitive regas tariffs
The Dahej terminal was set up with a capital expenditure of Rs.35.5 Bn in 2004 and since then, the capital the
capital cost for setting up LNG terminals (capex/tonne) has risen significantly. The regas tariff for long term
volumes is determined on a DCF basis which builds in 16% IRR on investment; with annual escalation of 5%
in regas tariffs. As Dahej enjoys the advantage of low capital costs, we don’t foresee any pressure on regas
margins as they are pegged to capital expenditure incurred. If new players were to compete with Petronet on
pricing, margins will be significantly lower and the interest expense on capex higher, thus lowering the
operating profits and returns throughout the project life.
Optimal location to cater to the projected increase in demand
The Dahej terminal is optimally located in Gujarat which accounts for 33% of the natural gas consumption in
India and is well connected to GAIL’s HVJ & DUPL pipelines and GSPL’s network in Gujarat.The
Petroleum & Natural Gas Regulatory Board (PNGRB) is targeting 200 cities by 2015 for rolling out City Gas
Distribution (CGD) networks, and majority of these cities lie in the states of UP, Haryana, Gujarat and
Rajasthan to which Dahej has good connectivity through existing pipelines. The upcoming Kochi terminal
also is optimally located to meet the demands of the historically gas starved south Indian states. The proposed
LNG terminal on the East coast is expected to meet the increasing demands of the entire east coast along with
SriLanka, where Naphtha is the primary fuel and is much expensive than Natural gas(Refer Fig 11).
Access to cheap LNG when the spot LNG prices are continually increasing
FOB value of long term Rasgas LNG was fixed at USD 2.53/mmBtu during the period CY04-08 and has
been increased periodically from 2009. This will continue until 2015, when the price is expected to reflect a
linkage of 12.7% with Japanese crude cocktail (JCC) (Refer Fig 12).While the suppliers seek to benefit from
the high crude oil prices by demanding a crude price linkage for LNG long term supply contracts and the spot
prices in the market is ruling at USD 14-15/mmbtu,the RasGas contract is unique as it allows for gradual
alignment of LNG price to JCC, thereby, keeping costs & prices down.
Investment Summary
We initiate coverage of Petronet LNG with a Buy rating and a target stock price of INR 206.38, offering a
upside of 32.25% from current stock price. PLL is the largest importer of natural gas in India. The company
is in the business of storage and re-gasification of LNG (Liquefied Natural Gas). The company currently has
a 10 mmtpa LNG terminal at Dahej, Gujarat.
Widening gas Demand-supply scenario in India and Petronet’s first mover advantage
Due to the depleting domestic gas supplies, imported R-LNG is expected to play a huge role in meeting the
increasing natural gas demand from various sectors. The company enjoys a first mover advantage in imported
LNG segment and is poised to take advantage of this widening demand-supply deficit. The company is
strengthening its position as market leader, increasing its capacity by constructing a similar LNG terminal at
Kochi, with a capacity of 5 mmtpa and undertaking capacity expansion of 7 mmtpa at Dahej
Favourable Global LNG scenario
Major gas producing firms around the world had already taken steps for capacity expansion, resulting a
number of liquefaction terminals.But due to the recent shale gas findings in USA, its LNG demand has
dipped and is expected to decrease rapidly in the near future. Hence these firms are now looking to Asia as
their key target consumer. This is expected to dampen the global spot LNG prices in the long term, which
augurs well for Petronet as it would be able to source cheap spot cargoes and improve capacity utilization.
Strong Financial performance
We expect a 2011-17 revenue CAGR of 20.8% , EPS CAGR 22.1% of and a tripling of book value. As a
result of huge capex plans and the debt financing of these capex plans, the free cash flow to equity(FCFE) is
expected to be negative in FY12. Once these capacity additions are operational, we expect the Operating
Cash Flow to increase, thereby reducing the debt, and achieving a D/E ratio of 0.70 in FY17 from the current
levels of 1.2. Thus FCFE can be expected to turn positive from FY13, and increase gradually.
Source: Company Data
Dahej
Kochi
Proposed
locations for
Eastern LNG
terminal
Figure 11: Optimal Location of
terminals near Key markets
Source: Company Data
CFA Institute Research Challenge October 14, 2011
6
Valuation
Our end-of-the year target price of is based on a Discounted Cash Flow and Comparables Analysis.In DCF
valuation,Petronet has been valued by projecting the revenues of Dahej terminal and Kochi terminal
individually, and then projecting the FCFE using the combined revenues from both the terminals. A real
option valuation is performed for the proposed for the upcoming LNG terminal at East coast.Since Petronet
with its unique business model has no exact peers,the comparables analysis is done through two methods.
The first is through average historic P/E of Petronet for the last three years and the second is by calculating
the trading multiples of its closest peers in gas distribution in India. Our target share price is the weighted
average of the prices resulting from our DCF and comparables Analysis.
Risks
The key risks include an increase in domestic gas supplies which will reduce the demand for imported LNG,
Government regulation of Regasification tariffs, Reduction in prices of alternative fuels such as Naphtha,
Fuel Oil etc,Absence of long term supply contracts other than RasGas and Delay in development of gas
transmission infrastructure in South India
Valuation
Assumptions
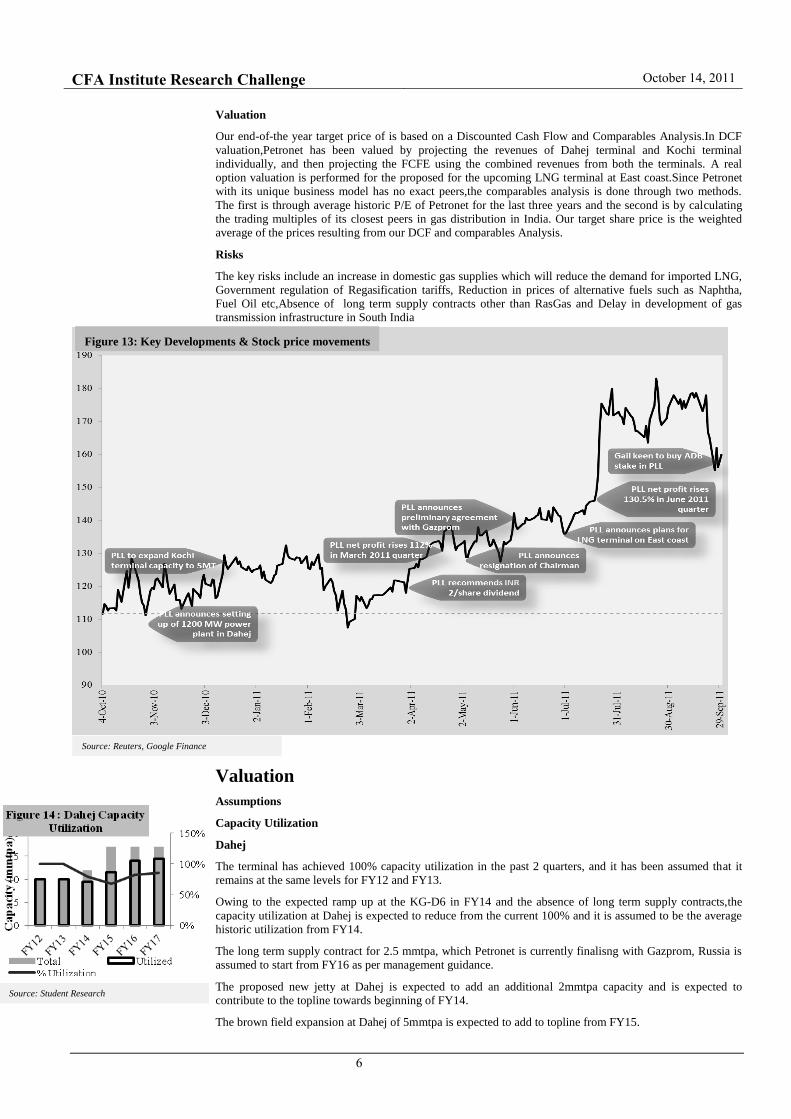
Capacity Utilization
Dahej
The terminal has achieved 100% capacity utilization in the past 2 quarters, and it has been assumed that it
remains at the same levels for FY12 and FY13.
Owing to the expected ramp up at the KG-D6 in FY14 and the absence of long term supply contracts,the
capacity utilization at Dahej is expected to reduce from the current 100% and it is assumed to be the average
historic utilization from FY14.
The long term supply contract for 2.5 mmtpa, which Petronet is currently finalisng with Gazprom, Russia is
assumed to start from FY16 as per management guidance.
The proposed new jetty at Dahej is expected to add an additional 2mmtpa capacity and is expected to
contribute to the topline towards beginning of FY14.
The brown field expansion at Dahej of 5mmtpa is expected to add to topline from FY15.
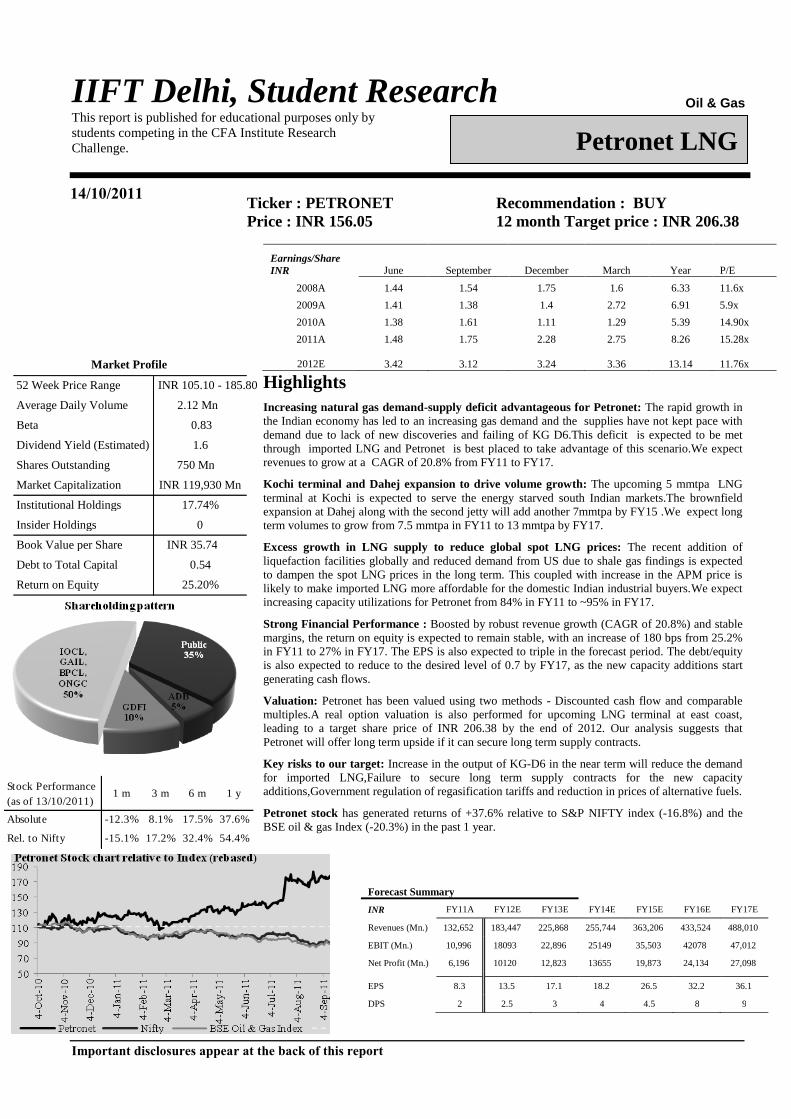
Figure 13: Key Developments & Stock price movements
Source: Reuters, Google Finance
Source: Student Research

CFA Institute Research Challenge October 14, 2011
7
Kochi
Phase I of the terminal is expected to be operational by Jan 2013, with a capacity of 2.5 mmtpa and it is
expected to be fully operational by FY 14 with a capacity of 5 mmtpa.
As the long term supply contract with the Exxon Mobil starts only from FY15 and there are no other term
contracts, the capacity utilization at kochi is likely to ramp up slowly ,as the entire demand is to be sourced
only through spot / medium cargoes when it becomes operational by FY13.
Regasification Tariffs
Dahej terminal regasification tariffs are INR 33.15/mmbtu currently. A 5% annual escalation in
regasification tariffs is assumed in the near term as provisioned. The initial regasification tariff at Kochi when
it starts operations in FY13 is arrived at INR 52.5/mmbtu building in the standard 16% IRR on a cap-ex of
INR 42 billion. A marketing margin average of USD 0.5/mmbtu on spot cargoes is assumed as the
management guided towards USD 0-1 per mmbtu depending upon demand & supply.
The proposed power plant at Dahej has not been considered in the valuation, due to the lack of
environmental clearances and power off-take agreements as per the management guidance.
The proposed LNG terminal on the east coast is valued separately using a real option, since the
investment decision and the expected cash-flows are still uncertain at this point in time, and it cannot be
incorporated in the DCF analysis.
Discounted Cash Flow(DCF) Valuation
Petronet has been valued by projecting the revenues of Dahej terminal and Kochi terminal individually, and
then carrying out a Discounted Cash Flow analysis using the combined revenues. The Free cashflows to the
firm is projected for the forecast period until FY17 with a constant EBITDA margin and a target Debt-Equity
of 70% as per management guidance. The terminal period growth rate is assumed to be 2%. These cashflows
are discounted at a Weighted average cost of capital (WACC) of 12.6% to arrive at the enterprise value of
INR 166,840 Million. Then by subtracting the net debt of INR 28,820 Million, we arrive at a equity value of
INR 138,020 Million,translating into a share price of INR184.03. Pls refer Appendix for WACC calculation,
DCF valuation, calculation of free cash flows and Share Price Sensitivity Analysis.
Source: Student Research
Source: Student Research
Source: Student Research
: .
PV of Free Cash Flow 48,580
Perpetuity Growth Rate 2.0
%
Terminal Value 253,820
Discount Factor 0.5
2
PV of Terminal value 132,010
Enterprise value(FCFF) 166,840
Less: Total debt 30,360
Plus: Cash and Cash Equi. 154
0
Net Debt 28,820
Implied Equity Value(FCFE) 138,020
Outstanding shares(Mn) 750
Implied share price(INR) 184.03
:Share price calculation(INRMn) Fig1
7

CFA Institute Research Challenge October 14, 2011
8
Valuation by comparables
Historic P/E: The historical trading multiples of Petronet for the past 3 years is assumed to be a reasonable
estimate for valuing the stock and a share price of INR193.09 is arrived.
Peers in Indian Gas sector: A sample set comprising of the major gas distribution companies,GAIL, Gujarat
Gas, Indraprastha Gas and GSPL has been taken as the comparables as there is no exact comparable company
to Petronet. Forward looking multiples (P/E, EV/EBITDA & P/BV) are calculated for these companies and
their average is taken as the trading multiple of Petronet, and a share price of INR200.18 is determined.
(Refer fig.19).
REAL Option Valuation of the proposed LNG terminal on the East coast
The LNG terminal on the east coast is valued at INR 50294.5 Million, and the project NPV is estimated at
INR 36420 Million, thus valuing the real option at INR 13874.5 Million using modified Black-Scholes
model. On a per share basis, this translates to an additional share value of INR 18.5. This is incremental to the
share price that has been arrived at, using the DCF & comparables methods.
Target share price
The target share price has been arrived at, by giving a 70% weightage to DCF analysis and a 30% weightage
to comparables (15% to valuation by historic P/E and 15% to valuation by closest peers in Indian Gas sector)
to arrive at a target share price of INR 187.88 without considering the LNG terminal on the east coast. The
target share price with the east coast terminal would be INR 206.38.
Risks to our share price Target
Increase in the output of KG-D6 in the near term will reduce the demand for R-LNG, thus reducing the
assumed marketing margins.
Failure to secure long term supply contracts for Kochi terminal and the excess capacity that is being created
at Dahej will lead to sub-optimal capacity utilizations than assumed.
Absence of off-take agreements with customers for the Kochi terminal, may substantially reduce the
projected cash flows.
Regasification tariffs, if brought under government regulations may prove detrimental to valuations as
Kochi‘s calculated intial regas tariff of INR 52.5/mmbtu in FY 13 is far higher than Dahej.
Financial Analysis
We have calculated the ratios which are important to the industry and for projecting the future growth of the
company. The Interest Coverage and the Debt-Equity have been calculated to show the solvency of the
company and the ability to take on more debt. The operating margin ratio and EPS would provide the base for
our furture profitability projections. Refer to Figure 20 for additional important ratios to assess the financial
prospects of the company.
P/E EV/EBITDA P/BV
INPUTS OUTPUTS
The PV of expected net cash flows from East Coast terminal now(INR Mn) 76,270 d1 1.54
The PV of set-up & development costs requiredfor the East coast terminal(INR Mn) 39,850 N(d1) 0.94
The expected competitive advantage period for the expansion 4.00 d2 0.65
The equivalent risk-free rate for the competitive advantage period. 0.08 N(d2) 0.74
The variance or 'riskiness' of the expansion's expected cashflows. 0.20 VALUE(INR Mn) 50,294 .5
P/E P/EBITDA P/BV
GAIL 16.1 7.8 2.4
Gujrat Gas 17.8 9.3 5.4
Indraprastha 15.9 7.2 4.9
GSPL 14.8 6.9 2.4
Petronet 16.2 7.8 3.7
P/E P/EBITDA P/BV
Avg.
multiples16.2 7.8 3.7
EPS 13.5
EBITDA 26.8
BVPS 46.7
Share Price 218.7 209.04 172.79
200.18
Figure 19: Comparables Analysis
Source: Student Rsearch
P/E EV/EBITDA P/BV

CFA Institute Research Challenge October 14, 2011
9
Earnings
The EPS is projected to grow at a CAGR of 22.1% buoyed by incremental revenue growth(CAGR-20.8%)
and stable margins while the book value is expected to quadruple to 147.3 in FY17.The ROE peaks in FY
2012 due to higher leverage and expected to remain stable over the projected period at 27% implying 180 bps
improvement from the current level.
Cash Flow
The operating cash flow is expected to continually increase along with the sales,resulting in a stable
OCF/sales ratio of around 14%. This indicates that the company generates sufficient cash flow from its
capacity additions,thereby able to meet its debt obligations.
Balance Sheet & Financing
The Asset Turnover ratio is expected to be vey high as the capacity utilization would be around 100% in
FY12 and FY13.Beyond FY13,The ratio is set to fall as new capacities would be added and ramp up in
volumes is expected to be gradual.The debt/equity ratio is expected to come down once the the undergoing
capital expenditure plans are completed and is projected to be around 70% which is inline with the
management’s target.The interest coverage ratio is expected to remain healthy throughout the forecast period
as the company generates sufficient operating cash flows to meet its debt obligations.
Strengths
Maximizing capacity utilization at dahej, robust volume growth, strong marketing margins - higher
operating cash flows
Petronet has improved its capacity utilization from 75.5% in FY10 to 85.3% in FY11 and further to 104.8%
in Q1FY12. There was 6% QoQ jump in Petronet's re-gasification volumes in Q1FY12. Petronet has actively
sourced spot/short term cargoes in the last year and also entered into a 1.5mmtpa medium term supply
contract for FY12 and FY13. Petronet has charged robust marketing margin of USD 0.3-0.4/mmbtu on spot
cargoes over and above re-gas margin.
Setting up of kochi terminal – access to the gas starved south indian markets
Petronet LNG is setting up a greenfield LNG terminal with a capacity of 5 mmtpa at Kochi in Kerala,
commissioning of which is expected by Oct 2012. The total capex involved in setting up this facility is
estimated at INR 42 bn. There is great demand for natural gas in the South India, mainly from the Mangalore
and Kochi industrial belt. The key customers for Petronet’s Kochi terminal are BPCL’s 9.5mmtpa Kochi
refinery and ONGC’s 11.8mmtpa Mangalore refinery, power and fertilizer plants in Kochi and Mangalore.
Capacity expansion at Dahej - Establishing itself firmly as market leader
Petronet is increasing the regasification capacity at its Dahej terminal by constructing a new jetty to act as a
back up for the old jetty, to avoid any down time. It also plans to increase the capacity by another 2 mmtpa by
Q3FY13. The new jetty will also enable unloading of LNG from larger ships.
Establishing solid cargo port at Dahej – Diversification
Petronet holds 26% Equity in Joint Venture Company with the Adani Group to develop a Solid Cargo Port in
Dahej (Adani Petronet (Dahej) Port Pvt. Limited). It has a capacity to handle 20 MMTPA of dry bulk
cargo/year (Coal, Steel and Fertilizers). Phase I has been commissioned in September, 2010.
Opportunities
New LNG terminal in East coast- Aggressive expansion: To cater requirement of gas consumers in the
East Coast region of the country, Petronet is exploring feasibility of developing another LNG receiving &
regasifying terminal on the East Coast with a capacity of 5 mmtpa at a cost of INR 40 Bn. Since no other
LNG terminal is located or planned in the East coast, Petronet has a distinct advantage.
Power plant at Dahej – Diversification: Petronet has completed Detail Feasibility Report for a 1.2 GW
Power Plant at Dahej. The project is expected to cost about USD 870 million,expected to be completed in 36
months . The benefits are Non-applicability of VAT,no transportation costs and 8% increase in efficiency.
Direct Marketing: Petronet is also exploring opportunities to supply LNG to Coastal area consumers in
India and neighbouring countries through smaller LNG vessels. It plans to foray into Direct Marketing by
focusing on Direct RLNG marketing to bulk consumers like Power & fertilizer producers and Industrial
consumers. LNG is provided through trucks in regions not serviced by pipelines.
Source: Student Research
Source: Student Research

CFA Institute Research Challenge October 14, 2011
10
Investment Risks
External Risks
Increase in KG-D6 output and other domestic discoveries of natural gas
The increase of gas output from KG-D6 and new discoveries of Natural gas(NELP) in the future would
increase domestic supply, impacting the LNG volumes and earnings estimates as imported LNG is costlier
than the domestic gas.
Cross price elasticity of alternative fuels
LNG competes with alternative fuels like naphtha, fuel oil and coal for the supply of fuel to Power &
fertilizer producers and Industrial consumers. A reduction in the price of alternatives could lead to better
competitiveness of these fuels and will have an adverse impact on Petronet’s future volumes and profitability.
Regulatory risk
Currently, Petronet LNG’s regasification charges are beyond the purview of the regulator, PNGRB. Also,
currently the pricing of imported R-LNG is not set by the government. Any regulatory change on
regasification charges or pricing would adversely impact Petronet LNG’s profitability and valuations, as
Kochi has far higher tariffs than Dahej.
Delay in development of transmission infrastructure in South India
Currently, there are many pipelines under construction in South India, with most of them scheduled to be
completed by FY13. Petronet’s new Kochi terminal is heavily dependent on the completion of these new
pipelines as per schedule in order to meet the growing gas demand of South India.
Internal risks
Disruptions in supply of Natural gas due to absence of long term contracts
Political disturbances in Middle East might cause supply disruption as RasGas is the sole supplier. And in
order to achieve full capacity utilization at Dahej, the firm is currently dependent on Spot and medium term
cargo. Even for the Kochi terminal which is scheduled to be operational by end 2012, Petronet is completely
dependent on spot cargoes till 2015 because the long term supply contract with Exxon Mobil starts only
from 2015.The company is actively in talks with many global suppliers for long term supply contracts. It is in
final stages of completing a 25 year 2.5 mmtpa supply contract with Gazprom, Russia.
Construction and Development risks
Petronet is currently in an expansion phase with so many projects planned in the near future. There is a
significant risk that these projects may get delayed and costs spiraling out of control. To mitigate this risk, the
company awards fixed date, fixed price EPC contracts after a global bidding process.
Operations & Maintenance risks
During its useful life, the terminal may fail to perform according to expectations and the costs of Operation &
Maintenance(O&M) of the terminal might increase beyond the maintenance budget. To mitigate this risk,
Petronet has GDF Suez as its strategic & technology partner.
Interest rate risk
The company has a loan of INR 3000Cr, of which 50% are fixed rate loans and 50% are floating rate loans.
The company has entered into swap agreements and converted its floating rate loans into fixed rate loans with
interest rates getting reset every three years. Considering its reliance on financing through borrowings, the
company may be unable to avail new loans at favorable interest rate levels, however the company’s recent
bond issuance that was rated Laa, is proof of creditor trust in the company.
Exchange rate risk
The exchange rate fluctuations linked with the imported LNG are also passed through to offtakers. All long
term loans are denominated in INR to avoid any cash flow mismatch as regasification tariffs are INR based.
Management risk
The four Indian promoters of Petronet are the biggest players in Indian Oil industry and have excellent
financial track record. GDF Suez, the strategic partner has an excellent track record of over 30 years in
imported LNG in Europe. Also, the key supplier RasGas has an established LNG supply history. The only
apprehension is that out of the 13 directors on the Petronet board, only 4 are independent and this has to be
improved upon to make for a more effective corporate governance.

CFA Institute Research Challenge October 14, 2011
11
Appendix:
DCF ASSUMPTIONS
Risk Free rate 10 year Government of India Bond Yield
Beta Regression of stock returns with market returns and then levering it
Market Risk Premium Average of
1) Market Risk Premium through Extrinsic method used by
Aswath Damodaran,
2) Market risk premium through Intrinsic method as per as Per
IIM A Working Paper 2006-06-04 by Varma & Baruva,
by taking the average of arithmetic mean and geometric
mean of the regression of equity returns with risk free rate
returns.
Cost of Debt Interest rate on the recent long term debt issued by the company
Target Debt-Equity ratio Management guidance
Figure 18: WACC Calculation
Capital Structure
Debt to Total Capitalization 41.3%
Equity to Total Capitalization 58.7%
Debt to Equity Ratio 70.5%
Cost of Equity
Risk-free rate 8.2%
Market risk Premium 9.6%
Levered Beta 0.92
Size Premium 0.0%
Cost of Equity 17.0%
Cost of Debt
Cost of Debt 9.5%
Taxes 33.0%
After Tax Cost of Debt 6.4%
WACC 12.6%
DCF Valuation
WACC Calculation
EBIT 783 1,100 1,809 2,290 2,515 3,550 4,208 4,701
Taxes (33%) 195 287 492 623 664 966 1,173 1,317
Capex 1,046 889 1,206 1,200 1,200 600 900 1020
Increase/Decrease in NWC 330 - 279 246 115 155 175 129 140
FCFF - 572 477 - 36 408 621 2,038 2,339 2,643
WACC 12.6%
Discount Period
0.5 1.5 2.5 3.5 4.5 5.5
Discount Factor
0.94 0.84 0.74 0.66 0.59 0.52
PV of free cash flow
- 34 341 461 1,345 1,37 0 1,375
DCF Valuation Actual
Projected
(in INR Cr unless specified) 2010 2011 2012 2013 2014 2015 2016 2017
Sales 10,747 13,265 18,345 22,587 25,574 36,321 43,352 48,801
Total costs 9,803 11,981 16,332 20,109 22,768 32,335 38,596 43,447
EBITDA 944 1,284 2,013 2,478 2,806 3,985 4,757 5,354
% margin 8.8% 9.7% 11.0% 11.0% 11.0% 11.0% 11.0% 1 1.0%
Depreciation & Amortization: 160.86 184.68 203 189 291 435 549 653
Financial year
Figure 20: Sensitivity Analysis
Perpetuity growth %
1.00% 1.50% 2.00% 2.50% 3.00%
WA
CC
10.8% 218.1 230.4 244.1 259.4 276.7
11.8% 188.3 197.9 208.5 220.3 233.4
12.8% 163.7 171.4 184.0 189.1 199.4
13.8% 143.3 149.5 156.4 163.8 171.9
14.8% 126.0 131.1 136.7 142.8 149.3
Source: Student Research
Share price Sensitivity Analysis

CFA Institute Research Challenge October 14, 2011
12
INCOME STATEMENT
2011 2012 2013 2014 2015 2016 2017
Sales 13106 18151 22348 25304 35937 42895 48286
Services 92 103 127 143 204 243 274
Other Income 68 91 112 127 180 214 241
Total Revenue 13265 18345 22587 25574 36321 43352 48801
Raw Materials 11801 16046 19757 22370 31770 37921 42687
Total Expenses 11981 16332 20109 22768 32335 38596 43447
EBITDA 1284 2013 2478 2806 3985 4757 5354
Deprecitation and Amortization Charges 185 203 189 291 435 549 653
EBIT Margin 1100 1809 2290 2515 3550 4208 4701
Intrest Expenses 193 306 384 486 597 621 675
PBT 906 1504 1905 2029 2953 3586 4027
Total Tax 287 492 623 664 966 1173 1317
PAT 620 1012 1282 1365 1987 2413 2710
Adjusted PAT 620 1012 1282 1365 1987 2413 2710
EPS 8 13 17 18 26 32 36
Cash EPS 11 16 20 22 32 39 45
DPS 2 3 3 4 6 8 9
Total Dividend 150 188 225 300 413 600 675
To Balance Sheet-Equity 470 824 1057 1065 1575 1813 2035
Sector 2010-11 2011-12 2012-13 2013-14 2014-15
Power 87.71 149.11 185.52 212.73 243.34
Fertilizer 49.39 57.48 68.08 68.08 68.08
City gas 13.70 17.53 22.44 28.72 36.76
Refinery 24.44 25.42 26.43 27.49 28.59
Sponge iron 3.71 3.82 3.93 4.05 4.17
Total 178.94 253.36 306.41 341.08 380.95
Figure 20 : Key Financial Ratios(Financial year)
Ratios 2012 2013 2014 2015 2016 2017
Operating Margin 9.9% 10.1% 9.8% 9.8% 9.7% 9.6%
Debt/Equity Ratio 1.15 1.12 1.12 0.91 0.79 0.71
Return on Equity 33% 32% 27% 31% 30% 27%
Assets turnover 7x 7.1x 5.3x 5.6x 5.4x 5.2x
Book Value 47 61 75 96 120 147
Int. Coverage 5.9x 6x 5.2x 5.9x 6.8x 7x
OCF/Sales 14% 14% 14% 14% 14% 14%
OCF/EBITDA 64% 63% 62% 62% 62% 62%
Debt/Ebitda 1.6x 1.6x 1.8x 1.6x 1.4x 1.3x
EPS 13.5 17.1 18.2 26.5 32.2 36.1
(In INR Cr unless specified)
Financial year
Source: Mercados Analysis 2010
Figure 7: Projected Sector-wise gas demand(mmscmd)
Source: Student Research

CFA Institute Research Challenge October 14, 2011
13
BALANCE SHEET
2011 2012 2013 2014 2015 2016 2017
SOURCES OF FUNDS :
Share Capital 750 750 750 750 750 750 750
Reserves Total 1930 2755 3812 4877 6452 8266 10300
Total Shareholders Funds 2680 3505 4562 5627 7202 9016 11050
Secured Loans 3036 3842 4858 5972 6215 6745 7401
Unsecured Loans 181 202 256 314 327 355 390
Total Debt 3216 4044 5114 6287 6542 7100 7790
Net Deferred Tax -348 -365 -384 -403 -423 -444 -466
Total Liabilities 5896 7183 9292 11511 13321 15671 18374
APPLICATION OF FUNDS :
Gross Block 3554 3560 5110 7310 9260 10760 12800
Less : Accumulated Depreciation 851 1055 1243 1534 1969 2083 2622
Net Block 2702 2505 3867 5776 7291 8677 10178
Capital Work in Progress 2203 3403 3903 3803 3223 2923 2800
Investments 1165 855 987 1243 1942 3153 4337
Current Assets, Loans & Advances
Inventories 248 343 407 468 651 787 880
Sundry Debtors 847 1032 1225 1409 1960 2368 2646
Cash and Bank 154 344 408 470 653 789 882
Loans and Advances 138 249 332 456 539 601 694
Total Current Assets 1387 1968 2371 2802 3805 4545 5102
Less : Current Liabilities and Provisions
Current Liabilities 1035 1315 1561 1796 2499 3018 3373
Provisions 179 232 275 317 441 533 595
Total Current Liabilities 1213 1548 1836 2112 2940 3551 3968
Net Current Assets 174 420 535 690 865 994 1134
Total Assets 5896 7183 9292 11511 13321 15671 18374
(In INR Cr unless specified)
Financial year

CFA Institute Research Challenge October 14, 2011
14
CASH FLOW STATEMENT
REAL OPTION VALUATION FOR LNG TERMINAL AT EAST COAST:
ASSUMPTIONS:
The investment schedule is expected to start from 2015
It is expected to contribute to topline and Bottomline from 2019 and a plant life of 20 years
The Tariffs and EBIT Margins would be similar to kochi
The capacity utilizations would ramp up gradually and attain the average utilization of 87.5%
Net of Depreciation addback and Investment in Capex and changes working capital would be zero for the projected years.
2011 2012 2013 2014 2015 2016 2017
Cash and Cash Equivalents at Beginning of the year 340.5 154 344 408 470 653 789
Cash flow From Operating Activities
Net Profit before Tax & Extraordinary Items 906.41 1504 1905 2029 2953 3586 4027
Depreciation 184.68 203 189 291 435 549 653
Interest (Net) 166.84 172 180 195 310 547 840
Dividend Received -24.69 -29 -37 -40 -48 -70 -77
Op. Profit before Working Capital Changes 1233.32 1850 2237 2475 3500 4312 4893
Trade & 0th receivables -343.69 -185 -193 -184 -552 -750 -775
Inventories -25.71 -95 -64 -61 -183 -390 -378
Trade Payables 291.53 281 245 235 535 590 355
Loans & Advances -28.41 -110 -83 -124 -83 -61 -94
Cash Generated from/(used in) Operations 1125.44 1741 2143 2340 3217 3701 4001
Direct Taxes Paid -217.92 -442.637 -560.856 -597.268 -869.222 -1055.61 -1185.25
Net Cash from Operating Activities 907.52 1298 1582 1743 2497 2945 3366
Cash flow from Investing Activities
Purchased of Fixed Assets -888.89 -1206 -1200 -1200 -1050 -1200 -1020
Interest Received 13.86 21 29 37 49 66 98
Dividend Received 24.7 29 37 40 48 70 77
Net Cash Used in Investing Activities -1476.57 -1465.65 -1266.09 -1378.42 -1831 -2564 -1745
Cash flow from Financing activirities
Proceed from 0ther Long Term Borrowings 935.71 829.5 753 750 566.5 838 0
Payments of Borrowings -219 -259 -750 -718 -597 -438 -1235
Dividend Paid -131.25 -188 -225 -300 -413 -600 -675
Others -21.8 -25 -30 -35 -40 -45 -50
Net Cash Used in Financing Activities 382.57 358 -252 -303 -483 -245 -1960
Net Inc/(Dec) in Cash and Cash Equivalent -186.48 190 64 61 184 136 -339
Cash and Cash Equivalents at End of the year 154.02 344 408 470 653 789 450
-900 -310 -132 -255 -878 -1500 Purchase of Investments(Net) -626.27
(In INR Cr unless specified)
Financial year

CFA Institute Research Challenge October 14, 2011
15
Scre
en cl
ipping
take
n: 10
/14/
2011
, 3:4
1 PM
FIN
AN
CIA
L M
OD
EL
FO
R R
EA
L O
PT
ION
VA
LU
AT
ION

CFA Institute Research Challenge October 14, 2011
16
Disclosures:
Ownership and material conflicts of interest:
The author(s), or a member of their household, of this report does not hold a financial interest in the securities of this company.
The author(s), or a member of their household, of this report does not know of the existence of any conflicts of interest that might bias the content or publication of this report.
Receipt of compensation:
Compensation of the author(s) of this report is not based on investment banking revenue.
Position as a officer or director:
The author(s), or a member of their household, does not serves as an officer, director or advisory board member of the subject company.
Market making:
The author(s) does not act as a market maker in the subject company’s securities.
Ratings guide:
Banks rate companies as either a BUY, HOLD or SELL.
Disclaimer:
The information set forth herein has been obtained or derived from sources generally available to the public and believed by the author(s) to be reliable, but
the author(s) does not make any representation or warranty, express or implied, as to its accuracy or completeness. The information is not intended to be used as the basis of any investment decisions by any person or entity. This information does not constitute investment advice, nor is it an offer or a
solicitation of an offer to buy or sell any security. This report should not be considered to be a recommendation by any individual affiliated with [Society
Name], CFA Institute or the CFA Institute Research Challenge with regard to this company’s stock.