Embed Size (px)
Citation preview
--—————=-———-——— ——__————-——- ————— —____ = ————— —. =._ —— — —————— -—— ———- -——— — .—-—__=e = ———= —— —__ ———=______—— ___—__s——— — ———= Mrru ——————————.—.
———— ——=
. IImBNliiilHltiHnFinal Data from the National Center for Health Statistics Vol. 31, No. 8, Supplement � November 30, 1982
.
9
Advance Report of Final Natality Statistics, 1980
Births and birth rates
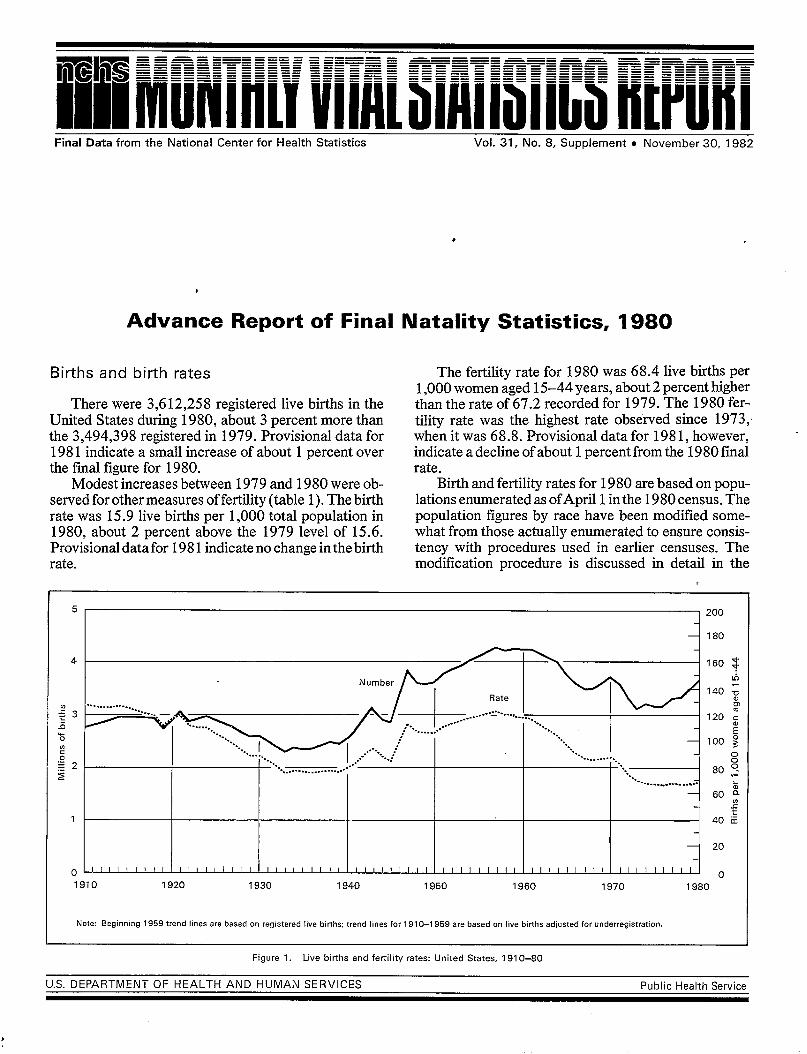
There were 3,612,258 registered live births in the United States during 1980, about 3 percent more than the 3,494,398 registered in 1979. Provisional data for 1981 indicate a small increase of about 1 percent over the final figure for 1980.
Modest increases between 1979 and 1980 were observed for other measures of fertility (table 1). The birth
— rate was 15.9 live births per 1,000 total population in 1980, about 2 percent above the 1979 level of 15.6. Provisional data for 1981 indicate no change in the birth rate.
5
I 4
..............
.... ....
.... I......... ..................
1
The fertility rate for 1980 was 68.4 live births per 1,000 women aged 15–44 years, about 2 percent higher than the rate of 67.2 recorded for 1979. The 1980 fertility rate was the highest rate observed since 1973, when it was 68.8. Provisional data for 1981, however, indicate a decline of about 1 percent from the 1980 final rate.
Birth and fertility rates for 1980 are based on populations enumerated as ofApril 1in the 1980 census. The population figures by race have been modtiled some-what from those actually enumerated to ensure consistency with procedures used in earlier censuses. The modification procedure is discussed in detail in the
200
180
%.-.............. .....
20
0 I I I I I I I I I 1 I 1 I 1 I I I I I I I I I I I I I I I I I I I I I I r I I I I I I I I I I I I I I I I I I I I I I I I I I r-l
1910 1920 1930 1940 1950 1960 1970 1980
Note: Beginning 1959 trend lines are based on reqstered live births; tm”d lines for 1910–1 959 are based on live births adjusted for underregistration.
Figure 1. Live births and fertility rates: United States, 1910-80
— U.S. DEPARTMENT OF HEALTH AND HUMAN SERVICES Public Health Service

.
---
---
---
-------
----
�
�
�
�
2 ~ Monthly Vital Statistics Report
300 300
. . . . . . . .
,*. . . . . .
,.. .
200 ,.”’”” 200 .4+- . -~--d’
25-29 ---w . . . .
. . . . . . . ..[ . . . . . . . . .
-+ *.. * /“ ? \
\ “%........ %,. \
\\ *. ‘-++. ““.
\ “. \< . . ...* .~
. -~x “.. .-- . . . >.*A. w#~ “
OM 30–34 - ~ ‘-100 10090 90
80 80
70 70
60 ~z. ~---.-zez=e~ 60
S.** 50 50
‘ .--.
40 -s-s 40
-. “.
30 ‘.‘. 30
‘. . .
. . . .
‘.
20 ‘.-.+ 20
-. -.. *--,,, ~
-., *•
.~-— “—- \.. —. 40-44
“L.
\
10 \ 10 9 ‘\ 9
8 8 \
7 7 \
6 6
5 \
5
‘\
‘L.- ~ 4 .
3 I I I 3
1950 1955 1960 1965 1970 1975 1980
Note: Beginning 1959 trend lines are basedon registered live births; trend lines for1950–1959 are basedon Iivebirths adjusted for underregistration.
Figure2, Birth ratasby ageofmothec United States, 1950-80

--------
----------
---------- ---
----
--
Technical notes. In addition, all birth and fertility rates for 197 1–79 have been revised for this report because of the unusually large difference between the 1980 census enumeration and the previously estimated population for that year. The 1980 census enumerated about 5.5 mil-lion more persons than were previously estimated for April 1, 1980. This “error of closure” differed in magnitude by age and by race. In order to make meaning@ and accurate trend comparisons from the 1970’s through 1980, all rates for 197 1–79 have been revised to reflect the 1980 census levels, and text references to rates for 1979 and prior years are based on the revised rates. The
Monthly Vital Statistics Report 3
revised populations are discussed in greater detail in the Technical notes.
The modest overall increases in fertility between 1979 and 1980 reflect comparably small increases in birthrates for women in the age groups 15–39 years (see tables 2, 3, and 4 for births and birth rates by age of mother). As in recent years, the largest increase was observed for women aged 30–34 years for whom the 1980 rate was 2.7 percent higher than the rate in 1979. The rate for women 20–24 years of age showed the second highest increase, 2.0 percent. The smallest measured increase, less than 1 percent, was in the rate for young
40 40 I —.._-._
30
-~ 30 -----------”---------._= - -—
:-~+’--1—
“’-+-:~[:---”””””20
10 9
_, 7
0 0“0” \ \
b\\
\ ‘\ -i--—
3
-_--. — e 10
9 %
8 —\ \ 8’
+---7 -% 7
P/---
I -~
-.--—- . ‘-w
-.
-1 -\—’
‘--’-’ ‘----------:
20
<.
-
— 6 6
— 5 <K-P’s+-+ 5
--+.-.--
4 H-M — \.– -k I ‘“-- �–- - -J 4
. N .-. —.-. -
0 0 3 3 0.
5 a 0 E 2 ““’”’:+k.a %..2
I \. -.- ....! -—f
1 1
0.9 0.9
0.8 0.8
0.7 0.7
0.6
0.5
0.4
0.3 I I I I I I I I I I I I I I I I I I I I I I I I 1 0.3
1950 1955 1960 1965 1970 1975 1980
Not& Beginning 1959 trend lines are based on registered live biflhs; trend lines for 1950–1959 are based m live births adjusted for underregistratim.
m Figure 3. Bitth rates by live-birth ordec United States, 1950-80
—

4 ~ Monthly Vital Statistics Report
teenage girls 15–17 years of age. The rate for teenagers under 15 years of age declined by 8.3 percent. There was no change in the birth rates for women aged 40 years and over.
Birth rates increased for first through fourth order births, with the largest increase observed for the first birth rate, 3.1 percent (table 5). Rates for second, third, and fourth order births increased from 0.9 to 2.6 percent. Rates for fifth and higher order births remained unchanged. The increase in the rate for first order births tended to be larger as maternal age advanced from 15–39 years and was again particularly concentrated at ages 30–34 years (8.5 percent) and 35-39 years (8.3 percent), continuing a pattern observed for the last several years. The slight over-all increase in the second order birth rate reflects little change in the rate for women under 30 years but there were notable increases for women aged 30–44 years.
Aside from increases from 4.2 to 4.7 percent in first birth rates for women in their twenties, there was relatively little change in the rates by live-birth order for these women. First and second order birth rates for teenagers increased slightly, but the increases were concentrated among the older teens aged 18–1 9 years. The first birth rate for the older teens increased by 1.2 percent.
There has been a clear trend of substantial increase in first order births for women in their thirties in recent years. The first birth rate for women 30–34 years of age increased 60 percent between 1975 and 1980. There were also sizable increases in the rates for women 35– 39 years (36.8 percent) and 25–29 (21.7 percent). The rates for second order births showed large increases for women in the age groups 30–44 years. In the 1975–80 period, the second order birth rate for women aged 30– 34 years increased by 38.9 percent, while the rates for women 35–39 and 40–44 years increased by 40.0 per-cent and 25.0 percent, respectively.
Between 1979 and 1980, the fertility rate for white women increased by 2.1 percent, to 64.7 births per 1,000 women aged 15–44 years. It is the highest level observed for this rate since 1973 (64.9). The fertility rate for black women declined slightly, by 0.2 percent, to 88.1 in 1980. Birth rates increased between 1979 and 1980 for white women in all age groups from 15 to 39 years, with the largest increases noted for women aged 30–34 years (2.4 percent) and 20–24 years (2.3 per-cent). The rate for white women aged 40–44 years declined 2.9 percent, while rates for women under 15 years and 45–49 years were unchanged. Birth rates for black women declined for all teenagers and for women aged 35 years and over. The rate for women 20–24 years was unchanged, while the rates increased by 0.8 percent for women 25–29 and by 3.6 percent for women 30–34 years.
First birth rates for white women were notably higher for all women aged 15–39 years, and were unchanged
for women under 15 years and 40 years and over. There were also sizable increases in second order birth rates for white women in their thirties. Among black women aged 25–39 years, first and second order birth rates increased considerably. In addition, rates for third and fourth order births for black women generally increased.
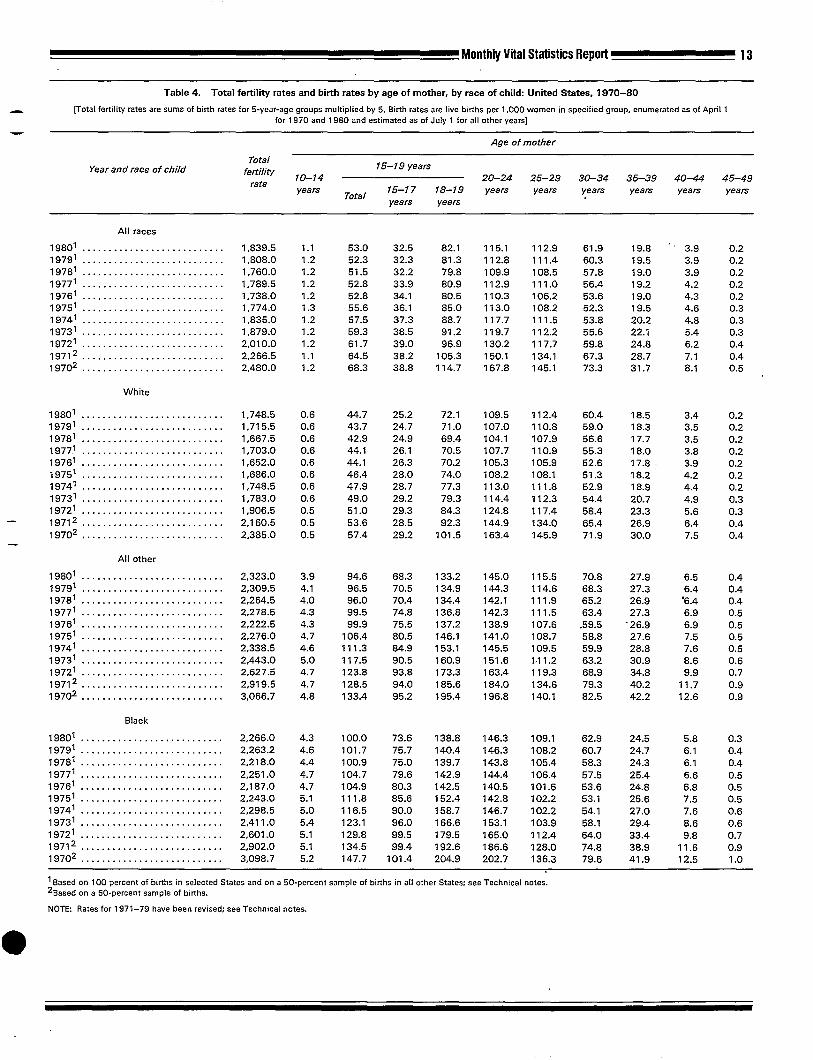
The total fertility rate indicates the number of births that 1,000 women would have ifthey experienced through-out their childbearing years the set of age-specific birth rates observed in a given calendar year. It shows the implications of current levels of fertility for completed family size. In 1980 this rate was 1,839.5 per 1,000 women, 1.7 percent above the rate of 1,808.0 for 1979.
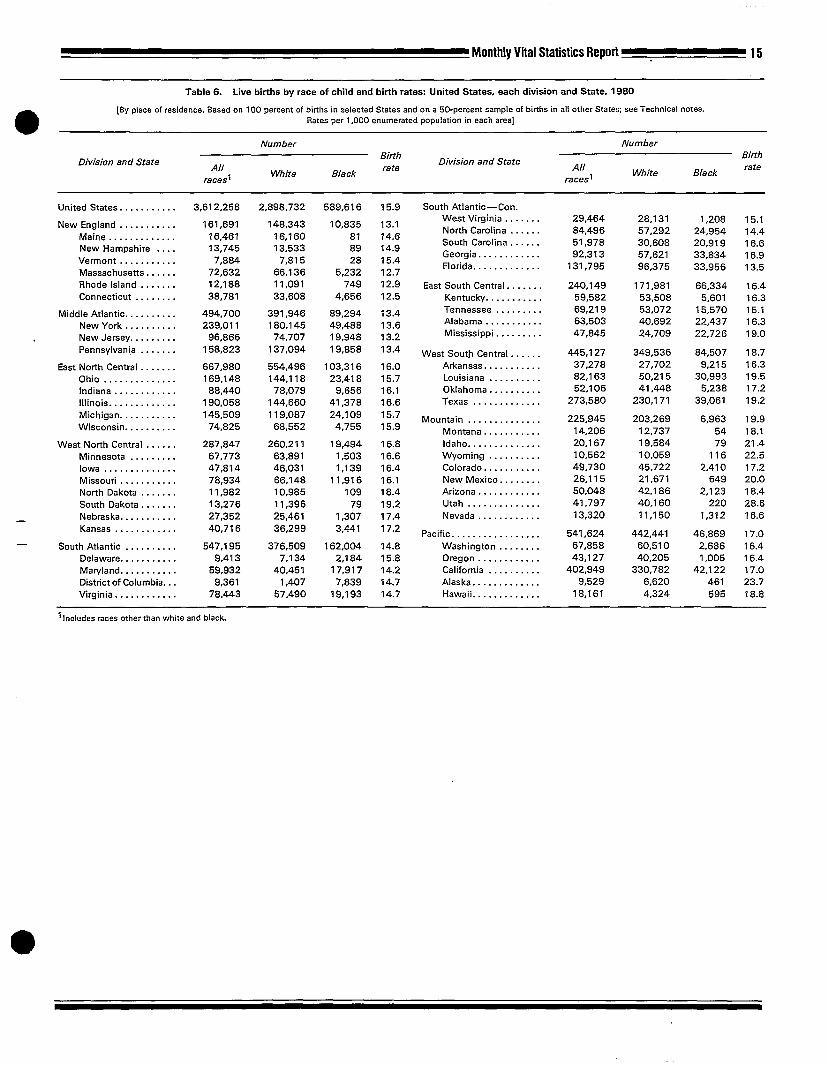
The number of births increased in all nine geographic divisions, with the increases ranging from 0.9 percent (Middle Atlantic Division) to 6.2 percent (West South Central Division) (1980 data are shown in table 6). The number of births increased in all registration areas except for the District of Columbia, which re-ported a decline of 1.6 percent, and West Virginia, with a decline of 1.2 percent. The increases ranged from 0.1 percent in Connecticut to 8.8 percent in Florida.
Birth rates for all nine geographic divisions were higher in 1980 than in 1979. The increases ranged from 0.8 percent for the Middle Atlantic Division to 3.9 per-cent for the West South Central Division. The rates in-creased for 43 States and the District of Columbia, ranging from 0.6 percent for Alabama, Indiana, Kentucky, and Michigan, to 5.7 percent for New Hampshire. There were declines of 0.5 percent for Idaho, 0.7 percent for North Carolina, 1.4 percent for Utah, ,md 1.9 percent for West Virginia. The rates were unchanged for Connecticut, New Mexico, and Tennessee.
Sex Ratio
The sex ratio at birth in 1980 was 1,053 male births per 1,000 female births compared with the ratio of 1,052 in 1979 (table 7).”The ratio has been measured within a range of 1,047 to 1,059 since 1940.
There are variations in the sex ratio by specified race. In 1980 the ratio for white births was 1,058; for black births, 1,029; and for American Indian births, 1,042. Since 1940 the ratio for white births has consistently been higher than that for black births.
Month of birth
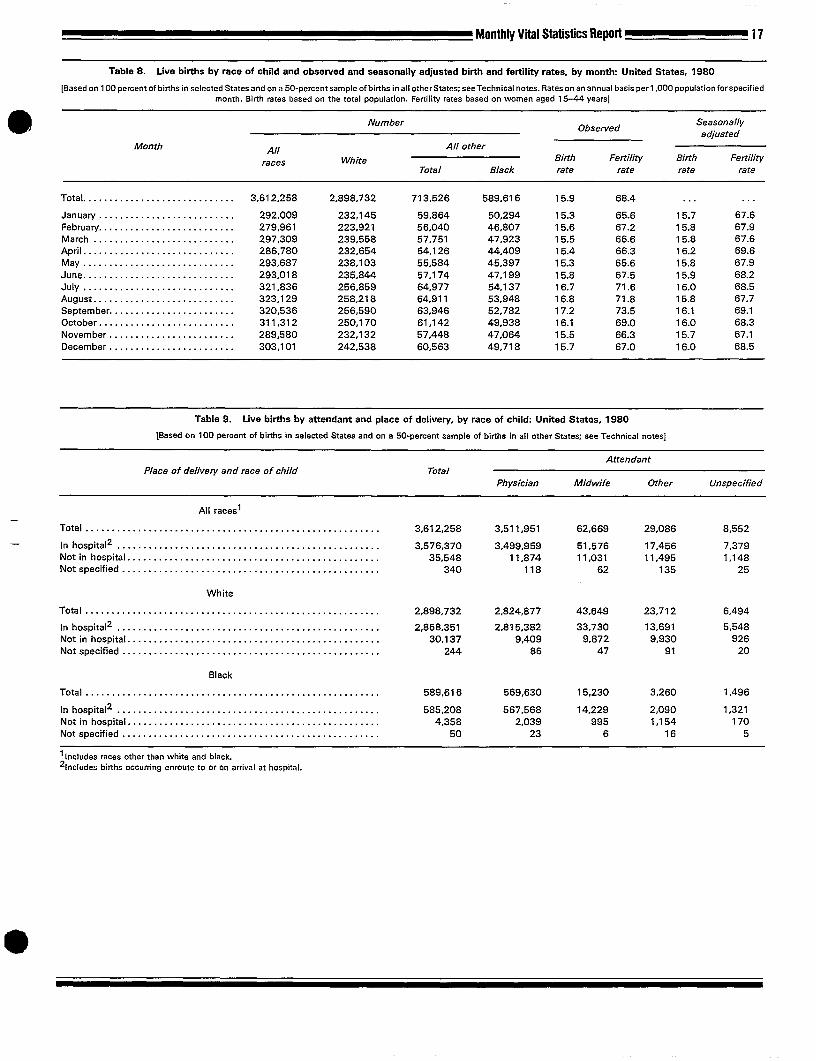
A consistent pattern in the monthly occurrence of births has been observed for many years, with the peak in August or September. Removal of the seasonal component from the monthly birth and fertility rates facilitates the observation of the underlying trends. Seasonally adjusted fertility rates in 1980 were erratic, with no clear pattern emerging (table 8). Provisional data for 1981 again show no consistent pattern in the rates

Monthly Vital Statistics fleport~ 5
except that the rates in the first quarter were somewhat higher than those in the remainder of the year..—
‘)
/.
n
Place of delive~ and attendant at birth
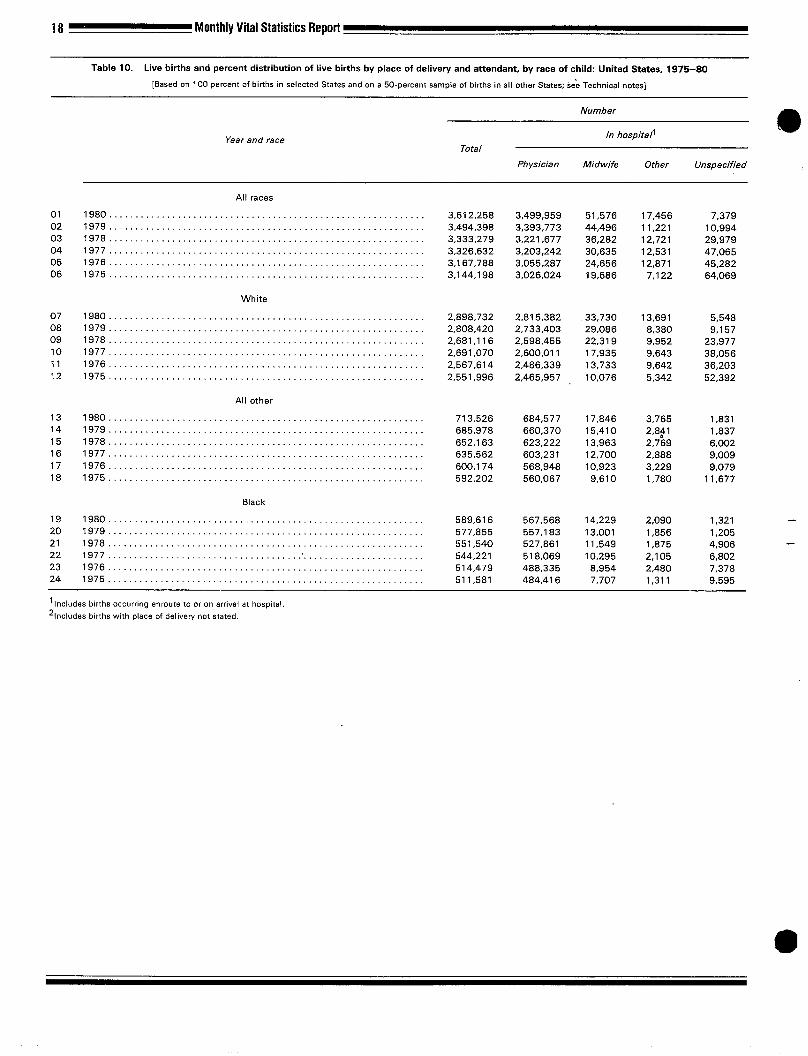
The proportion of all babies born in a hospital in 1980 was the same as in 1979,99.0 percent. Black infants are slightly more likely than white infants to be born in a hospital, 99.3 percent compared with 99.0 per-cent (table 9). Physicians delivered 97.9 percent of the births occurring in hospitals, a slight decline from the 98. l-percent level in 1979. In 1980, midwives attended 1.4 percent of all in-hospital deliveries compared with 1.3 percent in 1979.
Midwives continued to deliver more babies in 1980, both in and out of hospitals, although the numbers of these births are still small. In 1980 there were 62,669 midwife-attended deliveries, a 14.2-percent increase over the 54,859 births in 1979 (table 10). Among white births, there was a 15.O-percent overall increase in the number of midwife-attended deliveries. The comparable increase among black births was 6.1 percent. Mid-wives attended a larger share of both white and black in-hospital births in 1980 than in 1979. By contrast, although there was a larger fraction of white out-of-hospital births attended by midwives in 1980 than in 1979, there was a decline in the proportion of black out-of-hospital deliveries attended by midwives.
Age of father
The birth rate for men in 1980 was 57.0 live births per 1,000 men aged 15–54 years. This rate was 2.2 per-cent higher than the revised rate of 55.8 for 1979 (see table 11 for basic data and table 12). The rate for white men increased from 51.6 to 52.9 (2.5 percent), while the rate for black men increased very slightly, from 83.7 to 83.8 (O.1 percent).
Rates increased in every age group through 45-49 years. However, there was no consistent pattern in the rates by race. Among white men, increases were largest for teenagers and men aged 20–24, 30–34, and 55 years and over. Rates for black men in their twenties and early fifties declined. Except for black men aged 40-44 years, for whom the rate increased 2.6 percent, and men aged 55 years and over, with a 9.1 percent increase, the in-creases in other rates for black men were less than 1 percent.
Weight at birth
In 1980,6.8 percent of all births were classified as being of low birth weight, a slight decline from the level of 6.9 percent observed in 1979. Low birth weight is de-fined as less than 2,500 grams (5 pounds 8 ounces), in
accordance with the definition established in the Ninth Revision of the International Classitlcation of Diseases.
The proportion low birth weight declined slightly for both white and black infants. As in previous years, however, there persists a substantial racial differential in the incidence of low birth weight: The levels in 1980 were 12.5 percent for black births and 5.7 percent for white births.
Mothers aged 25–29 and 30–34 years are least likely to give birth to low-weight infants, while teenage mothers and mothers in their forties are most likely to bear low-weight babies. In 1980 the level of low birth weight for births to teenagers under 15 years of age (14.6 percent) was 2.5 times the levels observed for babies born to mothers aged 25–29 years (5.8 percent) and 30–34 years (5.9 percent) (table 13).
There were declines between 1979 and 1980 in the levels of low birth weight for births to mothers aged 17-29 years and 35 years and over. The declines were very modest in most age groups but ranged from 2 to 5 per-cent for births to mothers aged 19 years and 35 years and over. The proportion increased slightly for births to mothers under 15 years of age, 14.5 to 14.6 percent.
The median birth weight of infants born in 1980 was 3,360 grams (equivalent to approximately 7 pounds 7 ounces), unchanged from the median for 1979. The medians for white and black births increased, however, by 10 grams each, to 3,410 for white births (approximately 7 pounds 8 ounces) and 3,170 grams for black births (7 pounds). The racial difference of 240 grams in birth weight is equivalent to about 8% ounces.
The number and percent of low-birth-weight infants by race for each State are shown in table 14. Although there is variation in the percent low birth weight from State to State within each raoial group, the amount of variation is not significantly different for white and black births when the 6 States with fewer than 100 black births are excluded from the comparison. The coeiTicient of variation was 11.8 percent for white births and 14.5 percent for black births.
Multiple births
There were 69,676 live births in multiple deliveries (twins, triplets, quadruplets, etc.) during 1980. More than 98 percent of these were live births in twin deliveries (68,3 39 births). The multiple birth ratio was 19.3 live births in multiple deliveries per 1,000total live births, a decline from the 1979 ratio of 19.5. The decline in the multiple birth ratio is related to the continued decline in high order births which have previously been associated with a greater incidence of multiple births.
The multiple birth ratio for black births has consistently been higher than the ratio for white births. In 1980 the ratios were 24.1 for black births and 18.5 for white births.
6 ~ Monthly Vital Statistics Report
Multiple birth ratios tend to increase with advancing maternal age, generallyupto ages 35–39 years. In 1980 the multiple birth ratio for births to mothers aged 35–39 was 25.8, nearly twice the ratio for births to mothers 15-19 years of age (13.1).
Births to unmarried women
National statistics on births to unmarried women in 1980 are derived from two sources. For 41 States and the District of Columbia, marital status of mother is re-ported directly on the birth certificate; for the remaining 9 States, which lack such an item, marital status is inferred from a comparison of the child’s and parents’ surnames. This procedure, which is described in more detail in the Technical notes, represents a significant departure from the method used in previous years to pre-pare national estimates of births to unmarried women. Because of this method change and its differential effect on the various age and racial groups, the changes in the incidence of births to unmarried women between 1979 and 1980 must be interpreted with caution.
There were 665,747 births to unmarried women in 1980, an increase of 11.4percent over the 597,800 estimated for 1979 (table 15). Nearly one-third of this increase was due to the change in the method of preparing national figures. If the method had not changed, the 1980 estimate would have been 645,000 births, representing a 7.9-percent increase over the 1979 level. See the Technical notes for a complete tabulation of these figures by age of mother and race of child.
Increases occurred for both white and black births to unmarried women, but the increase was much greater for white births. There were 320,063 white births, a 21.7-percent increase over the 1979 estimate, and 325,737 black births, 3.1 percent more than were estimated for 1979. The impact of the change in compiling the national data differs substantially by race. Almost half of the increase in white births between 1979 and 1980 was due to the change in method. For black births, however, the increase would have been greater without a change in method.
The rate of childbearing among unmarried women continued to increase between 1979 and 1980. In 1980 this was 29.4 births per 1,000 unmarried women 15–44 years of age, the highest rate ever observed; it was 8.1 percent higher than the 1979 rate of 27.2. Nearly half of the increase between 1979 and 1980 is attributable to the method change in preparing birth statistics for unmarried women. The birth rates for unmarried women for the 1970’s have been revised to reflect the higher population levels indicated by the 1980 census (see Technical notes). These rates are shown in table 16.
The overall increase in the rate of childbearing among unmarried women was due solely to the substantial rise in the rate for unmarried white women, for whom the
rate was 17.6 in 1980. This was 18.1 percent higher than the revised 1979 rate of 14.9. Among black women, the nonmarital birthrate declined slightly, from 83.0 in 1979 to 82.9 in 1980. Without a change in the method, the 1980 rate for white women would have increased only half as much, while the rate for black women would have increased less than 1 percent.
Rates of nonmarital childbearing by age continued to be highest for women 20–24 years of age, with a rate of 40.9 in 1980. The rate for women aged 18–19 years was also high (39.0). Regardless of the method considered, the rates increased between 1979 and 1980 for all age groups under 30 years. For women ages 30 years and over, there were considerable increases in the rates as a result of the new method; if the method had not changed, the rates for these women would have declined.
The increases in the number of births to unmarried women in 1980 are due to a combination of two factors, a higher rate of childbearing by unmarried women and the growth in the number of unmarried women of child-bearing age. It is difficult to determine precisely the weight of each of these factors because it varies substantially by race and by age. However, it is clear that the growth of the population of unmarried women at ages 25 years and over continues to be a significant factor in the recent large increases in births to these women. By contrast, the number of unmarried teenagers has leveled off and begun to decline in recent years; the continued rise in births to these women is thus due to the increased rate of childbearing among unmarried teens.
The ratio of births to unmarried women per 1,000 total live births was 184.3 in 1980 compared with171. 1 in 1979. The ratio for white births was 110.4; it was 552.5 for black births. If the estimation procedure for counting nonmarital births had not changed, these ratios in 1980 would have been 178.6 for total births, 101.8 for white births, and 556.0 for black births. Numbers of births to unmarried women and ratios for each State, by race, are shown in table 14.
Interval since last live birth
In 1980, 48 States and the District of Columbia reported the date of the mother’s last live birth on the birth certificate. This information combined with date of present birth permits the calculation of intervals be-tween successive births. Interbirth intervals can be calculated for all second and higher order births and are shown in table 17.
During the past several years a consistent pattern of increase has been observed in the proportion of all second and higher order births occurring at short intervals. In 1980, 13.2 percent of all births occurred within 18 months of the mother’s previous live birth compared with 12.8 percent in 1979. There were increases as well

�
Monthly VitalStatisticsReport~ 7
.
0,
in the proportion of births occurring within 2 and 3 years of the mother’s previous live birth. In 1980, 27.5 per-cent of all second and higher order births occurred within 2 years of the mother’s previous live birth compared with 26.6 percent in 1979:51.4 percent occurred within 3 years of the previous live birth compared with 50.6 percent in 1979. (Births occurring at intervals of zero months have been excluded from the above calculations.)
Black infants are more likely than white infants to be born at very short intervals. For example, 17.3 percent of black babies compared with 12.2 percent of white babies followed their mother’s previous Iivebirthby less than 18 months.
Interbirth intervals tendtobe shortened as live-birth order advances. In 1980, 12.2 percent of second order births occurred within 18 months of the previous live birth compared with 21.1 percent of all eighth and higher order births.
Educational attainment of mother and father
Educational attainment of parents was reported on the birth certificates of 47 States and the District of Columbia in 1980. The proportion of mothers and fathers completing at least 12 years of school continued to in-crease in 1980, as it has in every year since 1969, which was the first year this information became available. In 1980,76.3 percent ofmothers and 82.2 percent offathers had at least completed high school. The median years of school completed by mothers was 12.6 years and by fathers, 12.8. (See table 18 for basic data.)
Just as the proportion of parents with at least a high school education has grown, the proportion with 8 or fewer years of formal education has continued to decline. In 1980, 4.3 percent of mothers and 4.2 percent of fathers were in this category. Births to very well-educated parents also continue to account for a larger fraction of all births. Forexarnple, in 1980,14.0 percent of mothers and 22.2 percent of fathers had completed at least 4 years of college.
In spite of the educational gains made by black parents in recent years, there continue to be large racial differences in educational attainment, although the differences tendtobe greater for mothers. In 1980,79.3 percent of white births and 63.8 percent of black births were to mothers with at least a high school diploma, while 83.1 percent of white births and 75.9 percent of black births were to fathers with at least 12 years of schooling.
There is a clear pattern for educational attainment to increase as age of mother advances, up to ages 30–34, afterwhichthere is a decline (table 19). The very youngest mothers have not had the same opportunity to complete their educations as have mothers in their twenties, and older.
The median years of education in 1980 was highest
for mothers aged 30–34 years ( 13.5 years), followed by mothers aged 25–29 years (12.9) and 35–39 years (12.8). These relationships by age of mother are similar for white and black births.
Month of pregnancy prenatal care began
The proportion of births to mothers who began pre-natal care in the frost trimester of pregnancy continued to increase in 1980, as it has over the past 11 years for which this information has been available. In 1980, 76.3 percent of all births were to mothers who began prenatal care in the first 3 months of pregnancy. Data on this topic were available from all 50 States and the District of Columbia for the first time in 1980 (tables 20 and 21). �
Black mothers continued to make greater gains than white mothers in the proportion receiving early care, thereby narrowing slightly the persistent racial differential in receipt of prenatal care. In 1980,62.7 percent of black mothers and 79.3 percent of white mothers began prenatal care in the fust 3 months of pregnancy. The proportion of white mothers receiving delayed (commencing in the third trimester) care or no care in 1980 was unchanged horn 1979, 4.3 percent, while among black mothers, the proportion declined slightly, from 8.9 per-cent in 1979 to 8.8 percent in 1980.
Mothers aged 25–29 and 30–34 years are most likely to receive care in the first trimester of pregnancy. In 1980 the proportions were 84.0 percent and 84.4 percent, respectively, for these two age groups. In contrast, fewer than half of the mothers aged 16 years and under received care early. The proportions of these very young mothers receiving delayed or no care were 4 to 7 times the levels observed for mothers in the age groups 25–34 years.
Number of prenatal vkks
In 1980,48 States and the District of Columbia re-ported the number of visits made for prenatal care on their birth certificates, an increase of 1 State from the 1979 reporting area. The median number of visits made for prenatal care by mothers having any prenatal care was 11.2 in 1980, the same as it was in 1979. The medians for white and black mothers each increased slightly in 1980, from 11.5 to 11.6 for white mothers, and from 10.1 to 10.2 for black mothers. (Basic data for 1980 are shown in table 22.)
As would be expected, the median number of pre-natal visits is closely associated with the point in the pregnancy at which prenatal care began (table 23). Early care is associated with more visits than is late care. Mothers beginning care in the first trimester had a median of 12.1 visits compared with 4.7 visits for those whose care dld not commence until the last trimester.

VitalStatistics8 ~ Monthly Report
Between 1979 and 1980, the median number of visits increased slightly or was unchanged for both white and black mothers beginning care in the first, second or third trimester except for a slight decline for white mothers whose care was delayed until the third trimester.
Some of the racial differential observed in the number of prenatal visits is related to the tendency for white mothers to begin care earlier in pregnancy than black mothers. When the medians are compared for mothers who began care at the same time in their pregnancies, the racial difference is reduced. The median number of visits according to trimester for white births in 1980 was 12.2 for the first trimester, 9.0 for the second trimester, and 4.9 for the third trimester. The medians for black births were 11.3, 8.2, and 4.4 visits, respectively.
Period of gestation
The length of gestation, measured from the first day of the mother’s last normal menstrual period to the date of birth, was reported on the birth certificates of 48 States and the District of Columbia in 1980, an increase of 1 State from the 1979 reporting area.
Babies who are born prior to 37 completed weeks of gestation are classified as “preterm.” In 1980,8.9 per-cent of all births were preterm, unchanged from the 1979 level. Nearly three-quarters (74.5 percent) of births in 1980 occurred at term, defined as 37–41 weeks of gestation (see table 24 for basic data). As in prior years, black infants in 1980 were about twice as likely as white infants to be born preterm. h 1980,16.1 percent of black babies and 7.5 percent of white babies were preterm. The proportions were unchanged from 1979.
The incidence of low birth weight is closely associated with length of gestation. Among infants born before 37 weeks of gestation, 40.3 percent weighed less than 2,500 grams (5 pounds 8 ounces). The incidence of low birth weight was only 3.0 percent among term and post-term infants. When the level of low birth weight according to length of gestation is compared for white and black births, it is seen that the racial differential in low birth weight is almost entirely associated with term and post-term births. Arnongpreterm births, 39.8 percent of
white infants and 42.5 percent of black infants were of low birth weight. The proportions of low birth weight among term and post-term births were 2.5 percent for white and 5.9 percent for black infants.
Apgar score
The Apgar score is a summary measure used to evaluate the newborn infant’s overall physical condition at birth. The score is a composite evaluation of five factors—the infant’s heart rate, respiratory effort, muscle tone, irritability, and color—each of which is assigned a value from Oto 2. The overall score is the sum of the five values, with a score of 10 being optimum. In 1980,44 States reported the score at 1 minute afterbirth, and 43 States and the District of Columbia reported the 5-minute score; the reporting areas each increased by 3 States.
Since 1978, when data on the Apgar scores first be-came available, there has been a decline in the proportions of births with high scores (9 or 10) at both 1 and 5 minutes after birth. In 1980, 46.5 percent of l-minute scores and 88.0 percent of 5-minute scores were 9 or 10. The proportions of infants receiving perfect 10 scoresat both 1 and 5 minutes have also declined during this period. Black and white infants were almost equally likely to receive scores of 9 or 10 at 1 minute, while white infants were more likely to receive high scores at 5 minutes (table 25).
Scores from Oto 3, indicating a severely depressed status, were assigned to virtually the same proportions ofinfantsin 1978, 1979, and 1980. In 1980,2 .2percent of babies received scores in the Oto 3 range at 1minute, while 0.6 percent of babies received these scores at 5 minutes. Generally, black infants were about twice as likely as white infants to receive scores from O to 3 at both 1 and 5 minutes. A large portion of this racial differential is probably associated with the similar racial differential in the incidence of low birth weight which is very closely associated with unfavorable Apgar scores.
Generally, 5-minute scores reflected considerable improvement over 1-minute scores, except of course when 1-minute scores were already optimum. The 5-minute scores for white babies tended to improve some-what more than for black infants when the 1-minute scores were severely depressed (table 26).
.
—.
0

Monthly Vital Statistics lleport~ 9
Table 1. Live births, birth rates, and fertility rates, by race of child: United States, specified years 1940-60 and each year 1965–80
[Birth rates per 1,000 population in specified group. Fertility rates per 1,000 women aged 15-44 years in specified group. Population enumerated as of April 1 for census years
and estimated as of July 1 for all other years. Beginning 1970 excludes births to nonresidents of the United States]
Number Birth rate Fertility rate
Year All other All other All other All All All
White White White races races races
Total Black Total Black Total Black
Registered births
19801 . . . . . . . . . . . . . . . . . 3,612,258 2,898,732 713,526 589,616 15.9 14.9 22.5 22.1 68.4 64.7 88.6 88.1
19791 . . . . . . . . . . . . . . . . . 3,494,398 2,808,420 685,976 577,655 15.6 14.5 22.2 22.0 67.2 63.4 88.5 88.3
19781 . . . . . . . . . . . . . . . . . 3,333,279 2,681,116 652,163 551,540 15.0 14.0 21.6 21.3 65.5 61.7 87.0 86.7
19771 . . . . . . . . . . . . . . . . . 3,326,632 2,691,070 635,562 544,221 15.1 14.1 21.6 21.4 66.8 63.2 87.7 88.1
19761 . . . . . . . . . . . . . . . . . 3,167,788 2,567,614 600,174 514,479 14.6 13.6 20.8 20.5 65.0 61.5 85.6 85.8
19751 3,144,198 2,551,996 592,202 511,581 14.6 13.6 21.0 20.7 66.0 62.5 87.7 87.9
19741::::::::::::::::: 3,159,958 2,575,792 564,166 507,162 14.6 13.9 21.2 20.8 67.8 64.2 89.8 89.7
19737 3,136,965 2,551,030 585,935 512,597 14.8 13.8 21.7 21.4 68.8 64.9 93.4 93.6
19721::::::::::::::::: 3,258,411 2,655,558 602,853 531,329 15.6 14.5 22.8 22.5 73.1 68.9 99.5 99.9
19712 . . . . . . . . . . . . . . . . . 3,555,970 2,919,746 636,224 564,960 17.2 16.1 24.6 24.4 81.6 77.3 109.1 109.7
19702 . . . . . . . . . . . . . . . . . 3,731,386 3,091,264 640,122 572,362 18.4 17.4 25.1 25.3 87.9 84.1 113.0 115.4
19692 . . . . . . . . . . . . . . . . . 3,600,206 2,993,614 606,592 543,132 17.9 16.9 24.5 24.4 86.1 82.2 111.6 112.1
19682 . . . . . . . . . . . . . . . . . 3,501,564 2,912,224 589,340 531,152 17.6 16.6 24.2 24.2 85.2 81.3 111.9 112.7
19673. . . . . . . . . . . . . . . . . 3,520,959 2,922,502 596,457 543,976 17.8 16.8 25.0 25.1 87.2 82.8 117.1 118.5
19662 . . . . . . . . . . . . . . . . . 3,606,274 2,993,230 613,044 558,244 18.4 17.4 26.1 26.2 90.6 86.2 123.5 124.7
19652 . . . . . . . . . . . . . . . . . 3,760,358 3,123,860 636,496 581,126 19.4 18.3 27.6 27.7 96.3 91.3 131.9 133.2
19602 . . . . . . . . . . . . . . . . . 4,257,850 3,600,744 657,106 602,264 23.7 22.7 32.1 31.9 118.0 113.2 153.6 153.5
Births adjusted
for underregistretion
1955 . . . . . . . . . . . . . . . . . . 4,097,000 3,485,000 613,000 . . . 25.0 23.8 34.5 -.. 116.3 113.7 154.3 . . .
1950 . . . . . . . . . . . . . . . . . . 3,632,000 3,108,000 524,000 .-. 24.1 23.0 33.3 . . . 106.2 102.3 137.3 -..
1945 . . . . . . . . . . . . . . . . . . 2,858,000 2,471,000 386,000 . . . 20.4 19.7 26.5 . . . 85.9 83.4 106.0 -.. — 1940 . . . . . . . . . . . . . . . . . . 2,559,000 2,199,000 360,000 . . . 19.4 18.6 26.7 . . . 79.9 77.1 102.4 -..
— 1 Based ~“ 100 Percent of bi~h~ in selected States and on a W-percent sample of births in all other States: see Technical notes
2Ba~ed ~“ ~ so-percent sample of births.
3Ba~ed ~“ ~ 20. to so-percent sample of biflhs.
NOTE Rstes for 1971-79 have been revised; see Technical notes.

Table 2. Live births by age of mother, live-birth order, and race of child: United Statea, 1980
[Based on 100 percenk of births in selected States and on a 50-percent sample of births in all other States; see Technical notes. Live-birth order refers to number of children born alive to mother]
Age of mother
Live- biflh order All 15– 19 years
and race of child ages Under
20–24 25–29 30–34 35–39 40–44 45–49 15 15 16 17 18 19 years years years years years years
years Total years years years years years
All races
Total . . . . . . . . . . . . . . . . . . . 3,612,258 10,169 552,161 28,176 63,198 106,846 153,333 200,606 1,226,200 1,108,291 550,354 140,793 23,090 1,200
First child . . . . . . . . . . . . . . . 1,545,604 9,657 425,676 26,206 56,278 86,832 116,551 137,809 605,183 371,859 112,964 18,241 1,964 60 Second child..........,.. 1,144,367 256 100,966 1,385 5,455 14,817 29,959 49,350 420,250 408,118 182,434 29,597 2,667 79 Third child. . . . . . . . . . . . . . . 537,393 13 15,816 53 375 1,540 4,297 9,551 142,749 209,311 134,551 31,649 3,206 98 Fourth child . . . . . . . . . . . . . . 202,271 6 2,104 7 20 111 508 1,458 36,577 73,277 63,606 23,026 3,536 139 Fifth child . . . . . . . . . . . . . . . 78,965 263 5 13 54 191 8,633 24,479 27,958 14,515 2,975 142 Sixth child . . . . . . . . . . . . . . . 35,146 31 2 4 25 1,987 8,629 12,917 9,118 2,343 121 Seventh child . . . . . . . . . . . . 17,160 6 2 4 457 2,951 6,380 5,485 1,764 117 Eighth child and over. 20,592 18 7 11 194 1,622 5,641 8,198 4,482 437 Not stated . . . . . . . . . . . . . . . 30,760 237 7,281 527 1,065 1,531 1,951 2,207 10,170 8,045 3,903 964 153 7
White
Total . . . . . . . . . . . . . . . . . . . 2,898,732 4,171 388,058 14,979 39,685 72,993 110,178 150,223 982,526 933,159 459,151 113,124 17,652 691
First child . . . . . . . . . . . . . . . 1,263,000 4,037 309,175 14,235 36,359 62,930 87,449 108,202 509,537 326,675 96,900 15,071 1,556 49 Second child . . . . . . . . . . . . . 935,302 68 65,452 524 2,652 8,437 19,282 34,557 336,623 351,202 155,771 24,083 2,047 56 Third child . . . . . . . . . . . . . . . 422,578 8 8,093 11 116 666 2,040 5,260 101,477 170,934 113,385 26,048 2,553 80 Fourth child . . . . . . . . . . . . . . 149,952 5 865 3 13 38 183 628 21,776 54,001 51,410 19,006 2,780 109 Fifth child . . . . . . . . . . . . . . . 55,719 87 1 5 24 57 4,233 16,136 21,272 11,508 2,373 110 Sixth child . . . . . . . . . 24,063 12 1 1 10 848 5,018 9,324 6,944 1,821 96 Seventh child . . . . . . . . . . . . 11,553 3 2 1 176 1,597 4,298 4,069 1,331 79 Eighth child and over. . . . . . 13,419 11 6 5 109 795 3,499 5,620 3,079 306 Not stated . . . . . . . . . . . . . . . 23,146 53 4,360 544 916 1,191 1,503 7,747 6,801 3,292 775 112 6
All other
Total . . . . . . . . . . . . . . . . . . . 713,526 5,998 164,103 13,199 23,513 33,853 43,155 50,383 243,674 175,132 91,203 27,669 5,438 309
First child . . . . . . . . . . . . . . . 282,604 5,620 116,501 11,971 19,919 25,902 29,102 29,607 95,646 45,184 16,064 3,170 408 11 Second child . . . . . . . . . . . . . 209,065 188 35,514 861 2,803 6,380 10,677 14,793 83,627 56,916 26,663 5,514 620 23 Third child . . . . . . . . . . . . . . . 114,815 5 7,723 42 259 874 2,257 4,291 41,272 38,377 21,166 5,601 653 18 Fourth child . . . . . . . . . . . . . . 52,319 1 1,239 4 7 73 325 830 14,801 19,276 12,196 4,020 756 30 Fifth child . . . . . . . . . . . . . . . 23,246 176 4 8 30 134 4.400 8,343 6,686 3,007 602 32 Sixth child . . . . . . . . . . . . . . . 11,083 19 1 3 15 1,139 3,611 3,593 2,174 522 25 Seventh child . . . . . . . . . . . . 5,607 3 3 281 1.354 2,082 1,416 433 38 Eighth child and over. . . . 7,173 7 1 6 85 827 2,142 2,578 1,403 131 Not stated . . . . . . . . . . . . . . . 7,614 184 2,921 321 521 615 760 704 2,423 1,244 611 189 41 1
.
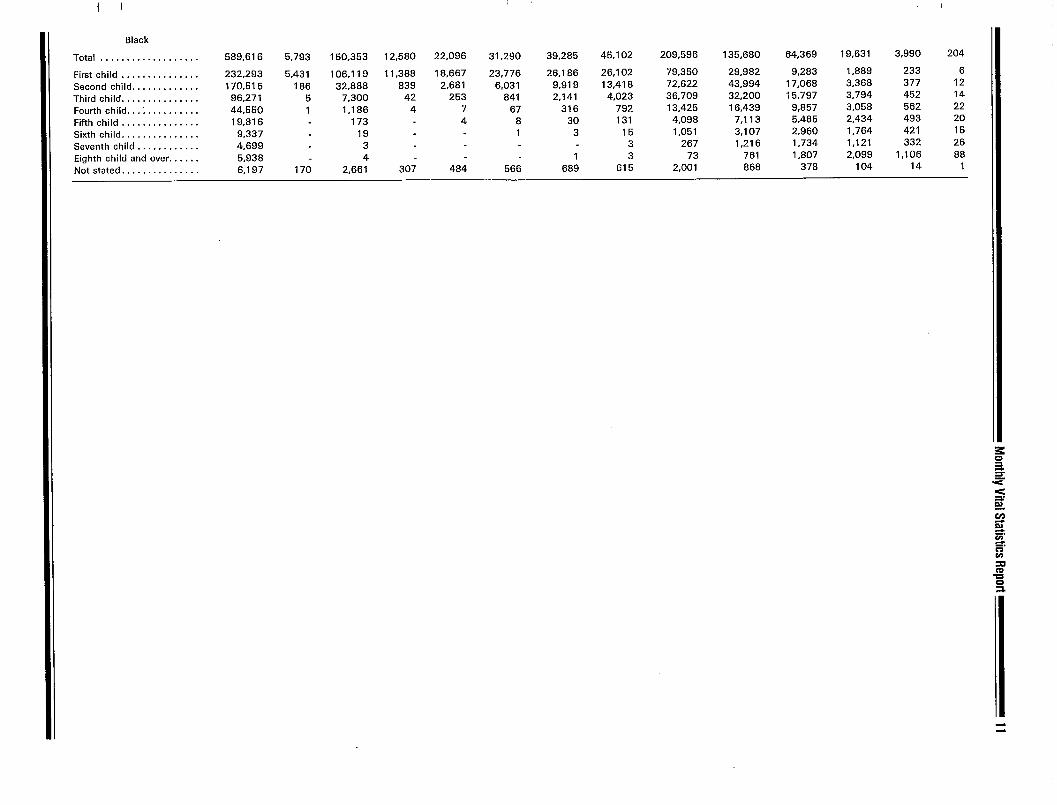
Black
Total . . . . . . . . . . . . . . . . . . .
First child . . . . . . . . . . . . . . . Second child . . . . . . . . . . . . .
Third child . . . . . . . . . . . . . . . Fourth child. . .: . . . . . . . . . . Fifth child . . . . . . . . . . . . . . . Sixth child . . . . . . . . . . . . . . .
Seventh child . . . . . . . . . . . .
Eighth child and over . . . . . . Not stated . . . . . . . . . . . . . . .
589,616 5,793 150,353 12,580 22,096 31,290 39,285 45,102 209,596 135,680 64,369 19,631 3,990 204
232,293 5,431 106,119 11,386 18,667 23,776 26,186 26,102 79,350 29,982 9,283 1,889 233 6
170,515 166 32,888 839 2,681 6,031 9,919 13,418 72,622 43,994 17,068 3,368 377 12
96,271 5 7,300 42 253 841 2,141 4,023 36,709 32,200 ; 5,797 3,794 452 14
44,550 1 1,186 4 7 67 316 792 13,425 16,439 9,857 3,058 562 22
19,816 173 4 8 30 131 4,098 7,113 5,485 2,434 493 20
9,337 19 1 3 15 1,051 3,107 2,960 1,764 421 15
4,699 3 3 267 1,216 1,734 1,121 332 26
5,938 4 1 3 73 761 1,807 2,099 1,106 86
6,197 170 2,661 307 484 566 689 615 2,001 868 378 104 14 1

12 ~ Monthly Vital Statistics Report
Table 3. 6i~hratea byageof mother, live-bifih Order, andrace &Child: united State~, 1980
[Based on 100 parcent of births in selected States and on a 50-percent sample of births in all other State% see Tachnical notes. Ratas ara live births per 1,000 women in specified age and racial grcmps. Live-birth order refers to number of children b.cm alive to mother]
Age of mother
Live -biflh order and race of child
All races
Total . . . . . . . . . . . . . . . . . . . . . . . . . . ,.,
First child . . . . . . . . . . . . . . . . . . . . . . . . .
Second child........,.,....,,.. . . . .
Third child . . . . . . . . . . . . . . . . . . . . . . . . .
Fourth child.............,.,.,., .,.
Fifth child . . . . . . . . . . . . . . . . . . . . . . . . Sixth and seventh child ..,...... ,., ., Eighth child and Over,.,.,......,..
White
Total. . . . . . . . . . . . . . . . . . . . . . . . . . ,.,
First child. , .?. . . . . . . . . . . . . . . . . . . .
Second child . ., ., ., . . . . . . . . . . . . . . . .Third child . . . . . . . . . . . . . . . . . . . . . . . . .Fourth child . . . . . . . . . . . . . . . . . . . .
Fifth child . . . . . . . . . . . . . . . . . . . . . . . .
Sixth and seventh child.,.,.,.,., .,.Eighth child And over . . . . . . . . . ,., .,.,
All other
Total . . . . . . . . . . . . . . . . . . . . . . . . . . . . . .
First child. . . . . . . . . . . . . . . . . . . . . . . . ,.
Second child . . . . . . . . . . . . . . . . . . . ,.,Third child, . . . . . . . . . . . . . . . . . . . . .
Fourth child . . . . . . . . . . . . . . . . . . . .
Fifth child . . . . . . . . . . . . . . . . . . . . . . . .
Sixth and seventh child . . . . . . . . . . .,,Eighth child Andover,.,., . . . . . . .
Black
Total, ., ., ., ., ., ., . . . . . . . . . . . . .
First child, . . . . . . . . . . . . . . . . . . . . . . .Second child,..............,..Third child . . . . . . . . . . . . . . . . .Fourth child, . . . . . . . . . . . . . . . . . . . ,.,Fifth child, ., . . . . . . . . . . . . . . . . . . . . .
Sixth and seventh child.......,.. . . . .Eighth child and over.,.,...,.,..
1544 15-19 years
yearsl 10-14 20-24 25-29 30-34 35-39 40-44 45-49 years
Total 15–1 7 18-19 years years years years years years years years
68.4 1.1 53.0 32.5 82.1 115.1 112.9 61.9 19.8 3.9 0.2
29.5 1.1 41.4 28.5 59.7 57.3 38.2 12.8 2.6 0.3 0.0 21.8 0.0 9.8 3.6 18,6 39.8 41.9 20.7 4.2 0.5 0.0 10,3 0.0 1,5 0.3 3.2 13.5 21.5 15.3 4.5 0.5 0.0
3,9 0.0 0,2 0.0 0.5 3.5 7.5 7.2 3.3 0.6 0.0 1.5 0.0 0.0 0.1 0.8 2.5 3.2 2.1 0.5 0.0 1.0 0.0 0.0 0.0 0.2 1.2 2.2 2.1 0.7 0.0 0.4 0.0 0.0 0.0 0.2 0.6 1.2 0.8 0.1
64.7 0.6 44.7 25.2 72.1 109.5 112.4 60.4 18.5 3.4 0.2
28,4 0.6 36.0 22.7 54.8 57.2 39.6 12.8 2.5 0.3 0.0 21.0 0.0 7.6 2.3 15,1 37.8 42.6 20.7 4.0 0.4 0.0
9.5 0.0 0,9 0.2 2.0 11.4 20.7 15.0 4.3 0.5 0.0 3.4 0.0 0,1 0.0 0.2 2.4 6.6 6.8 3.1 0.5 0.0 1,3 0.0 0.0 0.0 0.5 2.0 2.B 1,9 0.5 0.0 0,8 0.0 0,0 0.0 0.1 O.B 1.8 1.8 0.6 0.0 0.3 0.0 0.0 0.0 0.1 0.5 0.9 0.6 !3.1
88.6 3.9 94.6 68.3 133,2 145.0 115.5 70.8 27.9 6.5 0.4 — 35.6 3.7 68.3 57.1 84.9 57.5 30.0 12.6 3.2 0.5 0.0 26.2 0.1 20.8 9.9 36.8 50.3 37.8 20.8 5.6 0.7 0.0 — 14,4 0,0 4.5 1.2 9.5 24.8 25.5 16.5 5.7 0.8 0.0
6,5 0.0 0.7 0.1 1.7 8.9 12.8 9.5 4.1 0.9 0.0 2,9 0.1 0,0 0.2 2.6 55 5.2 3.0 0.7 0.0 2.1 0.0 0.0 0.0 0.9 3.3 4.4 3.6 1.1 0.1 0.9 0.0 0.0 0.1 0,5 1.7 2.6 1.7 0.2
88,1 4.3 100.0 73.6 138.8 146.3 109.1 62.9 24.5 5.8 0.3
35.2 4.2 71.8 61.3 87.3 55.9 24.3 9.1 2.4 0.3 0.0 25.7 0.1 22.3 10.9 39.0 51.2 35.6 16.8 4.2 0.5 0.0 14.5 0.0 4.9 1.3 10.3 25.9 26.1 15.5 4.8 0.7 0.0
6,7 0.0 0.8 0.1 1.8 9.5 13,3 9.7 3.8 0.8 0.0 3.0 0.1 0.0 0.3 2.9 5.8 5.4 3.1 0.7 0.0 2.1 0.0 0.0 0.0 0.9 3.5 4.6 3.6 1.1 0.1 0.9 0.0 0.0 0.1 0.6 1.8 2.6 1.6 0.1
— 1 Rates ~omp”ted by relating total births, regardless of age of mother, to women aged 15-44 Years.
19712
19721
Monthly Vial Statistics Report ~ 13
Table 4. Total fertility rates and birth rates by age of mother, by race of child: United States, 1970-80
[Total fertility rates are sums of birth rates for 5-year-ags groups multiplied by 5. Birth rates are live births per 1,000 women in specif!ed group, enumerated as of April 1
far 1970 and 1980 and estimated as of July 1 for all other years]
—
Age of mother
Year and race of child Total
fertility 10-14
15-?9 years 20-24 25-29 30-34 35-39 40–44 45-49
rate years
Total 15-17 18-79 yeacs years years years years years years years
All races
19801 . . . . . . . . . . . . . . . . . . . . . . . . . . . 1,839.5 1.1 53.0 32.5 82.1 115.1 112.9 61.9 19.8 “ 3.9 0.2 19797 . . . . . . . . . . . . . . . . . . . . . . . . . . . 1,808.0 1.2 52.3 32.3 81.3 112.8 111.4 60.3 19.5 3.9 0.2 19781 . . . . . . . . . . . . . . . . . . . . . . . . . . . 1,760.0 1.2 51.5 32.2 79.8 109.9 108.5 57.8 19.0 3.9 0.2 19777 . . . . . . . . . . . . . . . . . . . . . . . . . . . 1,789.5 1.2 52.8 33.9 80.9 112.9 111.0 56.4 19.2 4.2 0.2 19761 . . . . . . . . . . . . . . . . . . . . . . . . . . . 1.738.0 1.2 52.8 34.1 80.5 110.3 106.2 53.6 19.0 4.3 0.2 19761 . . . . . . . . . . . . . . . . . . . . . . . . . . . 1,774.0 1.3 55.6 36.1 85.0 113.0 108.2 52.3 19.5 4.6 0.3 19741 . . . . . . . . . . . . . . . . . . . . . . . . . . . 1,835.0 1.2 57.5 37.3 88.7 117.7 111.5 53.8 20.2 4.8 0.3 19731 . . . . . . . . . . . . . . . . . . . . . . . . . . . 1,879.0 1.2 59.3 38.5 91.2 119.7 112.2 55.6 22.1 5.4 0.3 19721 2,010.0 1.2 61.7 39.0 96.9 130.2 117.7 59.8 24.8 6.2 0.4 19712 ::::::::::::::::::::::::: :: 2,266.5 1.1 64.5 38.2 105.3 150.1 134.1 67.3 28.7 7.1 0.4 19702 . . . . . . . . . . . . . . . . . . . . . . . . . . . 2.480.0 1.2 68.3 38.8 114.7 167.8 145.1 73.3 31.7 8.1 0.5
White
19801 . . . . . . . . . . . . . . . . . . . . . . . . . . . 1,748.5 0.6 44.7 25.2 72.1 109.5 112.4 60.4 18.5 3.4 0.2 19791 . . . . . . . . . . . . . . . . . . . . . . . . . . . 1,715.5 0.6 43.7 24.7 71.0 107.0 110.8 59.0 18.3 3.5 0.2 19781 . . . . . . . . . . . . . . . . . . . . . . . . . . . 1,667.5 0.6 42.9 24.9 69.4 104.1 107.9 56.6 17.7 3.5 0.2 1977~ . . . . . . . . . . . . . . . . . . . . . . . . . ,. 1,703.0 0.6 44.1 26.1 70.5 107.7 110.9 55.3 18.0 3.8 0.2 19761 . . . . . . . . . . . . . . . . . . . . . . . . . . . 1,652.0 0.6 44.1 26.3 70.2 105.3 105.9 52.6 17.8 3.9 0.2 19751 . . . . . . . . . . . . . . . . . . . . . . . . . . . 1,686.0 0.6 46.4 28.0 74.0 ~08.2 108.1 51.3 18.2 4.2 0.2 19741 . . . . . . . . . . . . . . . . . . . . . . . . . . . 1,748.5 0.6 47.9 28.7 77.3 113.0 111.8 52.9 18.9 4.4 0.2 19731 . . . . . . . . . . . . . . . . . . . . . . . . . . . 1,783.0 0.6 49.0 29.2 79.3 114.4 112.3 54.4 20.7 4.9 0.3 19721 . . . . . . . . . . . . . . . . . . . . . . . . . . . 1,906.5 0.5 51.0 29.3 84.3 124.8 117.4 58.4 23.3 5.6 0.3
— ,9702 . . . . . . . . . . . . . . . . . . . . . . . . . . . 2,160.5 0.6 53.6 28.5 92.3 144.9 134.0 65.4 26.9 6.4 0.4
. . . . . . . . . . . . . . . . . . . . . . . . . . . 2,386.0 0.5 57.4 29.2 101.5 163.4 145.9 71.9 30.0 7.5 0.4
All other
19801 . . . . . . . . . . . . . . . . . . . . . . . . . . . 2,323.0 3.9 94.6 68.3 133.2 145.0 115.6 70.8 27.9 6.5 0.4 19791 . . . . . . . . . . . . . . . . . . . . . . . . . . . 2,309.5 4.1 96.5 70.5 134.9 144.3 114.6 68.3 27.3 6.4 0.4 19781 . . . . . . . . . . . . . . . . . . . . . . . . . . . 2,264.5 4.0 96.0 70.4 134.4 142.1 111.9 65.2 26.9 “6.4 0.4 19771 . . . . . . . . . . . . . . . . . . . . . . . . . . . 2,278.5 4.3 99.5 74.8 136.8 142.3 111.5 63.4 27.3 6.9 0.5 19761 . . . . . . . . . . . . . . . . . . . . . . . . . . . 2,222.5 4.3 99.9 75.5 137.2 138.9 107.6 .59.5 “ 26.9 6.9 0.5 1975 J . . . . . . . . . . . . . . . . . . . . . . . . . . 2,276.0 4.7 106.4 80.5 146.1 141.0 108.7 58.8 27.6 7.5 0.5 19741 . . . . . . . . . . . . . . . . . . . . . . . . . . . 2,338.5 4.6 111.3 84.9 153.1 145.5 109.5 59.9 28.8 7.6 0.5 19731 . . . . . . . . . . . . . . . . . . . . . . . . . . . 2,443.0 6.0 117.5 90.5 160.9 151.6 1,11.2 63.2 30.9 8.6 0.6 19721 . . . . . . . . . . . . . . . . . . . . . . . . . . . 2,627.5 4.7 123.8 93.8 173.3 163.4 119.3 68.9 34.8 9.9 0.7 19712 . . . . . . . . . . . . . . . 2,919.5 4.7 128.5 94.0 185.6 184.0 134.6 79.3 40.2 11.7 0.9 19702 : : : : : : : : : : :: . . . . . . . . . . . . . . . 3,066.7 4.8 133.4 95.2 195.4 196.8 140.1 82.5 42.2 12.6 0.9
Black
19801 . . . . . . . . . . . . . . . . . . . . . . . . . . . 2,266.0 4.3 100.0 73.6 138.8 146.3 109.1 62.9 24.5 5.8 0.3 19791 . . . . . . . . . . . . . . . . . . . . . . . . . . . 2,263.2 4.6 101.7 75.7 140.4 146.3 108.2 60.7 24.7 6,1 0.4 19781 . . . . . . . . . . . . . . . . . . . . . . . . . . . 2,218.0 4.4 100.9 75.0 139.7 143.8 105.4 58.3 24.3 6,1 0.4 19771 . . . . . . . . . . . . . . . . . . . . . . . . . . . 2,251.0 4.7 104.7 79.6 142.9 144.4 106.4 57.5 25.4 6.6 0.5 19761 . . . . . . . . . . . . . . . . . . . . . . . . . . . 2,187.0 4.7 104.9 80.3 142.5 140.6 101.6 53.6 24.8 6,8 0.5 19751 . . . . . . . . . . . . . . . . . . . . . . . . . . . 2,243.0 5.1 111.8 85.6 152.4 142.8 102.2 53.1 25.6 7.5 0.5 19741 . . . . . . . . . . . . . . . . . . . . . . . . . . . 2,298.5 5.0 116.5 90.0 158.7 146.7 102.2 54.1 27.0 7,6 0.6 19731 . . . . . . . . . . . . . . . . . . . . . . . . . . . 2,411.0 6.4 123.1 96.0 166.6 153.1 103.9 58.1 29.4 8,6 0.6 ,9712 . . . . . . . . . . . . . . . . . . . . . . . . . . 2,601.0 5.1 129.8 99.5 179.5 165.0 112.4 64.0 33.4 9.8 0.7
. . . . . . . . . . . . . . . . . . . . . . . . . . . 2,902.0 5.1 134.5 99.4 192.6 186.6 128.0 74.8 38.9 11.6 0.9 19702 . . . . . . . . . . . . . . . . . . . . . . . . . . . 3,098.7 5.2 147.7 101.4 204.9 202.7 136.3 79.6 41.9 12.5 1.0
1 Based ~“ 100 Percent of bifihs in selected States a“d on a 50.percent sample of births m all other state= see Technical notes.
2Ba~ed ~“ ~ 50. Percent sample of births.
NOTE Rates for 1971-79 have been revised; see Techn!cal notes.

14 ~ Monthly Vital Statistics Report
Table 5. Birth rates by live-birth order and race of child: United States, 1970–80
[Rates are live births per 1,000 women aged 15-44 years, enumerated as of April 1 for 1970 and 1980 and estimated as of July 1 for all other years. Figures for live-birth order not stated are distributed]
Live-biflh Order
Year and race of child Total 6 8 1 2 3 4 5 and and
7 over
68.4 29.5 21.8 10.3 3.9 1.5 1.0 0.4 67.2 28.6 21.6 10.1 3.8 1.5 1.0 0.4 65.5 27.8 21.1 9.8 3.8 1.5 1.0 0.4 66.8 26,2 21.6 10.0 3.8 1.6 1.1 0.5 65.0 27.5 20.8 9.5 3.8 1.6 1.2 0.6 66.0 28.1 20.9 9.4 3.9 1.7 1.3 0.7 67.8 28.7 21.4 9.5 4.1 1.9 1.5 0.8 68.8 28.6 21.0 9.8 4.5 2.2 1.8 0.9 73.1 29.8 21.4 10.6 5.3 2.6 2.2 1.2 61.6 32.0 23.1 12.5 6.4 3.3 2.8 1.5 87.9 34.2 24.2 13.6 7.2 3.8 3.2 1.8
64.7 28.4 21.0 9.5 3.4 1.3 0.8 0.3 63.4 27.4 20.8 9.4 3.4 1,3 0.8 0.3 61.7 26.6 20.2 9.2 3.3 1.3 0.8 0.3 63.2 26.9 20.9 9.4 3.4 1.4 0.9 0.4 61.5 26.3 20.2 8.9 3.4 1.4 1,0 0.4 62.5 26.7 20.3 8.8 3.5 1.5 1.1 0.5 64.2 27,2 20.8 9.0 3.8 1.7 1.2 0.6 64.9 27.0 20.4 9.2 4.1 1.9 1,5 0.7 68.9 28.1 20.9 10,1 4.9 2.3 1.8 0.8 77.3 30.5 22.5 12,0 6.0 3.0 2.3 1.0 84.1 32.9 23.7 13.3 6.8 3.4 2.7 1.2
86,6 35.6 26.2 14.4 6.5 2.9 2.1 0.9 88.5 35.7 26.2 14.2 6.4 2.9 2.1 1.0 87.0 35.0 25.8 13.8 6.3 2.9 2.2 1.1 87.7 35.6 25.7 13.5 6.2 3.0 2.4 1.3 85.8 35,2 24.7 12.8 6.0 3.0 2.5 1.5 87.7 36.7 24.6 12.6 6.1 3.1 2,8 1.8 89.8 37.7 24.7 12.5 6.3 3.3 3.1 2.1 93.4 38.8 24.4 13.0 6.9 3.9 3.7 2.6 99.5 40.6 25,0 13.7 7.7 4.6 4.6 3.4
109.1 41.6 26,8 15.5 9.0 5.6 5.9 4.6 113.0 42.4 26.9 15,9 9.7 6.1 6.7 5.3
88.1 35.2 25.7 14.5 6.7 3.0 2.1 0.9 88.3 35.3 25.8 14.4 6.6 3.0, 2.2 1.0 66.7 34.6 25.4 13.9 6.5 3.0 2.3 1.1 88.1 35.6 25.5 13.6 6.4 3.1 2.4 1.4 85.8 35.2 24.4 12.9 6.2 3.1 2.6 1.5 87.9 36,9 24.2 12.6 6.3 3.2 2.9 1.9 89,7 37,7 24.2 12.6 6.5 3.4 3.3 2.2 93,6 38,9 24.0 13.0 7.0 4.0 3.9 2.8 99.9 40.7 24.6 13,7 7.9 4.7 4.8 3.6
109,7 41.7 26.6 15,5 9.2 5.7 6.2 4.8 115,4 43.3 27.1 16,1 10.0 6.4 7.0 5.6
1 8a~ed ~“ 100 percent of bimhs in selected States and on a 50-percent sample of births in all other states; see Technical notes. 28a~ed ~“ ~ 50.Percent sample of biflhs.
NOTE: Rates for 1971-79 have been revised; see Technical notes,
—
Monthly Vital Statistics Repoft ~15 .
Table 6. Live births by race of child and birth rates United States, each division and State, 1980
[By place of residence. Based on 100 percent of births in selected States and on a 50-percent sample of births in all other States; see Technical notes. Rates per 1,000 enumerated population in each area]
@ Number Number
Birth BirthDivision and State Division and State
All rate All rateWhite Black White Black
races~ racesl
United States . . . . . . . . . . . 3,612,258 2,898,732 589,616 15.9 South Atlantic—Con.
Maine . . . . . . . . . . . . . New Hampshire . . . .
Vermont . . . . . . . . . . . Massachusetts. . . . . .
16,461 13,745
7,884 72,632
76,760 13,533
7,815 66,136
8’I 89 28
5,232
14.6 14.9
15.4 12.7
North Carolina . . . . . .
South Carolina . . . . . . Georgia . . . . . . . . . . . . Florida . . . . . . . . . . . . .
84,496 51,978 92,313
131,795
57,292 30,608 57,621
96,375
24,954 20,919 33,834
33,956
14.4
16.6 16.9 13.5
Rhode Island . . . . . . . 12,188 11,091 749 12.9 East South Central. . . . . . . 240,149 171,981 66,334 16.4 Connecticut . . . . . . . . 38,781 33,608 4,656 12.5 Kentucky . . . . . . . . . . . 59,582 53,508 5,601 16.3
Middle Atlantic. . . . . . . . . . 494,700 391,946 89,294 13.4 Tennessee . . . . . . . . . 69,219 53,072 15,570 15.1
New York . . . . . . . . . . 239,011 180,145 49,488 13.6 Alabama . . . . . . . . . . . 63,503 40,692 22,437 16.3
New Jersey . . . . . . . . . 96,866 74,707 19,948 13.2 Mississippi . . . . . . . . . 47,845 24,709 22,726 19.0
Pennsylvania . . . . . . . 158,823 137,094 19,858 13.4 West South Central . . . . . . 445,127 349,536 84,507 18.7
East North Central . . . . . . . 667,980 554,496 103,316 16.0 Arkansas . . . . . . . . . . . 37,278 27,702 9,215 16.3
Ohio . . . . . . . . . . . . . . 169,148 144,118 23,418 15.7 Louisiana . . . . . . . . . . 82,163 50,215 30,993 19.5
Indiana . . . . . . . . . . . . 88,440 78,079 9,656 16.1 Oklahoma . . . . . . . . . . 52,106 41,448 5,238 17.2
Illinois . . . . . . . . . . . . . 190,058 144,660 41,378 16.6 Texas . . . . . . . . . . . . . 273,580 230,171 39,061 19.2
Michigan . . . . . . . . . . .
Wisconsin . . . . . . . . . .
145,509
74,825 119,087
68,552 24,109
4,755
15.7
15.9 Mountain . . . . . . . . . . . . . .
Montana . . . . . . . . . . .
225,945
14,206
203,269
12,737 6,963
54 19.9
18.1 Weat North Central . . . . . . 287,847 260,211 19,494 16.8 Idaho . . . . . . . . . . . . . . 20,167 19,584 79 21.4
Minnesota . . . . . . . . . 67,773 63,891 1,503 16.6 Wyoming . . . . . . . . . . 10,562 10,059 116 22.5 Iowa . . . . . . . . . . . . . . 47,814 46,031 1,139 16.4 Colorado . . . . . . . . . . . 49,730 45,722 2,410 17.2 Missouri . . . . . . . . . . . 78,934 66,148 11,916 16.1 New Mexico . . . . . . . . 26,115 21,671 649 20.0 North Dakota . . . . . . . 11,982 10,985 109 18.4 Arizona . . . . . . . . . . . . 50,048 42,186 2,123 18.4 South Dakota . . . . . . . 13,276 11,396 79 19.2 Utah . . . . . . . . . . . . . . 41,797 40,160 220 28.6
New England . . . . . . . . . . . 161,691 148,343 10,835 13.1 West Virginia . . . . . . . 29,464 28,131 1.208 15.1
— Nebraska . . . . . . . . . . . 27,352 25,461 1,307 17.4 Nevada . . . . . . . . . . . . 13,320 11,150 1,312 16.6 Kansas . . . . . . . . . . . . 40,716 36,299 3,441 17.2
Pacific . . . . . . . . . . . . . . . . . 541,624 442,441 46,869 17.0 — South Atlantic . . . . . . . . . . 547,195 376,509 162,004 14.8 Washington . . . . . . . . 67,858 60,510 2,686 f 6.4 Delaware . . . . . . . . . . . 9,413 7,134 2,184 15.8 Oregon . . . . . . . . . . . . 43,127 40,205 1,005 16.4 Maryland . . . . . . . . . . . 59,932 40,451 17,917 14.2 California . . . . . . . . . . 402,949 330,782 42,122 17.0 District of Columbia. . . 9,361 1,407 7,839 14.7 Alaska . . . . . . . . . . . . . 9,529 6,620 461 23.7 Virginia . . . . . . . . . . . . 78,443 57.490 19,193 14.7 Hawaii . . . . . . . . . . . . . 18,161 4,324 595 18.8
1 ,nc,”de~ ~ace~ other than white and black.

m
Table 7. Live births by sex and sex ratio, by race of ~hilrf: united .CJ~~~es, 1 g7&8rJ
All other All races White
Total Black
Year Males Males Males Males
Male Female per
1,000 Male Female
per
1,000 Male Female
per
1,000 Male Female
per
1.000 females females females females
19801 . . . . . . . . . . . . . . . . . . . . . . . . . . . . . 1,852,616 1,759,642 1,053 1,490,140 1,408,592 1,058 362,476 351,050 1,033 299,033 290,583 1,029 19791 . . . . . . . . . . . . . . . . . . . . . . . . . . . . . . . 1,791,267 1,703,131 1,052 1,442,981 1,365,439 1,057 348,286 337,692 1,031 293,013 284,842 1,029 19781 . . . . . . . . . . . . . . . . . . . . . . . . . . . . . 1,709,3941,623,885 1,053 1,378,222 1,302,694 1,058 331,172 320,991 1,032 279,598 271,942 1,028 19771 . . . . . . . . . . . . . . . 1,705,916 1,620,716 1,053 1,383,440 1,307,630 1,058 322,476 313,086 1,030 275,556 268,665 1,026 19761 . . . . . . . . . . . . . . . . . . . . . . . . . . . . . 1,624,436 1,543,352 1,053 1,319,717 1,247,897 1,058 304,719 295,455 1,031 260,661 253,818 1,027 19751 . . . . . . . . . . . . . . . . . . . . . . . . . . . . . . . . 1,613,135 1,531,063 1,054 1,312,308 1,239,688 1,059 300,827 291,375 1,032 259,610 251,971 1,030 19741 . ., . . . . . . . . . . . . . . . . . . . . . . . . 1,622,114 1,537,844 1,055 1,325,019 1,250,773 1,059 297,095 287,071 1,035 257,277 249,885 1,030 19731, ...,.,........,,..,..,.,.. . . . 1,608,326 1,528,639 1,052 1,311,032 1,239,998 1,057 297,294 288,641 1,030 259,877 252,720 1,028
19721 . . . . . . . . . . . . . . . . . . . . . . . . . . . . . . . . 1,669,927 1,588,484 1,051 1,364,578 1,290,980 1,057 305,349 297,504 1,026 268,842 262,487 1,024 19712 . . . . . . . . . . . . . . . . . . . . . . . . . . . . . ,,, 1,822,910 1,733,060 1,052 1,499,958 1,419,768 1,056 322,952 313,272 1,031 286,430 278,530 1,028 19702 . . . . . . . . . . . . . . . . . . . . . . . . . . . . . . . 1,915,3761,816,008 1,055 1,590,140 1,501,124 1,059 325,238 314,864 1,033 290,508 281,854 1,031
1 Based on 100 percent of bifihs in selected States and on a 50-percent sample of births in all other StatB5; see Technical nOteS 2&~ed O. ~ 50.percent sample of bifihs.
Monthly Vital Statistics Report ~ 17
Tabla 8. Live births by race of child and observad and seasonally adjusted birth and fertility rates, by month United States, 1980
[Based on 100 percent of births in selected States and on a 50-percent sample of births in all other States; seeTechnical notes. Rateson an annual basisperl ,000 population forspecified
month. Birth rates based on the total population. Fertility rates baaed on women aged 1544 yeara]
a Number
Obsewed Seasonally
adjusted
Month All All other
races White Birth Fertility Birth Fertility Total Black rate rate rate rate
Total . . . . . . . . . . . . . . . . . . . . . . . . . . . . . 3,612,258 2,898,732 713,526 589,616 15.9 68.4 . . . . . .
January . . . . . . . . . . . . . . . . . . . . . . . . . . 292,009 232,145 59,864 50,294 15.3 65.6 15.7 67.6 February . . . . . . . . . . . . . . . . . . . . . . . . . . 279,961 223,921 56,040 46,807 15.6 67.2 15.8 67.9
March . . . . . . . . . . . . . . . . . . . . . . . . . . . 297,309 239,558 57,751 47,923 15.5 66.6 15.6 67.6
April . . . . . . . . . . . . . . . . . . . . . . . . . . . . . 286,780 232,654 54,126 44,409 15.4 66.3 16.2 69.6
. .May . . . . . . . . . . . . . . . . . . . . . . . . . . . 293,687 238.103 55,564 45,397 15.3 65.6 15.8 67.9
June . . . . . . . . . . . . . . . . . . . . . . . . . . . . . 293,018 235,844 57,174 47,199 15.8 67.5 15.9 68.2
July . . . . . . . . . . . . . . . . . . . . . . . . . . . . . 321,836 256,859 64,977 54,137 16.7 71.6 16.0 66.5
August . . . . . . . . . . . . . . . . . . . . . . . . . . . 323,129 256,218 64,911 53,946 16.8 71.8 15.6 67.7 September . . . . . . . . . . . . . . . . . . . . . . . . 320,536 256,590 63,946 52,782 17.2 73.5 16.1 69.1 October . . . . . . . . . . . . . . . . . . . . . . . . . . 311,312 250,170 61,142 49,936 16.1 69.0 16.0 68.3
November . . . . . . . . . . . . . . . . . . . . . . . . 289,580 232,132 57.448 47,064 15.5 66.3 15.7 67.1 December . . . . . . . . . . . . . . . . . . . . . . . . 303,101 242,538 60,563 49,718 15.7 67.0 16.0 68.5
Table 9. Live births by attendant and place of delivery, by race of child: United States, 1980
[Based on 100 percent of births in selected States and on a 50-percent sample of births in all other States; see Technical notes]
Attendant Place of delivery and race of child Total
Physician Midwife Other Unspecified
All racesl —
Total . . . . . . . . . . . . . . . . . . . . . . . . . . . . . . . . . . . . . . . . . . . . . . . . . . . . . . . . 3,612,258 3,511,951 62,669 29,086 8,552
lnhospita12 . . . . . . . . . . . . . . . . . . . . . . . . . . . . . . . . . . . . . . . . . . . . . . . . . . 3,576,370 3,499,959 51,576 17,456 7,379 Not in hospital . . . . . . . . . . . . . . . . . . . . . . . . . . . . . . . . . . . . . . . . . . . . . . . . 35,548 11,874 11,031 11,495 1,148 Not specified . . . . . . . . . . . . . . . . . . . . . . . . . . . . . . . . . . . . . . . . . . . . . . . . . 340 118 62 135 25
White
Total . . . . . . . . . . . . . . . . . . . . . . . . . . . . . . . . . . . . . . . . . . . . . . . . . . . . . . . . 2,698,732 2,824,877 43,649 23,712 6,494
Inhospitalz . . . . . . . . . . . . . . . . . . . . . . . . . . . . . . . . . . . . . . . . . . . . . . . . . . 2,868,351 2,815,382 33,730 13,691 5,548 Not in hospital . . . . . . . . . . . . . . . . . . . . . . . . . . . . . . . . . . . . . . . . . . . . . . . . 30,137 9,409 9,872 9,930 926 Not specified . . . . . . . . . . . . . . . . . . . . . . . . . . . . . . . . . . . . . . . . . . . . . . . . . 244 86 47 91 20
81ack
Total . . . . . . . . . . . . . . . . . . . . . . . . . . . . . . . . . . . . . . . . . . . . . . . . . . . . . . . . 589,616 569,630 15,230 3,260 1,496
lnhospita12 . . . . . . . . . . . . . . . . . . . . . . . . . . . . . . . . . . . . . . . . . . . . . . . . . . 585,208 567,568 14,229 2,090 1,321
Not in hospital . . . . . . . . . . . . . . . . . . . . . . . . . . . . . . . . . . . . . . . . . . . . . . . . 4,358 2,039 995 1,154 170
Not specified . . . . . . . . . . . . . . . . . . . . . . . . . . . . . . . . . . . . . . . . . . . . . . . . . 50 23 6 16 5
1lnclude~ racas other than white and black.
zln~,ude~ ~nhs occurring enroute to or on arrival at hOs!?ital.
010203040506
18 ~ Monthly Vital Statistics Report
Table 10. Live births and percent distribution of live births by place of delivary and attendant, by rata of child: United States, 1975-80
[Bssed on 100 percent of births in sslected States and on a 50-percent ssmpie of births in all other States; s~e Technical notes]
Year and race
07 08 09 10 11
12
13 14 15 16 17 18
Black
19 20 21 22 23 24
1 ,ncludes births occurring en route tO or on arrival at hOwital.
Z,”cludes births with place of delivew not stated.
Number
@In hospitall
Total
Physician Midwife Other Unspecified
3,612,258 3,499,959 51,576 17,456 7,379 3,494,398 3,393,773 44,496 11,221 10,994 3,333,279 3,221,677 36,282 12,721 29,979 3,326,632 3,203,242 30,635 12,531 47,065 3,167,788 3,055,287 24,656 12,871 45,282 3,144,198 3,026,024 19,686 7,122 64,069
2,898,732 2,815,382 33,730 13,691 5,548 2,808,420 2,733,403 29,086 8,380 9,157 2,681,116 2,598,455 22,319 9,952 23,977 2,691,070 2,600,011 17,935 9,643 38,056 2,567,614 2,486,339 13,733 9,642 36,203 2,551,996 2,465,957 10,076 5,342 52,392
713,526 684,577 17,846 3,765 1,831 665,978 660,370 15,410 2,8$1 1,837 652,163 623,222 13,963 2,769 6,002 635,562 603,231 12,700 2,888 9,009 600,174 568,948 10,923 3,229 9,079 592,202 560,067 9,610 1,780 11,677
589,616 567,568 14,229 2,090 1,321
577,855 557,183 13,001 1,856 1,205 551,540 527,861 11,549 1,875 4,906
544,221 518,069 10,295 2,105 6,802 514,479 488,335 8,954 2,480 7,378 511,581 484,416 7,707 1,311 9,595
o

0102
03040506
Monthly Vial Statistics Repott ~ 19
Table 10. Live births and percent distribution of live births by place of delivery and attendant, by race of child: United States, 1975-80—Con.
[Based m 100 percent of births in selected States and on a 50-percent sampl@ of births in all other States; see Technical notes]
Number— Con. Percent
Not in hospita12 In hospital~ Not in hospita12
Physician Midwife
11,992 11,093 11,837 10,363
11,806 9,778 12,766 9,991 11,940 9,574 11,265 9,727
9,495 9,919
9,356 8,879 9,136 7,733
9,389 7,028 8,894 5,824 7,818 5,082
2,497 1,174 2,481 1,484 2,670 2,045 3,377 2,963 3,046 3,750 3.447 4,645
—
2,062 1,001 2,099 1,356
2,325 1,924
3,044 2,883
2,728 3,675
3,161 4,602
Total Other and Other and
Other Unspecified Physician Midwife Physician MidwifeUnspecified Unspecified
11,630 1,173 100.0 96.9 1.4 0.7 0.3 0.3 0.4
10,032 1,682 100.0 97.1 1.3 0.6 0.3 0.3 0.3
9,167 1,869 100.0 96.7 1.1 1.3 0.4 0.3 0.3 7,449 2,953 100.0 96.3 0.9 1.8 0.4 0.3 0.3 5,914 2,264 100.0 96.4 0.8 1.8 0.4 0.3 0.3 2,960 3,345 100.0 96.2 0.6 2.3 0.4 0.3 0.2
10,021 946 100.0 97.1 1.2 0.7 0.3 0.3 0.4 07 8,734 1,425 100.0 97.3 1.0 0.6 0.3 0.3 0.4 08 8,059 1,485 100,0 96.9 0.8 1.3 0.3 0.3 0.4 09 6,605 2,403 100.0 96.6 0.7 1.8 0.3 0.3 0.3 10 5,148 1,831 100.0 96.8 0.5 1.8 0.3 0.2 0.3 11 2,585 2.744 100.0 96.6 0.4 2.3 0.3 0.2 0.2 12
1,609 227 100.0 95.9 2.5 0.8 0.4 0.2 0.3 13 1,298 257 100.0 96.3 2.2 0.7 0.4 0.2 0.2 14 1,108 384 100.0 95.6 2.1 1.3 0.4 0.3 0.2 15
844 550 100.0 94.9 2.0 1.9 0.5 0.5 0.2 16 766 433 100.0 94.8 1.8 2.1 0.5 0.6 0.2 17 375 601 100.0 94.6 1.6 2.3 0.6 0.6 0.2 18
1,170 175 100.0 96.3 2.4 0.6 0.3 0.2 0.2 19 954 201 100.0 96.4 2.2 0.5 0.4 0.2 0.2 20 825 275 100.0 95.7 2.1 1.2 0.4 0.3 0.2 21 578 445 100.0 95.2 1.9 1.6 0.6 0.5 0.2 22 550 379 100.0 94.9 1.7 1.9 0.5 0.7 0.2 23 281 508 100.0 94.7 1.5 2.1 0.6 0.9 0.2 24

20 ~ Monthly Vital Statistics Report
Table 11. Live births by age of father, age of mother, and race of child: United Statea, 1980
[Based on 100 percent of births in selected States, and on a 50.percent sample of births in all other State% see Technical notes]
Age of father @
Age of mother All 55Under
and race of child ages 15
15-19 20-24 25-29 30–34 35–39 40-44 45-49 50-54 years Not years years years years years years years years and stated
years over
All racesl
Alleges . . . . . . . . .
Under 15 years. 15–19 years ...,.
20-24 years.
25-29 years. .,
30-34 years.
35–39 years. . . 40-44 years. .
45–49 years. . . .
White
Ail ages . . . . . . . . .
Under 15 years. .,
15–19 years,.,.,
20-24 years, ., ., 25-29 years. ., .,
30–34 years. . . 35-39 years. ., .,
40-44 years. ., 45-49 years. . . . .
Black
Alleges. ..,...,.
Under 15 years. 15-19 years .,.,,
20-24 years. .,
25–29 years.
30-34 years.
35–39 years. . . . . 40–44 years. . . .
45–49 years. . . .
3,612,258
10,169
552,161 1,226,200
1,108,291
550,354 140,793
23,090
1,200
2,898,732
4,171 388,508
982,526 933,159 459,151
113,124
17,652 891
589,616
5,793 150,353
209,596 135,680
64,369
19,631
3,990 204
172
64
81 15
7
2 1
2
96
24
51 13
5
2 1
73
40 28
1
2
2
136,748
2,155
111,796 21,119
1,373
246
53 6
109,504
1,147
88,941 17,985
1,170 213
44
4
23,922
963 20,281
2,506
143 24
4 1
803,209
775 208,177
519,592
65,808 7,655
1,111 142
9
680,059
521 172,550
444,793
54,938
6,204 922 124
7
103,259
177 30,798
62,878 8,258 1,002
134 10
2
1,082,337
131 39,175
409,498
565,950 61,058
5,959
544 22
937,994
103
31,709 350,099 499,777
51,036 4,808
447 15
739,038
35 8,867
89,860
325,964
291,396
21,469 1,417
30
634,825
32 7,127
73,762 280,381
254,662 17,723
1,117
275,136
18
2,473 21,627
62,952 124,297
60,318 3,395
56
227,968
12
1,956 17,117
51,173 104,084
50,908
2,674 44
31,652
4
395
3,549 8,053
13,138
6,225 481
7
90,444
5 873
6,650 16,194 27,991
30,052 8,536
143
70,874
4 667
5,038 12,336 21,700 24,233
6,786 110
13,753
1
174
1,295 2,896
4,160
4,001
1,205 21
30,258
2
307 2,390
5,286 8,351
8,617 4,812
493
23,025
2 217
1,745 3,831
6,311 6,720
3,812 387
5,433
79
540 1,169 1,500
1,341
733 71
11,486
2 132 938
2,171 3,217 3,198 1,572
256
8,497
1 92
649 1,538 2,387 2,463 1,187
180
2,324
1 36
250 519 630
654 291
43
6,447
4 113
578 1,197
1,806
1,818
822 109
4,449
79 375 775
1,281 1,262
594
83
1,502
4 29
170 294
382 427
178
18
436,983
7,038 180,167 153,933
61,389 24,335
8,197 1,842
82
201,441
2,325 84,669 70,950 27,235 11,271
4,040 907
44
223,214112,520 7
22
6,075 47,986 1
50<705 3
21
,764
3 ,386
,761
,557
—
6,925 24,471
749 2,385
54 195
4 6
4,578
91,072
78,660. 32,084 12,137
3,811
840 32
ll”clude~ races other than white and black

Monthly Vital Statistics Report~ 21
Table 12. Birth rates byageoffathefi United States, 1970-80
[Ratesare live births per 1,000 men in specified group, enumerated as of April 1 for 1970 and 1980 and estimated as of July 1 for all other years. Figures for age of father not stated are
distributed]
� Age of father 75-54
Year yearsl 15-19 20-24 25-29 30-34 35-39 40-4 45-49 50-54 55 years
years2 years years years years years years years andover
19803 . . . . . . . 57.0 18.8 92.0 123.0 91.0 42.8 17.1 6.1 2.2 0.4 19793 . . . . . . . 55.8 18.5 90.6 122.4 89.3 42.2 16.7 6.0 2.3 0.3 19783 . . . . . . . 54.1 18.1 89.7 120.0 86.7 40.8 16.3 5.8 2.2 0.3 19773 . . . . . . . 54.9 19.1 92.8 124.2 85.9 41.1 16.5 6.0 2.2 0.3 19763 . . . . . . . 53.2 19.4 92.1 120.3 82.6 39.8 16.2 6.0 2.1 0.3 19753 . . . . . . . 53.8 20.8 96.2 123.9 81.5 39.9 16.5 6.1 2.2 0.4 19743 . . . . . . . 55.0 21.7 101.2 128.2 83.9 40.8 16.8 6.2 2.2 0,4 19733 . . . . . . . 55.7 22.4 104.3 129.7 86.0 42.5 18.0 6.7 2.3 0.4 19723 . . . . . . . 59.1 23.4 113.2 137.6 91.8 46.7 19.9 7.4 2.5 0.4 79714 . . . . . . . 66.1 23.9 129.8 160.2 103.8 53.2 22.7 8.2 2.9 0.5 19704 . . . . . . . 71.5 25.6 146.6 175.0 112.3 57.6 24.9 9.1 3.1 0.6
1 Ratea ~Omp~ted by ~elati”g total births, regardless of age of father, to men aged 15-5’$ Yearn.
2RateS ~omp”ted by relating binhs Of fathers under 20 years of a9e tO men aged 15-19 years.
ssa~ed on 100 percent of binhs in selected States and on a 50-percent sample of births in all other States; see Technical nOtea 4Ba~ed on ~ 50-Percent sample of bifihs.
NOTE Rates for 1971–79 have been revised; see Technical notes.
—
—

Table 13. Number and percent low birth weight end live births by birth weight, by age of mother and race of child: United Stataa, 1980
[Based on 100 percent of births in selected States and on a 50-percent sample of births in .1[ other States; see Technical notes]
Low birth weighrl Birth weighrz
A,.. . . --. I... ‘-+/c u, ,~J~,,JcJ
Total Under 5oo– 7,ooo– l,500– 2, ooo– 2,500– 3, ooo– 3, 5oo– 4,000– 4, 5oo– and race of child
Number Percent 500 999 1,499 1,999 2,499 2,999 3,499 3,999 4,499 4,999 grams grams grams grams grams grams grams grams grams
All races
Alleges . . . . . . . 246,292 6.8 3,612,258 3,591 15,903 21,936 47,680 157,182 588,216 1,333,635 1,046,761 319,304 58,153
Under 15 years. 1,482 14.6 10,169 32 162 150 326 812 2,560 3,875 1,834 317 43 1 5–19 years. 51,820 9.4 552,161 663 3,516 4,955 10,285 32,401 114,729 215,501 132,602 30,814 4,178
15 years... 3,400 12.1 28,178 59 272 386 707 1,976 6,452 11,157 5,738 1,164 125
16 years... 6,753 10.7 63,198 95 497 702 1,331 4,128 14,206 24,843 13,818 2,904 372 17 years... 10,611 10.0 106,646 146 685 1,010 2,147 6,623 22,942 42,018 24,668 5,399 691 18 years... 14,291 9.4 153,333 146 999 1,377 2,851 6,916 31,696 59,605 37,140 8,754 1,166 19 years... 16,765 8.4 200,606 217 1,063 1,480 3,249 10,756 39,433 77,878 51,238 12,593 1,824
20–24 years. 64,600 6.9 1,226,200 1,223 5,263 7,325 16,100 54,689 209,404 465,874 346,773 97,838 15,843 25–29 years. . . . 64,262 5.8 1,108,291 980 4,212 5,569 12,219 41,282 161,545 402,755 342,929 110,147 20,589 30–34 yesrs. 32,301 5.9 550,354 515 2,075 2,879 6,252 20,580 75,872 191,097 173,259 60,935 12,988 35–39 years. . . 9,612 7.0 140,793 153 571 854 2,068 6,166 20,277 46,847 42,445 16,433 3,767 40-44 years. . . . 1,906 8.3 23,090 24 100 187 403 1,192 3,625 7,317 6,570 2,700 699 45–49 years, 109 9.2 1,200 1 4 17 27 60 184 369 349 120 46
White
Alleges . . . . . . . 164,816 5.7 2,898,732 2,120 9,755 14,079 31,788 I 07,074 421,225 1,058,052 899,033 286,402 52,6%7
Under 15 years. . 464 11.2 4,171 10 46 50 117 241 845 1,635 974 211 31
1 5–19 years. . . . 29,826 7.7 388,058 329 1,897 2,830 5,901 18,869 70,231 150,921 105,283 26,223 3,642
15 years... 1,499 10.1 14,979 27 119 176 329 848 2,834 5,875 3,743 841 101
16 years... 3,582 9.1 39,685 50 261 381 747 2,143 7,524 15,583 10,105 2,355 309
17 years... 5,946 8.2 72,993 64 352 562 1,204 3,764 13,665 28,712 19,213 4,494 5s4
18 years... 8,413 7.7 110,178 60 570 S15 1,648 5,320 19,902 42,829 29,972 7,495 1,031
19 years... 10,386 6.9 150,223 128 595 896 1,973 6,794 26,306 57,922 42,250 11,038 1,617 20–24 yeers. . . . 56,000 5.7 982,526 694 3,142 4,607 10,633 36,924 150,292 370,846 298,118 87,991 14,448
25–29 years. . . . 46,776 5.0 933,159 643 2,837 3,881 8,843 30,572 124,089 335,346 302,451 100,387 16,893 30–34 yeers. 23,454 5.1 459,151 334 1,394 2,018 4,566 15,142 58,090 156,815 150,866 54,851 11,743
35–39 years. ., 6,931 6.2 113,124 95 371 566 1,413 4,486 14,967 36,81S 35,768 14,370 3,293 40–44 years. . . 1,297 7.4 17,652 14 65 117 295 806 2,587 5,397 5,305 2,266 583
45–49 years. . . . 68 7.7 891 1 3 10 20 34 124 274 268 103 34
All other
Alleges . . . . . . . 81,476 11.5 713,526 1,471 6,148 7,857 15,892 50,108 166,991 275,5S3 147,728 32,902 5,486
Under 15 years. 1,018 17.1 5,998 22 116 100 209 571 1,735 2,240 860 106 12 1 5–1 9 years. . . . 21,994 13.5 164,103 334 1,619 2,125 4,384 13,532 44,496 64,580 27,319 4,591 536
15 years... 1,901 14.5 13,199 32 153 210 378 1,12s 3,618 5,282 1,995 323 24 16 years... 3,171 13.5 23,513 45 236 321 584 1,985 6,682 9,260 3,713 549 63
17 years... 4,665 13.8 33,s53 82 333 446 943 2,859 9,277 13,306 5,455 905 107
18 years... 5,878 13.7 43,155 86 429 562 1,203 3,598 11,794 16,776 7,168 1,259 135
19 years... 6,379 12.7 50,383 89 468 584 1,276 3,962 13,127 19,956 8,988 1,555 207 20–24 yeers. . . . 28,600 11.8 243,674 529 2,121 2,718 5,467 17,765 59,112 95,028 48,655 9,847 1,395 25–29 yeara. . . . 17,486 10.0 175,132 337 1,375 1,686 3,376 10,710 37,456 67,409 40,478 9,760 1,696 30–34 years. . . . 8,847 9.7 91,203 181 681 861 1,686 5,43s 17,782 34,282 22,393 6,084 1,245 35-39 years. . . . 2,881 10.5 27,669 58 200 288 655 1,680 5,310 10,029 6,677 2,063 474 40–44 years. . . . 609 11.3 5,438 10 35 70 108 386 1,038 1,920 1,265 434 116 45–49 years. . . . 41 13.4 309 1 7 7 26 60 95 81 17 12
.
5,000 Not
grams stated
or more
8,181 11,716
1 37 495 2,022
13 129 45 257 73 444
136 545 228 647
1,927 3,941 2,768 3,296 2,117 1,785
710 502 150 123
13 10
7,285 9,252
11 431 1,501
8 78 36 191 60 319
120 416 207 497
1,746 3,085 2,512 2,705 1,S63 1,469
594 383 126 91
13 7
896 2,464
1 26 64 521
5 51 9 66
13 125
16 129 21 150
181 656 256 591 254 316 116 119
24 32 3

II
Black
Alleges . . . . . . . 73,462 12.5 589,616
Under 15 yaars. 994 17.2 5,793 1 5–19 years. . . . 20,939 14.0 150,353
15 yeara . . . 1,861 14.8 12,580 16 yeara . . . 3,071 13.9 22,096 17 years... 4,462 14.3 31,290 18 years... 5,556 14.2 39,285 19 yeara . . . 5,989 13.3 45,102
20-24 years. . . . 26,395 12,6 209,596 25-29 yeara. . . . 15,182 11.2 135,680 30–34 yeara. . . . 7,143 11.1 64,369 35-39 yeara. . 2,292 11.7 19,631 40-44 years. . . . 485 12.2 3,990 45-49 years. 32 15.8 204
1Less than 2,500 grams.2E~”i”ale”t~ Of the gram waight in terms of pounds and ounces
Under 500 grams = 1 lb 1 oz or less
500-999 grams = 1 lb 202-2 lb 3 oz
1,000-1,499 grams = 2 lb 4 OZ-3 lb 4 oz
1,500-1,999 grams = 3 lb 502-4 lb 6 oz
2,000-2,499 grams = 4 lb 7 OZ-5 lb 8 oz
2,500–2,999 grams = 5 lb 902.6 lb 9 oz
3,000-3,499 grams = 6 lb 1002-7 lb 11 oz
3,500-3,999 grams = 7 lb 1202-8 lb 13 oz
4,000-4,499 grams = 8 lb 1402-9 lb 14 oz
4,500-4,999 grams = 9 lb 15 OZ-11 lb O oz
5,000 grams or more = 11 lb 1 oz or more
1,381 5,748 7,208 14,463 44,662” 42,645 225,626 116,514 25,179 4,035 671 ,484
22 115 96 203 558 1,698 2,163 813 99 9 1 16 323 1,568 2,038 4,182 12,B28 41,643 59,115 24,065 3,809 404 51 327
32 151 208 372 1,09B 3,507 5,028 1,835 288 23 5 33 44 227 317 569 1,914 6,411 8,678 3,366 465 51 9 45 80 324 422 903 2.733 8,736 12,292 4,855 769 78 10 88 81 408 536 1,140 3,391 10,951 15,277 6,277 1,038 98 14 74 86 458 555 1,19B 3,692 12,038 17,840 7,732 1,249 154 13 87
508 2,010 2,547 5,085 16,245 52.263 81.382 40,092 7,773 1,026 137 526 311 1,248 1,534 2,977 9,112 29,638 51,323 30,417 7,311 1.246 194 369 156 603 687 1,390 4,307 12,738 23,300 15,556 4,371 “904 184 173
53 173 242 537 1,287 3,841 6,913 4,616 1,474 351 85 59 8 31 61 83 302 782 1,374 901 329 87 19 13
3 6 23 42 56 54 13 6 1
are as fol[okv~
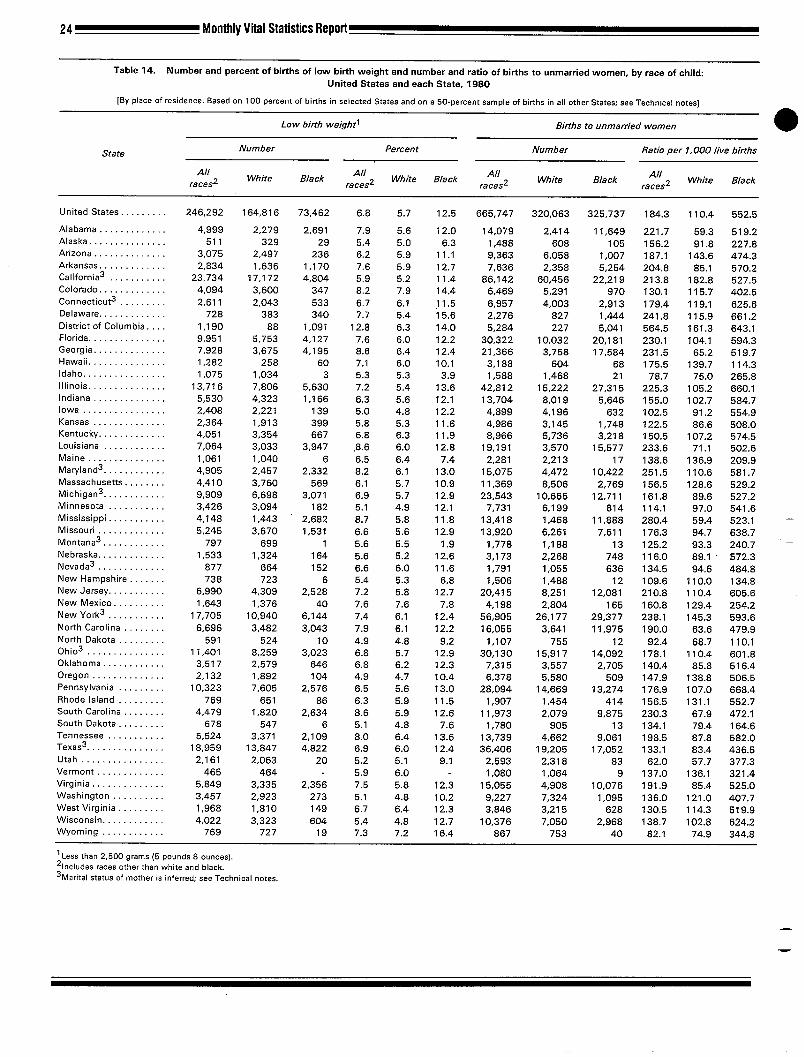
24 ~ Monthly Vital Statistics Report
Table 14. Number and percent of births of low birth weight and number and ratio of births to unmarried women, by race of child:
United States and each State, 19g0
[By place of residence, Bssed on 100 percent of births in selected States and on a 50-percent sample of births in all other States; see Technwal notes]
State
United States. . . . . . .
Alabama . . . . . . . . . . . . .
Alaska, . . . . . . . . . . . . . .
Arizona . . . . . . . . . . . . . .
Arkansas, ., ., .,.,...,
Calif0rnia3 . ., .,.,...,
Colorado . . . . . . . . . . . . .
C0nnecticut3 ., . . . .,
Delaware . . . . . . . . . . . . .
District of Columbia. .,
Florida . . . . . . . . . . . . . . .
Georgia . ., ., ...,.,...
Hawaii . . . . . . . . . . . . . . .
Idaho, ., ., . . . . . . . . . . .
Illinois ., ., . . . . . . . . . . .
Indiana, ., . . . . . . . . . . .
Iowa . . . . . . . . . . . . . . . . Kansas . . . . . . . . . . . . . .
Kentucky . . . . . . . . . . . . .
Louisiana . . . . . . . . . . . .
Maine, . . . . . . . . . . . . . .
Maryland., . . . . . . . . . .
Massachusetts ., ., .
Michigan.. ., .,.,....
Minnesota ..,.,...,.,
Mississippi . . . . . . . . . . .
Missouri . . . . . . . . . . . . .
Montana . . . . . . . . . . . .
Nebraska . . . . . . . . . . . . .
Nevada. . . . . . . . . . . . .
New Hampshire . . . . . . .
New Jersey . . . . . . . . . . .New Mexico . .,.,.,.,.
New York3 . . . . . . . . . . .
North Carolina . . . .
North Dakota . . . . . . . . .
0hio3 ., ., . . . . . . .
Oklahoma . . . . . . . . . . . .
Oregon . . . . . . . . . . . . . .
Pennsylvania . . . . . . . . .
Rhode island . . . . . . . . .
South Carolina . . . . . . . .
South Dakota . . . . . . . . .
Tennessee, . . . . . . . . . .
Texas.. , ., . . . . . . . . . .
Utah. . ., . . . . . . . . . . . .
Vermont, . . . . . . . . . . . .
Virginia . . . . . . . . . . . . . .
Washington ., .,.,....
West Virginia . . . .
Wisconsin . . . . . . . . . . . .
Wyoming . . . . . . . . . . . .
Low birth weightl Births ?0 unmarried women
Number Percent Number Ratio per 1,000 live births
All All All AllWhite Black White Black
racesz races 2 White Black racesz racesz
White Black
246,292 164,816 73,462 6.8 5.7 12.5 665,747 320,063 325,737 184.3 110.4 552.5
4,999 2,279 2,691 7.9 5.6 12.0 14,079 2,414 11,649 221.7 59.3 519.2 511 329 29 5.4 5.0 6.3 1,488 608 105 156.2 91.8 227.8
3,075 2<497 236 6.2 5.9 11.1 9,363 6,058 1,007 187.1 143.6 474.3 2,834 1,636 1,170 7,6 5.9 12.7 7,636 2,358 5,254 204.8 85.1 570.2
23,734 17,172 4,804 5,9 5.2 11.4 86,142 60,456 22,219 213.8 182.8 527.5 4,094 3,600 347 8.2 7.9 14.4 6,469 5,291 970 130.1 115.7 402.5 2,611 2,043 533 6.7 6.1 11.5 6,957 4,003 2,913 179.4 119.1 625.6
728 383 340 7.7 5.4 15.6 2,276 827 1,444 241.8 115.9 661.2 1,190 88 1,091 12.8 6.3 14.0 5,284 227 5,041 564.5 161.3 643.1 9,951 5,753 4,127 7.6 6.0 12.2 30,322 10,032 20,181 230.1 104.1 594.3 7,928 3,675 4,195 8.6 6.4 12.4 21,366 3,758 17,584 231.5 65.2 519.7 1,282 258 60 7.1 6.0 10.1 3,188 604 68 175.5 139.7 114.3 1,075 1,034 3 5.3 5.3 3.9 1,588 1,468 21 78.7 75.0 265.8
13,716 7,806 5,630 7.2 5.4 13.6 42,812 15,222 27,315 225.3 105.2 660.1 5,530 4,323 1,166 6.3 5.6 12.1 13,704 8,019 5,646 155.0 102.7 584.7 2,408 2,221 139 5.0 4.8 12.2 4,899 4,196 632 102.5 91.2 554.9 2,364 1,913 399 5.8 5.3 11.6 4,986 3,145 1,748 122.5 86.6 508.0 4,051 3,354 667 6.8 6.3 11.9 8,966 5,736 3,218 150.5 107.2 574.5 7,064 3,033 3,947 ,8.6 6.0 12.8 19,191 3,570 15,577 233.6 71.1 502.6 1,061 1,040 6 6.5 6.4 7.4 2,281 2,213 17 138.6 136,9 209.9 4,905 2,457 2,332 8.2 6.1 13.0 15,075 4,472 10,422 251.5 110.6 581.7 4,410 3,760 569 6.1 5.7 10.9 11,369 8,506 2,769 156.5 128.6 529.2 9,909 6,698 3,071 6.9 5.7 12.9 23,543 10,665 12,711 161.8 89.6 527.2 3,426 3,094 182 5.1 4.9 12.1 7,731 6,199 814 114.1 97.0 541.6 4,148 1,443 2,682 8.7 5.8 11.8 13,418 1,468 11,888 280.4 59.4 523.1 – 5,245 3,670 1,531 6.6 5.6 12.9 13,920 6,261 7,611 176.3 94.7 638.7
797 699 1 5.6 5.5 1.9 1,778 1,188 13 125.2 93.3 240.7 1,533 1,324 164 5.6 5.2 12.6 3,173 2,268 748 116.0 89.1 572.3
877 664 152 6.6 6.0 11.6 1,791 1,055 636 134.5 94.6 484.8 738 723 6 5.4 5.3 6.8 1,506 1,488 12 109.6 110.0 134.8
6,990 4,309 2,528 7.2 5.8 12.7 20,415 8,251 12,081 210.8 110.4 605.6 1,643 1,376 40 7.6 7.6 7.8 4,198 2,804 165 160.8 129.4 254.2
17,705 10,940 6,144 7.4 6.1 12.4 56,905 26,177 29,377 238.1 145.3 593.6 6,696 3,482 3,043 7.9 6.1 12.2 16,055 3,641 11,975 190.0 63.6 479.9
591 524 10 4.9 4.8 9.2 1,107 755 12 92.4 68.7 110.1 11,401 8,259 3,023 6.8 5.7 12.9 30,130 15,917 14,092 178.1 110.4 601.8
3,517 2,579 646 6.8 6.2 12.3 7,315 3,557 2,705 140.4 85.8 516.4 2,132 1,892 104 4.9 4.7 10.4 6,378 5,580 509 147.9 138.8 506.5
10,323 7,605 2,576 6.5 5.6 13.0 28,094 14,669 13,274 176.9 107.0 668.4 769 651 86 6.3 5.9 11.5 1,907 1,454 414 156.5 131.1 552.7
4,479 1,820 2,634 8.6 5.9 12.6 11,973 2,079 9,875 230.3 67.9 472.1 678 547 6 5.1 4.8 7.6 1,780 905 13 134.1 79.4 164.6
5,524 3,371 2,109 8.0 6.4 13.6 13,739 4,662 9,061 198.5 87.8 582.0 18,959 13,847 4,822 6.9 6.0 12.4 36,406 19,205 17,052 133.1 83.4 436.5
2,161 2,063 20 5.2 5.1 9.1 2,593 2,318 83 62.0 57.7 377.3 465 464 5.9 6.0 1,080 1,064 9 137.0 136.1 321.4
5,849 3,335 2,356 7.5 5.8 12.3 15,055 4,908 10,076 191.9 85.4 525.0 3,457 2,923 273 5.1 4.8 10.2 9,227 7,324 1,095 136.0 121.0 407.7 1,968 1,810 149 6.7 6.4 12.3 3,846 3,215 628 130,5 114.3 519.9 4,022 3,323 604 5.4 4.8 12.7 10,376 7,050 2,968 138.7 102.8 624.2
769 727 19 7.3 7.2 16.4 867 753 40 82.1 74.9 344.8
1 Less than 3,,500 grams (5 pounds 8 Ounces)
.?.l”c!”de~ ~aces other than white and black.
3Marital status of mother is inferred; see Technical notes.
—

-----
�
Monthly Vital Statistics Report ~25
Table 15. Numbers, rates, and ratios of births to unmarried women, by age of mother and race of child: United States, 1980
[Based on 100 persent of births in selected States and on a 50-percent sample of births in all other States; aee Technical notes. For 41 States and the Oistrict of Columbia,
marital status of mother is reported on the birth certificate, and for 9 States, mother’s marital status is inferreti see Technical notes. Populations estimated as of July 1]
Age of mother All
races
Alleges . . . . . . . . . . . . . . . . 665,747
Under 15 years . . . . . . . . . . 9,024
15-19 years . . . . . . . . . . . . 262,777
15 years . . . . . . . . . . . 21,908
16 years . . . . . . . . . . . 41,386
17 yeara . . . . . . . . . . . 58,606
18 yeara . . . . . . . . . . . 69,173
19 years . . . . . . . . . . . 71,704
20-24 yeara . . . . . . . . . . . . 237,265
25-29 years . . . . . . . . . . . . 99,583
30-34 yeara . . . . . . . . . . . . 40,984
35-39 years . . . . . . . . . . . . 13,187
40 years and over. . . . . . . . 2,927
Number Rate per 1,000 unmarried women
Ratio per 1,000 live birthsin specifred group
White
320,063
3,144
127,984 9,223
19,653
28,885 34,427
35,796
112,854 46,872
20,565 7,073
1,573
Ail other All
White races
Total Black
345,684 325,737
5,880 5,707 134,793 128,022
12,685 12,223 21,733 20,786 29,721 28,196 } 34,746 32,929 35,908 33,889 }
124,411 117.423 52,711 49,077 20,419 18.766
6,114 5,513 1,356 1,229
129.4 117.6
..-. .-
27.6 16.2
20.6 11.8
39.0 23.6
40.9 24.4
34.0 20.7
21.1 13.6
9.7 6.8
22.6 21.8
All other All otherAll
White races
Total Black Total Black
177.2 182.9 184.3 110.4 484.5 552.5
- 887.4 753.8 980.3 985.2
81.7 89.2 475.9 329.8 821.4 851.5
777.5 615.7 961.1 971.6
63.1 69.6 654.9 495.2 924.3 940.7
548.5 395.7 877.9 901.1
451.1 312.5 805.1 838.2 111.6 120.2
357.4 238.3 712.7 751.4
106.6 115.1 193.5 114.9 510.6 560.2
79.1 83.9 89.9 50.2 301.0 361.7
46.9 48.2 74.5 44.8 223.9 291.5
19.2 19.6 93.7 62.5 221.0 280.8
25.6 25.6 120.5 84.7 235.9 293.0
1 ,qata~ ~omputed by relating total births to unmarriad mothers, regardless of age of mother, to unmarried WOmen aged 15-44 YeaH.
2Rat~s ~Om@~d by relatjn~ births to u“martied mothers aged 40 years and over tO unmarried WOmen aged 40-44 Years.
—

26 ~ Monthly Vital Statistics Fteporl
Table 16. Birth rates for unmarried women by age of mother and race of child: United States, 1970-80
[Rates are live births to unmarried women per 1,000 unmarried women in specified group, estimated as of July 1]
Age of mother
Year and race
ALL RACES
Reported3
19804, . . . . . . . . . . . . . . . .
Estimated5
19804 . . . . . . . . . . . . . . . . .
19794 . . . . . . . . . . . . . . . . . 19784, ., . . . . . . . . . . . . . .
19774, . . . . . . . . . . . . . . . . 19764 . . . . . . . . . . . . . . . . .
19754 ...,.,.,,...,,,., 19744 .,........,.,.,.,
19734 . . . . . . . . . . . . . . . . .
19724 . . . . . . . . . . . . . . . . .
19716 . . . . . . . . . . . . . . . . . 19706, . . . . . . . . . . . . . . . .
WHITE
Reported3
19804, . . . . . . . . . . . . . . . .
Estimated5
19804 . . . . . . . . . . . . . . . . .19794 ...,..,.,.,.,.,.,
19784 . . . . . . . . . . . . . . . . .19774, .,.,.........,..
19764, . . . . . . . . . . . . . . . .
19754 . . . . . . . . . . . . . . . . .
19744 .,.,........,.,.,
19734 .,......,.,.,.,.,19724 . . . . . . . . . . . . . . . . .
19716 . . . . . . . . . . . . . . . . .
19706 . . . . . . . . . . . . . . . . .
ALL OTHER
Reported3
19804 . . . . . . . . . . . . . . . . .
Estimated5
19804 .,............,..19794 .,........,.,.,.,
19784 . . . . . . . . . . . . . . . . .19774 . ., ., ., ., .,..,...
19764, . . . . . . . . . . . . . . . .19754 . . . . . . . . . . . . . . . . .79744 . . . . . . . . . . . . . . . . .
19734 . . . . . . . . . . . . . . . . .19724 . . . . . . . . . . . . . . . . .19716 . . . . . . . . . . . . . . . . .
19706, . . . . . . . . . . . . . . . .
See footnotes at end of table.
15-54 75– 19 years years 1 20–24 25–29 30-34 35-39 40-442
Total 75-17 18– 19 years years years years years years years
29.4 27.6 20.6 39.0 40.9 34.0 21.1 9.7 2,6
28.4 28.2 21.4 39.4 39.7 30.5 17.4 7.8 2.2 27.2 26.4 19,9 37,2 37.7 29.9 17.7 8.4 2.3 25.7 24.9 19.1 35.1 35.3 28.5 16.9 8.2 2,2 25,6 25.1 19.8 34.6 34.0 27.7 16.9 8.4 2.4 24.3 23.7 19.0 32.1 31,7 26.8 17.5 9.0 2.5 24.5 23,9 19.3 32.5 31.2 27,5 17,9 9.1 2.6 23.9 23.0 18.8 31.2 30.5 27.9 18.4 10.0 2.6 24.3 22.7 18.7 30.4 31.5 29.6 20.3 10.8 3.0 24.8 22.8 18,5 30.9 33.2 30.8 22.6 12,0 3.1 25.5 22.3 17.5 31,7 35.5 34.5 25.2 13.3 3.5 26.4 22.4 17.1 32.9 38.4 37.0 27.1 13.3 3.6
!
17.6 16.2 11,8 23.6 24.4 20.7 13.6 6.8 1.8
16.2 16.0 11.8 23.1 22.6 17,3 10.3 5.0 1.3 —
14.9 14,6 10.8 21.0 20.3 15.9 10.0 5.1 1.4 13.7 13,6 10.3 19.3 18.1 14.8 9.4 4.8 1.3 13.5 13.4 10,5 18,7 17.4 14.4 9.3 4.9 1.4 12.6 12.3 9,7 16.9 15.8 14.0 10.1 5,5 1.4 12,4 12.0 9.6 16.5 15.5 14.8 9.8 5.4 1.5 11,7 11.0 8.8 15.3 15.0 14.7 9.5 5.5 1.5 11.8 10.6 8.4 14.9 15.5 15,9 10,6 5.9 1.7 11.9 10,4 8.0 15.1 16.6 16,5 12,1 6.5 1.6 12.5 10.3 7.4 15,8 18.7 18.5 13.2 7.2 1.9 13.8 10.9 7.5 17.6 22.5 21.1 14.2 4,4 . . .
77.2 81.7 63,1 111.6 106.6 79.1 46.9 19,2 5.6
78,1 86.4 67.7 116.3 107.6 75.4 42.3 16.9 5.3 78.2 83,9 64.8 115.3 107.1 7.7.7 44.8 19.1 5.7 76.5 81,2 63.2 111.6 104.9 76.4 43,6 18.2 5.6 77.4 84,0 67.2 112.7 103.1 74.4 43.7 18.5 6.6 76.4 82.5 67,5 108.9 101.1 74.0 43.4 18.7 6.9 79.0 86.3 70.7 114,3 102.1 73.2 47.9 20,0 6.9 80,3 87.3 73.2 113.4 103.0 77.0 50.9 23.2 6.6 83.2 88.5 75.6 112.8 107,8 81.0 55.8 26.2 7.2 86.2 91,8 77.6 119.3 112.4 83.3 55.7 29.0 8.2 90.2 92.0 75.4 125.4 120.6 92,6 65,3 32.2 10.4 89.9 90.8 73.3 126.5 121.0 93.8 69.8 21,7 ..-
.
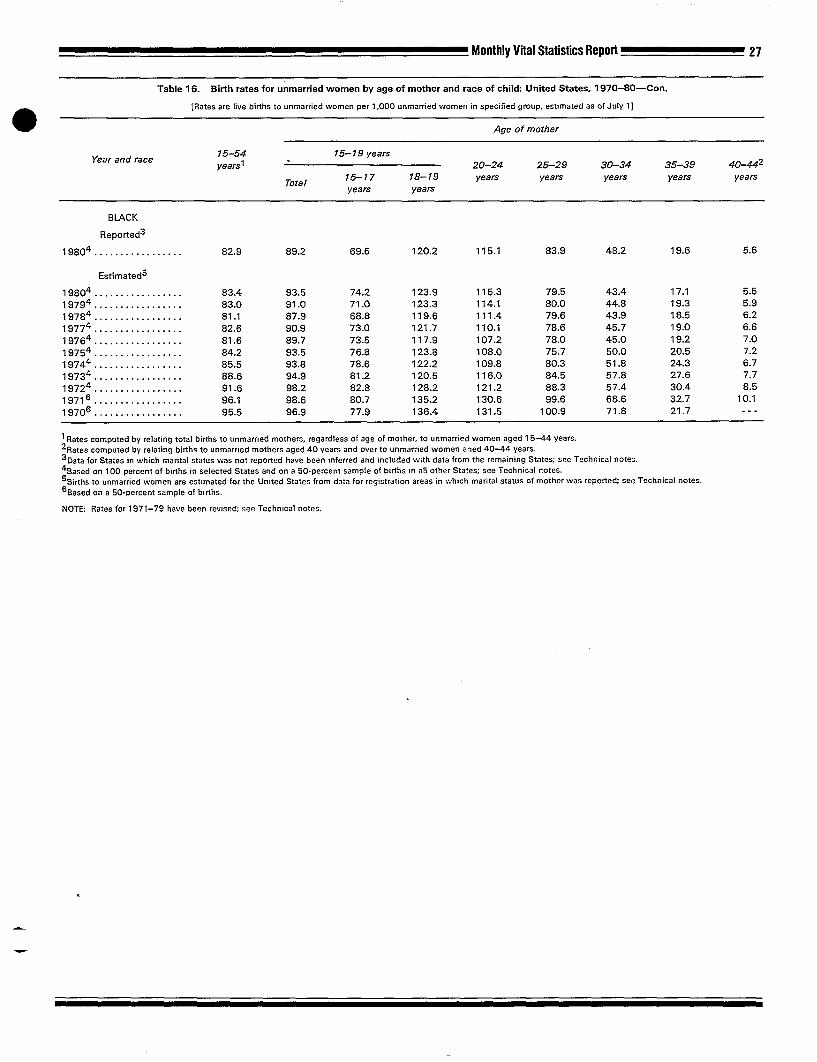
19804
Monthly Vital Statistics Repott ~ 27
Table 16. Birth rates for unmarried women by age of mother and race of child: United Statea, 1970-80—Con.
[Rates are live births to unmarried women per 1,000 unmarried women in specified group, estimated as of July 1]
� Age of mother
Year and race 75-54 15-19 years vears; 20-24 25-29 30-34 35–39 40442
Total 15-17 18-19 years years years years years years years
BLACK
Reportad3
19804 . . . . . . . . . . . . . . . . . 82.9 89.2 69.6 120.2 115.1 83.9 48.2 19.6 5.6
Estimatad5
,9794 . . . . . . . . . . . . . . . . . 83.4 93.5 74.2 123.9 15.3 79.5 43.4 17.1 5.5
. . . . . . . . . . . . . . . . . 83.0 91.0 71.0 123.3 14.1 80.0 44.8 19.3 5.9
19784 . . . . . . . . . . . . . . . . . 81.1 87.9 68.8 119.6 11.4 79.6 43.9 18.5 6.2
19774 . . . . . . . . . . . . . . . . . 82.6 90.9 73.0 121.7 110.1 78.6 45.7 19.0 6.6
19764 . . . . . . . . . . . . . . . . . 81.6 89.7 73.5 117.9 107.2 78.0 45.0 19.2 7.0
19754. . . . . . . . . . . . . . . . . 84.2 93.5 76.8 123.8 108.0 75.7 50.0 20.5 7.2
19744 . . . . . . . . . . . . . . . . . 85.5 93.8 78.6 122.2 109.8 80.3 51.8 24.3 6.7
19734 . . . . . . . . . . . . . . . . . 88.6 94.9 81.2 120.5 116.0 84.5 57.8 27.6 7.7
19724 . . . . . . . . . . . . . . . . . 91.6 98.2 82.8 128.2 121.2 88.3 57.4 30.4 8.5
19716 . . . . . . . . . . . . . . . . . 96.1 98.6 80.7 135.2 130.6 99.6 68.6 32.7 10.1
19706 . . . . . . . . . . . . . . . . . 95.5 96.9 77.9 136.4 131.5 100.9 71.8 21.7 . . .
1Rate$ c~mp”te,j @ ~elating total births to unmarried mothers, regardless of age of mother. to unmarried women aged 15-44 Years.
2Rate~ computed by ,elating births to unmamed mothers aged 40 years and over to unmarr!ed Women aqed 40-44 Years.?.Data for states i“ ~hi~h ~arltal status WaS “ot reponed have been referred and Included with data frOm the remain!n9 $tate~ see Technical nOte~.4Sa~ed on ,00 ~arce”t of bi~h~ ,“ selected States and cm a !jO.percent sample of births m ail other States: see Technical ‘Otes,
s~iflh~ to unmarried ~ome” are ~~tlmated for the IJ”lted Sta;es from data for reg!strat!on areas m wh8ch marital status Of mother was repO~ed; $ee Technical ‘otes.
6~a$ed ~“ ~ so-percent sample Qf births,
NOTE: Rates for 1971-79 have been rewsed; see Technmal notes. —

�
28 ~ Monthly Vital Statistics Report
Table 17. Live births by intervalsince last live birth, live-birth order, and race of child: Total of 48 reporting States and the District of Columbia, 1980
[Basad on 100 percent cd births in selected States and on a 50-percent sample of births in all other States; see Technical notes. Refers only to second and higher order births.
Live-birth order refers to number of childrcm bom alive to mother]
Live-bifih order AJI second
Interval since last live birth and race of child and higher 8 and
order births 1 2 3 4 5 6 7
All races2 ‘
Total . . . . . . . . . . . . . . . . . . . . . . . . . . . . . . . . . . . . . . .
Omonths (plural deliveries), . . . . . . . . . . . . . . . . . . . . l-n months . . . . . . . . . . . . . . . . . . . . . . . . . . . . . . 12-17 months . . . . . . . . . . . . . . . . . . . . . . . . . . . . . . . .
18-23 months, ., . . . . . . . . . . . . . . . . . . . . . . . . . . . .
24-35 months . . . . . . . . . . . . . . . . . . . . . . . . . . . . . . . . . .
36-47 months............,.,., . . . . . . . . . . . . .
48-59 months..............,.,., . . . . . . . . . . .
60-71 months................,.. . . . . . . . . . . . 72 months and over . . . . . . . . . . . . . . . . . . . . . . . . . .
Notstated . . . . . . . . . . . . . . . . . . . . . . . . . . . . . . . . .
White
Total . . . . . . . . . . . . . . . . . . . . . . . . . . . . . . . . . . . . . . . .
Omonths (plurai deliveries) . . . . . . . . . . . . . . . . . . . . .
I-n months...............,.. . . . . . . . . . . . . . . . . . 12–17 months . . . . . . . . . . . . . . . . . . . . . . . . . . . . . . . 18-23 months . . . . . . . . . . . . . . . . . . . . . . . . . . . . . . . . . .
24–35 months . . . . . . . . . . . . . . . . . . . . . . . . . . . . . . . . . .
36-47 months . . . . . . . . . . . . . . . . . . . . . . . . . . . . . . . . . . 48-59 months . . . . . . . . . . . . . . . . . . . . . . . . . . . . . . . . . .
60–71 months . . . . . . . . . . . . . . . . . . . . . . . . . . . . . . .
72 months and over. . . . . . . . . . . . . . . . . . . . . . . . . . . Not stated,.,............,.,., . . . . . . . . . . . . . . . . . .
Black
Total . . . . . . . . . . . . . . . . . . . . . . . . . . . . . . . . . . . . . . . . . .
Omonths (plural deliveries) . . . . . . . . . . . . . . . . . . . . . . . .
I-n months . . . . . . . . . . . . . . . . . . . . . . . . . . . . . . . . . . .
12-17 months . . . . . . . . . . . . . . . . . . . . . . . . . . . . . . . . . .
18–23 months, . . . . . . . . . . . . . . . . . . . . . . . . . . . . . . . . .
24-35 months . . . . . . . . . . . . . . . . . . . . . . . . . . . . . . .36–47 months . . . . . . . . . . . . . . . . . . . . . . . . . . . . . . . . . .
48-59 months . . . . . . . . . . . . . . . . . . . . . . . . . . . . . . . . . .
60–71 months . . . . . . . . . . . . . . . . . . . . . . . . . . . . . . . . . .72 months and over . . . . . . . . . . . . . . . . . . . . . . . . . . . . . .
Not stated . . . . . . . . . . . . . . . . . . . . . . . . . . . . . . . . . . . . . .
1Excludes not stated birth order.2r”cludes races other than white and black.
over
1,828,794 1,032,990 482,508 180,463 69,688 30,786 14,875 17,484
26,225 9,655 8,663 4,477 1,904 770 348 408 29,660 15,278 7,650 3,560 1,625 759 361 427
195,521 102,654 51,008 22,820 9,524 4,464 2,158 2,893 242,749 136,920 60,819 25,640 9,917 4,510 2,171 2,772
408,012 248,437 97,502 35,865 13,528 6,088 3,056 3,536 269,966 164,643 68,134 22,612 7,775 3,379 1,532 1,951
169,343 97,978 47,125 14,831 5,196 2,127 956 1,130 112,020 62,397 32,672 10,161 3,699 1,532 753 806 275,566 138,046 84,665 30,613 12,334 5,214 2,478 2,216
99,732 56,982 24.270 9,884 4,246 1,943 1,062 1,345
1,451,725 846,183 380,477 133,821 49,101 20,974 9,931 11,238
20,203 7,826 6,821 3,313 1,313 487 195 248
19,740 11,044 4,985 2,065 864 390 186 206 146,174 81,270 37,818 15,498 5,924 2,725 1,242 1,697 , 197,328 115,720 48,540 19,351 7,140 3,199 1,486 1,892 342,093 215,136 79,744 27,987 10,146 4,403 2,218 2,459
222,667 139,553 56,600 17,247 5,666 2,357 1,069 1,275
135,080 79,474 37,840 11,153 3,764 1,467 656 726 86,811 48,706 25,806 7,616 2,562 1,074 521 527
206,298 102,827 65,406 22,603 8,869 3,614 1,643 1,336
75,331 44,627 18,018 6,988 2,853 1,258 715 872
307,944 149,904 84,242 39,149 17,317 8,146 4,095 5,091
5,232 1,558 1,578 1,046 518 255 140 137
8,411 3,642 2,293 1,281 657 318 149 171
40,547 16,852 11,104 6,284 3,088 1,447 775 997
36,313 16,293 10,071 5,270 2,305 1,060 585 729
52,045 25,447 14,409 6,503 2,768 1,381 672 865
38,013 19,716 10,346 4,483 1,703 839 384 543 27,824 14,879 7,560 3,060 1,208 543 242 332
20,829 11,339 5,617 2,090 958 397 194 234
59,795 30,629 16,349 6,885 3,051 1,378 712 791
18,935 9,649 4,916 2,247 1,061 528 242 292
NOTE Excludes data for Louisiana and Texas, which did not require reporting of date of last live birth.

Monthly Vital Statistics Repofi ~ 29
Table 18. tiveti@hs byeducational attainment ofmother and father andrace ofchild: Total of47repoRing States andthe District of Columbia, 1980
[Based cm 100 percent of births in selected States and on a 50-percent sample of births in all other States; see Technical notes]
0 Mother Father Years of school complated
All racesl White Black All racesl White Black
Total . . . . . . . . . . . . . . . . . . . . . . . . . . . . . . . . . . . . . . . 2,867,871 2,277,269 505,747 2,867,871 2,277,269 505,747
0-5 years . . . . . . . . . . . . . . . . . . . . . . . . . . . . . . . . . . . 18,597 13,175 2,424 19,339 15,057 2,283 6years . . . . . . . . . . . . . . . . . . . . . . . . . . . . . . . . . . . . . . 15.083 11,536 2,171 15,409 12,715 1,698 7 years . . . . . . . . . . . . . . . . . . . . . . . . . . . . . . . . . . . . . . 17,759 12,282 4,666 13,186 10,622 2,045
?8years . . . . . . . . . . . . . . . . . . . . . . . . . . . . . . . . . . . . . . 69,094 51,445 14,921 54,022 46,376 5,860 9years . . . . . . . . . . . . . . . . . . . . . . . . . . . . . . . . . . . . . . 122,888 89,424 29,654 67,955 57,706 8,363 10 years . . . . . . . . . . . . . . . . . . . . . . . . . . . . . . . . . . . . 202,407 144,025 52,611 122,604 100,980 8,575 11 years . . . . . . . . . . . . . . . . . . . . . . . . . . . . . . . . . . . . 222,820 142,972 73,683 141,627 107,647 30,305
12 years . . . . . . . . . . . . . . . . . . . . . . . . . . . . . . . . . . . . ,252,011 1,012,581 270.704 1,011,774 847,499 139,804
13 years . . . . . . . . . . . . . . . . . . . . . . . . . . . . . . . . . . . . 212,379 175,998 31,694 147,084 127,471 15,913
14years . . . . . . . . . . . . . . . . . . . . . . . . .’ . . . . . . . . . . . 211,580 174,025 31,639 221,626 192,341 23,286
15 years . . . . . . . . . . . . . . . . . . . . . . . . . . . . . . . . . . . . 82,702 68,375 11,667 80,987 69,232 9,371
16years . . . . . . . . . . . . . . . . . . . . . . . . . . . . . . . . . . . . 274,449 242,475 22,093 310,562 282.031 19,049
17years ormore . . . . . . . . . . . . . . . . . . . . . . . . . . . . . 122,145 107,000 9,003 230,869 209,168 10,648
Not stated . . . . . . . . . . . . . . . . . . . . . . . . . . . . . . . . . . . 43,957 31,956 8,817 430,827 198,424 218,547
1 ,nclude~ ~aces other than white and black.
NOTE: Excludes data for California, Texas, and Washington, which did not require repmting of educational attainment of mother and father.

30 ~ Monthly Vital Statistics Report
Table 19. Live births by educational attainment of mother, age of mother, and race of child: Total of 47 reporting Statea and the
District of Columbia, ‘1980
[Based on 100 percent of births in selected States and on a 50-per.ent sample of births in ail other States; see Technical notes]
Years of school completed by mother
Age of mother and race of child Total O–8 9-7? 12 13-15 16 years Not
years years years years or more stated
All racesl
Alleges . . . . . . . . . . . . . . . . . . . . . . ,., .,. 2,867,871 120,533 548,115 1,252,011 506,661 396,594 43,957
Under 15 yeara. . . . . . . . . . . . . . . . . . . . . . 8,291 5,965 2,083 243 15–19 years . . . . . . . . . . . . . . . . . . . . . . . . 439,281 32,020 235,022 151,299 12,699 113 8,128
15 yeara, . . . . . . . . . . . . . . . . . . 22,525 6,868 15,158 174 525 16 years . . . . . . . . . . . . . . . . . . . . . ., 50,551 6,398 41,897 1,192 16 , 1,048 17 years........,.........,., . 85,309 6,044 63,993 13,366 195 1,711 18 years . . . . . . . . . . . . . . . . . . . . . 122,059 6,437 59,299 52,103 2,048 2,172 19 years . . . . . . . . . . . . . . . . . . . 158,837 6,473 54,675 84,464 10,440 113 2,672
20–24 years . ., ., ., . . . . . . . . . . . 973,746 32,618 186,432 527,808 173,052 39,303 14,533 25–29 years . ., ., . . . . . . . . . . . . . . . . . . . 884,636 23,722 77,147 374,955 208,642 188,084 12,086 30–34 years........,.,...,.,.. . . . . 434,383 15,654 31,671 151,352 91,273 137,969 6,464 35-39 years . . . . . . . . . . . . . . . . . . . . . . . . 108,969 7,952 12,599 39,558 18,600 28,203 2,057 40 years and over . . . . . . . . . . . . . . . . . 18,565 2,602 3,161 7,039 2,395 2,922 446
White
Alleges . . . . . . . . . . . . . . . . . . . . . . ,., .,. 2,277,269 88,438 376,421 1,012,581 418,398 349,475 31,956
Under 15 years . . . . . . . . . . . . . . ,., .,.,. 2,953 2,215 627 111 15–19 years . . . . . . . . . . . . . . . . . . . . . 298,032 23,630 154,785 106,525 7,778 77 5,237
15 years . . . . . . . . . . . . . . . . . . . . 10,965 3,747 6,883 71 264 16 years, . . . . . . . . . . . . . . . . . . . . 30,014 4,573 24,145 672 9 615 17 years . . . . . . . . . . . . . . . . . . . . . . . 56,053 4,774 41,857 8,194 119 1,109 18 years.....,......,.,.,.. .,. 84,967 5,234 41,890 35,253 1,154 1,436 19 years . . . . . . . . . . . . . . . . . . . . 116,033 5,302 40,010 62,335 6,496 77 1,813
20–24 years . . . . . . . . . . . . . . . . . . . . . . . . 770,238 26,060 136,145 429,232 135,724 32,639 10,438 25-29 years . . . . . . . . . . . . . . . . . . . . . . . . 743,117 17,823 53,483 315,134 179,600 167,760 9,317 30–34 years . . . . . . . . . . . . . . . . . . . . . . . . 362,502 ,11,343 21,156 124,487 77,869 122,584 5,063 35–39 years . . . . . . . . . . . . . . . . . . ,., .,. 86,599 5,626 8,257 31,706 15,508 23,994 1,508
40 years and over. . . . . . . . . . . . . . . . . . 13,828 1,741 1,968 5,497 1.919 2,421 282
Black
Alleges, . . . . . . . . . . . . . . . . . . . . . ., .,., 505,747 24,182 155,948 210,704 75,000 31,096 8,817
Under 15 years . . . . . . . . . . . . . . . . ., .,., 5,166 3,631 1,416 119 15–19 years, . . . . . . . . . . . . . . . . . . . . 130,431 7,289 74,599 41,520 4,598 29 2,396
15 years . . . . . . . . . . . . . . . . . . . . . . . 11,044 2,758 7,950 98 238 16 years . . . . . . . . . . . . . . . . . . . 19,412 1,635 16,916 490 7 364 17 years . . . . . . . . . . . . . . . . . . . . . . . 27,172 1,077 20,639 4,882 69 505 18 years . . . . . . . . . . . . . . . . . . . . . ,. 34,046 961 15,932 15,716 838 599 19 years, . . . . . . . . . . . . . . . . . . . . ,. 38,757 858 13,162 20,334 3,684 29 690
20–24 years . . . . . . . . . . . . . . . . . . . ., .,. 178,962 4,451 45,049 87,648 33,233 5,469 3,112 25–29 years . . . . . . . . . . . . . . . . . . . ., .,. 115,612 3,733 20,782 51,359 23,986 13,867 1,885 30–34 years . . . . . . . . . . . . . . . . . . . ., .,. 54,796 2,865 9,173 22,331 10,456 9,066 905 35-39 years . . . . . . . . . . . . . . . . . . ,., .,. 17,070 1,639 3,843 6,517 2,356 2,386 329 40 years and over . . . . . . . . . . . . . . . . . . 3,770 574 1,086 1,329 371 279 71
1 Includes races other than white and black
NOTE: Excludes data for California, Texas, and Washington, which did not require reporting of educational attainment of mother,

�
Monthly Vital Statistics Repoft ~ 31
Table 20. Live births by month of pregnancy prenatal care began, age of mother, and race of child: United States, 1980
[Based on 100 percent of births in selected States and on a 50-percent sample of births in all other States; see Technical notes]
Age of mother and race of child
All racesl
All ages . . . . . . . . . . . . . . . . . . . . . . . . . . . . .
Under 15 years . . . . . . . . . . . . . . . . . . . . . . .
15-19 years . . . . . . . . . . . . . . . . . . . . . . . . . 15 years . . . . . . . . . . . . . . . . . . . . . . . . 16 years . . . . . . . . . . . . . . . . . . . . . . . . 17 years . . . . . . . . . . . . . . . . . . . . . . . . 18 years . . . . . . . . . . . . . . . . . . . . . . . . 19 years . . . . . . . . . . . . . . . . . . . . . . . .
20-24 years . . . . . . . . . . . . . . . . . . . . . . . . . 25-29 years . . . . . . . . . . . . . . . . . . . . . . . . . 30-34 years . . . . . . . . . . . . . . . . . . . . . . . . . 35-39 years . . . . . . . . . . . . . . . . . . . . . . . . . 40years and over . . . . . . . . . . . . . . . . . . . . .
White
Alleges . . . . . . . . . . . . . . . . . . . . . . . . . . . . .
Under 15 years . . . . . . . . . . . . . . . . . . . . . . . 15-19 years . . . . . . . . . . . . . . . . . . . . . . . . .
15 years . . . . . . . . . . . . . . . . . . . . . . . .
16 years . . . . . . . . . . . . . . . . . . . . . . . . 17 years . . . . . . . . . . . . . . . . . . . . . . . . 18 years . . . . . . . . . . . . . . . . . . . . . . . . 19 years . . . . . . . . . . . . . . . . . . . . . . . .
20-24 years . . . . . . . . . . . . . . . . . . . . . . . . . 25-29 years . . . . . . . . . . . . . . . . . . . . . . . . .
— 30-34 years . . . . . . . . . . . . . . . . . . . . . . . . . 35-39 years . . . . . . . . . . . . . . . . . . . . . . . . . 40 years and over . . . . . . . . . . . . . . . . . . . . .
Black
Alleges . . . . . . . . . . . . . . . . . . . . . . . . . . . . .
Under 15 years . . . . . . . . . . . . . . . . . . . . . . . 15-19 years . . . . . . . . . . . . . . . . . . . . . . . . .
15 years . . . . . . . . . . . . . . . . . . . . . . . . 16 years . . . . . . . . . . . . . . . . . . . . . . . . 17yaars . . . . . . . . . . . . . . . . . . . . . . . . 18 years . . . . . . . . . . . . . . . . . . . . . . . . 19 years . . . . . . . . . . . . . . . . . . . . . .
20-24 years . . . . . . . . . . . . . . . . . . . . . . . . . 25-29 years . . . . . . . . . . . . . . . . . . . . . . . . .
30-34 years . . . . . . . . . . . . . . . . . . . . . . . . . 35-39 years . . . . . . . . . . . . . . . . . . . . . . . . . 40years and over . . . . . . . . . . . . . . . . . . . . .
1 ,“clude~ ~.sees other than white and black,
Month of pregnancy prenatal care began
Total No -Isr and 2d 3d 4th-6th 7th-9th Not
prenatalmonth month month month stated
care
3,612,258 1,812,854 867,071 652,340 134,204 46,211 99,578
10,169 1,620 1,726 4,412 1,415 529 467
552,161 166,814 133,021 177,871 41,042 14,058 19,355 28,178 5,780 5,850 11,334 2,943 1,125 1,146
63,198 14,672 14,273 23,942 5,788 1,981 2,542 106,846 28,414 25,368 37,507 8,675 2,989 3,893 153,333 46,148 37,484 49,465 11,139 3,777 5,310 200,606 71,800 50,036 55,623 12,497 4,186 6,464
1,226,200 590,979 302,169 233,980 48,416 16,550 34,106 1,108,291 648,105 260,849 138,923 25,121 8,501 26,792
550,354 323,469 129,364 67,593 12,018 4,144 13,766 140,793 72,200 34,092 23,737 4,770 1,851 4,143
24,290 9,667 5,850 5,824 1,422 578 949
2,898,732 1,540,198 701,759 464>290 91,665 28,627 72,193
4,171 685 725 1,693 654 250 164
388,058 124,929 96,988 118,295 26,926 8,298 12,622 14,979 3,244 3,225 5,766 1,592 556 596 39,685 9,692 9,242 14,542 3,560 1,146 1,503
72,993 20,327 18,091 24,716 5,658 1,715 2,486 110,178 34,926 27,774 34,057 7,535 2,294 3,592 150,223 56,740 38,656 39,214 8,581 2,587 4,445
982,526 500,363 244,890 168,599 33,508 10,447 24,719
933,159 567,162 219,324 103,291 17,556 5,369 20,457 459,151 279,001 ‘ 107,814 50,652 8,514 2,663 10,507 113,124 60,325 27,482 17,556 3,468 1,224 3,069
18,543 7.733 4,536 4,204 1,039 376 655
569,616 219,121 136,718 161,793 34,528 15,459 21,997
5)793 908 970 2,647 716 270 282 150,353 38,255 33,143 55,113 12,592 5,322 5,928
12,580 2,430 2,509 5,331 1,260 539 511 22,096 4,713 4,724 8,850 2,067 777 965 31,290 7,471 6,784 11,907 2,674 1,205 1,249
39,285 10,160 8,894 14,167 3,206 1,356 1,502 45,102 13,481 10,232 14,858 3,385 1,445 1,701
209,596 77,680 49,459 57,032 12,275 5,342 7,808 135,680 62,069 32,294 28,397 5,495 2,649 4,776
64,369 30,681 15,190 12,667 2,334 1,203 2,294
19,631 8,154 4>692 4,679 860 514 732 4,194 1,374 970 1,258 256 159 177

.
Tabla 21. Live births by month of pregnancy prenatal cara bagan and rata of child: Unitad States, 1980
[Based on 100 percent of births in selected States and on a 50-percent sample of births in all other States; see Technical notes]
Month of pregnant y prenatal care began
Race of child Total No 7st and 2d 3d 4th 5th 6th 7th 8th 9th Not
prenatal month month month month month month month month stated
care
Allracesl . . . . . . . . . . . . . . . . . . . . . . . . . . . . . . . . . . . . . . . . . . . . 3,612,258 1,812,654 867,071 350,229 89,800 112,311 73,122 43,010 18,072 46,211 99,576
White. . . . . . . . . . . . . . . . . . . . . . . . . . . 2,898,732 1,540,198 701,759 257,389 30,604 76,297 49,916 29,438 12,309 28,627 72,193
Black . . . . . . . . . . . . . . . . . . . . . . . . . . . . . . . . . . . . . . . . . . . . . . . . 569,616 219,121 136,718 79,871 51,163 30,759 19,171 10,858 4,499 15,459 21,997
1 Includes races other than whita and black.
Table 22. Live births by number of prenatal visits and rece of child: Total of 48 raporting States and tha District of Columbia, 1980
[Based on 100 percent of births in selected States and on a 50-percent sample of births in all other States; see Technical notes]
Number of prenatal visits
Race of child Total No 7-2 3–4 ‘ 5–6 7-8 9–lo 11–12 13–14 15–16 17–18 19 visits Not
visits visits visits visits visits visits visits visits visits visits or more stated .
Allracasl . . . . . . . . . . . . . . . . . . . . . . . . . 3,183,194 41,943 59,311 111,701 218.744 375,518 681,064 858,659 403,755 218,853 45,922 62,497 115,227
White . . . . . . . . . . . . . . . . . . . . . . . . . 2,546,279 25,112 35,404 69,142 148,531 282,895 551,881 733,347 349,573 186,803 38,839 42,732 82,020
Black . . . . . . . . . . . . . . . . . . . . . . . . . 546,845 15,105 21,169 37,421 61,421 80,013 110,153 104,671 44,436 27,785 6,195 8,777 29,699
1 I“ci”des races other than white and btack.
NOTE: Excludes data for California and New Mexico, which did not require reporting of number of prenatal visits.

Table 23. Live births by number of prenatal visits, month of pregnancy prenstal care bagan, and race of child: Total of 48 reporting Statea and the District of Columbia, 1980
[Based on 100 percent of births in selected States and on a 50.percent sample of births in all other States; see Technical notes]
Number of prenatal visits
began and race of child No 1-2 3-4 5-6 7-8 9-1o 11-12 13-74 15-16 17-18 19 visits Not visits visits visits visits visits visits visits visits visits visits or more stated
Allracesl . . . . . . . . . . . . . . . . . . . . . . . . . 3,183,194 41,943 59,311 111,701 218,744 375,518 681,064 858,659 403,755 . 218,853 45,922 52,497 115,227
lstand2d month..........,.,,, .,, 1,603,476 . . . 6,677 13,048 41,486 121,801 313,375 549,896 293,418 164,645 34,460 38,786 25,684 3d month . . . . . . . . . . . . . . . . . . . . . . . . . 765,256 5,484 13,880 47,132 103,177 214,628 227,147 84,063 40,243 8,692 9,345 11,465 4th-6th month . . . . . . . . . . . . . . . . . . . . 573,329 . . . 16,685 49,669 101,480 133,150 142,591 76,139 24,262 12,766 2,423 3,912 10,032 7th-9th month . . . . . . . . . . . . . . . . . . . . 118,140 ,.. 28,559 33,345 26,641 15,045 7,145 2,764 826 516 98 170 3,029 No prenatal care . . . . . . . . . . . . . . . . . . . 41,943 41,943 . . . . . . . . . . . . . . . .,. . . . . . . . . . . . . . . . Not stated . . . . . . . . . . . . . . . . . . . . . . . . 81,050 . . . 1,706 1,559 2,005 2.345 3,325 2,713 1,166 681 249 284 65,017
White . . . . . . . . . . . . . . . . . . . . . . . . . . . . 2,546,279 25,112 35,404 69,142 148,531 282,B95 551,881 733,347 349,573 186,803 38,839 42,732 82,020
lstand2d month . . . . . . . . . . . . . . . . . . 1,366,343 . . . 4,477 8,226 29,737 96,822 264,348 479,794 257,544 143,598 29,626 32,437 19,734 3d month . . . . . . . . . . . . . . . . . . . . . . . . . 618,403 . . . 3,247 8,536 32,807 79,634 175,871 191,106 71,760 32,885 7,128 7,281 8,148 4th-6 th month........,...,,.. . . . . 400,275 . . . 8,975 29,602 66,341 94,154 104,152 58,204 18,710 9,386 1,812 2,673 6,264 7th-9 th month . . . . . . . . . . . . . . . . . . . . 78,860 . . . 17,779 21,844 18,313 10,635 5,097 2,043 623 400 76 119 1,931 No prenatal care . . . . . . . . . . . . . . ,,, ., 25,112 25,112 . . . . . . . . . . . . ,.. . . . . . . . . . . . . ,.. . . . Notstated .,........,.,,,,..,.. . . . 57,286 . . . 926 934 1,333 1,650 2,413 2,200 936 532 197 222 45,943
Black, . . . . . . . . . . . . . . . . . . . . . . . . . . . . 546,845 15,105 21,169 37,421 61,421 80,013 110,153 104,671 44,436 27,7B5 6,195 8,777 29,699
lstand2d month . . . . . . . . . . . . . . . ,., 199,055 . . . 2,156 4,287 10,248 21,357 41,121 57,598 29,000 18,034 4,199 5,654 5,401 3d month . . . . . . . . . . . . . . . . . . . . . . . . . 126,048 . . . 2,003 4,696 12,568 20,338 33,078 30,371 10,255 6,471 1,387 1,863 3,018 4th-6th month . . . . . . . . . . . . . . . . . . . . 152,846 . . . 78055 18,276 31,161 34,168 33,516 15,637 4,836 3,058 540 1,157 3,422 7th-9th month.,.........,,.. . . . . . 33,063 ,,. 9,269 9,698 6,913 3,601 1,694 625 169 100 21 50 923 No prenatal care . . . . . . . . . . . . . . . . . . . 15,105 15,105 . . . .,. . . . ,,. . . . . . . . . . . . . . . . Not stated . . . . . . . . . . . . . . . . . . . .,, ,. 20,728 . . . 686 464 511 549 7“44 440 176 122 48 53 16,935
1 lnclude~ ~aCeS other than white and black.
NOTE: Excludes data for California and New Mexico, which did not require repmting of number of prenatal visits.
Month of pregnancy prenatal care Total
w w

Table 24. Live births by birth weight, period of gestation, and race of child: Total of 48 reporting States and the District of Columbia, 1980
[Based on 100 percent of births in selsctsd States and on a 50-percent sample of births i“ all other States; see Technical notes]
Period of gestation and race of child
All rac.esz
Total, . . . . . . . . . . . . . . . . . . . . . . . . . . . . . . .
Under 28 weeks...........,.. . . . . . . . .
28–31 weeks . . . . . . . . . . . . . . . . . .
32–35 weeks . . . . . . . . . . . . . . . . . . . . . . . .
36 weeks . . . . . . . . . . . . . . . . . . . .
37–39 weeks,............,.. . . . . . . .
40 weeks . . . . . . . . . . . . . . . . . . . . . .
41 weeks . . . . . . . . . . . . . . . . . . . . . . . . . . .
42 weeks and over. . .,, . . . . . . . . . . .
Not stated . . . . . . . . . . . . . . . . . . . . . . . .
White
Total, . . . . . . . . . . . . . . . . . . . . . . .
Under 28 weeks . . . . . . . . . . . . . . . . ,,, ...
28–31 weeks . . . . . . . . . . . . . . . .
32–35 weeks . . . . . . . . . . . . . . . . . . . . . .
36 weeks . . . . . . . . . . . . . . . . . . . .
37–39 weeks . . . . . . . . . . . . . . . .
40 weeks . . . . . . . . . . . . . . . . . . . .
41 weeks . . . . . . . . . . . . . . . . . . . .
42 weeks and over . . . . . . . . . . . . . . .
Not stated . . . . . . . . . . . . . . . . . . .
81ack
Total . . . . . . . . . . . . . . . . . . . . . . . . . .
Under 28 weeks . . . . . . . . . . . . . . . .
28-31 waeks . . . . . . . . . . . . . . . .
32–35 weeks . . . . . . . . . . . . . . . .
36 weeks . . . . . . . . . . . . . . . . . . . . . . . . . . . .
37–39 weeks . . . . . . . . . . . . . . . . . . . . . . .
40 weeks . . . . . . . . . . . . . . . . . . . . . . . . . . . .
41 weeks . . . . . . . . . . . . . . . . . . . .
42 weeks and over . . . . . . . . . . . . . . . . . . . .
Not stated . . . . . . . . . . . . . . . . . . . . . . . . . . .
Birth weightl
Total Under 5oo– l,ooo– 7, 5oo– 2, ooo– 2,500– 3, ooo– 3,500– 4, ooo– 4, 5oo– 5,000 Not
500 999 1,499 1,999 2,499 2,999 3,499 3,999 4,499 4,999 grams stated
grams grams grams grams grams grams grams grams grams grams or over
3,547,362 3,520 15,660 21,612 46,869 154,377 577,317 1,310,363 1,030,188 314,720 57,405 8,050 7,281
17,922 2,165 7,536 2,568 935 767 1,082 1,382 687 191 31 50 528
28,862 107 2,094 7,712 6,778 3,228 3,168 3,427 1,702 347 70 15 214
122,764 26 544 3,348 15,510 31,704 31,225 25,230 11,851 2,549 410 72 295
84,875 8 63 415 2,625 13,988 29,513 24,646 10,469 2,373 412 66 97
1,032,181 48 266 820 5,854 43,651 216,932 436,940 259,569 57,499 8,277 1,251 1,074
644,552 20 129 178 1089 10,512 77,207 250,248 224,999 67,287 10,928 1,294 661
457,537 25 96 130 655 6,015 44,288 157,793 170,976 63,118 12,307 1,588 546
474,304 32 149 228 1,040 7,961 51,092 160,800 167,582 67,469 15,016 2,269 666
684,365 1,089 4,783 6,213 12,383 36,551 122,810 249,697 182,353 53,887 9,954 1.445 3,200
2,843,453 2,067 9,578 13,823 31,135 104,794 412,380 1,036,278 864,381 282,244 51,984 7,159 5,630
10,888 1,318 4,723 1,588 479 394 561 805 472 148 26 39 335
18,258 69 1,301 5,150 4,572 1,853 1,674 2,017 1,154 258 52 10 148
84,240 12 337 2,196 10,798 22,698 20,995 16,244 8,444 1,943 313 55 205
61,958 2 45 276 1,754 9,849 21,526 18,159 7,934 1,948 341 57 67
817,756 39 182 564 4,040 30,037 157,676 346,035 219,639 50,396 7,246 1,069 833
542,863 12 101 104 746 7,581 56,204 206,261 197,300 60,904 9,954 1,159 537
395,090 21 69 81 464 4,251 33,988 132,655 152,251 58,020 11,356 1,453 481
401,338 21 101 154 660 5,499 37,672 131,488 147,458 61,712 13,908 2,088 577
511,062 573 2,719 3,710 7,622 22,632 80.084 184,614 149,729 46,915 8,788 1,229 2,447
584,311 1,363 5,691 7,151 14,345 44,339 141,380 223,626 115,503 24,921 3,995 666 1,331
6,573 791 2,640 908 434 353 491 539 186 39 5 10 177
9,642 38 734 2,348 2,000 1,272 1,359 1,264 475 74 16 5 57
34,174 14 190 1,067 4,253 8,121 9,089 7,858 2,892 512 84 14 80
19,844 6 17 122 797 3,618 6,942 5,767 2,131 350 63 6 25
175,508 8 70 230 1,645 11,968 49,877 73,577 31,524 5,475 783 130 201
80,977 7 19 68 315 2,556 15,885 34,923 21,463 4,850 689 103 99
49,741 2 25 47 178 1,592 8,700 20,266 14,313 3,775 684 104 55
59,663 10 44 65 341 2,211 11,696 24,190 15,789 4,341 774 129 73
148,189 487 1.952 2,296 4,382 12,628 37,341 55,242 26,730 5,505 897 165 564
1 Equi”alent~ of the gram weights in terms of pounds and Ounces are shown On table ~ 3.
21ncludss races other than white and black.
NOTE: Excludes data fm Connecticut and New Mexico, which did not require repwting of first day of last normal menstrual period.
.
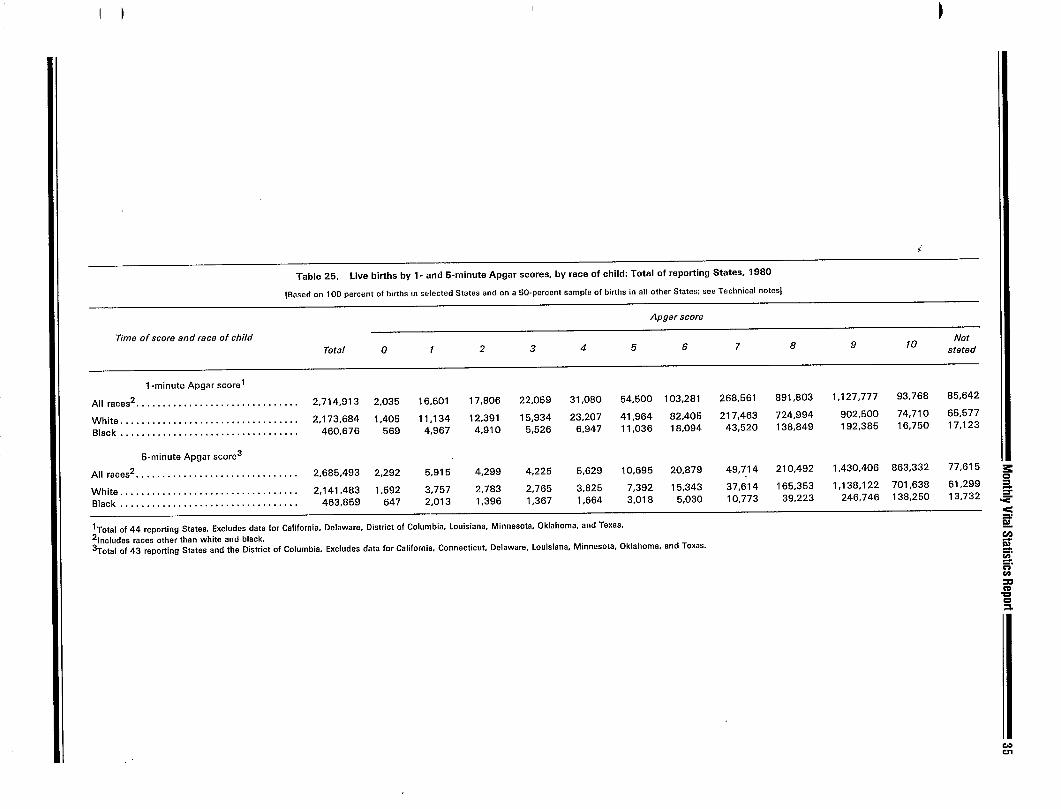
Table 25. Live births by 1- end 5-minute Apgar scores, by race of child: Total of reporting States, 1980
[Based on 100 percent of b!rths m selected States and on a 50-psrcOnt sample of bmhs in all other States sse Technical notss]
Apgar score
Time of score and race of child Not
Total o 1 2 3 4 5 6 7 8 9 10 stated
1 -minute Apgar scorel
All reces2. . . . . . . . . . . . . . . . . . . . . . . . . . . . . . . 2,714,913 2.035 16,601 17,806 22,059 31 ,OBO 54,500 103,281 268,561 891,803 1,127,777 93,768 85,642
White . . . . . . . . ., .,,.., . . . . . . . . . . . . . . . . . . 2,173,684 1,405 11,134 12,391 15,934 23,207 41,964 82,405 217,463 724,994 902,500 74,710 65,577
81sck . . . . . . . . . . . . . . . . . . . . . . . . . . . . . . . . . . 460,676 569 4,967 4,910 5,526 6,947 11,036 18,094 43,520 138,849 192,385 16,750 17,123
5-minute Apgar score3
Allraces2 . . . . . . . . . . . . . . . . . . . . . . . . . . . . . . . 2,685,493 2,292 5,915 4,299 4,225 5,629 10,695 20,879 49,714 210,492 1,430,406 863,332 77,615
White . . . . . . . . . . . . . . . . . . . . . . . . . . . . . . . . . . 2,141,483 1,592 3,757 2,783 2,765 3,825 7,392 15,343 37,614 165,353 1,138,122 701,638 61,299
black, . . . . . . . . . . . . . . . . . . . . . . . . . . . . . . . . . 463,859 647 2,013 1,396 1,367 1,664 3,018 5,030 10,773 39,223 246,746 138,250 13,732
lTotal of 44 ~eponing Statea, Exclude$ data for California, Delaware, District of Columbia. Louisiana, Minnesota, Oklahoma, and Texas.
Zl”cludea racs~ other than white and black.
3Total of 43 reponing states and the District of Columbia. Excludes data for California, Connecticut, Delaware, Louisiana, Minnssota, Oklahoma, and Texas.
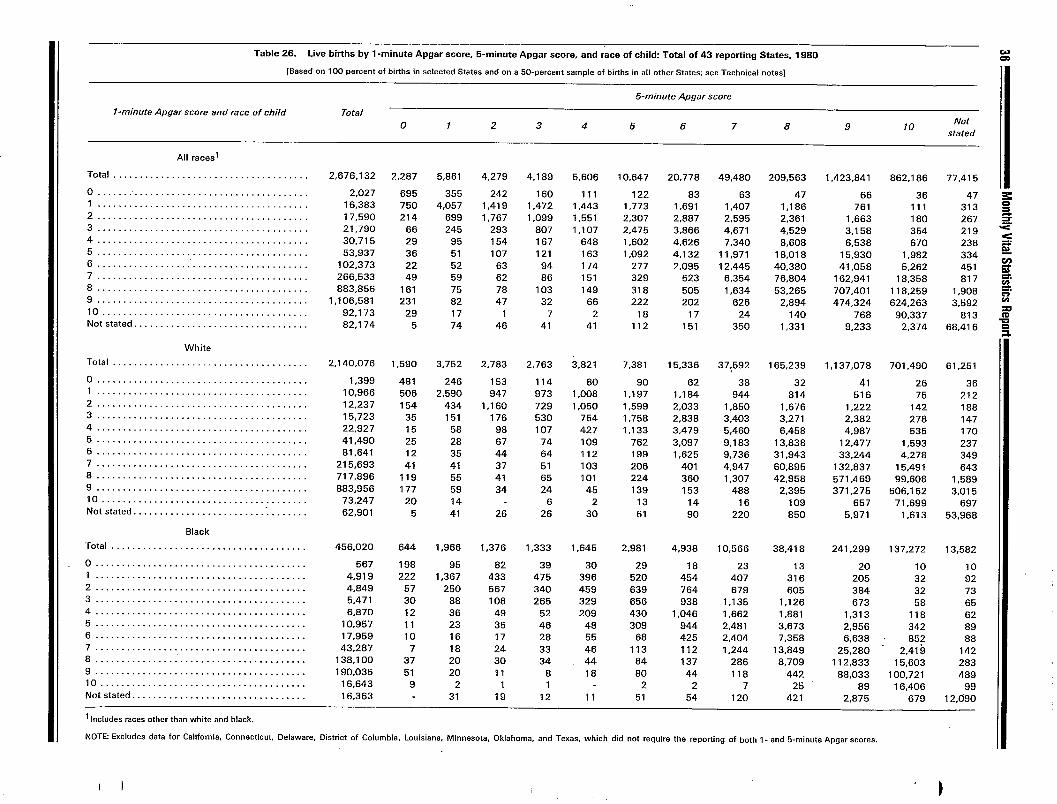
Table 26. Live births by 1-minute Apgar score, 5-minute Apgar score, and race of child: Total of 43 reporting States, 1980
[Bassd on 100 percent of births in selected States and on a 50-percent sample of births in all other States; see Technical notes]
5-minute Apgar score
l-minute Apgar score and race of child Total Not
o 1 2 3 4 5 6 7 8 9 10 stated
2,676,132 2,287 5,861 4,279 4,189 5,606 10,647 20,778 49,480 209,563 1,423,841 862,186 77,415
2,027 695 355 242 160 111 122 83 63 47 66 36 47 16,383 750 4,057 1,419 1,472 1,443 1,773 1,691 1,407 1,186 761 111 313 17,590 214 699 1,767 1,099 1,551 2,307 2,887 2,595 2,361 1,663 180 267 21,790 66 245 293 807 1,107 2,475 3,866 4,671 4,529 3,158 354 219 30,715 29 95 154 167 648 1,602 4,626 7,340 8,608 6,538 670 238 53,937 36 51 107 121 163 1,092 4,132 11,971 18,018 15,930 1,982 334
102,373 22 52 63 94 174 277 2,095 12,445 40,380 41,058 5,262 451 266,533 49 59 62 86 151 329 523 6,354 76,804 162,941 18,358 817 883,856 161 75 78 103 149 318 505 1,634 53,265 707,401 118,259 1,908
1,106,581 231 82 47 32 66 222 202 626 2,894 474,324 624,263 3,592 92,173 29 17 1 7 2 18 17 24 140 768 90,337 813 82,174 5 74 46 41 41 112 151 350 1,331 9,233 2,374 68.416
2,140,076 1,590 3,752 2.783 2,763 3,821 7,381 15,336 37,592 165,239 1,137,078 701,490 61,251
1,399 481 246 153 114 80 90 62 38 32 41 26 36 10,966 506 2,590 947 973 1,008 1,197 1,184 944 814 516 75 212 12,237 154 434 1,160 729 1,050 1,599 2,033 1,850 1,676 1,222 142 188 15,723 35 151 176 530 754 1,758 2,838 3,403 3,271 2,382 278 147 22.927 15 58 98 107 427 1,133 3,479 5,460 6,458 4,987 535 170 41,490 25 28 67 74 109 762 3,097 9,183 13,838 12,477 1,593 237 81.641 12 35 44 64 112 199 1,625 9,736 31,943 33,244 4,278 349
215,693 41 41 37 51 103 206 401 4,947 60,895 132,837 15,491 643 717,896 119 55 41 65 101 224 360 1,307 42,958 571,469 99,608 1,589 883,956 177 59 34 24 45 139 153 488 2,395 371,275 506,152 3,015
73,247 20 14 6 2 13 14 16 109 657 71,699 697 62,901 5 41 26 26 30 61 90 220 850 5,971 1,613 53,968
456,020 644 1,966 1,376 1,333 1,645 2,981 4,938 10,566 38,418 241,299 137,272 13,582
567 198 95 82 39 30 29 18 23 13 20 10 10 4,919 222 1,367 433 475 396 520 454 407 316 205 32 92 4,849 57 250 567 340 459 639 764 679 605 384 32 73 5,471 30 88 108 265 329 656 938 1,135 1,126 673 58 65 6,870 12 36 49 52 209 430 1,046 1,662 1,881 1,313 118 62
10,957 11 23 35 46 48 309 944 2,481 3,673 2,956 342 89 17,959 10 16 17 28 55 68 425 2,404 7,358 6,638 852 88 43,287 7 18 24 33 46 113 112 1,244 13,849 25,280 2,41 h 142
138,100 37 20 30 34 44 84 137 286 8,709 112,833 15,603 283 190,035 51 20 11 8 18 80 44 118 442 88,033 100,721 489
16,643 9 2 1 1 2 2 7 25 89 16,406 99 16,363 31 19 12 11 51 54 120 421 2,875 679 12,090
1 Includes races other than whita and black.
NOTE Excludes data for California, Connecticut, Delaware, Oistrict of Columbia, Louisiana, Minnesota, Oklahoma, and Texas, which did not require the reporting of both 1- and 5-minute Apgar scores.

Monthly Vital Statistics Report~ 31
Technical notes
Sources of data
Data shown in this report for 1980 are based on 100 percent of the birth certificates of 42 States which provided data through the Vital Statistics Cooperative Pro-gram. Data from the remaining areas (Arizona, Arkansas, California, Delaware, the District of Columbia, Georgia, New Mexico, North Dakota, and South Dakota) are based on a 50-percent sample of birth certificates filed in those areas.
Many of the topics discussed in this brief report are covered in more analytical detail in other reports published by the National Center for Health Statistics. The topics include first births to older mothers, birth weight, births to unmarried women, birth intervals, prenatal care, Apgar score, and teenage childbearing. Also avail-able are a methodological report on imputing length of gestation and two brief reports on Hispanic origin births.
Population denominators
Birth rates for 1980 are based on populations enumerated as of April 1, 1980. The figures by race in the 1980 census are affected by changes in the practice of
“1 reporting race, particularly on the part of the Hispanic population, and in coding and classifying racial groups in the 1980 census. One particular change has created a major inconsistency between the 1980 census data and historical data series, including censuses and vital statistics. About 40 percent of the Hispanic population counted in 1980, or over 5.8 million persons, did not mark one of the specified races listed on the census questionnaire but marked the “other” category instead. In the 1980 census a modification was made in the coding procedures in the treatment of persons who marked “other” race and wrote in a national origin designation of a Latin American country or a specific His-panic origin group in response to the race question. These persons remained in the “other races” category in 1980 census data; in previous censuses and in vital statistics, such responses were almost always coded into the” white” category. In order to maintain comparability, the 1980 census data by race have been redistributed to conform to the historical categories. Unpublished tabulations of these modified census counts were obtained from the U.S. Bureau of the Census and were used for the computation of the rates for this report.
In obtaining the modified census counts, persons who marked the “other” race category and who reported any Spanish origin on the Spanish origin question (5.8
T million persons) were distributed to white and black races in proportion to the distribution of persons of His-
panic origin who reported their race to be white or black. This procedure was done for each age-sex group. As a result of this procedure, 5.7 million persons were added to the white population, and about 135,000 persons were added to the black population. Persons who marked the “other” race category and who reported that they were not of Spanish origin (about 916,000 persons) were distributed as follows: 20 percent in each age-sex group were added to the category “Asian and Pacific Islander,” and 80 percent were added to the “white” category. 1 The count of American Indians, Eskimos, and Aleuts was not affected by these procedures.
Birth rates for 197 1–79 have been revised effective with this report. The revised rates are based on revised populations for these years which are consistent with the 1980 census levels.1 The 1980 census counted approximately 5.5 million more persons than had earlier been estimated for April 1, 1980.2
Births by marital status of mother
Beginning with 1980 data, national estimates of births to unmarried women are derived from two sources. For 41 States and the District of Columbia, marital status of mother is reported directly on the birth certificate; for the remaining 9 States which lack such an item, marital status is inferred from a comparison of the child’s and parents’ surnames. This procedure represents a substantial departure from the method used in previous years to prepare national estimates of births to unnlarned women. The previous method assumed that the incidence of births to unmarried women in States with no direct question on marital status was the same as the incidence in reporting States in the same geographic division. Ratios of births to unmarried women were computed by race for the reporting States in each geographic division, applied to all births in the division, and then summed to obtain national estimates by race. The figures by race were summed to yield the totals for the United States.
The new method represents an attempt to use related information on the birth certificate to improve the quality of national data on this topic as well as to pro-vide data for the individual nonreporting States. Al
lu.S. Bureau of the Census; preliminary estimates of the population of the United States, by age, sex, and race, 1970 to 1981. Current PopulationReports. Series P-25, No. 917. Washington. U.S. Government PrintingOffice, July 1982.21_J.s,Bureau of the Census: Coverage of the national population in the 1980census, by age, sex, and race: Preliminary estimates by demographic analysis. Current Population Reports. Series P-23, No. 115. Washington. U.S. GOVemment Printing OffIce, Feb. 1982.

Table 1. Number of births to unmarried women, by age of mother and race of child: United States, 1979 and 1980
[De to ro.ndnng estimates to the nearest hundred, esmmated figures by race may not add to total.. FIg.res for age of mother “ot stated are dlstnb.ted. Excludes births to nonresidents of the United States]
Years and race
ALL RACES
Reportedl
1980 .,, . . . . . . . . . . . . . . . . . . . . . . . . . .
Estimatedz
1980, . . . . . . . . . . . . . . . . . . . . . . . . . . . . 1979 ..,.,,.......,,....,.....,..
WHITE
Reportedl
1980 . . . . . . . . . . . . . . . . . . . . . . . . . . . .
Estimatedz
1980, . . . . . . . . . . . . . . . . . . . . . . . . . . .
1979 . . . . . . . . . . . . . . . . . . . . . . . . . . . . . . . .
ALL OTHER
Reportedl
1980 . . . . . . . . . . . . . . . . . . . . . . . . . . . . . . .
Estimated2
1980, . . . . . . . . . . . . . . . . . . . . . . . . . . . . . 1979 ., . . . . . . . . . . . . . . . . . . . . . . . . . .
8LACK
Reportedl
1980 . . . . . . . . . . . . . . . . . . . . . . . . . . . . .
Estimatedz
1980 . . . . . . . . . . . . . . . . . . . . . . . . . . . . . . 1979 . . . . . . . . . . . . . . . . . . . . . . . . . . . .
lData for the StaWS ,n which mar, tsl status was mx repotted
Age of mother
All 15– 19 years
ages Under 20-24 25–29 30–34 35–39 40 years
and15 Total
15 16 17 18 19 years years years years overyears years years years years years
665,747 9,024 262,777 21,908 41,386 58,606 69,173 71,704 237,265 99,583 40,984 13,187 2,927
645,000 9,700 269,000 23,000 43,000 60,500 70,600 71,900 230,200 89,300 33,800 10,600 2,500 597,800 9,500 253,200 21,800 41,300 56,900 66,400 66,600 210,100 80,600 31,300 10,600 2,500
320,063 3,144 127,984 9,223 19,653 28,885 34,427 35,796 112,854 46,872 20,565 7,073 1,571
295,000 3,000 126,500 9,100 19,600 28,900 34,100 34,900 104,600 39,100 15,500 5,200 1,100 263,000 3,300 116,400 9,000 18,600 26,700 31,300 30,800 90,200 33,200 13,700 4,900 1,200
345,684 5,880 134,793 12,685 21,733 29,721 34,746 35,908 124,411 52,711 20,419 6,114 1,356
350,000 6,600 142,500 13,900 23,400 31,600 36,500 37,100 125,600 50,200 18,400 5,400 1,300 334,800 6,200 136,700 12,800 22,800 30,300 35,100 35,800 119,900 47,400 17,600 5,700 1,300
325,737 5,707 128,022 12,223 20,786 28,195 32,929 33,889 117,423 49,077 18,766 5,513 1,229
327,800 6,400 134,300 13,300 22,300 29,700 34,300 34,600 117,600 46,500 16,900 4,800 1,200 315,800 6,100 130,100 12,300 21,800 28,800 33,200 33,900 113,100 44,000 16,100 5,200 1,200
have been inferred and included with data from the remaining StateS; see Technical nOteS.
2B,flhS to “nmarrled women are estimated for the U“ked States from data forreglstratlon areas In which marital status of mother was rermrted.
) ‘\

though the new method represents a significant change from the previous method, it is felt that the benefits of the new method outweigh the disadvantages of a discontinuity in the data series between 1979 and 1980. The new method is based on a comparison of the parents’ and child’s surnames. The mother’s current surname is usually obtained from the informant item on the birth cetilcate. If the mother is not the informant, the coding of marital status is based on the father’s and child’s surnames.
�
Briefly, a birth is classified as occurring to a married woman if the parents’ surnames are the same or if the child’s and father’s surnames are the same and the mother’s current surname is missing. A birth is classified as occurring to an unmarried woman if the father’s
Monthly Vial Statistics tlepott~ 39
name is missing, if the parents’ surnames are different, or if the father’s and child’s surnames are different and the mother’s current surname is missing. These rules are listed here in the priority-of-use order in which they are applied. The first applicable rule is coded.
A complete tabulation of the number of births to unmarried women by age of mother and race for 1979 and 1980 is shown intableI. Two sets offigures are given for 1980, those derived from the new method utilizing re-ported and inferred data, and those derived from the geographic ratio estimation procedure. It is evident that the methodological change had significantly greater impact on the figures for white births, particularly those to mothers aged 25 years and older, than on the figures for other racial or age groups.
This report presents summary tabulations from the final natality statistics for 1980. More”detailed tabulations for 1980 will be published in VitalStatisticsof the UnitedStates, VolumeI—Natality. Prior to the publication of that volume, the National Center for Health Statistics will respond to requests for unpublished data whenever possible.
—
—

---
40 ~ Monthly Vital Statistics”Report
Symbols
Data not available
. . . Category not applicable
Quantity zero
0.0 Quantity more than zero but less than
0.05
z Quantity more than zero but less than 500
where numbers are rounded to thousands
* Figure does not meet standards of
reliability or precision
SUGGESTED CITATION
National Center for Health Statistics: Advance report
of final natality statistic, 1980. Monthly Vital
.Sfatktics Raport, Vol. 31, No. 8, Supp. DHHS Pub.
No. (PHS) 83-1120, Public Health Service, Hyattsville,
Md. November 1982
U.S. DEPARTMENT OF HEALTH
AND HUMAN SERVICES
Public Health Setvice
National Center for Health Statistics
3700 Eaat-West Highway
Hyattsville, Maryland 20782
OFFICIAL BUSINESS
PENALTY FOR PRIVATE USE, $300
To receive the Monthly Vital Statistics Report
regularly, contact the National Center for Health
Statistics by calling 301–436–NCHS.
DHHS Publication No. (PHS) 83–1 120
.
COPYRIGHT INFORMATION
This report may be reprinted without further permission,
FIRST CLASS MAIL
POSTAGE & FEES PAID
PHS
PERMIT No, G29
I