Embed Size (px)
Citation preview
Prediction and analysis the causesof increasing an illegal e-taxi in
Bangladesh municipalitiesA case study of Pabna municipality
Mital Chakma, Md Sohel Rana and Md Ashrafuzzaman PramanikDepartment of Urban and Regional Planning,
Pabna University of Science and Technology, Pabna, Bangladesh
AbstractPurpose – This study aims to find out the causes for an increase in the number illegal E-taxis and the extentof these vehicles in the municipalities of Bangladesh.Design/methodology/approach – Based on extensive literature review and field investigation, a set ofquestionnaires was developed to explore the actual causes for an increase in the number of illegal E-taxis,where ten predicted hypotheses were tested.Findings – The result proved that the illegal E-taxi is very active in the study area. Besides the socio-economic condition of the commuter, education level of taxi drivers and commuter satisfaction level (safetyand comfort) and provision of continuous and door-to-door service system are the main causes for increasingnumber of E-taxis in themunicipality of Bangladesh.Originality/value – Moreover, this study provides an effective thinking on socio-economic condition ofdrivers and the legalization of illegal E-taxis in the study area.
Keywords Citizen science, E-taxi, Door to door service, Local public transport
Paper type Case study
1. IntroductionIn modern world, the electric taxi (E-taxi) is one of the important local public transportationmodes. This taxi is extensively used in many Asian countries. This traffic mode has specialcharacteristics lacking in other public transport (public buses and railway) services. Thespecial characteristics of these vehicles are the individual (chartered by single passengers)and door-to-door service provision for 24 h (Fukumoto et al., 2017). But the unlicensed taximay create a negative impact on the urban transport environment. In Bangladesh, most ofthe municipal cities were jam-packed with these unlicensed E-taxis (Chakma, 2018). Theintroduction of E-taxi can be expressed as a silent rebellion in the transport division ofBangladesh. This E-taxi was first introduced in Bangladesh around 2004, by a privatecompany with the name of “Maa Enterprise” (Mamun, 2015). Since then, the numbers ofthese vehicles were increasing and spreading all over the country. Numerous such vehicles
© Mital Chakma, Md Sohel Rana and Md Ashrafuzzaman Pramanik. Published in InternationalJournal of Crowd Science. Published by Emerald Publishing Limited. This article is published underthe Creative Commons Attribution (CC BY 4.0) licence. Anyone may reproduce, distribute, translateand create derivative works of this article (for both commercial and non-commercial purposes),subject to full attribution to the original publication and authors. The full terms of this licence may beseen at http://creativecommons.org/licences/by/4.0/legalcode
IJCS2,3
178
Received 6 June 2018Revised 15 September 2018Accepted 17 September 2018
International Journal of CrowdScienceVol. 2 No. 3, 2018pp. 178-197EmeraldPublishingLimited2398-7294DOI 10.1108/IJCS-06-2018-0010
The current issue and full text archive of this journal is available on Emerald Insight at:www.emeraldinsight.com/2398-7294.htm
are now playing all over the country, largely in the municipalities and suburban areas. Somemeasure the figures of a million. Exactly, no one knows the actual figure of these vehicles, asthey are not registered or licensed with the transport department.
In the Pabna municipality, about 80 per cent urban people including law administrationofficers have even been observed to use the illegal E-taxi to travel to certain parts of the city(Chakma, 2018; Mamun, 2015). The municipal authority officially claimed that they gavelicense to 1,200 E-taxis and 530 rickshaws, and the rest are roaming around the municipalitywithout any license. There is no entry rules and regulations for this E-taxi, any one any timecan run this taxi. As a result, these E-taxis are witnessed to illegal parking, traffic rulesviolation and serious traffic congestion. In some cases, these illegal E-taxis have beeninvolved in serious road accident at the major road intersection. Therefore, there was a needto examine the reasons for the existent of these illegal E-taxis in the face of opposition fromthe authorities and the latent threat to both drivers and their passengers. The major aimof this study is to find out the actual causes of existent of unlicensed E-taxi and the extent ofthese vehicles in the local public transport system.
2. Literature review2.1 Research on an unlicensed taxi in other countriesMala (2016) wrote a report about the causes of increasing illegal taxi in Fiji, he said that thisis because authorized taxis are not providing the required services to the public. Illegal taxiranks in Fourways city of South Africa have caused concern, and the main reason forcreating concern was limited resources of metro police in the city area (Seemela, 2017). Theprovisions of steady job by taxi service companies have led to an increase in the number ofillegal taxi (8,500) in Kingston Metropolitan Area, and day by day the number is increasing,although the law enforcer agents are in the process of trying to analyze and break down thenumber (Minott, 2016).
Çetin and Eryigit (2011) developed a model to estimate the effect of entry restrictions onthe Istanbul taxicab market over real medallion prices and inflation, and they found thatentry regulation in Istanbul pressures inflation rates as well. Jun-Zhong (2011) also arguesthat the taxi industry does not fit for general competition if the government does not fix anyentry rules and regulations because if the government regulates the enterprises then theenterprises will regulate taxis and their operations. For improving the taxi services, Baoxing(2006) emphasize the importance of:
� service qualities;� nature and positioning;� stability of the taxi industry; and� the qualifications of the taxi drivers.
Yanshen (2009) said that the key factor of the taxi industry stabilizing is the process of ataxicab license because unbalance taxi supply and demand have increased prices of the taxilicense. Ming-Yi (2007) explained that the main reason for increasing the unlicensed taxi inBeijing and Shanghai was the entry regulation, regulation effects and fare control.Unlicensed taxi as a mode of transport is also an important issue in Masvingo and Harare inZimbabwe (Tichagwa, 2016). Taxi companies provided a steady job to those who operateunder the name of the taxi service companies so that they were able to support their families.To prevalence of an informal taxi transport system and the authentication for its existenceTichagwa (2016) recommend particular routes mapped out for them, with a flexiblelicensing rule to match. Yuan et al. (2016) developed a model using real-life data to identify
Case study ofPabna
179
the unlicensed taxi, better regulate the traffic operation, reduce associated costs and helpgovernments.
2.2 Research on an unlicensed taxi in BangladeshBecause of the push and pull factor, day by day people from rural areas are migrating in theurban areas of Bangladesh. As a result, population density in urban areas is increasing, andthese surplus people are involving in different illegal activities including illegal taxioperation (Shamsher and Abdullah, 2013). Ultimately, these vehicles are creating a pressureon the traffic and transportation system. The volume of the vehicles in the capital city ofDhaka has increased so much that average public transport speed has become 5km/h, whichis same as average walking speed (Tribune, 2018). To describe the traffic jam situation inthe major city of Dhaka Bangladesh, Rosen (2016) said that “Of all the dysfunctions thatplague the world’s megacities, none may be more pernicious than bad (really, really bad)traffic.”
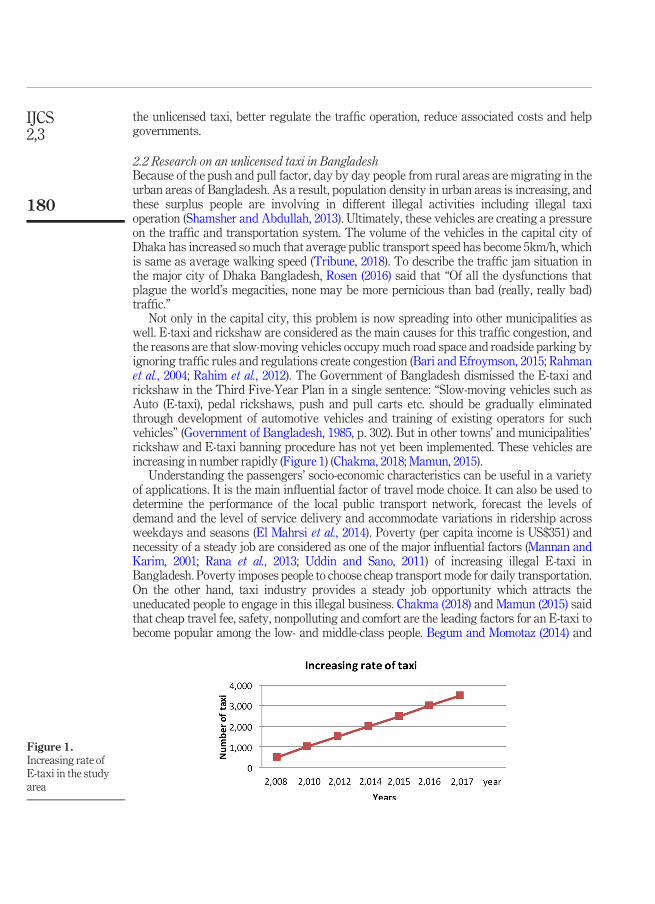
Not only in the capital city, this problem is now spreading into other municipalities aswell. E-taxi and rickshaw are considered as the main causes for this traffic congestion, andthe reasons are that slow-moving vehicles occupy much road space and roadside parking byignoring traffic rules and regulations create congestion (Bari and Efroymson, 2015; Rahmanet al., 2004; Rahim et al., 2012). The Government of Bangladesh dismissed the E-taxi andrickshaw in the Third Five-Year Plan in a single sentence: “Slow-moving vehicles such asAuto (E-taxi), pedal rickshaws, push and pull carts etc. should be gradually eliminatedthrough development of automotive vehicles and training of existing operators for suchvehicles” (Government of Bangladesh, 1985, p. 302). But in other towns’ and municipalities’rickshaw and E-taxi banning procedure has not yet been implemented. These vehicles areincreasing in number rapidly (Figure 1) (Chakma, 2018; Mamun, 2015).
Understanding the passengers’ socio-economic characteristics can be useful in a varietyof applications. It is the main influential factor of travel mode choice. It can also be used todetermine the performance of the local public transport network, forecast the levels ofdemand and the level of service delivery and accommodate variations in ridership acrossweekdays and seasons (El Mahrsi et al., 2014). Poverty (per capita income is US$351) andnecessity of a steady job are considered as one of the major influential factors (Mannan andKarim, 2001; Rana et al., 2013; Uddin and Sano, 2011) of increasing illegal E-taxi inBangladesh. Poverty imposes people to choose cheap transport mode for daily transportation.On the other hand, taxi industry provides a steady job opportunity which attracts theuneducated people to engage in this illegal business. Chakma (2018) and Mamun (2015) saidthat cheap travel fee, safety, nonpolluting and comfort are the leading factors for an E-taxi tobecome popular among the low- and middle-class people. Begum and Momotaz (2014) and
Figure 1.Increasing rate ofE-taxi in the studyarea
IJCS2,3
180
Horsu and Yeboah (2015) said that customer satisfaction (satisfaction variable, e.g.reliability, safety, continuous service, affordability, comfort and drive behavior) is the keyinfluential factor to become a popular traffic mode in a city. Customer satisfaction is aconclusion that a service has provided a pleasurable level of consumption-relatedhappiness (Oliver, 1997).
However, this study investigates motivational factors for illegal E-taxi services in themunicipalities of Bangladesh by considering the users socio-economic condition.
3. Materials and methodsThe main attention of the research is to explore the influential factors regarding the causesof increasing illegal E-taxi in Pabna municipality. The questionnaire was based on extensiveliterature review and field investigation. The study involves an overview of study area,design of questionnaire, data collection and statistical analysis of the collected data.
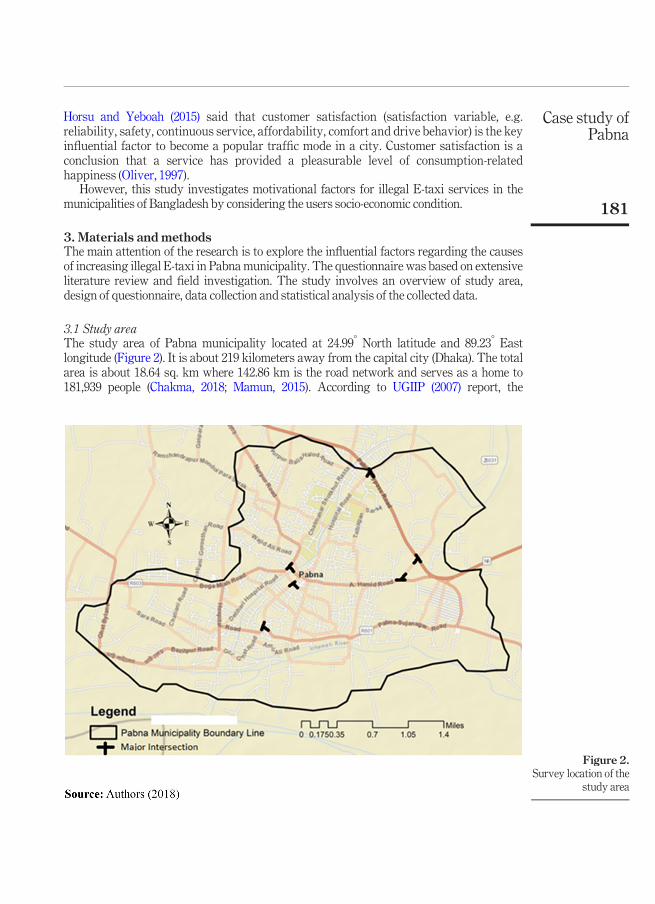
3.1 Study areaThe study area of Pabna municipality located at 24.99° North latitude and 89.23° Eastlongitude (Figure 2). It is about 219 kilometers away from the capital city (Dhaka). The totalarea is about 18.64 sq. km where 142.86 km is the road network and serves as a home to181,939 people (Chakma, 2018; Mamun, 2015). According to UGIIP (2007) report, the
Figure 2.Survey location of the
study area
Case study ofPabna
181
population density of the study area is higher than the other municipalities (30 persons peracre). The major transport modes of the municipality are E-taxi, rickshaw, tempo, van,bicycle and motor cycle. The E-taxi was first introduced in the Pabna municipality around2005 (Mamun, 2015; Saha et al., 2013). Since then, the numbers of these vehicles wereincreasing (Figure 1). Now, many people guess the number of this vehicle is around 5,000;exactly, no one knows the actual number of these vehicles because these vehicles areunlicensed. For this reason, the municipality is completely jam-packed with these surplusvehicles.
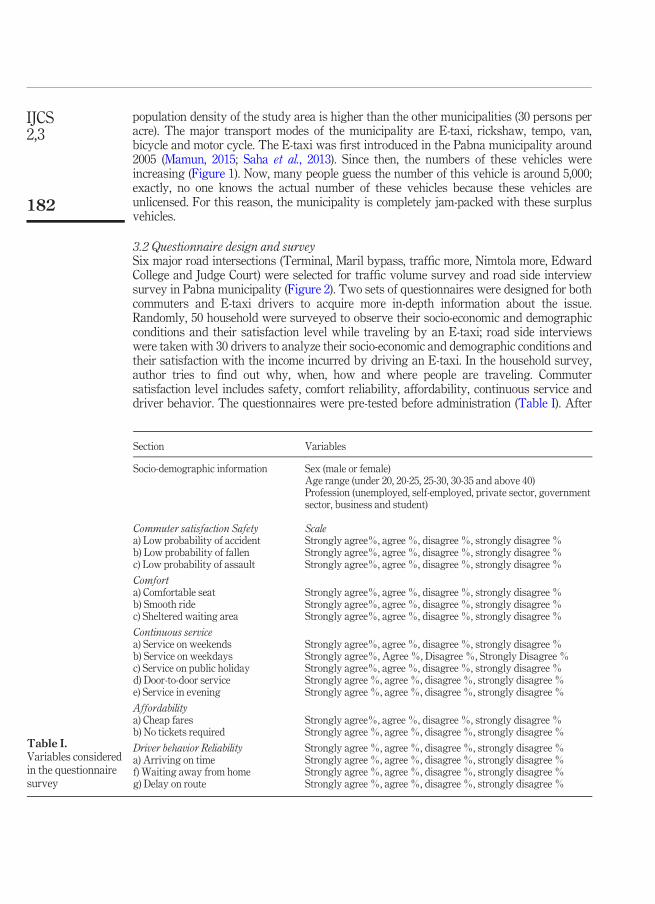
3.2 Questionnaire design and surveySix major road intersections (Terminal, Maril bypass, traffic more, Nimtola more, EdwardCollege and Judge Court) were selected for traffic volume survey and road side interviewsurvey in Pabna municipality (Figure 2). Two sets of questionnaires were designed for bothcommuters and E-taxi drivers to acquire more in-depth information about the issue.Randomly, 50 household were surveyed to observe their socio-economic and demographicconditions and their satisfaction level while traveling by an E-taxi; road side interviewswere taken with 30 drivers to analyze their socio-economic and demographic conditions andtheir satisfaction with the income incurred by driving an E-taxi. In the household survey,author tries to find out why, when, how and where people are traveling. Commutersatisfaction level includes safety, comfort reliability, affordability, continuous service anddriver behavior. The questionnaires were pre-tested before administration (Table I). After
Table I.Variables consideredin the questionnairesurvey
Section Variables
Socio-demographic information Sex (male or female)Age range (under 20, 20-25, 25-30, 30-35 and above 40)Profession (unemployed, self-employed, private sector, governmentsector, business and student)
Commuter satisfaction Safety Scalea) Low probability of accident Strongly agree%, agree %, disagree %, strongly disagree %b) Low probability of fallen Strongly agree%, agree %, disagree %, strongly disagree %c) Low probability of assault Strongly agree%, agree %, disagree %, strongly disagree %
Comforta) Comfortable seat Strongly agree%, agree %, disagree %, strongly disagree %b) Smooth ride Strongly agree%, agree %, disagree %, strongly disagree %c) Sheltered waiting area Strongly agree%, agree %, disagree %, strongly disagree %
Continuous servicea) Service on weekends Strongly agree%, agree %, disagree %, strongly disagree %b) Service on weekdays Strongly agree%, Agree %, Disagree %, Strongly Disagree %c) Service on public holiday Strongly agree%, agree %, disagree %, strongly disagree %d) Door-to-door service Strongly agree %, agree %, disagree %, strongly disagree %e) Service in evening Strongly agree %, agree %, disagree %, strongly disagree %
Affordabilitya) Cheap fares Strongly agree%, agree %, disagree %, strongly disagree %b) No tickets required Strongly agree %, agree %, disagree %, strongly disagree %
Driver behavior Reliability Strongly agree %, agree %, disagree %, strongly disagree %a) Arriving on time Strongly agree %, agree %, disagree %, strongly disagree %f) Waiting away from home Strongly agree %, agree %, disagree %, strongly disagree %g) Delay on route Strongly agree %, agree %, disagree %, strongly disagree %
IJCS2,3
182
some modification, the questionnaires were administered on larger samples by hiring someresearch assistant.
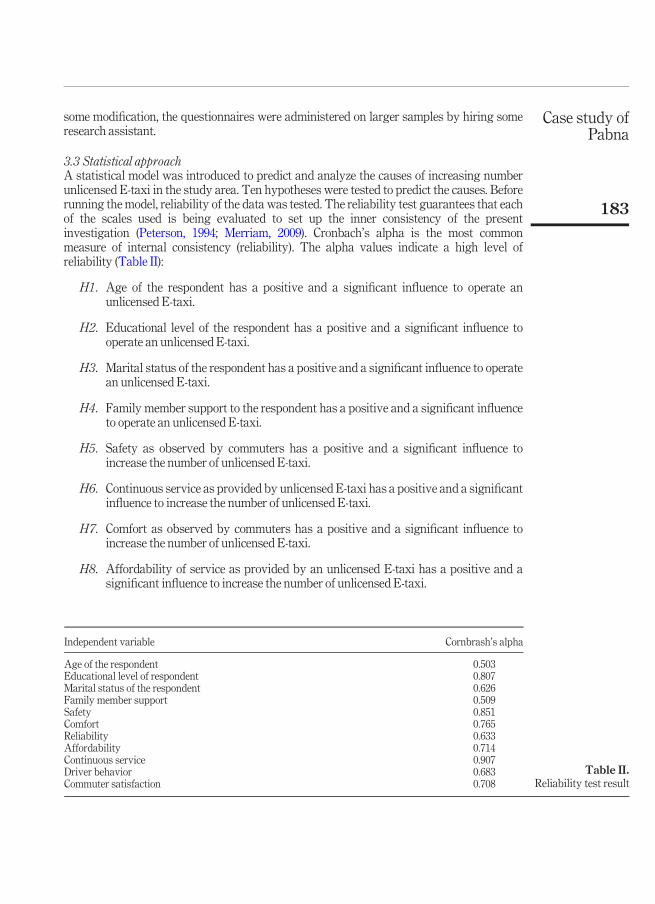
3.3 Statistical approachA statistical model was introduced to predict and analyze the causes of increasing numberunlicensed E-taxi in the study area. Ten hypotheses were tested to predict the causes. Beforerunning the model, reliability of the data was tested. The reliability test guarantees that eachof the scales used is being evaluated to set up the inner consistency of the presentinvestigation (Peterson, 1994; Merriam, 2009). Cronbach’s alpha is the most commonmeasure of internal consistency (reliability). The alpha values indicate a high level ofreliability (Table II):
H1. Age of the respondent has a positive and a significant influence to operate anunlicensed E-taxi.
H2. Educational level of the respondent has a positive and a significant influence tooperate an unlicensed E-taxi.
H3. Marital status of the respondent has a positive and a significant influence to operatean unlicensed E-taxi.
H4. Family member support to the respondent has a positive and a significant influenceto operate an unlicensed E-taxi.
H5. Safety as observed by commuters has a positive and a significant influence toincrease the number of unlicensed E-taxi.
H6. Continuous service as provided by unlicensed E-taxi has a positive and a significantinfluence to increase the number of unlicensed E-taxi.
H7. Comfort as observed by commuters has a positive and a significant influence toincrease the number of unlicensed E-taxi.
H8. Affordability of service as provided by an unlicensed E-taxi has a positive and asignificant influence to increase the number of unlicensed E-taxi.
Table II.Reliability test result
Independent variable Cornbrash’s alpha
Age of the respondent 0.503Educational level of respondent 0.807Marital status of the respondent 0.626Family member support 0.509Safety 0.851Comfort 0.765Reliability 0.633Affordability 0.714Continuous service 0.907Driver behavior 0.683Commuter satisfaction 0.708
Case study ofPabna
183
H9. Reliability of service as observed by commuters has a positive and a significantinfluence to increase the number of unlicensed E-taxi.
H10. Good driver behavior observed by commuters has a positive and a significantinfluence to increase the number of unlicensed E-taxi.
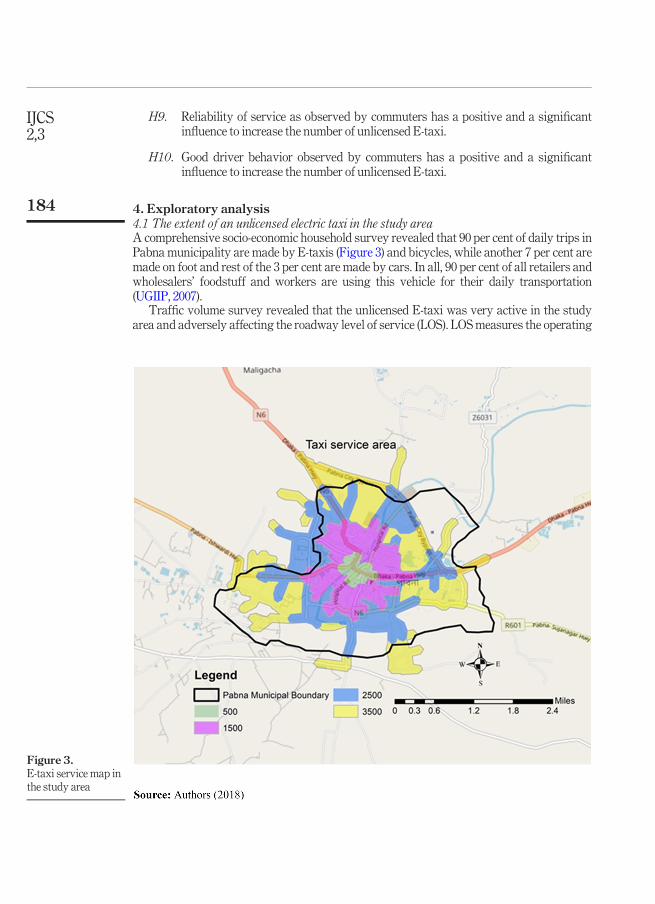
4. Exploratory analysis4.1 The extent of an unlicensed electric taxi in the study areaA comprehensive socio-economic household survey revealed that 90 per cent of daily trips inPabna municipality are made by E-taxis (Figure 3) and bicycles, while another 7 per cent aremade on foot and rest of the 3 per cent are made by cars. In all, 90 per cent of all retailers andwholesalers’ foodstuff and workers are using this vehicle for their daily transportation(UGIIP, 2007).
Traffic volume survey revealed that the unlicensed E-taxi was very active in the studyarea and adversely affecting the roadway level of service (LOS). LOSmeasures the operating
Figure 3.E-taxi service map inthe study area
IJCS2,3
184
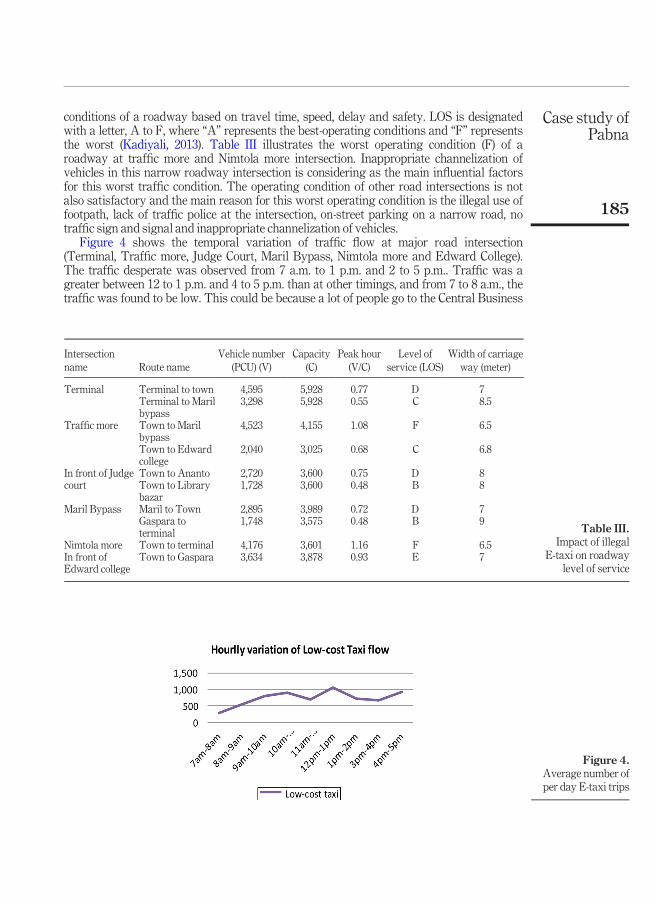
conditions of a roadway based on travel time, speed, delay and safety. LOS is designatedwith a letter, A to F, where “A” represents the best-operating conditions and “F” representsthe worst (Kadiyali, 2013). Table III illustrates the worst operating condition (F) of aroadway at traffic more and Nimtola more intersection. Inappropriate channelization ofvehicles in this narrow roadway intersection is considering as the main influential factorsfor this worst traffic condition. The operating condition of other road intersections is notalso satisfactory and the main reason for this worst operating condition is the illegal use offootpath, lack of traffic police at the intersection, on-street parking on a narrow road, notraffic sign and signal and inappropriate channelization of vehicles.
Figure 4 shows the temporal variation of traffic flow at major road intersection(Terminal, Traffic more, Judge Court, Maril Bypass, Nimtola more and Edward College).The traffic desperate was observed from 7 a.m. to 1 p.m. and 2 to 5 p.m.. Traffic was agreater between 12 to 1 p.m. and 4 to 5 p.m. than at other timings, and from 7 to 8 a.m., thetraffic was found to be low. This could be because a lot of people go to the Central Business
Table III.Impact of illegal
E-taxi on roadwaylevel of service
Intersectionname Route name
Vehicle number(PCU) (V)
Capacity(C)
Peak hour(V/C)
Level ofservice (LOS)
Width of carriageway (meter)
Terminal Terminal to town 4,595 5,928 0.77 D 7Terminal to Marilbypass
3,298 5,928 0.55 C 8.5
Traffic more Town to Marilbypass
4,523 4,155 1.08 F 6.5
Town to Edwardcollege
2,040 3,025 0.68 C 6.8
In front of Judgecourt
Town to Ananto 2,720 3,600 0.75 D 8Town to Librarybazar
1,728 3,600 0.48 B 8
Maril Bypass Maril to Town 2,895 3,989 0.72 D 7Gaspara toterminal
1,748 3,575 0.48 B 9
Nimtola more Town to terminal 4,176 3,601 1.16 F 6.5In front ofEdward college
Town to Gaspara 3,634 3,878 0.93 E 7
Figure 4.Average number ofper day E-taxi trips
Case study ofPabna
185
District (CBD) area for shopping and recreation (especially, between 4 and 5 p.m.), andduring the morning hours (from 7 to 8 a.m.), people get themselves ready for work, and forthis reason, the traffic flowwas low at that time. Severe traffic congestion was also observedduring the peak hours at Traffic more, Nimtola more and in front of Edward College. Lack oftraffic management, lack of traffic signal, illegal use of footpath and traffic rules’ violationsby unlicensed E-taxis were observed.
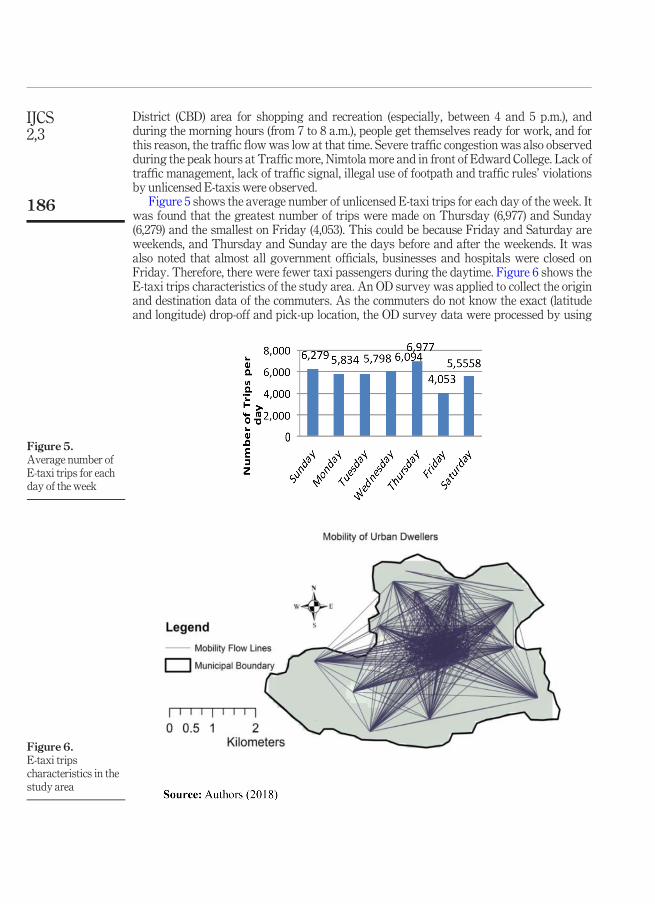
Figure 5 shows the average number of unlicensed E-taxi trips for each day of the week. Itwas found that the greatest number of trips were made on Thursday (6,977) and Sunday(6,279) and the smallest on Friday (4,053). This could be because Friday and Saturday areweekends, and Thursday and Sunday are the days before and after the weekends. It wasalso noted that almost all government officials, businesses and hospitals were closed onFriday. Therefore, there were fewer taxi passengers during the daytime. Figure 6 shows theE-taxi trips characteristics of the study area. An OD survey was applied to collect the originand destination data of the commuters. As the commuters do not know the exact (latitudeand longitude) drop-off and pick-up location, the OD survey data were processed by using
Figure 5.Average number ofE-taxi trips for eachday of the week
Figure 6.E-taxi tripscharacteristics in thestudy area
IJCS2,3
186
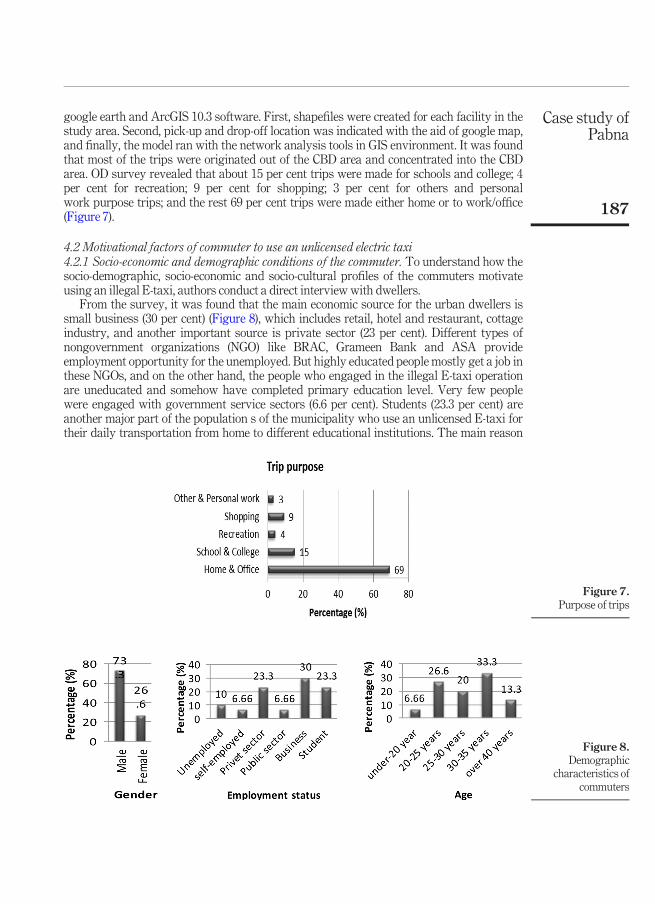
google earth and ArcGIS 10.3 software. First, shapefiles were created for each facility in thestudy area. Second, pick-up and drop-off location was indicated with the aid of google map,and finally, the model ran with the network analysis tools in GIS environment. It was foundthat most of the trips were originated out of the CBD area and concentrated into the CBDarea. OD survey revealed that about 15 per cent trips were made for schools and college; 4per cent for recreation; 9 per cent for shopping; 3 per cent for others and personalwork purpose trips; and the rest 69 per cent trips were made either home or to work/office(Figure 7).
4.2 Motivational factors of commuter to use an unlicensed electric taxi4.2.1 Socio-economic and demographic conditions of the commuter. To understand how thesocio-demographic, socio-economic and socio-cultural profiles of the commuters motivateusing an illegal E-taxi, authors conduct a direct interview with dwellers.
From the survey, it was found that the main economic source for the urban dwellers issmall business (30 per cent) (Figure 8), which includes retail, hotel and restaurant, cottageindustry, and another important source is private sector (23 per cent). Different types ofnongovernment organizations (NGO) like BRAC, Grameen Bank and ASA provideemployment opportunity for the unemployed. But highly educated people mostly get a job inthese NGOs, and on the other hand, the people who engaged in the illegal E-taxi operationare uneducated and somehow have completed primary education level. Very few peoplewere engaged with government service sectors (6.6 per cent). Students (23.3 per cent) areanother major part of the population s of the municipality who use an unlicensed E-taxi fortheir daily transportation from home to different educational institutions. The main reason
Figure 7.Purpose of trips
Figure 8.Demographic
characteristics ofcommuters
Case study ofPabna
187
for this is the location of “Pabna University of Science and Technology” and “MedicalCollege” in the municipality. Majority of students reside off-campus and travel to and fromthe institutions at various times of the day by using their institutional buses and informalE-taxis. Some university student said that they do a part-time job (e.g. tuition) to supportthemselves and reduce pressure on their families. The illegal E-taxis are the only option forthem.
People from the age group of 30 to 35 years used illegal E-taxis more (33.3 per cent); thiswas observed from the analysis, and the main reasons are ease of getting in and out of a taxi(which is suitable for old people), comfortable seats and smooth ride. People of other agegroups also use E-taxis as shown in Figure 8. From the field survey, it was experiential thata man is the money-earner in the family; he has to go out to earn the daily bread, and thiswas the main reason for the increase in the number of male commuters (73 per cent) with anillegal E-taxi than that of female commuters (26.6 per cent). UGIIP report said that about 80per cent commuters use an E-taxi for internal transport in the municipality, and theirtraveling patterns were attributed to traveling from residence to work/business place andacademic institutions, including going to markets for shopping and offices for gettingdifferent orders, completing business deals, dealing cases in the court, medical centers andfor social visits. UGIIP also said that about 50.48 per cent dwellers of total population weresufficient to meet minimum requirements of their family expenditures, and the rest 49.52 percent met their family needs in hardship, that is, by taking loan from their friends/relatives,moneylenders and illegal E-taxi driving, which gives a comprehensive picture of howindividual commuters are involved with illegal E-taxi business to meet their minimumfamily requirements.
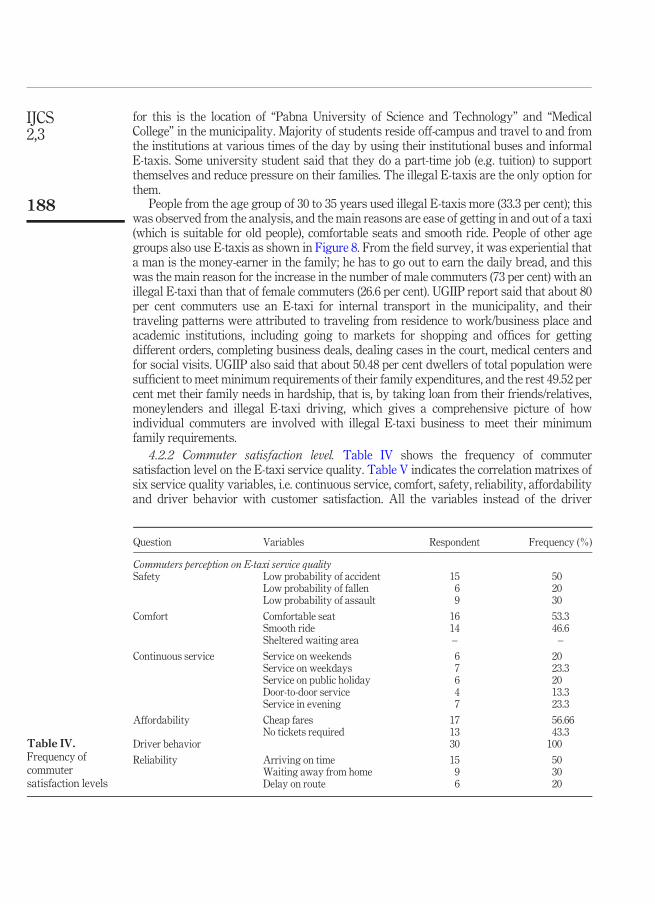
4.2.2 Commuter satisfaction level. Table IV shows the frequency of commutersatisfaction level on the E-taxi service quality. Table V indicates the correlation matrixes ofsix service quality variables, i.e. continuous service, comfort, safety, reliability, affordabilityand driver behavior with customer satisfaction. All the variables instead of the driver
Table IV.Frequency ofcommutersatisfaction levels
Question Variables Respondent Frequency (%)
Commuters perception on E-taxi service qualitySafety Low probability of accident 15 50
Low probability of fallen 6 20Low probability of assault 9 30
Comfort Comfortable seat 16 53.3Smooth ride 14 46.6Sheltered waiting area – –
Continuous service Service on weekends 6 20Service on weekdays 7 23.3Service on public holiday 6 20Door-to-door service 4 13.3Service in evening 7 23.3
Affordability Cheap fares 17 56.66No tickets required 13 43.3
Driver behavior 30 100
Reliability Arriving on time 15 50Waiting away from home 9 30Delay on route 6 20
IJCS2,3
188
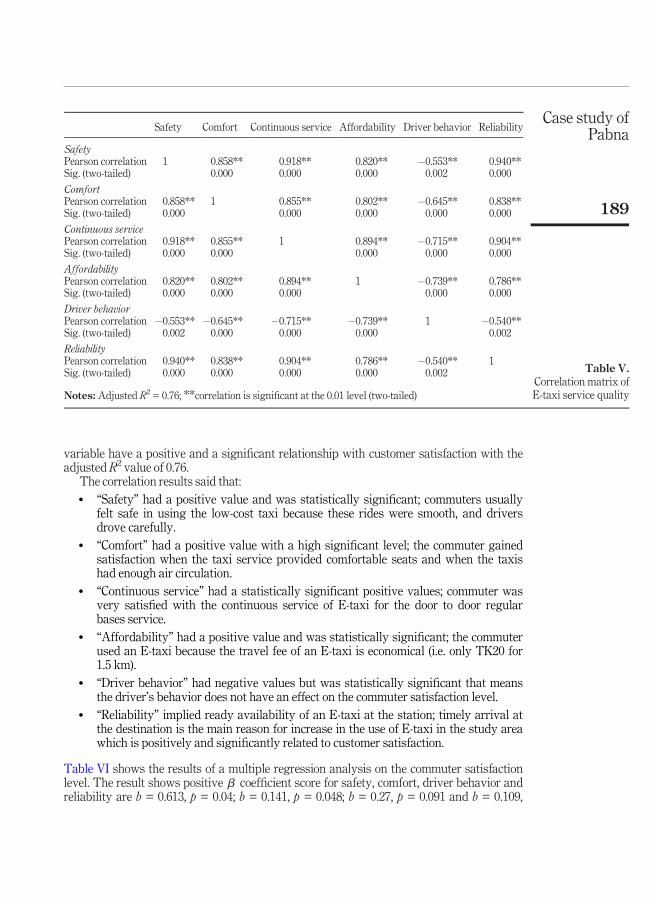
variable have a positive and a significant relationship with customer satisfaction with theadjustedR2 value of 0.76.
The correlation results said that:� “Safety” had a positive value and was statistically significant; commuters usually
felt safe in using the low-cost taxi because these rides were smooth, and driversdrove carefully.
� “Comfort” had a positive value with a high significant level; the commuter gainedsatisfaction when the taxi service provided comfortable seats and when the taxishad enough air circulation.
� “Continuous service” had a statistically significant positive values; commuter wasvery satisfied with the continuous service of E-taxi for the door to door regularbases service.
� “Affordability” had a positive value and was statistically significant; the commuterused an E-taxi because the travel fee of an E-taxi is economical (i.e. only TK20 for1.5 km).
� “Driver behavior” had negative values but was statistically significant that meansthe driver’s behavior does not have an effect on the commuter satisfaction level.
� “Reliability” implied ready availability of an E-taxi at the station; timely arrival atthe destination is the main reason for increase in the use of E-taxi in the study areawhich is positively and significantly related to customer satisfaction.
Table VI shows the results of a multiple regression analysis on the commuter satisfactionlevel. The result shows positive b coefficient score for safety, comfort, driver behavior andreliability are b = 0.613, p = 0.04; b = 0.141, p = 0.048; b = 0.27, p = 0.091 and b = 0.109,
Table V.Correlation matrix ofE-taxi service quality
Safety Comfort Continuous service Affordability Driver behavior Reliability
SafetyPearson correlation 1 0.858** 0.918** 0.820** �0.553** 0.940**Sig. (two-tailed) 0.000 0.000 0.000 0.002 0.000
ComfortPearson correlation 0.858** 1 0.855** 0.802** �0.645** 0.838**Sig. (two-tailed) 0.000 0.000 0.000 0.000 0.000
Continuous servicePearson correlation 0.918** 0.855** 1 0.894** �0.715** 0.904**Sig. (two-tailed) 0.000 0.000 0.000 0.000 0.000
AffordabilityPearson correlation 0.820** 0.802** 0.894** 1 �0.739** 0.786**Sig. (two-tailed) 0.000 0.000 0.000 0.000 0.000
Driver behaviorPearson correlation �0.553** �0.645** �0.715** �0.739** 1 �0.540**Sig. (two-tailed) 0.002 0.000 0.000 0.000 0.002
ReliabilityPearson correlation 0.940** 0.838** 0.904** 0.786** �0.540** 1Sig. (two-tailed) 0.000 0.000 0.000 0.000 0.002
Notes: Adjusted R2 = 0.76; **correlation is significant at the 0.01 level (two-tailed)
Case study ofPabna
189
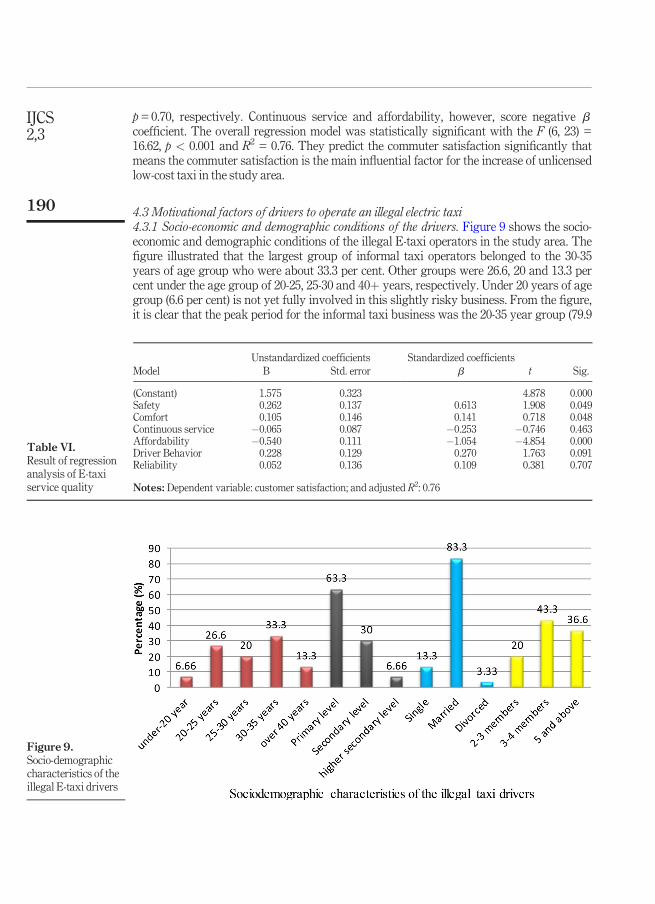
p=0.70, respectively. Continuous service and affordability, however, score negative bcoefficient. The overall regression model was statistically significant with the F (6, 23) =16.62, p < 0.001 and R2 = 0.76. They predict the commuter satisfaction significantly thatmeans the commuter satisfaction is the main influential factor for the increase of unlicensedlow-cost taxi in the study area.
4.3 Motivational factors of drivers to operate an illegal electric taxi4.3.1 Socio-economic and demographic conditions of the drivers. Figure 9 shows the socio-economic and demographic conditions of the illegal E-taxi operators in the study area. Thefigure illustrated that the largest group of informal taxi operators belonged to the 30-35years of age group who were about 33.3 per cent. Other groups were 26.6, 20 and 13.3 percent under the age group of 20-25, 25-30 and 40þ years, respectively. Under 20 years of agegroup (6.6 per cent) is not yet fully involved in this slightly risky business. From the figure,it is clear that the peak period for the informal taxi business was the 20-35 year group (79.9
Table VI.Result of regressionanalysis of E-taxiservice quality
ModelUnstandardized coefficients Standardized coefficients
t Sig.B Std. error b
(Constant) 1.575 0.323 4.878 0.000Safety 0.262 0.137 0.613 1.908 0.049Comfort 0.105 0.146 0.141 0.718 0.048Continuous service �0.065 0.087 �0.253 �0.746 0.463Affordability �0.540 0.111 �1.054 �4.854 0.000Driver Behavior 0.228 0.129 0.270 1.763 0.091Reliability 0.052 0.136 0.109 0.381 0.707
Notes: Dependent variable: customer satisfaction; and adjusted R2: 0.76
Figure 9.Socio-demographiccharacteristics of theillegal E-taxi drivers
IJCS2,3
190
per cent) because the 20-35 years range people were married person (83.3 per cent) and theyneed a job to support their family. Married people who had to support three to four memberswere 43.3 per cent or more than five members were 36.6 per cent. On the other hand, forthose with low education (primary level) (63.3 per cent) did not get a stable job in differentNGOs and government department; eventually, to support their families, they started theillegal taxi operation as it was the only means of their living. However, the over 40 groupsare the most experienced and knowledgeable operators who were actively thinking about toquitting the job or expand into different exercises like - small shop.
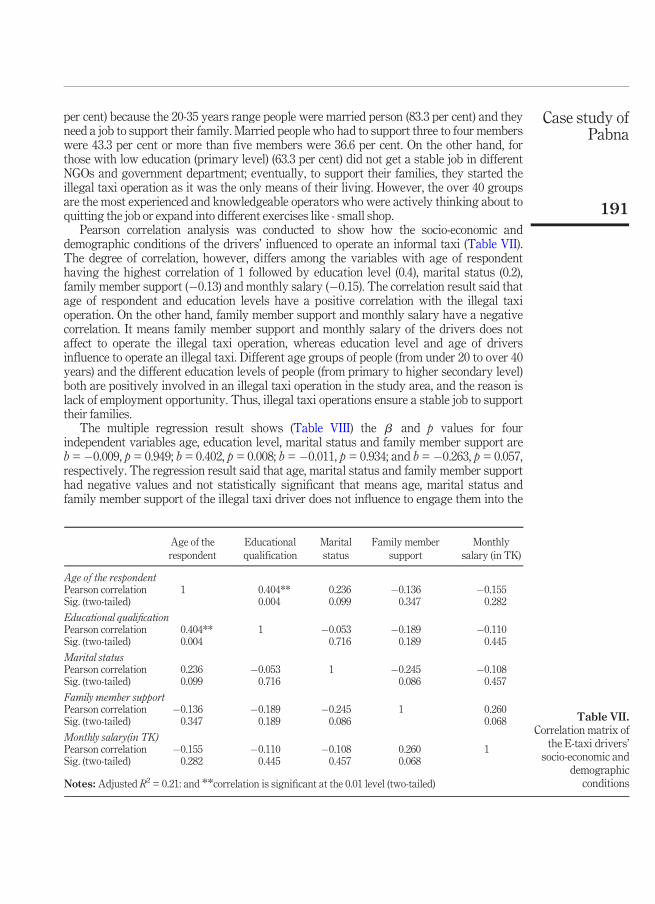
Pearson correlation analysis was conducted to show how the socio-economic anddemographic conditions of the drivers’ influenced to operate an informal taxi (Table VII).The degree of correlation, however, differs among the variables with age of respondenthaving the highest correlation of 1 followed by education level (0.4), marital status (0.2),family member support (�0.13) and monthly salary (�0.15). The correlation result said thatage of respondent and education levels have a positive correlation with the illegal taxioperation. On the other hand, family member support and monthly salary have a negativecorrelation. It means family member support and monthly salary of the drivers does notaffect to operate the illegal taxi operation, whereas education level and age of driversinfluence to operate an illegal taxi. Different age groups of people (from under 20 to over 40years) and the different education levels of people (from primary to higher secondary level)both are positively involved in an illegal taxi operation in the study area, and the reason islack of employment opportunity. Thus, illegal taxi operations ensure a stable job to supporttheir families.
The multiple regression result shows (Table VIII) the b and p values for fourindependent variables age, education level, marital status and family member support areb =�0.009, p = 0.949; b = 0.402, p = 0.008; b =�0.011, p = 0.934; and b =�0.263, p = 0.057,respectively. The regression result said that age, marital status and family member supporthad negative values and not statistically significant that means age, marital status andfamily member support of the illegal taxi driver does not influence to engage them into the
Table VII.Correlation matrix of
the E-taxi drivers’socio-economic and
demographicconditions
Age of therespondent
Educationalqualification
Maritalstatus
Family membersupport
Monthlysalary (in TK)
Age of the respondentPearson correlation 1 0.404** 0.236 �0.136 �0.155Sig. (two-tailed) 0.004 0.099 0.347 0.282
Educational qualificationPearson correlation 0.404** 1 �0.053 �0.189 �0.110Sig. (two-tailed) 0.004 0.716 0.189 0.445
Marital statusPearson correlation 0.236 �0.053 1 �0.245 �0.108Sig. (two-tailed) 0.099 0.716 0.086 0.457
Family member supportPearson correlation �0.136 �0.189 �0.245 1 0.260Sig. (two-tailed) 0.347 0.189 0.086 0.068
Monthly salary(in TK)Pearson correlation �0.155 �0.110 �0.108 0.260 1Sig. (two-tailed) 0.282 0.445 0.457 0.068
Notes: Adjusted R2 = 0.21: and **correlation is significant at the 0.01 level (two-tailed)
Case study ofPabna
191
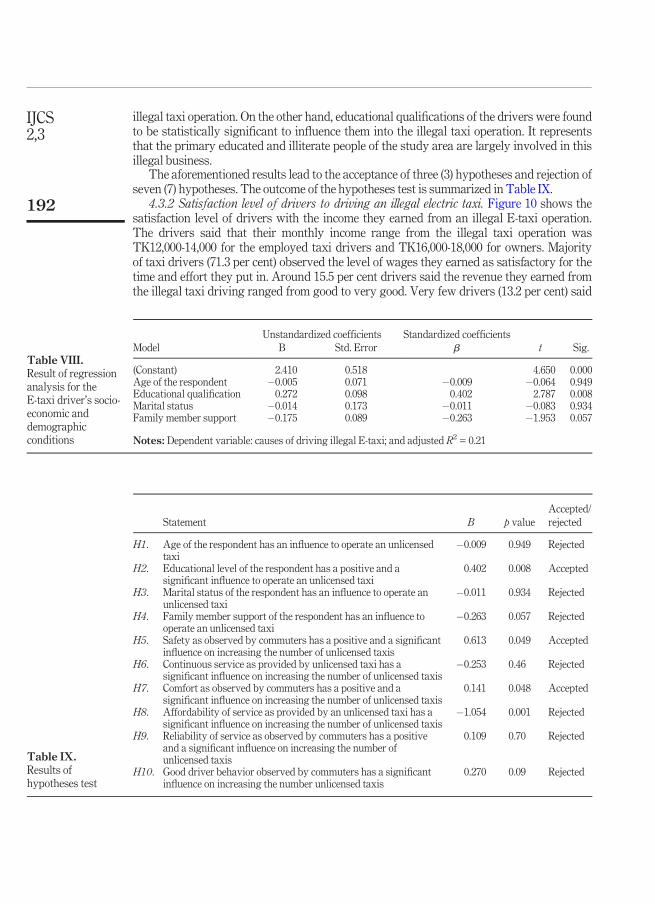
illegal taxi operation. On the other hand, educational qualifications of the drivers were foundto be statistically significant to influence them into the illegal taxi operation. It representsthat the primary educated and illiterate people of the study area are largely involved in thisillegal business.
The aforementioned results lead to the acceptance of three (3) hypotheses and rejection ofseven (7) hypotheses. The outcome of the hypotheses test is summarized in Table IX.
4.3.2 Satisfaction level of drivers to driving an illegal electric taxi. Figure 10 shows thesatisfaction level of drivers with the income they earned from an illegal E-taxi operation.The drivers said that their monthly income range from the illegal taxi operation wasTK12,000-14,000 for the employed taxi drivers and TK16,000-18,000 for owners. Majorityof taxi drivers (71.3 per cent) observed the level of wages they earned as satisfactory for thetime and effort they put in. Around 15.5 per cent drivers said the revenue they earned fromthe illegal taxi driving ranged from good to very good. Very few drivers (13.2 per cent) said
Table VIII.Result of regressionanalysis for theE-taxi driver’s socio-economic anddemographicconditions
Unstandardized coefficients Standardized coefficientsModel B Std. Error b t Sig.
(Constant) 2.410 0.518 4.650 0.000Age of the respondent �0.005 0.071 �0.009 �0.064 0.949Educational qualification 0.272 0.098 0.402 2.787 0.008Marital status �0.014 0.173 �0.011 �0.083 0.934Family member support �0.175 0.089 �0.263 �1.953 0.057
Notes: Dependent variable: causes of driving illegal E-taxi; and adjusted R2 = 0.21
Table IX.Results ofhypotheses test
Statement B p valueAccepted/rejected
H1. Age of the respondent has an influence to operate an unlicensedtaxi
�0.009 0.949 Rejected
H2. Educational level of the respondent has a positive and asignificant influence to operate an unlicensed taxi
0.402 0.008 Accepted
H3. Marital status of the respondent has an influence to operate anunlicensed taxi
�0.011 0.934 Rejected
H4. Family member support of the respondent has an influence tooperate an unlicensed taxi
�0.263 0.057 Rejected
H5. Safety as observed by commuters has a positive and a significantinfluence on increasing the number of unlicensed taxis
0.613 0.049 Accepted
H6. Continuous service as provided by unlicensed taxi has asignificant influence on increasing the number of unlicensed taxis
�0.253 0.46 Rejected
H7. Comfort as observed by commuters has a positive and asignificant influence on increasing the number of unlicensed taxis
0.141 0.048 Accepted
H8. Affordability of service as provided by an unlicensed taxi has asignificant influence on increasing the number of unlicensed taxis
�1.054 0.001 Rejected
H9. Reliability of service as observed by commuters has a positiveand a significant influence on increasing the number ofunlicensed taxis
0.109 0.70 Rejected
H10. Good driver behavior observed by commuters has a significantinfluence on increasing the number unlicensed taxis
0.270 0.09 Rejected
IJCS2,3
192
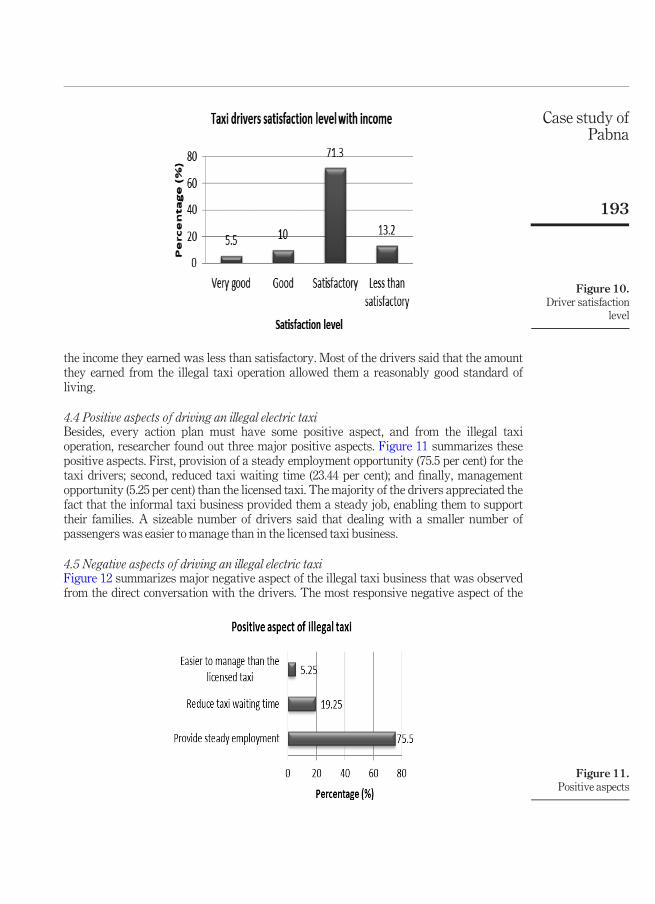
the income they earned was less than satisfactory. Most of the drivers said that the amountthey earned from the illegal taxi operation allowed them a reasonably good standard ofliving.
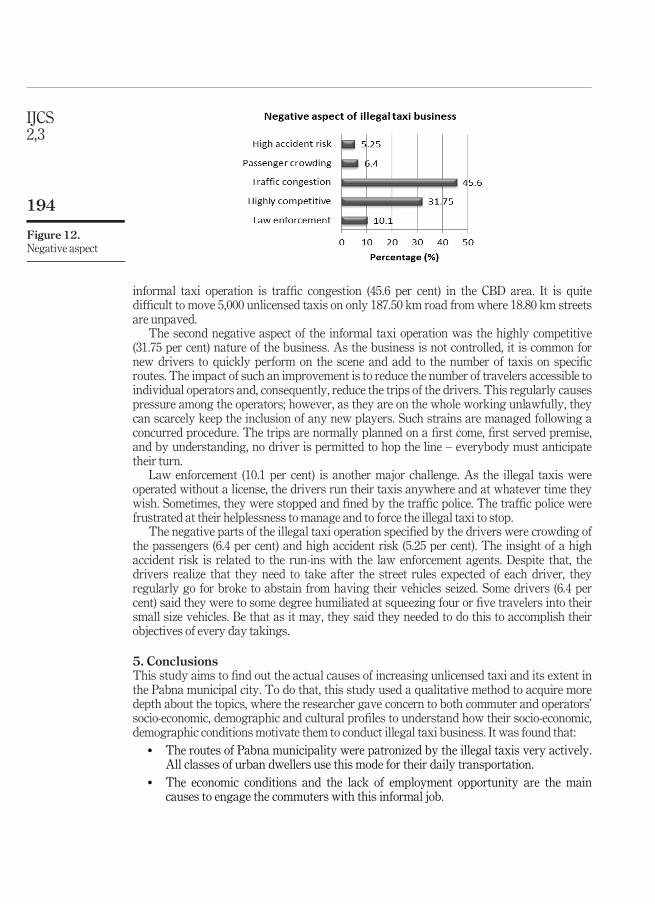
4.4 Positive aspects of driving an illegal electric taxiBesides, every action plan must have some positive aspect, and from the illegal taxioperation, researcher found out three major positive aspects. Figure 11 summarizes thesepositive aspects. First, provision of a steady employment opportunity (75.5 per cent) for thetaxi drivers; second, reduced taxi waiting time (23.44 per cent); and finally, managementopportunity (5.25 per cent) than the licensed taxi. The majority of the drivers appreciated thefact that the informal taxi business provided them a steady job, enabling them to supporttheir families. A sizeable number of drivers said that dealing with a smaller number ofpassengers was easier to manage than in the licensed taxi business.
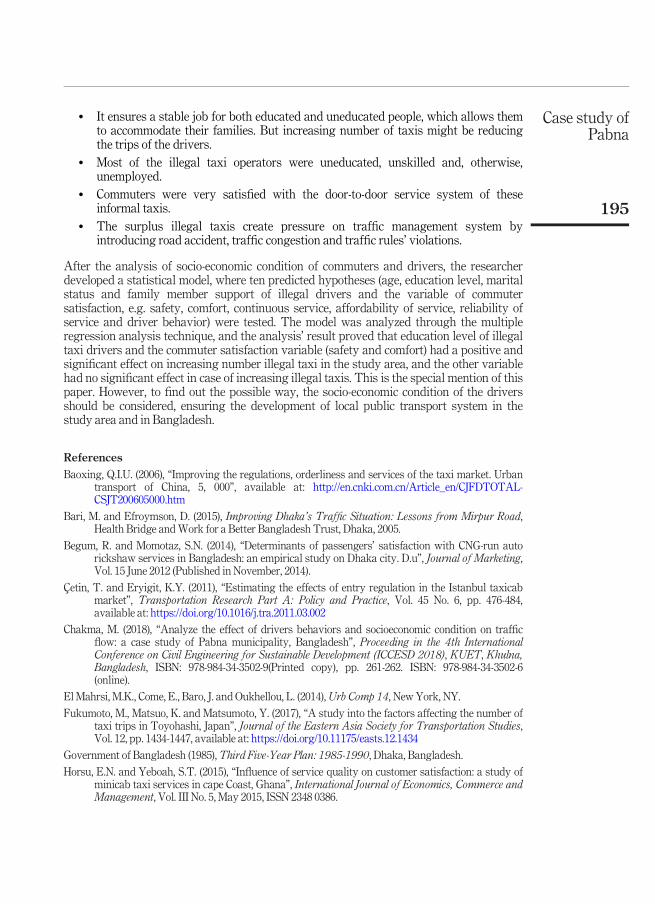
4.5 Negative aspects of driving an illegal electric taxiFigure 12 summarizes major negative aspect of the illegal taxi business that was observedfrom the direct conversation with the drivers. The most responsive negative aspect of the
Figure 10.Driver satisfaction
level
Figure 11.Positive aspects
Case study ofPabna
193
informal taxi operation is traffic congestion (45.6 per cent) in the CBD area. It is quitedifficult to move 5,000 unlicensed taxis on only 187.50 km road from where 18.80 km streetsare unpaved.
The second negative aspect of the informal taxi operation was the highly competitive(31.75 per cent) nature of the business. As the business is not controlled, it is common fornew drivers to quickly perform on the scene and add to the number of taxis on specificroutes. The impact of such an improvement is to reduce the number of travelers accessible toindividual operators and, consequently, reduce the trips of the drivers. This regularly causespressure among the operators; however, as they are on the whole working unlawfully, theycan scarcely keep the inclusion of any new players. Such strains are managed following aconcurred procedure. The trips are normally planned on a first come, first served premise,and by understanding, no driver is permitted to hop the line – everybody must anticipatetheir turn.
Law enforcement (10.1 per cent) is another major challenge. As the illegal taxis wereoperated without a license, the drivers run their taxis anywhere and at whatever time theywish. Sometimes, they were stopped and fined by the traffic police. The traffic police werefrustrated at their helplessness to manage and to force the illegal taxi to stop.
The negative parts of the illegal taxi operation specified by the drivers were crowding ofthe passengers (6.4 per cent) and high accident risk (5.25 per cent). The insight of a highaccident risk is related to the run-ins with the law enforcement agents. Despite that, thedrivers realize that they need to take after the street rules expected of each driver, theyregularly go for broke to abstain from having their vehicles seized. Some drivers (6.4 percent) said they were to some degree humiliated at squeezing four or five travelers into theirsmall size vehicles. Be that as it may, they said they needed to do this to accomplish theirobjectives of every day takings.
5. ConclusionsThis study aims to find out the actual causes of increasing unlicensed taxi and its extent inthe Pabna municipal city. To do that, this study used a qualitative method to acquire moredepth about the topics, where the researcher gave concern to both commuter and operators’socio-economic, demographic and cultural profiles to understand how their socio-economic,demographic conditions motivate them to conduct illegal taxi business. It was found that:
� The routes of Pabna municipality were patronized by the illegal taxis very actively.All classes of urban dwellers use this mode for their daily transportation.
� The economic conditions and the lack of employment opportunity are the maincauses to engage the commuters with this informal job.
Figure 12.Negative aspect
IJCS2,3
194
� It ensures a stable job for both educated and uneducated people, which allows themto accommodate their families. But increasing number of taxis might be reducingthe trips of the drivers.
� Most of the illegal taxi operators were uneducated, unskilled and, otherwise,unemployed.
� Commuters were very satisfied with the door-to-door service system of theseinformal taxis.
� The surplus illegal taxis create pressure on traffic management system byintroducing road accident, traffic congestion and traffic rules’ violations.
After the analysis of socio-economic condition of commuters and drivers, the researcherdeveloped a statistical model, where ten predicted hypotheses (age, education level, maritalstatus and family member support of illegal drivers and the variable of commutersatisfaction, e.g. safety, comfort, continuous service, affordability of service, reliability ofservice and driver behavior) were tested. The model was analyzed through the multipleregression analysis technique, and the analysis’ result proved that education level of illegaltaxi drivers and the commuter satisfaction variable (safety and comfort) had a positive andsignificant effect on increasing number illegal taxi in the study area, and the other variablehad no significant effect in case of increasing illegal taxis. This is the special mention of thispaper. However, to find out the possible way, the socio-economic condition of the driversshould be considered, ensuring the development of local public transport system in thestudy area and in Bangladesh.
ReferencesBaoxing, Q.I.U. (2006), “Improving the regulations, orderliness and services of the taxi market. Urban
transport of China, 5, 000”, available at: http://en.cnki.com.cn/Article_en/CJFDTOTAL-CSJT200605000.htm
Bari, M. and Efroymson, D. (2015), Improving Dhaka’s Traffic Situation: Lessons from Mirpur Road,Health Bridge andWork for a Better Bangladesh Trust, Dhaka, 2005.
Begum, R. and Momotaz, S.N. (2014), “Determinants of passengers’ satisfaction with CNG-run autorickshaw services in Bangladesh: an empirical study on Dhaka city. D.u”, Journal of Marketing,Vol. 15 June 2012 (Published in November, 2014).
Çetin, T. and Eryigit, K.Y. (2011), “Estimating the effects of entry regulation in the Istanbul taxicabmarket”, Transportation Research Part A: Policy and Practice, Vol. 45 No. 6, pp. 476-484,available at: https://doi.org/10.1016/j.tra.2011.03.002
Chakma, M. (2018), “Analyze the effect of drivers behaviors and socioeconomic condition on trafficflow: a case study of Pabna municipality, Bangladesh”, Proceeding in the 4th InternationalConference on Civil Engineering for Sustainable Development (ICCESD 2018), KUET, Khulna,Bangladesh, ISBN: 978-984-34-3502-9(Printed copy), pp. 261-262. ISBN: 978-984-34-3502-6(online).
El Mahrsi, M.K., Come, E., Baro, J. and Oukhellou, L. (2014),Urb Comp 14, New York, NY.
Fukumoto, M., Matsuo, K. and Matsumoto, Y. (2017), “A study into the factors affecting the number oftaxi trips in Toyohashi, Japan”, Journal of the Eastern Asia Society for Transportation Studies,Vol. 12, pp. 1434-1447, available at: https://doi.org/10.11175/easts.12.1434
Government of Bangladesh (1985),Third Five-Year Plan: 1985-1990, Dhaka, Bangladesh.Horsu, E.N. and Yeboah, S.T. (2015), “Influence of service quality on customer satisfaction: a study of
minicab taxi services in cape Coast, Ghana”, International Journal of Economics, Commerce andManagement, Vol. III No. 5, May 2015, ISSN 2348 0386.
Case study ofPabna
195
Jun-zhong,W.Q.Q.T. (2011),Nature, Role andManagement Mode of the Taxi Industry,Urban Problems,11, p. 016.
Kadiyali, L.R. (2013), Traffic Engineering and Transport Planning, Khanna publishers. New Delhi,3013.
Mala, S. (2016), “Lack of taxi services cause of illegal operations, says Tuinaceva”, Fijisun. 04 April2016, available at: http://fijisun.com.fj/2016/04/04/lack-of-taxi-services-cause-of-illegal-operations-says-tuinaceva/
Mamun, A.H. (2015), “Electric three wheelers and municipal transportation in Bangladesh”,International Journal of Innovative and Applied Research, Vol. 3 No. 2, pp. 12-16.
Mannan, S.M. and Karim, M.M. (2001), “Current state of the mobility of the urban dwellers in greaterDhaka”, 94th Annual Conference and Exhibition of Air and Waste Management Association,June 24-28, 2001,Orlando, FL.
Merriam, S.B. (2009), Qualitative Research: A Guide to Design and Implementation, Jossey-Bass, SanFrancisco, CA, ISBN-13: 978-0470283547.
Ming-yi, C.H.E.N. (2007), “Entry regulation, fares control and the divagation of unlicensed taxis–analysis on the taxi markets in Beijing and shanghai”, Journal of Shanxi Finance and EconomicsUniversity, Vol. 11, p. 010.
Minott, A. (2016), “Companies admit to dispatching illegal taxis to collect passengers”, The Gleaner,December 6, 2016, available at: http://jamaica-gleaner.com/article/lead-stories/20161206/companies-admit-dispatching-illegal-taxis-collect-passengers
Oliver, R.L. (1997), “Satisfaction: a behavioral perspective on the consumer”, Irwin/McGraw Hill, NewYork, NY, p. 13.
Peterson, R.A. (1994), “A Meta-Analysis of Cronbach’s coefficient alpha”, Journal of ConsumerResearch, Vol. 21 No. 2, pp. 381-391, available at: www.jstor.org/stable/2489828
Rahim, M.A., Joardder, M.U.H., Hoque, S.M.N., Rahman, M.M. and Sumon, N.H. (2012), “Socio-economicand environmental impacts of battery driven auto rickshaw at Rajshahi city in Bangladesh”,International Conference on Mechanical, Industrial and Energy Engineering 2012 01-02February, 2013,Khulna, Bangladesh.
Rahman, M.M., Okura, I. and Nakamura, F. (2004), “Effects OF rickshaws and auto-rickshaws on thecapacity OF urban signalized intersections”, IATSS Research, Vol. 28 No. 1.
Rana, S., Hossain, F., Roy, S.S. and Mitra, S.K. (2013), “The role of battery operated Auto-Rickshaw inthe transportation system of a city”, Journal of Asian Electric Vehicles, Vol. 11, No. 1, June 2013.
Rosen, J. (2016), “The Bangladeshi traffic jam that never ends”, The New York Time Style Magazine,available at: www.nytimes.com/2016/09/23/t-magazine/travel/dhaka-bangladesh-traffic.html
Saha, A.K., Haque, M.R., Nahar, T.T. and Rahman, M.M. (2013), “Application of traffic managementplan a sustainable solution of traffic congestion in Pabna city, Bangladesh”, InternationalJournal of Recent Development in Engineering and Technology, Vol. 1 No. 3, pp. 11-15.
Seemela, M. (2017), “Illegal taxi ranks in fourways cause concern”, Fourway Review, February 17, 2017,available at: https://fourwaysreview.co.za/254851/illegal-taxi-ranks-in-fourways-cause-concern/
Shamsher, R. and Abdullah, M.N. (2013), “Traffic congestion in Bangladesh-Causes and solutions: astudy of Chittagong metropolitan city”, Asian Business Review, Vol. 2 No. 1, (Issue 3) ISSN 2304-2613 (Print); ISSN 2305-8730 (Online).
Tichagwa, C.G. (2016), “Unlicensed taxis in Zimbabwe’s urban areas: the case for Legalising aninformal urban transportation system”, Development Southern Africa, Vol. 33 No. 1, pp. 81-98,available at: https://doi.org/10.1080/0376835X.2015.1113125
Tribune, D. (2018), “Study: Dhaka traffic wastes 5 million work hours, costs Tk37,000 crore”, Tuesday,available at: www.dhakatribune.com/bangladesh/dhaka/2018/05/20/study-dhaka-traffic-wastes-5-million-work-hours-costs-tk37-000-crore (accessed 22May 2018).
IJCS2,3
196
Uddin, M.F. and Sano, K. (2011), “Transportation problem urban city of the developing countryBangladesh”, Proceedings of the Eastern Asia Society for Transportation Studies, Vol. 8.
UGIIP (2007), Urban Governance and Infrastructure Improvement Project (UGIIP) for PabnaPourashava, Local Government and Engineering Department of Bangladesh, Dhaka.
Yanshen, C.H.E.N. (2009), Analysis on Current Problems of Taxi Industry Stablizing and Developing,Urban Studies, 2, p. 022.
Yuan, W., Deng, P., Taleb, T., Wan, J. and Bi, C. (2016), “An unlicensed taxi identification model basedon big data analysis”, IEEE Transactions on Intelligent Transportation Systems, Vol. 17 No. 6,pp. 1703-1713, doi: 10.1109/TITS.2015.2498180.
About the authorsMital Chakma is a graduate student at Pabna University of Science and Technology in the field ofUrban and Regional Planning. His research interest area is public transportation considering taximode. Mital Chakma is the corresponding author and can be contacted at: [email protected]
Md Sohel Rana is a Lecturer at Pabna University of Science and Technology in the Department ofUrban and Regional Planning. His research interest areas are transportation planning andmanagement, urban planning, disaster management and mitigation planning.
Md Ashrafuzzaman Pramanik is an Assistant Professor at Pabna University of Science andTechnology in the Department of Urban and Regional Planning. His research interest areas are urbanplanning and traffic and transportation planning.
For instructions on how to order reprints of this article, please visit our website:www.emeraldgrouppublishing.com/licensing/reprints.htmOr contact us for further details: [email protected]
Case study ofPabna
197