Embed Size (px)
Citation preview

International Journal of Scientific & Engineering Research, Volume 6, Issue 5, May-2015 656 ISSN 2229-5518
IJSER © 2015 http://www.ijser.orgs
Modeling of a Three Legged Self Supporting Telecommunication mast
under sudden side wind Crash Loading Oluwole.O and Akande.I.G* Department of Mechanical Engineering, University of Ibadan, Oyo state. Nigeria.
Emails: [email protected] *corresponding author’s email: [email protected]
Abstract—This Paper is on the modeling of telecommunication mast in a windy environment. The effect of sudden side crash wind load on a 3-legged Self Supporting Telecommunication Mast was studied in a 3-D modeling ANSYS environment. The behavioral patterns under full loading in windy environment were observed. The full loading being the self weight, communication system weight coupled with wind load. The effects of the bolts were neglected. The height of the modeled mast is 26.58m (2658cm or 26580mm). The mast was subjected to wind load from the side at different heights with the top mast having a load of 6196N and12908N at height 8.36m, in addition to the system load. A displacement of 17.486mm was seen to occur at the top and 0 mm at the base showing a fatigue loading at wind frequencies. The fatigue loads were observed to be much below the fatigue limit (endurance limit for mild steel). Direct stresses showed compressive stresses concentrated on a leg and of greater magnitude than tensile stresses developed on each of the two other legs opposite the points of wind application. The tensile stresses were balanced out by the compressive stresses to maintain mast stability.
Index Terms— Telecommunication mast, Deformation, Stress analysis, Wind load, ANSYS, Fatigue, Modeling.
—————————— ——————————
1 INTRODUCTION
A Self Supporting Telecommunication mast serves as a medium for receiving and transmitting wireless type of communication which includes mobile and internet net work, television and radio broadcasting and also integration of radar system. Generally, the masts are tapered upwards and usually supported at several levels along its height by a set of varying angle bracing member. The members are designed either as compression or tension members. This is because failure of any member will lead to the total failure of the structure. Failure originates from the kinds of loading the mast is subjected to such as (self weight or weight of antenna etc) and dynamic loading i.e. wind strike that is associated with altitude.(Mohd et al.,2013) [2]
A self supporting telecommunication mast has a larger foot print than monopole, but still requires a much smaller area than guyed mast. Due to its relatively small foot print, this kind of mast is commonly seen in cities or other places where it is short of free space. They free stand with three or four legs connected by a lattice work braces. Self supporting telecommunication masts can utilize a single foundation supporting all the legs or individual foundations below each leg. Due to the loading lattice mast foundations can experience both vertical and horizontal loads. The vertical loads act in both the upwards and downwards direction as the mast attempts to overturn. The horizontal or shear loading can act in any direction as the direction of the wind can vary. (http://www.cdc.gov) ,( Stottrup, 2012) [5]
For some years, the finite element method has been applied to solve the solid mechanics problems in view of its accuracy, convenience and flexibility.2-D modeling is known for its simplicity and ability to run on normal computer. This research attempt to simulate and analyze the deformation and stress distribution on a 3-D modeling of a telecommunication mast employing finite element method by the means of
IJSER
International Journal of Scientific & Engineering Research, Volume 6, Issue 5, May-2015 657 ISSN 2229-5518
IJSER © 2015 http://www.ijser.orgs
commercial soft ware known as ANSYS 14.0 as the modeler and processor. The study is significant in structure material selection and design process prior to fabrication and installation. By using ANSYS, failure behavior of the structure is simplified and there is a reduction or elimination of physical tests.
2 MODELING PROCEDURES
The overall procedure consist of (i) 3D Modeling of 3-legged self supporting telecommunication mast with L cross section (ii) Stress analysis of the masts (iii) Deformation of the mast under the action of wind load which are made to strike the mast from a particular direction, with all other loads in consideration and (iv) Analyzing the stresses and deformation on the Modeled Telecommunication Mast.
2.1 The Governing Equations and boundary conditions
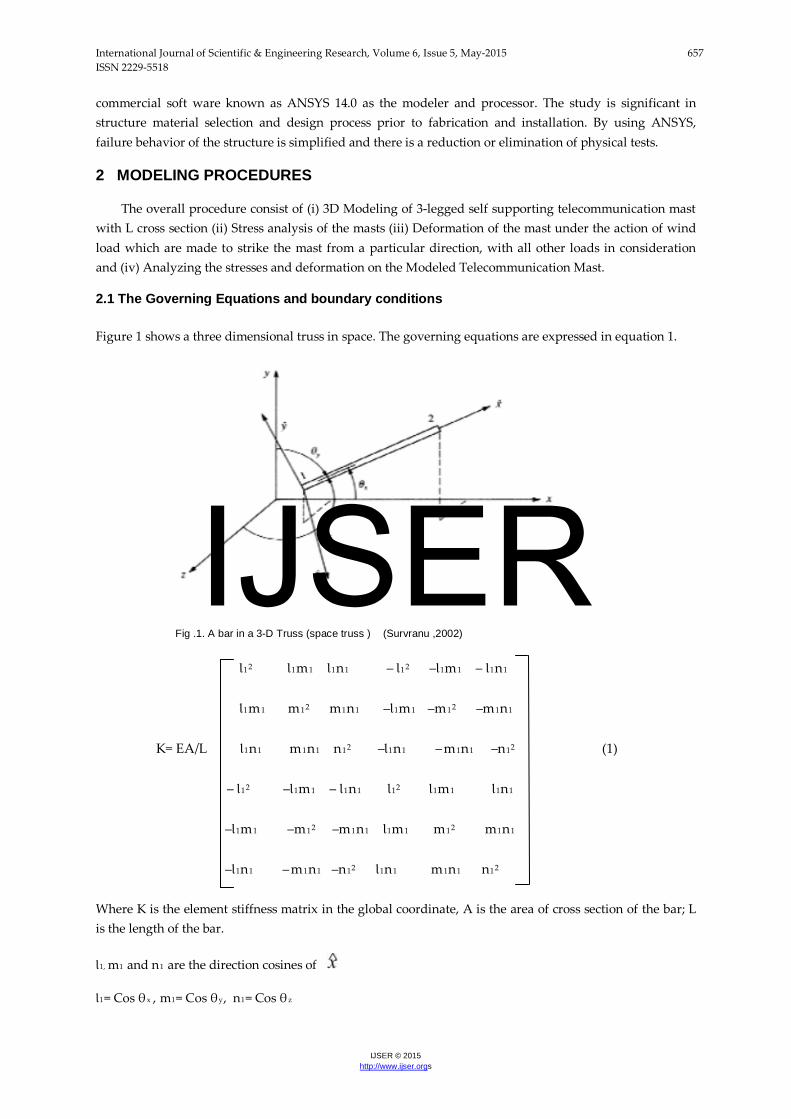
Figure 1 shows a three dimensional truss in space. The governing equations are expressed in equation 1.
Fig .1. A bar in a 3-D Truss (space truss ) (Survranu ,2002)
Ɩ12 Ɩ1m1 Ɩ1n1 – Ɩ12 –Ɩ1m1 – Ɩ1n1
Ɩ1m1 m12 m1n1 –Ɩ1m1 –m12 –m1n1
K= EA/L Ɩ1n1 m1n1 n12 –Ɩ1n1 – m1n1 –n12 (1)
– Ɩ12 –Ɩ1m1 – Ɩ1n1 Ɩ12 Ɩ1m1 Ɩ1n1
–Ɩ1m1 –m12 –m1n1 Ɩ1m1 m12 m1n1
–Ɩ1n1 – m1n1 –n12 Ɩ1n1 m1n1 n12
Where K is the element stiffness matrix in the global coordinate, A is the area of cross section of the bar; L is the length of the bar.
Ɩ1, m1 and n1 are the direction cosines of
Ɩ1= Cos θx , m1= Cos θy, n1= Cos θz
IJSER

International Journal of Scientific & Engineering Research, Volume 6, Issue 5, May-2015 658 ISSN 2229-5518
IJSER © 2015 http://www.ijser.orgs
F = KU (2)
Where F is the Load vector of the truss element and d is the displacement (Survranu , 2002) [6]. Figure 1 shows the displacement that occurs in each of the mast element. The displacement u(x, y, z) at the feet of the mast satisfies the simple dirichlet boundary condition i.e. u(x)=0, u(y)=0, u(z)=0 .Dirichlet may also be known as fixed or essential boundary condition.
2.2 Basic steps in the modeling of the telecommunication mast
Ansys work bench
Generation of nodes
Creation of line bodies
Generation of Cross sections
Assigning material properties
Developing Model
Setting up connections
Applying loads
Setting up solution items
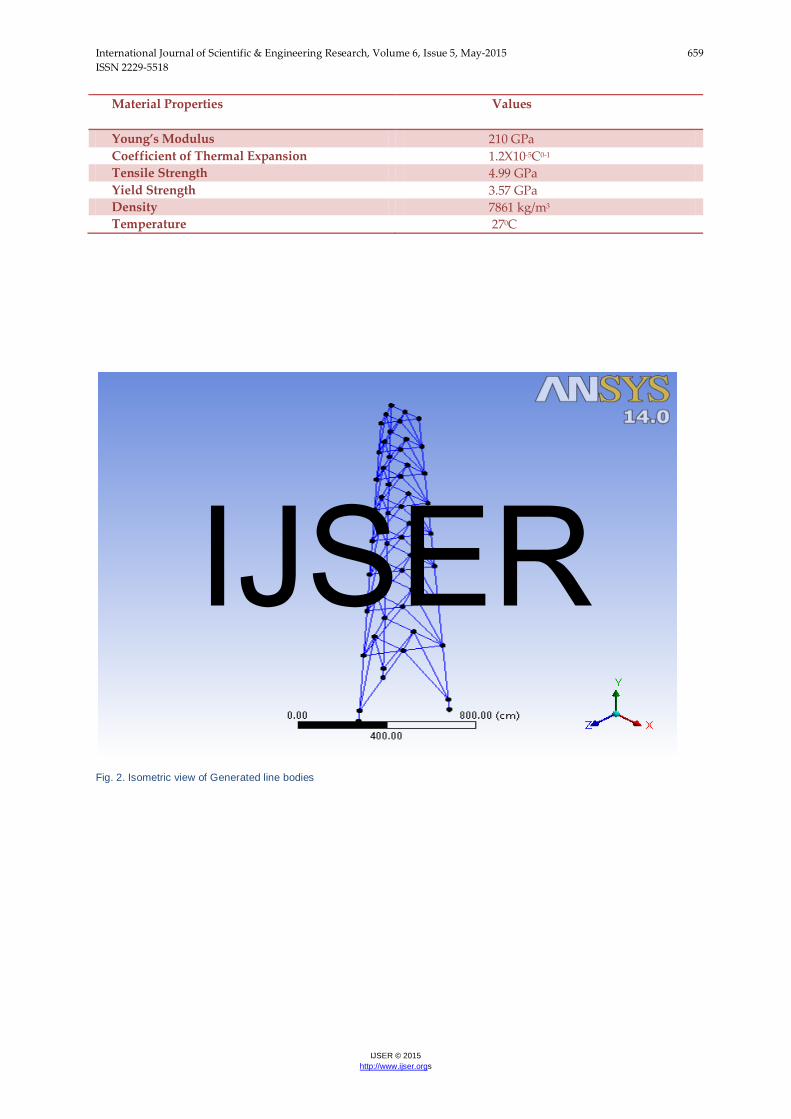
The views of some of the modeling steps are show in figure (2, 3, 5 and 6)
TABLE 1 MATERIAL PROPERTIES OF MILD STEEL USED IN THE MODEL
IJSER
International Journal of Scientific & Engineering Research, Volume 6, Issue 5, May-2015 659 ISSN 2229-5518
IJSER © 2015 http://www.ijser.orgs
Material Properties Values
Young’s Modulus 210 GPa Coefficient of Thermal Expansion 1.2X10⁻⁵C0-1 Tensile Strength 4.99 GPa Yield Strength 3.57 GPa Density 7861 kg/m3 Temperature 270C
Fig. 2. Isometric view of Generated line bodies
IJSER

International Journal of Scientific & Engineering Research, Volume 6, Issue 5, May-2015 660 ISSN 2229-5518
IJSER © 2015 http://www.ijser.orgs
Fig. 3. Isometric view of mast with cross section
Fig. 4. Material (Angle Bars) Type.(Mohd et al.,2013) [2]
TABLE 2 PARAMETERS OF THE BARS
Members Width Thickness Angle , Mass & volume Foot 400mm 100mm 900 Brace and Joint 150mm 20mm 900 Mass and Volume of the structure
13008kg, 1.6571e+009 mm³
IJSER

International Journal of Scientific & Engineering Research, Volume 6, Issue 5, May-2015 661 ISSN 2229-5518
IJSER © 2015 http://www.ijser.orgs
Fig. 5. Isometric view of meshed mast
Fig.6. Setting up joint connection (isometric view)
IJSER

International Journal of Scientific & Engineering Research, Volume 6, Issue 5, May-2015 662 ISSN 2229-5518
IJSER © 2015 http://www.ijser.orgs
2.3 Obtaining value of forces on various height of the mast
Several values of the wind forces for various height and area are shown in table 3 below. The graph is figure 3 show that as the height of the mast increases, the values of the wind load decreases. The values of the wind load were calculated using equation (3). The wind speed was assumed to be 45m/s. This was kept constant all through the heights, acting at an elevation of 8.36m above the ground, so was the density of the wind. Area is simply the area of the face the sudden wind strikes i.e. the face perpendicular to the wind force. It is obvious from table 3 that as the height of the mast increase, the areas of the element increase, this actually prompted increase in the wind the values of the wind forces. In figure 8 below, the load acts perpendicular on one side of the mast while the system loads (2400N) act down wards.
FW = ½[Cd .V2. A. ρ ] (Rajan, 2013) [4], Pahwa et.al [3] (3)
FW =Force due to wind (N), ρ =Air density (1.22kg/m3) , Cd= Drag coefficient (from text or experimental data), V= Wind velocity (m/s), A =Cross sectional area perpendicular or normal to wind direction (e.g. length * width). The figures below shows drag coefficient for various profile. Cd for a rectangular profile is 1.9 (Rajan, 2013) [4]
TABLE 3
CALCULATING VALUES OF WIND LOAD
H(m) V(m/s) P(kg/m3) Cd A(m2) Fw(N)
08.36 45 1.22 1.9 5.50 12908
11.36 45 1.22 1.9 4.95 11618
14.21 45 1.22 1.9 4.50 10561
16.86 45 1.22 1.9 4.10 9623
19.46 45 1.22 1.9 3.71 8707
21.94 45 1.22 1.9 3.33 7815
24.29 45 1.22 1.9 3.00 7041
26.58 45 1.22 1.9 2.64 6196
IJSER

International Journal of Scientific & Engineering Research, Volume 6, Issue 5, May-2015 663 ISSN 2229-5518
IJSER © 2015 http://www.ijser.orgs
Fig.7. Graph of Mast height against the Wind load
Fig. 8. Application of loads and other constraints
0
5
10
15
20
25
30
0 2000 4000 6000 8000 10000 12000 14000
H(m
)
Fw(N)
IJSER

International Journal of Scientific & Engineering Research, Volume 6, Issue 5, May-2015 664 ISSN 2229-5518
IJSER © 2015 http://www.ijser.orgs
Fig. 9. Side view showing application of Loads
Fig. 10. Top view showing application of Loads
3 RESULTS AND DISCUSSION
As a result of the external applied forces (wind load) and the system loads on the modeled mast, it
undergoes deformation as shown in fig 11 . The mast resists the force. Total displacement and directional
IJSER

International Journal of Scientific & Engineering Research, Volume 6, Issue 5, May-2015 665 ISSN 2229-5518
IJSER © 2015 http://www.ijser.orgs
displacement were solved for. The total displacement as shown in fig 11 is the vector sum of the directional
displacements. It was maximum at the extreme top of the mast even though the wind load applied to that
region was lower. The top offered less resistance because of the smaller area. Total displacement decreased
down the mast and was minimum at the foot of the mast.
Direct stresses acted perpendicular to the cross section of the mast’s body or the elements. As shown in
figure 12, the value of the maximum direct tensile stress on each of the mast foot where the wind load
impacted was 33.818 MPa and the value of the maximum direct compressive stress on the third foot of the
mast was -68.569 MPa showing a balance of forces. The force on the third foot being higher shows higher
stress level for fatigue. However, the fatigue limit for mild steel undergoing compression-tension is
250MPA (Mayer and Stanzl-Tschegg, 2015) [1] which shows that the compressive forces are far below the
fatigue limit. However, it has been proved that after a long time these stresses still have debilitating effect
on the structure (Mayer and Stanzl-Tschegg, 2015) [1]
Fig. 11. Results of the total deformation
IJSER

International Journal of Scientific & Engineering Research, Volume 6, Issue 5, May-2015 666 ISSN 2229-5518
IJSER © 2015 http://www.ijser.orgs
Fig. 12. Direct stress on the Modeled Mast
The value of the maximum displacement was 17.486mm, it decreases down the mast, and the minimum
was 0. The value of the maximum stress was 33.818MPa (Tensile) it also decreases down the mast and the
minimum value was -68.569 MPa (Compressive).
4 CONCLUSION
Telecommunication Mast of height 26.58m (2628cm) was modeled and simulated using ANSYS
14.0.The value of the maximum total displacement is 17.486mm i.e. (1.7486cm or 0.017486m) within a
second of sudden load wind strike. Deformation and displacement is minimal towards the base of the
mast; it is zero at the base of the mast. This is due to the large area at the base and the fixed support at the
base. The less number of structural members at the foot also affects its rigidity. The higher a
telecommunication mast length, the more tapered it is at the top and the more likely it is to have higher
displacement at the top. Direct stresses (Compressive and Tensile) are highest at the foot. Masts contain
rigid truss elements which may not collapse when loaded but may only deform slightly, but cycles of
deformation loads will eventually weaken the mast. From this modeled mast it can be concluded that the
mast will withstand those values of sudden wind loads strikes not taking into consideration long –term
corrosion effects on the structural members.
IJSER

International Journal of Scientific & Engineering Research, Volume 6, Issue 5, May-2015 667 ISSN 2229-5518
IJSER © 2015 http://www.ijser.orgs
REFERENCES
[1] H.Mayer and Stanzl-Tschegg, “Very high cycle fatigue behavior under cyclic torsion loading”, Peter- Jordan Street 82,
1190 Vienna Austria,(Accessed 2015, Feb.26).
(http://www.gruppofrattura.it/ocs/index.php/esis/ECF16/paper/view/7507/4182)
[2] R.M. Mohd, M. Jamaluddin, J Aidah., and M. Mohdazuan, “Finite Element Analysis of Telecommunication
Mini Mast Structure”, Faculty of Mechanical Engineering, UniversitiTekogi, MAR, 40450 shah Alan Selango Malaysia, pp :
258-264, 2013.
[3] S. Pahwa, T.Vivek and H. Jatwa, “Analytical Study of Transmission Tower Subjected to Wind and Seismic loads
using optimization technique”, International Journal of Engineering Technology and Advance Engineering, volume 4,
2014.
[4] R.R. Rajan, “Modeling and Analysis of a Broad Band Omni Antenna”, Department of Mechanical Engineering M.V.S.R
Engineering College Nadergul(Affliated to Osmania University ,Hydrabad) , 2013.
[5] U.A. Stottrup,” Analysis and design of masts and Towers”, Head of Department Ramboll Bredevej 2,D K-2030 Virum,
Denmark, 2002.
[6] D.E. Survranu. “Introduction to finite element”, Development of truss equation, 2002.
IJSER


![Ansys Kurulumu - bim.yildiz.edu.tr · Documentation Only' Install MPI for ANSYS ... ANSYS ANSYS F ANSYS ANSYS AIM (V] ANSYS AP-SYS CFO [V) ANSYS ore S . msys Realize Product Promise"](https://img.pdfslide.net/doc/110x75/5b69d01e7f8b9a422e8b4fb9/ansys-kurulumu-bim-documentation-only-install-mpi-for-ansys-ansys-ansys.jpg)