Embed Size (px)
DESCRIPTION
Â
Citation preview

Vol 2 (4) June 2014
International Journal of Students’
Research in Technology & Management
(IJSRTM)
Content List
1.Exergy Analysis of Vapor Compression Refrigeration System Using R12 and R134a as Refrigerants
Mohan Chandrasekharan
2. Investigation of Mechanical Properties of Aluminium 6061 Alloy Friction Stir Welding
J. Stephen Leon and Dr. V. Jayakumar
3. Microwave Assisted Trans-esterification of Waste Cooking Oil in Presence of Alkali Catalyst
Hasna Khalfan AlSuleimani, Priy Brat Dwivedi
4. Prediction of Excess Air Requirement Using ANN for the Improvement of Boiler Efficiency
Arun. S. Gopinath and N. Sreenivasa Babu
5. Study of Microwave Radiation on Transesterification of Jatropha Oil in Presence of Alkali Catalyst
Nadira Hassan Mohammed Al Balushi, Priy Brat Dwivedi
International Journal of Students’ Research in Technology & Management
Vol 2 (04), June-July 2014, ISSN 2321-2543, pg 134-139
http://www.giapjournals.org/ijsrtm.html 134
Exergy Analysis of Vapor Compression
Refrigeration System Using R12 and R134a as
Refrigerants Mohan Chandrasekharan
#1
# Department of Engineering, Mechanical Engineering Section, Al Musanna College of Technology,
Muladdah, Post Box 191, Postal Code 314, Sultanate of Oman. 1 [email protected]
Abstract— This paper deals with a comparative analysis of the
influence of refrigerant on the performance of a simple vapor
compression refrigeration system. The study is based on the
refrigerants R12 and R134a. A computational model based on
energy and exergy analysis is presented for investigation of the
effects of evaporating temperature and degree of sub-cooling on
the coefficient of performance and exergitic efficiency of the
refrigerator.
A considerable part of the energy produced worldwide is
consumed by refrigerators. So it is crucial to minimize the energy
utilization of these devices. The exergy analysis has been widely
used in the analysis of all engineering systems including
refrigerators. It is a powerful tool for the design, optimization
and performance evaluation of energy systems.
It is well known fact that the CFC and HCFC refrigerants have
been forbidden due to chlorine content and there high ozone
depleting potential (ODP) and global warming potential (GWP).
Hence HFC refrigerants are used now-a-days. Many research
papers have been published on the subject of replacing CFC and
HCFC refrigerants with other types of refrigerants.
This paper presents a comparative analysis of two refrigerants
working in a one stage vapor compression refrigeration system
with sub-cooling and superheating. These refrigerants are:
Dichlorodifluoromethane (R-12) and Tetrafluoroethane (R-134a).
Keywords —Vapor compression refrigeration system, Exergy,
COP, Exergetic efficiency, Degree of sub-cooling.
I. INTRODUCTION
Chlorofluorocarbons (CFCs) have been used widely over
the last eight decades in refrigeration and air-conditioning due
to their favorable characteristics such as low freezing point,
non-flammability, non-toxicity and chemically stable behavior
with other materials. Unfortunately, in recent years it has been
recognized that the chlorine released from CFCs migrate to the
stratosphere and destroys the earth’s ozone layer, causing
serious health problems [1, 2].
The Montreal Protocol signed by the international
community in 1987 regulates the production and marketing of
ozone depleting substances. The CFCs were prohibited
completely in 2010. Hydro-fluorocarbons (HFCs) are
presently replacing CFCs as they do not contain any chlorine
atoms and their ozone depletion potential (ODP) is zero.
Refrigerator pumps heat from a closed space to the
atmosphere. Heat transfer between the system and the
surroundings takes place at a finite temperature difference,
which is a major source of irreversibility for the cycle.
Irreversibility causes the system performance to degrade. The
losses in the cycle need to be evaluated considering individual
thermodynamic processes that make up the cycle. Energy
analysis is still the most commonly used method in the
analysis of thermal systems. The first law is concerned only
with the conservation of energy, and it gives no information
on how, where, and how much the system performance is
degraded. Exergy analysis is a powerful tool in the design,
optimization, and performance evaluation of energy systems
[9].
The principles and methodologies of exergy analysis are
well established [6-8]. An exergy analysis is usually aimed to
determine the maximum performance of the system and
identify the sites of exergy destruction. Analyzing the
components of the system separately can perform exergy
analysis of a complex system. Identifying the main sites of
exergy destruction shows the direction for potential
improvements.
There have been several studies on the performance of
alternative environment-friendly refrigerants on the basis of
energy and exergy analysis of refrigeration systems. Said and
Ismail [8] assessed the theoretical performances of R123,
R134a, R11 and R12 as coolants. It was established that for a
specific amount of desired exergy, more compression work is
required for R123 and R134a than R11 and R12. The
International Journal of Students’ Research in Technology & Management
Vol 2 (04), June-July 2014, ISSN 2321-2543, pg 134-139
http://www.giapjournals.org/ijsrtm.html 135
differences are not very significant at high
evaporation temperatures and hence R123 and R134a should
not be excluded as alternative coolants. Also, in their study
they obtained an optimum evaporation temperature for each
condensation temperature, which yields the highest exergetic
efficiency.
Aprea and Greco [9] compared the performance between
R22 and R407C (a zeotropic blend) and suggested that R407C
is a promising drop-in substitute for R22. Experimental tests
were performed in a vapour compression plant with a
reciprocating compressor to evaluate the compressor
performance using R407C in comparison to R22. The plant
overall exergetic performance was also evaluated and revealed
that R22 performance is consistently better than that of its
candidate substitute (R407C).
Aprea and Renno [9] studied experimentally, the
performance of a commercial vapour compression
refrigeration plant, generally adopted for preservation of
foodstuff, using R22 and its candidate substitute (R417A) as
working fluids. The working of the plant was regulated by
on/off cycles of the compressor, operating at the nominal
frequency of 50 Hz, imposed by the classical thermostatic
control. The reported result indicated that the substitute
refrigerant (R417A), which is a non-azeotropic mixture and
non-ozone depleting, can serve as a long term replacement for
R22; it can be used in new and existing direct expansion R22
systems using traditional R22 lubricants. Also in their
analysis, the best exergetic performances of R22 in
comparison with those of R417A were determined in terms of
the coefficient of performance, exergetic efficiency and
exergy destroyed in the plant components.
Khalid [10] studied the performance analysis of R22 and
its substitute refrigerant mixtures R407C, R410A and R417A
on the basis of first law. It was found that the COP of R417A
is 12% higher than R22, but for R407C and R410A, COP is
5% lowered as compared to R22, and R417A can be used in
existing system without any modification.
Various studies reviewed above focused mostly on the
exergetic analysis of R22 and its alternative refrigerants. R12
is used solely in the majority of conventional household
refrigerators, and there is currently little information on the
exergetic performance of R12 alternatives.
Therefore, in this paper, exergetic performances of a
domestic refrigeration system using R12 and its environment-
friendly alternative refrigerant R134a are theoretically studied
and compared.
II. SYSTEM DESCRIPTION
A one stage vapor compression refrigeration system is
considered as numerical exemplification of the proposed
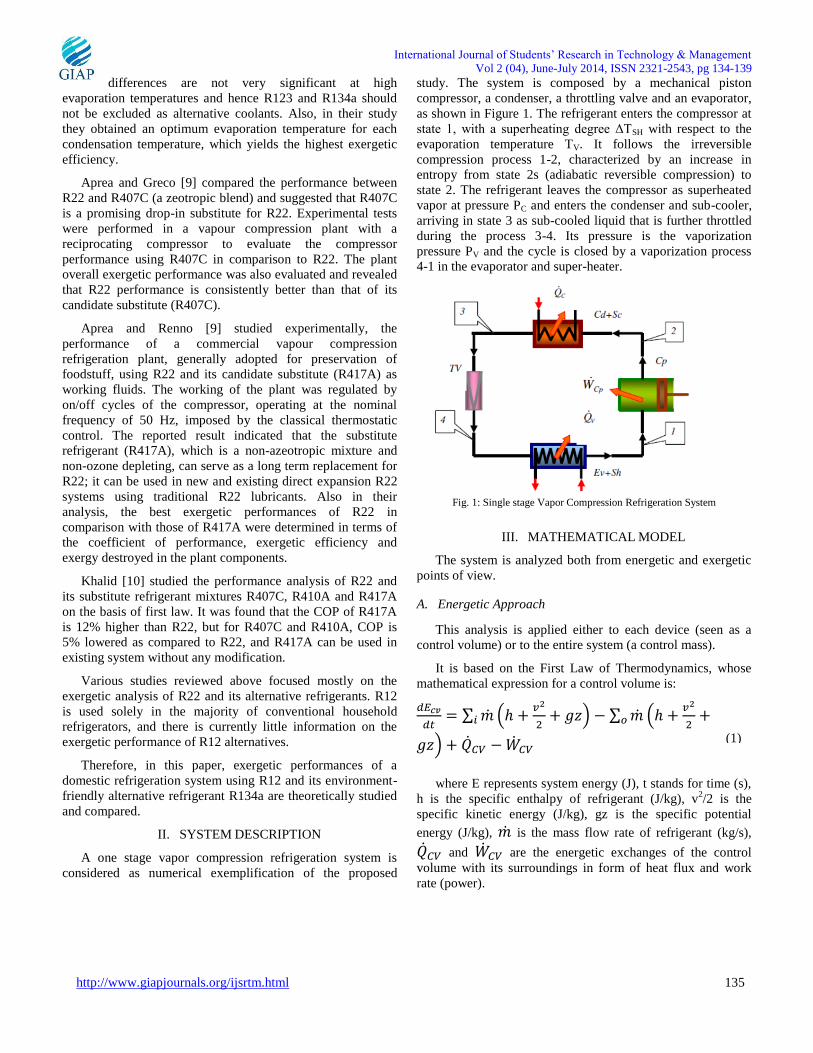
study. The system is composed by a mechanical piston
compressor, a condenser, a throttling valve and an evaporator,
as shown in Figure 1. The refrigerant enters the compressor at
state 1, with a superheating degree ΔTSH with respect to the
evaporation temperature TV. It follows the irreversible
compression process 1-2, characterized by an increase in
entropy from state 2s (adiabatic reversible compression) to
state 2. The refrigerant leaves the compressor as superheated
vapor at pressure PC and enters the condenser and sub-cooler,
arriving in state 3 as sub-cooled liquid that is further throttled
during the process 3-4. Its pressure is the vaporization
pressure PV and the cycle is closed by a vaporization process
4-1 in the evaporator and super-heater.
Fig. 1: Single stage Vapor Compression Refrigeration System
III. MATHEMATICAL MODEL
The system is analyzed both from energetic and exergetic
points of view.
A. Energetic Approach
This analysis is applied either to each device (seen as a
control volume) or to the entire system (a control mass).
It is based on the First Law of Thermodynamics, whose
mathematical expression for a control volume is:
∑ (
) ∑ (
)
where E represents system energy (J), t stands for time (s),
h is the specific enthalpy of refrigerant (J/kg), v2/2 is the
specific kinetic energy (J/kg), gz is the specific potential
energy (J/kg), is the mass flow rate of refrigerant (kg/s),
and are the energetic exchanges of the control
volume with its surroundings in form of heat flux and work
rate (power).
(1)
International Journal of Students’ Research in Technology & Management
Vol 2 (04), June-July 2014, ISSN 2321-2543, pg 134-139
http://www.giapjournals.org/ijsrtm.html 136
The subscripts i and o stands for inlet and outlet
states, respectively.
For steady state operation, equation (1) becomes:
∑ (
)
∑ (
)
(2)
In vapor compression refrigeration system, changes in
kinetic and potential energies are negligible. So equation 2
becomes:
∑
∑
(3)
which is applied to each device of the system:
(a) for the evaporator:
(4)
where represents the refrigeration load.
(b) for the condenser:
(5)
where is the rate of heat rejected at the condenser
(c) for the compressor:
(6)
where is the rate of work input to the compressor.
(d) for the throttling valve:
(7)
The energetic efficiency of the system is measured by the
coefficient of performance:
(8)
B. Exergetic Approach
A reversible thermodynamic process can be reversed
without leaving any trace on the surroundings. This is possible
only if the net heat and net work exchange between the system
and the surrounding is zero [9]. All real processes are
irreversible. Some factors causing irreversibility in a
refrigeration cycle include friction and heat transfer across a
finite temperature difference in the evaporator, compressor,
condenser, and refrigerant lines, sub-cooling to ensure pure
liquid at capillary tube inlet, super heating to ensure pure
vapour at compressor inlet, pressure drops, and heat gains in
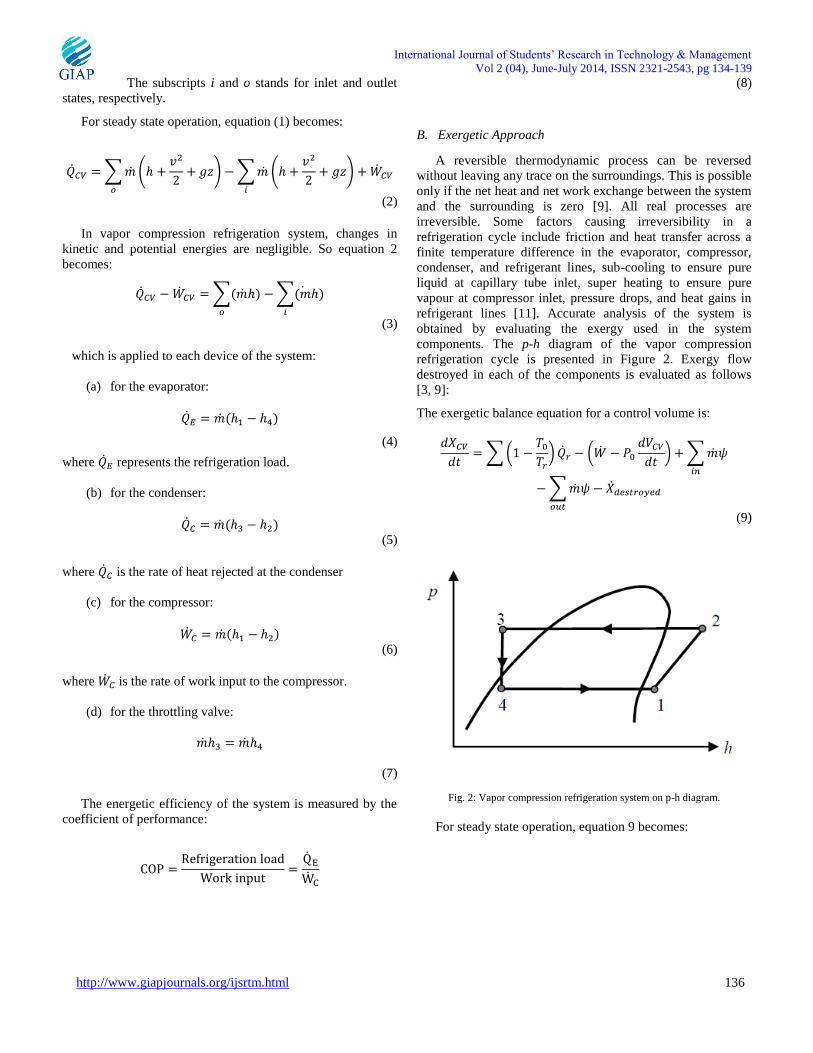
refrigerant lines [11]. Accurate analysis of the system is
obtained by evaluating the exergy used in the system
components. The p-h diagram of the vapor compression
refrigeration cycle is presented in Figure 2. Exergy flow
destroyed in each of the components is evaluated as follows
[3, 9]:
The exergetic balance equation for a control volume is:
∑(
) (
) ∑
∑
(9)
Fig. 2: Vapor compression refrigeration system on p-h diagram.
For steady state operation, equation 9 becomes:
International Journal of Students’ Research in Technology & Management
Vol 2 (04), June-July 2014, ISSN 2321-2543, pg 134-139
http://www.giapjournals.org/ijsrtm.html 137
∑(
) ∑
∑
(10)
Applying the exergetic balance equation to each
component of the vapor compression refrigeration system,
(a) for the evaporator:
(
)
(11)
(b) for the compressor:
(12)
(c) for the condenser:
(13)
(d) for the throttling valve:
(14)
The throttling process is isenthalpic process. h3 = h4.
Therefore, equation 14 can be expressed as:
(15)
The total exergy destruction rate,
The overall system exergetic efficiency ( ) is the ratio of
the exergy output ( ) to exergy input ( ) [3].
(
)
(17)
(18)
The only source of exergy input to the system is through
the electrical power supplied to the compressor ( ), that is,
= and Eq. (17) can be expressed as:
(
)
or
(
)
(19)
IV. RESULTS AND DISCUSSION
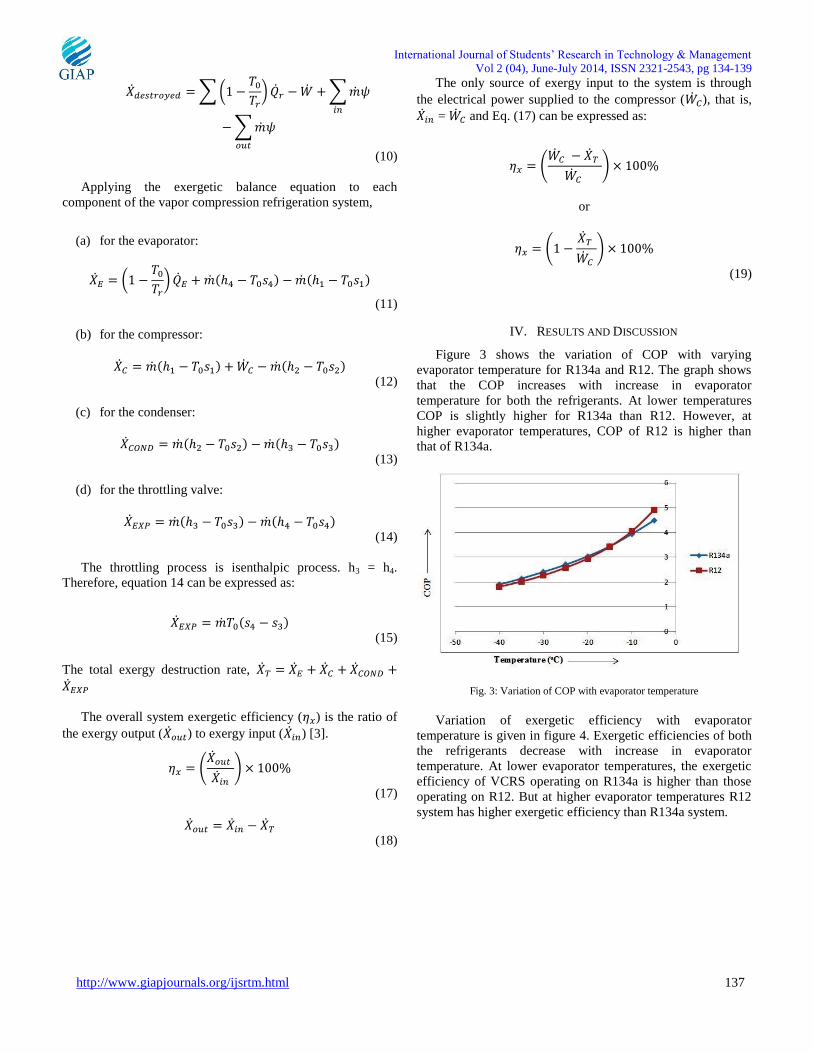
Figure 3 shows the variation of COP with varying
evaporator temperature for R134a and R12. The graph shows
that the COP increases with increase in evaporator
temperature for both the refrigerants. At lower temperatures
COP is slightly higher for R134a than R12. However, at
higher evaporator temperatures, COP of R12 is higher than
that of R134a.
Fig. 3: Variation of COP with evaporator temperature
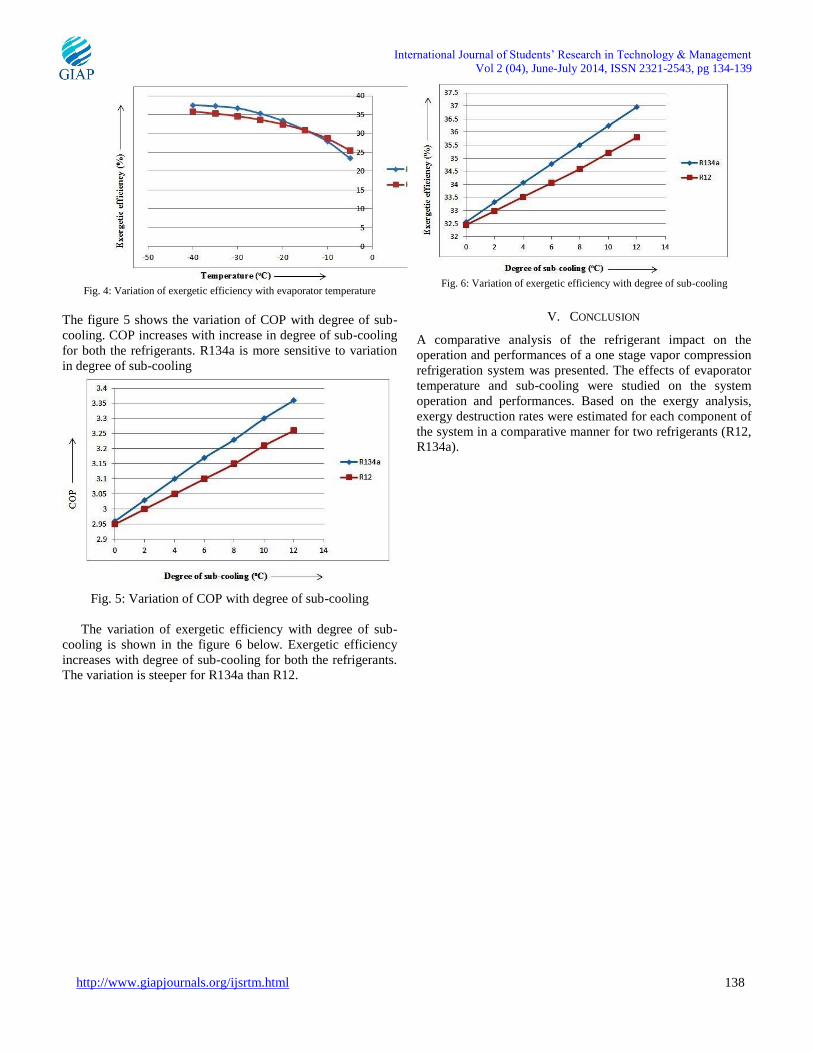
Variation of exergetic efficiency with evaporator
temperature is given in figure 4. Exergetic efficiencies of both
the refrigerants decrease with increase in evaporator
temperature. At lower evaporator temperatures, the exergetic
efficiency of VCRS operating on R134a is higher than those
operating on R12. But at higher evaporator temperatures R12
system has higher exergetic efficiency than R134a system.
International Journal of Students’ Research in Technology & Management
Vol 2 (04), June-July 2014, ISSN 2321-2543, pg 134-139
http://www.giapjournals.org/ijsrtm.html 138
Fig. 4: Variation of exergetic efficiency with evaporator temperature
The figure 5 shows the variation of COP with degree of sub-
cooling. COP increases with increase in degree of sub-cooling
for both the refrigerants. R134a is more sensitive to variation
in degree of sub-cooling
Fig. 5: Variation of COP with degree of sub-cooling
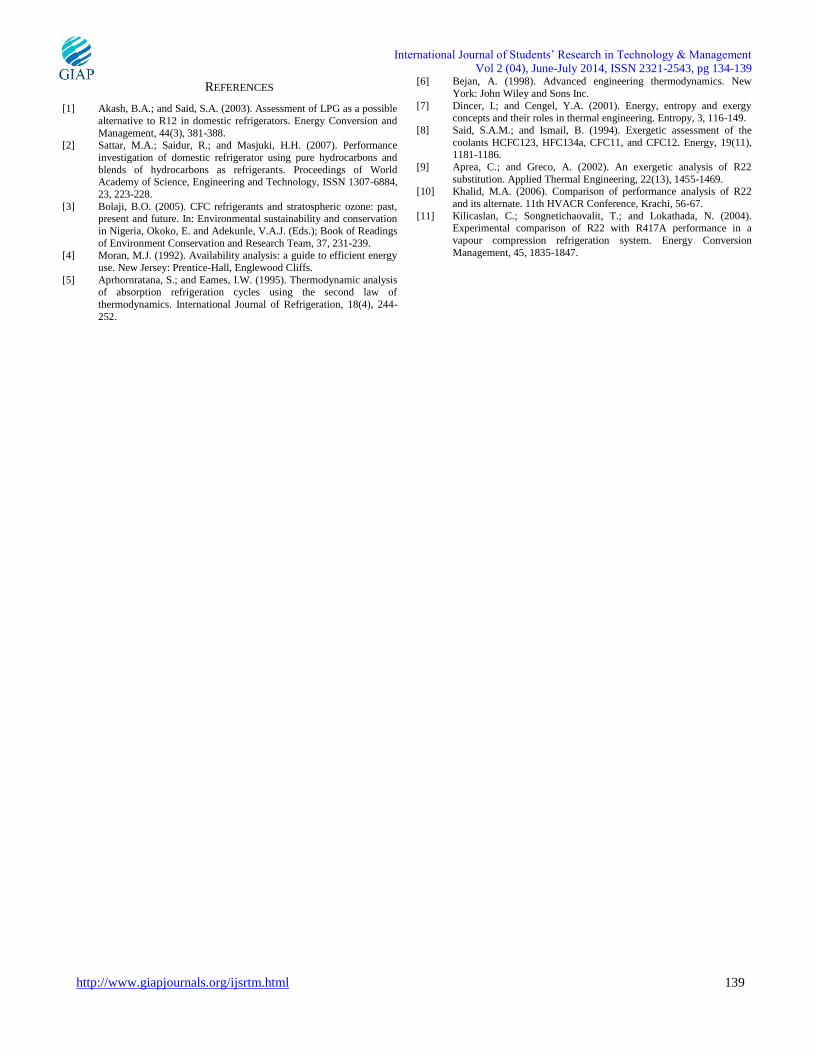
The variation of exergetic efficiency with degree of sub-
cooling is shown in the figure 6 below. Exergetic efficiency
increases with degree of sub-cooling for both the refrigerants.
The variation is steeper for R134a than R12.
Fig. 6: Variation of exergetic efficiency with degree of sub-cooling
V. CONCLUSION
A comparative analysis of the refrigerant impact on the
operation and performances of a one stage vapor compression
refrigeration system was presented. The effects of evaporator
temperature and sub-cooling were studied on the system
operation and performances. Based on the exergy analysis,
exergy destruction rates were estimated for each component of
the system in a comparative manner for two refrigerants (R12,
R134a).
International Journal of Students’ Research in Technology & Management
Vol 2 (04), June-July 2014, ISSN 2321-2543, pg 134-139
http://www.giapjournals.org/ijsrtm.html 139
REFERENCES
[1] Akash, B.A.; and Said, S.A. (2003). Assessment of LPG as a possible
alternative to R12 in domestic refrigerators. Energy Conversion and
Management, 44(3), 381-388. [2] Sattar, M.A.; Saidur, R.; and Masjuki, H.H. (2007). Performance
investigation of domestic refrigerator using pure hydrocarbons and
blends of hydrocarbons as refrigerants. Proceedings of World Academy of Science, Engineering and Technology, ISSN 1307-6884,
23, 223-228.
[3] Bolaji, B.O. (2005). CFC refrigerants and stratospheric ozone: past, present and future. In: Environmental sustainability and conservation
in Nigeria, Okoko, E. and Adekunle, V.A.J. (Eds.); Book of Readings
of Environment Conservation and Research Team, 37, 231-239. [4] Moran, M.J. (1992). Availability analysis: a guide to efficient energy
use. New Jersey: Prentice-Hall, Englewood Cliffs.
[5] Aprhornratana, S.; and Eames, I.W. (1995). Thermodynamic analysis of absorption refrigeration cycles using the second law of
thermodynamics. International Journal of Refrigeration, 18(4), 244-
252.
[6] Bejan, A. (1998). Advanced engineering thermodynamics. New
York: John Wiley and Sons Inc.
[7] Dincer, I.; and Cengel, Y.A. (2001). Energy, entropy and exergy
concepts and their roles in thermal engineering. Entropy, 3, 116-149.
[8] Said, S.A.M.; and Ismail, B. (1994). Exergetic assessment of the
coolants HCFC123, HFC134a, CFC11, and CFC12. Energy, 19(11), 1181-1186.
[9] Aprea, C.; and Greco, A. (2002). An exergetic analysis of R22
substitution. Applied Thermal Engineering, 22(13), 1455-1469. [10] Khalid, M.A. (2006). Comparison of performance analysis of R22
and its alternate. 11th HVACR Conference, Krachi, 56-67.
[11] Kilicaslan, C.; Songnetichaovalit, T.; and Lokathada, N. (2004). Experimental comparison of R22 with R417A performance in a
vapour compression refrigeration system. Energy Conversion
Management, 45, 1835-1847.
International Journal of Students’ Research in Technology & Management
Vol 2 (04), June-July 2014, ISSN 2321-2543, pg 140-144
http://www.giapjournals.org/ijsrtm.html 140
Investigation of Mechanical Properties of
Aluminium 6061 Alloy Friction Stir Welding J. Stephen Leon
1 and Dr. V. Jayakumar
2
Faculty of Mechanical and Engineering, Department of Engineering
Ibri College of Technology, Ibri, Sultanate of Oman
Abstract– Aluminium 6061 alloy is commonly used for construction
of aircraft structures, such as wings and fuselages, more commonly
in homebuilt aircraft than commercial or military aircraft.
Aluminium 6061 alloy generally present low weldability by
traditional fusion welding process. The development of Friction
Stir Welding (FSW) has provided an alternative improved way of
satisfactorily producing weld joint in aluminium 6061 alloy. In
FSW, the welding tool motion induces frictional heating and severe
plastic deformation and metal joining process is done in solid state
results, which results in defect free welds with good mechanical
properties in aluminium alloy 6061. Unlike in traditional fusion
welding, friction stir welds will not encounter problems like
porosity alloy segregation and hot cracking, and welds are
produced with good surface finish. In this paper, an attempt was
made to investigate the impact of process parameters of FSW in the
mechanical properties of the joint. The tensile properties,
microstructure, hardness of the FSW joints were investigated in the
weldment and heat affected zone. The changes of mechanical
properties are compared with the parental metal. The welding
parameters such as tool rotational speed and welding speed plays a
major role in deciding the joint characteristics. This paper focusses
on optimization of all these parameters. From this investigation it
was found that the joint made from the FSW yielded superior
tensile properties and impact strength due to the higher hardness
and fine microstructure.
Key Words– FSW, welding speed, axial force, mechanical
properties, microstructure.
I. INTRODUCTION
In recent years, demands for aluminium alloy 6061 have
steadily increased in aerospace, aircraft and automobile
applications because of their excellent strength to weight ratio,
good ductility, corrosion resistance and cracking resistance in
adverse environment. Welding of these alloys, however, still
remains a challenge. Apart from softening in the weld fusion
zone and heat affected zone, hot cracking in the weld can be a
serious problem [1]. Thus, the solid state bonding process is
highly recommended to solve these problems. FSW is an
innovative solid state welding process in which the metal to be
welded is not melted rather the two parts of weld joints are
brought into contact and the interface is strongly forged together
under the effect of heavy plastic deformation caused by the
inserted rotating stir probe pin [2].
In FSW a rotating cylindrical, shouldered tool with a
profiled probe penetrates into the material until the tool shoulder
contacts with the upper surface of the plates, which are butted
together as shown in figure 1.
Fig 1 Principle of FSW
The parts have to be clamped on to a backing bar in a
manner that prevents the abutting joint faces from being forced
apart. Frictional heat is generated between the wear resistant
welding tool and the material of the work pieces. This heat
causes the later to soften without reaching the melting point and
allows traversing of the tool along the weld line. In FSW,
tool rotation rate (rpm) in clockwise or counter clockwise
direction and tool traverse speed (mm/min) along the joint are
the most important parameters [3].
II. LITRATURE REVIEW
The effect of FSW parameters on temperature was examined
by Muhsin et al .[4]. They concluded that the maximum
International Journal of Students’ Research in Technology & Management
Vol 2 (04), June-July 2014, ISSN 2321-2543, pg 140-144
http://www.giapjournals.org/ijsrtm.html 141
temperature is a function of tool rotation rate while the
rate of heating was a function of traverse speed.
Munoz et al. [5] investigated the microstructure and
mechanical properties of friction stir welded and TIG welded
Al-Mg-Sc alloy and reported that the yield strength FSW
welded joint is decreased 20 % compared to base metal.
Apart from this, there have been lot of efforts to understand
the effect of process parameters on material flow behaviour,
microstructure formation and mechanical properties of friction
stir welded joints. Finding the most effective parameters on
properties of friction stir welds as well as realizing their
influence on the weld properties has been major topics for
researchers [6–8].
Extensive literature of friction stir welding of Al alloys does
indicate that there are few areas particularly on the relationship
between welding parameters and change in the mechanical
properties of weldment. This paper focuses on finding the
optimal speed (rpm) and feed rate (mm/s) with respect to
mechanical properties such as hardness number and tensile
strength.
III. EXPERIMENTAL PROCEDURE
AA 6061 aluminum alloy chemical composition and
mechanical properties are given in table 1 and 2 respectively.
TABLE 1
CHEMICAL COMPOSITION IN %WT
Name of
the Al
alloy
Mg Si Fe Cu Cr Mn Zn Ti Al
AA 6061 0.9 0.62 0.33 0.28 0.17 0.06 0.02 0.02 Balance
TABLE 2 MECHANICAL PROPERTIES
Name of
the
Aluminum
alloy
Yield
strength
in MPa
Ultimate
strength
in MPa
Elangation % Hardness
in HV
AA 6061 110 207 16 75
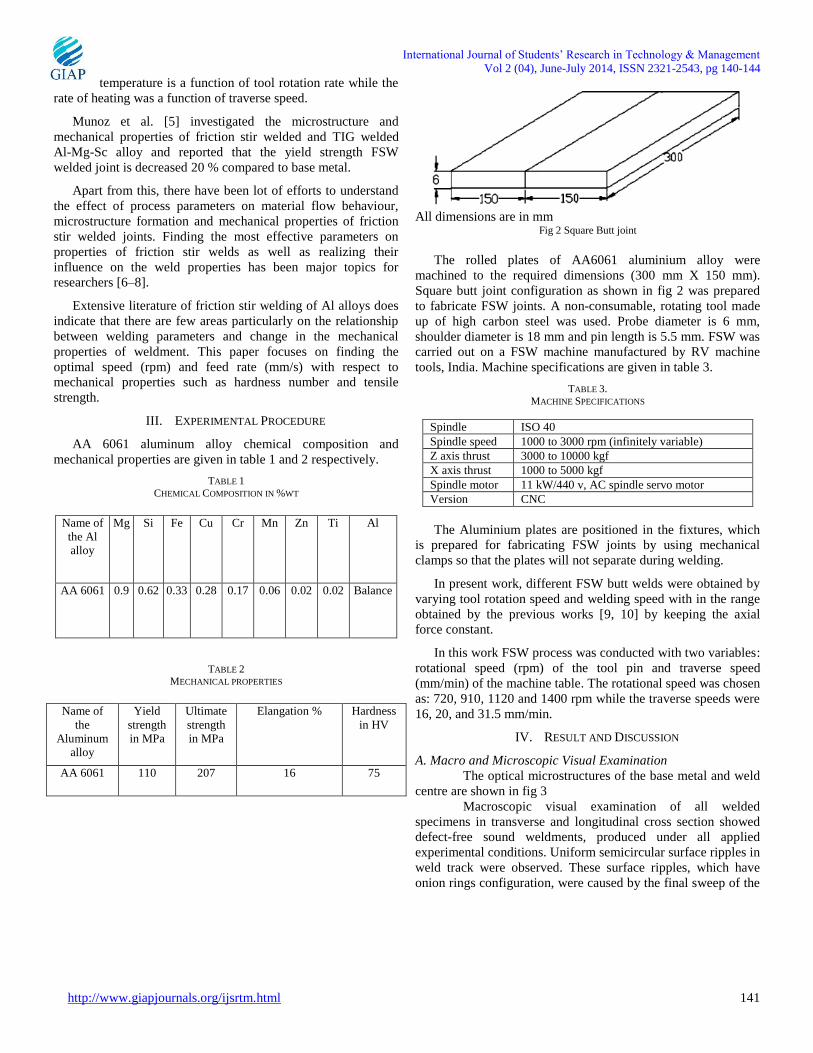
All dimensions are in mm
Fig 2 Square Butt joint
The rolled plates of AA6061 aluminium alloy were
machined to the required dimensions (300 mm X 150 mm).
Square butt joint configuration as shown in fig 2 was prepared
to fabricate FSW joints. A non-consumable, rotating tool made
up of high carbon steel was used. Probe diameter is 6 mm,
shoulder diameter is 18 mm and pin length is 5.5 mm. FSW was
carried out on a FSW machine manufactured by RV machine
tools, India. Machine specifications are given in table 3.
TABLE 3.
MACHINE SPECIFICATIONS
Spindle ISO 40
Spindle speed 1000 to 3000 rpm (infinitely variable)
Z axis thrust 3000 to 10000 kgf
X axis thrust 1000 to 5000 kgf
Spindle motor 11 kW/440 v, AC spindle servo motor
Version CNC
The Aluminium plates are positioned in the fixtures, which
is prepared for fabricating FSW joints by using mechanical
clamps so that the plates will not separate during welding.
In present work, different FSW butt welds were obtained by
varying tool rotation speed and welding speed with in the range
obtained by the previous works [9, 10] by keeping the axial
force constant.
In this work FSW process was conducted with two variables:
rotational speed (rpm) of the tool pin and traverse speed
(mm/min) of the machine table. The rotational speed was chosen
as: 720, 910, 1120 and 1400 rpm while the traverse speeds were
16, 20, and 31.5 mm/min.
IV. RESULT AND DISCUSSION
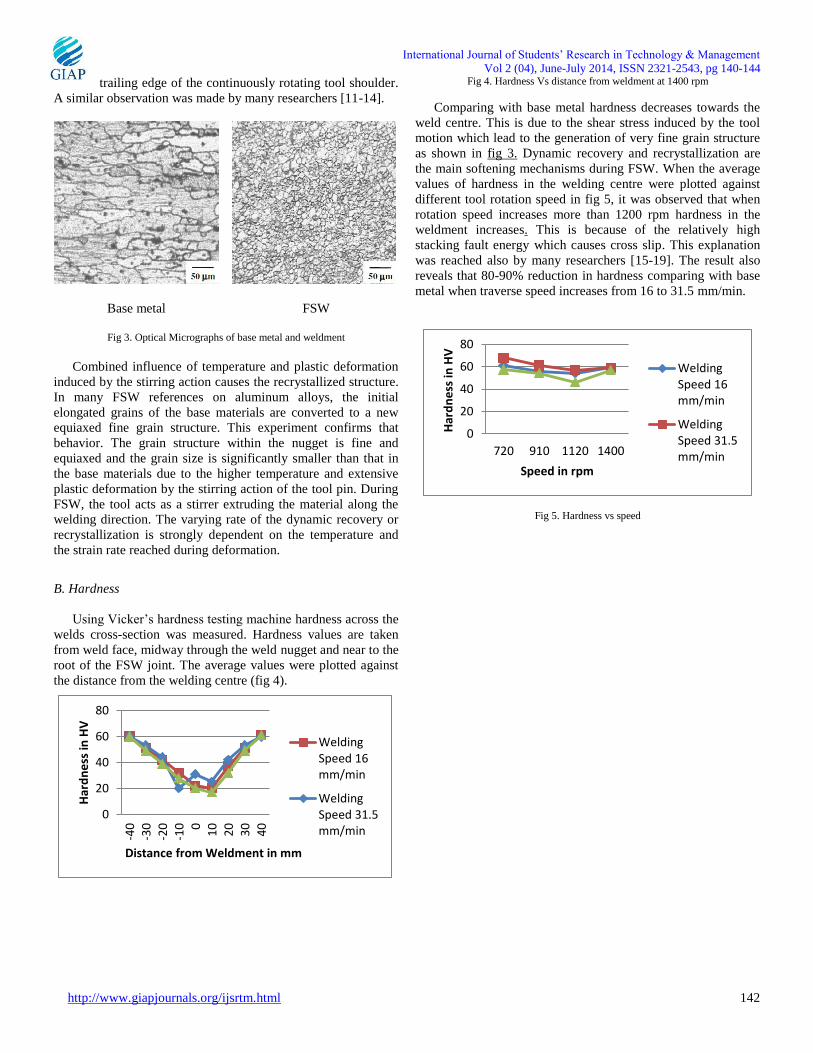
A. Macro and Microscopic Visual Examination
The optical microstructures of the base metal and weld
centre are shown in fig 3
Macroscopic visual examination of all welded
specimens in transverse and longitudinal cross section showed
defect-free sound weldments, produced under all applied
experimental conditions. Uniform semicircular surface ripples in
weld track were observed. These surface ripples, which have
onion rings configuration, were caused by the final sweep of the
International Journal of Students’ Research in Technology & Management
Vol 2 (04), June-July 2014, ISSN 2321-2543, pg 140-144
http://www.giapjournals.org/ijsrtm.html 142
trailing edge of the continuously rotating tool shoulder.
A similar observation was made by many researchers [11-14].
Base metal FSW
Fig 3. Optical Micrographs of base metal and weldment
Combined influence of temperature and plastic deformation
induced by the stirring action causes the recrystallized structure.
In many FSW references on aluminum alloys, the initial
elongated grains of the base materials are converted to a new
equiaxed fine grain structure. This experiment confirms that
behavior. The grain structure within the nugget is fine and
equiaxed and the grain size is significantly smaller than that in
the base materials due to the higher temperature and extensive
plastic deformation by the stirring action of the tool pin. During
FSW, the tool acts as a stirrer extruding the material along the
welding direction. The varying rate of the dynamic recovery or
recrystallization is strongly dependent on the temperature and
the strain rate reached during deformation.
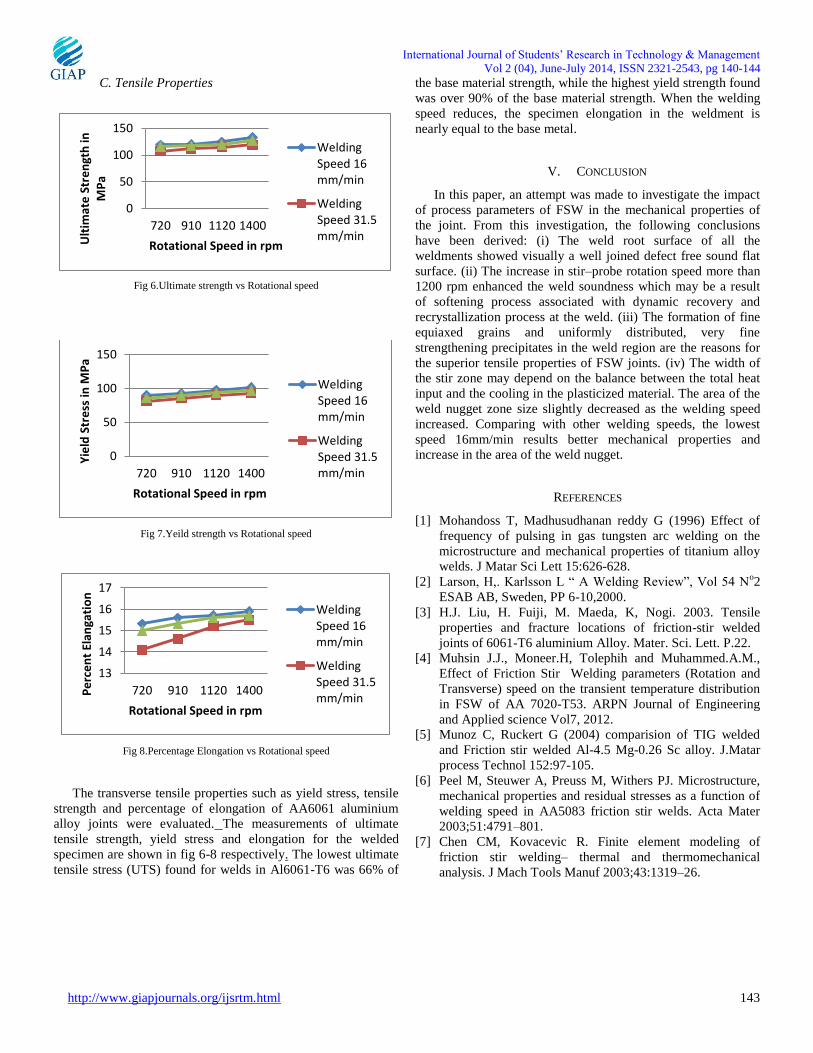
B. Hardness
Using Vicker’s hardness testing machine hardness across the
welds cross-section was measured. Hardness values are taken
from weld face, midway through the weld nugget and near to the
root of the FSW joint. The average values were plotted against
the distance from the welding centre (fig 4).
Fig 4. Hardness Vs distance from weldment at 1400 rpm
Comparing with base metal hardness decreases towards the
weld centre. This is due to the shear stress induced by the tool
motion which lead to the generation of very fine grain structure
as shown in fig 3. Dynamic recovery and recrystallization are
the main softening mechanisms during FSW. When the average
values of hardness in the welding centre were plotted against
different tool rotation speed in fig 5, it was observed that when
rotation speed increases more than 1200 rpm hardness in the
weldment increases. This is because of the relatively high
stacking fault energy which causes cross slip. This explanation
was reached also by many researchers [15-19]. The result also
reveals that 80-90% reduction in hardness comparing with base
metal when traverse speed increases from 16 to 31.5 mm/min.
Fig 5. Hardness vs speed
0
20
40
60
80
-40
-30
-20
-10 0
10
20
30
40
Har
dn
ess
in H
V
Distance from Weldment in mm
WeldingSpeed 16mm/min
WeldingSpeed 31.5mm/min
0
20
40
60
80
720 910 1120 1400H
ard
ne
ss in
HV
Speed in rpm
WeldingSpeed 16mm/min
WeldingSpeed 31.5mm/min
International Journal of Students’ Research in Technology & Management
Vol 2 (04), June-July 2014, ISSN 2321-2543, pg 140-144
http://www.giapjournals.org/ijsrtm.html 143
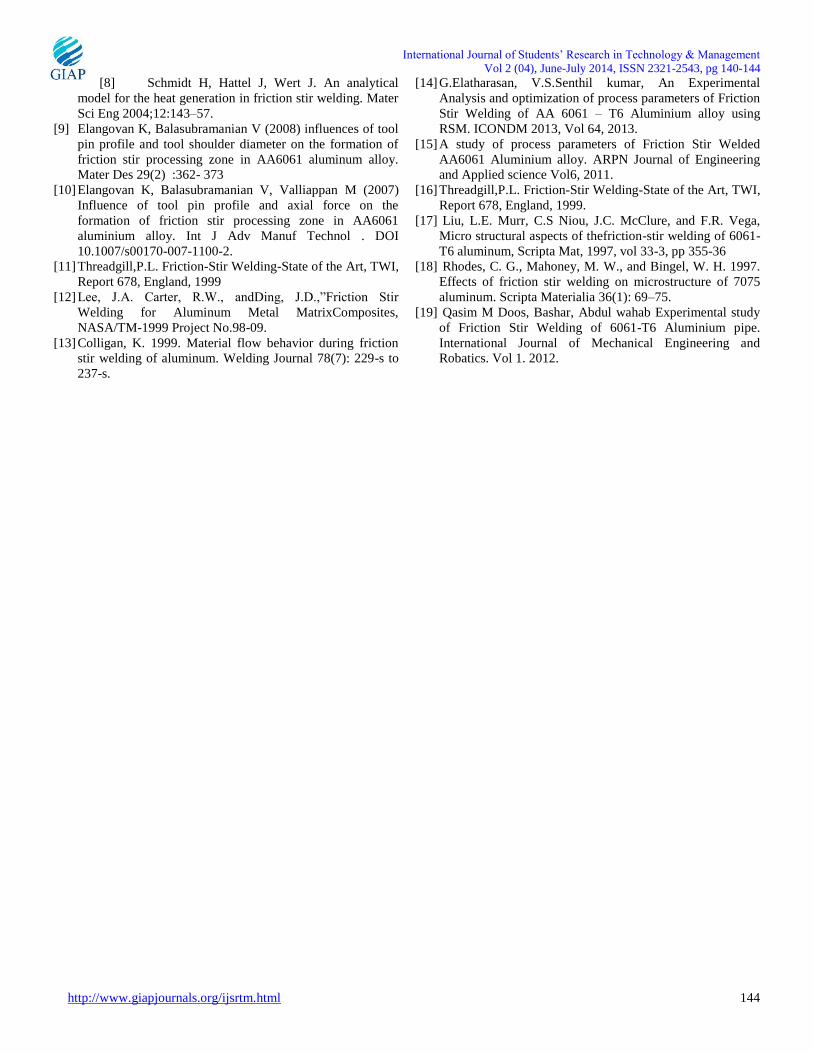
C. Tensile Properties
Fig 6.Ultimate strength vs Rotational speed
Fig 7.Yeild strength vs Rotational speed
Fig 8.Percentage Elongation vs Rotational speed
The transverse tensile properties such as yield stress, tensile
strength and percentage of elongation of AA6061 aluminium
alloy joints were evaluated. The measurements of ultimate
tensile strength, yield stress and elongation for the welded
specimen are shown in fig 6-8 respectively. The lowest ultimate
tensile stress (UTS) found for welds in Al6061-T6 was 66% of
the base material strength, while the highest yield strength found
was over 90% of the base material strength. When the welding
speed reduces, the specimen elongation in the weldment is
nearly equal to the base metal.
V. CONCLUSION
In this paper, an attempt was made to investigate the impact
of process parameters of FSW in the mechanical properties of
the joint. From this investigation, the following conclusions
have been derived: (i) The weld root surface of all the
weldments showed visually a well joined defect free sound flat
surface. (ii) The increase in stir–probe rotation speed more than
1200 rpm enhanced the weld soundness which may be a result
of softening process associated with dynamic recovery and
recrystallization process at the weld. (iii) The formation of fine
equiaxed grains and uniformly distributed, very fine
strengthening precipitates in the weld region are the reasons for
the superior tensile properties of FSW joints. (iv) The width of
the stir zone may depend on the balance between the total heat
input and the cooling in the plasticized material. The area of the
weld nugget zone size slightly decreased as the welding speed
increased. Comparing with other welding speeds, the lowest
speed 16mm/min results better mechanical properties and
increase in the area of the weld nugget.
REFERENCES
[1] Mohandoss T, Madhusudhanan reddy G (1996) Effect of
frequency of pulsing in gas tungsten arc welding on the
microstructure and mechanical properties of titanium alloy
welds. J Matar Sci Lett 15:626-628.
[2] Larson, H,. Karlsson L “ A Welding Review”, Vol 54 No2
ESAB AB, Sweden, PP 6-10,2000.
[3] H.J. Liu, H. Fuiji, M. Maeda, K, Nogi. 2003. Tensile
properties and fracture locations of friction-stir welded
joints of 6061-T6 aluminium Alloy. Mater. Sci. Lett. P.22.
[4] Muhsin J.J., Moneer.H, Tolephih and Muhammed.A.M.,
Effect of Friction Stir Welding parameters (Rotation and
Transverse) speed on the transient temperature distribution
in FSW of AA 7020-T53. ARPN Journal of Engineering
and Applied science Vol7, 2012.
[5] Munoz C, Ruckert G (2004) comparision of TIG welded
and Friction stir welded Al-4.5 Mg-0.26 Sc alloy. J.Matar
process Technol 152:97-105.
[6] Peel M, Steuwer A, Preuss M, Withers PJ. Microstructure,
mechanical properties and residual stresses as a function of
welding speed in AA5083 friction stir welds. Acta Mater
2003;51:4791–801.
[7] Chen CM, Kovacevic R. Finite element modeling of
friction stir welding– thermal and thermomechanical
analysis. J Mach Tools Manuf 2003;43:1319–26.
0
50
100
150
720 910 1120 1400
Ult
imat
e S
tre
ngt
h in
M
Pa
Rotational Speed in rpm
WeldingSpeed 16mm/min
WeldingSpeed 31.5mm/min
0
50
100
150
720 910 1120 1400
Yie
ld S
tre
ss in
MP
a
Rotational Speed in rpm
WeldingSpeed 16mm/min
WeldingSpeed 31.5mm/min
13
14
15
16
17
720 910 1120 1400Pe
rce
nt
Elan
gati
on
Rotational Speed in rpm
WeldingSpeed 16mm/min
WeldingSpeed 31.5mm/min
International Journal of Students’ Research in Technology & Management
Vol 2 (04), June-July 2014, ISSN 2321-2543, pg 140-144
http://www.giapjournals.org/ijsrtm.html 144
[8] Schmidt H, Hattel J, Wert J. An analytical
model for the heat generation in friction stir welding. Mater
Sci Eng 2004;12:143–57.
[9] Elangovan K, Balasubramanian V (2008) influences of tool
pin profile and tool shoulder diameter on the formation of
friction stir processing zone in AA6061 aluminum alloy.
Mater Des 29(2) :362- 373
[10] Elangovan K, Balasubramanian V, Valliappan M (2007)
Influence of tool pin profile and axial force on the
formation of friction stir processing zone in AA6061
aluminium alloy. Int J Adv Manuf Technol . DOI
10.1007/s00170-007-1100-2.
[11] Threadgill,P.L. Friction-Stir Welding-State of the Art, TWI,
Report 678, England, 1999
[12] Lee, J.A. Carter, R.W., andDing, J.D.,”Friction Stir
Welding for Aluminum Metal MatrixComposites,
NASA/TM-1999 Project No.98-09.
[13] Colligan, K. 1999. Material flow behavior during friction
stir welding of aluminum. Welding Journal 78(7): 229-s to
237-s.
[14] G.Elatharasan, V.S.Senthil kumar, An Experimental
Analysis and optimization of process parameters of Friction
Stir Welding of AA 6061 – T6 Aluminium alloy using
RSM. ICONDM 2013, Vol 64, 2013.
[15] A study of process parameters of Friction Stir Welded
AA6061 Aluminium alloy. ARPN Journal of Engineering
and Applied science Vol6, 2011.
[16] Threadgill,P.L. Friction-Stir Welding-State of the Art, TWI,
Report 678, England, 1999.
[17] Liu, L.E. Murr, C.S Niou, J.C. McClure, and F.R. Vega,
Micro structural aspects of thefriction-stir welding of 6061-
T6 aluminum, Scripta Mat, 1997, vol 33-3, pp 355-36
[18] Rhodes, C. G., Mahoney, M. W., and Bingel, W. H. 1997.
Effects of friction stir welding on microstructure of 7075
aluminum. Scripta Materialia 36(1): 69–75.
[19] Qasim M Doos, Bashar, Abdul wahab Experimental study
of Friction Stir Welding of 6061-T6 Aluminium pipe.
International Journal of Mechanical Engineering and
Robatics. Vol 1. 2012.
International Journal of Students’ Research in Technology & Management
Vol 2 (04), June-July 2014, ISSN 2321-2543, pg 145-148
145
Microwave Assisted Trans-esterification of Waste
Cooking Oil in Presence of Alkali Catalyst Hasna Khalfan AlSuleimani
#1, Priy Brat Dwivedi
#2
Student#1
, Project Guide#2
Mechanical & Industrial Department,
Caledonian College of Engineering, Oman
Abstract— Depletion of world petroleum resources and air
pollution has led to a search for alternative sources for fossil fuel,
including diesel. Because of the similarity with petro-diesel,
biodiesel fuel (fatty acid methyl ester) from vegetable oils, animal
fats and recycled cooking oil is considered as the best candidate for
diesel fuel substitute in diesel engines. Biodiesel helps in extending
engine life, improving fuel economy, decreasing air pollution and
reducing reliance on foreign and fossil fuel. In this paper the effect
of microwave radiation on trans-esterification of waste cooking oil
(from restaurants and from industrial food processors) in presence
of alkali catalyst in batch process was studied. For optimal yield
ratio of oil to methanol was 1:6, 0.4 w% KOH for 200 seconds in
domestic microwave oven. Later on results were compared with
conventional heating process of trans-esterification. From this work
it is concluded that biodiesel can be produced from waste cooking
oil using microwave radiation with significant reduction in
production time.
Keywords— WCO, Trans-esterification, microwave, biodiesel,
alkali catalyst
I. INTRODUCTION
Biodiesel (biological oil) is one of the alternative fuels that
are produced from renewable sources. It is also called as mono
alkyl ester of long chain fatty acid and it can be derived from
various biological sources such as vegetable oil and animal fats.
It can be made from a diverse mix of feed stocks including
Waste cooking oil. Hundred years ago, Rudolf Diesel tested
vegetable oil as fuel for his engine. In 1930s and 1940s
vegetable oils (VOs) were used as diesel fuels, but only in
emergency situations [1]. Alternative fuels for diesel engines
are becoming increasingly important due to diminishing
petroleum reserves and the environmental consequences of
exhaust gases from petroleum fuelled engines [2]. Although the
calorific value of VOs is as good as diesel fuel but the low
volatility and high viscosity of VOs prohibits its direct
application as fuel for diesel engines. However, this technical
problem of higher viscosity of VOs has been overcome by
trans-esterification [3]. Trans-esterification is the process of
reacting triglyceride (vegetable oils) with alcohol in presence of
catalyst. During the transesterification process, triglycerides are
first converted to diglycerides, which in turn are converted to
monoglycerides, and then to glycerol. Each step produces a
molecule of an ester of a fatty acid [4].
Waste cooking oil is taken as feed stock for production of
Biodiesel; it offers a triple fact solution: economic,
environmental and waste management. The term “waste
vegetable oil” (WVO) refers to vegetable oil which has been
used in food production and which is no longer viable for its
intended use. It is can be collect from variety of sources, e.g.,
food industry, restaurants or houses. Production of biodiesel
from Waste cooking oil to partially substitute petroleum diesel
is an alternative way for environment protection and energy
security.
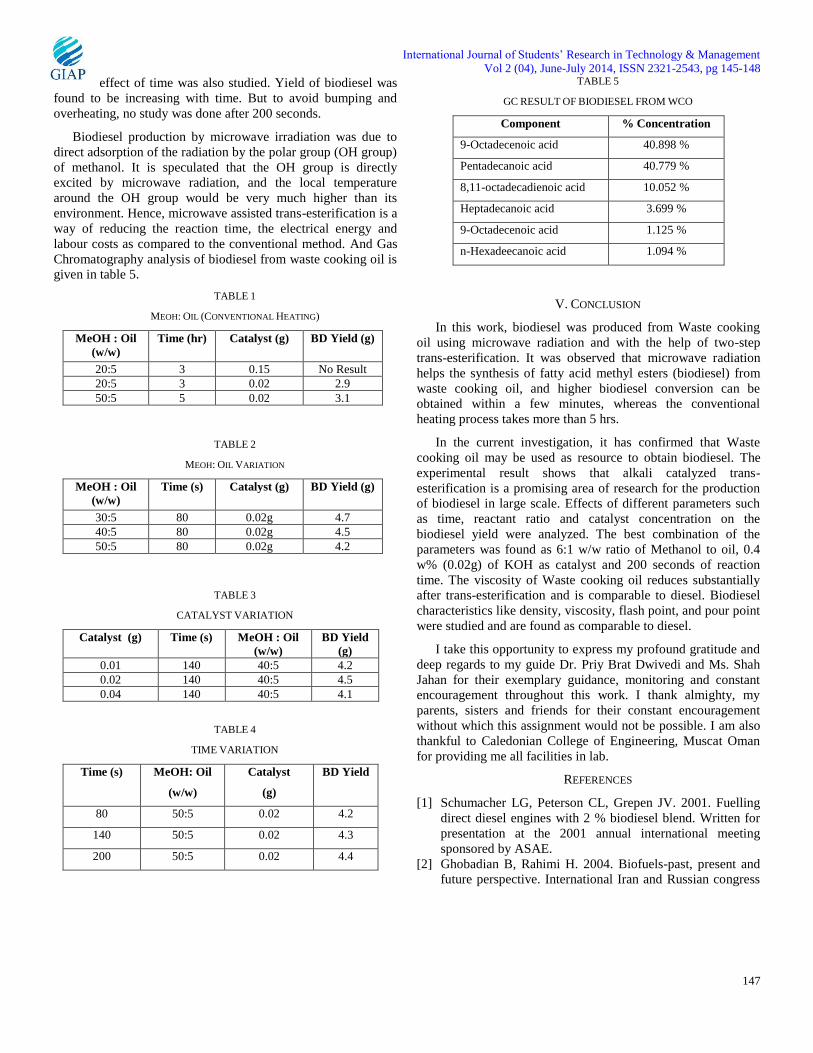
Trans-esterification is a process in which the glycerin is
separated from WVO. It refers to catalyzed chemical reaction
involving vegetable oil and an alcohol to yield fatty acid alkyl
esters (i.e. Biodiesel) and glycerol.
Fig 1.1: A schematic representation of the Trans-
esterification of triglycerides (vegetable oil) with methanol
to produce fatty acid methyl esters (Biodiesel) (R=CH3).
This process can convert oil to biodiesel up to 80 to 94% in
30 min to 2 hr [5]. The yields were dictated by molar ratio of
the oil to alcohol, reaction time, temperature, catalyst type,
International Journal of Students’ Research in Technology & Management
Vol 2 (04), June-July 2014, ISSN 2321-2543, pg 145-148
146
catalyst concentration, triglyceride properties, and
mixing intensity.
An alternative to conventional heating trans-esterification is
the microwave-assisted trans-esterification. This means that
microwave radiation for biodiesel synthesis is more efficient in
reducing the time required for the reaction and separation of the
products and offers a better way to synthesize biodiesel when
compared to conventional mode of heating as well as improve
product yields under atmospheric conditions [6] [7]. It is due to
the fact that microwave radiation activates the smallest degree
of variance of polar molecules and ions such as alcohol with the
continuously changing magnetic field.
The use of vegetable oils as alternative fuels has been
around for one hundred years when the inventor of the diesel
engine Rudolph Diesel first tested peanut oil, in his
compression-ignition engine. In 1970, scientists discovered that
the viscosity of vegetable oils could be reduced by a simple
chemical process and that it could perform as diesel fuel in
modern engine. Considerable efforts have been made to develop
vegetable oil derivatives that approximate the properties and
performance of the hydrocarbon-based diesel fuels. Bio-diesel
production is a very modern and technological area for
researchers due to the relevance that it is winning every day
because of the increase in the petroleum price and the
environmental advantages. Trans-esterification is the most
common method and leads to mono-alkyl esters of vegetable
oils and fats, now called bio-diesel when used for fuel purposes
[8].
The diesel fuel has a closer properties, biodiesel fuel (fatty
acid methyl ester) from vegetable oil is considered as the best
candidate for diesel fuel substitute in diesel engines. Biodiesel is
the fastest growing alternative fuel in the country. Biodiesel’s
has ability to extend engine life, improve fuel economy,
decrease air pollution and reduce reliance on foreign fuel. The
use of waste cooking oil to produce biodiesel reduced the raw
material cost [9].
II. MATERIALS
Waste Cooking Oil was collected from the local restaurant
in Muscat, Oman. This oil was filtered and used for the
production of biodiesel. In this work, Potassium hydroxide was
used as alkali catalyst. In comparison with other alcohols,
methanol is cheaper and has better physical and chemical
properties (polar and shortest chain alcohol), and it was used as
a reactant. Potassium hydroxide, methanol and sulphuric acid
were purchased from Schalau Chemie S.A, Spain. Other
required chemicals purchased from local market were of
analytical reagent great. In this study domestic oven was used of
LG company make. Total work was done at fixed power of 160
wt.
III. BIODIESEL PRODUCTION
Waste cooking oil was used in this study. Waste Cooking
Oil contains an initial acid value of 2.3 mg which is >1 mg
KOH per gram of oil. Therefore, biodiesel production was
performed in two-step reaction mechanisms:
Acid-Catalyzed Esterification.
Base-Catalyzed Trans-esterification.
A. Acid Catalyzed esterification
The Waste Cooking Oil used in this study had an initial acid
value of 2.3 mg KOH/g corresponding to a free fatty acid (FFA)
level of 3.1%, which is above the 1% limit for a satisfactory
trans-esterification reaction using an alkaline catalyst [10]. In
this pretreatment, methanol-to-oil ratio was taken as 4:1 w/w
and 0.4 w% of H2SO4 was used. This mixture was heated in LG
make domestic microwave oven with occasional shaking for 60
seconds. Power level was set at 160 W. This pretreatment was
done with every set before mixture was set for trans-
esterification.
B. Base-Catalyzed Trans-esterification
The method applied for the production of biodiesel from
WCO in this study is base-catalyzed trans-esterification in a
laboratory-scale setup. The reaction was performed using
methanol as alcohol and KOH as catalyst. The trans-
esterification process was studied at three KOH catalyst
loadings (0.01, 0.02 and 0.04 g), three oil to methanol w/w
ratios (1:6, 1:8, and 1:10) and three time variations. Results are
listed in table. After the reaction, the excess methanol was
removed by vacuum distillation and then the trans-esterification
products were poured into a separating funnel for phase
separation. After phase separation, the top layer (biodiesel), was
separated and washed with distilled water in order to remove the
impurities. Then the biodiesel was heated above 1000C, to
remove the moisture.
IV. RESULT AND DISCUSSION
Conventional heating set was also studied for methanol,
catalyst and time variation and results are given in table 1.
Maximum yield of biodiesel yield was 3.1g with 50g methanol
in 5 hrs refluxing set. In table 2, 3 and 4 results of methanol,
time and catalyst variation are summarized. It is clear that
microwave radiation is one of the best tools for trans-
esterification of waste cooking oil. Optimum yield was found
when methanol to oil ratio was 6:1. As clear from table 2,
biodiesel yield was decreasing with increasing the amount of
methanol. More study is required in this area to find the reasons
behind this observation.
In case of alkali catalyst variation biodiesel yield increased
with increase in alkali catalyst concentration. But due to soap
formation and difficulty in product separation, yield decreased
as catalyst amount increased to 0.4 w%. During this study,
International Journal of Students’ Research in Technology & Management
Vol 2 (04), June-July 2014, ISSN 2321-2543, pg 145-148
147
effect of time was also studied. Yield of biodiesel was
found to be increasing with time. But to avoid bumping and
overheating, no study was done after 200 seconds.
Biodiesel production by microwave irradiation was due to
direct adsorption of the radiation by the polar group (OH group)
of methanol. It is speculated that the OH group is directly
excited by microwave radiation, and the local temperature
around the OH group would be very much higher than its
environment. Hence, microwave assisted trans-esterification is a
way of reducing the reaction time, the electrical energy and
labour costs as compared to the conventional method. And Gas
Chromatography analysis of biodiesel from waste cooking oil is
given in table 5.
TABLE 1
MEOH: OIL (CONVENTIONAL HEATING)
MeOH : Oil
(w/w)
Time (hr) Catalyst (g) BD Yield (g)
20:5 3 0.15 No Result
20:5 3 0.02 2.9
50:5 5 0.02 3.1
TABLE 2
MEOH: OIL VARIATION
MeOH : Oil
(w/w)
Time (s) Catalyst (g) BD Yield (g)
30:5 80 0.02g 4.7
40:5 80 0.02g 4.5
50:5 80 0.02g 4.2
TABLE 3
CATALYST VARIATION
Catalyst (g) Time (s) MeOH : Oil
(w/w)
BD Yield
(g)
0.01 140 40:5 4.2
0.02 140 40:5 4.5
0.04 140 40:5 4.1
TABLE 4
TIME VARIATION
Time (s) MeOH: Oil
(w/w)
Catalyst
(g)
BD Yield
80 50:5 0.02 4.2
140 50:5 0.02 4.3
200 50:5 0.02 4.4
TABLE 5
GC RESULT OF BIODIESEL FROM WCO
Component % Concentration
9-Octadecenoic acid 40.898 %
Pentadecanoic acid 40.779 %
8,11-octadecadienoic acid 10.052 %
Heptadecanoic acid 3.699 %
9-Octadecenoic acid 1.125 %
n-Hexadeecanoic acid 1.094 %
V. CONCLUSION
In this work, biodiesel was produced from Waste cooking
oil using microwave radiation and with the help of two-step
trans-esterification. It was observed that microwave radiation
helps the synthesis of fatty acid methyl esters (biodiesel) from
waste cooking oil, and higher biodiesel conversion can be
obtained within a few minutes, whereas the conventional
heating process takes more than 5 hrs.
In the current investigation, it has confirmed that Waste
cooking oil may be used as resource to obtain biodiesel. The
experimental result shows that alkali catalyzed trans-
esterification is a promising area of research for the production
of biodiesel in large scale. Effects of different parameters such
as time, reactant ratio and catalyst concentration on the
biodiesel yield were analyzed. The best combination of the
parameters was found as 6:1 w/w ratio of Methanol to oil, 0.4
w% (0.02g) of KOH as catalyst and 200 seconds of reaction
time. The viscosity of Waste cooking oil reduces substantially
after trans-esterification and is comparable to diesel. Biodiesel
characteristics like density, viscosity, flash point, and pour point
were studied and are found as comparable to diesel.
I take this opportunity to express my profound gratitude and
deep regards to my guide Dr. Priy Brat Dwivedi and Ms. Shah
Jahan for their exemplary guidance, monitoring and constant
encouragement throughout this work. I thank almighty, my
parents, sisters and friends for their constant encouragement
without which this assignment would not be possible. I am also
thankful to Caledonian College of Engineering, Muscat Oman
for providing me all facilities in lab.
REFERENCES
[1] Schumacher LG, Peterson CL, Grepen JV. 2001. Fuelling
direct diesel engines with 2 % biodiesel blend. Written for
presentation at the 2001 annual international meeting
sponsored by ASAE.
[2] Ghobadian B, Rahimi H. 2004. Biofuels-past, present and
future perspective. International Iran and Russian congress
International Journal of Students’ Research in Technology & Management
Vol 2 (04), June-July 2014, ISSN 2321-2543, pg 145-148
148
of agricultural and natural science.Shahre cord
university. Shahrekord. Iran.
[3] Ma F, Hanna MA. 1999. Biodiesel production: a review.
Bioresource technology, 70: 1-15.
[4] Freedman B, Butterfield RO, Pryde
EH.1986.Transesterification kinetics of soybeen oil.
JAOCS 63, 1375–1380.
[5] Encinar J, Gonzalez J, Rodriguez J, Tejedor A. 2002.
Biodiesel Fuels from Vegetable Oils: Transesterification of
Cynara c ardunculus L.
[6] Dasgupta A, Banerjee P, Malik S. 1992. Use of microwave
irradiation for rapid transesterification of lipids and
accelerated synthesis of fatty acyl pyrrolidides for analysis
by gas chromatography-mass spectrometry: study of fatty
acid profiles of olive oil, evening primrose oil, fish oils and
phospholipids from mango pulp. Chemistry and physics of
lipids, 62: 281-291.
[7] Lertsathapornsuk V, Pairintra R, Krisnangkura K,
Chindaruksa S. (Eds.) 2003. Proceeding of the 1st
International Conference on Sustainable Energy and Green
Architecture, Bangkok, SE091.
[8] Balat, M. and Balat, H. 2008. A critical review of bio-diesel
as a vehicular fuel. Energy conversion and management, 49
(10), pp. 2727--2741.
[9] Mistry, M. and Khambete, A. Extraction of Biodiesel from
waste vegetable oil.
[10] Freedman B, Butterfield RO, Pryde EH. Transesterification
kinetics of soybean oil 1. J Am Oil Chem Soc (JAOCS)
1986;63(10):1375–80.
International Journal of Students’ Research in Technology & Management
Vol 2 (04), June-July 2014, ISSN 2321-2543, pg 149-152
http://www.giapjournals.org/ijsrtm.html 149
Prediction of Excess Air Requirement Using
ANN for the Improvement of Boiler Efficiency Arun. S. Gopinath
#1, N. Sreenivasa Babu
*2
Engineering Department, Shinas College of Technology
Sultanate of Oman
Abstract—An improvement in the efficiency on converting fuel
energy to useful thermal energy could result in significant fuel
saving for industrial Sector. In this paper artificial intelligence
concept using Artificial Neural Network (ANN) is used to predict
the optimized excess air requirement using real time and calculated
data. This work determines the excess air requirement for complete
combustion corresponding to theoretical CO2 in flue gases and real-
time values obtained from remote measurements of CO2 (actual) in
flue gases.
Keywords— ANN, Flue gas Analysis, Excess Air Control, Boiler
Efficiency, Losses
I. INTRODUCTION
The operating efficiency of industrial boilers is one of the
critical concerns in National Energy Consumption.The
improvement in boiler efficiency will increase the steam input to
the turbine and hence the alternator output power as well.
Improvement in boiler efficiency can be done by optimizing the
combustion with excess air control. Moreover Optimized
combustion directly minimizes the emission of hazardous
pollutants into the atmosphere like CO, Oxides of Sulphur and
Nitrogen etc. which will minimize air pollution.
II. FUELS, COMBUSTION & FORMULATION
Coal is one among the prominent fuel using in the power
generation industry. For the Complete combustion of Coal as
fuel, air is required. Normally Oxygen (O2) is required for the
combustion. It is obtained from the air which is supplied to the
furnace. The amount of air required to supply sufficient Oxygen
for the complete combustion of fuel is the Theoretical air.
Excess Air is the amount of air required in addition to the
stoichiometric air to make sureof complete oxidation during
burning of fuel.
Among the types of fuels ,Natural gas requires less and coal
requires the maximum amount of excess air for the complete
combustion[1].A typical 210 MW natural circulation , dry
Bottom , tangentially fired , balanced draft and radiant Reheat
type with direct fired pulverized coal system boiler is
considered for this analysis. Data from the Proximate and
Ultimate analysis of Coal used in the boiler is as shown in
Table1&2. In situ Measurements from 210MW Boiler is shown
in Table 3 & 4.
TABLE I
SAMPLE OF PROXIMITY ANALYSIS RESULT OF COAL
Content Percentage
1 Ash 38
2 Volatile Matter 20
3 Moisture 7.1
4 Fixed Carbon 34.6
GCV of Coal : 4210 K Cal/kg
TABLE-2 SAMPLE OF ULTIMATE ANALYSIS OF COAL FROM PROXIMITY ANALYSIS
Sl. No Content Percentage
1 Carbon 45.957
2 Hydrogen 2.835
3 Nitrogen 0.935
4 Sulphur 0.3
5 Oxygen 4.873
TABLE-3
PERFORMANCE DATA FROM 210MW BOILER
Sl.
No
Parameter Unit Test
value

International Journal of Students’ Research in Technology & Management
Vol 2 (04), June-July 2014, ISSN 2321-2543, pg 149-152
http://www.giapjournals.org/ijsrtm.html 150
1 Load MW 210
2 PA In Temp.to APH A 0 C 42
3 PA In Temp.to APH B 0 C 42
4 SEC. AIR TEMP.TO APH A 0 C 42
5 SEC. AIR TEMP.TO APH B 0 C 42
6 Flue Gas TEMP APH A INLET 0 C 147.7
7 Flue Gas TEMP APH B INLET 0 C 159.0
8 Flue Gas TEMP. APH A OUTLET 0 C 333
9 Flue Gas TEMP. APH B OUTLET 0 C 331
10 SEC.AIR TEMP. APH A OUTLET 0 C 262.5
11 SEC.AIR TEMP.APH B OUTLET 0 C 280
12 PA OUTLET TEMP.APH A 0 C 292
13 PA OUTLET TEMP.APH B 0 C 282
14 TOTAL SEC. AIR FLOW T/Hr. 405
15 TOTAL PA FLOW T/Hr. 340
16 TOTAL AIR FLOW T/Hr. 705
TABLE IV
IN SITE MEASUREMENTS
Sl. No Parameters Quantity in %
1 O2 INLET 3.585
2 O2 OUTLET 5.115
3 CO2 INLET 15.715
4 CO2 OUTLET 14.185
5 CO OUTLET 0.005
An Indirect Method is followed in this analysis for evaluating
boiler efficiency. In Indirect method the following losses are
considered [2];
Percentage heat loss due to dry flue gas, L1
Percentage heat loss due to evaporation of water
formed, L2
Percentage heat loss due to moisture present in fuel,L3
Percentage heat loss due to moisture present in air, L4
Percentage heat loss due to Partial Conversion of C to
CO , L5
Percentage heat loss due to Radiation & Convection,
L6
Percentage heat loss due to Un burnt carbon in Fly ash,
L7
Percentage heat loss due to Unburnt carbon in Bottom
Ash, L8
Boiler Efficiency =
[100 – (L1+ L2+ L3+ L4+ L5+ L6+ L7+ L8)]
III. ALGORITHM & RESULT ANALYSIS
The Excess air required for the complete combustion is
calculated by comparing the actual CO2measured from insitu
and the theoretical CO2 value derived from the theoretical air
required for complete combustion [6].
The steps followed for the calculation is as follows:
Step 1: Fuel Parameters after Proximity Analysis and Ultimate
Analysis should be given as input
Step 2: Boiler parameters & Ambient parameters from the In
site measurements to be given as input
Step 3: Calculate the Theoretical Air required for the
Combustion of Fuel
Step 4: Calculate the Theoretical CO2 Required for the complete
Combustion of fuel
Step 5: Actual CO2 from the Flue gas is taken from in site
measurements
Step 6: Excess Air required for the complete combustion was
calculated by comparing the theoretical CO2 and Actual CO2
Step 7: After calculating the Excess Air Required for different
combinations of theoretical CO2 and Actual CO2for different
grades of coal, a neural network was trained to predict the
values of excess air required.
A. ANN for Prediction of Excess Air Requirement
A feed forward neural network trained with back propagation
is used for this prediction.
The steps followed for creating the Artificial Neural Network
is as follows:
Step 1: Theoretical CO2 from different grades of coal and
their Measured Actual CO2 where given as Input vectors.
Step 2: Corresponding Excess air Requirement calculated
were assigned as the target values for their input vectors.
Step 3: The 2 layer feed forward Neural Network was created
with 3 neurons in each hidden layer.
Step 4: TheNetwork was trained and created with the Data
samples
Step 5: Weight values and the biasing is adjusted iteratively
to improve the network performance function.
Step 6: Mean square error between the network outputs and
the target outputs is the performance function
Step 7: Trained network can be applied to simulate output
corresponding to any new set of input data
International Journal of Students’ Research in Technology & Management
Vol 2 (04), June-July 2014, ISSN 2321-2543, pg 149-152
http://www.giapjournals.org/ijsrtm.html 151
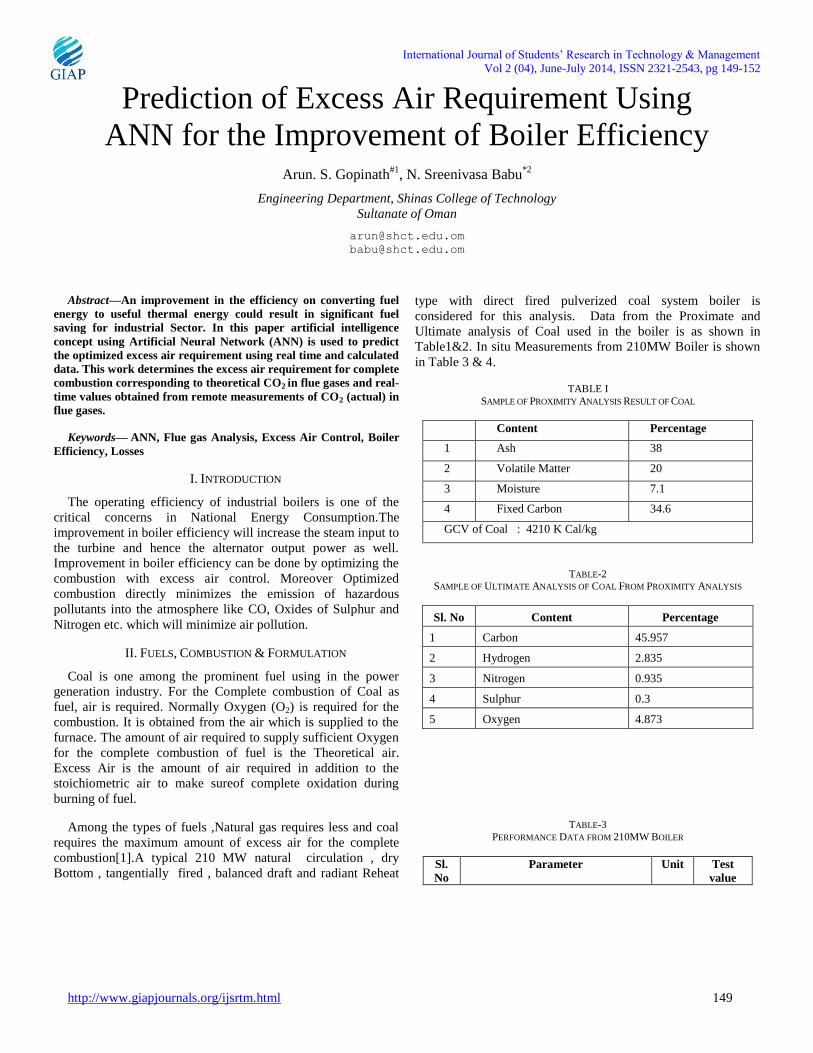
Fig. 1 Excess Air Requirement for Different CO2 actual measurements of coal using indirect method
Neural Network Training data is shown in Table 5. The CO2
actual is taken from in site measurements for different grades of
pulverized coal with different compositions. The training
algorithm used in neural network is Levenberg -Marquardt
algorithm which works better on function fitting problems with
small networks [3]. CO2theoretical is derived from the details of
ultimate analysis of the coal [4-5]. The performance function for
the feed forward network is its mean square error between the
network output and targets.
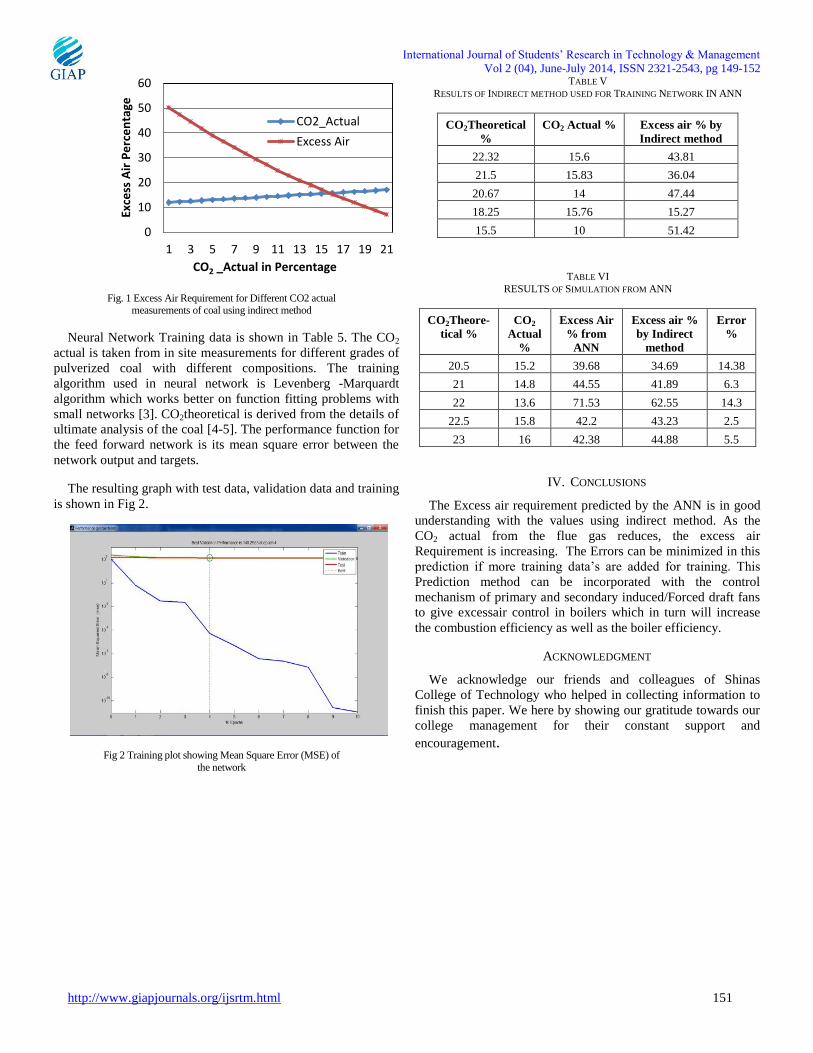
The resulting graph with test data, validation data and training
is shown in Fig 2.
Fig 2 Training plot showing Mean Square Error (MSE) of
the network
TABLE V
RESULTS OF INDIRECT METHOD USED FOR TRAINING NETWORK IN ANN
CO2Theoretical
%
CO2 Actual % Excess air % by
Indirect method
22.32 15.6 43.81
21.5 15.83 36.04
20.67 14 47.44
18.25 15.76 15.27
15.5 10 51.42
TABLE VI
RESULTS OF SIMULATION FROM ANN
CO2Theore-
tical %
CO2
Actual
%
Excess Air
% from
ANN
Excess air %
by Indirect
method
Error
%
20.5 15.2 39.68 34.69 14.38
21 14.8 44.55 41.89 6.3
22 13.6 71.53 62.55 14.3
22.5 15.8 42.2 43.23 2.5
23 16 42.38 44.88 5.5
IV. CONCLUSIONS
The Excess air requirement predicted by the ANN is in good
understanding with the values using indirect method. As the
CO2 actual from the flue gas reduces, the excess air
Requirement is increasing. The Errors can be minimized in this
prediction if more training data’s are added for training. This
Prediction method can be incorporated with the control
mechanism of primary and secondary induced/Forced draft fans
to give excessair control in boilers which in turn will increase
the combustion efficiency as well as the boiler efficiency.
ACKNOWLEDGMENT
We acknowledge our friends and colleagues of Shinas
College of Technology who helped in collecting information to
finish this paper. We here by showing our gratitude towards our
college management for their constant support and
encouragement.
0
10
20
30
40
50
60
1 3 5 7 9 11 13 15 17 19 21
Exce
ss A
ir P
erc
en
tage
CO2 _Actual in Percentage
CO2_Actual
Excess Air

International Journal of Students’ Research in Technology & Management
Vol 2 (04), June-July 2014, ISSN 2321-2543, pg 149-152
http://www.giapjournals.org/ijsrtm.html 152
REFERENCES
[1] Henry CopeteLópez and Santiago Sánchez Acevedo., An Approach to
Optimal Control of the Combustion System in a Reverberatory Furnace,
RevistaTecnologicas No. 23, December 2009. [2] Yoshitaka and Akihiro Murata., Optimum Combustion control by
TDLS200 Tunable Diode Laser Gas Analyser, Yokogawa Technical
Report English Edition, Vol.53, No.1, 2010. [3] Mark Hudson Beale, Martin T Hagan and Howard B Demuth., Neural
Network Tool BoxTM –User’s Guide, R2013b.
[4] JigishaParikha, S.A. Channiwalab and G.K. Ghosalc., A correlation for
calculating HHV from proximate analysis of solid fuels, Science Direct,
Fuel84, pp. 487-494, 2005.
[5] James G. Speight., Hand Book of Coal Analysis, John Wiley & Sons,
Inc. Publications, Hoboken, New Jersey, 2005. [6] Viktor Placek, Cyril Oswald and Jan Hrdlicka., Optimal Combustion
Conditions for a Small-scale Biomass Boiler, ActaPolytechnica, Vol. 52,
No. 3, 2012.
International Journal of Students’ Research in Technology & Management
Vol 2 (04), June-July 2014, ISSN 2321-2543, pg 153-156
153
Study of Microwave Radiation on
Transesterification of Jatropha Oil in Presence
of Alkali Catalyst
Nadira Hassan Mohammed Al Balushi#1
, Priy Brat Dwivedi*2
1Student,
2Project Guide, Mechanical & Industrial Engineering Department
Caledonian College of Engineering, Muscat, Oman
Corresponding author: [email protected]
Abstract— The objectives of this study is to produce biodiesel
from Jatropha oil using microwave radiation in presence of alkali
catalyst and designing suitable batch reactor for lab scale
production. Cost effectiveness of the project is also being studied.
This paper outlines studies done to find the optimal method for
converting Jatropha oil to useable biodiesel using microwave
irradiation. The amount of acid catalyst is 0.4w % and ratio of
methanol to oil is 6:1 w/w for the optimal trans-esterification.
Keywords: Jatropha oil, Biodiesel, Catalyst, Microwave radiation,
Trans-esterification
I. INTRODUCTION
Oil is running out. In the short term it will continue to go
up in price and in the middle distant future it will be too
expensive to burn. As the world energy demand and
consumption increases every day, we need to focus on the use
of biofuels that will help extend the lifetime of our oil supply,
but eventually we will need to replace oil. Whatever that
replacement is it needs to be sustainable.
By 2030, global energy consumption is projected to grow
by 36% [1] and, in our view; demand for liquid transport fuels
will rise by some 16 million barrels more a day. With the
world’s population projected to reach 8.3 billion by then, an
additional 1.3 billion people will need energy. To meet this
demand a diverse energy mix is needed. This is where biofuels
can help; in the next two decades, biofuels is expected to
provide some 20% (by energy) of the growth in fuel for road
transport [2]. The possibility of deriving bioduesel from
locally grown sources and using them as alternatives to petro
diesel products is attractive for many countries, including the
Sultanate of Oman, that currently depend largely on fossil
fuels.
Biodiesel is fuel that is similar to diesel fuel and is derived
from usually vegetable sources. Biodiesel refers to a vegetable
oil- or animal fat-based diesel fuel consisting of long-chain
alkyl (methyl, ethyl, or propyl) esters. Biodiesel is typically
made by chemically reacting lipids (e.g., vegetable oil, animal
fat (tallow) with an alcohol producing fatty acid esters (FAE).
Biodiesel helps reduce greenhouse gas emissions (GHGs)
because it comes from animal or plant biomass with a
lifecycle of a few years. On the other hand, petro diesel is a
fossil fuel that releases into the atmosphere carbon that has
been tied up for hundreds of millions of years, and all of it
adds to GHGs. Fossil fuels also release more tailpipe
emissions than does biodiesel. Biodiesel is a liquid which
varies in color between golden and dark brown depending on
the production feedstock. It is slightly miscible with water, has
a high boiling point and low vapor pressure. The flash point of
biodiesel (>130 °C, >266 °F) is significantly higher than that
of petroleum diesel (64 °C, 147 °F) or gasoline (−45 °C, -52
°F). Biodiesel has a density of ~ 0.88 g/cm³, higher than
petrodiesel (~ 0.85 g/cm³). Most diesel engines are warranted
to run on anywhere between B5 (5% biodiesel) to B20 (20%
biodiesel). [3] Have discussed few chemical and physical
properties of jatropha oil. (Table 1).
Kapilan [5] has used microwave radiation for two step
transesterification in his work and reported successful
production of biodiesel from jatropha oil grown in Indian soil.
Antony Raja, et al. [6] reported that Jatropha oil is converted
into jatropha oil methyl ester known as (biodiesel) prepared in
the presence of homogeneous acid catalyst. The same
characteristics study was also carried out for the diesel fuel for
obtaining the base line data for analysis.
International Journal of Students’ Research in Technology & Management
Vol 2 (04), June-July 2014, ISSN 2321-2543, pg 153-156
154
TABLE I
CHEMICAL AND PHYSICAL PROPERTIES [4]
Parameter Value
% FFA as oleic acid
Iodine value
Saponification value
Peroxide value
Percentage oil content (kernel)
Density at 20° C (g/ml)
Viscosity at room temperature (cp)
Physical state at room temperatur
2.23±0.02
103.62±0.07
193.55±0.61
1.93±0.012
63.16±0.35
0.90317
42.88
Liquid
A Value is mean ± standard deviation of triplicate
determinations.
Marchetti, et al. [7] concluded that there are different ways
of production, with different kinds of raw materials: refine,
crude or frying oils. Also with different types of catalyst, basic
ones such as sodium or potassium hydroxides, acids such as
sulfuric acid and ion exchange resins. One of the advantages
of this fuel is that the raw materials used to produce it are
natural and renewable. Also of this process, the free fatty acid
will be changed completely in to esters. Bojan, et al. [8]
carried out his work to produce biodiesel from crude Jatropha
Curcas oil (CJCO) with a having high free fatty acid (HFFA)
contents (6.85%) and also the crude Jatropha Curcas oil was
processed in two steps. During the first step the free fatty acid
content of crude Jatropha Curcas oil was reduced to 1.12% in
one hour at 60°C using 9:1 methanol to oil molar ratio. The
second step was alkali catalyzed transesterification using
methanol to oil molar ratio of 5.41:1 to produce biodiesel from
the product of the first step at 60°C.The maximum yield of
biodiesel was 93% v/v of crude Jatropha Curcas oil which was
more than the biodiesel yield (80.5%) from the one step alkali
catalyzed transesterification process. Temu, et al. [9] reported
that the quality of biodiesel is influenced by the nature of
feedstock and the production processes employed. The
physico-chemical properties of jatropha and castor oils were
assessed for their potential in biodiesel. The properties of
jatropha and castor oils were compared with those of palm
from literature while that of biodiesel were compared with
petro-diesel. Results showed that high amounts of FFA in oils
produced low quality biodiesel while neutralized oils with low
amounts of FFA produced high quality biodiesel.
In current study locally grown jatropha oil was taken as
feed stock and two step transesterification was done by
microwave radiation.
Antony, et al. [10] reported that all countries are at present
heavily dependent on petroleum fuels for transportation and
agricultural machinery. The fact that a few nations together
produce the bulk of petroleum has led to high price fluctuation
and uncertainties in supply for the consuming nations. This in
turn has led them to look for alternative fuels that they
themselves can produce. Among the alternatives being
considered are methanol, ethanol, biogas and vegetable oils.
Vegetable oils have certain features that make them attractive
as substitute for Diesel fuels. Vegetable oil has the
characteristics compatible with the CI engine systems.
Vegetable oils are also miscible with diesel fuel in any
proportion and can be used as extenders. Ronnie, et al. [11]
concluded that the benefits of jatropha as biodiesel include the
reduction of greenhouse gas emissions, as well as the
country’s oil imports. Local production of jatropha is also
practical because as a non-food crop, it will not compete with
food supply demands. It can also grow on marginal degraded
land, leaving prime agricultural lots for food crops while at the
same time restoring the marginal and degraded land’s fertility.
All of these benefits can possibly be achieved by the presence
of this locally fabricated high efficiency jatropha oil extractor
equipment.
This mixture was heated in LG make domestic microwave
oven with occasional shaking for 60 seconds. Power level was
set at 160 W. This pretreatment was done with every set
before mixture was set for transesterification. This pre-treated
jatropha oil was used in base catalysed second-step
transesterification.
In the second step, transesterification was carried out at
with various methanol-to- oil ratio, at various catalyst strength,
and various time duration. In this step also power supply 160
W. Results of variations are summarized in table 2. After the
reaction, the excess methanol was removed by vacuum
distillation and then the trans-esterification products were
poured into a separating funnel for phase separation. After
phase separation, the top layer (biodiesel), was separated and
washed with distilled water in order to remove the impurities.
Then the biodiesel was heated above 1000C, to remove the
moisture.
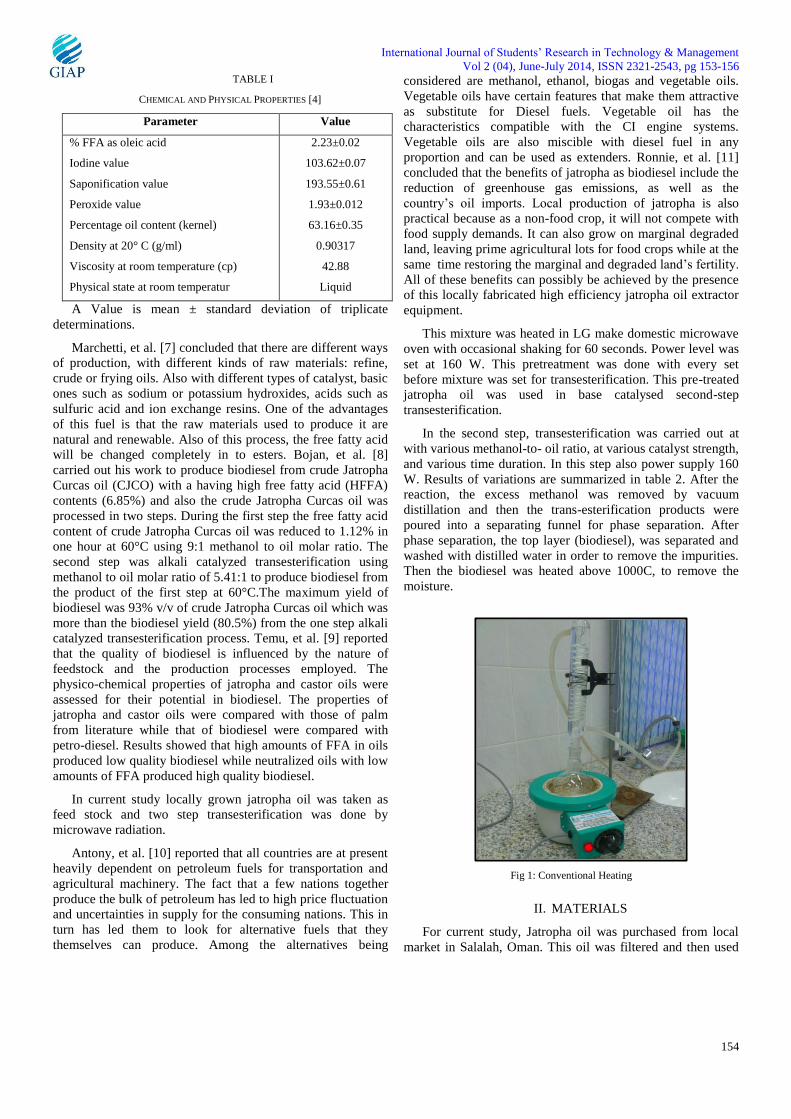
Fig 1: Conventional Heating
II. MATERIALS
For current study, Jatropha oil was purchased from local
market in Salalah, Oman. This oil was filtered and then used
International Journal of Students’ Research in Technology & Management
Vol 2 (04), June-July 2014, ISSN 2321-2543, pg 153-156
155
for the production of biodiesel. Sulphric acid (H2SO4)
is used as acid catalyst in first step and KOH was used as
catalyst in second step. In our study we used Methanol for
transesterification. Because methanol is cheaper and has better
physical and chemical properties (polar and shortest chain
alcohol). Potassium hydroxide, methanol and sulphuric acid
were purchased from Schalau, Chemie S.A, Spain. All the
chemicals used for transesterification were of analytical
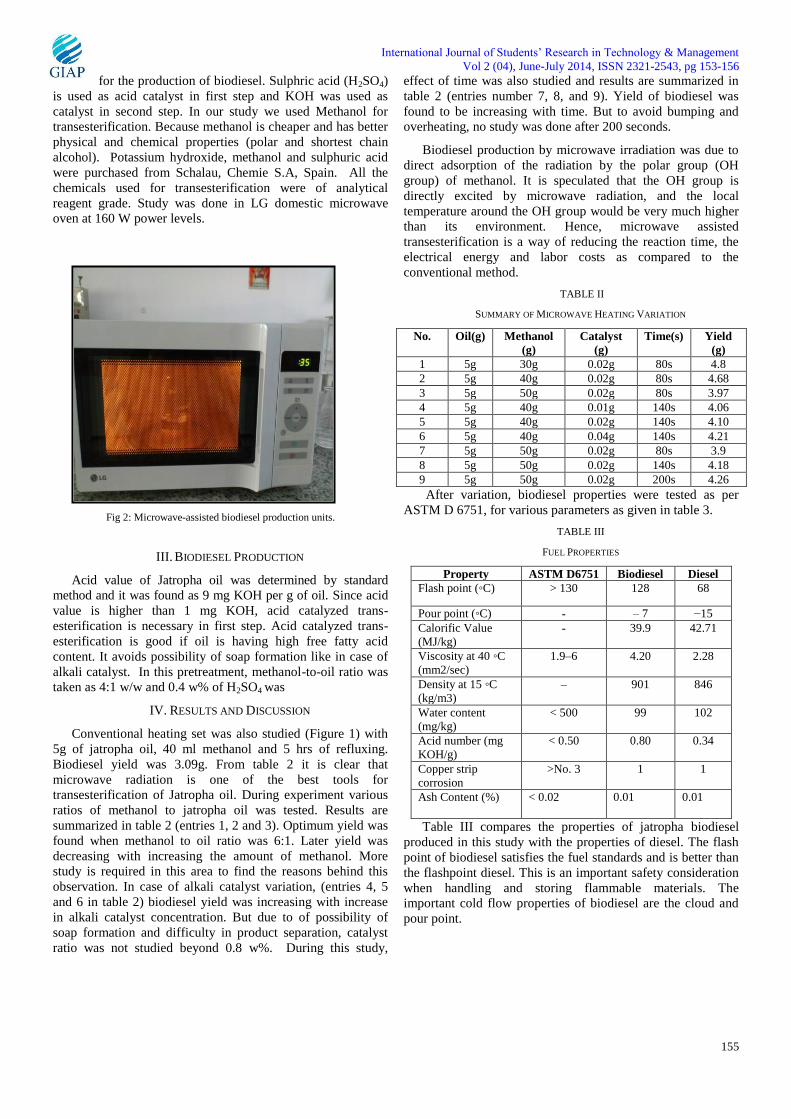
reagent grade. Study was done in LG domestic microwave
oven at 160 W power levels.
Fig 2: Microwave-assisted biodiesel production units.
III. BIODIESEL PRODUCTION
Acid value of Jatropha oil was determined by standard
method and it was found as 9 mg KOH per g of oil. Since acid
value is higher than 1 mg KOH, acid catalyzed trans-
esterification is necessary in first step. Acid catalyzed trans-
esterification is good if oil is having high free fatty acid
content. It avoids possibility of soap formation like in case of
alkali catalyst. In this pretreatment, methanol-to-oil ratio was
taken as 4:1 w/w and 0.4 w% of H2SO4 was
IV. RESULTS AND DISCUSSION
Conventional heating set was also studied (Figure 1) with
5g of jatropha oil, 40 ml methanol and 5 hrs of refluxing.
Biodiesel yield was 3.09g. From table 2 it is clear that
microwave radiation is one of the best tools for
transesterification of Jatropha oil. During experiment various
ratios of methanol to jatropha oil was tested. Results are
summarized in table 2 (entries 1, 2 and 3). Optimum yield was
found when methanol to oil ratio was 6:1. Later yield was
decreasing with increasing the amount of methanol. More
study is required in this area to find the reasons behind this
observation. In case of alkali catalyst variation, (entries 4, 5
and 6 in table 2) biodiesel yield was increasing with increase
in alkali catalyst concentration. But due to of possibility of
soap formation and difficulty in product separation, catalyst
ratio was not studied beyond 0.8 w%. During this study,
effect of time was also studied and results are summarized in
table 2 (entries number 7, 8, and 9). Yield of biodiesel was
found to be increasing with time. But to avoid bumping and
overheating, no study was done after 200 seconds.
Biodiesel production by microwave irradiation was due to
direct adsorption of the radiation by the polar group (OH
group) of methanol. It is speculated that the OH group is
directly excited by microwave radiation, and the local
temperature around the OH group would be very much higher
than its environment. Hence, microwave assisted
transesterification is a way of reducing the reaction time, the
electrical energy and labor costs as compared to the
conventional method.
TABLE II
SUMMARY OF MICROWAVE HEATING VARIATION
No. Oil(g) Methanol
(g)
Catalyst
(g)
Time(s) Yield
(g)
1 5g 30g 0.02g 80s 4.8
2 5g 40g 0.02g 80s 4.68
3 5g 50g 0.02g 80s 3.97
4 5g 40g 0.01g 140s 4.06
5 5g 40g 0.02g 140s 4.10
6 5g 40g 0.04g 140s 4.21
7 5g 50g 0.02g 80s 3.9
8 5g 50g 0.02g 140s 4.18
9 5g 50g 0.02g 200s 4.26
After variation, biodiesel properties were tested as per
ASTM D 6751, for various parameters as given in table 3.
TABLE III
FUEL PROPERTIES
Property ASTM D6751 Biodiesel Diesel
Flash point (◦C) > 130 128 68
Pour point (◦C) - – 7 −15
Calorific Value
(MJ/kg) - 39.9 42.71
Viscosity at 40 ◦C
(mm2/sec)
1.9–6 4.20 2.28
Density at 15 ◦C
(kg/m3)
– 901 846
Water content
(mg/kg)
< 500 99 102
Acid number (mg
KOH/g)
< 0.50 0.80 0.34
Copper strip
corrosion
>No. 3 1 1
Ash Content (%) < 0.02 0.01 0.01
Table III compares the properties of jatropha biodiesel
produced in this study with the properties of diesel. The flash
point of biodiesel satisfies the fuel standards and is better than
the flashpoint diesel. This is an important safety consideration
when handling and storing flammable materials. The
important cold flow properties of biodiesel are the cloud and
pour point.
International Journal of Students’ Research in Technology & Management
Vol 2 (04), June-July 2014, ISSN 2321-2543, pg 153-156
156
According to ASTM standard D 6751, no limit is
given for pour point and suggested “report” in the fuel
standard. The calorific value is an important property of
biodiesel that determines its suitability as an alternative to
diesel. As per European standard, EN 14214, the approved
calorific value for biodiesel is 35 MJ per kg. The table shows
that the calorific value of jatropha biodiesel is close to that of
diesel. According to the ASTM standards, the acceptable
viscosity range for biodiesel is between 1.9–6.0 mm2/s at
400C, and jatropha biodiesel satisfies the biodiesel standard.
The density of jatropha biodiesel is close to that of diesel and
satisfies the ASTM standard. ASTM standard approves a
maximum acid value for biodiesel of 0.5 mg KOH/g, but
jatropha biodiesel produced in this study has acid value 0.80
mg. The degree of tarnish on the corroded copper strip
correlates to the overall corrosiveness of the fuel sample. The
copper strip corrosion property of jatropha biodiesel is within
the specifications of ASTM. Another important factor of
biodiesel is the ash content estimation. The ash content of
jatropha biodiesel satisfies the ASTM standard.
V. CONCLUSIONS
In this work, biodiesel was produced from jatropha oil
using microwave radiation and with the help of two-step
transesterfication. It was observed that microwave radiation
helps the synthesis of methyl esters (biodiesel) from non-
edible oil, and higher biodiesel conversion can be obtained
within a few minutes, whereas the conventional heating
process takes more than 5 hrs.
In the current investigation, it has confirmed that Jatropha
oil may be used as resource to obtain biodiesel. The
experimental result shows that alkali catalyzed
transesterification is a promising area of research for the
production of biodiesel in large scale. Effects of different
parameters such as time, reactant ratio and catalyst
concentration on the biodiesel yield were analyzed. The best
combination of the parameters was found as 6:1 w/w ratio of
Methanol to oil, 0.8 w% of KOH as catalyst and 200 seconds
of reaction time. The viscosity of Jatropha oil reduces
substantially after transesterification and is comparable to
diesel. Biodiesel characteristics like density, viscosity, flash
point, and pour point were studied and are found as
comparable to diesel.
ACKNOWLEDGEMENT
Authors are thankful to Caledonian College of Engineering, Muscat,
for supporting this work.
REFERENCES
[1] (2013) Annual Energy Outlook 2013 website. [Online].
Available: http://www.eia.gov/forecasts/aeo/IF_all.cfm.
[2] (2013) BP Outlook 2030 website. [Online]. Available:
http://www.bp.com/sectiongenericarticle.do?categoryId
=9030039&contentId=7055156.
[3] (2014) The wikipedia website. [Online]. Available:
http://en.wikipedia.org/wiki/Biodiesel.
[4] E. Akbar, Z. Yaakob, S. K. Kamarudin, M. Ismail and
J. Salimon, “Characteristic and Composition of
Jatropha Curcas Oil Seed from Malaysia and its
Potential as Biodiesel Feedstock, ” European Journal
of Scientific Research., vol. 29, pp. 396-403, Nov.
2009.
[5] N. Kapilan, “Production of Biodiesel from Vegetable
Oil Using Microware Irradiation,” Acta Polytechnica.,
vol. 52, pp. 46-50, Nov. 2010.,” Research Journal of
Chemical Science., vol. 1, pp. 81-87, Nov. 2011.
[6] S. Antony, D.S. Robinson and C. Lee, “Biodiesel
production from jatropha oil and its characterization
Oil by A Two Step Method- An Indian Case Study, ”
Journal of Sustainable Energy & Environment., vol. 3,
pp. 63-66, Dec. 2012.
[7] J.M. Marchetti, V.U. Miguel and A.F. Errazu,
“Possible methods for biodiesel production,”
Renewable and Sustainable Energy Reviews., vol. 11,
pp. 1300-1311, Nov. 2007.
[8] S.G. Bojan and S.K. Durairaj, “Producing Biodiesel
from High Free Fatty Acid Jatropha Curcas Oil by A
Two Step Method- An Indian Case Study, ” Journal of
Sustainable Energy & Environment., vol. 3, pp. 63-66,
Nov. 2012.
[9] A. Okullo, T. Ogwok and J.W. Ntalikwa, “Physico-
Chemical Properties of Biodiesel from Jatropha and
Castor Oils, ” International Journal of Renewable
Energy Research., vol. 2, pp. 47-52, Nov. 2012.
[10] S. Antony, D. Robinson and C. Robert, “Biodiesel
production from jatropha oil and its characterization, ”
Research Journal of Chemical Sciences., vol. 1, pp. 81-
87, Apr. 2011.
[11] P. Ronnie, D. Robinson and C. Robert, “Jatropha Oil
Extractor Equipment, ” Research Journal of Chemical
Sciences., vol. 3, pp. 238-243, Apr. 2010.
![vOl.4 no.2 july-december 2017 · [vol.4 no.2 july-december 2017] วารสารรังสีวิทยาศิริราช. เทคนิคการถ่ายภาพเอกซเรย์เต้านมในผ้หญิงที่ศัลยกรรมเสริมเต้านมู](https://img.pdfslide.net/doc/110x75/5f0d95027e708231d43b11bb/vol4-no2-july-december-2017-vol4-no2-july-december-2017-aaaaaaaaaaaaaaaaaaaaaaa.jpg)


![Ijsrtm vol 1 (2) april 2013 [issn 2321 2543] giap india](https://img.pdfslide.net/doc/110x75/568c342d1a28ab02358f76cb/ijsrtm-vol-1-2-april-2013-issn-2321-2543-giap-india.jpg)