Embed Size (px)
Citation preview

1
IL-33/ST2 induces neutrophil-dependent reactive oxygen species production and mediates
gout pain
Chengyu Yin1, #, Boyu Liu1, #, Yuanyuan Li1, Xiaojie Li1, Jie Wang1, Ruixiang Chen1, Yan Tai2,
Qiyang Shou3, Ping Wang4, Xiaomei Shao1, Yi Liang1, Hong Zhou5, Wenli Mi6, Jianqiao
Fang1,*and Boyi Liu1,*
1. Department of Neurobiology and Acupuncture Research, The Third Clinical Medical College,
Zhejiang Chinese Medical University, Key Laboratory of Acupuncture and Neurology of
Zhejiang Province, Hangzhou, 310053, China.
2. Academy of Chinese Medical Sciences, Zhejiang Chinese Medical University, Hangzhou,
310053, China.
3. The Second Clinical Medical College, Zhejiang Chinese Medical University, Hangzhou
310053, China.
4. Department of Pathology, School of Basic Medical Science, Zhejiang Chinese Medical
University, Hangzhou, 310053, China
5. Department of Immunology, Anhui Medical University, Hefei, 230032, China
6. Department of Integrative Medicine and Neurobiology, The Academy of Integrative Medicine,
School of Basic Medical Sciences, Institutes of Brain Science, Brain Science Collaborative
Innovation Center, State Key Laboratory of Medical Neurobiology, Fudan University,
Shanghai, 200032, China.
#These authors contributed equally to this work.
*Correspondence: Boyi Liu, Department of Neurobiology and Acupuncture Research, The Third
Clinical Medical College, Zhejiang Chinese Medical University, Key Laboratory of Acupuncture

2
and Neurology of Zhejiang Province, Hangzhou, 310053, China. E-mail: [email protected]
Or Jianqiao Fang, Department of Neurobiology and Acupuncture Research, The Third Clinical
Medical College, Zhejiang Chinese Medical University, Key Laboratory of Acupuncture and
Neurology of Zhejiang Province, Hangzhou, 310053, China. E-mail: [email protected].
Declaration of interest : None.
Abstract
Objective: Gout, induced by monosodium urate (MSU) crystal deposition in joint tissues,
provokes severe pain and impacts life quality of patients. However, the mechanisms
underlying gout pain are still incompletely understood. Methods: We established a mouse gout
model by intra-articularly injection of MSU crystals into the ankle joint of wild type and genetic
knockout mice. RNA-Sequencing, in vivo molecular imaging, Ca2+ imaging, reactive oxygen
species (ROS) generation, neutrophil influx and nocifensive behavioral assays, etc. were used.
Results: We found interleukin-33 (IL-33) was among the top up-regulated cytokines in the
inflamed ankle. Neutralizing or genetic deletion of IL-33 or its receptor ST2 (suppression of
tumorigenicity) significantly ameliorated pain hypersensitivities and inflammation.
Mechanistically, IL-33 was largely released from infiltrated macrophages in inflamed ankle upon
MSU stimulation. IL-33 promoted neutrophil influx and triggered neutrophil-dependent ROS
production via ST2 during gout, which in turn, activated transient receptor potential ankyrin 1
(TRPA1) channel in dorsal root ganglion (DRG) neurons and produced nociception. Further,
TRPA1 channel activity was significantly enhanced in DRG neurons that innervate the inflamed
ankle via ST2 dependent mechanism, which results in exaggerated nociceptive response to

3
endogenous ROS products during gout. Conclusions: We demonstrated a previous unidentified
role of IL-33/ST2 in mediating pain hypersensitivity and inflammation in a mouse gout model
through promoting neutrophil-dependent ROS production and TRPA1 channel activation.
Targeting IL-33/ST2 may represent a novel therapeutic approach to ameliorate gout pain and
inflammation.
Keywords: Gout; arthritis; TRPA1; reactive oxygen species; cytokine; neutrophil;

4
Introduction
Gout is caused by monosodium urate (MSU) crystal accumulation in the joints and periarticular
tissues [1]. It is the most common inflammatory arthritis worldwide [1]. Unfortunately, the
incidence of gout is still increasing due to life style/dietary changes and the aging population [2].
Patients with gout suffer from intense joint inflammation and excruciating arthritic pain, which
severely reduced the patients’ life quality [3]. Gout attack is usually treated with colchicine,
nonsteroidal anti-inflammatory drugs (NSAIDs) or corticosteroids [4-6]. In spite of that, gout is
still difficult to treat due to the many unwanted adverse effects of these conventional therapies [3].
Currently, interleukin-1β (IL-1β) neutralizing monoclonal antibody and synthetic IL-1R
antagonists are available alternative options [7, 8]. But patients will have to be closely watched for
intolerabilities or side effects [4, 9].
MSU provokes the activation of innate immune system and thereby, elicits strong inflammatory
response in the joint and periarticular tissues [5, 10]. Infiltrated macrophages engulf MSU via
phagocytosis and subsequently release an array of inflammatory mediators [11]. Some of these
mediators may possibly interact with the peripheral nociceptors to elicit gout pain. In addition, our
recent work, together with others, demonstrated that endogenous ROS products are critically
involved in mediating gout pain and inflammation [12, 13]. However, it still remains elusive how
ROS is generated in the inflamed tissues in the context of gout and mediates gout pain.
It was recently reported that serum IL-33 expression was increased in gout patients compared to
healthy controls and positively correlated with the inflammatory indicator C-reactive protein [14,

5
15]. IL-33, a member of the IL-1 family, binds to the receptor complex, consisting of IL-33
specific ST2 and IL-1 receptor accessory protein IL-1RAcp, to elicit biological functions in
inflammation, autoimmune response and homeostasis [16, 17]. Recent evidence suggests that
IL-33 can act as an important pain mediator in certain pain conditions, including joint pain, bone
cancer pain, muscle pain and neuropathic pain [12, 18, 19] . Our recent work further identified
IL-33 engages with ST2 in peripheral sensory neurons to exert sensory neuron hyperexcitability
[20, 21]. These studies all demonstrate a pivotal role for IL-33/ST2 in mediating nociception and
sensory neuron activities.
In the present study, we aimed to explore the potential pronociceptive or inflammatory mediators
in the inflamed ankle from MSU-induced mouse gout arthritis model via RNA-Seq expression
analysis. We further found that IL-33/ST2 mediates pain hypersensitivity and inflammation in the
mouse gout model through promoting neutrophil-dependent ROS production and TRPA1 channel
activation.
Results
1. MSU-induced gout arthritis triggers the release of IL-33 from the inflamed ankle tissues.
We first established the mouse model of gout arthritis by intra-articular (i.a.) injection of MSU
(0.5 mg/20 μL) into mouse ankle (MSU group) as we previously described [12]. Control animal
received PBS injection (20 μl PBS, i.a., Veh group). MSU injection elicited obvious ankle edema,
which showed up 2 h after injection and persisted until 72 h, compared with Veh group (Figure
1A&B). Pathology analysis indicated strong inflammatory cell infiltration into the ankle of

6
MSU-treated mice (Figure 1C). Moreover, MSU-injected mice developed robust mechanical
allodynia, manifested by reduction of paw withdraw threshold (PWT), which peaked at 24 h and
lasted until 48 h (Figure 1D). To explore potential endogenous pain mediators in MSU-induced
gout arthritis, we performed RNA-Seq to examine gene expression profiles in ankle tissues
isolated from MSU-injected and vehicle-injected mice. Ankle tissues were collected 24 h after
MSU or PBS injection and high quality RNA was extracted for RNA-Seq analysis (Figure
S1A&B). A total of 1722 genes, which take up 8.9% of total genes (19323), was found to be
significantly up- or down-regulated (DEGs, |log2 (Fold Change)| ≥1.0; q≤0.001) in ankle tissues
of MSU-injected mice vs. vehicle-injected mice (Figure 1E). The 594 upregulated and 1128
downregulated DEGs were illustrated in scatter plot (Figure 1F).
Among these DEGs, we especially focused on inflammatory cytokines or chemokines that were
upregulated. Figure 1G showed the top 10 inflammatory cytokines or chemokines identified to be
significantly up-regulated. Among these genes, certain well-known inflammatory mediators, such
as Il-6, Il-1β and Cxcl3, were significantly increased in MSU group. We were particular interested
in Il-33, which has not previously been implicated in gout pain, but implicated in some other pain
conditions, including neuropathic, cancer and muscle pain, etc. [18, 19] Therefore, we set to
examine the possible involvement of IL-33 in mediating the pain response of the mouse gout
model.
qPCR confirmed that Il-33 gene were significantly increased in ankle tissues of MUS group
(Figure 2A). St2, the gene encoding the specific receptor for IL-33, was significantly upregulated

7
as well (Figure 2B). Il-1RAcP, which forms IL-33 receptor complex with ST2, was not changed
(Figure 2C). ELISA confirmed a corresponding increase of IL-33 protein concentration in ankle
tissues from MSU group mice 24 h after model establishment (Figure 2D). Western blot further
indicated IL-33 protein expression was significantly increased in ankle tissues of MSU group 8,
24 and 48 h after model establishment, which peaked at 24 h time point (Figure 2E). ST2 protein
expression in ankle tissue was also significantly increased 24 h after MSU injection (Figure 2F).
In contrast, IL-33 or ST2 protein expression was not significantly changed in Veh group at all time
points (Figure 2E&F).
2. IL-33/ST2 signaling is involved in mediating the pain hypersensitivity and inflammatory
response of the mouse gout model.
We set to study whether IL-33 was involved in mechanical allodynia of the mouse gout model. An
IL-33 neutralizing antibody (5 μg/mouse, i.p.) or isotype control IgG (goat IgG, 5 μg/mouse, i.p.)
was injected into mice 1 h before and 8, 23 h after model establishment (Figure 3A). IL-33
neutralizing antibody significantly reduced ankle edema and mechanical allodynia of MSU group
mice at 24 and 28 h time points (Figure 3B&C). IL-33 neutralizing antibody gradually lost its
effect 8 h after its last application (Figure 3B&C). We further examined the effects of IL-33 using
Il-33 deficient (Il-33-/-) mice. Similarly, Il-33-/- mice exhibited reduced ankle edema and
mechanical allodynia compared with wild type (WT) control group after model establishment
(Figure 3D&F). Area under the curve (AUC) indicated accumulated reduction in mechanical
allodynia and ankle edema in Il-33-/-+MSU group vs. WT+MSU group (Figure 3E&G). We then
studied whether ST2 was also involved in the mechanical allodynia of mouse gout model using

8
St2 deficient (St2-/-) mice. When MSU was injected, St2-/- mice (St2-/-+MSU) exhibited
significantly reduced mechanical allodynia and ankle edema compared with WT (WT+MSU)
group (Figure 3H&J). Area under the curve (AUC) indicated accumulated reduction in mechanical
allodynia and ankle edema in St2-/-+MSU group compared with WT+MSU group (Figure 3I&K).
Additionally, naïve Il-33-/- and St2-/- mice did not exhibit any deficits in
general locomotor activities in open field test and body weight vs. WT mice (Figure S2A-D).
We then studied the behavioral effects of exogenously injecting IL-33 into gout model mice. 24 h
after gout model establishment, recombinant mouse IL-33 (rIL-33) was injected into the ankle
(3-300 ng/10 μl, i.a., Figure S3A) of the gout model mouse. 30 or 300 ng rIL-33 injection further
enhanced the ankle edema and exacerbated the mechanical allodynia of the gouty mice at both
24.75 and 28 h time points compared with vehicle (BSA)-injected gouty mice, whereas 3 ng
rIL-33 was not effective (Figure S3B&C). We further tested whether IL-33’s effect is mediated via
ST2. We found that co-injection of ST2 neutralizing antibody with rIL-33 largely abolished
rIL-33’s effect on ankle edema and 50% PWTs in MSU-treated WT mice (Figure S3D&E).
Furthermore, rIL-33 injection (300 ng) into MSU-treated St2-/- mice did not further induce ankle
edema and mechanical allodynia compared with BSA (vehicle) (Figure S3F), which is consistent
with the results derived from ST2 neutralizing antibody. Therefore, these data suggest that
exogenous IL-33 acts on ST2 to exacerbate inflammation and pain hypersensitivities in gout
model mice.
We further examined the expression of some key inflammatory cytokines and chemokines in ankle

9
tissues via Bio-Plex multiplex immunoassays. As shown in Table 1, MSU treatment triggered
upregulation of a number of cytokines and chemokines in ankle tissues of WT mice. Compared
with WT mice, St2-/- mice showed significantly reduced expression of IL-1β, IL-6, IL-13, CCL11,
G-CSF, CXCL1, CCL2 and CCL3 proteins in ankle tissues (Table 1), suggesting St2-/- mice
showed generally attenuated inflammatory response during gout.
3. Macrophage is among one of the cellular mechanisms for IL-33 overproduction in gout
condition.
IL-33 expression can be induced in macrophages by the bacterial endotoxin, lipopolysaccharide
(LPS) [22-24]. As macrophages accumulate in the inflamed tissues to react to MSU deposition by
uptake of the crystals via phagocytosis [7], we set to test whether MSU could trigger IL-33
expression in macrophages. We first tested the effect of MSU on macrophage cell line RAW264.7
in vitro. As a positive control, incubation with LPS (1 μg/ml) induced obvious upregulation of
Il-33 gene expression in RAW264.7 cells compared with vehicle (PBS) incubated cells (Figure
4A), a result consistent with previous studies [22]. MSU (0.5 or 1.0 mg/ml) incubation triggered a
significant upregulation of Il-33 gene expression in RAW264.7 cells (Figure 4A). ELISA test
further confirmed that MSU incubation promoted IL-33 protein expression in RAW264.7 cells
(Figure 4B). We then tested the effect of MSU on mouse macrophages. Thioglycollate-elicited
macrophages (TPMs) were harvested from mice and exhibited over 90% macrophages purity
examined by flow cytometry (Figure S4A&B). MSU (1 mg/ml) or LPS incubation (1 μg/ml)
resulted in a significant increase in IL-33 protein expression in TMPs (Figure 4C).

10
We further examined the effect of in vivo macrophages depletion using clodronate-containing
liposomes on IL-33 release in gout (Figure 4D). Clodronate (1 mg/100 μl, i.p.) robustly reduced
the macrophages detected by F4/80 staining in the spleen of naïve mice compared with vehicle
(liposome) treatment (Figure S5A&B), demonstrating the effectiveness of clodronate on
macrophage depletion. MSU-treated mice showed obvious macrophage accumulation in
periarticular ankle tissues, which was significantly reduced by clodronate treatment (Figure
4E&F). The ankle tissues were then collected and subjected to IL-33 protein detection.
Clodronate-induced macrophage depletion significantly reduced the upregulation of IL-33 protein
expression in ankle tissues from MSU-treated mice (Figure 4G). Clodronate-induced macrophage
depletion further reduced ankle edema and mechanical allodynia of MSU-treated mice (Figure
4H-K). Based upon the above data, we reasoned that macrophage might be among one of the
cellular mechanisms for IL-33 overproduction during gout.
4. IL-33/ST2 signaling participates in oxidative stress modulation and promotes ROS
production in gout.
We next explored the mechanisms underlying how IL-33/ST2 mediates the pain response of
mouse gout model. We and others have demonstrated that endogenous ROS products resulted
from oxidative stress played an important role in mediating gout pain and inflammation [12, 13,
25]. Therefore, we began to explore whether IL-33/ST2 could have any effect on endogenous
ROS production and oxidative stress level under gout condition. We found that H2O2 level was
significantly increased in ankle tissues from WT+MSU group mice vs. WT+Veh group mice,
whereas St2-/-+MSU group mice showed significantly reduced H2O2 level vs. WT+MSU group

11
mice (Figure 5A). Furthermore, the levels of some lipid perioxidation products, such as
malondialdehyde (MDA) and 4-hydroxynonenal (4-HNE), were both significantly increased in
ankle tissues from WT+MSU group mice vs. WT+Veh group mice. In comparison, St2-/-+MSU
group mice showed significantly reduced levels of MDA and 4-HNE (Figure 5B, E&F). We also
evaluated the activities of antioxidant enzymes superoxidase dismutase (SOD) and glutathione
peroxidase (GSH-Px). The levels of SOD and GSH-Px were dramatically decreased in ankle
tissues of WT+MSU group mice, whereas St2-/-+MSU group mice showed significantly improved
levels compared with WT+MSU group (Figure 5C&D). We further performed a noninvasive in
vivo imaging of ROS productions in mouse ankle using the chemiluminescent probe L-012 [26].
WT+MSU group displayed significantly increased L-012 chemiluminescent signals in the ankle
compared with MSU+Veh group, a sign of increased ROS production in vivo. In contrast,
St2-/-+MSU group showed significantly reduced L-012 chemiluminescent signals vs. WT+MSU
group (Figure 5G&H).
We then tested the effect of exogenously applied rIL-33 on oxidative stress in ankle tissues of the
mouse gout model. Injection of rIL-33 (300 ng/mouse) into MSU-treated mice (MSU+rIL-33
group) promoted a further reduction of antioxidant enzymes SOD and GSH-Px activities and a
further increase in MDA level in ankle tissues vs. MSU-treated mice injected with BSA
(MSU+BSA group, Figure 5I, J&K). Furthermore, rIL-33-induced MDA level increase in ankle
tissues of gout model mice was abrogated by co-administration with ST2 neutralizing antibody or
in St2-/- mice (Figure 5K&L). Collectively, the above results demonstrated that IL-33/ST2
promotes oxidative stress and ROS production in gout.

12
5. IL-33/ST2 signaling drives neutrophil influx to produce oxidative stress in gout
condition.
We then explored the mechanisms underlying how IL-33/ST2 promotes oxidative stress and ROS
production. Neutrophils played an important role in mediating gout pain [27]. Neutrophil exerts
respiratory burst that rapidly releases ROS products [28-30]. We found that myeloperoxidase
(MPO) activity, a quantitative measurement of neutrophil congregation [27], was significantly
increased in the inflamed ankles of MSU group mice, whereas MPO activity was significantly
attenuated in St2-/- mice (Figure 6A). Besides, injecting rIL-33 into the inflamed ankles of MSU
group mice resulted in further increase in MPO activity (Figure 6B). We further established the
mouse MSU air pouch gout model, which allows for convenient collection of adequate tissue
exudates for cell infiltration analysis. Cytopathological analysis indicated that MSU injection into
air pouches elicited an increase in the numbers of total cells, including neutrophils, lymphocytes
and monocytes, among which neutrophils are the predominant cell type infiltrated. The numbers
of total cells and neutrophils were both largely reduced in St2-/- mice (Figure S7).
We continued to examine whether neutrophil was the cellular source for oxidative stress and ROS
production in gout condition. We used fucoidin, a potent selectin inhibitor that
reduces the aggregation of neutrophils, to reduce neutrophil influx [27]. Fucoidin (20 mg/kg) was
applied intravenously twice into MSU-treated mice (Figure 6C). Fucoidin treatment almost
completely inhibited neutrophil influx into the ankle tissue after MSU injection, as indicated by a
change in MPO activity (Figure 6D). Moreover, fucoidin significantly reduced ROS production

13
and improved antioxidant enzyme activities in ankle tissues of MSU-treated mice (Figure 6E-H).
Fucoidin treatment also attenuated the ankle edema and mechanical allodynia of MSU-treated
mice (Figure 6I&J). These data suggest that IL-33/ST2 drives neutrophil influx and triggers
neutrophil-dependent ROS production, resulting in mechanical allodynia of gout model mice.
6. TRPA1 channel activity is increased in DRG neurons of gout model mice via ST2
dependent mechanism, resulting in enhanced nociceptive response to endogenous ROS
products.
Endogenous ROS products, including H2O2 and 4-HNE, activate TRPA1 in peripheral sensory
neurons to produce pain. Evidence suggests that MSU-induced gout arthritis increases TRPA1
expression in joint tissues [25]. Thereby, we continued to explore whether TRPA1 channel activity
was functionally enhanced in peripheral sensory neurons that innervate the ankles of MSU-treated
mice. Ipsilateral L3-5 DRG neurons were acutely harvested from MSU- or PBS (Veh)-treated
mice and loaded with Fura-2 for Ca2+ imaging (Figure 7A). The percentage of DRG neurons
responding to endogenous TRPA1 agonist H2O2 (500 nM) was significantly higher in MSU group
vs. Veh group (Figure 7A&B). In addition, the amplitude of Ca2+ responses elicited by H2O2 was
significantly higher in MSU group vs. Veh group (Figure 7C&D). We also observed that the
enhanced TRPA1 channel activity is reduced in DRG neurons from St2-/- mice (Figure 7A-D). The
in vitro results were further corroborated by in vivo behavioral tests. Injecting H2O2 (100 μg/site)
into ipsilateral hind paws of MSU group mice resulted in more robust nocifensive behavior than
Veh group mice (Figure 7E&F). The enhanced nocifensive response to H2O2 was eliminated by
co-injecting mice with TRPA1 specific antagonist HC-030031 (10 μg/site, Figure 7E&F).

14
Furthermore, H2O2 injection into MSU-treated ST2-/- mice resulted in significantly reduced
nociceptive response vs. MSU-treated WT mice (Figure 7E&F), a result consistent with the in
vitro Ca2+ imaging results. Therefore, both in vivo and in vitro data suggests that TRPA1 channel
activity is enhanced in DRG neurons of gout model mice via ST2 dependent mechanism, resulting
in exaggerated nociceptive response to endogenous ROS products during gout.
Discussion
In this study, we first screened the potential inflammatory cytokines or chemokines in the
inflamed ankle tissue from a mouse gout arthritis model via RNA-Seq. We found that IL-33 was
among the top up-regulated cytokines in the inflamed ankle. Neutralizing or genetic deleting IL-33
and its receptor ST2 significantly ameliorated pain hypersensitivities and inflammation in the
mouse gout model. IL-33 promoted neutrophil influx and triggered neutrophil-dependent ROS
production in the inflamed ankle, which activated TRPA1 channel in DRG neurons and produces
nociception. Meanwhile, TRPA1 channel activity was significantly enhanced in DRG neurons that
innervate the inflamed ankle, resulting in exaggerated nociceptive response to endogenous ROS
products. These data all suggest a pivotal role of IL-33/ST2 in mediating gout pain and
inflammation.
IL-33 can be released by several cell types, including keratinocytes, epithelial cells, fibroblasts
and macrophages, etc. upon trauma, infection or inflammation [16, 31, 32]. During gout,
macrophages are the cells that accumulate in the inflamed tissues to react to MSU deposition by
uptake of the crystals via phagocytosis [11]. We found that both macrophage cell line RAW264.7

15
and cultured mouse peritoneal macrophages react to MSU challenge by producing IL-33 in vitro.
In vivo depletion of macrophages with clodronate significantly reduced IL-33 protein upregulation
in ankle tissues of gout arthritis mice and further attenuated pain hypersensitivity and
inflammation. This is by far the first evidence showing that macrophage reacts with MSU to
produce IL-33. Therefore, our results suggest that macrophage may be among one of the cellular
sources for IL-33 overproduction during gout. However, the participation of other cell types, such
as fibroblasts, epithelial cells, etc. in IL-33 production under gout condition cannot be rule out and
needs to be further tested.
Gout is accompanied with oxidative stress that provokes ROS production in local inflamed tissues
[12]. H2O2 has been found to be significantly increased in joint tissues from the mouse gout model
and triggers hyperalgesia and inflammation via activating peripheral TRPA1 channel [13, 25]. Our
recent work identified that reducing ROS production by eucalyptol or ROS scavengers
significantly reduced pain and inflammation in the mouse gout model, demonstrating an important
role of ROS in mediating gout pain and inflammation [12]. However, the exact mechanism of how
oxidative stress is generated and modulated under gout condition is still not fully understood. In
our study, we found that St2-/- mice displayed significantly reduced oxidative stress, ROS
production and pain hypersensitivity in gout condition, whereas exogenously injected IL-33
further promoted oxidative stress, ROS production and exacerbated pain hypersensitivity in gout
condition via ST2 dependent mechanism. In vivo ROS imaging further indicated that ROS
production in gout is related with ST2. These results in all suggest a pivotal role of IL-33/ST2 in
modulating oxidative stress during gout.

16
Neutrophil influx into joint tissue is considered as the pathological hallmark of gout, which makes
important contributions to gout pathogenesis [27]. Here, we observed that St2-/- mice showed
much reduced neutrophil influx, whereas exogenously injected rIL-33 further promoted neutrophil
influx into the inflamed ankle. This result suggests that IL-33/ST2 is involved in mediating
neutrophil influx in gout. We found that St2-/- mice showed much reduced tissue contents of
CXCL1, CCL3 and IL-1β, which are neutrophil chemotactants crucial for neutrophil recruitment
[33]. This result indicates that CXCL1, CCL3 and IL-1β are produced via ST2 dependent
mechanism in gout condition. IL-33 can act via ST2 expressed in macrophages to produce CXCL1,
CCL3 and IL-1β during inflammation [33, 34]. We reason here that IL-33, after being released
from macrophages, may act in an autocrine manner to induce CXCL1, CCL3 and IL-1β
production via ST2 in macrophages during gout. These cytokines or chemokines may then induce
chemotaxis of neutrophils. Meanwhile, excellent previous studies have demonstrated in murine
models and humans, IL-33 can directly promote neutrophil influx by acting on ST2 receptors
expressed on neutrophils [33, 35]. Thus, IL-33 may directly promote neutrophil influx by acting
on ST2 expressed in neutrophils during gout via the paracrine mechanism. On the basis of these
findings, we propose that IL-33 may act through ST2 via above mentioned autocrine or paracrine
or both mechanisms to attract neutrophils in gout condition. This proposed mode of action is a
reminiscent of IL-33-mediated neutrophil migration in rheumatoid arthritis, in which both
autocrine and paracrine mechanisms as mentioned above are involved [33]. Nonetheless, the exact
cellular interactions that IL-33/ST2 mediated to promote neutrophil influx under gout condition
remain to be further studied.

17
A recent study by Shang et al. reported that IL-33 attenuates inflammation in a MSU-induced
mouse peritonitis model [15]. They observed IL-33 treatment significantly reduced neutrophil
influx in MSU-induced mouse peritonitis model. Moreover, IL-33 treatment reduced the
inflammatory cytokine IL-1β and IL-6 production, while promoted anti-inflammatory cytokine
IL-10, IL-5 and IL-13 production in peritoneal cavity gavage fluids. They further found that IL-33
recruited a subset of myeloid-derived suppressor cells, namely CD11b+Gr-1intF4/80+ cells,
to suppress MSU-induced IL-1β production in peritoneal lavage fluids. These results are in
contrast to our current observations. However, it is well established that IL-33 possesses unique
biological function, which is about its seemingly contradictory pro-inflammatory vs.
anti-inflammatory properties under different physical/pathological conditions [16]. For example,
in peritoneal cavity, IL-33 has been reported to promote the recruitment of IL-10-producing
regulatory B cells to attenuate mucosal inflammatory responses [36]. In contrast, in arthritis and
some other conditions, IL-33 serves as a pro-inflammatory cytokine and exacerbates inflammation
and pain via promoting the production of TNF-α, CXCL1, IL-1β and PGE2 through ST2 in plantar
skin tissues [37-39]. IL-33 also substantially potentiates substance P-induced TNF-α and IL-1β
production from mast cells to enhance inflammation [40, 41]. In addition, our recent work found
that IL-33 released by keratinocytes can activate peripheral sensory neurons via promoting Ca2+
influx through TRPA1/TRPV1 channels in ST2 dependent mechanism, resulting in potentiation of
skin inflammation and pruritus in a mouse allergic contact dermatitis model [20]. The mouse gout
model we used here is totally different from Shang et al., in which MSU was intra-articularly
injected into the ankle of mice for one single time, whereas Shang et al. repetitively injected MSU

18
into the peritoneal cavity for a total of 4 times during 4 days’ period. It is believed that the
biological effects of IL-33 is highly tissue specific and influenced by the microenvironment where
it is produced [16]. Given the fact that ankle cavity possesses totally different morphological
structure, cell distributions and immune responses vs. peritoneal cavity, therefore, the different
observations we had with Shang et al., may likely be attributed to different animal models we used.
Nonetheless, the immunological mechanisms underlying the complex dichotomous functions of
IL-33 still need to be further investigated.
TRPA1 is a target of endogenous ROS and lipid perioxidative products, such as OxPAPC, 4-HNE
and H2O2 [42-45]. TRPA1 is expressed by a subpopulation of peptidergic nociceptors and
contributes to pain and neurogenic inflammation [43]. Previous studies identified H2O2 level is
significantly increased in the inflamed ankle tissue of gout model mice [25]. Our study further
identified that, in addition to H2O2, the lipid peroxidation product 4-HNE was also increased in the
inflamed ankle tissues of gout model mice. It is reported that TRPA1 expression is upregulated in
the inflamed joint tissues of gout model mice [25]. We further demonstrated that TRPA1 channel
activity is significantly enhanced in DRG neurons that innervate the inflamed ankle from gout
model mice. This finding was further corroborated by the enhanced nocifensive response to the
endogenous TRPA1 agonist H2O2 exhibited by gout model mice. We also observed that DRG
neurons from St2-/- mice showed much reduced TRPA1 activity upon H2O2 challenge. Certain
inflammatory cytokines, such as IL-1β and IL-6 can promote TRPA1 expression in DRG neurons
or chondrocytes [46, 47]. IL-1β and IL-6 were both upregulated in the inflamed ankle tissue of
gout model mice but much reduced in St2-/- mice. Therefore, the enhanced TRPA1 channel

19
functional activity we observed may be due to channel expression upregulation mediated by IL-1β,
IL-6 or other inflammatory mediators released during gout.
Conclusions
In all, our study demonstrated a previous unidentified role of IL-33/ST2 in mediating pain
hypersensitivities and inflammation in a mouse gout model through promoting
neutrophil-dependent ROS production and TRPA1 channel activation. Our study suggests that
targeting IL-33/ST2 signaling may represent a novel therapeutic approach to ameliorate pain and
inflammation in gout.
Methods
Animals
Male C57BL/6j or BALB/c mice (8-10 weeks; 20-25 g) were purchased from Shanghai
Laboratory Animal Center, Chinese Academy of Sciences. St2 knockout (St2−/−) mice in the
background of BALB/c were kindly provided by Dr. Andrew McKenzie at the MRC Laboratory of
Molecular Biology, Cambridge, United Kingdom. Il-33 knockout (Il-33−/−) mice in the
background of C57BL/6j were kindly provided by Dr. Hiroshi Kiyonari at the Laboratory for
Animal Resources and Genetic Engineering, Center for Developmental Biology, Institute of
Physical and Chemical Research, Kobe, Japan. All animals were housed in the Laboratory Animal
Center of Zhejiang Chinese Medical University accredited by the Association for Assessment and
Accreditation of Laboratory Animal Care (AAALAC) under standard environmental conditions
(12 h light–dark cycle and 24 °C) with access to food and water provided ad libitum. The mice

20
were randomly allocated and five mice were housed per cage. For group size estimation, we make
sure that the data subjected to statistical analysis in our study has a group size (n) ≥ 5, according to
our previous experience and studies using similar experimental protocols. We only included male
mice in our study to circumvent hormonal female cycle possible interferences in behavioral
analysis. Besides, gout has been considered as a male predominant disease and it occurs much
more frequently in men than women [48].
MSU-induced gout arthritis model establishment
Gout arthritis was induced by intra-articularly (i. a.) injection of MSU crystals (0.5 mg) suspended
in 20 μl endotoxin-free phosphate buffered saline (PBS) into the tibio-tarsal joint (ankle) of mice
under isoflurane anesthesia as we described before [12]. Control group mice received an i. a.
injection of 20 µL sterile PBS. A successful gout arthritis model establishment was judged by
obvious swelling and mechanical hyperalgesia 2 h after MSU injection [13].
Evaluation of ankle joint mechanical pain hypersensitivity
Mice were individually placed in transparent Plexiglas chambers on an elevated mesh floor and
were habituated for 30 min before test. The mechanical hyperalgesia was determined using a
series of von Frey filaments (0.04 to 4 g) applied perpendicularly to the heel area of the hind paw
in ascending order beginning with the finest fiber. The minimum force that caused the mouse to
withdraw its hind paw away from the filament was considered as the withdrawal threshold. For
each mouse, a von Frey hair was applied 5 times at 10 s intervals. The threshold was determined
when paw withdrawal was observed in more than three out of five applications as we previously

21
described [49]. The behavior tests are conducted by an experimenter blinded to experimental
conditions.
RNA-Seq and data processing
24 h post-injection of MSU or vehicle, mice were euthanized. The injected ankles were then
collected, diced and stored in RNAlater (Thermal Fisher Scientific, Waltham, MA, USA). Total
RNA from vehicle and MSU group was extracted using Trizol reagent (Thermal Fisher Scientific,
Waltham, MA, USA). RNA quality and purity were validated by TapeStation (Agilent,
Santa Clara, CA, USA) and NanoDrop (Thermo Fisher Scientific, Waltham, MA, USA). Only
RNA samples showing RNA Integrity Number≥8.0 and A260/230≥1.5 were used for RNA-Seq.
The samples were sequenced by BGISEQ-500 from BGI Group (Shenzhen, China). Raw
sequencing reads were aligned to mouse genome (mm10). Differential expression analyses were
performed with R and Bioconductor packages of edgeR and limma voom as reported in our
previous studies [50, 51]. The threshold required for the genes to be considered significantly
changed was as follows: q-value≤0.001 and absolute value of |log2 (Fold Change)| ≥1.0.
Myeloperoxidase (MPO) activity measurement
Neutrophil recruitment in ankle joint was evaluated via quantification of the enzyme MPO activity
using a commercial MPO detection kit (Nanjing Jiancheng Bioengineering Institute, Nanjing,
China) as we described [12]. Briefly, mice were terminally anesthetized and the ankle joint was
homogenized and centrifuged at 10, 000 rpm at 4 ℃ for 15 min. 10 µL of the supernatant was
transferred into PBS (pH 6.0) containing 0.17 mg/ml 3, 3’, 5, 5’-tetramethylbenzidine and 0.0005%

22
H2O2. MPO catalyzed the redox reaction of H2O2 and 3, 3’, 5, 5’-tetramethylbenzidine and
produced yellow-colored compounds, through whose absorbance at 460 nm was determined. MPO
activity was calculated and expressed as U/mg protein. One unit of MPO activity was defined as
the quantity of enzyme that degraded 1 μmol H2O2 at 37 °C per g wet tissue.
Air pouch model
Mice were anesthetized with isoflurane. The back skin was shaved and 3 ml of sterile air was
subcutaneously injected (s.c.) into the back to establish air pouch as described [52]. 3 days after
the first injection, an additional 3 ml sterile air was injected into the pouch again. 3 days later, 3
mg of MSU crystals in 1 ml PBS, or 1 ml of PBS alone, was injected into the air pouches,
respectively. 6 h after injection, mice were euthanized and exudates were collected and
centrifuged at 500 g for 5 min at room temperature. Total cells were then counted with a
hemocytometer and spun onto cytoslides and stained with Diff-Quick reagent. Differential cell
counts were achieved by microscopic counting using standard morphological and staining criteria
as we previously described [53] .
Cell culture
Raw 264.7 cells: Raw 264.7 macrophage cell line was purchased from Shanghai Academy of Life
Sciences (Shanghai, China) and cultured in DMEM (Hycolon, USA) supplemented with 10% fetal
bovine serum (FBS, BI, Israel), 100 units/mL penicillin and 100 μg/mL streptomycin at 37˚C in a
humidified atmosphere of 5% CO2 and 95% air. DRG neurons: Mice were sacrificed 24 h after
MSU injection. Ipsilateral L3-5 dorsal root ganglia (DRGs) were harvested and dissociated using

23
collagenase type 1 and dispase (Gibco, Thermo Fisher Scintific, USA) as described previously [54,
55]. DRG neurons were cultured in DMEM plus 10% FBS, 100 units/mL penicillin and 100
μg/mL streptomycin on round coverslips coated with poly-D-lysine (Sigma, MO, USA) and
mouse laminin (Invitrogen, CA, USA) in 24-well chamber.
Ca2+ imaging
DRG neurons were used 4 h after dissociation. Cells were loaded with Fura 2-AM (10 μM,
Invitrogen) for 45 min in a loading buffer containing: NaCl 140, KCl 5, CaCl2 2, MgCl2 2, HEPES
10 (pH 7.4 adjusted with NaOH). Cells were subsequently washed 3 times and imaged in the
loading buffer. Ratiometric Ca2+ imaging was performed on a Nikon ECLIPSE Ti-S (Japan)
microscope with a Polychrome V monochromator (Till Photonics, USA) and an Orca Flash 4.0
CCD camera (Hamamatsu, Japan). Images were captured and processed with MetaFluor software
(Molecular Devices, CA, USA). Ratiometric images were obtained with exposures of 0.5 ms at
340 nm and 0.3 ms at 380 nm excitation wavelengths. Representative Ca2+ imaging images were
generated using ImageJ software. A cell was considered responsive if the peak Ca2+ response is
above 20% of the baseline according to our previous publications [56, 57].
In vivo ROS imaging
24 h after MSU injection into the right ankle, mice were injected (i.v.) with the fluorescent ROS
indicator dye L-012 (Tocris, USA, 25 mg/kg), as described previously [58]. Mice were
anesthetized with isoflurane, then placed on the stage of an IVIS Lumina LT in vivo imaging
system (PerkinElmer, Waltham, MA, USA) and the fluorescence imaging was performed 5 min

24
post injection. The luminescence signal intensities were quantified with Living Image software
(PerkinElmer, USA).
Ethnic statement
This study was approved by the Laboratory Animal Management and Welfare Ethical Review
Committee of Zhejiang Chinese Medical University (Permission Number: ZSLL-2017-183).
Statistical analysis
Statistical analysis was conducted using SPSS 19.0 (IBM Corp., Armonk, NY, USA). Results
were expressed as mean ± SEM. Student’s t-test was used for comparisons between two groups.
One-way or two-way ANOVA followed by Tukey’s post hoc test was used for comparison among
groups≥ 3. Comparison is considered significantly different if p < 0.05.
Author contributions
CY, BL (Boyu Liu), YL (Yuanyuan Li), XL, JW, RC, YT, QS, PW, XS, YL (Yi Liang) conducted
the experiments, collected and analyzed the data; HZ and WM provided reagents. JF and BL (Boyi
Liu) designed and supervised the study. BL (Boyi Liu) wrote the manuscript.
Acknowledgment
This project was supported by National Natural Science Foundation of China (81873365),
Zhejiang Provincial Natural Science Funds for Distinguished Young Scholars (LR17H270001),
National Natural Science Foundation of China (81603676) and research funds from Zhejiang

25
Chinese Medical University (Q2019J01) to B.L. (Boyi Liu). We thank Academy of Chinese
Medical Sciences, Zhejiang Chinese Medical University for the professional technical support to
this work.
References
1. Rees F, Hui M, Doherty M. Optimizing current treatment of gout. Nat Rev Rheumatol. 2014; 10: 271-83. 2. Roddy E, Doherty M. Epidemiology of gout. Arthritis Res Ther. 2010; 12: 223. 3. Terkeltaub R. Update on gout: new therapeutic strategies and options. Nat Rev Rheumatol. 2010; 6: 30-8. 4. Richette P, Doherty M, Pascual E, Barskova V, Becce F, Castaneda-Sanabria J, et al. 2016 updated EULAR evidence-based recommendations for the management of gout. Ann Rheum Dis. 2017; 76: 29-42. 5. Dalbeth N, Choi HK, Joosten LAB, Khanna PP, Matsuo H, Perez-Ruiz F, et al. Gout. Nat Rev Dis Primers. 2019; 5: 69. 6. Chai W, Tai Y, Shao X, Liang Y, Zheng GQ, Wang P, et al. Electroacupuncture Alleviates Pain Responses and Inflammation in a Rat Model of Acute Gout Arthritis. Evid Based Complement Alternat Med. 2018; 2018: 2598975. 7. So AK, Martinon F. Inflammation in gout: mechanisms and therapeutic targets. Nat Rev Rheumatol. 2017; 13: 639-47. 8. Narang RK, Dalbeth N. Management of complex gout in clinical practice: Update on therapeutic approaches. Best Pract Res Clin Rheumatol. 2018; 32: 813-34. 9. Bardin T, van de Laar MA. The Way Forward: Practical Clinical Considerations for the Use of Canakinumab in Patients With Difficult-to-Treat Gouty Arthritis. Joint Bone Spine. 2015; 82 Suppl 1: eS30-2. 10. Mei J, Zhou F, Qiao H, Li H, Tang T. Nerve modulation therapy in gouty arthritis: targeting increased sFRP2 expression in dorsal root ganglion regulates macrophage polarization and alleviates endothelial damage. Theranostics. 2019; 9: 3707-22. 11. Nakayama M. Macrophage Recognition of Crystals and Nanoparticles. Front Immunol. 2018; 9: 103. 12. Yin C, Liu B, Wang P, Li X, Li Y, Zheng X, et al. Eucalyptol alleviates inflammation and pain responses in a mouse model of gout arthritis. Br J Pharmacol. 2020; 177: 2042-57. 13. Trevisan G, Hoffmeister C, Rossato MF, Oliveira SM, Silva MA, Silva CR, et al. TRPA1 receptor stimulation by hydrogen peroxide is critical to trigger hyperalgesia and inflammation in a model of acute gout. Free Radic Biol Med. 2014; 72: 200-9. 14. Duan L, Huang Y, Su Q, Lin Q, Liu W, Luo J, et al. Potential of IL-33 for Preventing the Kidney Injury via Regulating the Lipid Metabolism in Gout Patients. J Diabetes Res. 2016; 2016: 1028401. 15. Shang K, Wei Y, Su Q, Yu B, Tao Y, He Y, et al. IL-33 Ameliorates the Development of MSU-Induced Inflammation Through Expanding MDSCs-Like Cells. Front Endocrinol (Lausanne). 2019; 10: 36.

26
16. Hardman C, Ogg G. Interleukin-33, friend and foe in type-2 immune responses. Curr Opin Immunol. 2016; 42: 16-24. 17. Alexander SPH, Fabbro D, Kelly E, Mathie A, Peters JA, Veale EL, et al. THE CONCISE GUIDE TO PHARMACOLOGY 2019/20: Catalytic receptors. Br J Pharmacol. 2019; 176 Suppl 1: S247-S96. 18. Alvarez P, Bogen O, Levine JD. Nociceptor Interleukin 33 Receptor/ST2 Signaling in Vibration-Induced Muscle Pain in the Rat. J Pain. 2020; 21: 506-12. 19. Fattori V, Hohmann MSN, Rossaneis AC, Manchope MF, Alves-Filho JC, Cunha TM, et al. Targeting IL-33/ST2 signaling: regulation of immune function and analgesia. Expert Opin Ther Targets. 2017; 21: 1141-52. 20. Liu B, Tai Y, Achanta S, Kaelberer MM, Caceres AI, Shao X, et al. IL-33/ST2 signaling excites sensory neurons and mediates itch response in a mouse model of poison ivy contact allergy. Proc Natl Acad Sci U S A. 2016; 113: E7572-E9. 21. Liu B, Jordt SE. Cooling the Itch via TRPM8. J Invest Dermatol. 2018; 138: 1254-6. 22. Ohno T, Oboki K, Kajiwara N, Morii E, Aozasa K, Flavell RA, et al. Caspase-1, caspase-8, and calpain are dispensable for IL-33 release by macrophages. J Immunol. 2009; 183: 7890-7. 23. Hiraide S, Yanagawa Y, Iizuka K. Tranilast inhibits interleukin-33 production by macrophages. Eur J Pharmacol. 2018; 818: 235-40. 24. Schmitz J, Owyang A, Oldham E, Song Y, Murphy E, McClanahan TK, et al. IL-33, an interleukin-1-like cytokine that signals via the IL-1 receptor-related protein ST2 and induces T helper type 2-associated cytokines. Immunity. 2005; 23: 479-90. 25. Trevisan G, Hoffmeister C, Rossato MF, Oliveira SM, Silva MA, Ineu RP, et al. Transient receptor potential ankyrin 1 receptor stimulation by hydrogen peroxide is critical to trigger pain during monosodium urate-induced inflammation in rodents. Arthritis Rheum. 2013; 65: 2984-95. 26. Helyes Z, Tekus V, Szentes N, Pohoczky K, Botz B, Kiss T, et al. Transfer of complex regional pain syndrome to mice via human autoantibodies is mediated by interleukin-1-induced mechanisms. Proc Natl Acad Sci U S A. 2019; 116: 13067-76. 27. Amaral FA, Costa VV, Tavares LD, Sachs D, Coelho FM, Fagundes CT, et al. NLRP3 inflammasome-mediated neutrophil recruitment and hypernociception depend on leukotriene B(4) in a murine model of gout. Arthritis Rheum. 2012; 64: 474-84. 28. Amulic B, Cazalet C, Hayes GL, Metzler KD, Zychlinsky A. Neutrophil function: from mechanisms to disease. Annu Rev Immunol. 2012; 30: 459-89. 29. Winterbourn CC, Kettle AJ, Hampton MB. Reactive Oxygen Species and Neutrophil Function. Annu Rev Biochem. 2016; 85: 765-92. 30. Khaw YM, Cunningham C, Tierney A, Sivaguru M, Inoue M. Neutrophil-selective deletion of Cxcr2 protects against CNS neurodegeneration in a mouse model of multiple sclerosis. J Neuroinflammation. 2020; 17: 49. 31. Liew FY, Girard JP, Turnquist HR. Interleukin-33 in health and disease. Nat Rev Immunol. 2016; 16: 676-89. 32. Mariotte A, De Cauwer A, Po C, Abou-Faycal C, Pichot A, Paul N, et al. A mouse model of MSU-induced acute inflammation in vivo suggests imiquimod-dependent targeting of Il-1beta as relevant therapy for gout patients. Theranostics. 2020; 10: 2158-71. 33. Verri WA, Jr., Souto FO, Vieira SM, Almeida SC, Fukada SY, Xu D, et al. IL-33 induces neutrophil migration in rheumatoid arthritis and is a target of anti-TNF therapy. Ann Rheum Dis. 2010; 69: 1697-703.
27
34. Tran VG, Cho HR, Kwon B. IL-33 Priming Enhances Peritoneal Macrophage Activity in Response to Candida albicans. Immune Netw. 2014; 14: 201-6. 35. Chen YL, Gutowska-Owsiak D, Hardman CS, Westmoreland M, MacKenzie T, Cifuentes L, et al. Proof-of-concept clinical trial of etokimab shows a key role for IL-33 in atopic dermatitis pathogenesis. Sci Transl Med. 2019; 11. 36. Sattler S, Ling GS, Xu D, Hussaarts L, Romaine A, Zhao H, et al. IL-10-producing regulatory B cells induced by IL-33 (Breg(IL-33)) effectively attenuate mucosal inflammatory responses in the gut. J Autoimmun. 2014; 50: 107-22. 37. Fattori V, Borghi SM, Verri WA, Jr. IL-33/ST2 signaling boosts inflammation and pain. Proc Natl Acad Sci U S A. 2017; 114: E10034-E5. 38. Zarpelon AC, Cunha TM, Alves-Filho JC, Pinto LG, Ferreira SH, McInnes IB, et al. IL-33/ST2 signalling contributes to carrageenin-induced innate inflammation and inflammatory pain: role of cytokines, endothelin-1 and prostaglandin E2. Br J Pharmacol. 2013; 169: 90-101. 39. Verri WA, Jr., Guerrero AT, Fukada SY, Valerio DA, Cunha TM, Xu D, et al. IL-33 mediates antigen-induced cutaneous and articular hypernociception in mice. Proc Natl Acad Sci U S A. 2008; 105: 2723-8. 40. Taracanova A, Tsilioni I, Conti P, Norwitz ER, Leeman SE, Theoharides TC. Substance P and IL-33 administered together stimulate a marked secretion of IL-1beta from human mast cells, inhibited by methoxyluteolin. Proc Natl Acad Sci U S A. 2018; 115: E9381-E90. 41. Taracanova A, Alevizos M, Karagkouni A, Weng Z, Norwitz E, Conti P, et al. SP and IL-33 together markedly enhance TNF synthesis and secretion from human mast cells mediated by the interaction of their receptors. Proc Natl Acad Sci U S A. 2017; 114: E4002-E9. 42. Liu B, Tai Y, Caceres AI, Achanta S, Balakrishna S, Shao X, et al. Oxidized Phospholipid OxPAPC Activates TRPA1 and Contributes to Chronic Inflammatory Pain in Mice. PLoS One. 2016; 11: e0165200. 43. Bautista DM, Pellegrino M, Tsunozaki M. TRPA1: A gatekeeper for inflammation. Annu Rev Physiol. 2013; 75: 181-200. 44. Alexander SPH, Mathie A, Peters JA, Veale EL, Striessnig J, Kelly E, et al. THE CONCISE GUIDE TO PHARMACOLOGY 2019/20: Ion channels. Br J Pharmacol. 2019; 176 Suppl 1: S142-S228. 45. Cheng RX, Feng Y, Liu D, Wang ZH, Zhang JT, Chen LH, et al. The role of Nav1.7 and methylglyoxal-mediated activation of TRPA1 in itch and hypoalgesia in a murine model of type 1 diabetes. Theranostics. 2019; 9: 4287-307. 46. Nummenmaa E, Hamalainen M, Moilanen LJ, Paukkeri EL, Nieminen RM, Moilanen T, et al. Transient receptor potential ankyrin 1 (TRPA1) is functionally expressed in primary human osteoarthritic chondrocytes. Arthritis Res Ther. 2016; 18: 185. 47. Liu D, Sun M, Xu D, Ma X, Gao D, Yu H. Inhibition of TRPA1 and IL-6 signal alleviates neuropathic pain following chemotherapeutic bortezomib. Physiol Res. 2019; 68: 845-55. 48. Harrold LR, Yood RA, Mikuls TR, Andrade SE, Davis J, Fuller J, et al. Sex differences in gout epidemiology: evaluation and treatment. Ann Rheum Dis. 2006; 65: 1368-72. 49. Liu B, Fan L, Balakrishna S, Sui A, Morris JB, Jordt SE. TRPM8 is the principal mediator of menthol-induced analgesia of acute and inflammatory pain. Pain. 2013; 154: 2169-77. 50. Yin C, Hu Q, Liu B, Tai Y, Zheng X, Li Y, et al. Transcriptome profiling of dorsal root ganglia in a rat model of complex regional pain syndrome type-I reveals potential mechanisms involved in pain. J Pain Res. 2019; 12: 1201-16.

28
51. Chen R, Yin C, Hu Q, Liu B, Tai Y, Zheng X, et al. Expression profiling of spinal cord dorsal horn in a rat model of complex regional pain syndrome type-I uncovers potential mechanisms mediating pain and neuroinflammation responses. J Neuroinflammation. 2020; 17: 162. 52. Reber LL, Starkl P, Balbino B, Sibilano R, Gaudenzio N, Rogalla S, et al. The tyrosine kinase inhibitor imatinib mesylate suppresses uric acid crystal-induced acute gouty arthritis in mice. PLoS One. 2017; 12: e0185704. 53. Caceres AI, Liu B, Jabba SV, Achanta S, Morris JB, Jordt SE. Transient Receptor Potential Cation Channel Subfamily M Member 8 channels mediate the anti-inflammatory effects of eucalyptol. Br J Pharmacol. 2017. 54. Willis DN, Liu B, Ha MA, Jordt SE, Morris JB. Menthol attenuates respiratory irritation responses to multiple cigarette smoke irritants. FASEB J. 2011; 25: 4434-44. 55. Zheng X, Tai Y, He D, Liu B, Wang C, Shao X, et al. ETAR and protein kinase A pathway mediate ET-1 sensitization of TRPA1 channel: A molecular mechanism of ET-1-induced mechanical hyperalgesia. Mol Pain. 2019; 15: 1744806919842473. 56. Tai Y, Wang C, Wang Z, Liang Y, Du J, He D, et al. Involvement of Transient Receptor Potential Cation Channel Member A1 activation in the irritation and pain response elicited by skin-lightening reagent hydroquinone. Sci Rep. 2017; 7: 7532. 57. Li Y, Yin C, Li X, Liu B, Wang J, Zheng X, et al. Electroacupuncture Alleviates Paclitaxel-Induced Peripheral Neuropathic Pain in Rats via Suppressing TLR4 Signaling and TRPV1 Upregulation in Sensory Neurons. Int J Mol Sci. 2019; 20. 58. Kielland A, Blom T, Nandakumar KS, Holmdahl R, Blomhoff R, Carlsen H. In vivo imaging of reactive oxygen and nitrogen species in inflammation using the luminescent probe L-012. Free Radic Biol Med. 2009; 47: 760-6.
Figure legend Figure 1 RNA-Seq expression analysis of mRNA changes in inflamed ankle tissues of MSU-induced mouse gout model. (A) Representative photos showing mouse ankle injected with PBS (Veh group) or MSU (MSU group). The pictures were taken 24 h after injection. (B) Time course of the % increase in ankle diameter after model establishment. n = 6 mice/group, **p<0.01 vs. Veh group. (C) Representative photos of ankle H&E staining from Veh and MSU group. The right panels show enlarged area as indicated in the left. (D) Time course of PWT changes in the right hind paw after model establishment. n = 6 mice/group, *p<0.05 and **p<0.01 vs. Veh group. (E) Heat map illustration of the DEGs derived from MSU group vs. Veh group. n = 3 mice/group. (F) Volcano plot showing gene expression profiles in MSU group vs. Veh group. Red and blue spots indicate up- and down-regulated DEGs, respectively, whereas grey spots indicate non-DEGs. (G) Top 10 most highly up-regulated inflammatory cytokines or chemokines in MSU group vs. Veh group. Figure 2 The expressions of IL-33 and ST2 proteins are up-regulated in inflamed ankle tissues of mouse gout model. (A-C) qPCR analysis of Il-33, St2 and Il-1RAcP gene expression

29
fold changes in MSU group vs. Veh group (PBS). Ankle tissues were harvested 24 h after model establishment. n = 6-8 mice/group. (D) ELISA result of IL-33 protein changes in MSU group vs. Veh group. n = 5 mice/group. **p<0.01, NS: no significance. (E) IL-33 protein expression in ankle tissues examined by Western blotting at 0, 8, 24 and 48 h time points after MSU or Veh group establishment. Upper panel shows representative photos of IL-33 and β-actin protein expression. Lower panel indicates the summarized IL-33 expression normalized to β-actin in MSU and Veh group. n = 6 mice/group. (F) ST2 protein expression in ankle tissues examined by Western blotting at 0, 8, 24 and 48 h time points after MSU or Veh group establishment. Upper panel shows representative photos of ST2 and β-actin protein expression. Lower panel indicates the summarized ST2 expression normalized to β-actin in MSU and Veh group. n = 6 mice/group. *p<0.05 and **p<0.01 vs. 0 h time point, NS: no significance vs. 0 h time point. Student’s t test was used for statistical analysis in (A-D). One-way ANOVA followed by Tukey post hoc test was used for statistical analysis in panels (E-F). Figure 3 IL-33/ST2 is involved in mediating pain hypersensitivity and inflammatory response of the mouse gout model. (A) Schematic picture depicting the time points of IL-33 neutralizing antibody (IL-33 Ab) or isotype control IgG application (i.p.) and behavioral/ankle edema tests. MSU or PBS (Veh) was injected into the ankle (i.a.) at 0 h time point. (B&C) The comparison of % increase of ankle diameter (B) or PWT (C) 1, 4, 8 and 24 h after IL-33 Ab or isotype control IgG application. (D) Time course showing PWT changes in WT and Il33-/- mice after MSU or PBS injection. (E) Summary of the normalized area under the curve as in (D), in which WT+Veh group was taken as 100%. n = 6 mice/group. (F) Time course showing % increase in ankle diameter in WT and Il33-/- mice after MSU or PBS injection. (G) Summary of the normalized area under the curve as in (F), in which WT+Veh group was taken as 100%. n = 7 mice/group. (H) Time course showing PWT changes in WT and St2-/- mice after MSU or PBS injection. (I) Summary of the normalized area under the curve as in (H), in which WT+Veh group was taken as 100%. n = 7 mice/group. (J) Time course showing % increase in ankle diameter in WT and St2-/- mice after MSU or PBS injection. (K) Summary of the normalized area under the curve as in (J), in which WT+Veh group was taken as 100%. n = 7 mice/group. *p<0.05 and **p<0.01 vs. WT+Veh group. #p<0.05 and ##p<0.01 vs. WT+MSU group. One-way ANOVA followed by Tukey post hoc test was used for statistical analysis in panels (E, G, I&K). Two-way ANOVA followed by Tukey post hoc test was used for statistical analysis in panels (B, C, D, F, H&J). Figure 4 Macrophage is a cellular mechanism for IL-33 overproduction during gout. (A) Upper panel: Schematic protocol illustrating time points for MSU/LPS incubation and RAW264.7 cell harvest. Lower panel: Expression of Il-33 gene in RAW264.7 cells after vehicle (Veh, PBS), MSU (0.5 or 1 mg/ml) or LPS (1 μg/ml) incubation by qPCR. (B) IL-33 protein expression changes in RAW264.7 cells after vehicle (PBS), MSU (0.5 mg/ml) or LPS (1 μg/ml) incubation by ELISA. (C) IL-33 protein expression changes in macrophages after vehicle, MSU (0.5 or 1 mg/ml) or LPS (1 μg/ml) incubation by ELISA. n = 5-6 replicates/group. (D) Protocol illustrating in vivo depleting macrophages in mice via treating with clodronate-laden liposome (i.p.). Liposome (Lipo) was used as vehicle control. (E) Immunofluorescence staining of periarticular tissues using F4/80 to detect macrophages. Right panels show enlarged fields depicted as white

30
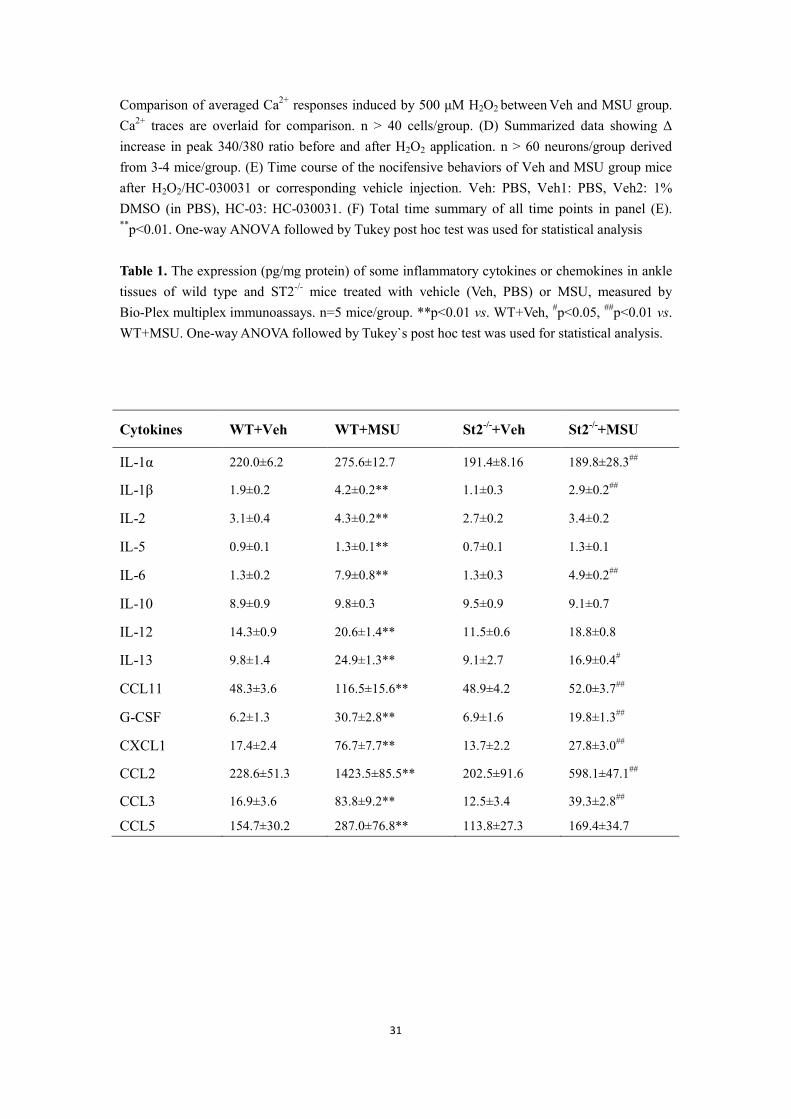
boxes on the left. (F) F4/80 positively stained cell counts per observation field. n = 4 mice/group. (G) Western blot of IL-33 protein expression in ankle tissues after macrophage depletion. Upper panel: representative images of IL-33 and β-actin protein expression in Veh+Lipo, MSU+Lipo and MSU+Clodro groups. Lower panel: summarized IL-33 expression normalized to β-actin. (H) Time course of the % increase in ankle diameter after MSU injection. (I) Summary of the normalized AUC as in (H), in which Veh+Lipo group was taken as 100%. (J) Time course of PWT changes after MSU injection. (K) Summary of the normalized AUC as in (J), in which Veh+Lipo group was taken as 100%. n = 7 mice/group. *p<0.05 and **p<0.01 vs. Veh+Lipo group. #p<0.05 and ##p<0.01 vs. MSU+Lipo group. NS: no significance. One-way ANOVA followed by Tukey post hoc test was used for statistical analysis in panels (A, B, C, F, G, I&K). Two-way ANOVA followed by Tukey post hoc test was used for statistical analysis in panels (H&J). Figure 5 IL-33/ST2 participates in oxidative stress modulation and promotes ROS production in gout condition. (A-D) Summarized data showing H2O2 content (A), MDA content (B), SOD activity (C) and GSH-Px activity (D) determined in WT or ST2-/- mice ankle tissues 24 h after vehicle (Veh, PBS) or MSU injection. (E) 4-HNE and β-actin expression in mice ankle tissues determined by Western blot. (F) Summarized data of 4-HNE expression normalized to β-actin. (G) In vivo ROS imaging showing ROS contents in the ankle area using L-012 in different groups. (H) Summarized total fluorescence flux of L-012 in the ankle area. (I-J) SOD activity (I) and GSH-Px activity (J) in ankle tissues 4 h after BSA or rIL-33 (300 ng) injection. (K) MDA level in ankle tissues 4 h after BSA or rIL-33 injection. ST2 neutralizing antibody (50 μg) or isotype IgG was co-injected with rIL-33. (L) MDA level in ankle tissues 4 h after BSA or rIL-33 injection in WT or St2-/- mice. *p<0.05 and **p<0.01. NS: no significance. One-way ANOVA followed by Tukey post hoc test was used for statistical analysis.
Figure 6 IL-33/ST2 promotes neutrophil influx into inflamed tissue to generate oxidative stress in gout condition. (A) MPO activity determined in WT or ST2-/- mice ankle tissues 24 h after vehicle (Veh, PBS) or MSU injection. n = 5-9 mice/group. (B) MPO activity determined in ankle tissue of gout model mice after exogenously injection with BSA or rIL-33. (C) Schematic protocol for blocking neutrophil influx via fucoidine (20 mg/kg in 20 μl injecting volume, i.v.). (D-H) MPO activity (D), H2O2 (E), SOD activity (F), GSH-Px activity (G) and MDA content (H) measured in fucoidine- or vehicle (PBS)-treated gout model mice. n = 5-9 mice/group. (I) % increase in ankle diameter of gout model mice 1 or 3 h after fucoidine or PBS treatment. (J) PWT of gout model mice 1 or 3 h after fucoidine or PBS treatment. n = 5-8 mice/group. *p<0.05 and **p<0.01. One-way ANOVA followed by Tukey post hoc test was used for statistical analysis. Figure 7 TRPA1 channel activity is increased in DRG neurons of gout model mice via ST2 dependent manner, which enhances the nociceptive response to endogenous ROS products in gout condition. (A) Pseudo color images from Fura-2-based ratiometric Ca2+ imaging indicating the Ca2+ responses from ipsilateral L3-5 DRG neurons in response to the endogenous TRPA1 agonist H2O2 (500 μM) in Veh (PBS) or MSU group mice. 40 mM KCl was perfused at the end of each recording to determine all live DRG neurons in observation field. (B) Summarized % of H2O2 positive responding DRG neurons in each observation field from Veh or MSU group of mice. n = 6-7 tests/group. Each group contains 150–200 neurons derived from 3–4 mice. (C)
31
Comparison of averaged Ca2+ responses induced by 500 μM H2O2 between Veh and MSU group. Ca2+ traces are overlaid for comparison. n > 40 cells/group. (D) Summarized data showing Δ increase in peak 340/380 ratio before and after H2O2 application. n > 60 neurons/group derived from 3-4 mice/group. (E) Time course of the nocifensive behaviors of Veh and MSU group mice after H2O2/HC-030031 or corresponding vehicle injection. Veh: PBS, Veh1: PBS, Veh2: 1% DMSO (in PBS), HC-03: HC-030031. (F) Total time summary of all time points in panel (E). **p<0.01. One-way ANOVA followed by Tukey post hoc test was used for statistical analysis Table 1. The expression (pg/mg protein) of some inflammatory cytokines or chemokines in ankle tissues of wild type and ST2-/- mice treated with vehicle (Veh, PBS) or MSU, measured by Bio-Plex multiplex immunoassays. n=5 mice/group. **p<0.01 vs. WT+Veh, #p<0.05, ##p<0.01 vs. WT+MSU. One-way ANOVA followed by Tukey`s post hoc test was used for statistical analysis.
Cytokines WT+Veh WT+MSU St2-/-+Veh St2-/-+MSU
IL-1α 220.0±6.2 275.6±12.7 191.4±8.16 189.8±28.3##
IL-1β 1.9±0.2 4.2±0.2** 1.1±0.3 2.9±0.2##
IL-2 3.1±0.4 4.3±0.2** 2.7±0.2 3.4±0.2
IL-5 0.9±0.1 1.3±0.1** 0.7±0.1 1.3±0.1
IL-6 1.3±0.2 7.9±0.8** 1.3±0.3 4.9±0.2##
IL-10 8.9±0.9 9.8±0.3 9.5±0.9 9.1±0.7
IL-12 14.3±0.9 20.6±1.4** 11.5±0.6 18.8±0.8
IL-13 9.8±1.4 24.9±1.3** 9.1±2.7 16.9±0.4#
CCL11 48.3±3.6 116.5±15.6** 48.9±4.2 52.0±3.7##
G-CSF 6.2±1.3 30.7±2.8** 6.9±1.6 19.8±1.3##
CXCL1 17.4±2.4 76.7±7.7** 13.7±2.2 27.8±3.0##
CCL2 228.6±51.3 1423.5±85.5** 202.5±91.6 598.1±47.1##
CCL3 16.9±3.6 83.8±9.2** 12.5±3.4 39.3±2.8##
CCL5 154.7±30.2 287.0±76.8** 113.8±27.3 169.4±34.7

GroupVehMsu
Up/Down
SymbolIl24
Cxcl3Cxcl5Il10
Log2 Ratio (MSU/Veh) q-valueGene ID
UpDown
−4 0 3
A B
Il33Il1f9
Ccl19Cxcl2
Il6Il1b
9367233012220311161537712521525724047
1.811.791.501.291.291.281.26
3.74 3.67E-202.51E-143
6.58E-100
7.87E-2448.90E-408.90E-421.02E-221.79E-222
02.101.84
203101619316176
G
Veh MSU
0
50
100
150
MSUVeh
% in
crea
se in
dia
met
er
0 2 8 24 48 72 96Time (h)
0 2 8 24 48 72 96Time (h)C
300
200
100
00 5-5-10
Veh1
Veh2
Veh3
MSU1MSU2
MSU3Log2 fold change
-log10
q-va
lue
D
E FUpDownNon-DEGs
Veh MSU
10X
**
****
**
**
0.0
0.5
1.0
1.5
2.0
2.5
PWT
(g)
*** *

A
E F
B C D
3210
45
Fold
cha
nge
Il33 qPCR
ng/m
g pr
otei
n
3
2
1
0
IL-33 ElisaSt2 qPCR
15
10
5
0
Fold
cha
nge
0.00.51.01.52.02.5 NS
Il1RAcP qPCR
Fold
cha
nge
IL-33β-actin
HourskDa20 -42 -
0 8 24 480 8 24 48
Veh MSU
ST2β-actin
60 -42 -
HourskDa
0 8 24 480 8 24 48
Rel
ativ
e ex
pres
ion
(%)
0
100
200
******
Veh MSU
VehMSU
VehMSU
VehMSU
Rel
ativ
e ex
pres
ion
(%)
0
100
200
300
NSNS
8h 24h
48h 8h 24
h48
h0h 0h8h 24h
48h 8h 24
h48
h0h 0h
*** **
NSNS*

JH KI
PWT
(g)
PWT
(g)
Nor
mal
ized
AU
C(%
)
0
1
2
3
0
50
100
150
0 2 8 24 48Time (h)
0 2 8 24 48
% in
crea
se in
dia
met
er
0
500
1000
1500
0
50
100
150
200
250*** **
**
Time (h)
0 2 8 24 48Time (h)
0 2 8 24 48Time (h)
WT+VehWT+MSU
St2-/-+VehSt2-/-+MSU
WT+VehWT+MSU
St2-/-+VehSt2-/-+MSU
Nor
mal
ized
AU
C(%
)
WT+VehWT+MSU
St2-/-+VehSt2-/-+MSU
WT+VehWT+MSU
St2-/-+VehSt2-/-+MSU
ED F G
Nor
mal
ized
AU
C(%
)
Nor
mal
ized
AU
C(%
)
% in
crea
se in
dia
met
er
WT+VehWT+MSU
Il-33-/-+VehIl-33-/-+MSU
WT+VehWT+MSU
Il-33-/-+VehIl-33-/-+MSU
Il-33-/-+VehIl-33-/-+MSU
** **
WT+VehWT+MSU
Il-33-/-+VehIl-33-/-+MSU
WT+VehWT+MSU
**
**
****
**
** ** **
**
**
****
**
#
##
###
## ####
####
0
50
100
150
200
0.0
0.5
1.0
1.5
2.0
0500
1000150020002500
0
50
100
150 ** **
#
A
MSU (i.a.)
IL-33 Ab (i.p.)
IL-33 Ab (i.p.)
IL-33 Ab (i.p.)
PWTsEdema
-1
0
8
23
24
3228
Time (h)
PWT
(g)
B C Veh+Iso IgGMSU+Iso IgGMSU+IL-33 Ab%
incr
ease
in d
iam
eter
1 h 4 h 8 h 24 h
Time after IL-33 Ab/Iso IgG injection
1 h 4 h 8 h 24 h
Time after IL-33 Ab/Iso IgG injection
** ****
**** **
**
** **** **
*
0.0
0.5
1.0
1.5
2.0
2.5
-50
0
50
100
150
200
48

IL-33 20 KD
42 KDβ-actin
Rel
ativ
e ex
pres
sion
(%)
D E
G
K
IH
% in
crea
se in
dia
met
erPW
T (g
)
Nor
mal
ized
AU
C (%
)N
orm
aliz
ed A
UC
(%)
Clodro MSU
-24h 0h 2h 6h 24h
Veh+LipoMSU+LipoMSU+Clodro
0.0
0.5
1.0
1.5
2.0
0
200
400
600
800
0
50
100
150 **
***
**
## ## ##
#
**
** **
** **
**
*
Clodronateor liposome
(i.p.)
MSU (i.a.)
PWTs/EdemaCollect tissue
-24h
0h
24h
J-24h 0h 2h 6h 24h
0
50
100
150Veh+LipoMSU+LipoMSU+Clodro
Clodro MSU
F
Veh+Lipo
MSU+Lipo
MSU+Clodro
Cel
ls c
ount
s/fie
ld (X
10⁴
)
** **Veh+Lipo
MSU+Lipo
MSU+Clodro
0
2
4
6
8
10
A CBRaw 264.7 Raw 264.7 TPMs
pg/m
g pr
otei
n
VehLPS
MSU(0.5 mg)
MSU(0.1 mg)
MSU(1 mg)Veh
LPS
MSU (1 mg)0
2
4
6
8
10
Rel
ativ
eex
pres
sion
***
**
*****
**
pg/m
g pr
otei
n
0
200
400
600
800
0
50
100
1500 6h
MSU or LPS Collect cells for qPCR
0 6h 0 6h
Collect cells for Elisa
Collect TPMs for Elisa
MSU or LPS MSU or LPSTPMs
MSU (0.5 mg)Veh LPS
0
50
100
150
200
#
Veh+L
ipo
MSU+Lipo
MSU+Clod
ro

A C D
FWT St2-/- St2-/-WT
0
50
100
150
200
Rat
io to
β-a
ctin
(%)
2
4
6
0
SOD
Act
ivity
(U/m
g pr
otei
n) 60
80
40
20
0
GSH
-Px
Activ
ity(U
/mg
prot
ein)
H2O
2 le
vel
(μm
ol/m
g tis
sue)
1
2
3
0
75 kDa
50 kDa
20 kDa
42 kDaβ-actin
Veh MSU
4-HNE
* *** **
****
***
St2-/-+VehSt2-/-+MSU
WT+VehWT+MSU
Radiance(p/sec/cm²/sr)
G H
WT+Veh
St2-/-+Veh
***
St2-/-+MSU
WT+MSU
15,00
0
20,00
0
25,00
0
30,00
0
35,00
0
40,00
0
15
10
5
0
Tota
l flux
[p/s
](×10
^4)
B
60
40
20
0M
DA
leve
l (μ
mol
/mg
prot
ein) ***
WT+VehWT+MSU
St2-/-+VehSt2-/-+MSU
I J K L
0
1
2
3
4
5
0
10
20
30
40
50
SOD
Act
ivity
(U/m
g pr
otei
n)
GSH
-Px
Activ
ity(U
/mg
prot
ein)
** **
***
Veh+B
SA
MSU+BSA
MSU+rIL-3
3
Veh+B
SA
MSU+BSA
MSU+rIL-3
3
E
MSU+BSA+Ig
G
Veh+B
SA+IgG
MSU+rIL3
3 +IgG
MSU+rIL3
3 +ST2 A
b
WT+Veh
+BSA
WT+MSU+B
SA
ST2-/- +M
SU+BSA
ST2-/- +M
SU+rIL3
3
* **
***
NS*
0
20
40
60
80
0
20
40
60
MD
A le
vel
(μm
ol/m
g pr
otei
n)
MD
A le
vel
(μm
ol/m
g pr
otei
n)

0
2
4
6
8SO
D A
ctiv
ity(U
/mg
prot
ein)
0
10
20
30
40
50
MD
A le
vel
(μ m
ol/m
g pr
otei
n)
0
20
40
60
80
GSH
-Px
Activ
ity(U
/mg
prot
ein)
0
1
2
3
4
MPO
Act
ivity
(U/m
g tis
sue)
D E F G H
0
1
2
3
4
H2O
2 le
vel
(μ m
ol/m
g tis
sue)
******
****
**** **
* **
% in
crea
se in
dia
met
er
0
50
-50
100
150
200
1 h 3 hTime after fucoidin/PBS injection
3 h
1.5
1.0
0.5
0.0
2.0
2.5
PWT
(g)
Veh+PBSMSU+PBSMSU+Fuco
JI
0
PWTs/Edema
MSU (i.a.)
Fucoidin(i.v.)
*** **
****
**
****
Time after fucoidin/PBS injection
8 23 24 27Time (h)
Tissue collection
A
3
2
1
0
MPO
Act
ivity
(U/m
g tis
sue)
** **
B
0
2
4
6
MPO
Act
ivity
(U/m
g tis
sue)
**
**
WT+VehWT+MSU
St2-/-+VehSt2-/-+MSU
CVeh+BSAMSU+BSAMSU+rIL33
1 h

Time (s)
Rat
io (3
40/3
80)
Noc
ifens
ive
beha
vior
.s
Time (min)
Tim
e.s
% H
2O2
posi
tive
resp
ondi
ng n
euro
n
Δ C
hang
e in
R34
0/38
0
H2O2 KCl
**
** ** ****
****
FE
B
A
C D
L3-5 DRG neuron culture
Ratiometric Ca2+ imaging
Control +H2O2 +KCl
Control +H2O2 +KCl
Control +H2O2 +KCl
WT+Veh+Veh1+Veh2WT+Veh+H2O2+Veh2
WT+MSU+H2O2+Veh2
ST2-/-+MSU+H2O2+Veh2WT+MSU+H2O2+HC-03
---
+ +++
++
-
- -+ +
-
MSUH2O2
HC-03
0
20 WT VehWT MSUST2-/- MSU
WT+
Veh
WT+
MSU
ST
2-/-+M
SU
40
60
80
WT VehWT MSUST2-/- MSU
0
5
10
WT VehWT MSUST2-/- MSU
0 200 400 6001
2
3
4
5
0
50
100
150
200
250
2 4 6 8 100
10
20
30
40
50
WTWT WT
WT St2-/-

1
Supplementary Materials Title page Title IL-33/ST2 induces neutrophil-dependent reactive oxygen species production and mediates gout pain
Author
Chengyu Yin1, #, Boyu Liu1, #, Yuanyuan Li1, Xiaojie Li1, Jie Wang1, Ruixiang Chen1, Yan Tai2,
Qiyang Shou3, Ping Wang4, Xiaomei Shao1, Yi Liang1, Hong Zhou5, Wenli Mi6, Jianqiao
Fang1,*and Boyi Liu1,*
# These authors contributed equally to this work.
*Correspondence: Boyi Liu, Department of Neurobiology and Acupuncture Research, The Third
Clinical Medical College, Zhejiang Chinese Medical University, Key Laboratory of Acupuncture
and Neurology of Zhejiang Province, Hangzhou, 310053, China. E-mail: [email protected]
Or Jianqiao Fang, Department of Neurobiology and Acupuncture Research, The Third Clinical
Medical College, Zhejiang Chinese Medical University, Key Laboratory of Acupuncture and
Neurology of Zhejiang Province, Hangzhou, 310053, China. E-mail: [email protected].
Abstract
Objective: Gout, induced by monosodium urate (MSU) crystal deposition in joint tissues,
provokes severe pain and impacts life quality of patients. However, the mechanisms
underlying gout pain are still incompletely understood. Methods: We established a mouse gout
model by intra-articularly injection of MSU crystals into the ankle joint of wild type and gentic
knockout mice. RNA-Sequencing, in vivo molecular imaging, Ca2+ imaging, reactive oxygen

2
species (ROS) generation, neutrophil influx and nocifensive behavioral assay, etc. were used.
Results: We found interleukin-33 (IL-33) was among the top up-regulated cytokines in the
inflamed ankle. Neutralizing or genetic deletion of IL-33 or its receptor ST2 (suppression of
tumorigenity) significantly ameliorated pain hypersensitivities and inflammation. Mechanistically,
IL-33 was largely released from infiltrated macrophages in inflamed ankle upon MSU stimulation.
IL-33 promoted neutrophil influx and triggered neutrophil-dependent ROS production via ST2
during gout, which in turn, activated transient receptor potential ankyrin 1 (TRPA1) channel in
dorsal root ganglion (DRG) neurons and produced nociception. Further, TRPA1 channel activity
was significantly enhanced in DRG neurons that innervate the inflamed ankle via ST2 dependent
mechanism, which results in exaggerated nociceptive response to endogenous ROS products
during gout. Conclusions: We therefore demonstrated a previous unidentified role of IL-33/ST2 in
mediating pain hypersensitivity and inflammation in a mouse gout model through promoting
neutrophil-dependent ROS production and TRPA1 channel activation. Targeting IL-33/ST2 may
represent a novel therapeutic approach to ameliorate gout pain and inflammation.
Keywords: Gout; arthritis; TRPA1; reactive oxygen species; cytokine; neutrophil;

3
Graphical abstract IL-33 produced by macrophages upon MSU stimulation promoted neutrophil influx and triggered neutrophil-dependent ROS and lipid peroxidation products generation via ST2, which activated TRPA1 in DRG neurons and produced gout pain.

4
Supplementary methods and materials
Chemicals
MSU and DMSO were purchased from Sigma (St. Louis. MO, USA). H2O2 and LPS were
purchased form Solarbio Life Sciences (Beijing, China). Fucoidin was purchased from APExBIO
Technology (Houston, TX, USA). Clodronate and liposome controls were purchased from
Liposoma BV (Amsterdam, The Netherlands). Fura-2 AM was purchased from Abcam
(Cambridge, UK). HC-030031 and L-012 were purchased from Tocris (Minneapolis, MN, USA).
Ankle edema test
Ankle edema was evaluated as an % increase in ankle diameter measured with a digital caliper and
was calculated as follows as previously described [1, 2]: % increase in ankle
diameter=(Lafter-Lbasal)/Lbasal◊100%. The experimenter was blind to experimental conditions. The
same experimenter carried out all edema tests to avoid inter-observer variability.
H2O2-induced nocifensive behavior assay
Mice were placed into transparent chambers and habituated for 30 minutes before testing.
Chemicals were injected into the hind paw of mice using 1-mL syringe and 30-gauge needle as
follows: H2O2 (100 μg/site) was co-injected with HC-030031 (10 μg/site) or vehicle in a total
volume of 10 μl dissolved in PBS. Nocifensive behavior (licking, flinching, or biting of injected
paw) was recorded with a videorecorder for 10 min and quantified thereafter. All behavior tests are
conducted by an experimenter blinded to experimental conditions.

5
The open field test
The test consists of a non-transparent Plexiglass enclosure (40 cm × 40 cm × 30 cm) placed in a
sound-proof experimental room. Animals were habituated to experimental room conditions for
30 min before test. To initiate testing, the mice were placed in the center of the field individually,
and the total distance they traveled in the field was monitored by the camera above the field
during 5 min testing time. The movement was then analyzed by Anymaze software from Stoelting
(Wood Dale, IL, USA) and compared thereafter.
ELISA test
Ankles joint samples were harvested after treatment, weighed and immediately frozen in liquid
nitrogen. Tissues were homogenized with Bullet Blender (BBX24, NextAdvance Inc. NY, USA)
in 50 mM Tris-base (PH 7.4) and 150 mM NaCl added with protease inhibitors (Roche,
Switzerland) and 0.2% Triton X-100 (Sigma, MO, USA) at 4 ℃ for 20 min at full speed as we
described previously. The supernatants were centrifuged at 12, 000g for 12 min at 4 ℃. The
protein concentrations were determined by BCA assay (Thermo Fisher Scientific, Waltham, MA,
USA). The supernatants were tested by ELISA in duplicates for IL-33 using a commercial kit
(R&D Systems, Minneapolis, MN, USA), according to the manufacture’s instruction.
Bio-Plex multiplex immunoassays
The concentrations of some key inflammatory cytokines or chemokines in supernatant of
homogenized ankle tissues of mice were detected using Bio-Plex multiplex immunoassay
(RayBiotech, Norcross, GA, USA). Briefly, a total of 50 μl antibody-conjugated beads were added

6
to the assay plate. The samples were diluted in 1:24. 50 μl of diluted samples, standards, the blank,
and controls were added to the plate, respectively. The plate was then incubated in the dark with
shaking at 850 rpm for 30 min and then washed 3 times with 100 μl washing buffer. A total of 25
μl biotinylated antibody and 50 μl streptavidin-phycoerythrin were added to the plate, respectively,
with shaking and washing procedure mentioned above. The readout was carried out using
Bio-Plex protein array reader and Bio-Plex Manager 6.0 was used for data acquisition and
analysis.
Thioglycollate-elicited macrophages (TPMs) culture
TPMs were generated by injecting the mice (i.p.) with 2.5 ml of 4 % Brewer’s thioglycollate
medium (Sigma, USA) as described before [3]. Mice were euthanized 72 h after injection.
Peritoneal cavity cells were harvested by lavage, and cells were washed and plated in 6-well
chamber. Cells were cultured in DMEM plus 10% FBS, 100 units/mL penicillin and 100 μg/mL
streptomycin. Cells were incubated overnight and adherent cells were then stimulated with MSU
or LPS.
Macrophage depletion with clodronate
200 μl of a clodronate-laden liposome suspension (5 mg/ml) was injected (i.p.) 48 h before
behavioral test. Liposomes lacking clodronate served as vehicle control. The efficiency of
macrophage depletion was evaluated by immunostaining the spleen and periarticular ankle tissues
with F4/80 antibody.

7
Neutrophil aggregation blocking with fucoidine
Mice were treatment with fucoidin (20 mg/kg in 20 μl) or corresponding vehicle (PBS) by
intravenous injection via the tail vein at 8 h and 23.5 h after MSU injection. The efficiency of
neutrophil aggregation blockage was evaluated by MPO assay.
IL-33/ST2 neutralizing antibody application
For blocking IL-33 and ST2 signaling, mouse IL-33–neutralizing and ST2-neutralizing antibodies
(catalog numbers: AF3626 and MAB10041; R&D Systems) and normal goat or rat isotype control
IgGs (catalog numbers: I5256 and I4131; Sigma-Aldrich) were dissolved in sterile PBS. For
blocking IL-33, IL-33 neutralizing antibody (10 μg/mouse) was treated at 0 h, 8 h and 23 h time
points, for a total of three times, after MSU injection. In cases where ST2-neutralizing antibody
was co-applied with rIL-33, ST2 neutralizing antibody (50 μg/mouse) was pre-mixed with rIL-33
(300 ng/mouse) and co-injected with rIL-33 into the ankle joint of mice. The effective dosages of
IL-33- and ST2-neutralizing antibodies were derived from our previous study [4].
Determination of oxidant/anti-oxidant status
Ankle joint tissues from mice of each group were collected 24 h after MSU injection. The samples
were then homogenized, followed by centrifugation at 3,000 rpm for 15 min. Supernatant was
collected for superoxide dismutase (SOD), reduced glutathione (GSH) and malondialdehyde
(MDA) assay as we described before [1]:
Detection of SOD activity: SOD activity was detected based on the inhibition of nitro blue
tetrazolium reduction using the xanthine/xanthine oxidase system as a superoxide generator with a

8
commercially available kit (Nanjing Jiancheng Bioengineering Institute, Nanjing, China).
Absorbance was determined with a microplate reader at 560 nm. The results were averaged and
expressed as U/mg of sample protein.
Detection of MDA level: Lipid peroxidation product MDA level was determined based upon the
concentration of thiobarbituric acid-reactive substances using a commercially available kit
(Beyotime, Shanghai, China). Absorbance was determined using a microplate reader at 532 nm.
MDA concentration was calculated using the absorbance coefficient according to manufacturer’s
instruction and expressed as U/mg of sample protein.
Detection of GSH-Px level: GSH-Px level was measured using 5, 5′-dithiobis-(2-nitrobenzoic acid)
recycling method with a commercially available kit (Nanjing Jiancheng Bioengineering Institute,
Nanjing, China). Absorbance was monitored using a microplate reader at 412 nm. The results
were deduced from comparison with that of the standard solution of GSH and expressed as
μmol/mg of sample protein.
Immunofluorescent staining
Mice were deeply anesthetized with isoflurane and were perfused through the ascending aorta
with 0.9% saline followed by 4% paraformaldehyde in 0.1 M PBS. After perfusion, the spleen and
periarticular tissues were removed and post-fixed in the same fixative for 4-6 h (4 ℃) before
transferring to 30% sucrose for 72 h for dehydration. Tissues were serially cut into 8 μm thickness
section on a frozen microtome (CryoStar NX50, Thermo Fisher, CA, USA) and processed for
immunofluorescence. The sections were first blocked with 5% donkey serum in PBS (with 0.3%
Triton X-100, blocking buffer) for 1 h at 37 ℃ and then incubated overnight at 4 ℃ with the

9
following primary antibodies diluted in blocking buffer: rat anti F4/80 (1:500, Abcam). The
sections were then incubated 1 hr at 37 ℃ with mixture of corresponding secondary antibodies.
Fluorescence images were captured by Nikon A1R laser scanning confocal microscope. The
sections were examined and analyzed in a blinded manner. 3 images were randomly selected per
mouse tissue and averaged and compared as described in our previous study [5].
Western blotting
After measuring protein concentrations, the samples were heated for 5 min with 5X loading buffer
at 100 ℃ and loaded onto SDS-PAGE. The proteins were electrophoretically transferred onto
polyvinylidene fluoride membranes. After being blocked with 5% nofatty milk in Tris-buffer
saline containing 0.1% Tween-20 for 1h at room temperature, the membranes were then probed
with following primary antibodies overnight at 4 ℃. These antibodies included goat anti-IL33
(1:500, R&D Systems), goat anti-ST2 (1:1000, R&D Systems), rabbit anti-4HNE (1:500, Abcam)
and mouse anti-β-actin (1:5000, Abcam). The proteins were then detected by horseradish
peroxidase-conjugated and corresponding secondary antibodies (1:5000, CST). The results of
protein expression are normalized to the density of β-actin. Fold change in control/vehicle group
was expressed as 100% quantification.
Real-time quantitative PCR (qPCR)
At 24 h after MSU injection, the mice were euthanized and ankle joint samples were collected.
Total RNA from each group was extracted in 1 mL Trizol reagent and centrifuged at 12,000 rpm at
4 ℃ for 10 min. The extracted total RNA from ankle was reverse-transcribed into cDNA using

10
random haxamers primers with Prime ScriptTM RT reagent Kit (TaKaRa Bio Inc, China). Each
reaction was performed in triplicates and normalized to β-actin gene expression. qPCR was
performed in CFX96 Instrument Sequence Detection System (Bio-Rad, Berkeley, CA, USA)
using Fast Start Universal SYBR Green Master Kit (TaKaRa Bio Inc, China) with 25 µL reaction
system. The CT value of each well was determined using the CFX96 Real-Time System Software
and the average of the triplicates was calculated. The relative quantification was determined by the
△△CT method as described before [6]. The sequences of all primers used were shown in Table S1.

11
Supplementary figures and legends:
Figure S1 High quality ankle tissue RNA obtained for RNA-Seq. (A) Ankle tissue RNA electrophoresis image. Left lane shows the marker and right lane shows the RNA sample. (B) RNA integrity number (RIN) determined by TapeStation.

12
Figure S2 St2-/- and Il33-/- mice showed normal general locomotor activities in open field test and body weight. (A&B) Open field test of naïve St2-/- (A) and Il33-/- (B) mice compared with WT control mice. Upper panel: typical movement traces of the mice. Lower panel: Summarized total distance the mice traveled. (C&D) Comparison of body weight of St2-/- (C) or Il33-/- (D) mice with WT control mice. NS: no significance. Student’s t test is used for statistical analysis.

13
Figure S3 Exogenously injected recombinant IL-33 exacerbates pain hypersensitivities and ankle edema of gout model mice via ST2 dependent mechanism. (A) Schematic protocol for gout model establishment and time points for i.a. injection of rIL-33/BSA (or in combination with ST2 neutralizing antibody/Iso-type IgG). Ankle diameter and PWTs were observed 45 min and 4 h after rIL-33/BSA injection. (B) % increase in ankle diameter after 3, 30 or 300 ng rIL-33 or BSA injection. (C) PWT changes after 3, 30 or 300 ng rIL-33 or BSA injection. (D) % increase in ankle diameter after IL-33 (300 ng) combined with ST2 neutralizing antibody (50 μg) or iso-type IgG injection. (E) PWT changes after IL-33 (300 ng) combined with ST2 neutralizing antibody (50 μg) or iso-type IgG injection. (F) % increase in ankle diameter after IL-33 or BSA injection into WT or St2-/- mice. (G) PWT changes after IL-33 or BSA injection into WT or St2-/- mice. n = 5-7 mice/group. *p<0.05 and **p<0.01. NS: no significance. One-way ANOVA followed by Tukey post hoc test was used for statistical analysis.

14
Figure S4 Thioglycollate-elicited macrophage collection and identification. (A) TPMs observed under transmitted light microscope. (B) FACS plots showing the percentage of F4/80+/CD11b+ macrophages in peritoneal fluids after thioglycollate treatment.

15
Figure S5 Validation of clodronate-induced macrophage depletion. (A) Schematic protocol for the time points of clodronate or liposome application and spleen tissue collection. (B) Representative immunofluroscence images showing spleen section stained with macrophage marker F4/80 in clodronate or liposome-treated group. (C) Summarized % normalized fluorescence intensity of (B). n = 7 mice/group. Scale bar indicate 50 μm. **p<0.01. Student’s t test is used for statistical analysis.

16
Figure S6 Analysis of infiltrated cells in tissue exudates from the mouse air pouch model. Upper panel: Protocol for establishing the mouse air pouch model. On Day 0 and 3, 5 ml sterile air was injected subcutaneously (s.c.) into the back of the mouse. On Day 6, MSU (3 mg/ml, in 1 ml injection volume) or PBS (1 ml) was injected into the air pouches. 6 h later, the animals were sacrificed and tissue exudates were collected for analysis. Lower panel: Cell counts (total, neutrophils, lymphocytes and macrophages) from tissue exudates of the air pouch model from WT and St2-/- mice. n = 5-6 mice/group. **p<0.01. One-way ANOVA followed by Tukey post hoc test was used for statistical analysis.

17
Table S1. Primers sequence used for qPCR evaluation of gene expression changes in the present study
Gene name Gene ID Primer sequence (5ʹ to 3ʹ) Amplicon size (bp)
β-actin 11461 F:5’-GTGCTATGTTGCTCTAGACTTCG-3’ 174
R:5’-ATGCCACAGGATTCCATACC-3’
Il-33 77125 F:5’-CAGAAGACCAAAGAATTCTGCC-3’ 130
R:5’-CATGCTTGGTACCCGATTTTAG-3’
St2 17082 F:5’-TGACACCTTACAAAACCCGGA-3’ 178
R:5’-AGGTCTCTCCCATAAATGCACA-3’
Il-1rap 16180 F:5’-CACCAAGGTACACAGTAGAACT-3’ 123
R:5’-CAGCCAGTAAACATGGTAAACC-3’
References 1. Yin C, Liu B, Wang P, Li X, Li Y, Zheng X, et al. Eucalyptol alleviates inflammation and pain responses in a mouse model of gout arthritis. Br J Pharmacol. 2020; 177: 2042-57. 2. Silva CR, Oliveira SM, Hoffmeister C, Funck V, Guerra GP, Trevisan G, et al. The role of kinin B1 receptor and the effect of angiotensin I-converting enzyme inhibition on acute gout attacks in rodents. Ann Rheum Dis. 2016; 75: 260-8. 3. Hannemann N, Cao S, Eriksson D, Schnelzer A, Jordan J, Eberhardt M, et al. Transcription factor Fra-1 targets arginase-1 to enhance macrophage-mediated inflammation in arthritis. J Clin Invest. 2019; 129: 2669-84. 4. Liu B, Tai Y, Achanta S, Kaelberer MM, Caceres AI, Shao X, et al. IL-33/ST2 signaling excites sensory neurons and mediates itch response in a mouse model of poison ivy contact allergy. Proc Natl Acad Sci U S A. 2016; 113: E7572-E9. 5. Hu Q, Zheng X, Li X, Liu B, Yin C, Li Y, et al. Electroacupuncture Alleviates Mechanical Allodynia in a Rat Model of Complex Regional Pain Syndrome Type-I via Suppressing Spinal CXCL12/CXCR4 Signaling. J Pain. 2020. 6. Livak KJ, Schmittgen TD. Analysis of relative gene expression data using real-time quantitative PCR and the 2(-Delta Delta C(T)) Method. Methods. 2001; 25: 402-8.


![GII Primary ST2[1]](https://img.pdfslide.net/doc/110x75/5534c5e04a7959ae4b8b4c08/gii-primary-st21.jpg)