Embed Size (px)
Citation preview

LETTERdoi:10.1038/nature12979
IL-35-producing B cells are critical regulators ofimmunity during autoimmune and infectious diseasesPing Shen1*, Toralf Roch1{*, Vicky Lampropoulou1, Richard A. O’Connor2, Ulrik Stervbo1, Ellen Hilgenberg1, Stefanie Ries1,Van Duc Dang1, Yarua Jaimes1, Capucine Daridon1,3, Rui Li4, Luc Jouneau5, Pierre Boudinot5, Siska Wilantri1, Imme Sakwa1,Yusei Miyazaki4, Melanie D. Leech2, Rhoanne C. McPherson2, Stefan Wirtz6, Markus Neurath6, Kai Hoehlig1, Edgar Meinl7,Andreas Grutzkau1, Joachim R. Grun1, Katharina Horn1, Anja A. Kuhl8, Thomas Dorner1,3, Amit Bar-Or4, Stefan H. E. Kaufmann9,Stephen M. Anderton2 & Simon Fillatreau1
B lymphocytes have critical roles as positive and negative regulatorsof immunity. Their inhibitory function has been associated prim-arily with interleukin 10 (IL-10) because B-cell-derived IL-10 canprotect against autoimmune disease and increase susceptibility topathogens1,2. Here we identify IL-35-producing B cells as key playersin the negative regulation of immunity. Mice in which only B cellsdid not express IL-35 lost their ability to recover from the T-cell-mediated demyelinating autoimmune disease experimental auto-immune encephalomyelitis (EAE). In contrast, these mice displayeda markedly improved resistance to infection with the intracellularbacterial pathogen Salmonella enterica serovar Typhimurium asshown by their superior containment of the bacterial growth andtheir prolonged survival after primary infection, and upon second-ary challenge, compared to control mice. The increased immunityfound in mice lacking IL-35 production by B cells was associatedwith a higher activation of macrophages and inflammatory T cells,as well as an increased function of B cells as antigen-presenting cells(APCs). During Salmonella infection, IL-35- and IL-10-producingB cells corresponded to two largely distinct sets of surface-IgM1
CD138hiTACI1CXCR41CD1dintTim1int plasma cells expressingthe transcription factor Blimp1 (also known as Prdm1). During EAE,CD1381 plasma cells were also the main source of B-cell-derived IL-35and IL-10. Collectively, our data show the importance of IL-35-producing B cells in regulation of immunity and highlight IL-35production by B cells as a potential therapeutic target for auto-immune and infectious diseases. This study reveals the central roleof activated B cells, particularly plasma cells, and their productionof cytokines in the regulation of immune responses in health anddisease.
The inhibitory activities of B cells involve their production of IL-10,which in mice can protect from autoimmunity but impair resistanceto infection3–6. Such suppressive function could be relevant to humandiseases. A defect in IL-10 secretion by B cells was observed in patientswith multiple sclerosis and type 1 diabetes7,8. Furthermore, B-cell deple-tion therapy had deleterious effects in some patients with multiplesclerosis or ulcerative colitis9,10, and led to ulcerative colitis or psoriasisin patients with Graves’ disease or rheumatoid arthritis, respectively11,12.These effects were probably not all owing to a loss of IL-10-producingB cells. Mouse B cells could inhibit immunity independently of IL-10(refs 13, 14). However, no mediator to account for this has been char-acterized. There is an urgent need to identify additional factors medi-ating regulatory functions of B cells.
B cells require activation to exert suppressive activity and Toll-likereceptors (TLR) are critical in this process. Mice with deficiencies inboth TLR2 and TLR4 restricted to B cells developed an exacerbatedEAE after immunization with the encephalitogenic peptide from mye-lin oligodendrocyte glycoprotein (MOG35–55)15. Using mice with sin-gle deficiencies in these TLR restricted to B cells (BTlr22/2
and BTlr42/2
mice, respectively), we found that TLR4 was the most critical for B-cell-mediated suppression in EAE (Fig. 1a and Extended Data Fig. 1a).With our previous studies3, these results establish TLR4 and CD40 asreceptors essential for the regulatory function of B cells in EAE. CD40also contributes to the protective roles of B cells in ulcerative colitisand arthritis4,5.
IL-10 production by B cells is required for recovery from EAE3.Naive B cells produced IL-10 after TLR4 engagement, but not uponco-stimulation by TLR4 plus CD40 (Fig. 1b and Extended Data Fig. 1b).To identify additional suppressive factor(s) produced upon TLR4 plusCD40 stimulation, we performed Affymetrix array analyses on (1) naiveB cells, (2) B cells activated by TLR4 and (3) B cells activated by TLR4plus CD40, and focused on genes coding for secreted molecules (ExtendedData Fig. 1c). Among the genes differentially expressed, of interest wasEpstein-Barr virus-induced gene 3 (Ebi3), a member of the IL-12 cyto-kine family that can dimerize with p28 or p35 to generate IL-27 or IL-35,respectively, which both have suppressive functions16–19. B cells did notexpress p40 (also known as Il12b) messenger RNA, highlighting its cell-type specific expression pattern20, but constitutively transcribed p35(also known as Il12a) (Extended Data Fig. 1d). In fact, B cells were themain source of p35 mRNA in secondary lymphoid tissues (Fig. 1d).B cells upregulated expression of p35 and Ebi3 mRNA, as well as EBI3protein upon activation by TLR4 plus CD40, which was furtherincreased upon B-cell receptor for antigen (BCR) engagement, suggest-ing they could secrete IL-35 (Fig. 1e and Extended Data Fig. 1). Thiswas confirmed by co-immunoprecipitation using supernatants fromTLR4 plus CD40-activated B cells (Fig. 1f). We conclude that B cellscan secrete IL-35 after activation by TLR4 plus CD40.
To evaluate the role of IL-35 expression by B cells during EAE, weused mice with a B-cell-restricted deficiency in p35 (Bp352/2
), or EBI3(BEbi32/2
), or control mice with wild-type B cells (BWT). We also usedmice in which B cells could not express p40 (Bp402/2
), or p28 (Bp282/2
),because p35 can dimerize with p40 to form IL-12, and EBI3 can assoc-iate with p28 to form IL-27. B cells secreted p28 after activation(Extended Data Fig. 1j). Bp352/2
and BEbi32/2
mice developed exacer-bated EAE, whereas Bp402/2
and Bp282/2
mice had disease courses similar
*These authors contributed equally to this work.
1Deutsches Rheuma-Forschungszentrum, a Leibniz Institute, Chariteplatz 1, 10117 Berlin, Germany. 2University of Edinburgh, Centre for Inflammation Research and Centre for Multiple SclerosisResearch, Queen’s Medical Research Institute, Edinburgh EH16 4TJ, UK. 3Charite Universitatsmedizin Berlin, CC12, Department of Medicine/Rheumatology and Clinical Immunology, 10117 Berlin,Germany. 4Neuroimmunology Unit, Montreal Neurological Institute and Hospital, McGill University, Montreal, Quebec H3A2B4, Canada. 5Virologie et Immunologie Moleculaires, INRA, 78352 Jouy-en-Josas, France. 6Medical Clinic 1, Kussmaul Campus for Medical Research, University of Erlangen-Nurnberg, 91054 Erlangen, Germany. 7Institut fur Klinische Neuroimmunologie Klinikum der Ludwig-Maximilians-Universitat Munchen, 81377 Munchen, Germany. 8Immunpathologie, Research Center ImmunoSciences, 12203 Berlin, Germany. 9Max Planck Institute of Infection Biology, Department ofImmunology, Chariteplatz 1, 10117 Berlin, Germany. {Present address: Institute of Biomaterial Science, Helmholtz-Zentrum Geesthacht, Centre for Materials and Coastal Research, Kantstraße 55, 14513Teltow, Germany.
3 6 6 | N A T U R E | V O L 5 0 7 | 2 0 M A R C H 2 0 1 4
Macmillan Publishers Limited. All rights reserved©2014

to BWT controls (Fig. 2a and Extended Data Fig. 2). Therefore,B cells limited EAE pathogenesis through provision of IL-35. EAEpathogenesis involves TH1 and TH17 cells, which express IFN-c andIL-17, respectively21,22. Bp352/2
mice displayed increased MOG-reactiveIFN-c and IL-17 production compared to control mice (Fig. 2b andExtended Data Fig. 2d). In contrast, Bp282/2
and Bp402/2
mice mountednormal T-cell responses (Fig. 2b and Extended Data Fig. 2). Bp352/2
micehad more CD41 T cells and mononuclear phagocytes in the centralnervous system than BWT mice (Extended Data Fig. 2), suggesting thatB-cell-derived IL-35 limited disease by reducing the accumulation ofpathogenic cells in the target organ. These data demonstrate that B-cell-derived IL-35 is a critical regulator of T-cell-mediated autoimmunity.
The mechanisms underlying the suppressive activities of IL-35 remainpoorly understood23. During EAE, the increased T-cell response observedin Bp352/2
mice was not due to a defect in CD41Foxp31 T regulatory(Treg) cells (Extended Data Fig. 2), which are protective in this disease24.B cells from Bp352/2
mice expressed higher levels of activation markers(CD44, CD69) and molecules involved in antigen presentation to CD41
T cells (MHC-II, CD80, CD86), compared to control B cells (ExtendedData Fig. 3). Accordingly, they were more potent APC, stimulatinghigher proliferation and production of inflammatory cytokines (IL-17and GM-CSF) by MOG-reactive CD41 T cells than control B cells(Fig. 2c, d and Extended Data Fig. 3c). Preliminary studies showedthat Bp352/2
mice were susceptible to EAE induced with human MOG, a
eGFP
a
c
b
LPS + anti-CD40
B cells from IL-10–eGFP mice
100 101 102 103 104 100 101 102 103 104100
101
102
103
104
100
101
102
103
104
72 h
1420353_at (Lta)
1418126_at (CCL5)
1422924_at (TNFsf9)
1449222_at (EBI3)
1450297_at (IL-6)
1417925_at (CCL22)
1450330_at (IL-10)
24 h 72 h 24 hNaive
LPS +anti-CD40LPS
0 2.0–2.0
P =
0.0
183
LPS
CD
19
0 10 20 300
2
4
6
Days post-EAE induction
Mean E
AE
sco
re
13.1% 1.53%
C57
BL/6
JHT
C57
BL/6
JHT
C57
BL/6
LN
C57
BL/6
spleen
0
200
400
600
800Naive
lymph
nodes
Naive
spleens
Purified
B cells
p35
mR
NA
rela
tive
exp
ressio
n
Actin
EBI3
WB: 72 h B-cell lysates
Wild-type
B-cell
supernatants
p35–/–
B-cell
supernatants
EBI3
IP: anti-p35Blot: anti-EBI3
Naive
B c
ells
LPS
CpG
PGN
LPS +
ant
i-CD40
PGN +
ant
i-CD40
CpG
+ a
nti-C
D40
e f
d
Figure 1 | B cells secrete IL-35 upon activation by TLR4 and CD40.a, EAE was induced in BTlr22/2
(grey squares, n 5 8), BTlr42/2
(black triangles,n 5 8) and BWT mice (grey circles, n 5 16). Data show clinical EAE scores fromtwo independent experiments (mean 6 s.e.m.). Cumulative disease scores werecompared using two-tailed unpaired t-test. b, Splenic B cells from IL-10–eGFP(knock-in of eGFP at Il10 locus) mice were stimulated for 72 h with LPS(1mg ml21) or LPS (1mg ml21) plus anti-CD40 (10mg ml21), and eGFPexpression was measured by flow cytometry. Plots show eGFP expression bylive CD191 cells. Results are representative of three independent experiments.c, Hierarchical cluster analysis of secreted factors differentially expressedbetween B cells activated with LPS or LPS plus anti-CD40 (Pearson correlationwith average linkage). Affymetrix microarrays were performed inquadruplicates. Gene expression levels are shown for each array compared to itsaverage value for all arrays, within a scale from twofold increase (yellow) totwofold decrease (blue). d, p35 mRNA expression was quantified by RT–PCRin lymph nodes and spleen from naive C57BL/6 and B-cell-deficient JHT mice,as well as in B cells purified from lymph nodes and spleen of C57BL/6 mice.Data show compilation of three independent experiments (mean 6 s.e.m.).e, Splenic B cells were activated as indicated for 72 h, and treated with GolgiStopfor the last 4 h of culture. B-cell lysates were separated on SDS–PAGE gel andblotted with anti-EBI3 or anti-actin antibody. Data shows a representativeresult from three independent experiments. f, B cells from C57BL/6 or p35-deficient mice were activated for 72 h with LPS plus anti-CD40. Culturesupernatants were subjected to immunoprecipitation with anti-p35 followed bywestern blot with anti-EBI3 antibody. Data shown are representative of twoindependent experiments.
0 10 20 300
1
2
3
4
5
6
BWTBp35–/–
Mean E
AE
sco
re
a
0 10 20 300
1
2
3
4
5
6
Mean E
AE
sco
re
0 10 20 300
1
2
3
4
5
6
Days post-EAE induction
Mean E
AE
sco
re
0 10 20 300
50
100
150
200
MOG35–55 (μM)
b
IFN
-γ (ng
ml–
1)
0 10 20 300
500
1,000
1,500
2,000
IL-1
7 (p
g m
l–1)
c
MOG35–55 (μM)
BWT
Bp35–/–
Bp40–/–
P =
0.0
492
P <
0.0
001
BWTBEbi3–/–BWTBp40–/–
******
***
***
***
***
**
**
*
*
*
*
d
0 10 20 30 40 500
5,000
10,000
15,000
20,000
MOG35–55 (μg ml–1)C
PM
0 10 20 30 40 500
10,000
20,000
30,000
CP
M
Bp35–/– derived B cells
BWT derived B cells
Teff from BWT mice Teff from Bp35–/– mice
MOG35–55 (μg ml–1)
0 10 20 30 40 50 0 10 20 30 40 500
1,000
2,000
3,000
4,000IL
-17 (p
g m
l–1)
GM
-CS
F (p
g m
l–1)
MOG35–55 (μg ml–1)
100
200
300
400
500
MOG35–55 (μg ml–1)
0
BWT B cells + BWT Teff
Bp35–/– B cells + BWT Teff
BWT B cells + Bp35–/– Teff
Bp35–/– B cells + Bp35–/– Teff
Days post-EAE induction Days post-EAE induction
Figure 2 | IL-35 expression by B cells is required for recovery from EAE.a, EAE was induced in Bp352/2
(grey squares, n 5 17) and BWT mice(black circles, n 5 16) (left panel); BEbi32/2
(grey squares, n 5 9) andcorresponding BWT mice (black circles, n 5 5) (middle panel); Bp402/2
(grey squares, n 5 10) and BWT mice (black circles, n 5 16) (right panel) byimmunization with MOG35–55 peptide in Complete Freund’s adjuvant. Datashow clinical EAE scores from two independent experiments (mean 6 s.e.m.).Cumulative disease scores were compared using a two-tailed unpaired t-test.b, Splenocytes were collected from mice on day 10 after EAE induction,and pooled before re-stimulation for 48 h with MOG35–55 in increasingconcentrations. Culture supernatants were analysed by ELISA to determineIFN-c and IL-17 concentrations. Data show a representative result from twoindependent experiments. c, EAE was induced in Bp352/2
and correspondingBWT mice by immunization with MOG35–55 peptide in Complete Freund’sadjuvant. B cells and CD41CD252 T cells (Teff) were isolated from pooleddraining lymph nodes and spleens on day 10 after immunization. Then 5 3 105
B cells from Bp352/2
or BWT mice were cultured with 1 3 104 Teff cells fromBp352/2
or BWT mice in the presence of MOG35–55 in increasing concentrations,as indicated. Proliferation was assessed after 64 h by [3H]thymidineincorporation. CPM, counts per minute. Data show representative results fromtwo independent experiments. d, Supernatants from cultures as described inc were harvested after 48 h, and analysed by Bio-Plex to determine theconcentrations of IL-17 and GM-CSF. Data shown (mean 6 s.e.m.) are pooledfrom two independent experiments. b–d, Graphs show mean 6 s.e.m.. Resultswere compared using a two-way ANOVA followed by a Bonferroni post-test(*P , 0.05, **P , 0.01; ***P , 0.001). Results of comparison are shown forBp352/2
versus BWT (b), and for BWT B cells plus BWT Teff versus Bp352/2
B cells plus BWT Teff (d).
LETTER RESEARCH
2 0 M A R C H 2 0 1 4 | V O L 5 0 7 | N A T U R E | 3 6 7
Macmillan Publishers Limited. All rights reserved©2014

disease dependent on pathogenic functions of B cells25. These findingsintroduce IL-35 as a regulator of the APC function of B cells.
To test the role of B-cell-derived IL-35 in infection, we challengedBp352/2
, BEbi32/2
and Bp402/2
mice with the Gram-negative bacteriumSalmonella enterica serovar Typhimurium (hereafter referred to asSalmonella). This intracellular pathogen causes a disease in mice thatresembles typhoid fever in humans, responsible for approximately20 million cases and 600,000 deaths annually26. Bp352/2
and BEbi32/2
mice displayed longer survival than Bp402/2
and BWT mice after prim-ary infection, and upon secondary challenge (Fig. 3a). This improvedresistance correlated with better control of the bacterial burden in spleenand liver, increased accumulation of macrophages in these organs, andstronger inflammatory T-cell responses towards Salmonella (Fig. 3b, cand Extended Data Fig. 4). In contrast, B-cell-derived IL-35 had noeffect on Treg frequencies, global frequencies of activated T cells orhumoral immunity against Salmonella (Extended Data Figs 4 and 5a).Bp352/2
mice also mounted normal antibody responses against a hapten-protein antigen (Extended Data Fig. 5b). Consistent with the role ofCD40 in IL-35 production by B cells (Fig. 1), mice with a B-cell-restricteddeficiency in CD40 displayed enhanced control of Salmonella infection(Extended Data Fig. 5c). These data demonstrate that B cells can inhibitanti-microbial immunity through production of IL-35.
B cells can also inhibit anti-Salmonella immunity through IL-10 (ref. 6).To identify IL-10- and IL-35-producing B cells, and clarify their rela-tionship, we quantified Ebi3 and Il10 mRNA in CD191CD1382 B cellsand CD138hi plasma cells during Salmonella infection (Fig. 4a andExtended Data Fig. 6). Ebi3 and Il10 were exclusively induced inCD138hi cells (Fig. 4a). Single-cell PCR analyses indicated that distinctsets of CD138hi cells expressed the mRNA for Il10 or for both IL-35subunits Ebi3 and p35 (Fig. 4b). We therefore characterized further theseplasma cells. They expressed uniform surface levels of IgM, CD80, CD86,MHC-II, CD40, CD69, CD44, CD43, TACI and CXCR4, as well asintermediate levels of CD1d (also known as Cd1d1) and Tim1 (alsoknown as Havcr1) (Extended Data Fig. 6a, d), yet three subsets could bedistinguished according to CD138 and CD22 levels: CD138intCD221,CD138hiCD221 and CD138hiCD222 cells (Extended Data Fig. 7). Thesesubsets differed by their capacity to produce antibodies, and expresseddistinct amounts of mRNA for the transcription factors driving plasmacell development (Blimp1, IRF4), or maintaining B-cell identity (Pax5)(Extended Data Fig. 7), demonstrating that they corresponded to dif-ferent stages of plasma cell development. The expression levels of Il10and Ebi3 mRNA in these subsets correlated with their degree of matur-ity, and were highest in the most differentiated CD138hiCD222 cells(Extended Data Fig. 7c). CD138hiCD222 plasma cells were mostlylocated at the interface between red and white pulp in spleen, in clustersalso containing T cells, CD11b1 and CD1691 myeloid cells (ExtendedData Fig. 7d). Single-cell PCR analyses revealed that 6–10% of CD138hi
cells expressed Il10 mRNA, and a similar frequency made mRNA forboth IL-35 subunits, whereas few cells co-expressed these three tran-scripts together (Fig. 4b). Nearly all CD138hi cells transcribing Il10 orboth IL-35 subunits co-expressed Blimp1 (Fig. 4c), as expected forplasma cells. The less mature CD138intCD221 population containedlittle Il10 or Ebi3 mRNA (Extended Data Fig. 7c), and only rare cellscontained Il10 mRNA (Fig. 4b), suggesting that expression of IL-10and both IL-35 subunits were acquired during plasma cell maturation.These data indicate that distinct sets of plasma cells provide IL-10 andIL-35 during Salmonella infection.
Plasma cells from mice infected with Salmonella consistently secretedmore IL-10 than B cells upon ex vivo stimulation (Fig. 4d and ExtendedData Fig. 8). Around 70% of CD138hi plasma cells upregulated IL-10expression after stimulation with phorbol 12-myristate 13-acetate plusionomycin, a classical treatment for identifying cytokine-producingcells (Extended Data Fig. 8). CD1381 plasma cells were also the majorB-cell subtype expressing the proteins EBI3 and p35 (Fig. 4e). In contrast,CD138hi plasma cells did not secrete IL-6, a mediator of pro-inflammatoryfunctions of B cells27, unlike CD191CD1382 B cells (Extended Data
Fig. 8). This lack of IL-6 production, which may reflect a repressiveeffect of Blimp1 (ref. 28), distinguishes IL-10- and IL-35-expressingplasma cells from IL-10-producing CD1dhi B cells (Extended DataFig. 8). CD138hi plasma cells therefore have a remarkable propensityto express anti-inflammatory cytokines but not IL-6 during Salmonella
a
0 5 10 150
20
40
60
80
100
Days post-infection
Surv
ival (%
)
0
20
40
60
80
100
Surv
ival (%
)
0
20
40
60
80
100
Surv
ival (%
)
0
20
40
60
80
100
Surv
ival (%
)
0
20
40
60
80
100
Surv
ival (%
)
0
20
40
60
80
100
Surv
ival (%
)
0 5 10 15Days post-infection
0 5 10 15Days post-infection
P < 0.0001
P < 0.0001
P < 0.0001
Ly6C
CD
11b
0
2
4
6
8 P = 0.0079
Mo
no
nucle
ar
phag
ocyte
s
am
ong
sp
leno
cyte
s (%
)
0
1
2
3P < 0.0001
0
1
2
3
4NS
CD
40L
+ in C
D4
+ c
ells
(%
) P =
0.0394P =
0.0225
0
5
10
15
0
5
10
15
20
25
IFN
-γ+ in C
D4
+ c
ells
(%
) P =
0.0281
P =
0.0419
CD
4IFN-γ+ CD4+ T cells
IFN-γ
CD40L+ CD4+ T cellsc
0 10 20 30 40 50
Days post-rechallenge
0 10 20 30 40 50
Days post-rechallenge
0 10 20 30 40 50
Days post-rechallenge
P = 0.0030
b104
103
102
101
100
104
103
102
101
101 102 103 104100
100
101 102 103 104100
104
103
102
101
100
100 101 102 103 104
NS
NS
MP
BWT BWT
BWT
BW
T
BW
T
BW
T
BWT
BWT
BWT
BWTBp35–/–
Bp35–/–
Bp35–/
–
Bp40–/–
Bp40–/–
Bp40–/
–
BEbi3–/–
BEbi3–/–
BEbi3–/
–
BW
T
BW
T
BW
T
Bp35–/
–
Bp40–/
–
BEbi3–/
–
Bp35–/–
Figure 3 | B-cell-derived IL-35 enhances susceptibility to Salmonella.a, Top panel shows survival curves of Bp352/2
(n 5 14) and correspondingBWT mice (n 5 16), BEbi32/2
(n 5 12) and corresponding BWT mice (n 5 13),Bp402/2
(n 5 13) and corresponding BWT mice (n 5 14) after infection withvirulent Salmonella (SL1344). Data pooled from two independent experiments.Survival curves were compared using Wilcoxon test. Bottom panel showssurvival curves of Bp352/2
(n 5 15) and corresponding BWT mice (n 5 16),BEbi32/2
(n 5 15) and corresponding BWT mice (n 5 15), Bp402/2
(n 5 11) andcorresponding BWT mice (n 5 14) vaccinated with attenuated Salmonella(SL7207) and 90 days later re-challenged with virulent Salmonella (SL1344).Data are pooled from two independent experiments. Survival curves werecompared using Wilcoxon test. b, Representative FACS plot of mononuclearphagocytes (MP) gated as CD11b1Ly6Chi cells among live BWT splenocytesat day 6 post-infection (p.i). with SL1344 (left panel); frequencies of MPper spleen at day 6 p.i. in Bp352/2
, BEbi32/2
, and Bp402/2
mice together withtheir corresponding BWT controls (right panel). Numbers of mice: Bp352/2
(n 5 6) and BWT (n 5 8), BEbi32/2
(n 5 7) and BWT (n 5 5), Bp402/2
(n 5 8)and BWT (n 5 8). Data are pooled from two independent experiments.Graphs show mean 6 s.e.m. c, Mice were infected with attenuated Salmonella(SL7207). After 21 days, bone marrow cells were stained for CD4 and CD40Lor IFN-c after 6 h re-stimulation with heat-killed Salmonella. RepresentativeFACS plots of IFN-c1 cells among CD41 T cells from BWT and Bp352/2
mice(left panel). Frequencies of IFN-c1 and CD40L1 cells among CD41 T cells,(middle and right panels, respectively). Data are pooled from two independentexperiments with total number of mice: Bp352/2
(n 5 12) and correspondingBWT (n 5 10), BEbi32/2
(n 5 8) and corresponding BWT (n 5 9), Bp402/2
(n 5 15)and corresponding BWT (n 5 9). b, c, Data were analysed using two-tailedunpaired t-test with Welch’s correction in case of unequal variance. P values.0.05 are considered not significant (NS).
RESEARCH LETTER
3 6 8 | N A T U R E | V O L 5 0 7 | 2 0 M A R C H 2 0 1 4
Macmillan Publishers Limited. All rights reserved©2014

infection, emphasizing the regulatory potential of plasma cells com-pared to other B cell subsets.
Our study identifies IL-35-producing B cells as critical regulators ofimmunity. At a time window during Salmonella infection when bothB-cell-derived IL-10 (ref. 6) and IL-35 exerted suppressive functions,plasma cells were the major B-cell type expressing these cytokines. Thiswas also the case during EAE (Extended Data Fig. 9). During Salmonellainfection, IL-10 and IL-35 were made by distinct sets of plasma cells,suggesting that these two suppressive axes can operate in parallel. Inline with this, mice in which individual B cells could express eitherIL-10 or IL-35, but not both cytokines, displayed a normal EAE course(Extended Data Fig. 9). Accordingly, B and plasma cells could produceIL-10 without concomitant IL-35 secretion (Extended Data Fig. 9).Future studies shall assess whether ‘regulatory plasma cells’ producingIL-10 and IL-35 (but not IL-6) can provide novel opportunities forimmune intervention.
METHODS SUMMARYBTlr22/2
, BTlr42/2
, Bp352/2
, BEbi32/2
, Bp402/2
, Bp282/2
and BWT mice were generatedusing a previously described mixed bone marrow chimaera approach3,6, as detailedin the Methods, and outlined in Extended Data Fig. 10. This protocol allowed normalreconstitution of the B-cell compartment in the resulting chimaera (Extended DataFig. 10). EAE was induced in mice by immunization with MOG35–55 emulsified incomplete Freund’s adjuvant (Sigma-Aldrich). The disease score and the MOG35–55
specific T-cell responses (at days 10 and 28) were assessed as described previously3.Mouse B cells were purified and activated as described before15. Cytokine secretionwas determined by Bio-Plex or ELISA. Whole transcriptome analyses were per-formed with RNA purified from naive and activated B cells, using GeneChipMouse Genome 430 2.0 Arrays. For mRNA quantification, total RNA was isolatedwith TRIzol (AMS Biotechnology) and cDNA was prepared with the Reverse Trans-cription Kit (Promega). Quantitative RT–PCR was performed with LightCyclerFastStart DNA Master SYBR Green I (Roche). Western blots to determine EBI3,p35 and actin expression were performed using anti-EBI3 (rabbit M75 polyclonalAb), anti-p35 (rabbit EPR5736 polyclonal Ab), and anti-actin (rabbit I-19 poly-clonal Ab), respectively. For immunoprecipitation, IL-35 was captured with anti-p35 antibody (clone C18.2; eBioscience) followed by precipitation using mMACSProtein G microbeads (Miltenyi Biotech). Infections with virulent and attenuatedSalmonella (strains SL1344 and SL7207, respectively) were performed as pub-lished6. Flow cytometry analyses were performed as previously described6. Otherprotocols are described in the Methods.
Online Content Any additional Methods, Extended Data display items and SourceData are available in the online version of the paper; references unique to thesesections appear only in the online paper.
Received 24 January 2012; accepted 30 December 2013.
Published online 23 February 2014.
1. Fillatreau, S., Gray, D. & Anderton, S. M. Not always the bad guys: B cells asregulators of autoimmune pathology. Nature Rev. Immunol. 8, 391–397 (2008).
2. Fillatreau, S. Novel regulatory functions for Toll-like receptor-activated B cellsduring intracellular bacterial infection. Immunol. Rev. 240, 52–71 (2011).
3. Fillatreau, S., Sweenie, C. H., McGeachy, M. J., Gray, D. & Anderton, S. M. B cellsregulate autoimmunity by provision of IL-10. Nature Immunol. 3, 944–950 (2002).
4. Mauri, C., Gray, D., Mushtaq, N. & Londei, M. Prevention of arthritis by interleukin10-producing B cells. J. Exp. Med. 197, 489–501 (2003).
5. Mizoguchi, A., Mizoguchi, E., Takedatsu, H., Blumberg, R. S. & Bhan, A. K. Chronicintestinal inflammatory condition generates IL-10-producing regulatory B cellsubset characterized by CD1d upregulation. Immunity 16, 219–230 (2002).
6. Neves, P. et al. Signaling via the MyD88 adaptor protein in B cells suppressesprotective immunity during Salmonella typhimurium infection. Immunity 33,777–790 (2010).
7. Duddy, M. et al. Distinct effector cytokine profiles of memory and naive humanB cell subsets and implication in multiple sclerosis. J. Immunol. 178, 6092–6099(2007).
8. Jagannathan, M. et al. Toll-like receptors regulate B cell cytokine production inpatients with diabetes. Diabetologia 53, 1461–1471 (2010).
9. Benedetti, L. et al. Relapses after treatment with rituximab in a patient withmultiple sclerosis and anti myelin-associated glycoprotein polyneuropathy.Arch. Neurol. 64, 1531–1533 (2007).
10. Goetz, M., Atreya, R., Ghalibafian, M., Galle, P. R. & Neurath, M. F. Exacerbation ofulcerative colitis after rituximab salvage therapy. Inflamm. Bowel Dis. 13,1365–1368 (2007).
11. El Fassi, D., Nielsen, C. H., Kjeldsen, J., Clemmensen, O. & Hegedus, L. Ulcerativecolitis following B lymphocyte depletion with rituximab in a patient with Graves’disease. Gut 57, 714–715 (2008).
0 1 2 3 4 5 6 7 80
5
10
15
20
25
CD138hi plasma cells
Ebi3
mR
NA
fo
ld
ind
uctio
n
0 1 2 3 4 5 6 7 80
100
200
300
400
Il10
mR
NA
fo
ld
ind
uctio
n
CD19+CD138– B cellsa
b
c d
0
20
40
60
80
100
0
20
40
60
80
100
Blim
p1+
in p35
+Ebi3
+ c
ells
(%
)
0
3
6
9
12
0
3
6
9
12
p35
+Ebi3
+ c
ells
(%
)
Il10+
cells
(%
)
0
3
6
9
12
Il10+p35
+Ebi3
+ c
ells
(%
)
CD13
8hi C
D22
+
CD13
8hi C
D22
–
CD13
8int C
D22
+
CD13
8hi C
D22
+
CD13
8hi C
D22
–
CD13
8int C
D22
+
CD13
8hi C
D22
+
CD13
8int C
D22
+
Days post-infection Days post-infection
Blim
p1+
in Il10
+ c
ells
(%
)
CD13
8hi C
D22
+
CD13
8hi C
D22
–
CD13
8hi C
D22
+
CD13
8hi C
D22
–
Naive
B cellsB cells
no. 1
B cells
no. 2
PC
no. 1
PC
no. 2
PC
no. 1
B cells
no. 1
WT cells - day 3 p.i. KO cells - day 3 p.i.
EBI3
p35
Actin
e
Naive
B
CD13
8– B
CD13
8hi
0
1,000
2,000
3,000
4,000
PMA + ionomycin
P = 0.0012
IL-1
0 (p
g m
l–1)
CD13
8hi C
D22
–
Figure 4 | IL-10 and IL-35 are expressed by CD138hi plasma cells duringSalmonella infection. a, Splenic plasma cells (PC) (CD138hi) and B cells(CD191CD1382) were isolated from C57BL/6 mice on days 0, 1, 3, 5, and 8after infection with 107 c.f.u. attenuated Salmonella (SL7207). Ebi3 and Il10mRNA expression was quantified by RT–PCR. Data show fold inductionof Ebi3 (left) and Il10 (right) in PC and B cells compared to naive B cells.A compilation of five independent experiments is shown (mean 6 s.e.m.).b, Single CD138intCD221, CD138hiCD221, and CD138hiCD222 cells weresorted by FACS from C57BL/6 mice on day 3 after infection with 107 c.f.u.attenuated Salmonella (SL7207). A total of 208 CD138intCD221, 206CD138hiCD221 and 189 CD1381CD222 cells expressed b-actin, and wereincluded for analysis. Data show percentages of Il101 (left), p351Ebi31
(middle), and Il101p351Ebi31 (right) cells among each subset. c, Blimp1mRNA expression in cells analysed in (c) was also detected by single-cell PCR.Data show percentages of Blimp11 cells among Il101 (left), and p351Ebi31
cells (right). d, CD138hi PC and CD191CD1382 B cells were isolated fromspleens of C57BL/6 mice on day 3 after infection with attenuated Salmonella(107 c.f.u.). Naive B splenic B cells were isolated from unchallenged C57BL/6mice. Cells were activated for 24 h with PMA/ionomycin and IL-10 wasdetermined in culture supernatants by Bio-Plex. Data shown is pooled from5 independent experiments. Results were compared using a two-tailedunpaired t-test. e, Splenic CD191CD1382 B cells and CD1381 plasma cellswere isolated from spleens of C57BL/6 (WT) and p352/2Ebi32/2p402/2
mice on day 3 p.i. with attenuated Salmonella (107 c.f.u.). Proteins wereseparated on SDS–PAGE gel and detected with anti-EBI3, anti-p35 oranti-actin antibodies. Data show results from two independent preparationsfor WT samples, and one preparation for p352/2Ebi32/2p402/2 B andplasma cells.
LETTER RESEARCH
2 0 M A R C H 2 0 1 4 | V O L 5 0 7 | N A T U R E | 3 6 9
Macmillan Publishers Limited. All rights reserved©2014

12. Dass, S., Vital, E. M. & Emery, P. Development of psoriasis after B cell depletion withrituximab. Arthritis Rheum. 56, 2715–2718 (2007).
13. Wilson, M. S. et al. Helminth-induced CD191CD23hi B cells modulateexperimental allergic and autoimmune inflammation. Eur. J. Immunol. 40,1682–1696 (2010).
14. Su, Y., Zhang, A. H., Noben-Trauth, N. & Scott, D. W. B-cell gene therapy fortolerance induction: host but not donor B-cell derived IL-10 is necessary fortolerance. Front. Microbiology 2, http://dx.doi.org/10.3389/fmicb.2011.00154(2011).
15. Lampropoulou, V. et al. TLR-activated B cells suppress T cell-mediatedautoimmunity. J. Immunol. 180, 4763–4773 (2008).
16. Devergne, O., Birkenbach, M. & Kieff, E. Epstein-Barr virus-induced gene 3 and thep35 subunit of interleukin 12 form a novel heterodimeric hematopoietin. Proc.Natl Acad. Sci. USA 94, 12041–12046 (1997).
17. Collison, L. W. et al. The inhibitory cytokine IL-35 contributes to regulatory T-cellfunction. Nature 450, 566–569 (2007).
18. Niedbala, W. et al. IL-35 is a novel cytokine with therapeutic effects againstcollagen-induced arthritis through the expansion of regulatory T cells andsuppression of Th17 cells. Eur. J. Immunol. 37, 3021–3029 (2007).
19. Villarino, A. et al. The IL-27R (WSX-1) is required to suppress T cell hyperactivityduring infection. Immunity 19, 645–655 (2003).
20. Brentano, F. et al. Abundant expression of the interleukin (IL)23 subunit p19, butlow levels of bioactive IL23 in the rheumatoid synovium: differential expressionand Toll-like receptor-(TLR) dependent regulation of the IL23 subunits, p19 andp40, in rheumatoid arthritis. Ann. Rheum. Dis. 68, 143–150 (2009).
21. Kuchroo, V. K. et al. Cytokines and adhesion molecules contribute to the ability ofmyelin proteolipid protein-specific T cell clones to mediate experimental allergicencephalomyelitis. J. Immunol. 151, 4371–4382 (1993).
22. Park, H. et al. A distinct lineage of CD4 T cells regulates tissue inflammation byproducing interleukin 17. Nature Immunol. 6, 1133–1141 (2005).
23. Bettini, M., Castellaw, A. H., Lennon, G. P., Burton, A. R. & Vignali, D. A. Prevention ofautoimmune diabetes by ectopic pancreatic b-cell expression of interleukin-35.Diabetes 61, 1519–1526 (2012).
24. McGeachy, M. J., Stephens, L. A. & Anderton, S. M. Natural recovery and protectionfrom autoimmune encephalomyelitis: contribution of CD41CD251 regulatorycells within the central nervous system. J. Immunol. 175, 3025–3032 (2005).
25. Weber, M. S. et al. B-cell activation influences T-cell polarization and outcome ofanti-CD20 B-cell depletion in central nervous system autoimmunity. Ann. Neurol.68, 369–383 (2010).
26. Mittrucker, H. W. & Kaufmann, S. H. Immune response to infection with Salmonellatyphimurium in mice. J. Leukoc. Biol. 67, 457–463 (2000).
27. Barr, T. A. et al. B cell depletion therapy ameliorates autoimmune disease throughablation of IL-6-producing B cells. J. Exp. Med. 209, 1001–1010 (2012).
28. Chan,Y.H.et al. Absenceof the transcriptional repressor Blimp-1 inhematopoieticlineages reveals its role in dendritic cell homeostatic development and function.J. Immunol. 183, 7039–7046 (2009).
Acknowledgements We thank H. Schliemann, H. Ruebsamen, M. Spadaro andD. Jenne for assistance and support. We thank M. Loehning for providing IL-12p40-deficientmice, andS.Akira forprovidingTLR2-andTLR4-deficientmice.We thankO. Neyrolles for help with some of the in vivo experiments. We thank E. Schott for helpwith the AST/ALT measurements. S.F. is supported by grants from the DeutscheForschungsgemeinschaft (SFB-650, TRR-36, TRR-130, FI-1238/02), Hertie Stiftung,and an advanced grant from the Merieux Institute. C.D and T.D. are supported by theDeutsche Forschungsgemeinschaft (SFB-650, Do491/7-2, 8-2). P.B. and L.J. aresupportedby INRA.A.B.-O. is supportedby a CIHR/MSSCNewEmergingTeamgrant inClinical Autoimmunity. Work in S.M.A.’s laboratory was supported by grants from theUK Medical Research Council and the Wellcome Trust. E.M. is supported by the ClinicalCompetence Network for Multiple Sclerosis and SFB-TR128.
Author Contributions P.S., T.R. and V.L. performed most of the experiments, the dataanalysis, and edited the manuscript. R.A.O., U.S., E.H., S.R., V.D.D., Y.J., C.D., R.L., L.J., P.B.,S.W., I.S., Y.M., M.D.L., R.C.M., S.W., M.N., K.H., E.M., A.G., J.R.G., K.H., A.A.K., T.D., A.B.-O.,S.H.E.K. and S.M.A. contributed to some experiments. L.J., P.B., A.G. and J.R.G.performed themicroarray dataanalysis. T.D., S.H.E.K. andS.M.A. helpedwith thewritingof the manuscript. S.M.A. helped with the design of some experiments. S.F. designedthe study, performed some experiments and wrote the manuscript.
Author Information The gene array data have been deposited in NCBI’s GeneExpression Omnibus database with the accession number GSE35998. Reprints andpermissions information is available at www.nature.com/reprints. The authors declareno competing financial interests. Readers are welcome to comment on the onlineversion of the paper. Correspondence and requests for materials should be addressedto S.F. ([email protected]).
RESEARCH LETTER
3 7 0 | N A T U R E | V O L 5 0 7 | 2 0 M A R C H 2 0 1 4
Macmillan Publishers Limited. All rights reserved©2014

METHODSMice, immunization and infection. C57BL/6, Tlr22/2, Tlr42/2, Ebi32/2, p282/2,p352/2, p402/2, Cd402/2, Il102/2, Il102/2p352/2, p352/2Ebi32/2p402/2, JHT,IL-10–eGFP6, and p352/2 IL10–eGFP mice were bred under specific pathogen-free conditions. BTlr22/2
, BTlr42/2
, Bp282/2
, Bp352/2
, BEbi32/2
, Bp402/2
, BCd402/2
andBIl102/2
mice were obtained by a previously described mixed bone marrow chi-maera approach using lethally irradiated C57BL/6 or JHT mice as recipients3,6.Briefly, Bp352/2
mice were obtained by reconstituting recipient mice with a mixtureof bone marrow cells from B-cell-deficient JHT mice (80%) and p35-deficient mice(20%). Control BWT chimaera were obtained using a mixture of bone marrow cellsfrom JHT mice (80%) and C57BL/6 mice (20%) for experiments shown in Fig. 1a,Fig. 2a left panel, and Fig. 2a, right panel. For all other experiments (includingFig. 2a middle panel, and Extended Data Fig. 2a), corresponding BWT controlchimaera were obtained as outlined in Extended Data Fig. 10, by reconstitutingirradiated mice with a mixture of bone marrow cells from C57BL/6 mice (80%) andfrom mice deficient in the gene of interest (20%). The various control chimaera arecalled ‘corresponding BWT mice’ throughout the study. EAE was induced byimmunization with MOG35–55 peptide, or recombinant human MOG extracellulardomain emulsified in Complete Freund’s adjuvant (Sigma-Aldrich) and pertussistoxin (Sigma-Aldrich), and assessed as previously described3. Mice with a weightloss .20% were humanely euthanized according to ethical regulations. To mea-sure the MOG-reactive T cell response, 8 3 105 splenocytes were stimulated in flat-bottomed 96-well plates with different concentrations of MOG35–55 peptide for2 days, and culture supernatants were then analysed by ELISA to determine con-centrations of IFN-c and IL-17 (coating/detection with clones R4-6A2 and XMG1.2for IFN-c, and TC11-18H10 and TC11-8H4 for IL-17). Mice were infected intra-venously with 100 c.f.u. Salmonella strain SL1344, and 106 or 107 c.f.u. attenuatedSalmonella strain SL7207, and assessed as previously described, including forhistological analyses6. All experiments were reviewed and approved by appropriateinstitutional review committees (University of Edinburgh ethical review commit-tee, Comite d’Ethique Midi-Pyrenees, and LAGeSo Berlin), and were conducted inaccordance with UK, French and German legislations, in compliance with Europeancommunity council directive 68/609/EEC guidelines. Mice were of C57BL/6 strain,6–12-weeks old at the start of experiments, and of male and female genders. EAEexperiments and Salmonella infections were performed in a blinded manner, andidentities of the mice were revealed upon termination of the experiment. Norandomization was used. Estimation of size groups was based on our previousexperience with these disease models, without a priori determination by powercalculation.B-cell purification and activation. B cells were obtained by magnetic isolationusing negative selection with anti-CD11b, anti-CD11c, and anti-CD43 microbe-ads (Miltenyi Biotec). B cells (.99% pure) were activated as previously described15
at 5 3 105 cells per well in 96-well flat-bottom plates with LPS (Escherichia coliserotype 055:B5; Sigma-Aldrich), CpG-ODN-1826 (TIB MolBiol, Germany), PGN(Streptomyces species 79682; Sigma-Aldrich), agonistic anti-CD40 antibody (cloneFGK-45, produced in house), mouse CD40L-expressing L47 cells (L47-CD40L1),or control L5 cells (L5-ctrl) as indicated. Culture supernatants were collected at72 h, and IL-10 concentrations measured by Bio-Plex (Bio-Rad). For the micro-array experiments, B cells purified as described above were further depleted ofpossible contaminants by another round of magnetic negative selection after re-labelling with anti-CD11b, anti-CD11c, anti-CD43, anti-CD90, and anti-DX5microbeads (Miltenyi Biotec). B cells were activated with LPS (1mg ml21) orLPS (1mg ml21) plus anti-CD40 (10mg ml21). Dead cells were eliminated fromthe 24 h and 72 h activated culture by labelling with propidium iodide (PI), andsorting on FACS Diva (BD Biosciences). Cells were lysed in RLT buffer (Qiagen)and total RNA was extracted using RNeasy Mini Kit (Qiagen).Gene array hybridization and data analysis. cRNA were hybridized on AffymetrixMG 430 2.0 arrays, using standard Affymetrix protocol after quality control withAgilent 2100 Bioanalyzer and quantification with NanoDrop ND-1000 spectro-photometer, as previously described29. The significantly differentially regulatedgenes were detected using a t-test based R-script, with P values adjusted usingBenjamini Hochberg procedure. In order to be selected in a comparison of twoconditions, each Affymetrix ID had to fulfill the following criteria: (1) be present inat least three of the four arrays for at least one of the two conditions compared, (2) tohave a mean signal intensity higher than 50 in at least one of the two conditions,and (3) to show an adjusted P value ,0.01 (t-test) in the comparison of the twoconditions. The genes differentially expressed between TLR4-activated and TLR4-activated plus CD40-activated B cells (t-test; P , 0.01), and differentially modu-lated during B-cell activation (t-test; P , 0.01), were then selected and filtered usingthe gene ontology resource (http://www.geneontology.org) to focus on secretedmolecules (Extended Data Fig. 1c). Seven genes fulfilled these criteria, among whichfive were uniquely increased in TLR4 plus CD40-stimulated B cells (Extended Data
Fig. 1c). Hierarchical clustering was performed with the MeV program (version4.8.1)30 using Pearson correlation and average linkage.Analysis of mRNA expression by B and plasma cells. Sorted B and plasma cellswere lysed in TRIzol, and RNA was prepared (AMS Biotechnology). After DNasetreatment (Ambion), RNA was reverse-transcribed with a Reverse TranscriptionSystem (Promega). Quantitative RT–PCR was performed on an MX3005P QPCRSystem (Stratagene), with LightCycler FastStart DNA Master SYBR Green I (Roche).Transcripts were quantified using b-actin as standard, and the following forward(FP) and reverse (RP) primers (MWG Biotech): b-actin FP: 59-TGGAATCCTGTGGCATCCATGAAAC-39, b-actin RP: 59-TAAAACGCAGCTCAGTAACAGTCC-39; EBI3 FP: 59-CGGTGCCCTACATGCTAAAT-39, EBI3 RP: 59-GCGGAGTCGGTACTTGAGAG-39; p35 FP: 59- CATCGATGAGCTGATGCAGT-39, p35RP: 59-CAGATAGCCCATCACCCTGT-39; IL-10 FP: 59-AGCCGGGAAGACAATAACTG-39, IL-10 RP: 59-CATTTCCGATAAGGCTTGG-39; Blimp1 FP:59- GGCATTCTTGGGAACTGTGT-39; Blimp1 RP: 59- GACAGAGGCCGAGTTTGAAG-39; IRF4 FP: 59- GCAGCTCACTTTGGATGACA-39; IRF4 RP: 59-CCAAACGTCACAGGACATTG-39; Pax5 FP: 59-AACTTGCCCATCAAGGTGTC-39;Pax5 RP: 59-CTGATCTCCCAGGCAAACAT-39.Western blot and immunoprecipitation. Activated B cells were treated withGolgiStop (BD Biosciences, Germany) to block protein secretion during the last4 h of stimulation. B cells (2 3 107) were lysed with 500ml RIPA buffer (ThermoFisher Scientific, USA) supplemented with protease inhibitors (Thermo FisherScientific, USA). Cells isolated from mice infected with Salmonella were directlylysed in RIPA buffer containing protease inhibitors. Protein concentrations oflysates were determined using the BCA Protein Assay Kit (Thermo Fisher Scientific,USA). Proteins were separated on a polyacrylamide gel and transferred to a PVDFmembrane (Bio-Rad Laboratories, USA) using semi-dry blotting. EBI3, p35 andactin were detected using rabbit anti-EBI3 (M-75 polyclonal IgG, Santa CruzBiotechnology, USA), rabbit anti-p35 (EPR5736 polyclonal IgG, Abcam, UK),or rabbit anti-actin (I-19 polyclonal Ab, Santa Cruz Biotechnology, USA) primaryantibody, and horseradish peroxidase (HRP)-conjugated secondary anti-rabbitantibody (cat. number: 81-6120, Invitrogen, USA; or cat. number: 111-035-144,Jackson ImmunoResearch, USA) with ECL (GE Healthcare, UK) as HRP substrate.The chemiluminescence signal was measured using the Image-Reader LAS-3000(Fujifilm, Japan). For immunoprecipitation, supernatant from B cells activatedwith LPS plus anti-CD40 (clone FGK-45, 10mg ml21) were incubated overnightat 4 uC with 2mg ml21 anti-p35 (C18.2, eBioscience). Immunoprecipitation wasperformed using mMACS Protein G Microbeads (Miltenyi Biotech), followed byimmunoblot to detect EBI3.B–T cell co-cultures. The protocol for B–T cell co-cultures was adapted from aprevious report25. Briefly, B cells were magnetically sorted from pooled spleens andlymph nodes of Bp352/2
or BWT mice on day 10 post-EAE induction as CD191
cells (,98% pure), and Teff cells were FACS-sorted from the CD19-depletedfraction as previously described31. 50 3 104 B cells and 1 3 104 CD41CD252
T cells (Teff) were then co-cultured in the indicated combinations in presenceof increasing concentrations of MOG35–55. After 48 h cultures received 1mCi[3H]thymidine, and [3H]thymidine incorporation was measured 16 h later witha Top-Count NXT liquid scintillation counter (Perkin Elmer). Before addition of[3H]thymidine, samples of culture supernatants were collected to quantify con-centrations of IL-17, IFN-c, GM-CSF and IL-6 using Bio-Plex (Bio-Rad).Plasma cell purification. Plasma cells and B cells were obtained from C57BL/6,p352/2, p352/2Ebi32/2p402/2, IL-10–eGFP, and p352/2IL-10–eGFP mice onday 3 after infection with 107 colony forming units (c.f.u.) Salmonella (SL7207)by magnetic isolation using anti-CD138-PE (clone 281-2, BD Pharmingen) andanti-PE microbeads (Miltenyi Biotec). The negative fraction was then subjectedto FACS sorting to obtain high purity CD191CD1382 B cells. The positive fractionwas then stained for CD22 (clone OX-97, BioLegend), and subjected to FACSsorting to obtain high purity plasma cells (CD138hi), and plasma cell subsets(CD138intCD221, CD138hiCD221 and CD138hiCD222 cells). For western blot,CD138hi and CD138int cells were isolated as CD1381 plasma cells from infectedmice by magnetic isolation using anti-CD138-PE (clone 281-2, BD Pharmingen)and anti-PE microbeads (Miltenyi Biotec).Single-cell PCR analysis. Single cells were sorted on a FACS Aria II (BD Biosciences)into a 96-well PCR plate, immediately frozen in liquid nitrogen and stored at280 uC until further use. For detection of respective transcripts a two-step PCRapproach was used. Reverse transcription and the first PCR step were carried out ina one-step reaction using the Qiagen OneStep RT–PCR kit according to the man-ufacturer’s instructions. As recommended in these instructions, specific nestedprimers (MWG Biotech) were used as follows: EBI3nested FP: 59-CCTTCATTGCCACTTACAGG-39, EBI3nested RP: 59-TAATCTGTGAGGTCCTGAGC-39;p35nested FP: 59-CATTCTAGACAAGGGCATGC-39, p35nested RP: 59-GTGATGGGAGAACAGATTCC-39; IL-10nested FP: 59-TCTTACTGACTGGCATGAGG-39; IL-10nested RP: 59-CTTCTACCAGGTAAAACTGG-39; Blimp1nested FP:
LETTER RESEARCH
Macmillan Publishers Limited. All rights reserved©2014

59- CGTGAAGTTTCAAGGACTGG-39; Blimp1nested RP: 59- GTGGTGGAACTCCTCTCTGG-39. For validation of sorting, b-actin primers were added to thereaction mixture. After this first reaction, an aliquot of the PCR product was loadedon an agarose gel, and only b-actin positive samples were considered to furtheranalysis. A 100-fold dilution of the PCR product was subsequently used as templatefor the second PCR reaction using the primers described in the section: analysis ofmRNA expression by B and plasma cells. Amplification of the respective transcriptwas verified on an agarose gel.Histology. For immunostaining, 1- to 2-mm sections of formalin-fixed, paraffin-embedded tissue were cut, deparaffinized and subjected to a heat-induced epitoperetrieval step. Slides were rinsed in cool running water and washed in Tris-bufferedsaline (pH 7.4) before incubation with primary antibodies against CD3 (cat numberN1580, Dako, Glostrup, Denmark, dilution 1:10), and F4/80 (clone BM8, eBioscience,dilution 1:50) for 30 min, followed by biotinylated donkey anti-rat or donkey anti-rabbit (cat. numbers 712-065-153 and 711-065-152, Dianova, Hamburg, Germany)secondary antibodies. The streptavidin-AP kit (cat. number K5005, Dako) wasused for detection. As negative control, primary antibody was omitted.Detection of serum antibodies by ELISA. To quantify Salmonella-specific orNP-OVA-specific antibodies, diluted sera were incubated on 96-well plates coatedwith 5 3 106 heat-killed S. typhimurium per well or 50mg ml21 NP(15)-BSA (Bio-search Technologies), respectively. Detection was done with alkaline phosphatase-conjugated anti-IgM (cat number 1020-04), anti-IgG (cat number 1030-04), anti-IgG1(cat number 1070-04), anti-IgG2b (cat number 1090-04), anti-IgG2c (cat number1079-04), and anti-IgG3 (cat number 1100-04) antibodies (all from Southern Bio-technology Associates).Detection of mouse IL-27 p28 subunit by ELISA. The concentration of mouseIL-27 p28 subunit was quantified using the mouse IL-27 p28 Quantikine ELISA Kit(cat number M2728, R&D Systems), according to the manufacturer’s instructions.Isolation of CNS-infiltrating cells. CNS single-cell suspension was obtained bycollagenase digestion of brain and spinal cord. Infiltrating leukocytes were sepa-rated from debris and tissue cells using Ficoll centrifugation. Cell numbers weredetermined by FACS. Cells were characterized by flow cytometry after staining forCD4 (clone RM4-5), CD11b (clone M1/70), Ly6G (clone 1A8) and Foxp3 (cloneFJK16 s).Treg suppression assay. CD41CD251 T cells (Treg) were isolated from Bp352/2
and BWT mice on day 10 post-EAE induction, and compared for their capacity tosuppress the proliferation of CD41CD252 T cells (Teff) isolated from naiveC57BL/6 mice in vitro, as previously described31.ELISPOT Assay. Sorted B cells (CD191CD1382), and plasma cell subsets(CD138intCD221, CD138hiCD221, and CD138hiCD222 cells) or total plasmacells (CD1381) were seeded at a starting number of 104 cells per well, with sevensuccessive threefold serial dilutions, in 96-well flat-bottom EIA/RIA high-bindingplate (Millipore) pre-coated with anti-mouse Ig(H1L) chain (5mg ml21; SouthernBiotechnology Associates, cat number 1010-01). After 3 h incubation, plates werewashed, and incubated with alkaline phosphatase-conjugated anti-IgM or anti-IgG antibodies overnight at 4 uC (Southern Biotechnology Associates, cat numbers1020-04 and 1030-04). ELISPOT were then developed using BCIP/NBT substrate(Gene Tex Inc.).Stimulation and characterization of plasma cells and B cells. Purified plasmacells and B cells were seeded at 5 3 105 cells per well on 96-well flat-bottom platesand stimulated with PMA plus ionomycin, LPS (1mg ml21; Escherichia coli ser-otype 055:B5; Sigma-Aldrich), agonistic anti-CD40 antibody (10mg ml21; cloneFGK-45, produced in house), anti-IgM (5mg ml21, cat number 115-006-075,Jackson ImmunoResearch Laboratories, USA), IL-4 (20 ng ml21; R & D SystemsGmbH), IL-5 (20 ng ml21; eBioscience), IL-6 (20 ng ml21; R & D Systems GmbH),
IL-21 (20 ng ml21; R & D Systems GmbH), and indicated combinations. After 24 h,supernatants were harvested for the detection of IL-10 and IL-6 concentration byBio-Plex (Bio-Rad, USA); cells were subjected to flow cytometry for the quantifica-tion of GFP-positive cells. Characterizations were done by flow cytometry after stain-ing for CD19 (clone 1D3, BD Pharmingen), CD138 (clone 281-2, BD Pharmingen),IgM (cat number 1020-02, SouthernBiotech), IgD (clone 217-170, BD Pharmingen),CD80 (clone 16-10A1, BD Pharmingen), CD86 (clone GL1, BD Pharmingen), MHCII(clone M5/114, in house), CD40 (clone 3/23, BD Pharmingen), CD69 (clone H1.2F3,eBioscience), CD44 (clone 1M7, in house), CD43 (clone S7, BD Pharmingen),CD28 (clone E18, Biolegend), TACI (clone 8F10, BD Pharmingen), CXCR4 (clone2B11, BD Pharmingen), CD1d (clone 1.B1, in house) and Tim1 (clone RMT1-4,Biolegend).Validation of chimaeras. BEbi32/2
and corresponding BWT chimaeras were used asan example to demonstrate the validity of the chimaera system, that is, that thedeficiency in the gene of interest is restricted to B cells, and complete in that com-partment in BX2/2
mice. To this end, B cells, CD11b1 cells and CD41 T cells werepurified from BEbi32/2
and corresponding BWT chimaeras. Briefly, splenocytesfrom BEbi32/2
and BWT mice were subjected to CD19 positive selection usingmagnetic cell sorting. The CD191 fraction was subsequently stained for B220(clone RA3-6B2), CD11b (clone M1/70), CD11c (clone N418), CD4 (clone GK1.5),and CD8 (clone 53.6.72), and FACS-sorted for B2201CD11b2CD11c2CD42CD82
cells, yielding .99% pure B cells. The CD192 fraction obtained from the mag-netic sort was stained, and used to FACS-sort CD41B2202CD11b2 cells, andCD11b1B2202CD42 cells, resulting in . 97–98% pure CD41 T cells andCD11b1 cells, respectively. All sorted populations as well as the remaining non-T/B/CD11b1 cells (denoted as non-T, B, M cells) were lysed and genomic DNAwas extracted using the DNeasy Blood & Tissue Kit (Qiagen), according to themanufacturer’s instructions. The amounts of genomic DNA present in these sam-ples were equilibrated by real time PCR using the Mog gene as standard with theprimer pair: forward 59-AGGAAGGGACATGCAGCCGGA-39; reverse 59-CTGCATAGCTGCATGACAACTG-39. Wild-type Ebi3 gene was then amplified byconventional PCR with the following primers: forward 59-AACCTCAGGCCAGGCAGT-39; reverse 59-TTCCGTAGGCCATGTAGGAC-39, in order to testfor the presence of the wild-type Ebi3 allele in the different cell fractions.Additional reagents. Antibodies used in this study also included anti-Ly6C (cloneAL21, cat number 557359, BD Pharmingen), anti-IFN-c (clone XMG1.2, BDPharmingen), anti-CD154 (cat number 130-092-105, Miltenyi Biotech), anti-CD62L(MEL14, in house).Statistics. Statistical analysis was performed using GraphPad Prism (version 5.02for Windows, GraphPad Software, USA). EAE data distribution did not differfrom normal distribution, as evaluated using Kolmogorov–Smirnov test. Equalityof variances between groups was assessed before analyses by ANOVA or t-test.Groups were compared using ANOVA, two-tailed t-test, or Wilcoxon test, as indi-cated in figure legends. The t-tests were modified using Welch’s correction in caseof unequal variance. One-way and two-way ANOVA were followed by Bonferronipost-test. No samples were excluded from analysis. Statistical analysis of the genearray data are described in the section gene array hybridization and data analysis.
29. Biesen,R. et al. Sialic acid-binding Ig-like lectin 1 expression in inflammatory andresident monocytes is a potential biomarker for monitoring disease activity andsuccess of therapy in systemic lupus erythematosus. Arthritis Rheum. 58,1136–1145 (2008).
30. Saeed, A. I. et al. TM4: a free, open-source system for microarray datamanagement and analysis. Biotechniques 34, 374–378 (2003).
31. Hoehlig, K. et al. Activation of CD41 Foxp31 regulatory T cells proceeds normallyin the absence of B cells during EAE. Eur. J. Immunol. 42, 1164–1173 (2012).
RESEARCH LETTER
Macmillan Publishers Limited. All rights reserved©2014

LETTER RESEARCH
Macmillan Publishers Limited. All rights reserved©2014

Extended Data Figure 1 | Gene array analysis and IL-35 secretion by B cellsactivated in vitro. a, EAE was induced in BTlr22/2
(squares), BTlr42/2
(triangles)and BWT (circles) mice (see Fig. 1). Animals showing a bodyweight loss .20% and/or sustained front leg impairment were killed inaccordance with ethical regulations. Survival curves were compared usingWilcoxon test. b, In the top panels, splenic B cells from C57BL/6 mice werestimulated with lipopolysaccharides (LPS), peptidoglycan (PGN) or CpGDNA oligonucleotides for 72 h, as indicated, and IL-10 concentrations insupernatants were determined by Bio-Plex. Results from stimulated cells werecompared to unstimulated B cells (RPMI) using one-way ANOVA followed byBonferroni post-test (***P , 0.001; **P , 0.01; *P , 0.05; mean 6 s.e.m.);in the bottom panels, splenic B cells were simultaneously activated withanti-CD40 (clone FGK-45; in indicated amounts) and LPS (2mg ml21),PGN (2mg ml21) or CpG (2mg ml21). Supernatants were collected after 72 hand analysed for IL-10 content by Bio-Plex. Data shown are pooled from threeindependent experiments (mean 6 s.e.m.). Results from B cells stimulatedwith LPS, CpG or PGN alone were compared to B cells co-stimulated withanti-CD40 using one-way ANOVA followed by Bonferroni post-test(***P , 0.001; **P , 0.01; *P , 0.05). c, Affymetrix MG 430 2.0 wholegenome arrays were performed in quadruplicates for naive B cells, B cellsactivated by TLR4 for 24 h and 72 h, and B cells activated by TLR4 plus CD40for 24 h and 72 h (20 arrays in total). To obtain genes significantly regulatedupon stimulation with LPS, the expression profiles of naive B cells, B cellsactivated with LPS for 24 h, and B cells activated with LPS for 72 h werecompared to each other, generating three lists of differentially expressedAffymetrix IDs (referred to as genes in this figure), whose union provided a setof n 5 9,703 Affymetrix IDs differentially expressed during LPS activation.A similar analysis yielded a set of n 5 10,456 Affymetrix IDs differentiallyexpressed during LPS plus anti-CD40 activation. The union of these two setswas computed to obtain the list of Affymetrix IDs modulated during B-cellstimulation with LPS or LPS plus anti-CD40 (n 5 12,933). To focus ongenes differentially expressed between B cells activated with LPS or LPS plus
anti-CD40, the expression profiles of B cells activated with LPS or LPS plusanti-CD40 for 24 h were compared to each other. A similar analysis was donefor B cells activated for 72 h. The intersection of these two sets provided the listof Affymetrix IDs differentially expressed between LPS-activated and LPS-activated plus anti-CD40-activated B cells at both 24 h and 72 h (this wasdone to identify the Affymetrix IDs with long-term differential expression)(n 5 436). The intersection of the set n 5 12,933 with the set n 5 436 gave a listof 417 Affymetrix IDs, which was further filtered on Gene Ontology to extractthe Affymetrix IDs corresponding to secreted factors, yielding a final list of7 genes. d, Signal intensities of p35, Ebi3 and p40 mRNA expression werecalculated using the values of the Affymetrix arrays. Data show mean 6 s.e.m.e, f, Splenic murine B cells were stimulated with LPS (1mg ml21), PGN(10mg ml21), CpG ODN 1826 (1mg ml21), and anti-CD40 (clone FGK-45;10mg ml21), alone or in combination, as indicated, for 24 h or 72 h. p35 (e) andEbi3 (f) mRNA expression was then quantified by real-time PCR. Data compilethree independent experiments (mean 6 s.e.m.). For statistical analysis, one-way ANOVA test followed by Bonferroni post-test was performed comparingeach activated B-cell sample to naive B cells (***P , 0.001; **P , 0.01;mean 6 s.e.m.). g–i, Splenic murine B cells were stimulated for 72 h withanti-IgM (F(ab9)2 goat anti-mouse IgM; Jackson ImmunoResearch;5mg ml21), LPS (1mg ml21) and L47 cells (5 3 104 cells, irradiated), alone or incombinations, as indicated. g, h, Levels of p35 and Ebi3 mRNA expression werequantified by real-time PCR. Data show compilation of three independentexperiments (mean 6 s.e.m.). i, Splenic murine B cells were activated asindicated for 72 h, and treated with GolgiStop for the last 4 h of culture.B-cell lysates were separated on SDS–PAGE gel and blotted with anti-EBI3antibody. Data show representative results from three independentexperiments. j, Splenic B cell from C57BL/6 and p28 mice were stimulated withLPS (1mg ml21), CpG (1mg ml21), PGN (10mg ml21), anti-CD40(10mg ml21), alone or in combination, as indicated, for 72 h. p28concentrations in culture supernatants were determined by ELISA. Data shown(mean 6 s.em) are pooled from four independent experiments.
RESEARCH LETTER
Macmillan Publishers Limited. All rights reserved©2014

LETTER RESEARCH
Macmillan Publishers Limited. All rights reserved©2014

Extended Data Figure 2 | Characterization of immune reponses duringEAE in mice lacking IL-35 expression in B cells. a, EAE was induced in Bp352/2
(black diamonds, n 5 5) and corresponding BWT mice (white triangles, n 5 4).Data show clinical EAE scores (mean 6 s.e.m.) from two independentexperiments. Cumulative disease scores were compared using two-tailedunpaired t-test. b, EAE was induced in Bp282/2
(grey squares; n 5 10) andcorresponding BWT mice (dark grey circles, n 5 10). Splenocytes were collectedfrom mice on day 28 after EAE induction, and re-stimulated individually for48 h with MOG35–55. Supernatants were analysed by ELISA to determineconcentrations of IFN-c (middle) and IL-17 (right). Data (mean 6 s.e.m.) arepooled from two independent experiments. c, EAE was induced in Bp352/2
(triangles), BEbi32/2
(diamonds), Bp402/2
(squares), and BWT (circles) mice (seeFig. 2). Animals showing a body weight loss . 20% and/or sustained front legimpairment were killed in accordance with ethical regulations. Survival curveswere compared using Wilcoxon test. d, Splenocytes were collected from Bp352/2
,Bp402/2
, and BWT mice on day 28 after EAE induction (see Fig. 2a), and pooledbefore re-stimulation for 48 h with MOG35–55. Culture supernatants wereanalysed by ELISA to determine concentrations of IFN-c (left) and IL-17(right). Data show representative results from two independent experiments.Statistical analysis was performed using the two-way-ANOVA test followed bya Bonferroni post-test (*P , 0.05, **P , 0.01; ***P , 0.001; mean 6 s.e.m.).Results of analysis are shown for BWT versus Bp352/2
comparison. e–j, EAE wasinduced in Bp352/2
(grey squares; n 5 8) and corresponding BWT mice (darkgrey circles; n 5 8) and mice were killed at day 12 post-EAE induction toanalyse accumulation of immune cells in CNS. Data show clinical EAE scores
(mean 6 s.e.m.) (e). f–h, Mononuclear cells were isolated from CNS (brain plusspinal cord) of individual mice shown in (e), and numbers of total cells (f),CD41 T cells (g) and CD11b1Ly6G2 macrophages (h) were quantified by flowcytometry. Data shown (mean 6 s.e.m.) are pooled from two independentexperiments. Results were compared using two-tailed unpaired t-test withWelch’s correction in case of inequal variances. i, j, Representative FACSplots of CD41 T cells and CD11b1Ly6G2 macrophages, respectively.k, Frequencies of Foxp31 Treg cells among CD41CD82 T cells in CNS atday 12 post-EAE induction (left panel), and in spleen at day 10 post-EAEinduction (right panel) as determined by flow cytometry. Data shown in the leftpanel (mean 6 s.e.m.) are pooled from two independent experiments with10 mice per group in total. Data shown in the right panel (mean 6 s.e.m.) arerepresentative of three independent experiments with 9 mice per group in total.Results were compared using two-tailed unpaired t-test. P values .0.05 areindicated by ns. l, Treg suppression assay. CD41CD251 T cells (Treg)were FACS-sorted from pooled spleen and lymph nodes of Bp352/2
andcorresponding BWT mice on day 10 post-EAE induction, and then co-culturedat the indicated ratios with 2 3 104 CD41CD252 T cells (Teff) isolated fromnaive C57BL/6 mice in presence of 1 3 105 irradiated splenocytes and0.1mg ml21 anti-CD3 (clone 145-2C11). Proliferation was measured after 64 hof culture by incorporation of [3H]thymidine, and plotted as suppressionpercentage defining as 100% the proliferation values obtained for controlcultures without Treg cells. Data (mean 6 s.e.m.) are pooled from twoindependent experiments.
RESEARCH LETTER
Macmillan Publishers Limited. All rights reserved©2014

Extended Data Figure 3 | Lack of IL-35 production by B cells results inincreased activation of B cells during EAE. a, EAE was induced in Bp352/2
(n 5 6) and corresponding BWT mice (n 5 6). Mice were killed on day 10 afterimmunization and splenic B cells were analysed by flow cytometry for surfaceexpression of antigen-presenting molecules (MHC II), co-stimulatorymolecules (CD80, CD86), and activation markers (CD44, CD69). MFI, meanfluorescence intensity. Data (mean 6 s.e.m.) are pooled from two independentexperiments. Results were compared using two-tailed unpaired t-test withWelch’s correction in case of inequal variances. b, Representative histogramplots showing expression of these molecules on wild-type and p35-deficientB cells. Dead cells were excluded using propidium iodide. c, EAE was induced in
Bp352/2
and corresponding BWT mice. B cells and CD41CD252 T cells(Teff) were isolated from pooled lymph nodes and spleens on day 10 afterimmunization. To test the APC function of B cells (see Fig. 2), 5 3 105 B cellsfrom Bp352/2
or BWT mice were then cultured with 1 3 104 Teff cells from Bp352/2
or BWT mice in presence of MOG35–55, as indicated. Culture supernatants werecollected after 48 h, and analysed by Bio-Plex to determine concentrations ofIFN-c (left) and IL-6 (right). Data (mean 6 s.e.m.) are pooled from twoindependent experiments. Results were compared using two-way ANOVAfollowed by Bonferroni post-test (*P , 0.05). Results of analysis are shown forcomparison, BWT B cells plus BWT T cells versus Bp352/2
B cells plus Bp352/2
Tcells for IL-6.
LETTER RESEARCH
Macmillan Publishers Limited. All rights reserved©2014

RESEARCH LETTER
Macmillan Publishers Limited. All rights reserved©2014

Extended Data Figure 4 | Bacterial burden and T-cell activation in micelacking IL-35 production by B cells during Salmonella infection. a, Bp352/2
,BEbi32/2
, Bp402/2
and corresponding BWT mice were infected intravenously withvirulent Salmonella strain SL1344 (100 c.f.u.). Bacterial loads in spleens (top)and livers (bottom) were determined on day 6 post-infection (p.i). Data(mean 6 s.e.m.) are pooled from two independent experiments. Numbersof mice analysed: Bp352/2
(n 5 6) and corresponding BWT mice (n 5 8),BEbi32/2
(n 5 5) and corresponding BWT mice (n 5 5), Bp402/2
(n 5 6) andcorresponding control BWT mice (n 5 5). Data were analysed with two-tailedunpaired t-test. P values . 0.05 are indicated by ns. b, Top shows liverhistochemistry of total infiltrating cells (haematoxylin and eosin; H&E),T cells (CD3), and macrophages (F4/80) at day 6 p.i.; bottom, numbers ofinflammatory foci per liver section on day 6 p.i. Data (mean 6 s.e.m.) arepooled from two independent experiments. Numbers of mice analysed:Bp352/2
(n 5 6) and corresponding BWT mice (n 5 8), BEbi32/2
(n 5 7) andcorresponding BWT mice (n 5 5), Bp402/2
(n 5 7) and corresponding BWT mice(n 5 8). Data were compared using two-tailed unpaired t-test with Welch’scorrection in case of inequal variances. P values . 0.05 are indicated by ns.c, Bp282/2
(n 5 6) and corresponding BWT (n 5 6) mice were infectedintravenously with attenuated Salmonella (strain SL7207). On day 21 p.i. bonemarrow (BM) cells were isolated from individual mice, and re-stimulated for6 h with heat-killed Salmonella before staining for surface CD4, andintracellular CD40L or IFN-c. (top). Representative FACS plots showingCD40L and IFN-c expression by CD41 T cells, after gating on CD41 cells.
Bottom, frequencies of CD40L1 (left) and IFN-c1 (right) cells among CD41
T cells in BM (mean 6 s.e.m.). Data are pooled from two independentexperiments. Data were compared using two-tailed unpaired t-test. P values. 0.05 are indicated by ns. d, Representative FACS plot shows Foxp3expression by splenic CD41 T cells from a BWT mouse on day 21 p.i. withattenuated Salmonella (strain SL7207); (top right) frequency of Foxp31 Tregcells among CD41 T cells in spleens of naive Bp352/2
(n 5 5) and correspondingBWT mice (n 5 5), Bp402/2
(n 5 7) and corresponding BWT mice (n 5 7);(bottom) frequency of Foxp31 Treg cells among CD41 T cells on day 21 p.i.with attenuated Salmonella (strain SL7207) in spleens of Bp352/2
(n 5 8) andcorresponding BWT mice (n 5 8), BEbi32/2
(n 5 10) and corresponding BWT
mice (n 5 10), Bp402/2
(n 5 15) and corresponding BWT mice (n 5 9), Bp282/2
(n 5 6) and corresponding BWT mice (n 5 6). Data (mean 6 s.e.m.) are pooledfrom two independent experiments. Data were analysed with two-tailedunpaired t-test. P values .0.05 are indicated by ns. e, Mice were infected as in(d) and frequency of activated CD44hiCD62Llo CD41 and CD81 T cellswere determined by flow cytometry. Representative FACS plot showsexpression of CD44 and CD62L by live (PI negative) CD41 T cells. Graphsshow frequencies of CD44hiCD62Llo cells among CD41 T cells (left) andCD81 T cells (right). Data (mean 6 s.e.m.) are pooled from two independentexperiments. Numbers of mice analysed: Bp352/2
(n 5 14) and correspondingBWT mice (n 5 12), BEbi32/2
(n 5 10) and corresponding BWT mice (n 5 10),Bp402/2
(n 5 15) and corresponding BWT mice (n 5 9), Bp282/2
(n 5 6) andcorresponding BWT mice (n 5 6).
LETTER RESEARCH
Macmillan Publishers Limited. All rights reserved©2014

Extended Data Figure 5 | Role of IL-35 and CD40 expression by B cellsduring Salmonella infection. a, Bp352/2
, BEbi32/2
, Bp402/2
and theircorresponding BWT mice were infected with attenuated Salmonella (strainSL7207). Relative titres of Salmonella-reactive IgM and IgG in serum weredetermined by ELISA. Data (mean 6 s.e.m.) are pooled from threeindependent experiments. Numbers in brackets indicate the numbers of miceanalysed for each measurement. b, Bp352/2
(n 5 17) and correspondingBWT mice (n 5 16) were immunized with 200mg NP-OVA in alumintraperitoneally. Relative titres of NP(15)-BSA-reactive antibodies in serumwere determined by ELISA. Data (mean 6 s.e.m.) are pooled from threeindependent experiments. Results were compared using two-tailed unpaired
t-test. P values .0.05 are indicated by ns. c, Mice were infected with 100 c.f.u. ofvirulent Salmonella. Upper left shows survival curves of BCd402/2
(n 5 9) andcorresponding BWT mice (n 5 16). Data are pooled from two independentexperiments. Survival curves were compared using Wilcoxon test. Upperright, numbers of inflammatory foci per liver section were determined onday 5 p.i. Lower panel, bacterial loads in liver (left) and spleen (right)were determined on day 5 p.i. Data (mean 6 s.e.m.) are pooled from twoindependent experiments. Numbers of mice analysed: BCd402/2
(n 5 12), andcorresponding BWT mice (n 5 13). Results were analysed using two-tailedunpaired t-test with Welch’s correction.
RESEARCH LETTER
Macmillan Publishers Limited. All rights reserved©2014

Extended Data Figure 6 | Characterization of IL-10- and IL-35-expressingplasma cells during Salmonella infection. a, b, C57BL/6 mice were infectedintravenously with attenuated Salmonella (strain SL7207; 107 c.f.u.). Onindicated days p.i., CD138hi plasma cells and CD191CD1382 B cells wereisolated from spleen through magnetic and FACS procedures. a, Strategy forisolation of CD138hi plasma cells and CD191CD1382 B cells: splenocytes werestained with anti-CD138-PE followed by labelling with magnetic anti-PEmicrobeads, and magnetic separation on autoMACS (Miltenyi Biotech). Theobtained CD138-positive and CD138-negative fractions were stained for CD19,CD138 and CD11b/CD11c/TCR-b/DAPI. CD138hiCD11b2CD11c2TCR-b2DAPI2 and CD191CD1382CD11b2CD11c2TCR-b2DAPI2 cells werethen isolated from CD138-positive and CD138-negative fraction, respectively,by FACS, as bulk or single cells. Numbers in FACS plots indicate thepercentages of CD191CD1382 B cells and CD138hi plasma cells in totalsplenocytes on day 3 after challenge (left plots), after magnetic isolation (middleplots), and after FACS isolation (right plots). b, Single CD138hi cells were
isolated on indicated days, and analysed by single cell-PCR using a mix ofprimers for b-actin, Il10, p35 and Ebi3. Only cells giving a positive signal forb-actin were included in the calculations shown. Data show frequencies ofCD138hi cells that gave a positive signal for Il10, both p35 and Ebi3, or Il10 andp35 and Ebi3. Numbers of cells tested: day 1 (181 cells; 86% positive forb-actin),day 3 (156 cells; 79% positive for b-actin) and day 8 (163 cells; 97% positive forb-actin). Cells were obtained from two independent experiments. c, d, CD138hi
plasma cells and CD191CD1382 B cells were enriched by magnetic isolation(as described in a) from spleen of C57BL/6 mice on day 3 after infection withattenuated Salmonella (SL7207; 107 c.f.u.). c, Data show expression levels ofselected surface receptors on live (DAPI2) CD138hi plasma cells andCD191CD1382 B cells. Cells were gated as in a (middle panels), and analysedby flow cytometry. d, Levels of CD1d and Tim-1 expressed by CD138hi cellswere compared to those found respectively on CD1dhi and CD1dlo B cells, andon Tim11 and Tim12 B cells from spleen of naive C57BL/6 mice. Data showrepresentative results from 2–5 independent experiments.
LETTER RESEARCH
Macmillan Publishers Limited. All rights reserved©2014

RESEARCH LETTER
Macmillan Publishers Limited. All rights reserved©2014

Extended Data Figure 7 | Characterization of plasma cells duringSalmonella infection. a, CD138hi plasma cells and CD191CD1382 B cellswere magnetically enriched from spleens of C57BL/6 mice on day 3 afterinfection with attenuated Salmonella (SL7207; 107 c.f.u.). CD191CD1382
B cells (P1) were then isolated from the CD138-negative fraction by FACS.CD138intCD221 (P2), CD138hiCD221 (P3), and CD138hiCD222 (P4) wereisolated from the CD138-positive fraction by FACS. b, Frequencies of IgM- andIgG-secreting cells among B cells (CD191CD1382) and each of these plasmacell subsets (CD138intCD221, CD138hiCD221, CD138hiCD222) weredetermined by ELISPOT assay. A compilation of two independent experimentsis shown (mean 6 s.e.m.). c, Blimp1, Irf4, Pax5, Il10, Ebi3 and p35 mRNAexpression was quantified by real-time PCR in these populations. Naive splenic
B cells (naive CD191) were isolated from unchallenged C57BL/6 mice bymagnetic selection. Data show the compilation of three independentexperiments (mean 6 s.e.m.). d, Plasma cells accumulate in splenic red pulpaggregates adjacent to white pulp areas on day 3 after Salmonella infection.C57BL/6 mice were infected intravenously with attenuated Salmonella(SL7207; 107 c.f.u.), and spleens were harvested 3 days later. Spleen sections(7mm) were stained with: top panels: anti-Ig-k (clone 187.1; green), anti-Igl(clone SL136; green), anti-CD90 (clone T24; red) and anti-CD22 (clone OX-97;blue); middle panels: anti-Ig-k (clone 187.1; red), anti-Igl (clone SL136; red),anti-CD11b (clone M1/70; green), and anti-CD22 (clone OX-97; blue); bottompanels: anti-Ig-k (clone 187.1; red), anti-Igl (clone SL136; red), anti-CD169(clone MOMA-1; green), and anti-CD22 (clone OX-97; blue).
LETTER RESEARCH
Macmillan Publishers Limited. All rights reserved©2014

RESEARCH LETTER
Macmillan Publishers Limited. All rights reserved©2014

Extended Data Figure 8 | Production of IL-10 and IL-6 by plasma cellsand B cells after Salmonella infection. a, CD138hi plasma cells andCD191CD1382 B cells were isolated from spleen of C57BL/6 mice on day 3after infection with attenuated Salmonella (SL7207; 107 c.f.u.), as described inExtended Data Fig. 6. Isolated cells were activated for 24 h as indicated with LPS(1mg ml21), anti-CD40 (10mg ml21), and anti-IgM (5mg ml21). IL-10 (left)and IL-6 (right) concentrations were determined by Bio-Plex. Data shown arepooled from 2–5 independent experiments (mean 6 s.e.m.). Results werecompared using two-tailed unpaired t-test. P values . 0.05 are indicated by ns.b, c, CD138hi plasma cells were isolated from spleen of C57BL/6 or IL-10–eGFPmice on day 3 after infection with attenuated Salmonella (SL7207; 107 c.f.u.).b, Cells were analysed by flow cytometry directly after isolation to quantifyIL-10–eGFP expression (ex vivo), and 24 h after re-stimulation with PMA plusionomycin. Data show representative FACS plots and histogram overlays.Numbers in the plots indicate the percentages of IL-10–eGFP-positive cellsamong total live (PI2) cells. c, Cells isolated from C57BL/6 and IL-10–eGFPmice were re-stimulated for 24 h, as indicated with LPS (1mg ml21), anti-CD40(10mg ml21), anti-IgM (5mg ml21), IL-4 (20 ng ml21), IL-5 (20 ng ml21), IL-6(20 ng ml21) and IL-21 (20 ng ml21). Cells were analysed as in b. Data shown
are pooled from 2–4 independent experiments (mean 6 s.e.m.). Results werecompared between condition RPMI and activated conditions (left) or betweencondition with added cytokine and condition LPS plus anti-CD40 (right) usingone-way ANOVA followed by Bonferroni post-test (*P , 0.05, **P , 0.01;***P , 0.001). d–g, Expression of IL-6 by IL-10-expressing CD1dhi B cells.d, CD191CD1dhi and CD191CD1dlo cells were isolated from spleen of naiveC57BL/6 mice according to CD19 and CD1d expression using magnetic andFACS procedures, and stimulated for 24 h, as indicated. IL-6 and IL-10concentrations in culture supernatants were determined by Bio-Plex.e, f, CD1dhi B cells were isolated from naive IL-10–eGFP mice and stimulatedwith LPS (2mg ml21) for 48 h. IL-6 and IL-10 concentrations in culturesupernatants were determined by Bio-Plex (e), and cells were analysed by flowcytometry to determine the frequency of IL-10–eGFP-expressing cells (f).g, CD1dhi B cells were isolated from naive IL-10–eGFP mice, and stimulatedwith LPS (2mg ml21) for 48 h. IL-10–eGFP2 and IL-10–eGFP1 cells were thenseparated by FACS and analysed by real time PCR for expression levels of Il10and Il6 mRNA. Data shown are pooled from two independent experiments(mean 6 s.e.m.).
LETTER RESEARCH
Macmillan Publishers Limited. All rights reserved©2014

RESEARCH LETTER
Macmillan Publishers Limited. All rights reserved©2014

Extended Data Figure 9 | IL-35 and IL-10 production by plasma cells duringEAE and Salmonella infection. a, B cells and plasma cells were isolated fromspleens of mice on days 14 and 28 after EAE induction through magneticand FACS procedures. Splenocytes were stained with anti-CD138-PE followedby labelling with anti-PE microbeads, and magnetic separation. The obtainedCD138-positive and CD138-negative fraction were stained for CD19, CD138,and CD11b/CD11c/CD90/DAPI. CD1381CD11b2CD11c2CD902DAPI2
and CD191CD1382CD11b2CD11c2CD902DAPI2 cells were then isolatedfrom CD138-positive and CD138-negative fractions, respectively, by FACS, asbulk cells. Naive splenic B cells (naive CD191) were isolated from unchallengedC57BL/6 mice by magnetic selection. Blimp1, Irf4 and Pax5 mRNA expressionwas quantified by real-time PCR. Data compile 2 independent experiments(mean 6 s.e.m.). b, Production of IgM and IgG by plasma cells and B cellsisolated from mice during EAE was determined by ELISPOT. A compilation of3 independent experiments for day 14, and 2 independent experiments for day28 is shown (mean 6 s.e.m.). c, Left, CD191CD1382 B cells (B cell) andCD1381 plasma cells (plasma cell) were isolated from spleens of mice on days14 and 28 after EAE induction through magnetic and FACS procedures, asdescribed in a, and stimulated for 24 h with PMA plus ionomycin (PMA plusiono) or kept in medium ([). IL-10 concentrations were determined byBio-Plex. Data are pooled from 4 independent experiments for day 14 and 2independent experiments for day 28 (mean 6 s.e.m.). Right, B cells(CD191CD1382) and CD1381 plasma cells (CD1381) were isolated fromspleens of mice on day 14 after EAE induction through magnetic isolation. Forthis, splenocytes were stained with anti-CD138-PE followed by labelling withanti-PE microbeads, and magnetic separation to yield CD1381 plasma cells.B cells were obtained from the CD138-negative fraction after further depletionof remaining CD1381 cells, and positive selection using anti-CD19 magneticmicrobeads. Purities were above 95%. Cell lysates were separated on SDS–PAGE gel and sequentially blotted with anti-EBI3, anti-p35, and anti-actinantibodies. Data show representative results of two independent experiments.d, e, Mice in which B cells cannot co-express IL-10 and IL-35 do not develop
exacerbated EAE. d Left, Bp352/2
(50%)Il102/2
(50%) were obtained by reconstitutinglethally irradiated recipient mice with BM cells from JHT mice (80%), IL-10-deficient mice (10%), and p35-deficient mice (10%). BWT mice were producedusing C57BL/6 BM instead of JHT BM cells. Bp352/2
and BIl102/2
mice wereobtained as outlined in Extended Data Fig. 10. Right, EAE was induced inBp352/2
(50%)Il102/2
(50%) mice (grey diamonds, n 5 10), Bp352/2
(grey squares,n 5 10), BIl102/2
(white diamonds, n 5 5) and BWT (dark grey circles, n 5 10)mice. Data show clinical EAE scores. e, Splenocytes were harvested fromBp352/2
(50%)Il102/2
(50%) and BWT mice on day 28 after EAE induction, and re-stimulated individually for 48 h with MOG35–55. Culture supernatants wereanalysed by ELISA to determine concentrations of IFN-c and IL-17. Data(mean 6 s.e.m.) are pooled from two independent experiments. f, Productionof IL-10 by IL-35-deficient B cells in vitro. Splenic B cells from naive C57BL/6,p352/2, and p352/2Ebi32/2 mice were stimulated with LPS (1mg ml21),anti-CD40 (10mg ml21), alone or in combination, as indicated, for 72 h, andIL-10 concentrations were determined by Bio-Plex. Data (mean 6 s.e.m.) arepooled from three independent experiments. Results were compared betweenC57BL/6 cells and cells from mutant mice using one-way ANOVA followedby Bonferroni post-test (*P , 0.05). g–i, IL-35 is not necessary for productionof IL-10 by CD138hi plasma cells during Salmonella infection. CD138hi plasmacells were isolated from spleen of C57BL/6, IL-10–eGFP, p352/2, and p352/2
IL-10–eGFP mice on day 3 after infection with attenuated Salmonella(107 c.f.u.) using a combination of magnetic and FACS methods. Cells wereanalysed by flow cytometry (g) to determine the frequency of IL-10–eGFP-expressing cells after re-stimulation as indicated for 24 h (h). Numbers in theplots indicate the percentages of IL-10–eGFP-positive cells among total live(PI2) cells. Results were compared using two-tailed unpaired t-test. i, CD138hi
plasma cells isolated from C57BL/6 and p352/2 mice were re-stimulated for24 h as indicated. IL-10 concentrations were determined by Bio-Plex. Data arepooled from two independent experiments (mean 6 s.e.m.). Results werecompared using two-tailed unpaired t-test with Welch’s correction. P values.0.05 are indicated by ns.
LETTER RESEARCH
Macmillan Publishers Limited. All rights reserved©2014
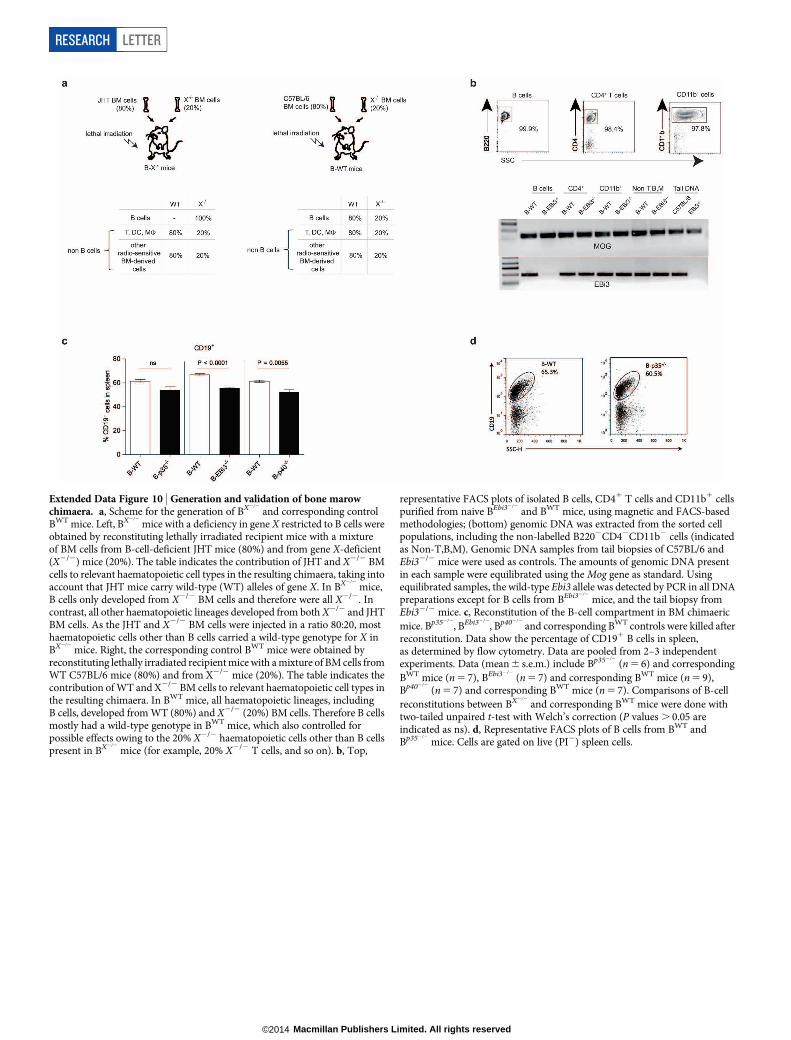
Extended Data Figure 10 | Generation and validation of bone marowchimaera. a, Scheme for the generation of BX2/2
and corresponding controlBWT mice. Left, BX2/2
mice with a deficiency in gene X restricted to B cells wereobtained by reconstituting lethally irradiated recipient mice with a mixtureof BM cells from B-cell-deficient JHT mice (80%) and from gene X-deficient(X2/2) mice (20%). The table indicates the contribution of JHT and X2/2 BMcells to relevant haematopoietic cell types in the resulting chimaera, taking intoaccount that JHT mice carry wild-type (WT) alleles of gene X. In BX2/2
mice,B cells only developed from X2/2 BM cells and therefore were all X2/2. Incontrast, all other haematopoietic lineages developed from both X2/2 and JHTBM cells. As the JHT and X2/2 BM cells were injected in a ratio 80:20, mosthaematopoietic cells other than B cells carried a wild-type genotype for X inBX2/2
mice. Right, the corresponding control BWT mice were obtained byreconstituting lethally irradiated recipient mice with a mixture of BM cells fromWT C57BL/6 mice (80%) and from X2/2 mice (20%). The table indicates thecontribution of WT and X2/2 BM cells to relevant haematopoietic cell types inthe resulting chimaera. In BWT mice, all haematopoietic lineages, includingB cells, developed from WT (80%) and X2/2 (20%) BM cells. Therefore B cellsmostly had a wild-type genotype in BWT mice, which also controlled forpossible effects owing to the 20% X2/2 haematopoietic cells other than B cellspresent in BX2/2
mice (for example, 20% X2/2 T cells, and so on). b, Top,
representative FACS plots of isolated B cells, CD41 T cells and CD11b1 cellspurified from naive BEbi32/2
and BWT mice, using magnetic and FACS-basedmethodologies; (bottom) genomic DNA was extracted from the sorted cellpopulations, including the non-labelled B2202CD42CD11b2 cells (indicatedas Non-T,B,M). Genomic DNA samples from tail biopsies of C57BL/6 andEbi32/2 mice were used as controls. The amounts of genomic DNA presentin each sample were equilibrated using the Mog gene as standard. Usingequilibrated samples, the wild-type Ebi3 allele was detected by PCR in all DNApreparations except for B cells from BEbi32/2
mice, and the tail biopsy fromEbi32/2 mice. c, Reconstitution of the B-cell compartment in BM chimaericmice. Bp352/2
, BEbi32/2
, Bp402/2
and corresponding BWT controls were killed afterreconstitution. Data show the percentage of CD191 B cells in spleen,as determined by flow cytometry. Data are pooled from 2–3 independentexperiments. Data (mean 6 s.e.m.) include Bp352/2
(n 5 6) and correspondingBWT mice (n 5 7), BEbi32/2
(n 5 7) and corresponding BWT mice (n 5 9),Bp402/2
(n 5 7) and corresponding BWT mice (n 5 7). Comparisons of B-cellreconstitutions between BX2/2
and corresponding BWT mice were done withtwo-tailed unpaired t-test with Welch’s correction (P values . 0.05 areindicated as ns). d, Representative FACS plots of B cells from BWT andBp352/2
mice. Cells are gated on live (PI2) spleen cells.
RESEARCH LETTER
Macmillan Publishers Limited. All rights reserved©2014