Embed Size (px)
Citation preview
Genaro A. Ramirez-Correa,1 Junfeng Ma,2 Chad Slawson,3 Quira Zeidan,2
Nahyr S. Lugo-Fagundo,1 Mingguo Xu,1 Xiaoxu Shen,4 Wei Dong Gao,4
Viviane Caceres,5 Khalid Chakir,5 Lauren DeVine,2 Robert N. Cole,2
Luigi Marchionni,6 Nazareno Paolocci,5 Gerald W. Hart,2 and Anne M. Murphy1
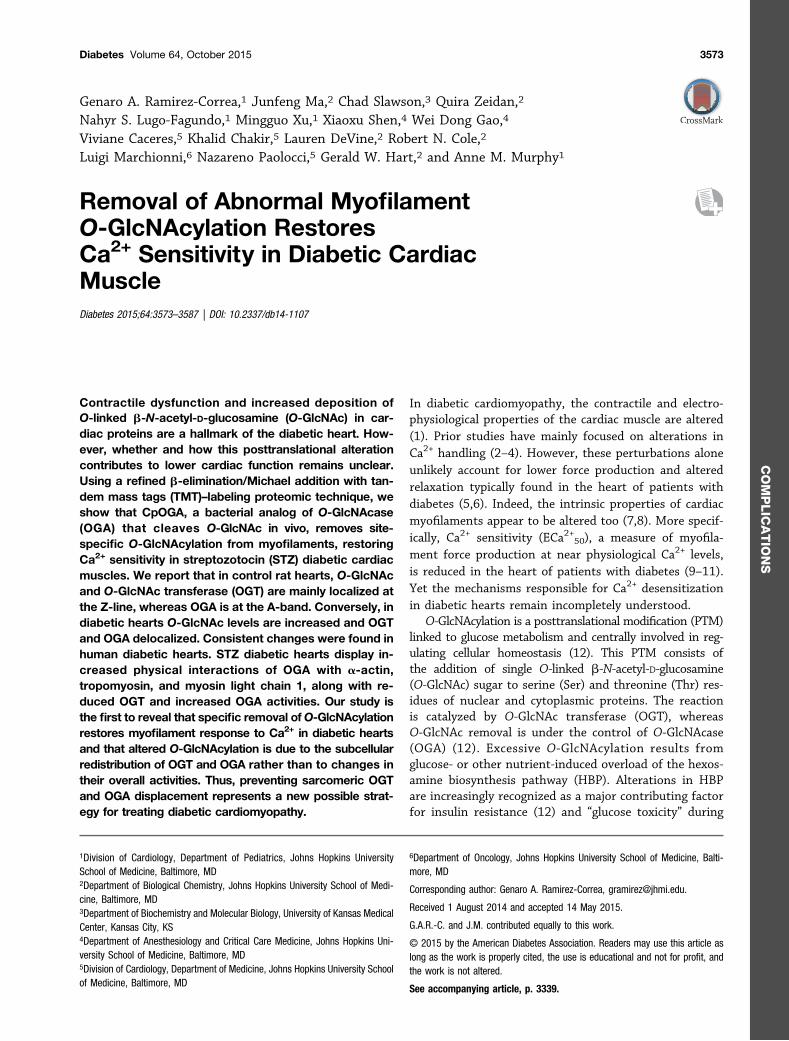
Removal of Abnormal MyofilamentO-GlcNAcylation RestoresCa2+ Sensitivity in Diabetic CardiacMuscleDiabetes 2015;64:3573–3587 | DOI: 10.2337/db14-1107
Contractile dysfunction and increased deposition ofO-linked b-N-acetyl-D-glucosamine (O-GlcNAc) in car-diac proteins are a hallmark of the diabetic heart. How-ever, whether and how this posttranslational alterationcontributes to lower cardiac function remains unclear.Using a refined b-elimination/Michael addition with tan-dem mass tags (TMT)–labeling proteomic technique, weshow that CpOGA, a bacterial analog of O-GlcNAcase(OGA) that cleaves O-GlcNAc in vivo, removes site-specific O-GlcNAcylation from myofilaments, restoringCa2+ sensitivity in streptozotocin (STZ) diabetic cardiacmuscles. We report that in control rat hearts, O-GlcNAcand O-GlcNAc transferase (OGT) are mainly localized atthe Z-line, whereas OGA is at the A-band. Conversely, indiabetic hearts O-GlcNAc levels are increased and OGTand OGA delocalized. Consistent changes were found inhuman diabetic hearts. STZ diabetic hearts display in-creased physical interactions of OGA with a-actin,tropomyosin, and myosin light chain 1, along with re-duced OGT and increased OGA activities. Our study isthe first to reveal that specific removal ofO-GlcNAcylationrestores myofilament response to Ca2+ in diabetic heartsand that altered O-GlcNAcylation is due to the subcellularredistribution of OGT and OGA rather than to changes intheir overall activities. Thus, preventing sarcomeric OGTand OGA displacement represents a new possible strat-egy for treating diabetic cardiomyopathy.
In diabetic cardiomyopathy, the contractile and electro-physiological properties of the cardiac muscle are altered(1). Prior studies have mainly focused on alterations inCa2+ handling (2–4). However, these perturbations aloneunlikely account for lower force production and alteredrelaxation typically found in the heart of patients withdiabetes (5,6). Indeed, the intrinsic properties of cardiacmyofilaments appear to be altered too (7,8). More specif-ically, Ca2+ sensitivity (ECa2+50), a measure of myofila-ment force production at near physiological Ca2+ levels,is reduced in the heart of patients with diabetes (9–11).Yet the mechanisms responsible for Ca2+ desensitizationin diabetic hearts remain incompletely understood.
O-GlcNAcylation is a posttranslational modification (PTM)linked to glucose metabolism and centrally involved in reg-ulating cellular homeostasis (12). This PTM consists ofthe addition of single O-linked b-N-acetyl-D-glucosamine(O-GlcNAc) sugar to serine (Ser) and threonine (Thr) res-idues of nuclear and cytoplasmic proteins. The reactionis catalyzed by O-GlcNAc transferase (OGT), whereasO-GlcNAc removal is under the control of O-GlcNAcase(OGA) (12). Excessive O-GlcNAcylation results fromglucose- or other nutrient-induced overload of the hexos-amine biosynthesis pathway (HBP). Alterations in HBPare increasingly recognized as a major contributing factorfor insulin resistance (12) and “glucose toxicity” during
1Division of Cardiology, Department of Pediatrics, Johns Hopkins UniversitySchool of Medicine, Baltimore, MD2Department of Biological Chemistry, Johns Hopkins University School of Medi-cine, Baltimore, MD3Department of Biochemistry and Molecular Biology, University of Kansas MedicalCenter, Kansas City, KS4Department of Anesthesiology and Critical Care Medicine, Johns Hopkins Uni-versity School of Medicine, Baltimore, MD5Division of Cardiology, Department of Medicine, Johns Hopkins University Schoolof Medicine, Baltimore, MD
6Department of Oncology, Johns Hopkins University School of Medicine, Balti-more, MD
Corresponding author: Genaro A. Ramirez-Correa, [email protected].
Received 1 August 2014 and accepted 14 May 2015.
G.A.R.-C. and J.M. contributed equally to this work.
© 2015 by the American Diabetes Association. Readers may use this article aslong as the work is properly cited, the use is educational and not for profit, andthe work is not altered.
See accompanying article, p. 3339.
Diabetes Volume 64, October 2015 3573
COMPLIC
ATIO
NS

diabetes. Similar to phosphorylation, O-GlcNAcylation isa widely distributed and highly dynamic PTM (12). How-ever, unlike phosphorylation, which is regulated by a myriadof kinases and phosphatases, the extent of O-GlcNAcylationrelies on two enzymes only, specifically OGT and OGA. OGTsubstrate specificity is regulated by transient protein-to-protein interactions that take place primarily at its tetratri-copeptide repeat (TPR) domain (12) (Fig. 7A). OftenOGT and OGA interact with each other and/or are foundforming a holoenzyme complex with protein phospha-tases and kinases (12). Modifications of Ser and Thr byO-GlcNAc occur in myofilaments, and the addition of ex-ogenous N-acetyl-D-glucosamine (GlcNAc) alters myofila-ment response to Ca2+ (13,14). In addition, manipulationof cardiac O-GlcNAc levels influences Ca2+ cycling kinetics(4) and mitochondrial rates of respiration in diabetes(2,15) and functional recovery after ischemia-reperfusioninjury (16,17) or chronic pressure-overload (18–21).Despite all of this evidence, whether and how alteredO-GlcNAcylation contributes to myofilament dysfunc-tion in diabetic cardiomyopathy (7,8,22–24) is currentlyunclear.
Here we proved that specific removal of O-GlcNAc ex-cess from diabetic myofilaments ameliorates contractiledysfunction by linking improvement in force-Ca2+ rela-tionships to site-specific O-GlcNAc changes. We alsodetermined a potential mechanism leading to alteredO-GlcNAcylation by comparing the status and sarcomericdistribution patterns of OGT and OGA in the heart of ratswith streptozotocin (STZ)-induced type 1 diabetes withthat found in controls.
RESEARCH DESIGN AND METHODS
All animal protocols in this study were performed inaccordance with institutional guidelines and approval ofthe Johns Hopkins University School of Medicine Insti-tutional Animal Care and Use Committee.
Type 1 Diabetes Rat ModelType 1 diabetes was induced in male Sprague-Dawley rats(Charles River) by an intraperitoneal injection of STZ(65 mg/kg). Control animals were injected with vehicle only.Animals were killed 6–8 weeks after induction of diabetes.At the moment of tissue harvest, STZ diabetic animals hadblood glucose of 693.5 6 61.5 mg/dL and controls had123.9 6 9.5 mg/dL.
Isolated Skinned Fiber StudiesFor skinned cardiac muscles studies, muscles were isolatedand mounted as previously described (25,26). Varied Ca2+
concentrations [Ca2+]o were achieved by mixing the relaxingsolution and activating solution in various ratios. Afterreaching the highest [Ca2+]o concentration, trabeculae werewashed in relaxing solution and incubated at room temper-ature 1 h in 1 mg/mL CpOGA (27) diluted in relaxing solu-tion. Afterward, a new Ca2+ activation protocol was repeated.Steady-state force-[Ca2+]o relationships were determined ex-perimentally and fit to a modified Hill equation (25,26).
Immunofluorescence Confocal MicroscopyCold acetone–fixed cryosections (7–8 mm) from rat orhuman (BioChain Inc., Office of Human Research Protec-tion registered IRB00008283) myocardium were blockedand incubated overnight with a primary antibody againstO-GlcNAc (CTD110.6). In addition, isolated skinned myo-cytes were obtained from flash-frozen myocardium byhomogenization in 0.03% Triton X-100 at low speed aspreviously described (28), seeded on eight chamber slidescoated with 40 mg/mL laminin (Invitrogen), and fixed in4% formaldehyde-methanol–free ultrapure (PolysciencesInc.). Cryosections or isolated skinned myocytes wereblocked and incubated overnight with OGA O-GlcNAcase(345), OGT (AL-25) (29), and anti–a-actinin (Sigma-Aldrich)at 1 mg/mL. Secondary antibodies were Alexa 647 goat anti-mouse IgM (m-chain) for O-GlcNAc, Alexa 647 goat anti-rabbit IgG for OGT, Alexa 594 goat anti-chicken IgY forOGA, and Alexa 488 goat anti-mouse IgG for a-actinin.Prolong antifade with DAPI (Invitrogen) was used formounting. Images were acquired on a Zeiss 710 LSM up-right microscope using a 325 or a 363 water-immersionobjective (Nikon) and analyzed with Zen 9 Leica Zeiss soft-ware tools.
Double Immunoelectron MicroscopyFor gold immunolabeling, goat anti-rabbit or goat anti-mouse were labeled with 12-nm-diameter particles todetect anti-OGT (AL-34) or anti–O-GlcNAc (CTD 110.6),and goat anti-chicken was labeled with 6-nm-diameter par-ticles to detect anti-OGA (345). Labeled ultrathin sections(60- to 90-nm thick) were examined under the transmis-sion electron microscope (Hitachi 7600 TEM, Tokyo,Japan), and 8–11 random field pictures were used forquantification of OGT, OGA, and O-GlcNAc immunolabeledgold particles with ImageJ software (National Institutes ofHealth [NIH]).
Coimmunoprecipitation for OGT and OGAFor immunoprecipitation studies, anti-OGT (AL-28) oranti-OGA (345) (1 mg total) antibodies were added to0.5 mg/mL protein samples. Immunoprecipitates werethen separated by SDS-PAGE, transferred to polyvinyli-dene fluoride membranes (Millipore, Bedford, MA) forantibody probing against a-cardiac actin (Sigma-Aldrich),a-tropomyosin (Tm; Sigma-Aldrich), and anti-myosinlight chain (MLC) 1 (Clone 1LC-14, Spectral Diagnos-tics). Between different antibodies blots were strippedfor 1 h at 25°C in 200 mmol/L glycine (pH 2.5; Sigma-Aldrich) (29).
OGT and OGA Activity Assays
OGT AssaysHeart homogenates were separated in cytosolic or myo-filament fractions, desalted, and subjected to OGT activityassays as described (30). Activity counts in disintegrationper minute (dpm) were normalized to total protein con-tent (dpm/mg), and then background activity without CKIIpeptide was subtracted (Fig. 7C).
3574 OGA Restores Cardiac Muscle ECa2+50 in Diabetes Diabetes Volume 64, October 2015

OGAse AssaysOGAse activity was determined as previously described(31). Briefly, activity was expressed as the amount ofenzyme catalyzing the release of 1 mmol/mg/min pNPfrom pNP-GlcNAc, and then background activity in thepresence of the most specific and potent OGA inhibitor(1mmol/L thiamet-G) was subtracted (Fig. 7C).
Myofilament Isolation and Tandem Mass TagsLabelingMyofilament proteins were isolated as previously de-scribed (32). Protein concentration was determinedby the Bradford assay and equal amounts of protein(;200 mg) were reduced with 5 mmol/L dithiothreitol(DTT), alkylated with 15 mmol/L iodoacetamide, anddigested by trypsin (trypsin-to-protein ratio, 1:50). Trypticpeptides were labeled for quantitation with tandem masstags (TMT) 10plex labels (127, 128, 129, 130) following themanufacturer’s guidelines (Thermo Fisher Scientific). Thelabeled peptides were combined and fractioned offline usingXBridge HPLC column (Waters). The resulting 96 fractionswere combined into 24 fractions for liquid chromatography–tandem mass spectrometry (LC-MS/MS) runs, while onlyreserving 10% for the preenriched analysis, and combin-ing the remaining 90% for O-GlcNAc peptide enrichment(postenrichment).
O-GlcNAc Peptide EnrichmentThe remaining pooled peptides were used to enrichO-GlcNAcylated peptides by adapting a method describedpreviously (33,34), with some modifications. In brief, pep-tides were treated with alkaline phosphatase (50 units;New England Biolabs) and PNGase F (1,000 units; NewEngland Biolabs) for 6 h, followed by desalting witha C18 spin column (Nest Group). The dried peptideswere resuspended in a buffer containing 20 mmol/LDTT, 20% (v/v) ethyl alcohol, and 1.5% triethanolamine(pH 12.5) and incubated at 50°C for 4 h with gentle shak-ing. Reaction was quenched by the addition of trifluoro-acetic acid (final pH ;7.0). Peptides were desalted andthen incubated with thiol-Sepharose beads (Sigma-Aldrich)in PBS containing 1 mmol/L EDTA (PBS/EDTA, pH 7.4) for4 h. After five washes in a PBS/EDTA buffer supplementedwith acetonitrile 40% (v/v), beads were incubated in PBS/EDTA containing 20 mmol/L DTT for 30 min. Releasedpeptides were collected and desalted with a C18 spin col-umn. Dried peptides were then analyzed by LC-MS/MS forO-GlcNAc site mapping and quantification.
LC-MS/MS AnalysisThe unenriched and O-GlcNAc–enriched fractions wereanalyzed with an LTQ-Orbitrap Velos (Thermo Fisher Sci-entific) attached to a Nano Acquity (Waters) chromatog-raphy system. Peptides were loaded on a 75-mm 3 2.5-cmC18 (YMC*GEL ODS-A 12-nm S–10-mm) trap at 600 nL/min0.1% formic acid (solvent A) and fractionated at 300 nL/minon a 75-mm 3 150-mm reverse-phase column usinga 2–90% acetonitrile in 0.1% formic acid gradient over90 min. Eluting peptides were sprayed into the mass
spectrometer through 1-mm emitter tip (New Objective)at 2.2 kV. Survey scans (full MS) were acquired within350–1800 m/z with up to eight peptide masses (precursorions) individually isolated at IW1.9Da, and fragmented(MS/MS) using higher-energy collisional dissociation, at 35activation collision energy. Precursor and the fragmentions were analyzed at resolution 30,000 and 15,000, re-spectively. Dynamic exclusion of 30 s, repeat count 1,monoisotopic ion precursor selection (MIPS) “on”, m/zoption “off”, lock mass “on” (silocsane 371 Da) wereused. MS/MS spectra were processed by PEAKS Studio(Bioinformatics Solutions Inc.) using Rattus norvegicusFASTA as the proteome database, with concatenated de-coy database, specifying all peptide species, trypsin asenzyme, missed cleavage 2, precursor mass tolerance10 ppm, fragment mass tolerance 0.03 Da, and oxidation(M), deamidation (NQ), carbamidomethyl (C), and TMTlabels 127, 128, 129, and 130 as variable modifications.
TMT and O-GlcNAc QuantificationQuantitation function of PEAKS Studio was used toexport the raw intensity values of TMT peptides with orwithout O-GlcNAc enrichment. Only peptides with a pos-itive identification value or a cutoff value of 20 for pep-tide score threshold (210 log P), quantification masstolerance (0.2 Da), and a 0.1% false discovery rate(FDR) were considered. All Ser or Thr residues fromO-GlcNAcylated peptides were identified by a +136 massshift given by DTT during BEMAD and their MS/MS spec-tra manually inspected. The experimental design con-sisted of 12 biological samples divided into threeexperiments with four isobaric mass-tags, each experi-ment comprising a STZ diabetic and a control samplewith and without CpOGA treatment. The TMT preenrich-ment samples were analyzed to factor in potentialchanges in protein expression, the relative total proteinload, and to refine the comparisons among postenrich-ment samples by accounting for technical and experimen-tal variation. The median signal value for each modifiedpeptide of each sample was first determined and con-verted to log2 notation (with 0.0 values excluded as nulls)for further processing. Data were then quantile normal-ized to achieve the same median. The difference betweenprenormalized and normalized data provided a numberthat was further used as a correction factor for the post-enrichment peptide analysis. For the O-GlcNAc–enrichedpeptides, signals were treated as above, except when con-verted to log2 notation, the 0.0 values were log-convertedto 0.001 to be able to express ratios.
Detection of Differential O-GlcNAcylationWe used a statistical generalized linear model approachfor differential gene expression detection. Briefly, a mixed-effects linear model was fit for each individual modifiedpeptide to estimate O-GlcNAcylation differences betweenthe groups of samples being compared (i.e., control vs. STZdiabetic, control vs. CpOGA control, STZ vs. CpOGA STZ).When distinct peptides for the same O-GlcNAcylated site
diabetes.diabetesjournals.org Ramirez-Correa and Associates 3575

were available, correlation coefficients were computed andthe associated consensus correlation was added to themodel (35). An empirical Bayes approach was applied tomoderate standard errors of log2 O-GlcNAcylation fold-change, as previously described (36). Finally, for each ana-lyzed feature, moderated t statistics, log-odds ratios ofdifferential expression (B statistics), and raw and adjustedP values (FDR control by the Benjamini and Hochbergmethod) were obtained. All analyses were performed usingsoftware packages available from the R/Bioconductor forstatistical computing “limma” (36).
StatisticsThe Student t test, one-way ANOVA, and two-way ANOVAwith repeated measures, followed by post hoc pairwisecomparison, when appropriate, was used for statisticalanalysis of the data. A value of P , 0.05 was consideredto indicate significant differences between groups. Unlessotherwise indicated, data are expressed as mean 6 SEM.
RESULTS
Removal of Site-Specific O-GlcNAcylation ExcessRestores Myofilament Ca2+ Sensitivity in DiabeticCardiac MuscleUsing an MS approach, we have previously identifiedspecific O-GlcNAcylation sites on five major cardiac myo-filament proteins on normal hearts (14). We also showedthat incubation of skinned cardiac muscles with GlcNAcreduces myofilament Ca2+ sensitivity, thus reproducinga hallmark of diabetic cardiac muscle (7,14). Yet, site-specific O-GlcNAcylation changes on diabetic hearts remainunknown. Nor is it clear whether removing endogenousO-GlcNAc from diabetic skinned cardiac muscles is suffi-cient to restore myofilament function. To address thesequestions, we first confirmed that O-GlcNAcylation is en-hanced in protein extracts from STZ diabetic hearts (Fig. 1A).Next, we used CpOGA to remove O-GlcNAc from diabeticskinned cardiac muscles (Fig. 1B). Finally, we used a re-fined global quantitative proteomic technique that com-bines TMT labeling with b-elimination/Michael additionto quantify the O-GlcNAcylation changes in diabetichearts and to identify the key amino acid residues whereO-GlcNAc is reduced after CpOGA in STZ diabetic heartsbut not in controls (Fig. 1C).
OGA is the mammalian enzyme that removes O-GlcNAcin vivo; however, its glycosidase activity is greatly reducedwhen expressed as a recombinant protein (31). To circum-vent this issue, we used a bacterial glycosidase, CpOGA (27)(Clostridium perfringens N-acetyl-glycosidase J, provided byDr. Daan van Aalen, University of Dundee). CpOGA ishighly homologous to human OGA and displays potentand specific activity toward mammalian protein homoge-nates (37). Hence, skinned cardiac muscles from diabetic(STZ-induced) and control rats were incubated withCpOGA and their contractile properties determined beforeand after this treatment. Steady-state force-[Ca2+] relation-ships measurements revealed that CpOGA removal of abnor-mal O-GlcNAcylation restores myofilament Ca2+ sensitivity
in diabetic skinned fibers (Fig. 1B). Remarkably, theECa2+50 of CpOGA-treated diabetic skinned fibers becamesimilar to that found in control muscles, regardless ofCpOGA presence (Fig. 1B). Upon CpOGA administration,no difference in maximal Ca2+ activated force (Fmax) andHill coefficient (n) was evident between control and diabeticmuscles (Fig. 1B). Next, control and diabetic (STZ) rat heartmyofilaments were compared before and after beingincubated with recombinant CpOGA and analyzed forO-GlcNAcylation by MS/MS tagging and LC-MS/MS. In to-tal we found 63 O-GlcNAcylated sites, 39 in myosin heavychain (MHC), 9 in a-sarcomeric actin, 2 in MLC 1, 5 ina-Tm 1, 7 in cardiac troponin I (cTnI), and 1 in myosinbinding protein C (Table 1).
Because CpOGA removes O-GlcNAc in both control anddiabetic (STZ) rat muscles but only restores ECa2+50 indiabetic muscles, we focused our proteomic analysis onidentifying the site-specific O-GlcNAc changes that are sta-tistically significant on CpOGA-treated STZ diabetic versusCpOGA-untreated STZ diabetic myofilaments but notsignificant on CpOGA-treated control versus CpOGA-untreated control myofilaments (Fig. 1C). Surprisingly,most of the sites that change significantly are located onMHC (S740, S844, S1414, S1465, S1471, S1472, S1598,T1601, S1602, S1778, and S1917), a-sarcomeric actin (actinS54, T326), and a-TmS87. Noteworthy, the sites thatare significantly more O-GlcNAcylated in diabetic hearts(i.e., MHC S844, S1471, S1472, T1601, and S1917 andactin T326) (Fig. 1C, red rectangles) are also part of the groupof sites that change significantly upon CpOGA treatment ofSTZ diabetic myofilaments. Thus, abnormal O-GlcNAcylationof cardiac muscle proteins is sufficient to reduce myofilamentCa2+ sensitivity, and its removal is necessary to preventthis Ca2+ desensitization.
Diabetic Cardiac Muscle Displays Sarcomeric O-GlcNAcSignal Increased and Delocalized From Z-LinesThe a-cardiac actin O-GlcNAc signal intensity (by immu-noblot) is augmented in animal models of diabetes (14).Moreover, in normal human myocardium, O-GlcNAc pre-dominantly modifies a Z-line protein called ZASP (Z-bandalternatively spliced PDZ motif protein) (38). ZASPO-GlcNAcylation increases further in heart failure andhypertrophic cardiomyopathy (38). However, whetherO-GlcNAc–specific subcellular localization changes in di-abetes is not clear. To fill this gap, cryosections fromnormal and STZ-induced diabetic rat hearts were fixedin cold acetone and stained for O-GlcNAc (CTD 110.6)to determine the relative abundance and localization ofO-GlcNAc (Fig. 2A). Consistent with previous findings,O-GlcNAc signal intensity was markedly increased inSTZ rat diabetic myocardium compared with controlhearts (Fig. 2B). Also, immunoelectron microscopyrevealed that in control myocardium, O-GlcNAc was pre-dominantly localized in clusters near the Z-lines, whereasin STZ-treated rats O-GlcNAc clusters were spread towardthe A-band (Fig. 2C). Next, we performed a morphometric
3576 OGA Restores Cardiac Muscle ECa2+50 in Diabetes Diabetes Volume 64, October 2015

analysis of nine random fields of control or STZ rat di-abetic myocardium using immune-gold particles (12 nmdiameter) to assess O-GlcNAc distance from the nearestZ-line (Fig. 2D). This approach allowed us to conclude thatoverall O-GlcNAc signal is increased in the sarcomeres ofdiabetic rats and moves away from Z-lines. To test whethersimilar alterations pertain to human pathology, O-GlcNAcimmune-fluorescence was investigated in one sample froma normal (donor) and one from a patient with type 2 di-abetes. Consistent with findings in the rat, O-GlcNAc signal
intensity was markedly increased in the human diabeticspecimen (Fig. 2E).
OGT and OGA Sarcomeric Distribution Is Inverted inDiabetic MyocardiumNext, we reasoned that the presence of enhancedO-GlcNAcylation in specific sarcomere compartments ofdiabetic hearts could be due to enhanced activity of OGT,reduced OGA activity, or abnormal localization of enzymes.To address this issue, we used anti-OGT (AL-28) or
Figure 1—Removing abnormal O-GlcNAcylation restores myofilament Ca2+ sensitivity in diabetic cardiac muscle. A: O-GlcNAc Westernblots (WB) demonstrate increased O-GlcNAcylation on STZ diabetic heart homogenates. B: Steady-state force-[Ca2+]o relationship inskinned diabetic and control cardiac STZ diabetic muscles pre-CpOGA (n = 5) and STZ post-CpOGA (n = 4), control pre-CpOGA(n = 6) and control post-CpOGA (n = 5). Comparison of ECa2+50 for all groups (lower panel). Maximal force (Fmax) and Hill coefficient (n).C: Proteomic identification and quantification of site-specific O-GlcNAc changes that are statistically significant (generalized linear modelapproach) on CpOGA treatment of STZ diabetic myofilaments but not on CpOGA treatment of control myofilaments. Highlighted in redrectangles are the sites that are significantly more O-GlcNAcylated in diabetic hearts. The horizontal line in the middle of each box indicatesthe median; the top and bottom borders of the box mark the 75th and 25th percentiles, respectively, the whiskers mark the 90th and 10thpercentiles, and the c indicate outliers. Statistical analysis used moderated t-statistics, log-odds ratios of differential expression(B statistics), and raw and adjusted P values (FDR control by the Benjamini and Hochberg method). Con, control.
diabetes.diabetesjournals.org Ramirez-Correa and Associates 3577

anti-OGA (345) antibodies and an immunofluorescenceand confocal microscopy approach to analyze the signal in-tensity and colocalization of both enzymes. OGT exhibiteda predominantly sarcomeric localization, whereas OGA dis-played both a sarcomeric and reticular pattern (Fig. 3A andB). Similar to O-GlcNAc, OGT tended to colocalize mostlywith a-actinin near the Z-line (Fig. 3C and D). Althoughdetectable at the Z-line too, OGA was instead predomi-nantly distributed throughout the A-band along the entiresarcomeric unit. To further consolidate this evidence, weused the colocalization tools of Zen 9 Image Analysis Soft-ware (Leica Zeiss), enabling us to quantify changes in OGTand OGA distribution. Representative images of normal andSTZ diabetic hearts were used to generate XY pixel dot plotsof laser scanning signals. A series of colocalization quanti-fication parameters are displayed as bar graphs for OGT anda-actinin (Fig. 3E) and for OGT and OGA (Fig. 3F). Analysisof at least three random fields from four replicates on threedifferent hearts showed clear differences between normaland STZ diabetic myocardium. OGT colocalization witha-actinin was decreased in STZ myocardium (Fig. 3E1–3),thus confirming a redistribution apart from the Z-line (P =0.0053). Interestingly, OGT/OGA colocalization was alsoreduced in STZ diabetic myocardium (P # 0.05, Fig. 3F1–3).a-Actinin, OGT, and OGA immunofluorescence was also eval-uated in human heart samples (Fig. 4A). Acetone prefixed
frozen slides were triple-antigen stained by immunofluo-rescence for OGT (AL-28), OGA (345), and a-actinin. Asexpected, human control and diabetic myocardiumexhibited a differential sarcomeric pattern for OGT andOGA signals. A selected area from control (Fig. 4A, toppanel) or diabetic (Fig. 4A, bottom panel) is shown asa white square in the merged left picture, followed byenlarged areas showing the regions in single or combinedchannels for linear surface profile plots of approximatelysix to eight sarcomere units (dashed line). Combined sig-nals of OGT (magenta) or OGA (red) and a-actinin (green)for control and diabetic myocardium indicated that OGTlabeling peaks in control myocardium correspond mostlywith the a-actinin signal. Conversely, OGA labelingshowed variable signals, peaking both at A-band andZ-line regions (Fig. 4A, top panel). In diabetic myocardium,however, OGT signal peaks tended to shift away from thea-actinin signal, whereas OGA labeling centered more onthe a-actinin signal (Fig. 4A, bottom panel). Because cry-osections fixed with acetone might reflect tissue architec-ture alterations, we decided to corroborate the OGT andOGA staining pattern on isolated skinned myocytesobtained from flash-frozen myocardium derived fromrat samples as described (28). Similar to rat or humanmyocardium cryosections, isolated skinned myocytesfixed with 4% formaldehyde displayed the expected
Table 1—O-GlcNAcylated peptides and their corresponding amino acid sites in normal and diabetic cardiac myofilaments
MHC or myosin heavy chain 6, P02563 Actin, a-cardiac, P68035Peptide ID AA Peptide ID AAR.*TNCFVPDDKEEYVK.A T35 R.AVFP*SIVGR.P S34K.V*TAETENGK.T T60 K.D*SYVGDEAQSK.R S54R.ENQ*SILI*TGESGAGK.T S173/T177 K.DSYVGDEAQ*SK.R S62Q.SILI*TGE*SGAGK.T T177/S180 R.GY*SFVTTAER.E S201F.A*SIAAIGDR.S S197 A.TAA*SSSSLEK.S S234K.TVRNDN*S*SR.F S241/S242 K.*SYELPDGQVITIGNER.F S241Y.A*S ADTGDSGK.G S627 K.EITALAP*S*T MK.I S325/T326N.PAAIPEGQFID*S R.K S740 K.QEYDEAGP*SIVHR.K S370K.*SAETEK.E S844 Myosin regulatory light chain 1, P16409R.IEDEQALG*SQLQK.K S1102 Peptide ID AAR.*S DLTR.E S1139 K.EAEFDA*SK.I S 45R.ELEEI*SER.L S1149 R.ALGQNP*TQAEVL.R T 93R.SVNDL*T*SQR.A T1274/S1275 Tropomyosin a 1K.LQTENGEL*S R.Q S1288 Peptide ID AAK.EALI*SQL*TR.G S1301/T1304 K.ATDAEADVA*SLNR.R S87K.AN*SEVAQWR.T S1368 K.AADE*SER.G S123K.C*S*SLEKTK.H S1414/S1415 K.VIE*SR.A S132R.*SNAAAAALDK.K S1437 R.AEL*SEGK.C S186K.YEE*SQ*S ELESSQK.E S1465/S1467 K.*SLEAQAEK.Y S206E.SQSELE*SSQK.E S1469 Cardiac Troponin I, P23693E.SQSELE*S*SQK.E S1471/S1472 Peptide ID AAR.VVD*SLQ*T*S LDAETR.S S1598/T1601/S1602 E.*SSDSAGEPQPAPAPVR.R S5Q.*TSLDAETR.S T1601 S.*SD*SAGEPQPAPAPVR.R S6/S8R.IA*SEAQK.H S1638 K.ISA*SR.K S43/S45R.AVVEQ*TER.S T1697 R.VL*STR.C S78K.LAEQELIE*T*SER.V T1711/S1712 K.E*SLDLR.A S167K.EQD*T*SAHLER.M T1777/S1778 Cardiac myosin binding protein C, P23693R.NAE*SVK.G S1838 Peptide ID AAR.ADIAE*SQVNK.L S1917 R.DG*SDIAANDK.Y S47
3578 OGA Restores Cardiac Muscle ECa2+50 in Diabetes Diabetes Volume 64, October 2015

OGT and OGA staining pattern in control (Fig. 4B, toppanel) or STZ diabetic (Fig. 4B, bottom panel) myo-cytes. When sarcomeres in control hearts are comparedwith those found in diabetic hearts, these changes in theOGT staining pattern mirror faithfully those found in ratSTZ diabetic myocardium (Fig. 3), with an inverted patternof OGT and OGA sarcomeric distribution. This inverted pat-tern of OGT/OGA localization may influenceO-GlcNAcylation
cycling rates, thus likely perturbing O-GlcNAc stoichiometryin specific sarcomere compartments.
Next, we analyzed OGT and OGA by double immuno-electron microscopy in hearts from STZ diabetic and controlrats. Immunoelectron microscopy data fully corroboratedthe evidence obtained with the immunofluorescence ap-proach, confirming the redistribution of both enzymeswithin the sarcomere. Indeed, similar to O-GlcNAc, OGT
Figure 2—Diabetic myocardium displays increased O-GlcNAcylation. A: Rat control and STZ diabetic myocardium cryosections wereimmunostained for O-GlcNAc and nuclei (DAPI). B: Quantification of O-GlcNAc immunofluorescence, channel intensity normalized toarea (mm2), shows a significant increase in STZ diabetic myocardium. *P < 0.05. C: Immunoelectron microscopy for O-GlcNAc showssignal redistribution from mainly the Z-line (arrowheads) toward the A-band. D: Relation of immunogold particles and distance from theZ-line. E: Human donor and diabetic myocardium cryosections display O-GlcNAc sarcomeric distribution and its increase in thediabetic heart.
diabetes.diabetesjournals.org Ramirez-Correa and Associates 3579

immunogold-labeled particles were mainly located at theZ-disk in normal hearts (Fig. 5A, top panel), whereas theywere more diffused along the A-band in diabetic hearts (Fig.5B, top panel). Instead of being localized mainly at theA-band (normal hearts), OGA formed sizable clusters inthe vicinity of the Z-disk (diabetic hearts; Fig. 5B, bottom
panel). Finally, we determined the frequency of OGT andOGA immunogold-labeled particles, examining 9–10 ran-dom fields of normal or diabetic myocardium and quanti-fying OGT (12 nm, purple circle) and OGA (6 nm, red circle)immunogold-labeled particles confined to the myofilamentapparatus. Our approach revealed that both O-GlcNAc
Figure 3—OGT and OGA mislocalization in STZ diabetic myocardium. A and B: Rat control and STZ diabetic myocardium cryosectionswere immunostained for a-actinin (green), OGT (magenta), and OGA (red). C and D: Regions of interest (white square and dashed line) wereused to plot the signals of OGT and a-actinin; the red arrows show Z-line. E: OGT and a-actinin colocalization parameters show significantdifferences in weighted coefficient (1), overlap coefficient (2), and Pearson correlation R (3). *P = 0.0053. F: OGT and OGA colocalizationparameters show significant differences in overlap coefficient (1), Pearson correlation R (2), and correlation R2 (3). *P < 0.05. Images wereacquired with a Zeiss 710 LSM Meta confocal microscope. NIH ImageJ and Origin 8.0 software were used to plot OGT or OGA witha-actinin as relative intensity profiles.
3580 OGA Restores Cardiac Muscle ECa2+50 in Diabetes Diabetes Volume 64, October 2015

cycling enzymes were detected at higher frequency in diabeticmyocardium (Fig. 5C and D). Taken together, these datasuggest that, in analogy to cardiac kinases and phosphatases(39), mislocalized OGT and OGA activities can affect thefunction of contractile or regulatory proteins, or both.
Differential Interactions of OGT and OGA WithMyofilament Proteins in the Diabetic HeartAssessing OGT by Western blot in myofilament prepara-tions (14) involves the use of high (1%) concentrations ofTriton X-100 (32). This procedure may preclude the possi-bility of detecting weak interactions between OGT, OGA,and their potential transient binding partner proteins, thusunderestimating the extent of OGT and OGA abundance inthe myofilaments. To properly evaluate these interactions,we used a coimmunoprecipitation approach, testing whether
OGT and OGA are physically associated with myofilamentproteins and determining possible changes in their myofil-ament abundance imparted by diabetes. Fresh whole-hearthomogenates from control or diabetic (STZ-treated) ratswere immunoprecipitated with anti-OGT (AL-28) or anti-OGA (345) antibodies (29), resolved by SDS-PAGE, andanalyzed by Western blots against several myofilamentproteins. OGT and OGA were both associated with a-cardiacactin, a-Tm, and MLC 1 in normal hearts (Fig. 5E and F).A representative coimmunoprecipitation of OGT and OGAwith interacting myofilament proteins is provided in Fig. 5Eand F. In the diabetic hearts, the OGA-immunoprecipitatedinteractions with a-cardiac actin, a-Tm, and MLC 1 wereincreased several fold compared with the control interac-tions (Fig. 5H) (n = 5 vs. n = 4, P , 0.05), whereas inter-actions with OGT were normal. On the other hand,
Figure 4—OGT and OGA distribution profile in human and rat control and diabetic hearts. A: Human donor and diabetic myocardiumcryosections were immunostained for a-actinin (green), OGT (magenta), and OGA (red). Regions of interest (white square and line) werechosen to plot OGT, OGA, and a-actinin signals. Signals from donor or diabetic myocardium are displayed as double y-axis graphs toillustrate the inversed distribution profile of OGT/a-actinin and OGA/a-actinin, respectively. B: Rat control and diabetic skinnedmyocytes were isolated from flash-frozen myocardium, fixed in 4% ultrapure formaldehyde, and immunostained as above. Regionsof interest and OGT, OGA, and a-actinin signals were plotted as above and confirmed the abnormal distribution profile of OGT and OGAin diabetic hearts.
diabetes.diabetesjournals.org Ramirez-Correa and Associates 3581

although the OGT-immunoprecipitated interactions withmyofilaments tended to have increased interactions in di-abetic samples, they did not reach statistical significance.The heterogeneity of the signals for OGT and OGA coim-munoprecipitations on the control heart homogenatesmight be related to the feeding status (ad libitum) of theanimals or to a potential cyclic nature of these protein-to-protein interactions. Hence, OGA interactions with myofil-ament proteins are more abundant in diabetic hearts, andthey are likely contributing to reduce contractility.
OGT and OGA Activity Are Altered in Diabetic HeartsIn diabetic hearts, overall O-GlcNAc levels have beenreported to change with or without reciprocal changes inOGT expression and uridine diphosphate (UDP)–GlcNAclevels (40). Protein specific O-GlcNAcylation, however, canchange in either direction (40). With this paradox in mind,we hypothesized that the observed changes in OGT/OGAsarcomeric distribution and myofilament protein interac-tions might influence their enzymatic activity. To testthis, fresh whole hearts from control or STZ diabetic rats
Figure 5—Differential OGT and OGA subcellular localization and myofilament interactions in control and diabetic myocardium. Representativetransmission electron microscopy images of control (A) and STZ diabetic rat myocardium (B). Ultrathin sections were examined with immunoelectronmicroscopy with primary antibodies (anti-OGT AL-28 and anti-OGA), and secondary antibodies gold-labeled (anti-rabbit, 12 nm; anti-chicken, 6 nm).Z-line, green arrowhead; OGT, purple circles; OGA, red circles; OGT and OGA in close vicinity, pink circles; OGT, purple arrowhead; and OGA, redarrowhead. Quantification of OGT (C) and OGA (D) number of particles/field in nine fields shows an increase for OGT (2 6 0.6 vs. 8.6 6 2.6,*P # 0.028) and OGA (9.4 6 2.9 vs 37.6 6 12.6, *P # 0.05) immunoelectron microscopy in STZ diabetic myocardium. Images were analyzed inImageJ software (NIH). Representative coimmunoprecipitations (co-IP) of OGT (E) and OGA (F), followed by Western blots (WB) for a-sarcomericactin, Tm, and MLC 1. A fraction of the inputs from controls (C1, C2), STZ (S1, S2), and agarose beads with no antibody (M) or isotype-specificnormal antibody + agarose beads (1°) were included. G: Analysis of integrated signal density of myofilament immunoreactivity normalized to total IPOGT displayed a trend toward increased interactions with Tm and MLC 1. H: OGA co-IP shows that diabetic STZ rats display several fold increasedassociations with a-actin, a-Tm, and MLC 1. *P # 0.05.
3582 OGA Restores Cardiac Muscle ECa2+50 in Diabetes Diabetes Volume 64, October 2015

were homogenized in extraction buffer containing 1% Tri-ton X-100. Total tissue homogenates were separated in cy-tosolic and myofilament fractions by centrifugation. ForOGT assays, both cytosolic and myofilament fractionswere desalted into OGT desalting buffer (for activity assays)or stored at 280°C for SDS-PAGE and Western blots. AfterOGT expression was normalized to cTnI content, neithersubcellular fraction showed significant differences betweencontrol (n = 3) and STZ diabetic (n = 3) hearts (myofilamentand cytosolic fractions are shown in Fig. 6A and B, respec-tively). OGT activity was assayed by the incorporation ofUDP–[H3]-labeled GlcNAc into a synthetic peptide (CKIIpeptide); disintegration per minute counts were normalizedto micrograms of protein, and then OGT activity withoutpeptide was subtracted (31) (Fig. 7C). This approachrevealed a significant reduction in myofilament-associatedOGT activity in STZ diabetic hearts (Fig. 6D, obtained inmyofilament fractions). Conversely, OGT activity in the cy-tosolic fractions of STZ diabetic hearts was not significantlydifferent (Fig. 6E).
For OGA assays, myofilament fractions retained tracesof detergent; therefore, they were not suitable formeasurement of enzymatic activity. However, total tissuehomogenates became properly usable after protein pre-cipitation with 30–50% ammonium sulfate and desaltinginto OGA assay buffer. After the latter procedure, OGAexpression normalized to cTnI content was not signifi-cantly different between groups (0.54 6 0.02 for STZ
vs. 1.14 6 0.29 for controls, n = 3 each) (Fig. 6C). OGAactivity was assessed by the release of p-nitrophenol(pNP) from pNP-GlcNAc, a synthetic substrate. In addition,our approach accounted for OGA activity background morestrictly because we subtracted OGA activity detected in thepresence of thiamet-G, the most potent and specific OGAinhibitor available (41) (Fig. 7C). OGA-specific activity wassignificantly increased in homogenates from STZ diabetichearts compared with controls (Fig. 6F). Thus, changes inOGT/OGA protein-to-protein interactions and subcellularlocalization may influence OGT/OGA enzymatic activity.
DISCUSSION
This study establishes that excessiveO-GlcNAcylation, in a spe-cific subset of myofilament sites of MHC, a-sarcomeric actin,and Tm, is sufficient to produce myofilament dysfunction indiabetic cardiomyopathy, and it does so by affecting Ca2+ sen-sitivity. These perturbations in myofilament O-GlcNAcylationresult from OGT and OGA displacement within the sarcomererather than from variations in enzymatic activity per se, result-ing in an overall perturbed O-GlcNAc cycling. Important, froma translational point of view, is the finding that similar alter-ations occur in experimental and human diabetic hearts.
Depressed myofilament Ca2+ sensitivity is a hallmarkof myofilament dysfunction in diabetic cardiomyopathyand heart failure (7,11). Alterations in myofilament phos-phorylation are now recognized as important negativemodulators of cardiac function, along with perturbations
Figure 6—Subcellular expression and activity of OGT and OGA in diabetic hearts. Analysis of OGT expression in myofilament fractions (A)and in cytosolic fractions (B) showed no significant differences between STZ diabetic and control hearts. C: OGA expression tended to belower in myocardium total homogenates from STZ diabetic hearts but did not reach statistical significance. D: OGT activity showeda significant decrease in myofilament fractions from STZ diabetic hearts. *P < 0.05. E: OGT activity assays in cytosolic fractions showedno significant difference. F: OGA assays for specific activity in total heart homogenates showed a significant increase in STZ diabetichearts. For all quantifications, bar graphs represent the mean of n = 3 6 SEM. *P < 0.05.
diabetes.diabetesjournals.org Ramirez-Correa and Associates 3583

in Ca2+ handling (39,42–44). That alterations in cardiacprotein O-GlcNAcylation are present in models of type 1and type 2 diabetes (2,4,24,40,45) and cardiac disease(21,38) is well established; however, no studies haveaddressed yet the functional effect of cardiac myofila-ments O-GlcNAcylation during the course of diabetic car-diac dysfunction (2–4). We have previously identifiednumerous sites within the cardiac myofilament areO-GlcNAcylated under normal conditions (14). We alsoshowed that incubation of normal skinned cardiacmuscles with GlcNAc reduced myofilament Ca2+
sensitivity (14). Moreover, adenoviral-based or inducibletransgenic overexpression of human OGA, for whichCpOGA is a very close homolog, is known to amelioratecontractile and energetic deficits associated with diabeticcardiomyopathy (4,45). Here, we add important novelevidence that in diabetic myofilaments there are selectiveproteins, such as MHC, a-sarcomeric cardiac actin (actin),and cardiac a-Tm, and some of their specific sites such asMHC S844, S1471, S1472, T1601 and S1917, actin T326,and TmS87, that indeed have excessive O-GlcNAcylation.More importantly, we demonstrated that specific removal
Figure 7—Model of O-GlcNAc role in diabetic cardiomyopathy pathogenesis. A: General characteristics of OGT and OGA. B: OGT/OGAlocalization in normal and diabetic sarcomeres; functional effect of O-GlcNAc-specific removal by OGA-like CpOGA. C: Graphical repre-sentation of OGT activity toward CKII peptide or endogenous targets and OGA total or specific activity when normalized to residual activityin the presence of thiamet-G (TMG).
3584 OGA Restores Cardiac Muscle ECa2+50 in Diabetes Diabetes Volume 64, October 2015
of excessive O-GlcNAcylation, from a subset of myofilamentssites via CpOGA (Fig. 1C) rapidly restores myofilament Ca2+
sensitivity, thus correcting myofilament dysfunction in STZdiabetic skinned muscles. The advantage of our approach(i.e., the use of recombinant CpOGA on skinned cardiacmuscles) resides in the ability of assessing the functionalconsequences of O-GlcNAcylation removal from myofila-ments independently from other major adverse effects even-tually imposed by O-GlcNAcylation on Ca2+ handling andmitochondrial key proteins (2,4,15,24,45–48). Thus, herewe cement the view that excessive O-GlcNAcylation isa novel, negative modulator of myofilament function inthe diabetic myocardium. At the same time, our data sug-gest, for the first time, that removing excess of O-GlcNAcfrom diabetic myofilaments specific sites mimics what de-phosphorylation does on Ca2+ sensitivity in experimental(49) and human heart failure (50–53).
Cardiac myofilament phosphorylation and function isregulated by multiple kinases and phosphatases (54,55).They strategically dock at the Z-line and modify theiractivity and/or localization in response to mechanicalforces and neurohumoral stimuli (54,55). The displace-ment of these enzymatic activities may have importantfunctional repercussions on the contractile apparatus(39). For instance, at baseline, protein phosphatase 2Aforms a complex with protein phosphatase 2B and p38–mitogen-activated protein kinase, but it moves away fromthe Z-line upon b-adrenergic stimulation (55). Whethersimilar effects can be attained by changes in the sarco-meric localization of OGT and OGA is currently unknown.
Here we report that, in normal hearts, OGT and OGAdistribute mainly at the Z-line and A-band, respectively.However, in diabetic hearts, OGT drifts away from theZ-line, whereas OGA appears even more clustered at thissite. Importantly, these changes are similarly evident inrat and human diabetic myocardium. It is already wellknown that OGT localization and catalytic activitychanges in response to metabolic cues (12,56). OGT andOGA often occur in transient protein-to-protein complexescontaining kinases and phosphatases (12,56). Theseinclude kinases and phosphatases such as AMPK(56), Ca2+/calmodulin-dependent protein kinase IV, p38–mitogen-activated protein kinase, protein phosphatase 1,and myosin phosphatase targeting 1, which are key regu-lators of cardiac metabolism and function (12). Althoughthese protein interactions have not been confirmed inthe heart, a recent report elegantly shows that CaMKII isO-GlcNAcylated during acute hyperglycemia and diabetes,leading to chronic activation, which contributes to diabetescardiac mechanical dysfunction and arrhythmias (24). Pres-ent data show that, in the heart, OGT and OGA formcomplexes with a-cardiac actin, a-Tm, and MLC 1, andthat these protein-to-protein complexes are enhanced forOGA in diabetes. These alterations are potentially relevantto the pathogenesis of diabetic systolic and diastolic dysfunc-tion, given that transient protein-to-protein complexes regu-late OGT substrate specificity (12). Because O-GlcNAcylation
and phosphorylation signaling cascades have extensive cross-talk (12,56), both at the level of site occupancy and at thelevel of modifying enzymes, further dissecting this phenom-enon in the heart would be important.
Previously, OGT expression (40,57,58) and activity(59) in diabetic hearts have been found to be normal,whereas OGA activity is reduced, with or without recip-rocal changes in expression (57–59). Here, we analyzedmyofilament and cytosolic fractions separately. We foundthat OGT expression in diabetic hearts is not differentbetween diabetic and control hearts. Owing to OGA in-hibition by traces of Triton X-100, OGA expression andactivity were analyzed only in total homogenates in whichOGA expression was not different between groups. Inaddition, our study accounts for OGT and OGA activitybackground in a more rigorous way. Indeed, OGT activitywithout CKII peptide and OGA activity with thiamet-G(a specific OGAse inhibitor) were subtracted. Our myofila-ment versus cytosolic compared data showed that OGTenzymatic activity is reduced in the myofilament in di-abetic hearts but not in the cytosolic fraction. In con-trast, OGA activity in total homogenates is significantlyincreased in diabetic hearts (Fig. 6F). This apparent par-adoxical decrease of OGT activity in diabetic hearts couldbe explained by the way we accounted for the back-ground activity, subcellular fractionation, or by changesin OGT substrate specificity in response to metaboliccues (30). Increased OGA activity may reflect compen-sation for excessive O-GlcNAcylation. Supporting thispossibility is previous evidence showing that increasederythrocyte protein O-GlcNAcylation and OGA activityare present in samples from patients with prediabetesand with type 2 diabetes (60).
Cardiac contractility is regulated on a beat-to-beat basisby the Ca2+-dependent modulation of myosin cross-bridgebinding on actin by the Tm-troponin complex. Cross-bridgecycling occurs at the A-band (61), whereas most of thesignaling arises from the Z-line (54,55,62). Thus, retarget-ing of OGT and OGA may increase a-cardiac actinO-GlcNAcylation at the A-band, potentially interferingwith actin-Tm modulation of cross-bridge cycling (Fig. 7B).Altogether, these data suggest that in diabetic hearts, OGTand OGA displacement rather than their catalytic activity isthe key in modulating excessive O-GlcNAcylation.
There are limitations in the current study. First, morework is needed to define the functional effect of myofila-ment O-GlcNAcylation at the site-specific level, alongwith the interplay with phosphorylation. Second, futurestudies should address whether excessive a-cardiac actinO-GlcNAcylation indeed perturbs cross-bridge cycling ki-netics, actin-Tm interactions, or the actin rate of poly-merization. Finally, it is not known whether O-GlcNAcmodifications or phosphorylation of specific substrates orin OGT/OGA contribute to their altered pattern of localiza-tion. Answering this question would define more in detailthe effect of this PTM on the function of diabetic hearts;however, it requires fully dedicated, separate studies.
diabetes.diabetesjournals.org Ramirez-Correa and Associates 3585

In conclusion, the present work demonstrates thatabnormal O-GlcNAcylation is sufficient to cause myofila-ment functional deficit in diabetic cardiomyopathy. In-creased OGA interactions with sarcomeric proteins(a-cardiac actin, a-Tm, and MLC 1) are likely central tothese alterations, showing that normal sarcomeric OGTand OGA subcellular localization is lost in myofilamentsfrom diabetic hearts. This abnormal redistribution ofO-GlcNAc cycling enzymes is similarly present in experi-mental and human diabetic cardiomyopathy. On thesegrounds, here we propose that, in addition to directtargeting of abnormal site-specific phosphorylation ofmyofilament regulatory subunits, removing abnormalsite-specific O-GlcNAcylation in myofilaments and/or pre-venting changes in O-GlcNAc cycling should be consideredas another promising new therapeutic avenue for treatingdiabetic cardiomyopathy.
Acknowledgments. For expert technical assistance, the authors thankJohn Robinson from Pediatric Cardiology and the JHMI Microscope Facility, andMarina Allary (Johns Hopkins School of Medicine) for helpful suggestions.Funding. This work has been supported by the National Institutes of Health(NIH)/National Heart, Lung, and Blood Institute (NHLBI) Proteomics Center Con-tract HHSN268201000032C (A.M.M., G.W.H.), R01-DK-61671 (G.W.H.); Programof Excellence in Glycobiology NHLBI P01-HL-107153 (G.W.H., N.P.), R01-HL-091923 (N.P.); American Heart Association (AHA) and the Lawrence and FlorenceA. DeGeorge Charitable Trust Scientist Developing Grant (AHA-12SDG9140008)for G.A.R.-C., AHA (AHA-0855439E) for W.D.G.; and Institutional DevelopmentAward (IDeA) from National Institute of General Medical Sciences/NIH (P20-GM-12345 and R01-DK100595) for C.S. In addition, this study was supported by theJohns Hopkins Institute for Clinical and Translational Research, which is fundedin part by Grant Number UL1-TR-001079 from National Center for AdvancingTranslational Sciences/NIH for L.M.Duality of Interest. Under a licensing agreement between JohnsHopkins University and several companies, including Covance ResearchProducts, Sigma-Aldrich, and Santa Cruz Biotechnology, G.W.H. receivesroyalties from the sale of the CTD110.6 O-GlcNAc antibody. The terms aremanaged by Johns Hopkins University in accordance with conflict of interestpolicies. No other potential conflicts of interest relevant to this article werereported.Author Contributions. G.A.R.-C. designed and performed research, an-alyzed data, and wrote the manuscript. J.M. and C.S. designed and performedresearch, analyzed data, and edited and reviewed the manuscript. Q.Z. performedresearch, analyzed data, and edited and reviewed the manuscript. N.S.L.-F.,M.X., V.C., K.C., L.D., and R.N.C. performed research and analyzed data. X.S.performed research. L.M., N.P., and G.W.H. assisted with experimental discus-sion and with critical evaluation and editing of the manuscript. W.D.G. analyzeddata and edited and reviewed the manuscript. A.M.M. designed research, inter-preted data, and assisted with experimental discussion and with critical evalu-ation and editing of the manuscript. G.A.R.-C. is the guarantor of this work and,as such, had full access to all data in the study and takes responsibility for theintegrity of the data and the accuracy of the data analysis.Prior Presentation. Parts of this study were presented at the BasicCardiovascular Sciences 2011 Scientific Sessions of the American Heart Asso-ciation, New Orleans, LA, 18–21 July 2011, and at the American Heart Associ-ation 2012 Scientific Sessions, Los Angeles, CA, 3–7 November 2012.
References1. Boudina S, Abel ED. Diabetic cardiomyopathy revisited. Circulation 2007;115:3213–3223
2. Clark RJ, McDonough PM, Swanson E, et al. Diabetes and the accompa-nying hyperglycemia impairs cardiomyocyte calcium cycling through increasednuclear O-GlcNAcylation. J Biol Chem 2003;278:44230–442373. Davidoff AJ, Ren J. Low insulin and high glucose induce abnormal re-laxation in cultured adult rat ventricular myocytes. Am J Physiol 1997;272:H159–H1674. Hu Y, Belke D, Suarez J, et al. Adenovirus-mediated overexpression ofO-GlcNAcase improves contractile function in the diabetic heart. Circ Res 2005;96:1006–10135. Zhang L, Cannell MB, Phillips AR, Cooper GJ, Ward ML. Altered calciumhomeostasis does not explain the contractile deficit of diabetic cardiomyopathy.Diabetes 2008;57:2158–21666. Flagg TP, Cazorla O, Remedi MS, et al. Ca2+-independent alterations indiastolic sarcomere length and relaxation kinetics in a mouse model of lipotoxicdiabetic cardiomyopathy. Circ Res 2009;104:95–1037. Malhotra A, Penpargkul S, Fein FS, Sonnenblick EH, Scheuer J. The effect ofstreptozotocin-induced diabetes in rats on cardiac contractile proteins. Circ Res1981;49:1243–12508. Malhotra A, Sanghi V. Regulation of contractile proteins in diabetic heart.Cardiovasc Res 1997;34:34–409. Akella AB, Ding XL, Cheng R, Gulati J. Diminished Ca2+ sensitivity ofskinned cardiac muscle contractility coincident with troponin T-band shifts in thediabetic rat. Circ Res 1995;76:600–60610. Hofmann PA, Menon V, Gannaway KF. Effects of diabetes on isometrictension as a function of [Ca2+] and pH in rat skinned cardiac myocytes. Am JPhysiol 1995;269:H1656–H166311. Jweied EE, McKinney RD, Walker LA, et al. Depressed cardiac myofilamentfunction in human diabetes mellitus. Am J Physiol Heart Circ Physiol 2005;289:H2478–H248312. Hart GW, Slawson C, Ramirez-Correa G, Lagerlof O. Cross talk betweenO-GlcNAcylation and phosphorylation: roles in signaling, transcription, andchronic disease. Annu Rev Biochem 2011;80:825–85813. Hedou J, Cieniewski-Bernard C, Leroy Y, Michalski JC, Mounier Y, BastideB. O-linked N-acetylglucosaminylation is involved in the Ca2+ activation prop-erties of rat skeletal muscle. J Biol Chem 2007;282:10360–1036914. Ramirez-Correa GA, Jin W, Wang Z, et al. O-linked GlcNAc modification ofcardiac myofilament proteins: a novel regulator of myocardial contractile function.Circ Res 2008;103:1354–135815. Makino A, Suarez J, Gawlowski T, et al. Regulation of mitochondrial mor-phology and function by O-GlcNAcylation in neonatal cardiac myocytes. Am JPhysiol Regul Integr Comp Physiol 2011;300:R1296–R130216. Fülöp N, Zhang Z, Marchase RB, Chatham JC. Glucosamine cardioprotectionin perfused rat hearts associated with increased O-linked N-acetylglucosamineprotein modification and altered p38 activation. Am J Physiol Heart Circ Physiol2007;292:H2227–H223617. Jones SP, Zachara NE, Ngoh GA, et al. Cardioprotection by N-acetylglucosamine linkage to cellular proteins. Circulation 2008;117:1172–118218. Watson LJ, Facundo HT, Ngoh GA, et al. O-linked b-N-acetylglucosaminetransferase is indispensable in the failing heart. Proc Natl Acad Sci U S A 2010;107:17797–1780219. Laczy B, Hill BG, Wang K, et al. Protein O-GlcNAcylation: a new signalingparadigm for the cardiovascular system. Am J Physiol Heart Circ Physiol 2009;296:H13–H2820. Ngoh GA, Facundo HT, Zafir A, Jones SP. O-GlcNAc signaling in the car-diovascular system. Circ Res 2010;107:171–18521. Lunde IG, Aronsen JM, Kvaløy H, et al. Cardiac O-GlcNAc signaling is in-creased in hypertrophy and heart failure. Physiol Genomics 2012;44:162–17222. Fein FS, Strobeck JE, Malhotra A, Scheuer J, Sonnenblick EH. Reversibilityof diabetic cardiomyopathy with insulin in rats. Circ Res 1981;49:1251–126123. Malhotra A, Lopez MC, Nakouzi A. Troponin subunits contribute to alteredmyosin ATPase activity in diabetic cardiomyopathy. Mol Cell Biochem 1995;151:165–172
3586 OGA Restores Cardiac Muscle ECa2+50 in Diabetes Diabetes Volume 64, October 2015

24. Erickson JR, Pereira L, Wang L, et al. Diabetic hyperglycaemia activatesCaMKII and arrhythmias by O-linked glycosylation. Nature 2013;502:372–37625. Gao WD, Backx PH, Azan-Backx M, Marban E. Myofilament Ca2+ sensitivityin intact versus skinned rat ventricular muscle. Circ Res 1994;74:408–41526. Gao WD, Murray CI, Tian Y, et al. Nitroxyl-mediated disulfide bond formationbetween cardiac myofilament cysteines enhances contractile function. Circ Res2012;111:1002–101127. Rao FV, Dorfmueller HC, Villa F, Allwood M, Eggleston IM, van Aalten DM.Structural insights into the mechanism and inhibition of eukaryotic O-GlcNAchydrolysis. EMBO J 2006;25:1569–157828. Kirk JA, Holewinski RJ, Kooij V, et al. Cardiac resynchronization sensitizes thesarcomere to calcium by reactivating GSK-3b. J Clin Invest 2014;124:129–13829. Slawson C, Lakshmanan T, Knapp S, Hart GW. A mitotic GlcNAcylation/phosphorylation signaling complex alters the posttranslational state of the cy-toskeletal protein vimentin. Mol Biol Cell 2008;19:4130–414030. Cheung WD, Hart GW. AMP-activated protein kinase and p38 MAPK activateO-GlcNAcylation of neuronal proteins during glucose deprivation. J Biol Chem2008;283:13009–1302031. Zachara NE, Cole RN, Hart GW, Gao Y. Detection and analysis of proteinsmodified by O-linked N-acetylglucosamine. Curr Protoc Protein Sci 2001;Chapter12:Unit 12.1832. Murphy AM, Solaro RJ. Developmental difference in the stimulation of cardiacmyofibrillar Mg2(+)-ATPase activity by calmidazolium. Pediatr Res 1990;28:46–4933. Wang Z, Park K, Comer F, Hsieh-Wilson LC, Saudek CD, Hart GW. Site-specific GlcNAcylation of human erythrocyte proteins: potential biomarker(s) fordiabetes. Diabetes 2009;58:309–31734. Wells L, Vosseller K, Cole RN, Cronshaw JM, Matunis MJ, Hart GW. Mappingsites of O-GlcNAc modification using affinity tags for serine and threonine post-translational modifications. Mol Cell Proteomics 2002;1:791–80435. Smyth GK, Michaud J, Scott HS. Use of within-array replicate spots forassessing differential expression in microarray experiments. Bioinformatics 2005;21:2067–207536. Smyth GK. Linear models and empirical bayes methods for assessing dif-ferential expression in microarray experiments. Stat Appl Genet Mol Biol 2004;3:Article337. Schimpl M, Borodkin VS, Gray LJ, van Aalten DM. Synergy of peptide andsugar in O-GlcNAcase substrate recognition. Chem Biol 2012;19:173–17838. Leung MC, Hitchen PG, Ward DG, Messer AE, Marston SB. Z-bandalternatively spliced PDZ motif protein (ZASP) is the major O-linked b-N-acetylglucosamine-substituted protein in human heart myofibrils. J Biol Chem2013;288:4891–489839. Zhang P, Kirk JA, Ji W, et al. Multiple reaction monitoring to identify site-specific troponin I phosphorylated residues in the failing human heart. Circulation2012;126:1828–183740. Fülöp N, Mason MM, Dutta K, et al. Impact of Type 2 diabetes and aging oncardiomyocyte function and O-linked N-acetylglucosamine levels in the heart. AmJ Physiol Cell Physiol 2007;292:C1370–C137841. Yuzwa SA, Macauley MS, Heinonen JE, et al. A potent mechanism-inspiredO-GlcNAcase inhibitor that blocks phosphorylation of tau in vivo. Nat Chem Biol2008;4:483–49042. Bilchick KC, Duncan JG, Ravi R, et al. Heart failure-associated alterations introponin I phosphorylation impair ventricular relaxation-afterload and force-frequency responses and systolic function. Am J Physiol Heart Circ Physiol 2007;292:H318–H32543. Ramirez-Correa GA, Cortassa S, Stanley B, Gao WD, Murphy AM. Calciumsensitivity, force frequency relationship and cardiac troponin I: critical role of PKAand PKC phosphorylation sites. J Mol Cell Cardiol 2010;48:943–953
44. Takimoto E, Soergel DG, Janssen PM, Stull LB, Kass DA, Murphy AM.Frequency- and afterload-dependent cardiac modulation in vivo by troponin I withconstitutively active protein kinase A phosphorylation sites. Circ Res 2004;94:496–50445. Fricovsky ES, Suarez J, Ihm SH, et al. Excess protein O-GlcNAcylation andthe progression of diabetic cardiomyopathy. Am J Physiol Regul Integr CompPhysiol 2012;303:R689–R69946. Ren J, Davidoff AJ. Diabetes rapidly induces contractile dysfunctions inisolated ventricular myocytes. Am J Physiol 1997;272:H148–H15847. Ren J, Gintant GA, Miller RE, Davidoff AJ. High extracellular glucose impairscardiac E-C coupling in a glycosylation-dependent manner. Am J Physiol 1997;273:H2876–H288348. Zhu-Mauldin X, Marsh SA, Zou L, Marchase RB, Chatham JC. Modificationof STIM1 by O-linked N-acetylglucosamine (O-GlcNAc) attenuates store-operated calcium entry in neonatal cardiomyocytes. J Biol Chem 2012;287:39094–3910649. Belin RJ, Sumandea MP, Allen EJ, et al. Augmented protein kinase C-alpha-induced myofilament protein phosphorylation contributes to myofilament dys-function in experimental congestive heart failure. Circ Res 2007;101:195–20450. Kooij V, Saes M, Jaquet K, et al. Effect of troponin I Ser23/24 phosphor-ylation on Ca2+-sensitivity in human myocardium depends on the phosphory-lation background. J Mol Cell Cardiol 2010;48:954–96351. Kooij V, Zhang P, Piersma SR, et al. PKCa-specific phosphorylation of thetroponin complex in human myocardium: a functional and proteomics analysis.PLoS One 2013;8:e7484752. Wijnker PJ, Boknik P, Gergs U, et al. Protein phosphatase 2A affectsmyofilament contractility in non-failing but not in failing human myocardium. JMuscle Res Cell Motil 2011;32:221–23353. Wijnker PJ, Foster DB, Tsao AL, et al. Impact of site-specific phosphory-lation of protein kinase A sites Ser23 and Ser24 of cardiac troponin I in humancardiomyocytes. Am J Physiol Heart Circ Physiol 2013;304:H260–H26854. Solaro RJ. Multiplex kinase signaling modifies cardiac function at the levelof sarcomeric proteins. J Biol Chem 2008;283:26829–2683355. Solaro RJ. Sarcomere control mechanisms and the dynamics of the cardiaccycle. J Biomed Biotechnol 2010;2010:10564856. Bullen JW, Balsbaugh JL, Chanda D, et al. Cross-talk between two essentialnutrient-sensitive enzymes: O-GlcNAc transferase (OGT) and AMP-activatedprotein kinase (AMPK). J Biol Chem 2014;289:10592–1060657. Bennett CE, Johnsen VL, Shearer J, Belke DD. Exercise training mitigatesaberrant cardiac protein O-GlcNAcylation in streptozotocin-induced diabetic mice.Life Sci 2013;92:657–66358. Cox EJ, Marsh SA. Exercise and diabetes have opposite effects on theassembly and O-GlcNAc modification of the mSin3A/HDAC1/2 complex in theheart. Cardiovasc Diabetol 2013;12:10159. Jensen RV, Zachara NE, Nielsen PH, Kimose HH, Kristiansen SB, Bøtker HE.Impact of O-GlcNAc on cardioprotection by remote ischaemic preconditioning innon-diabetic and diabetic patients. Cardiovasc Res 2013;97:369–37860. Park K, Saudek CD, Hart GW. Increased expression of beta-N-acetylglucosaminidase in erythrocytes from individuals with pre-diabetes anddiabetes. Diabetes 2010;59:1845–185061. Ibanez-Garcia D, Requejo-Isidro J, Webb MR, West TG, French P,Ferenczi MA. Fluorescence lifetime imaging reveals that the environment ofthe ATP binding site of myosin in muscle senses force. Biophys J 2010;99:2163–216962. Hoshijima M. Mechanical stress-strain sensors embedded in cardiac cy-toskeleton: Z disk, titin, and associated structures. Am J Physiol Heart CircPhysiol 2006;290:H1313–H1325
diabetes.diabetesjournals.org Ramirez-Correa and Associates 3587