Embed Size (px)
Citation preview
RESTRICTED
ILE COPY Report No. AS-109
This report was prepared for use within the Bank and its affilioted organizations.They do not accept responsibility for its accurocy or completeness. The report maynot be published nor may it be quoted as representing their views.
INTERNATIONAL BANK FOR RECONSTRUCTION AND DEVELOPMENT
INTERNATIONAL DEVELOPMENT ASSOCIATION
ECONOMIC DEVELOPMENT
OF
PAKISTAN
VOLUME I
MAIN REPORT
April 26, 1965
South Asia Department
Pub
lic D
iscl
osur
e A
utho
rized
Pub
lic D
iscl
osur
e A
utho
rized
Pub
lic D
iscl
osur
e A
utho
rized
Pub
lic D
iscl
osur
e A
utho
rized
Pub
lic D
iscl
osur
e A
utho
rized
Pub
lic D
iscl
osur
e A
utho
rized
Pub
lic D
iscl
osur
e A
utho
rized
Pub
lic D
iscl
osur
e A
utho
rized
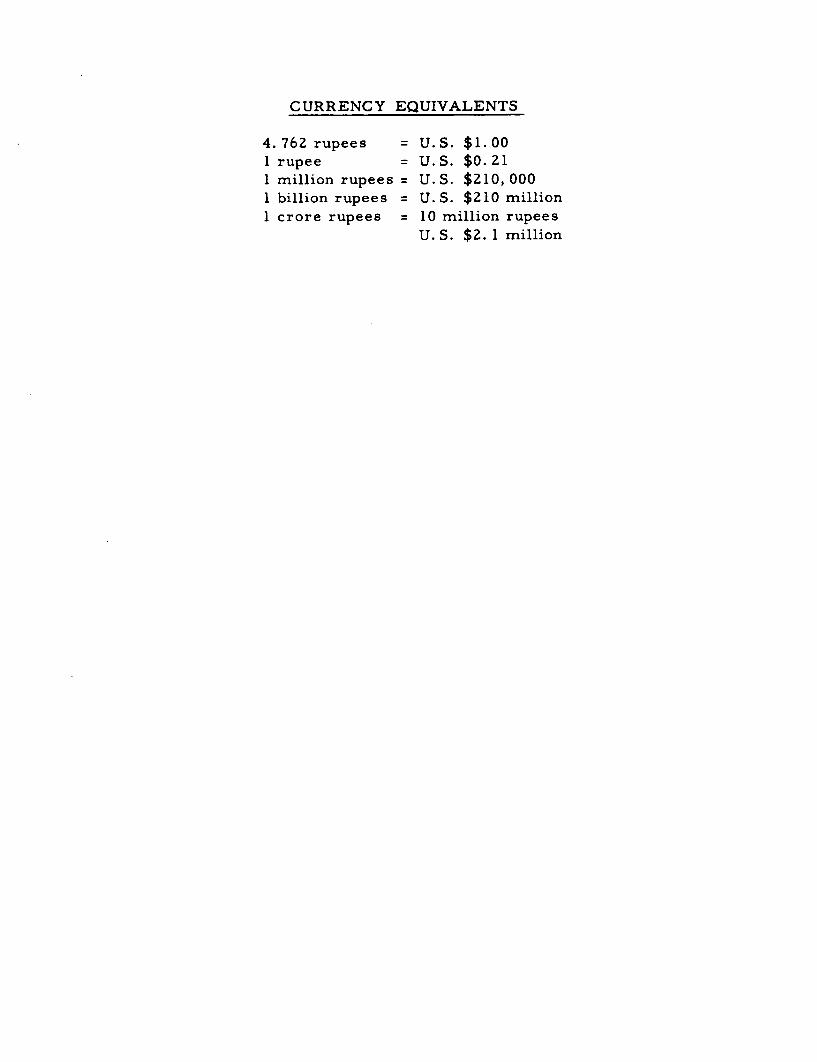
CURRENCY EQUIVALENTS
4.762 rupees = U.S. $1.001 rupee = U.S. $0.211 million rupees = U.S. $210,0001 billion rupees = U.S. $210 million1 crore rupees = 10 million rupees
U. S. $2. 1 million
FILE COPY
i4EMORANDU I ONRECENT ECONOMIC DEVELOPMENTS AND PROSPECTS
IN PAKISTAN
Introduction
1. A report entitled "The Economic Development of Pakistan" (AS-109,April 26, 1965), was circulated to the Executive Directors on April 29, 1965.It contained an evaluation of achievements of the Second Five-Year Plan(1960-1965) and an appraisal of the proposed Third Five-Year Plan (1965-1970).This memorandum gives an account of more recent developments in the economicfield, in particular those arising from the hostilities between India andPakistan.
2. During 1964/65 the economy grew by 4.8 per cent and the prospects arethat a similar rate of growth may be achieved in 1965/66. This ispossible because of the exceptionally good outlook for agricultural produc-tion. However, such a rate is well below the growth target of 6.5 per centper annum for the whole Third Plan.
General Economic Effect of Hostilities
3. The physical damage to productive facilities during recent hostilitieswith India is reported to have been limited. However, of serious consequencefor the development effort have been the disruption of the flow of foreignaid, the diversion of public funds and of foreign exchange reserves todefense, and the loss of momentum resulting from the slowing down of economicactivities in the private sector. The hostilities have also disrupted inter-national shipping to Pakistan, delaying the export of the current jute andcotton crops. Nlo shortages of critical supplies developed during the hostil-ities nor did it become necessary to introduce rationing of foodgrains orprice cQntrols or other administrative controls over production and distri-bution.
Changes in the 1965/66 Budget and Development Program
4. The Minister of Finance, in presenting the Budget of the Central Gov-ernment to the National Assembly on June 14, announced that it was theintention of the Pakistan Government to implement the Third Five-Year Planonly within the framework of monetary stability and that the 1965/66 annualdevelopment program had been formulated in conformity with the Third Plan.Although the Plan's phasing would have required budgeting for Rs. 4,700million for the public sector, the 1965/66 annual development plan wasestablished at Rs. 4,460 million.
- 2 -
5. Early in October a number of fiscal measures were announced tostrengthen incentives for private investment. At the end of October theGovernment announced a reduction amounting to about 23 per cent in proposedexpenditure for the 1965/66 development program. The revised total ofRs. 3,420 million is referred to as the "Hard Core Development Program".The reduction in the development appropriation was attributed to a loss ofrevenue receipts owing to the hostilities, the slowdown in expected arrivalsof foreign aid goods, and the increase in planned expenditure for defense.
6. On November 22 the Finance Minister introduced into the NationalAssembly a Supplementary Finance Bill. He stated that there would be areduction of non-development expenditures of the Central and ProvincialGovernments estimated at Rs. 150 million and announced some new taxationproposals. Those proposals took the form of a defense surcharge of 25 percent on the existing rates of sales tax, import duties (except on machinery)and excise duties on petroleum products. The net savings arising from (a)the reductions in budgeted development and non-development expenditures,after taking account of the loss of revenues and of receipts from foreignaid, and (b) the revenue from additional taxes (estimated at Rs. 295 million)..plus (c) the bulk of the existing provision of Rs. 350 million for contin-gencies, will all be used for defense. In addition-, the Government is rais/ngsome funds by voluntary contributions to a Defense Fund and the sale ofDefense Bonds. However, no estimate of the comprehensive additional defenseexpenditures has been given. In the fiscal year ending June 30, 1965,expenditures on defense services amounted to Rs. 1321 million and Rs. 1361million was originally budgeted for this purpose for 1965/66.
Monetary Policy
7. Because of the inflationary dangers apparent at the beginning of1965, in January the State Bank had tightened credit controls. Afterregistering a nominal increase of only about Rse 30 million in the first sixmonths of 1965, the money supply declined by about Rs. 290 million from July 1to September 30. In October, because of the possibility of deflationarytendencies emerging in the economy, and with the intention of reviving nonai;Leconomic activity, credit restrictions were eased. This change consisted ofa lowering of the statutory cash reserve ratio of commercial banks, theelimination of the quota system which was designed to limit Central Bankadvances to the commercial banks, and the reduction of margin requirementson loans for imports and for inventory financing.
Import Liberalization Program
8. The import liberalization program, started early in 1964, was modifiedon October 2, 1965. While the principle of a Free (unlicensed) List isretained, the number of items on the List was reduced from 56 to 31. Theimport liberalization program was developed on the assumption of foreignassistance being received in the form of non-project aid, and with theprospect of its severe reduction it has been necessary for Pakistan toeliminate some of the items previously allowed to be imported on the FreeList. There was also some tightening of restrictions on all other imports.
These measures have been taken because of the decline in foreign exchangereserves which fell by about a quarter from July 1, 1964, to September 30,1965. A further loss of reserves was experienced in October.
Prospects for the Third Plan
9. The reduction of the 1965/66 annual development program, referredto above, indicates that public sector development expenditures this yearwill be below the 1964/65 level. The revised annual development programattempts to ensure that there will be no significant reduction in productiveschemes, particularly in agriculture, and that there will be no interruptionin schemes where international commitments have already been made or whereprojects have a bearing on the export effort. The Government proposes tomake a comprehensive review of the Third Plan in January 1966, and the Bar-,kis planning to send an economic mission i:n February to make a review ofeconomic conditions and the prospects for the Third Plan, by which time moreinformatio:n will be available and the Government's review of the Plan shouldhave been completed. On the evidence available now, the recent hostilitieshave given only a limited setback to the economy; however, the extent towhich the economy will recover its former buoyancy, following the measuresoutlined above,.will depend on many factors, including the revival of confi-dence in the private sector and the availability of foreign exchange.
Consortium
10. At the Seventh Meeting of the Pakistan Consortium, Pakistan requestec'.new aid commitments of $500 millio.n for the year 1965/66. To date, Canada,Germaniy, Italy and Japan have informed Palkistan of the financial assistancethey propose to make available for 1965/66. The amounts are as follows:Canada $25.5 million compared with $23.6 million in 1964/65, Germany $38.1million (unchanged), Italy $20 million compared with $10 million in theprevious fiscal year, and Japan $30 million (unchanged). The United Kingdom,France and the Netherlands are also making new aid available but have notmade any formal pledges.
South Asia Department
December 30, 1965
CONTENTS
BASIC STATISTICSMAPSUPMARY AND CONCLUSIONS i - viINTRODUCTION
Chapter Page
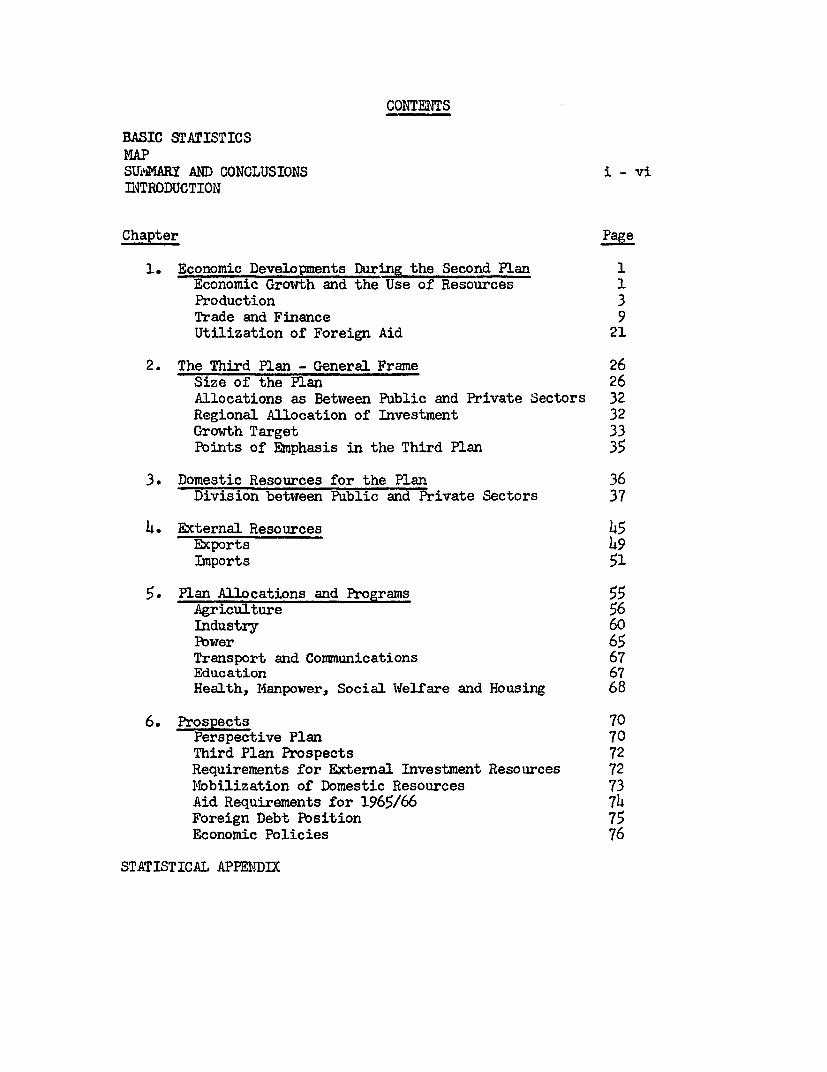
1. Economic Developments During the Second Plan 1Economic Growth and the Use of Resources 1Production 3Trade and Finance 9Utilization of Foreign Aid 21
2. The Third Plan - General Frame 26Size of the Plan 26Allocations as Between Public and Private Sectors 32Regional Allocation of Investment 32Growth Target 33Points of Emphasis in the Third Plan 35
3. Domestic Resources for the Plan 36Division between Public and Private Sectors 37
4. External Resources 45Exports 49Imports 51
5. Plan Allocations and Programs 55Agriculture 56Industry 60Pbwer 65Transport and Communications 67Education 67Health, Manpower, Social Welfare and Housing 68
6. Prospects 70Perspective Plan 70Third Plan Prospects 72Requirements for External Investment Resources 72M,1obilization of Domestic Resources 73Aid Requirements for 1965/66 74Foreign Debt Position 75Economic Policies 76
STATISTICAL APPE1DIK
ANNEXES
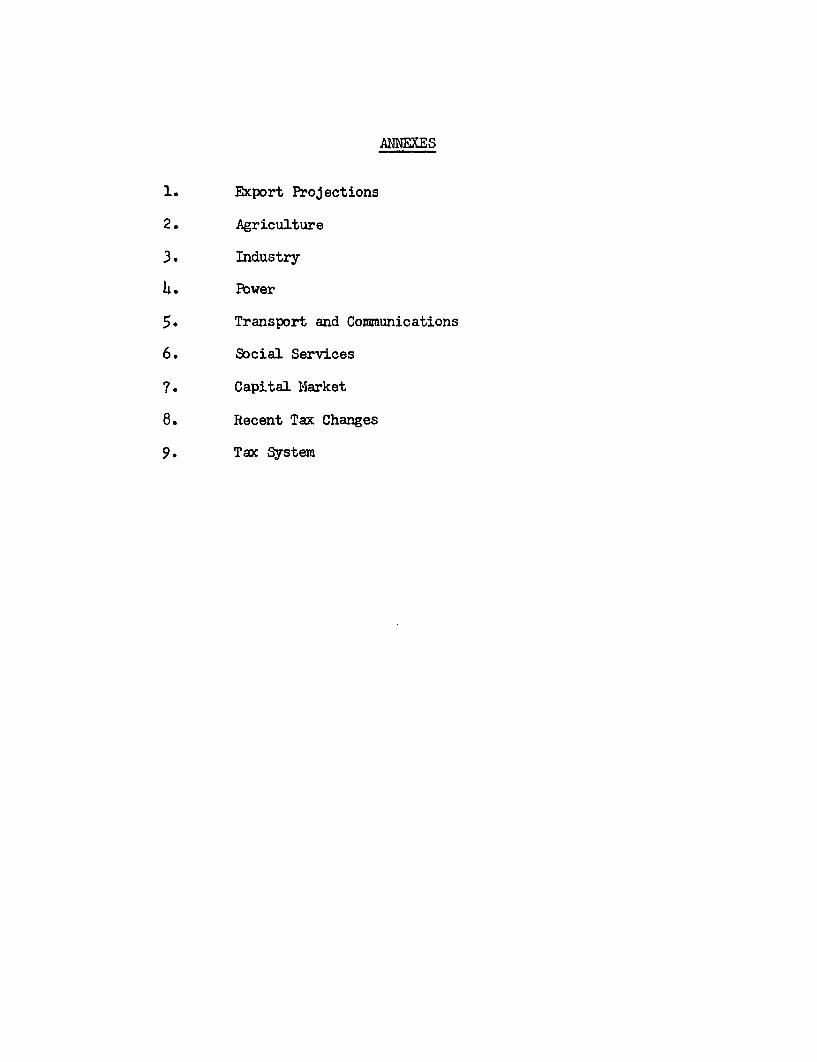
1. Export Projections
2. Agriculture
3. Industry
4. Pbwer
5. Transport and Communications
6. Social Services
7. Capital Market
8. Recent Tax Changes
9. Tax System
BASIC STATISTICS
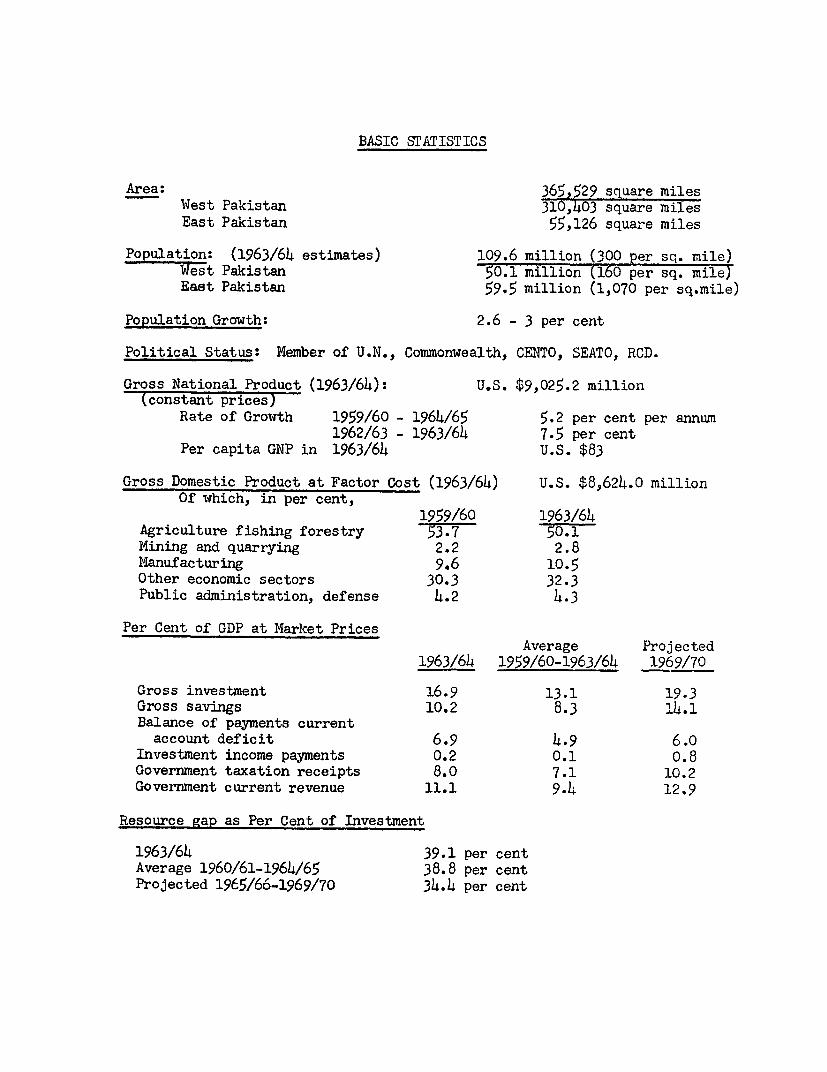
Area: 365,529 square milesWest Pakistan 310,403 square milesEast Pakistan 55,126 square miles
Population: (1963/64 estimates) 109.6 million (300 per sq. mile)West Pakistan 50.1 million (160 per sq. mile)East Pakistan 59.5 million (1,070 per sq.mile)
Population Growth: 2.6 - 3 per cent
Political Status: Member of U.N., Commonwealth, CENTO, SEATO, RCD.
Gross National Product (1963/64): U.S. $9,025.2 million(constant prices)
Rate of Growth 1959/60 - 1964/65 5.2 per cent per annum1962/63 - 1963/64 7.5 per cent
Per capita GNP in 1963/64 U.S. $83
Gross Domestic Product at Factor Cost (1963/64) u.s. $8,624.0 millionOf which, in per cent,
1959/60 1963/64Agriculture fishing forestry 53.7 50.1Mining and quarrying 2.2 2.8Manufacturing 9.6 10.5Other economic sectors 30.3 32.3Public administration, defense 4.2 4.3
Per Cent of GDP at Market PricesAverage Projected
1963/64 1959/60-1963/64 1969/70
Gross investment 16.9 13.1 19.3Gross savings 10.2 8.3 14.1Balance of payments current
account deficit 6.9 4.9 6.0Investment income payments 0.2 0.1 0.8Government taxation receipts 8.0 7.1 10.2Government current revenue 11.1 9.4 12.9
Resource gap as Per Cent of Investment
1963/64 39.1 per centAverage 1960/61-1964/65 38.8 per centProjected 1965/66-1969/70 34.4 per cent
-2-
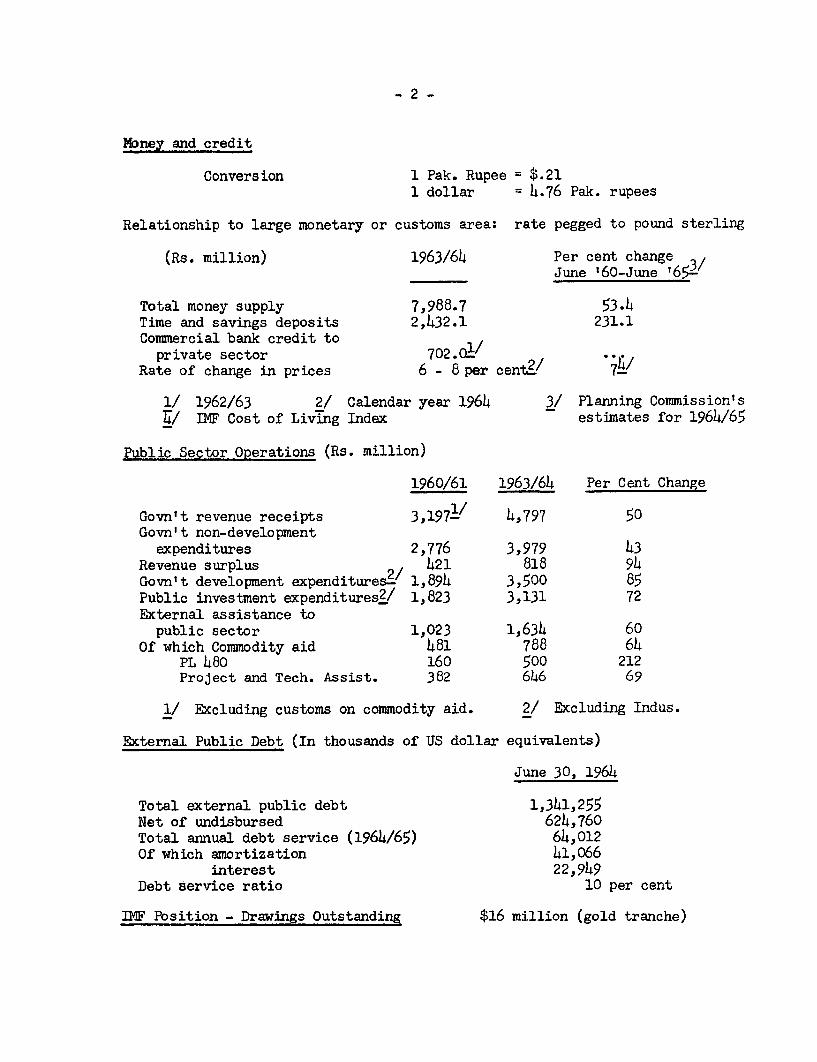
Money and credit
Conversion 1 Pak. Rupee = $.211 dollar = 4.76 Pak. rupees
Relationship to large monetary or customs area: rate pegged to pound sterling
(Rs. million) 1963/64 Per cent changeJune '60-June '65-
Total money supply 7,988.7 53.4Time and savings deposits 2,432.1 231.1Commercial bank credit to
private sector 702.0 1QRate of change in prices 6 - 8 per cent2/7
1/ 1962/63 2/ Calendar year 1964 3/ Planning Commission'sI7/ IMF Cost of Living Index estimates for 1964/65
Public Sector Operations (Rs. million)
1960/61 1963/64 Per Cent Change
Govn't revenue receipts 3 , 1 9 71/ 4,797 50Govn't non-development
expenditures 2,776 3,979 43Revenue surplus 2/ 421 818 94Govn't development expenditures_ 1,894 3,500 85Public investment expenditures2/ 1,823 3,131 72External assistance to
public sector 1,023 1,634 60Of which Commodity aid 481 788 64
PL 480 160 500 212Project and Tech. Assist. 382 646 69
1/ Excluding customs on commodity aid. 2/ Excluding Indus.
External Public Debt (In thousands of US dollar equivalents)
June 30, 1964
Total external public debt 1,341,255Net of undisbursed 624,760Total annual debt service (1964/65) 64,012Of which amortization 41,066
interest 22,949Debt Service ratio 10 per cent
IMF Position - Drawings Outstanding $16 million (gold tranche)
-3-
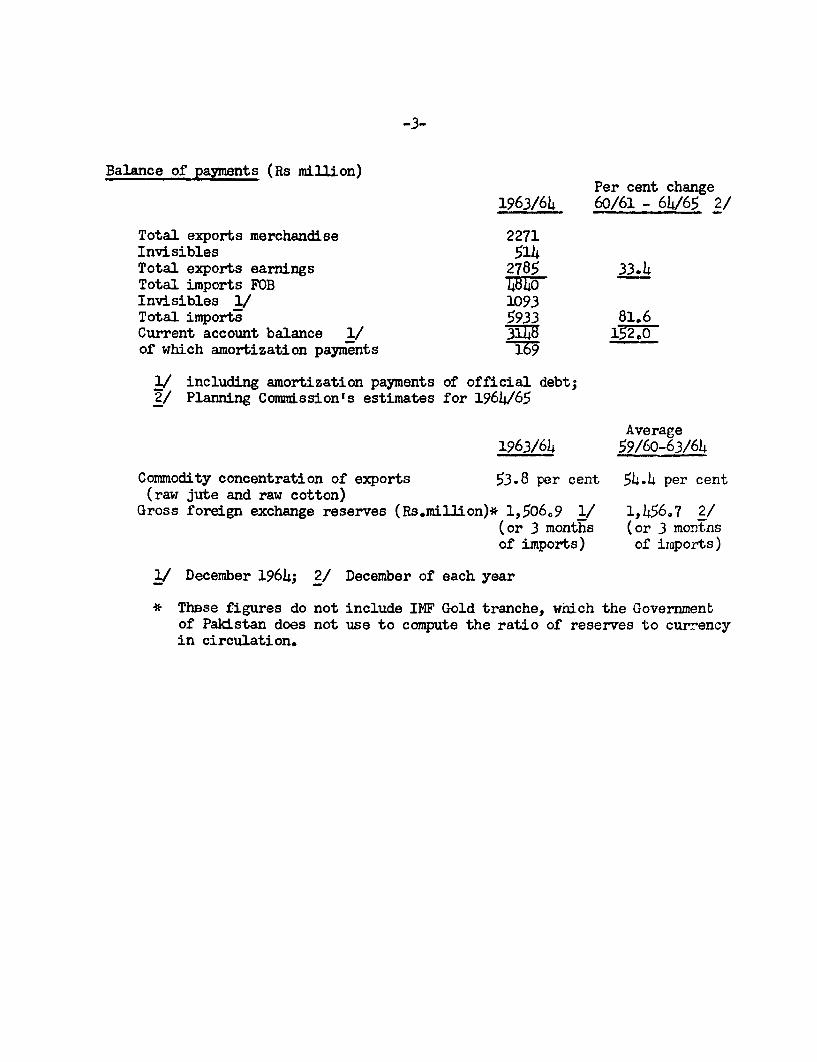
Balance of payments (Rs million)Per cent change
1963/64 60/61 - 64/65 2/
Total exports merchandise 2271Invisibles 514Total exports earnings 2785 33.4Total imports FOB V8W0Invisibles 1/ 1093Total imports 5933 81.6Current account balance 1/ 3148 152.0of which amortization payments -T;
1/ including amortization payments of official debt;2/ Planning Commission's estimates for 1964/65
Average1963/64 59/60-63/64
Commodity concentration of exports 53.8 per cent 54.4 per cent(raw jute and raw cotton)
Gross foreign exchange reserves (Rs.mill-ion)* 1,506.9 1/ 1,45607 2/(or 3 months (or 3 montnsof imports) of iaports)
1/ December 1964; 2/ December of each year
* These figures do not include IMF Gold tranche, which the Governmentof Pakistan does not use to compute the ratio of reserves to currencyin circulation.
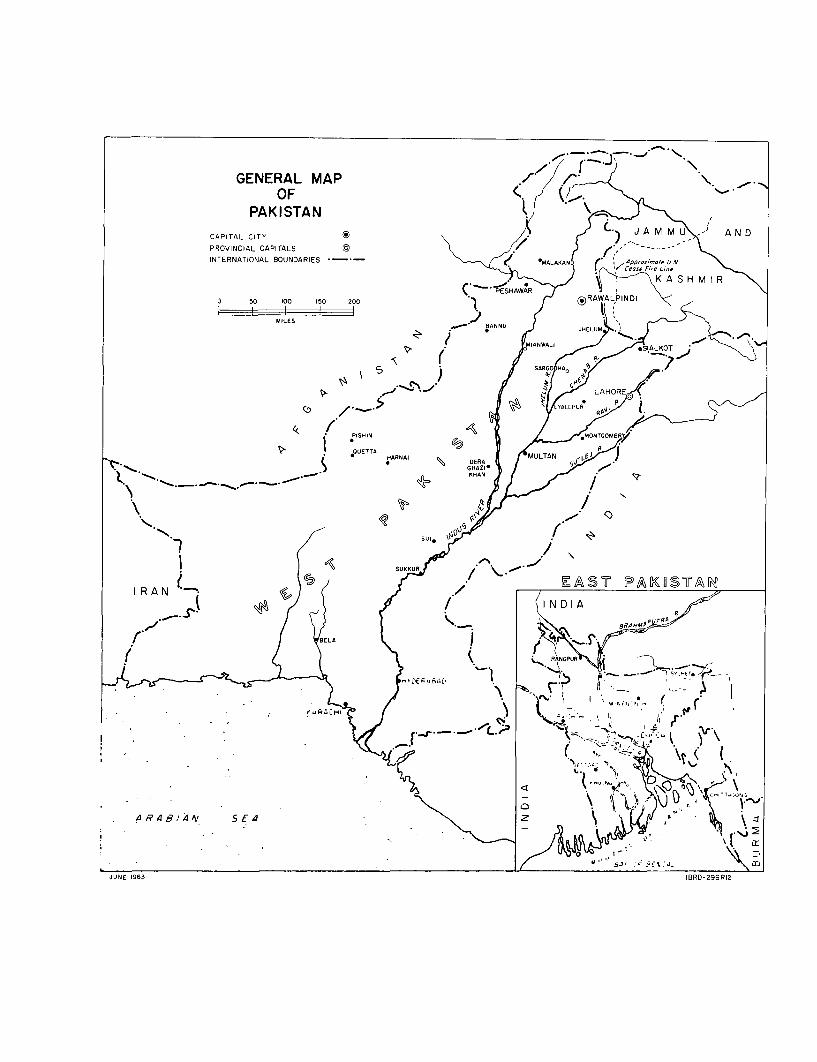
GENERAL MAPOF
PAKISTANCAPITAL CITY M U A N D
PROVINCIAL CAPITALS ©INTERNATIONAL BOUNDARIES 'ML- ( /
0 50 100 50 200 IAL
MILES
MINWALi!a K j
SARGO H .
:) / ' _ ' 5 0 t~~~~~~~~~~~~~~~tYA PUR
PISHIN
II >NEARNAI DERA. UTA )
IRAN~~~~~~~~~~~~~~~~~~~~~~~~~~~~~~~~~~~~~~~~~~~~~~~~~~~~~~~~~~~~~~~~~~~~~~~~~~~~~~~~~~~~~~~~~~~~~~~~~~~~~~~~~~~~~~~~~~~~~~~~~~~~~~~~~~~~~~~~~~~~~~~~~~~~~~~~~~~~~~~~~~~~~~~~~~~~~~~~~~~~~~~~~~~~~~~~~~~~~~~~~~~~~~~~~~~~~~,
?RS/4 5( Zu/
i \§ J < ,/ * C~AST PAKSTAH
I R A N 't X 2 l /!(
! () t 9 _ I ; RANGPUR<,,^ R_~~~~~~~~~~~I D A csu;
JJNE 1963 IBRD-2 2
A S
A4 R 4' 5 -t,
JUNE 1963 IBRD-296RI2
SUMMARY AND CONCLUSIONS
i. This report assesses the progress of the Second Five-Year Plan(1960/61-1964/65) and examines the general framework of the Third Plan(1965/66-1969/70).
The Second Plan
ii. The Second Plan has been a success. During the first four yearsof the Plan, a cumulative economic growth of 23 per cent was recorded asagainst an estimate for the five years of 24 per cent. The likely growthover the whole Plan is 28-29 per cent. Between 1959/60 and 1964/65 privateconsumption increased by less than 23 per cent but private investment grewby nearly 200 per cent. Pakistan was able to finance 62 per cent of herprogram from her own resources, 15 per cent more than had been originallycontemplated. The disbursement of foreign aid was 23 per cent short ofexpectations but this was more than compensated by the larger mobilizationof domestic rupee and foreign exchange resources. In real terms, totalnational resources are estimated to have increased by 37 per cent. Aid-financed imports contributed only about 20 per cent of this increase. Bythe end of the Plan, Pakistan was using 15.4 per cent of these resourcesfor investment compared with 9.5 per cent in 1959/60.
iii. The favorable relationship between gross investment and incre-mental output (capital/output ratio) was a contributing factor to thegrowth achieved in the Plan. This resulted partly from the comparativelyquick return from investments in the private industrial sector and frominvestment in quiclc pay-off inputs, notably water and fertilizer, in agri-culture.
iv. Production trends are difficult to measure in agriculturebecause of the weather variable, but production increased by 3.5 per centper annum in the first four years of the Second Plan. Of greater signifi-cance was the change from stagnation in the 1950's to growth in the 1960's.A major share of investment in agriculture was financed from the savingsof farmers' demands for fertilizer, machinery, pesticides and other mate-rials out-running the capacity of the government organizations to deliver.Industry remained the leading sector in the economy with a growth of over9 per cent annually, mainly in larger-scale establishments.
v. To a large extent, the Pakistan Government has moved fromdirect controls to reliance on fiscal and monetary measures to regulatethe economy. The taxation system has aimed at encouraging more savingsand investment and holding down consumption. This policy has accentu-ated the concentration of economic power, but it has allowed savings toincrease and it has produced a climate conducive to private enterprise.
- ii -
vi. The consolidated revenue surplus of the Central and ProvincialGovernm.ents increased by 2-1/3 times corapared with the first year of theSecond Plan and there was available 16 per cent more revenue than ori-ginally estimated for financing development. However, the ProvincialGovernments have had to rely principally on the Center for their develop-ment resources since their own receipts have not been sufficient to allowthem to much more than cover their mounting recurrent expenditures.
vii. The balance of payments position has been encouraging, parti-cularly on the export side. Little growth was expected in Palcistaniexports at the start of the Plan, but actually, it has been averaging7 per cent. The stagnation of the First Plan period has thus changedto a satisfactory rate of growth and the five year target for exportswill have been exceeded by 84 per cent. Exports are now growing fasterthan GNP. The major cause of the improvement was an upsurge in produc-tion of crops such as raw cotton and superior rice and in fish. Despiterapid industrial growth the exports of manufactured products declined inimportance from 25 per cent in the first year of the Plan to 22 per centin 1963/64. At the same time, imports have been lower than expected.This has been achieved by increased import substitution for industrialproducts and by the relatively slow disbursement of project-type aid forthe public sector. The balance of payments deficit over the five yearswill be 25 per cent lower than expected.
viii. The Pakistan Government has an import policy based on liberal-izing the inflow of goods for the development of the economy while re-taining controls on other imports or making them more expensive throughthe exchange rate mechanism. There has recently been a reduction incontrols, but the Government has had to be cautious because of possibleeffects on foreign exchange reserves. The removal last July of 51 items,mainly raw materials and components from import control, has improved theutilization of the existing industrial capacity. While realizing thatthe import price of essential raw materials should not be too high, theMission considers that a price level should be sought for imports gener-ally which will not discriminate against domestic production. Thereappears to be a preference for imported, over local material and equip-ment because of the exchange rate. The Government in the 1964/65 Budget,with this in mind, made a beginning with increased import and customsduties and sales taxes. More needs to be done in this direction.
ix. It is too early to assess the full effects of freeing importsfrom quantitative controls in July 1964, but it is believed that theresults will justify the financing provided. Raw materials are not nowconsidered in short supply but modernizing and balancing equipment is alimiting factor in expansion.
- iii -
x. The striking features in the utilization of aid have beenthat Pakistan resources provided 62 per cent of Plan outlays comparedwith the anticipated 47 per cent, and the shortfall by 23 per cent inforeign resources used. The Plan estimates had projec-ted a gross in-flow of capital of $2,770 million (excluding PL 480 but including theIndus project). It is now estimated that foreign aid disbursementswill be about $2,000 million. Considerable delays in the commitmentof aid pledges have been the main reason for this relatively slowutilization of aid. There has been improvement in the later years ofthe Plan. It is likely that the Plan will finish with a pipeline ofunused pledges and undisbursed commitments equal to two-thirds ofdisbursements for the Second Plan and one-third of the foreign aidrequirements estimated for the Third Plan. The Mission considersthat there may be some reduction during the Third Plan in the fund of$1,086 million of unused commitments and pledges.
xi. Administrative performance was considered in the 1964 report.A number of recommendations were made aimed at improving the system.Some improvement has been seen. To assess one measure of administra-tive performance, the carry-over of unutilized pledges at the end ofthe Second Plan will be much lower than at any time during the Plan.It is recommended that the Planning Commission keep more closely intouch with the implementation of projects and that plans be made forthe phasing of project preparation, so that there will be an adequateflow, thus preventing the bunching which has been noticeable in theSecond Plan. Some of the committees which have been established toadvise on tariff structure and other subjects and which have not yetreported should expedite their work. Absence of such studies makesthe examination of the proposals of the Third Plan difficult.
xii. It was envisaged in the Second Plan that money supply wvouldincrease by Rs. 1,500 million over the Plan period. The Plan did notprovide for any drawdown of foreign exchange resources or increases inthe size of government net borrowings from the banking system. Creditexpansion in the private sector will be only 20 per cent above expec-tations but public deficit financing has been about equal to thecredit expansion to the private sector. The increase in money supplyhas, therefore, doubled. After a remarkable stability in the firstthree years, including an accumulation of reserves in the third year,the increase in money supply that occurred in the fourth and fifthyears is now exercising some upward pressure on the price level. TheState Bank has now taken measures to restrain the rate of credit ex-pansion. However, the Third Plan will start with a backlog of excessliquidity in the economy with potentially inflationary consequences.
- iv -
The Third Plan
xiii. The principal objectives of the Third Plan are: (1) toincrease the rate of economic growith to 6.5 per cent a year comparedwith 5.2 per cent for the Second Plan; (2) to accomplish this primarilyby increasing the mobilization of domestic resources to cover 68 percent of Plan outlays compared to 62 per cent in the Second Plan; (3)bring about a more balanced growth in the economy by increasing therate of growth of agricultural output byl.5 per cent to 5 per cent ayear, and by directing a large share of industrial investments tocapital goods industries; (4) to increase exports in relation to GNPand imports; and (5) to narrow the discrepancy between per capitaincome in the two Provinces. The direction of a larger share of in-vestments to capitalgoods industries will require a sharp increase inindustrial investment to be channeled through the public sector, parti-cularly in East Pakistan.
xiv. The Third Plan will be about double the financial size of theSecond, and in real terms, probably some 85 per cent larger. Thecountry's total development effort will be about Rs. 57 billion (around$12 billion), includ4n}g the Indus Basin Works and the Tarbela projectif it is undertaken.±/ The Bank has completed its Study in which theTarbela project was found to be technically feasible and economicallyjustifiable. In making comparisons between the Plans, it must be re-membered that in the Second Plan there was rapidly increasing annualinvestment amounting to 156 per cent between 1959/60 and 1964/65. Theincrease as between the last year of the Second Plan and that proposedfor 1969/70 is 65 per cent. The Third Plan assumes a steadily increas-ing rate of investment at about 10.5 per cent per annum.
xv. The allocation of resources (including the Indus Basin Works)between the public and private sectors gives a higher share to thepublic (60 per cent), which is about the same proportion as in theSecond Plan. Excluding the Indus Basin Works, the public sector shareis approximately 58 per cent or a little higher than in the Second Plan.
xvi. It is expected that there will be a higher proportion of bothpublic and private investment in East Pakistan in the Third Five-YearPlan period. 52 per cent of Plan funds are earmarked for that Province.The investment in the public sector industries in East Pakistan isplanned to increase three-fold compared with the Second Plan.
xvii. The growth strategy of the Third Plan is to maintain the SecondPlan growth in non-agricultural sectors of around 7 per cent a year andimprove the growth rate in agriculture from 3.5 to 5.0 per cent, bygreater emphasis on water investment and better provision of farm supplies.The Mission believes that the growth targets of the Third Plan are feasi-ble, providing agriculture receives the urgent attention it requires.
1/ Without Tarbela, Plan and Indus outlays will be about Rs. 55.3 billion(about $11,613 million).
xviii. The export target is an annual increase of about 9.5 per centper annum. The Mission considers this rate to be too high and thinks itwill be around 8 per cent. One iriportar±t factor in achieving the growthobjective of the Third Plan is the timing and scale of returns on invest-ments. The Government envisages some increase in the capital/output ratioduring the Third Plan. This will depend on the project composition ofthe Plan wLhich has not yet been finally determined.
xix. The growJth of population is quite high, estimated at between2.6 and 3.0 per cent per annum, and this problem is being tackled byincreased emphasis on family planning, but the Wqission is not optimisticabout short-term results and emphasizes that the program must be organizedand implemented in a vigorous manner.
xx. Although the domestic resources of the Third Plan are forecastas much larger than those in the Second, the strategy demands an increasein the marginal savings rate only from 21 per cent to 22 per cent. How-ever, the average rate of savings would increase much more, i.e., fro,around 10 to over 13 per cent. The high level of marginal savings in theSecond Plan came from the encouragement given to large-scale industriesby the removal of controls and the Government's ability to mobilizepublic savings through increases in taxes. These two lines of policywill be continued during the Third Plan. However, the contribution ofagriculture to the Third Plan growth would increase from 18 to 20 percent while that of industry would decline from 40 to 33 per cent. Thisemphasizes the necessity of increasing savings and tax collections inthe agricultural sector.
xxi. The industrial strategy in the Plan is to stress more capitalgoods in relation to consumer goods production. The Mission has consider-ab'Le reservations regarding t:lis policy, because some o-f the projectscontemplated may not accord with Pakistan's comparative economic advantageand also because the capital intensive character of such industries makeslittle contribution to the red-ct-on in unemployment. There is also apolitically motivated urge to establish similar industries in both Eastand West Pacistan. The proposal to set up capital goods industries meansthat under-priced capital will be used more extensively, while labor,whose real cost is often lower than its market price, is under-utilized.
xxii. On the assumption of a 37 per cent growth, the Government esti-mates that the revenues of the Central and Provincial Governments willincrease by two-thirds in the next five years. The revenue surplus isestimated at nearly three times that of the Second Plan. The return fromadditional taxation has been set by the Planning Commission at Rs. 3billion, pending a decision on taxation and tariff rates and policies forthe Plan period. To obtain Rs. 1 billion of additional domestic resourcesfor the Government financed program, it is planned to transfer privateresources to the public sector by associating more private investmentwith public corporations. The remaining Rs. 1.5 billion of the Rs. 16.5billion required for the public sector program would be obtained throughdeficit financing.
- vi -
xxiii. The Government is requesting $2,700 million of consortium aidand requires about $4,550 million of gross capital inflow of all types($4,300 million excluding amortization) for the Plan and the Indusproject. As compared with the absorption of foreign assistance duringthe last year of the Second Plan, the average annual foreign aid require-ment for the Third Plan may be about one-third greater. From the stand-point of new commitments required, the increase will be less because ofthe build-up of the aid pipeline in the mid years of the Second Plan.
xxiv. The principal conclusions of the Missibn on the mobilization ofdomestic and external resources for the Third Plan are:
(1) The overall Plan target of mobilizing Rs. 35,500 million ($7,455million of domestic resources for development expenditures maybe achieved if the economy grows as forecast and if financialstability is maintained.
(2) At the same time, it appears likely that there will be a short-fall of Rs. 2 billion or so from the Rs. 16.5 billion that theGovernment plans to mobilize for public sector developmentexpenditures.
(3) If our less optimistic export forecasts are correct, there willalso be $200 million or so less domestically generated foreignexchange for development imports.
(4) If some reduction is required in the public sector program, itmay not affect total investment in the economy as a whole orthe distribution of investment as between the commodity produc-ing and other sectors.
xxv. It may be difficult to achieve the full public sector programwith the inflow of foreign assistance that is being requested withoutimpinging to some extent on resources for the private sector program.Therefore, the Government should adopt a flexible policy towards annualdevelopment programs. If the Government considers it essential to meetthe full public sector expenditure target in the Plan, it should sethigher targets for revenues, net capital receipts or for other non-expan-sionary domestic financing instead of seeking to mobilize funds throughdeficit financing. The amount of foreign assistance requested by Pakistanappears to be necessary to carry out a development program of about themagnitude envisaged. The aid requested from the consortium for 1965/66conforms to the needs of the economy at the start of the Third Plan. Itis not much in excess of the level of disbursements expected in 1964/65.A substantial portion of 1965/66 aid should be for commodities or programsthat will assist in continuing the trade liberalization program undertakenlast year.
xxvi. In respect of Pakistan's future foreign borrowings, the credit-worthiness of the country has improved during the Second Plan despite theincrease in her external indebtedness. Therefore, while requiring thebulk of assistance on easy terms, she appears capable of borrowing about20 per cent of her Third Plan funds on conventional terms. About half ofthese new borrowings would be offset by amortization on existing hard debt.
INTRODUJCTION7
The purposes of this report are to review the economicprogress made by Pakistan during the Second Five-Year Plan (July 1,1960-June 30, 1965) and to appraise the Third Plan (July 1, 1965-June 30, 1970) from the standpoint of its overall magnitude andobjectives. Since, at the time of the Mission's visit in Februaryof this year, the Government had not completed a comprehensive ThirdPlan document, including descriptions of the new projects it expectsto initiate during the Plan period, this report will not contain adetailed evaluation of the sector-by-sector programs. Hlowever, itwill comment. on the more important lines of development envisagedand the sectoral allocations of financial resources. The reportalso comments on the current economic situation in Pakistan. ThePakistan submission to the Consortium will deal in more detail withthese subjects, including the need for foreign assistance in 1965/66.
The last report on Pakistan's economic development program(AS-106a) was circulated to the Executive Directors and members ofthe Pakistan Consortium on April 28, 1964. It dealt with the firstfour years of the Second Plan and the prospects for 1964/65. TheBank's report (AS-96a) of February 1963 considered in more detailthe general economic structure of Pakistan. That subject is dis-cussed in this report only incidentally to our consideration of theprogress achieved during the Second Plan.
CHAPTER 1
ECOTNOMIC DEVELOnPENTS DURING THE SECOMD PLAN
Economic Growth and Use of Resources.
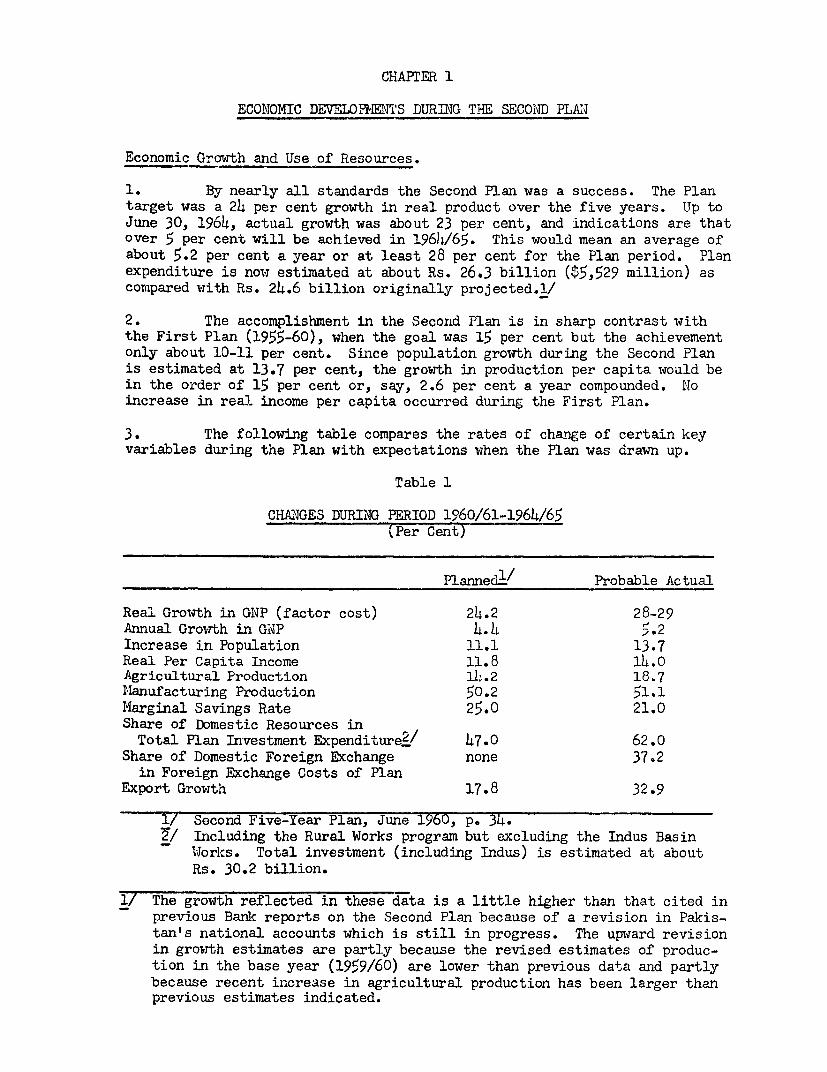
1. By nearly all standards the Second Plan was a success. The Plantarget was a 24 per cent growth in real product over the five years. Up toJune 30, 1964, actual growth was about 23 per cent, and indications are thatover 5 per cent will be achieved in 1964/65. This would mean an average ofabout 5.2 per cent a year or at least 28 per cent for the Plan period. Planexpenditure is now estimated at about Rs. 26.3 billion ($5,529 million) ascormpared with Rs. 24.6 billion originally projected.l/
2. The accomplishment in the Secorld Plan is in sharp contrast withthe First Plan (1955-60), when the goal was 15 per cent but the achievementonly about 10-11 per cent. Since population growth during the Second Planis estimated at 13.7 per cent, the growth in production per capita would bein the order of 15 per cent or, say, 2.6 per cent a year compounded. Noincrease in real income per capita occurred during the First Plan.
3. The following table compares the rates of change of certain keyvariables during the Plan with expectations when the Plan was drawn up.
Table 1
CHAINGES DURING PERIOD l960/61-1964/65(Per Cent)
Plannedi/ Probable Actual
Real Growth in GNP (factor cost) 24.2 28-29Annual Growth in GNP 4.4 h.2Increase in Population 11.1 13.7Real Per Capita Income 11.8 14.0Agricultural Production 1)4.2 18.7Manufacturing Production 50.2 >1.1IMarginal Savings Rate 25.0 21.0Share of Domestic Resources in
Total Plan Investment Expenditure_/ 47.0 62.0Share of Domestic Foreign Exchange none 37.2
in Foreign Exchange Costs of PlanExport Growth 17.8 32.9
1/ Second Five-Year Plan, June 1960, p. 34.2/ Including the Rural Works program but excluding the Indus Basin
Works. Total investment (including Indus) is estimated at aboutRs. 30.2 billion.
1/ The growth reflected in these data is a little higher than that cited inprevious Bank reports on the Second Plan because of a revision in Pakis-tan's national accounts which is still in progress. The upward revisionin growth estimates are partly because the revised estimates of produc-tion in the base year (1959/60) are lower than previous data and partlybecause recent increase in agricultural production has been larger thanprevious estimates indicated.
-2-
4. The only significant cause for concern is the unexpectedly highrate of population growth which, as during the First Plan, considerablyexceeded expectations. Although the marginal savings rate fell considerablyshort of the target, the latter was unrealistic and, thanks to the higherthan expected growth rate, total domestic savings will substantially exceedthe Plan target.
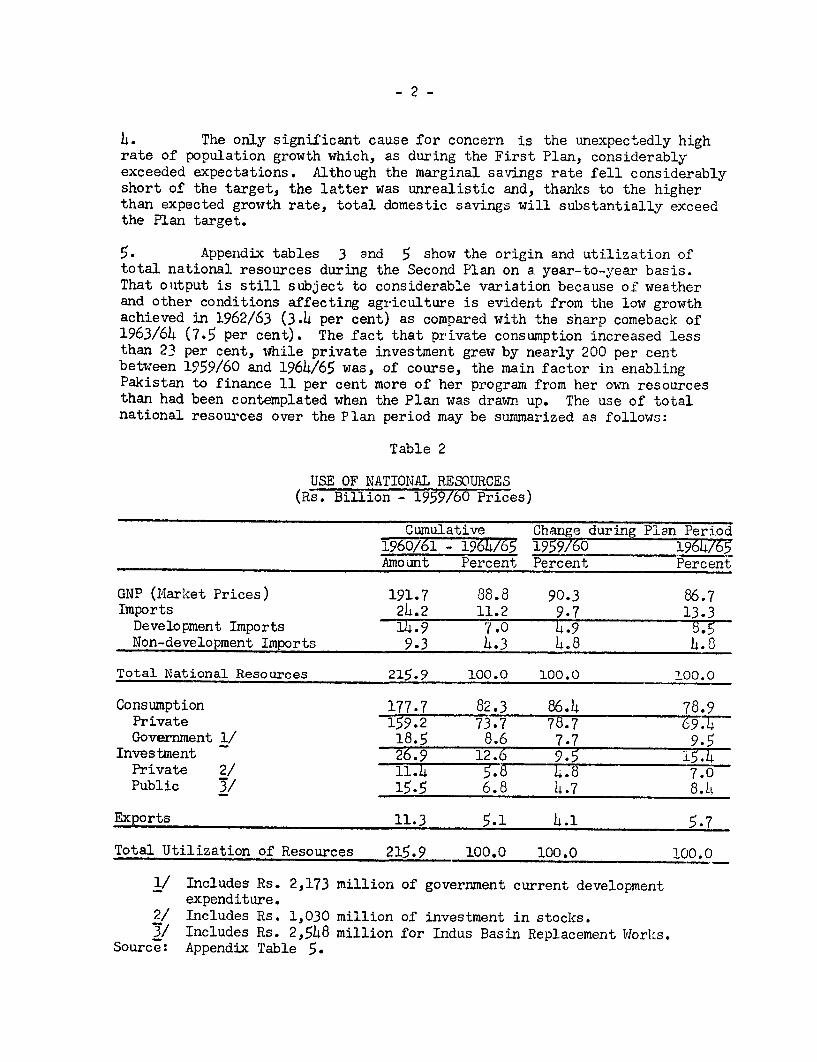
5. Appendix tables 3 and 5 show the origin and utilization oftotal national resources during the Second Plan on a year-to-year basis.That ouitput is still subject to considerable variation because of weatherand other conditions affecting agriculture is evident from the low growthachieved in 1962/63 (3.4 per cent) as compared with the sharp comeback of1963/64 (7.5 per cent). The fact that private consumption increased lessthan 23 per cent, wihile private investment grew by nearly 200 per centbetwJeen 1959/60 and 1964/65 was, of course, the main factor in enablingPakistan to finance 11 per cent more of her program from her own resourcesthan had been contemplated when the Plan was drawn up. The use of totalnational resources over the Plan period may be summarized as follows:
Table 2
USE OF NATIONAL RESOURCES(Rs. Billion - 1959/60 Prices)
Cumulative Change during Plan Period1960/61 - 1964/65 1959/60 1964765Amount Percent Percent Percent
GNP (Miarket Prices) 191.7 88.8 90.3 86.7Imports 244.2 11.2 9.7 13.3
Development Imports 14.9 7.0 4.9 8.5Non-development Imports 9.3 14.3 4.8 14.8
Total National Resources 215.9 100.0 100.0 100.0
Consumption 177.7 82.3 86.4 78.9Private 159.2 73.7 75.7 69.4Government 1/ 18.5 8.6 7.7 9.5
Investment 26.9 12.6 9.5 15.4Private 2/ 11.4 5.8 4.8 7.0Public 3/ 15.5 6.8 4.7 8.4L
Exports 11.3 5.1 4.1 5.7
Total Utilization of Resources 215.9 100.0 100.0 100.0
1/ Includes Rs. 2,173 million of government current developmentexpenditure.
2/ Includes Rs. 1,030 million of investment in stocks.3/ Includes Rs. 2,548 million for Indus Basin Replacement Works.
Source: Appendix Table 5.
6. In zeal terms the availability of total national resourcesfor the Pakistan economy increased about 37 per cent over the SecondPlan. Aid-financed imports contributed about 7.5 per cent of this in-crease or roughly one-fifth.
7. While total consumption rose about 27 per cent, it declined appre-ciably as a proportion of total resources. Per capita consumption roseby about 13 per cent, or less than half the increase in aggregate con-surnption. By the end of the Plan, Pakistan was using 15.4 per cent ofher resources for investment (17.8 per cent of GNP) as compared with 9.5per cent (10.5 per cent of GNP) in 1959/60. A fifth of the absolute in-crease in investment was due to the Indus Works, and the remainder tothe Plan.
8. Even at the end of the Plan, Pakistan's performance measuredby the relation of gross savings and govern-meint revenues to GNP wasquite modest as was the percentage of total resources used for invest-ment. However, the increases are encouraging and augur well for theThird Plan. In 1964/65, probably about 10.5 per cent of Gross DomesticProduct (market prices) will be saved and about 11 per cent will accrueto the Government in the form of taxes and other revenues. Comparablefigures for 1959/60 were about 6.3 per cent and 8 per cent.
9. A contributing factor to the growth achieved during the SecondPlan was the favorable relationship between gross investment and incre-mental output (capital/output ratio). This ratio seems to have averagedabout 2.4 over the Second Plan period (Appendix table 11 ). Consideringthe large amount of infrastructural investment required to cope with thegreat distances and difficult terrain of the country, and particularlyits division into two regions separated by over 1,200 air- and 3,000 sea-miles, such a favorable result is rather surprising, particularly inview of the inclusion of Indus with a limited, and as yet, unrealizeddevelopment potential. The results are attributable largely to (1) thecomparatively quick return fropi investment in the private industrialsector; (2) agricultural inputs, notably water and fertilizer, in theprivate agricultural sector; and (3) the fuller utilization of excesscapacity partly because of import liberalization.
10. At the inception of the Second Plan, the public sector wasexpected to use about 64 per cent (as compared with the 62 per cent thatnow seems likely) of the total resources available, so that there hasbeen some relative shortfall in its performance, as compared with expec-tations, whereas the private sector has substantially exceeded itsinvestment target.
Production.
11. Agriculture. Indications are that during the first four years of theSecond Plan, agricultural production increased about 3.5 per cent per year.l/Production of major crops which represent about 60 per cent of the agri-cultural GIWP increased by 4.6 per cent a year. Rice, cotton and sugar cane
I/ Based on estimates of G1NP at factor costs (1959/60 prices).
- 4 -
increased over base period (1959/60) production by 39, 42 and 38 per centrespectively. Jute, tea and tobacco exhibited no significant trend. Esti-mates of GNP growth in agriculture and production of principal crops arein Appendix tables 3 and 8.
12. Preliminary estimates for 1964/65 indicate a slight drop in riceand cotton production from the record 1963/64 levels, but tea, wheat andsugar cane are expected to increase. Jute production declined for thethird successive year. Prospects are that total agricultural output in1964/65 will probably not exceed the record 1963/64 level. Assuming that1964/65 output equals that of 1963/64, the annual rate of growth duringthe Second Plan would be 3.1 per cent per year in terms of GNP,and SecondPlan targets for rice, cotton, sagar cane and total foodgrains would havebeen exceeded.
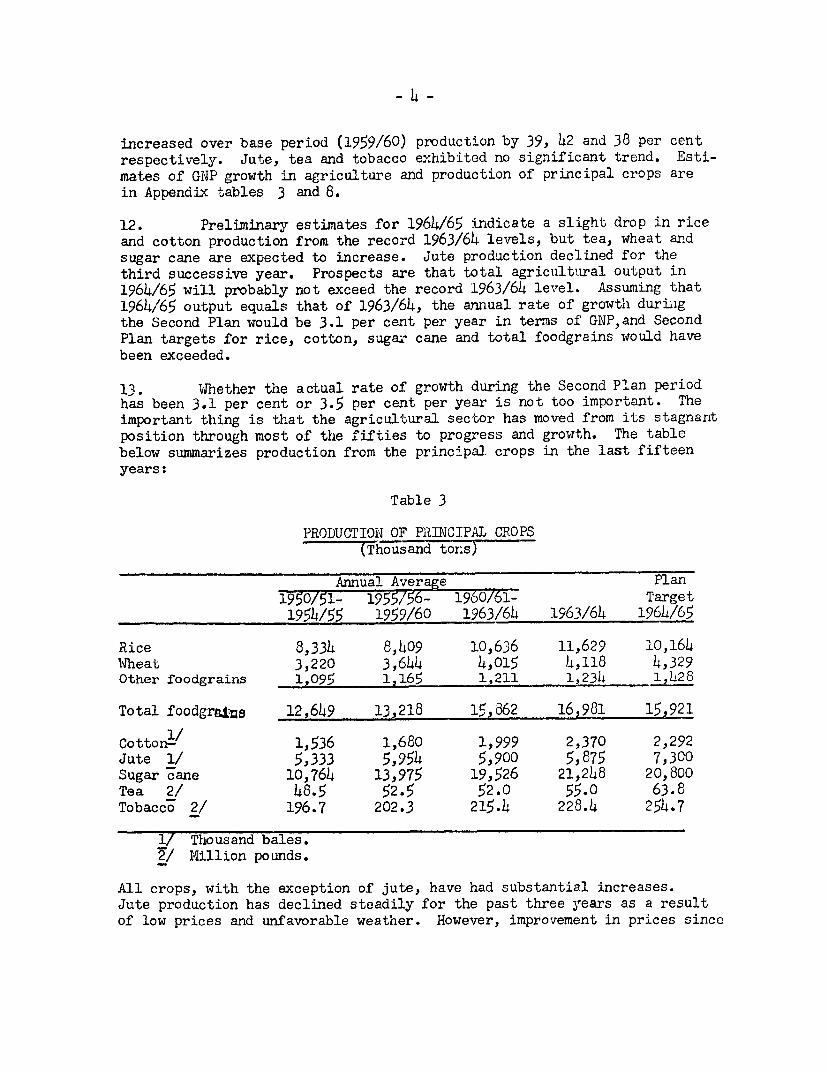
13. Whether the actual rate of growth during the Second Plan periodhas been 3.1 per cent or 3.5 per cent per year is not too important. Theimportant thing is that the agricultural sector has moved from its stagnantposition through most of thie fifties to progress and growth. The tablebelow summarizes production from the principal crops in the last fifteenyears:
Table 3
PRODUCTION OF PRINCIPAL CROPS(Thousand tor;s)
Annual Average Plan1950/51- 1955/56- 19$0/61- Target1954/55 1959/60 1963/64 1963/64 1964/65
Rice 8,334 8,409 10,636 11,629 10,164lWheat 3,220 3,644 4,015 4,118 4,329Other foodgrains 1,095 1,165 1,211 1 ,234 1,428
Total foodgra&ts 12,649 13,218 15,862 16,981 15,921
Cottonl/ 1,536 1,680 1,999 2,370 2,292Jute 1/ 5,333 5,954 5,900 5,875 7,300Sugar cane 10,764 13,975 19,526 21,248 20,800Tea 2/ 48.5 52.5 52.0 55.0 63.8Tobacco 2/ 196.7 202.3 215.4 228.4 254.7
1/ Thousand bales.2/ M4illion pounds.
All crops, with the exception of jute, have had substantial increases.Jute production has declined steadily for the past three years as a resultof low prices and unfavorable weather. However, improvement in prices since
- 5 -
November 1964 can be expected to result in a larger crop in 1°65/66. Teaproduction should also increase over the next several years because of newlplantings during the Second Plan period.
14. The major factors behind this increase in agricultural output havebeen the development of additional water resources in West Pakistan andimproved flood control and drainage in East Pakistan. Increases in otherinputs such as fertilizer have also contributed.
15. The Second Plan provided for public development expenditures ofRs. 2,520 million for agriculture and Rs. 2,580 million additional forwater dev-elopment. It is estimated that about 83 per cent of the alloca-tion for agriculture and 100 per cent of the allocation for water will havebeen spent by June 30, 1965. In addition, the Plan estimated Rs. 880 millionfor private investment in agriculture. Although data on private investmentsand savings are fragmentary, a survey of private investments in 1962/63 indi-cated that private investments in the agricultural sector, excluding housing,orchards and livestock, amounted to about Rs. 800 million in the one yearalone, of which about Rs. 90 million were for private tubewells and farmmachinery. On this basis, private investment during the Second Plan wouldamount to roughly Rs. 4 billion, more than four times the Plan allocation.The Agricultural Development Bank of Pakistan, cooperatives and directgovernment loans to cultivators provided roughly Rs. 1,200 million of credit,about half of which was on a medium- and lont-ttmr bl-sis. This would indi-cate that a major share of the private investment in agriculture was financedout of the savings of the farmers and landowners.
16. The importance of the private investment effort can be illustratedby the water developments in West Pakistan. Out of a total potential avail-ability of 114 million acre feet in the Indus Basin, only 52 million acrefeet had been developed at the beginning of the Second Plan. During theSecond Plan period private tubewells developed an additional 4.7 million acrefeet while public tubewells developed 2.5 million acre feet, and public sur-face water development provided 3 million acre feet. Thus water availabilityjincreased nearly 20 per cent in only 5 years.
17. In East Pakistan, public investment in the Coastal EmbankmentsProject involving construction and strengthening of 1,600 miles of tidalembankments and various other flood protection and drainage works made asignificant contribution to increased output. Progress was made towardcompleting the Kushtia Unit of the Ganges Kobadak Project, the Teesta sub-project and the Ground Water and Pump Irrigation Project, but the effectiveuse of the water for irrigation has been slow in developing. The GangesKobadak Project has shown relatively little increase in area irrigated in1964/65, although some improvements in practices were reported. Difficul-ties were also being encountered in organizing farmers to develop irrigationunder the Ground Water and Pump Irrigation Project.
- 6 -
18. The Planning Commission estimates that, for the country as a whole,about 2.1 million acres of new land have been brought under irrigation andthat 7.2 million acres have been provided with improved irrigation drainageor flood protection during the Second Plan. The total land affected bythese improvements was about 17 per cent of the cropped area in 1963/64.With increased water availability, more intensive cropping becomes possibleand the supply of complementary inputs becomes essential. Fertilizer usemoved from 31,000 tons (NPK equivalents) in 1959/60 to 111,000 tons in1963/64 and is projected to be 160,000 tons in 1964/65. Plant protectionactivities of the Government have been trebled but still only 12 per cent ofthe acreage is being treated. Progress has also been made in increasing theuse of improved seed, but the Government is finding it difficult to meet thedemand. Subsidized programs for fertilizer, plant protection, seed multi-plication and distribution and mechanization cost about Rs. 900 million duringthe Second Plan, or almost half of the Government's development expendituresfor agriculture (excluding water development).
19. However, until 1963/64 the supply of all agricultural inputs wassubject to government restrictions either because of government monopoliesor severe import restrictions. The basic philosophy was that governmentmust teach the peasant the value of these inputs and that government controlwas necessary to prevent improper use by cultivators and malpractices bymiddlemen. The sharp increase in fertilizer sales which occurred in 1963/64as a result of the liberalization of fertilizer distribution shows quiteclearly that fanners are prepared to expand fertilizer usage and that pri-vate enterprise is better equipped to handle distribution thar; governmentagencies. There is growing evidence that farmers' demand for farm machinery,pesticides and seed has also outrun the capacity of goverrnent agencies.
20. The justification for continued government control and large-scalesubsidization of farm inputs has been usually couched in terms of the needsof the small, low income farmers who cannot afford to pay the full price forthese services, and the need for equitable distribution of scarce input items.In fact, how^Jever, the restricted availability of supplies and services andfinancing have probably been more important hindrances to development thanprice. Moreover, larger, more influential farmers have received the bulk ofthe subsidized services often at the cost of repeated trips to governmentoffices and crop losses resulting from unnecessary delays.
21. Various reorganizations of agricultural agencies carried out earlyin the Second Plan led to some disruption of existing programs. These includedthe abolition of the Village AID program and the establishment of the Agri-cultural Development Corporations (A.D.C.) in each wing; the change from theLand Utilization Committeeand the Soil Reclamation Board to the Land and WaterDevelopment Board; the reorganization of the Agriculture Department in WestPakistan; the establishment of the West Pakistan wholesale supply cooperative;and the establishment of the Agricultural Development Bank of Pakistan. Mostof these changes were necessary and have contributed to the recent growth ofagriculture, but the uncertainties before and after each major reorganizationcaused serious delays in the implementation of the Plan. This was particularlytrue of the Agricultural Development Corporations whose contributions have beenmuch short of expectations.
22. Industry. During the First Plan (1955-1960) investment in industry wasonly ab6ii-j8 per cent of the ivlan target. Foreign exchange difficultieswere mainly responsible for the shortfall. However, production in large andmedium-scale industry rose by more than 80 per cent between 1954 and 1959,whereas the Plan target was for an increase of 65 per cent.
23. The Second Plan target for investment in industry was Rs. 6,107million, over three times the actual First Plan investment. The privatesector was expected to invest Rs. 3,719 million and the public sectorRs. 1,460 million. In addition, the Plan made provision for Rs. 928 millionof working capital. In fact, the private sector has invested about Rs. 4,440million and the public sector Rs. 1,352 million. This total is about 95 percent of the five-year target (Appendix table 10 ). The dynamic privateindustrial sector exceeded its target by over 20 per cent.
24. The Second Plan aimed at increases in production of 65 per cent inlkrge-and medium-scale industry and of 25 per cent in small-scale and cottageindustry. In 1964/65, it is expected that the contribution of the manufac-turing sector to gross national product will be about 11 per cent compared to9.5 per cent in 1959/60. Industry contributed about 20 per cent of thegrowth in GNP during the Second Plan period.
25. Large-scale manufacturing output rose by about 65 per cent in thefirst four years of the Plan and the total increase is estimated at 87 percent, i.e. over 13 per cent per annum. The largest increases up to 1963/64were for chemical fertilizers, basic metals, newsprint, vegetable oil andpetroleum processing. Relatively small advances were made in cotton andwoolen cloth, soda ash and such items as soap and beverages. (See Appendixtable 9 and Annex 3 for analysis of output by specific industries). It isextremely difficult to assess the growth in small-scale manufacturing (plantsof less than fifty employees).I/ The rate of growth during the Second Planfor small-scale industry has been estimated at 2.6 per cent per annum, muchbelow the Plan target of 4.6 per cent.
26. The rate of growth for total manufacturing activities is estimatedto have been around 9 per cent during the Second Plan, around 11 per centper annum in East Pakistan and about 8 per cent per annum in West Pakistan.This is not unreasonable in view of the fact that in East Pakistan large-scale manufacturing sectors started from a lower base.
Factors which affect these growth rates are:
(a) Entrepreneurial capacity. and profit incentives favorableto industrial investment.
(b) Credit to promote investment, specially foreign exchangefrom development banks (PICIC, IDBP).
(c) Improved supply of raw materials.(d) Larger (though still limited) demand for products being
produced.
1/ In 1959/60, the relative weights in -value added for the small-scale andlarge-scale manufacturing sectors was 43.6 and 56.4 per cent respectively.
- 8 -
27. Industry and Import Liberalization. Up until about mid-1964, Pakistanindustry, with some notable exceptions such as textiles, was operating wellbelow even one-shift capacity. The main factor hindering the full utiliza-tion of capacity was the shortage of industrial raw materials, components andspare parts.
28. In January 1964 an important liberalization measure was taken byplacing four iron and steel items on free import list, which meant that eli-gible importers could import these items from the United States (which wasproviding the financing) without import license. In July 1964, a majorextension of the liberalization policy was announced and the free list wasexpanded to 51 items, largely intermediate products. With minor changes,the free import list has been continued for the first half of 1965 and it isthe stated government policy to continue it within the limits of foreign ex-change availability. Since machinery to implement the enlarged list did notbegin to function till August 1964 and given the time required for placingorders and arrival of goods, it is too early for a proper analysis of theimpact of the free list on the utilization of industrial capacity. However,recent studies indicate that the degree of utilization of capacity is defi-nitely rising and is approaching 100 per cent (from around 75 per cent) inmany lines l_ However, in most factories visited by the *lission, the degreeof utilization of capacity was still only fair. Moreover, the sample may showabove average utilization as it included several relatively well-organizedindustries which had the technical and managerial talents to operate effici-ently. The major reasons for excess capacity are the still irregular supplyof imported raw materials and components, the general shortage of skills andthe lack of markets.
29. Industry is still a profitable field for the Pakistan entrepreneurand the rupee capital is available in the lorm of profits to be reinvested. VThe Mission heard some complaints concerning a relative decline of profits insome industries due to keener competition because of the more liberal importpolicy. However, profits remain high although reliable information on theiramount is scarce. In 1963 net profits after tax as a percentage of net worth.
1/ Some notion of the effect of the import liberalization can be gained bystudying the price of specific items. Reduction in steel prices has beenattributed to the introduction of the free import list. The prices ofG.P. sheets have come down from Rs. 1,500 per ton in July 1964 to Rs.1,330per ton in December 1964, a fall of 11.5 per cent. For the same period,prices of G.I. wire have gone down from Rs. 1,915 per ton to Rs. 1,475 perton and of structurals (joists) from Rs. 1,400 per ton to Rs. 1,225 perton. In other cases, reduction of over 20 per cent has occurred in Chloro-mycitin, tanning substances, carbon black, laboratory glassware, scienti-fic instruments, pigments, condensed milk and gum.
2/ About 75 per cent of gross profit (including depreciation) is said to bereinvested in representative large-scale industries.
- 9 -
were about 14 per cent for cotton textiles and jute goods, 42 per cent forsugar, 20 per cent for cement, 10 per cent for tobacco, o per cent forengineering, paper and board (see [riex 3). A tentative comparison withthe level of profitability in Latin Ainerica and the United States is alsogiven in tThe Annex. Coiiibined with a liberal ta; inceintive systen, theseprofits provide a good basis for further investment.
30. iHore detailed discussion of Pakistan's industrial derelopment duringthe Second Plan, together with the controls used and finarncing provided, is inAnnex 3 .
Trade and Finance.
31. Financial Policy. In the main, the fiscal and monetary strategy andpolicies outlined in the Second Plan were followed effectively. As intended,there were significant departures from an extensive use of direct controls infavor of reliance on fiscal and monetary measures to regulate the economy.The budget and taxation systems were used to encourage more savings andmobilize increasing resources for government financed development expendituresand for holding down consumption. This was accomplished by extending or rais-ing excises, sales taxes and import tariffs, reducing export duties to promotelarger exports, and modifying direct taxes to strengthen incentives for in-creased production and investment. Subsidies and other measures were also usedto secure desired resource allocation. However, only a beginning was made toachieve a more income-elastic tax system. Tax policy was not effective inchecking the concentration of economic powier and, indeed, such checks mighthave reduced private savings. Over most of the period, the fiscal and mone-tary measures followed by the Government resulted in financial stability.
32. Fiscal Performance. An outstanding feature of the fiscal performance hasbeen the buoyancy of the revenue surplus. Despite a rise in non-developmentexpenditures of about 48 per cent during this period, there was available forgovernment financed development undertakings 16 per cent more revenue resourcesthan had been projected.
33. Taxes have roughly doubled in volume from Rs. 2.0 billion in 1959/60to about Rs. 4.0 billion in 1964/65, and tax receipts on the average haveincreased about a fifth each year or from 6.1 per cent of GIIP in 1959/60 toan expected 8.7 per cent in 1964/65. Half the increase, or Rs. 1 billion, hascome from excises and customs. Increased collections from the sales tax pro-duced another Rs. 440 million of the increase. Returns from these threecategories of indirect taxes increased about 90 per cent. Income and corporatetaxes have increased less rapidly from a level of Rs. 370 million in 1959/60 toan estimated Rs. 633 million in 1964/65. However, these direct taxes increasedfrom about 14.6 to 15.9 per cent of total tax revenue. Land revenue collec-tions,which are the responsibility of the Provincial Governments,increased evenmore slowly from the 1959/60 rate of Rs. 220 million to Rs. 307 million esti-mated for 1964/65.
- 10 -
34. Tile non-tax receipts of the Central and Provincial Governments(revenues from railways, posts and telegraphs and othor public undortakingscharges for irrigation and electricity and miscellaneous receipts) alsoabout doubled from 1960/61 to 1964/65. Total non-tax revenues were about30 per cent above the Plan target of Rs. 4,150 million.
35. The Plan target for the increase in administrative expenditure was4 per cent per annum and for the rise in the recurrent cost of developmentschemes, 14 per cent yearly. In these projections an allowance was made for ananticipated long-delayed adjustment in goverrment pay scales. In fact, the in-crease in normal administrative expenditure has averaged about 6 per cent peryear, whereas the expenditures of development departments have gone up about16 per cent annually. The burden of debt services has increased rapidly andsurpassed the five-year Plan expectation of Rs. 1.4 billion by well overRs. 1.0 billion. The debt service and defense expenditures together accountedfor the entire excess of non-development spending over the target.
36. The Second Plan set forth a tentative target of Rs. 200 million forcontributions from local bodies to national development. The local bodies orBasic Democracies in 1959 were given increased tax powers as well as addi-tiorLal responsibilities for development work, but only fragmentary data areava:K'.able on their financial contribution. The Planning Commission estimates,however, indicate that the target was reached.
37. At the provincial level, government income has increased, partly asa result of the Provinces' own slightly improved revenues but primarily onaccount of better revenue collections by the Central Government and a corres-ponding higher share distributed to the Provinces.!/ On the other hand,
1/ The share of the two Provinces in centrally collected taxes is workedout as follows:(a) 50 per cent of the net proceeds of Income Tax including Corporation
Tax but excluding the tax on federal emoluments.(b) 60 per cent of the net proceeds of the Sales Tax.(c) 60 per cent of the Excise Duties on tea, betel-nuts and tobacco.(d) 100 per cent of Export Duties on jute and cotton.(e) 100 per cent of the Estate and Succession Duty in respect of agri-
cultural land.(f) 100 per cent of taxes on capital value of immovable property.
The apportionment between the two Provinces is according to the followingformula:(a) Sales Tax. 70 per cent on the basis of popu-
lation and 30 per cent on thebasis of incidence.
(b) Estate and Succession Duties inrespect of agricultural land and Each Province receives an amountequal to the collection in thetaxes on the capital value of Province concerned.immovable property.
(c) Other Taxes and Duties. On the basis of population.
The "net proceeds" of a tax or duty is the total proceeds thereof reducedby the cost of collection. On the basis of population, East Pakistan re-ceives 54 per cent and West Pakistan 46 per cent of the proceeds assignedto the Provinces.
- 11 -
the growing recurring costs of completed development schemes, debt servicingof foreign loans and other factors have increased non-development expendi-tures over the 1960/61 rate by 94 per cent in East Pakistan and 80 per centin West Pakistan. Excluding taxes shared with the Central Government, theprovincial deficit on non-development account has increased from aboutRs. 143 million in the first year of the Second Plan to an estimated Rs. 478million in 19614/65. Provincial revenue sources are financing a smaller pro-portion of the expanding non-development spending.
38. The increase in public savings during the Second Plan period was ata rate almost double the rate of growth in GNP and roughly kept pace with therate of increase in total domestic savings. The Central and ProvincialGovernments also mobilized receipts from small private savings, public borrow-ing from non-bank sources, sale of public industrial assets, depreciation fundsof the railways, posts and telegraphs, other reserve funds, and other non-expansionary sources. Total public financial resources rose from 8.7 per centof GNP in 1959/60 to about 12.1 per cent in 1964/65. They amounted to nearly12 per cent of the additional income generated in the economy during the SecondPlan.
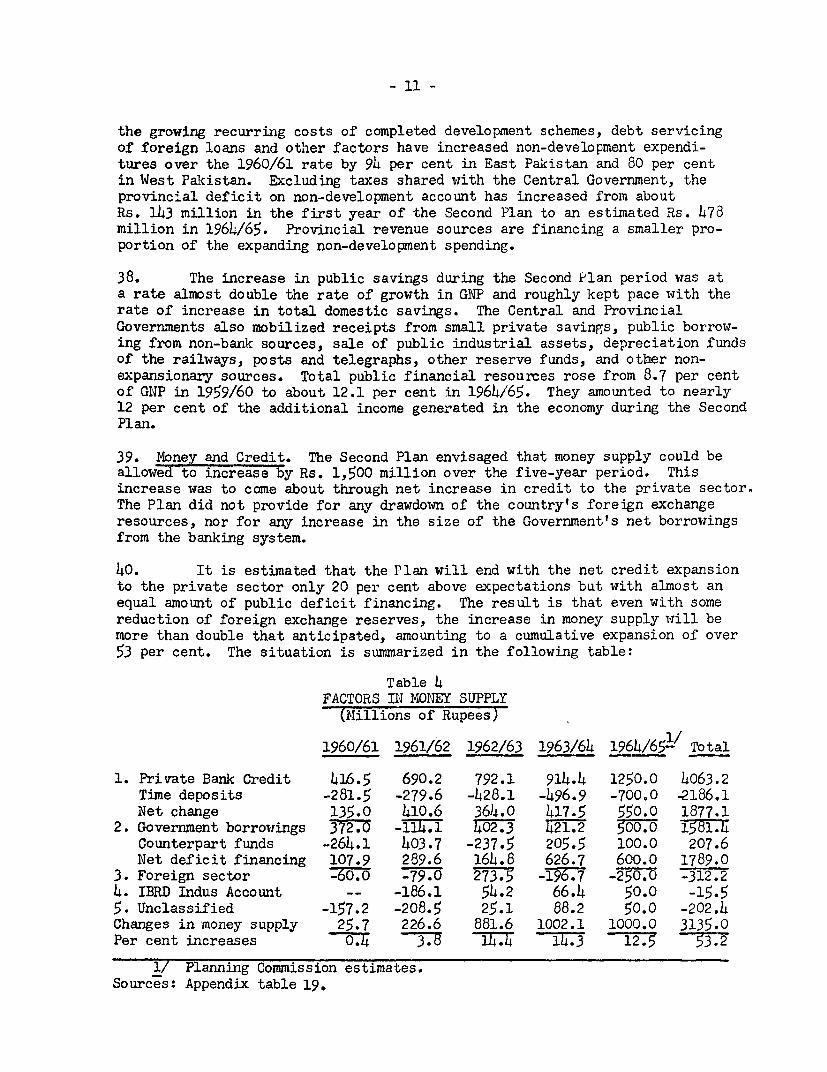
39. Money and Credit. The Second Plan envisaged that money supply could beallowed to increase by Rs. 1,500 million over the five-year period. Thisincrease was to come about through net increase in credit to the private sector.The Plan did not provide for any drawdown of the country's foreign exchangeresources, nor for any increase in the size of the Government's net borrowingsfrom the banking system.
40. It is estimated that the Plan will end with the net credit expansionto the private sector only 20 per cent above expectations but with almost anequal amount of public deficit financing. The result is that even with somereduction of foreign exchange reserves, the increase in money supply will bemore than double that anticipated, amounting to a cumulative expansion of over53 per cent. The situation is summarized in the following table:
Table 4FACTORS IN MOINEY SUPPLY
(Millions of Rupees)
1960/61 1961/62 1962/63 1963/64 1964/651" Total
1. Private Bank Credit 416.5 690.2 792.1 914.4 1250.0 4063.2Time deposits -281.5 -279.6 -428.1 -496.9 -700.0 -2186.1Net change 135.0 410.6 364.0 417.5 550.0 1877.1
2. Government borrowings 372.0 -114.1 402.3 421.2 500.0 1581.Counterpart funds -264.1 403.7 -237.5 205.5 100.0 207.6Net deficit financing 107.9 289.6 164.8 626.7 600.0 1789.0
3. Foreign sector -60.0 79.0 273.5 -196.7 -250.0 -312.24. IBRD Indus Account -- -186.1 54.2 66.4 50.0 -15.55. Unclassified -157.2 -208.5 25.1 88.2 50.0 -202.4Changes in money supply 25.7 226.6 881.6 1002.1 1000.0 3135.0Per cent increases 0. 4 14.4 14.3 12.5 3.2
1/ Planning Commission estimates.Sources: Appendix table 19.
- 12 -
41. During the first twio years of the Plan stability in money supplywas maintained and the monetary overhang at the start of the Plan was absorbedin the growth of the economy. In the third year the accumulation of reservesadded substantially to money supply. Thereafter, public deficit financing(plus the drawdown of counterpart funds) started to grow while private bankcredit continued to expand. In December 1964, foreign exchange reserves almostfell to the statutory limit of 30 per cent of currency in circulation, leadingPakistan to draw its gold tranche of $16 million and to arrange a standby of$37.5 million from the IfF.
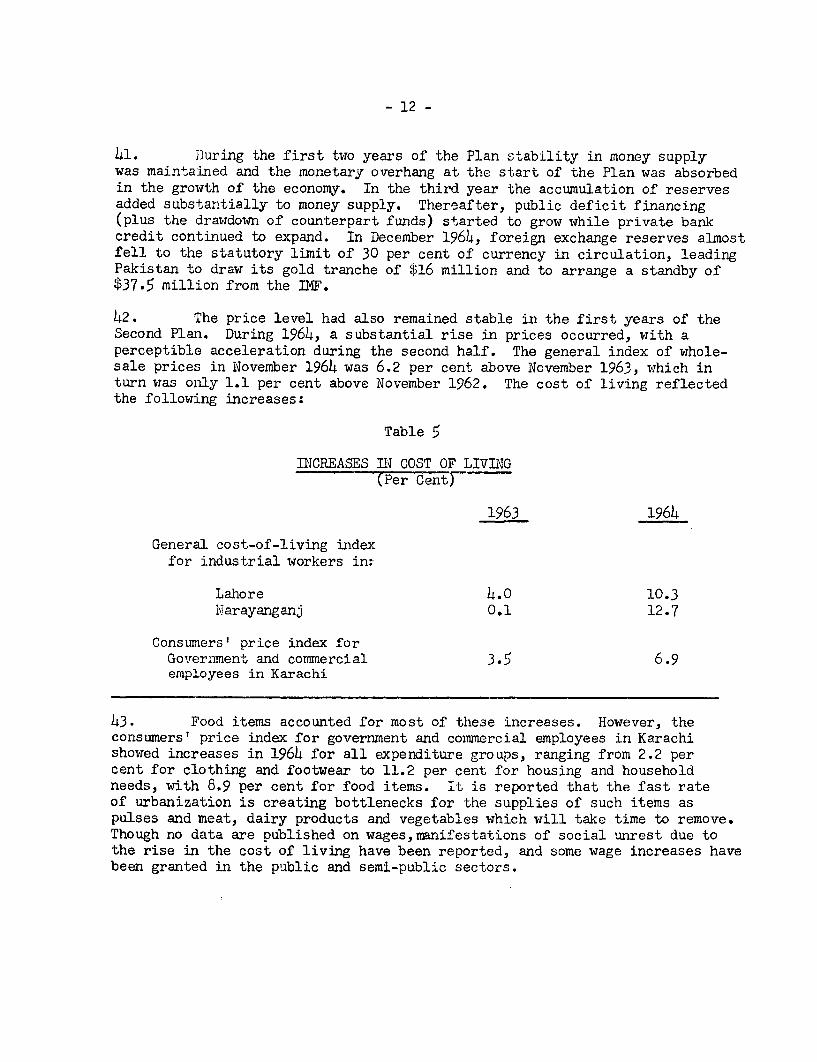
42. The price level had also remained stable in the first years of theSecond Plan. During 1964, a substantial rise in prices occurred, with aperceptible acceleration during the second half. The general index of whole-sale prices in November 1964 was 6.2 per cent above November 1963, which inturn was only 1.1 per cent above November 1962. The cost of living reflectedthe following increases:
Table 5
INCREASES El COST OF LIVIIG(Per CentF
1963 1964
General cost-of-living indexfor industrial workers in:
Lahore 4.0 10.3Narayanganj 0.1 12.7
Consumers' price index forGovernment and commercial 3.5 6.9employees in Karachi
43. Food items accounted for most of these increases. However, theconsumers' price index for government and commercial employees in Karachishowed increases in 1964 for all expenditure groups, ranging from 2.2 percent for clothing and footwear to 11.2 per cent for housing and householdneeds, with 8.9 per cent for food items. It is reported that the fast rateof urbanization is creating bottlenecks for the supplies of such items aspulses and meat, dairy products and vegetables which will take time to remove.Though no data are published on wages,manifestations of social unrest due tothe rise in the cost of living have been reported, and some wage increases havebeen granted in the public and semi-public sectors.
- 13 -
44. One important factor accounting for the unusually strong demandfor bank credit has been the import liberalization program. Larger imports,some of which were speculative, and a fuller utilization of industrialcapacity, created a strong demand for credit in 1964. Some restrictivecredit measures could have been usefully applied simultaneously with theliberalization of imports in July 1964.
45. During the first fortnight of January 1965, the State Bank con-sidered it essential to take measures to restrain the rate of monetaryexpansion.i/ They are designed to contain the unusual buoyancy of privatebank credit. Their selectivity in favor of exports and of small businessshould be welcome. The penalties they put on speculative imports and in-ventories have received a less enthusiastic reception. They are not sostrong as to curtail the long-term expansion of credit needed for thedevelopment of agriculture, industry and commerce.
46. From the standpoint of total monetary supply, the State Bank cando little to restrain the expansionary influence of the Government's defi-cit financing. Commodity procurement operations and the development program,for which such financing is needed, have a high priority.
47. A part of the unusual expansion that occurred during the secondhalf of 1964 was due to seasonal and accidental factors, whose effects maybe expected to diminish during the second half of 1964/65. But, there islittle doubt that, if the Government does not take steps to reduce its re-liance on the banking system, the rate of money expansion for the whole of1964/65 will be at least as high as it was in 1963/64, even though the draw-down of foreign exchange reserves will be greater.
1/ On the recommendations of the Credit Committee established in 1962,the State Bank introduced in August 1963 a quota system with graduatedinterest rates for State Bank lending to commercial banks. Under thissystem, borrowing at the rate of 4 per cent is limited to individualbank ceilings equal to the statutory balances the bank holds with theState Bank, above which the rate is increased in steps up to 6 per centas borrowings from the State Bank exceed this quota. An exception ismade for borrowing against loans of up to Rs. 25,000 to small businesses.This latter provision is in response to the Government's concern aboutthe lack, since Partition, of adequate credit facilities for the small-man.
In January 1965 the State Bank took action in three fields: (1) tighten-ing of the quota system and expansion of its coverage to include alltypes of loans and advances from the State Bank; (2) imposition of a25 per cent marginal requirement against the opening of L/Cs for imports;and (3) increase in the cash reserve requirements of the banks from 5per cent to 7½! per cent to be effective from April 1965. Borrowingsfrom the State Bank by IDBP and ADBP and by commercial banks to financethe small-man (up to Rs. 25,000) and to finance exports are exempt forthe purview of the quota system.
- 14 -
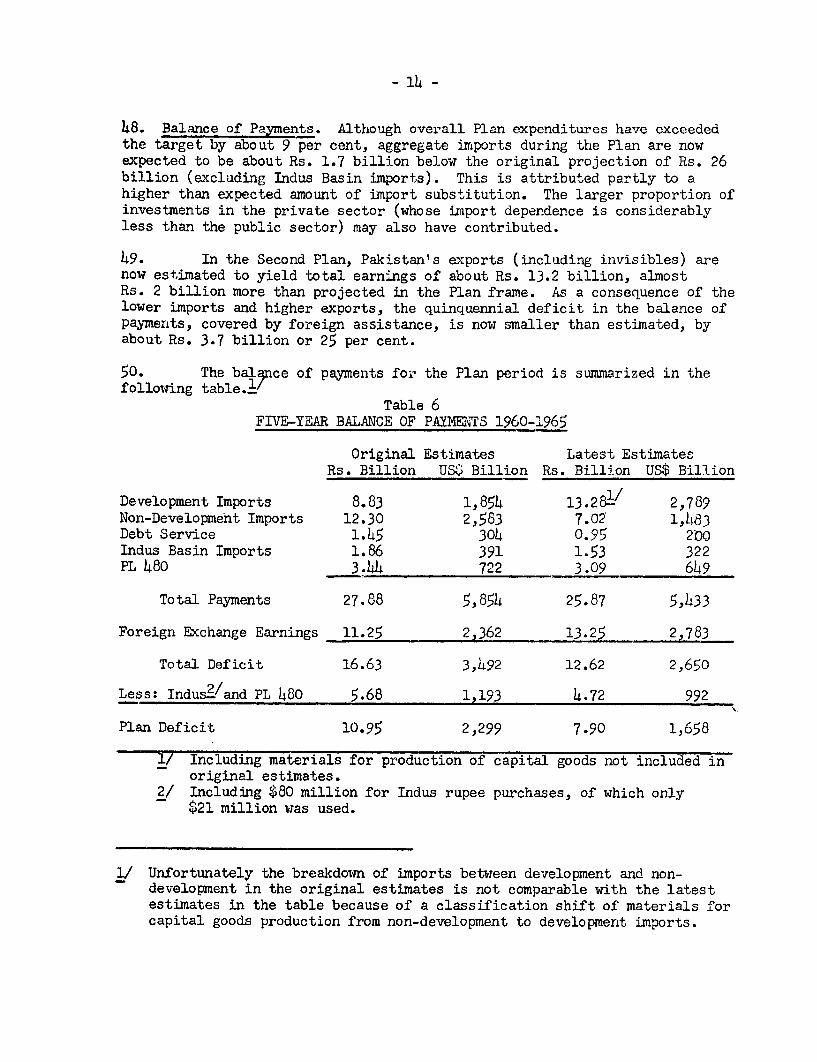
48. Balance of Payments. Although overall Plan expenditures have exceededthe target by about 9 per cent, aggregate imports during the Plan are nowexpected to be about Rs. 1.7 billion below the original projection of Rs. 26billion (excluding Indus Basin imports). This is attributed partly to ahigher than expected amount of import substitution. The larger proportion ofinvestments in the private sector (whose import dependence is considerablyless than the pub'lic sector) may also have contributed.
49. In the Second Plan, Pakistan's exports (including invisibles) arenow estimated to yield total earnings of about Rs. 13.2 billion, almostRs. 2 billion more than projected in the Plan frame. As a consequence of thelower imports and higher exports, the quinquennial deficit in the balance ofpayments, covered by foreign assistance, is now smaller than estimated, byabout Rs. 3.7 billion or 25 per cent.
50. The bala"nce of payments for the Plan period is summarized in thefollowing table.l/
Table 6FIVE-YEAR BALANCE OF PAYMENTS 1960-1965
Original Estimates Latest EstimatesRs. Billion US$ Billion Rs. Billion US$ Billion
Development Imports 8.83 1,854 1 3 . 2 81/ 2,789Non-Development Imports 12.30 2,583 7.02 1,483Debt Service 1.45 304 0.95 200Indus Basin Imports 1.86 391 1.53 322PL 480 3.44 722 3.09 649
Total Payments 27.88 5,854 25.87 5,433
Foreign Exchange Earnings 11.25 2,362 13.25 2,783
Total Deficit 16.63 3,492 12.62 2,650
Less: Indus.2/and PL 480 5.68 1,193 4.72 992
Plan Deficit 10.95 2,299 7.90 1,658
1/ Including materials for production of capital goods not included inoriginal estimates.
2/ Including $80 million for Indus rupee purchases, of which only$21 million was used.
1/ Unfortunately the breakdown of imports between development and non-development in the original estimates is not comparable with the latestestimates in the table because of a classification shift of materials forcapital goods production from non-development to development imports.
- 15 -
Pakistan's balance of payments position has thus proved to be considerablybetter than anticipated in every respect, includirng debt service.
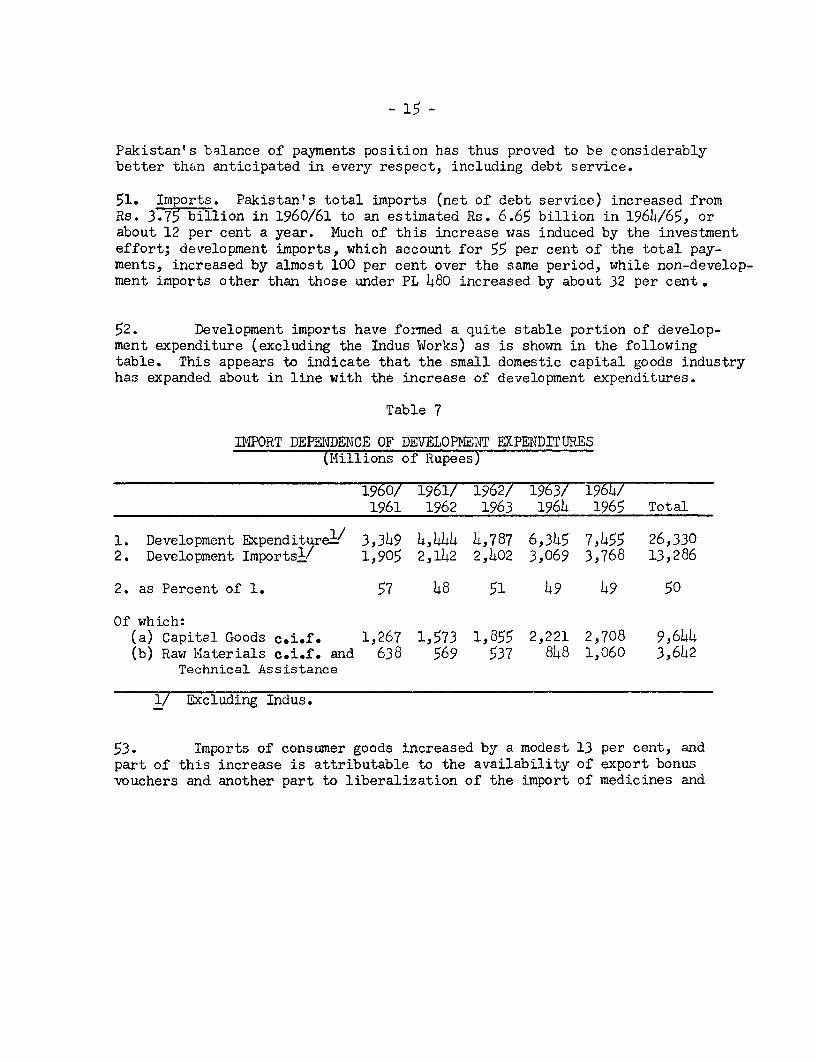
51. Imports. Pakistan's total imports (net of debt service) increased fromRs. 3.7 billion in 1960/61 to an estimated Rs. 6.65 billion in 1964/65, orabout 12 per cent a year. Much of this increase was induced by the investmenteffort; development imports, which account for 55 per cent of the total pay-ments, increased by almost 100 per cent over the same period, while non-develop-ment imports other than those under PL 480 increased by about 32 per cent.
52. Development imports have formed a quite stable portion of develop-ment expenditure (excluding the Indus Works) as is shown in the followingtable. This appears to indicate that the small domestic capital goods industryhas expanded about in line with the increase of development expenditures.
Table 7
IMPORT DEPENDENCE OF DEVELOPMEINT EXPENDITURES(Millions of Rupees)
1960/ 1961/ 1962/ 1963/ 1964/1961 1962 1963 1964 1965 Total
1. Development Expenditurel/ 3,349 4,444 4,787 6,3)45 7,455 26,3302. Development Importsl/ 1,905 2,142 2,402 3,069 3,768 13,286
2. as Percent of 1. 57 48 51 49 49 50
Of which:(a) Capital Goods c.i.f. 1,267 1,573 1,855 2,221 2,708 9,644(b) Raw MIaterials c.i.f. and 638 569 537 848 1,060 3,642
Technical Assistance
1/ Excluding Indus.
53. Imports of consumer goods increased by a modest 13 per cent, andpart of this increase is attributable to the availability of export bonusvouchers and another part to liberalization of the import of medicines and
- 16 -
books.Y- Intermediate goods, which are used in the domestic production ofconsumer goods and of capital goods in a proportion of about 2:3, haveshown a more sizeable increase from Rs. 866 million to Rs. 1,455 million,or by 67 per cent. This reflects the process of increasing import substi-tution for consumer goods, the raw materials for which have to be imported.
54. Imports of raw materials going into the production of consumergoods have been growing faster than those going into capital goods produc-tion. This is explained by the early stage of development of the capitalgoods industry in Pakistan. During the last 15 years, industrializationhas been concentrated on consumer goods, but it is expected that in futurean increasing volume of capital goods will be produced locally.
55. Imports under the U.S. PL 480 program amounted to about $650million during the Second Plan. Despite rising foodgrain production, importsof wheat averaged about 1.3 million tons a year and appear to be stable orrising slightly. The higher per capita income with a relatively high incomeelasticity for food probably accounts for this.
56. Import Policy. Pakistan will be entering the Third Plan with an importsystem that has been substantially liberalized, compared with the system thatprevailed at the beginning and during the earlier years of the Second Plan.There has been significant progress towards eliminating quantitative controlsand permitting the flow of imports to respond to the requirements of themarket, particularly in respect of industrial raw materials and components.2/
1/ Under the Export Bonus Scheme, an exporter who earns $210 in foreign ex-change has to sell this to the State Bank of Pakistan at the official rateof exchange, of Rs. 4.76, that is for Rs. 1,000. But in addition, ifentitled to bonus as most manufactured items are, he receives in additiona voucher that entitles him,or the person to whom he sells it, to purchaseforeign exchange at the official rate of Rs. 4.76 for a percentage of thevalue of his exports. The bonus percentage is either 30 or 20 per cent,depending on the item. If the bonus is 30 per cent (as it is in mostcases) and the voucher is sold at 150 per cent of the official rate, theexporter would receive Rs. 450 from the bonus if he sold it on the KarachiStock Exchange at present. Added this to the Rs. 1,000, his effectiveexport rate would be 45 per cent above the official rate or Rs. 6.90 tothe dollar. The import rate on goods imported with the vouchers would be150 per cent higher than the official rate or about Rs. 12 to the dollar.
2/ The freeing of the requirements of industries from controls has been instages. Before July 1960, no imports were permitted except against in-dividual licenses. Allocations for industries were based on governmentassessment of plant requirements for single shift operations. In thatyear, 118 industries were permitted to import raw materials on the basisof a single request rather than assessment of needs. In 1961, eleventypes of raw materials were placed under so-called OGL (Open General Li-cense). The term OGL was a misnomer, as the system was still rigid. Thenumber of OGL items was subsequently enlarged, and an export incentive wasbuilt into the scheme by granting additional import licenses in a limitedamount for imports of raw materials against evidence of export performance.
- 17 -
57. The most important recent change in import policy was the removal,in June 1964, from import control (putting on the "free list" means freedomfrom licensing, not from tariffs) of 51 items, most of which were intermediatematerials and components. The impact of this action on industrial productionis discussed above. It supplemented, on a broader front, the action taken inJanuary 1964., when four iron and steel items, financed with U.S. commodity aid,were placed on the free list. Prior to liberalization, these 51 items consti-tuted about 39 per cent of all imports other than those under project aid.
58. Notwithstanding the heavy ordering of these items, particularly inNovember and December 1964 (which was attributable partly to anxieties aboutthe continuation of liberalization and to the impending elections), the Govern-ment in January announced the continuation of the "free list", and the importpolicy for the current shipping period (January-June 1965) is virtually un-changed.
59. The Government has had to approach the liberalization of importscarefully, since it has been hard to gauge demand in the market after over adecade of controls and with an exchange rate that made the landed cost ofmost goods very low in relation to domestic prices. This was evident fromthe price paid for bonus vouchers (Appendix table 24 ). In the case of mostconsumer goods except those imported against bonus vouchers (mainly durableconsumer goods, and some quasi-luxuries and certain capital equipment), acombination of high import duties and quantitative restrictions was necessaryto contain demand. Where these restrictions are handled liberally, as in thecase of medicines, domestic prices were very low by any standard. Similarly,all capital goods, including those financed with foreign aid, bear very lowiimport duties, and since they are usually priced into the economy at the parrate, tend to stifle domestic attempts at producing similar goods.-/ Thesolution, applied so far in a few cases, of banning the import of directlycompetitive goods, is certainly not the right answer. The last Bank reportpointed out that the present exchange rate system tends to give an artificialstimulus to demand for those goods that are imported under direct licensingat the par rate, and that the only practical solution would be to combine thelifting of quantitative controls with a policy designed to bring effectivedomestic demanid into line with available foreign exchange resources.
60. The Mission recognizes the need to keep the price of essential rawmaterials at a reasonably low level if,in coming years,new producers' goodsindustries, based partly on imported raw materials, are to be established onan economical basis, and are to withstand competition from aid-financedcapital goods on which it wrould be impractical to impose high protective
1/ Duties on capital goods are about 7½2 per cent in East and 12½ per centin West Pakistan. Consumer goods tariffs average about 50 per cent andintermediate goods 15 - 20 per cent.
- 18 -
duties. But a price level should be sought also for the.e imported rawmaterials that will not continue to discourage the use of similar or alterna-tive domestic materials.
61. The acceleration in the disbursement of commodity aid made availableduring the last three years, has, of course,been effective in reducing theexcess of domestic demand over the supply of foreign exchange. Indeed, it hasmade it possible to initiate the removal of quantitative controls without sub-stantial price measures directed at restraining effective demand. But a risinglevel of commodity aid should not be postulated to continue for the future ongrounds merely of meeting internal demand not associated with higher levels ofinvestmerit and economic growth.
62. With the natural practice by private as well as government agenciesto make present and future cost calculations on the basis of c.i.f. prices forimported capital and intermediate goods, rather than the real cost of foreignexchange, a propensity to prefer imported goods over "expensive" local alter-natives clearly exists, and tends to build import dependence into the economy.The Government has recognized the need to encourage the use of resources thatcan be found domestically, and, with the intent of correcting some of theundervaluation of imports, it requested regulatory powers in the 196h/65 budgetto enhance import duties, customs and sales taxes, each by a maximum percentageof 25 per cent of the existing duty or 10 per cent ad valorem. The authoritywas given for the fiscal year 1964/65. Some import duties wvere accordinglyenhanced by 10 per cent ad valorem, but the overall increase so far has beenless than 5 per cent. Only about a third of the authority given by the legis-lation has been used. It is expected that the Committee on Tariffs and Taxa-tion, which is studying the problem at present, will make their recommendationson these matters in the near future.
63. It is clear that substantial increases in the import tariff wouldbring down commercial profit margins in the import trade. The Mission thinksthat this is one sector of the economy which is in need of drastic rationali-zation. It is difficult to assess the total number of active importers in thecountry, but from available information it appears that in East Pakistan alone,the number of importers must be close to 15,000, handling an annual volume ofabout $200 million equivalent. This would make for V average of $13,000 perfirm but considerably less for the majority of them.- In West Pakistan, thesituation would seem to be not much different. Mlost of these importers couldbe better employed in an economy generally short of managerial talent.
6h. It should be expected that the removal of quantitative controls wouldin due course tend to eliminate that part of the import trade whose business hadbeen,in the past,limited to creaming off the scarcity value of import licenses.No such effects have been reported so far; this may be due to special measures
1/ Small importers are said to handle only 25 per cent of the $200 million.
- 19 -
taken to protect small traders, particularly in East Pakistan. The Missiondoes not think that such measures can be economically justified.
65. Domestic wholseale prices have come down by 10 per cent to 25 percent for those items which were placed on the free list in January 1964.Representatives of private industry pointed out to the Mission that, benefi-cial as the import liberalization was felt to be, it still contains someelements of inconsistency where non-availability of crucial items underregular licensing made it difficult to realize the full benefit of the freelist. This criticism has been met in part by putting such items on thebonus import list. Also, the marginal deposit requirement introduced inDecember was felt to be overly effective in restraining demand as, of course,it was intended to do. However, there was no disagreement in the fact thatsubstantial improvements had been made possible in the utilization of indus-trial capacity.
66. Exports. When the Second Plan was drawn up, a very modest 2 per centannual growth of exports was forecast; this was subsequently raised to 3 percent, still less than the expected growth in GNP and quite out of proportionwith the expected growth of imports.2/ Actual export performance, however,has been much better. So far, it has been at a compound rate of 7.2 percent a year, rising from $442 million in 1959/60 to Y$585 million in 1963/64.The overall Plal target may be exceeded by 15 per cent.
67. The success of Pakistan's exports during the Second Plan was not aconsequence of changes in market conditions abroad or unusually favorableweather. Nor can it be attributed to special measures of export promotion,since the Export Bonus Scheme had largely played out its role when the Planprojections were made. The principal cause was a sudden break-through inthe production of exportable crops, chiefly raw cotton, rice and fish, andhas to be viewed in the context of the overall growth of the economy. Verylargely, the economic growth during the Plan must be attributed to the per-formance of agriculture; the same is true for exports. The proportion ofmanufactured goods in total exports declined from 25 per cent in the firstyear to 22 per cent in 1963/64. For cotton textiles, not even the originaltarget is being reached, and in the case of jute goods, it is likely to beexceeded only by a small margin, if at all.
1/ Pakistan's exportsin 1959 were just about the same as a decade earlier.This stagnation was interrupted only by the lKorean boom, the subsequentslump, and later by a short-lived improvement after the 1955 devaluation.In 1959 the Export Bonus Scheme came into operation. It provided apartial upward adjustment of the effective rate of exchange; about 37 percent of all exports benefited from the scheme, and these registered a165 per cent increase in one year. However, the impact of the schemeworked itself off; physical limitations on production assumed greaterimportance as the Second Five-Year Plan got underway in 1960.
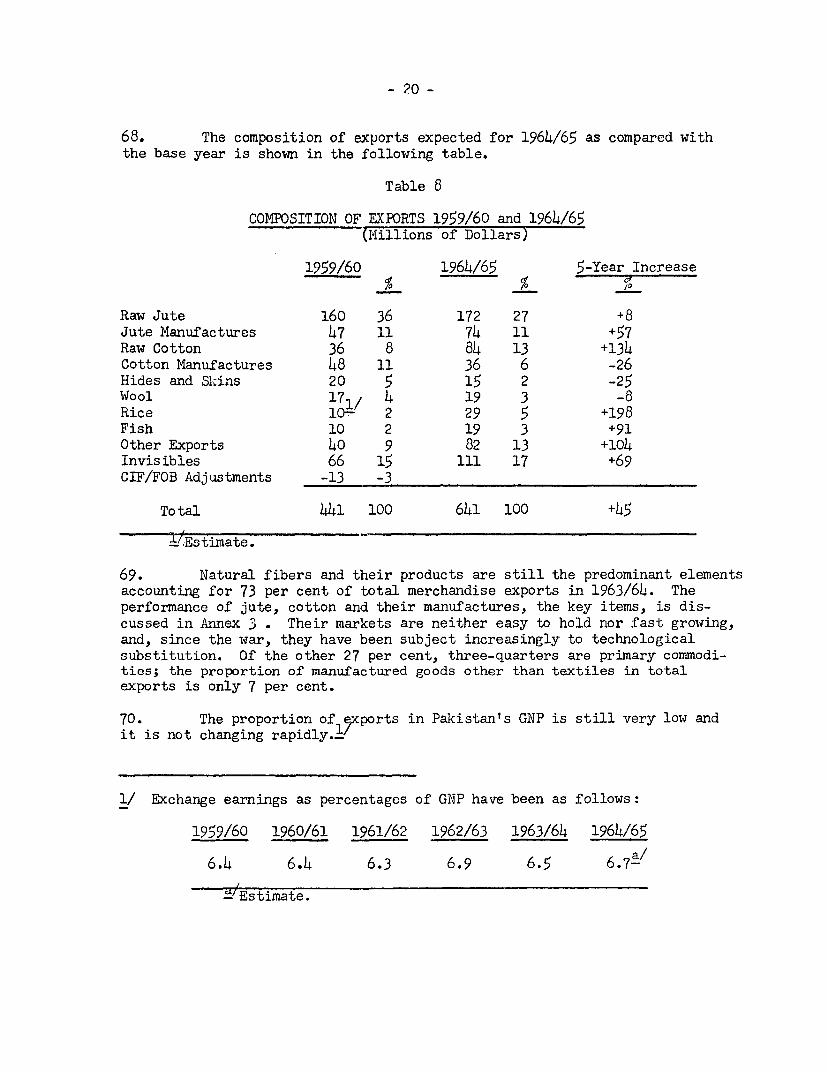
- 20 -
68. The composition of exports expected for 1964/65 as compared withthe base year is shown in the following table.
Table 8
COMPOSITION OF EXPORTS 1959/60 and 1964/65(Millions of Dollars)
1959/60 1964/65 5-Year Increaseof
Raw Jute 160 36 172 27 +8Jute Manufactures 47 11 74 11 +57Raw Cotton 36 8 84 13 +134Cotton Manufactures 48 11 36 6 -26Hides and Skins 20 5 15 2 -25Wool 171/ 4 19 3 -8Rice 10- 2 29 5 +198Fish 10 2 19 3 +91Other Exports 40 9 82 13 +104Invisibles 66 15 111 17 +69CIF/FOB Adjustments -13 -3
Total 441 100 641 100 +45
Y -Estimate.
69. Natural fibers and their products are still the predominant elementsaccounting for 73 per cent of total merchandise exports in 1963/64. Theperformance of jute, cotton and their manufactures, the key items, is dis-cussed in Annex 3 . Their markets are neither easy to hold nor fast growing,and, since the war, they have been subject increasingly to technologicalsubstitution. Of the other 27 per cent, three-quarters are primary commodi-ties; the proportion of manufactured goods other than textiles in totalexports is only 7 per cent.
70. The proportion of12xports in Pakistan's GNP is still very low andit is not changing rapidly
1/ Exchange earnings as percentages of GNP have been as follows:
1959/60 1960/61 1961/62 1962/63 1963/64 1964/65
6.4 6.4 6.3 6.9 6.5 6.7-/
.a/ Estimate.
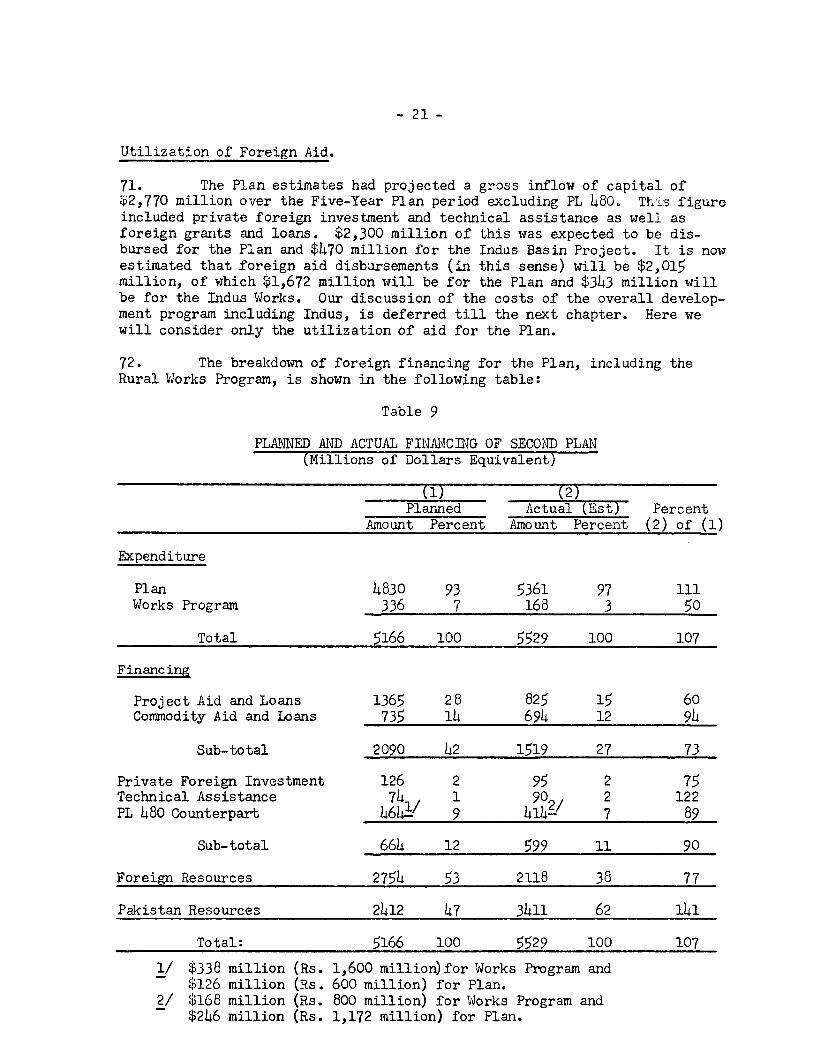
- 21 -
Utilization of Foreign Aid.
71. The Plan estimates had projected a gross inflow of capital of$2,770 million over the Five-Year Plan period excluding PL 480. Th:Ls figureincluded private foreign investment and technical assistance as well asforeign grants and loans. $2,300 million of this was expected to be dis-bursed for the Plan and $470 million for the Indus Basin Project. It is nowestimated that foreign aid disbursements (in this sense) will be $2,015million, of which $1,672 million will be for the Plan and $343 million willbe for the Indus Works. Our discussion of the costs of the overall develop-ment program including Indus, is deferred till the next chapter. Here wewill consider only the utilization of aid for the Plan.
72. The breakdown of foreign financing for the Plan, including theRural Works Program, is showin in the following table:
Table 9
PLANNED AID ACTUAL FINANCDIG OF SECOND PLAN(Millions of Dollars Equivalent)
(1) (2)Planned Actual (Est) Percent
Amount Percent Amount Percent (2) of (1)
Expenditure
Plan 4830 93 5361 97 111Works Program 336 7 168 3 50
Total 5166 100 5529 100 107
Financing
Project Aid and Loans 1365 28 825 15 60Commodity Aid and Loans 735 14 694 12 94
Sub-total 2090 42 1519 27 73
Private Foreign Investment 126 2 95 2 75Technical Assistance 74 1 90 2 122PL 480 Counterpart 4641 / 9 414- 7 89
Sub-total 664 12 599 11 90
Foreign Resources 2754 53 2118 38 77
Pakistan Resources 2412 47 3411 62 141
Total: 5166 100 5529 100 107
1/ $338 million (Rs. 1,600 million)for Works Program and$126 million (Rs. 600 million) for Plan.
2/ $168 million (Rs. 800 million) for Works Program and$246 million (Rs. 1,172 million) for Plan.
- 22 -
73. The most striking feature in addition to the shortfall of foreignresources of 23 per cent (27 per cent if only "aid" in the stricter senseof project and commodity assistance is considered) is the concomitant factthat Pakistani resources have met 62 per cent of Plan outlays as comparedwith about 47 per cent originally intended. If Plan expenditures had notexceeded expectations, the foreign resources actually received would havecovered 42 per cent of such expenditures (instead of 38 per cent). The 41per cent, by which the use of Pakistan's own resources have exceeded expec-tations, was made necessary to the extent of about two-fifths by an increasein Plan expenditures and three-fifths by a shortfall in the disbursement ofproject aid. The dominant role of the shortfall in project aid is evidentfrom the table. The net capital inflow (foreign resources received lessforeign debt service for the Plan was $1,902 million, as compared with the$2,450 million originally intended.
74. At the inception of the Second Plan, foreign aid requirements werecomputed in terms of disbursements and there was insufficient appreciationof the delay between the commitment of funds and their disbursement. By theend of the Plan period, however, the foreign aid pipeline probably will haveincreased by about $646 million or over 110 per cent. While total foreignresources used were 23 per cent less than contemplated by the drafters ofthe Plan, total funds pledged, together with private investments, technicalassistance and PL 480, amounted to over $3,000 million.
75. The remainder of this discussion has to do only with project andcommodity aid for the Plan, thus excluding PL 480, private investment, andtechnical assistance. The actual disbursement of aid in this narrower senseis likely to reach only 73 per cent of the target as table 9 shows.
76. The utilization of such assistance pledged or committed from con-sortium as well as non-consortium sources (including estimates for the lasthalf of 1964/65) is shown in the following table.
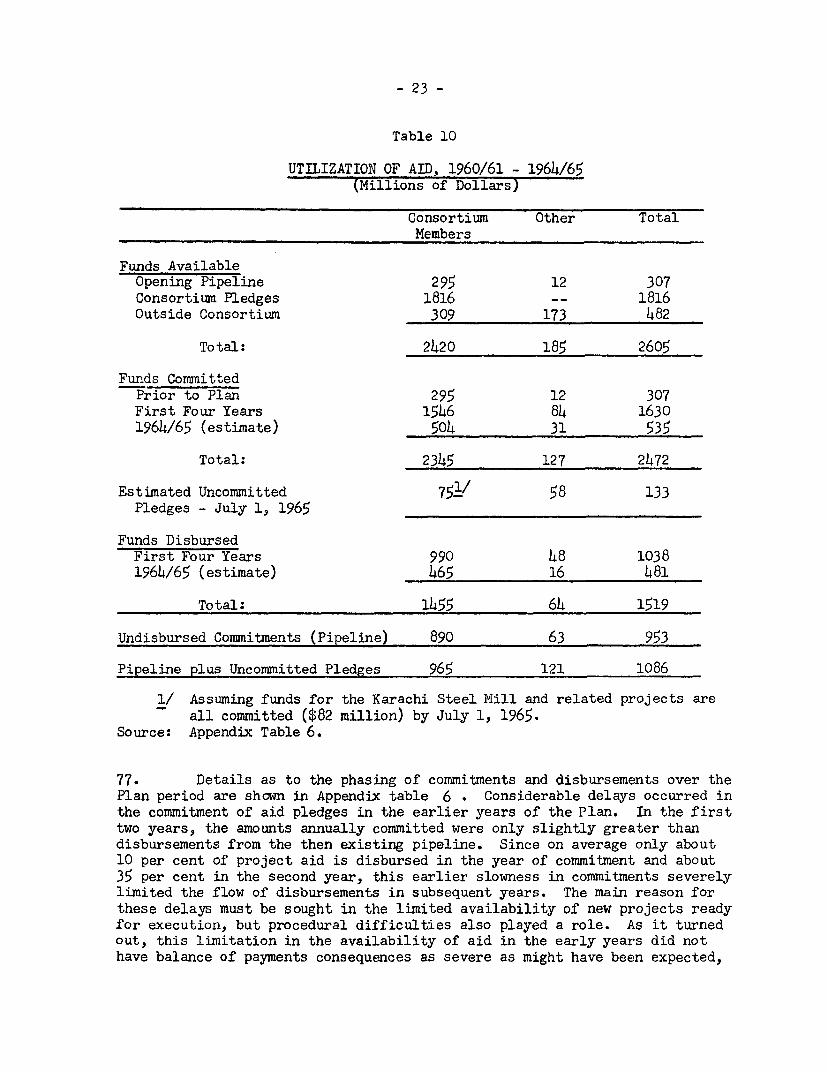
- 23 -
Table 10
UTILIZATION OF AID, 1960/61 - 1964/65(Millions of Dollars)
Consortium Other TotalMembers
Funds AvailableOpening Pipeline 295 12 307Consortium Pledges 1816 -- 1816Outside Consortium 309 173 482
Total: 2420 185 2605
Funds CommittedPrior to Plan 295 12 307First Four Years 1546 84 16301964/65 (estimate) 504 31 535
Total: 2345 127 2472
Estimated Uncommitted 751/ 58 133Pledges - July 1, 1965
Funds DisbursedFirst Four Years 990 48 10381964/65 (estimate) _465 16 481
Total: 1455 64 1519
Undisbursed Commitments (Pipeline) 890 63 953
Pipeline plus Uncommitted Pledges 965 121 1086
1/ Assuming funds for the Karachi Steel Mill and related projects areall committed ($82 million) by July 1, 1965.
Source: Appendix Table 6.
77. Details as to the phasing of commitments and disbursements over thePlan period are shown in Appendix table 6 . Considerable delays occurred inthe commitment of aid pledges in the earlier years of the Plan. In the firsttwo years, the amounts annually committed were only slightly greater thandisbursements from the then existing pipeline. Since on average only about10 per cent of project aid is disbursed in the year of commitment and about35 per cent in the second year, this earlier slowness in commitments severelylimited the flow of disbursements in subsequent years. The main reason forthese delays must be sought in the limited availability of new projects readyfor execution, but procedural difficulties also played a role. As it turnedout, this limitation in the availability of aid in the early years did nothave balance of payments consequences as severe as might have been expected,
- 24 -
had the calculations of the Plan's import coraponent aad the country's exportcapability been correct. In the middle of the Plan, commitments began to swingupwards; while project aid disbursements showed only a gradual acceleration1962/63 was the turning point both for a larger volume of commodity aid andsubstantially higher export earnings, the combination of which gave greaterflexibility for investment, particularly in the private sector, and permitteda smooth transition from a controlled economy to domestic decontrol and sub-stantial liberalization of imports. This helped to improve the investmentclimate, and together with fiscal and other incentives made it possible toexceed Plan targets for investment in the privately financed sector by morethan a third.
78. The annual rate of commitments reached a peak of almost $700 millionin 1963/64, a considerable part of which had been carried from preceding yearsin the form of uncommitted consortium pledges, held up pending the completionof feasibility reports and their approval by creditor countries and the Bank.
79. Total availabilities of pledges for fiscal year 1964/65 were $613million, of which $435 million were new pledges. Commitments up to December31,1964 amounted to $232 million. The proposed commitment rate in the current6-month period therefore is $303 million; whether this figure is reached willdepend, among other things, on the speed with which arrangements for theKarachi Steel Mill can be finalized. If the steel mill funds are committed,it appears that the carryover of uncommitted pledges will be about $75 million.
80. It appears that Pakistan will end the Plan period with a pipeline ofunused pledges and undisbursed equal to about two-thirds of disbursementsduring the Second Plan and about one-third of foreign aid requirements nowestimated for the Third Plan. Most of this build-up occurred during the thirdand fourth year of the Plan, when marny projects reached a stage of preparationwhen funds could be committed to them. The last year of the Plan will prob-ably show a relatively small further accretion to the pipeline (see Appendixtable 6 ). As is indicated below, the Mission feels that some reduction ofthe fund of $1,086 million unused commitments and pledges may be possibleduring the Third Plan despite the increase contemplated in overall Third Planoutlays. All of the uncommitted pledges at the end of the Second Plan will beearmarked for projects then under consideration by aid-giving countries andagencies. Therefore, it can realistically be regarded as part of the end-of-Plan pipeline.
81. Nearly 40 per cent of the project assistance furnished to Pakistanduring the Second Plan was committed and disbursed for projects in the privatesector. There appears to have been little difference in the speed with whichproject aid was used in the two sectors. In both the public and privatesectors, about 46 per cent of commitments (including undisbursed commitmentsat the beginning) were disbursed during the Plan period. Data showing thecommitment and disbursement of project assistance by categories of the Planare not yet available for 1964/65. However, its distribution for the firstfour years is shown in Appendix table 30 .
- 25 -
82. In its 1964 report (AS-106a), the Bank examined in some depthPakistan's administrative performance during the Second Plan. A number ofrecommendations were made for improved organization and staffing in theagencies most immediately concerned with the preparation and execution ofthe Plan. The Evaluation of the Second Plan (Chapter 6), prepared by thePlanning Commission, discussed the improvements in public administrationthat have been made or that are now in progress, and concludes that sub-stantial progress has been achieved, though more improvement is needed incertain areas. The Mission agrees with this evaluation. The rate of aidutilization is one indicator of administrative performance. The carryoverof unused pledges remaining at the end of the current year is likely to bemuch smaller than at any time since the establishment of the consortium andwill be a result of special problems in finalizing aid negotiations oncertain projects together with the terms on which certain aid is offered,rather than slowness in project preparation per se. In respect of the rateof disbursement and the consequent size of the pipeline, non-project aid isbeing disbursed about as rapidly as it is committed, allowing for the in-evitable delays in allocating it to the private or quasi-private sector.The closing level of pipeline for this type of aid may be a little smallerthan at the start of the Plan. The disbursement of project aid is only nowreaching the amount that was contemplated as an average for the Second Planas a whole. Considering the level that Plan expenditures have now reached,the disbursement of project aid is clearly still quite slow. This, as wellas difficulties and problems which the Mission observed in connection witha number of projects, leads us to repeat the recommendation in last year'sreport that the Planning Commission establish a section charged with keepingclosely in touch with the implementation of projects. This should notinterfere at all with the Provinces' responsibility for project preparationand execution.
83. In respect of the preparation of Third Plan projects, a large numberof feasibility studies have been completed or are nearing completion. Theprojects that will emerge from these studies, together with the large numberof on-going projects, should permit a steadily rising level of developmentexpenditure. What seems to be deficient or lacking are plans for the appro-priato time-phasing of projects. For example, decisions as to which projectsare J .e undertaken during the first year of the Third Plan and which leftfor later had not yet been taken at the time of the Mission's visit.
84. In respect of a broader field, preparations for the Third Plan havealso moved quite slowly. The special committee that was established a yearor longer ago to prepare recommendations on new sources of government revenuefor the Plan has not yet reported. Also, the overhaul of the tariff structureto provide a substitute for direct import controls is still awaited. Thesedelays in reaching decisions on matters of basic economic and fiscal policymake the task of preparing as well as reviewing the Third Plan more difficult.
CHAPTER 2
THE THIRD PLAN - GENERAL FRAIE
Size of the Plan
85. The financial magnitude of the Third Plan is about double theSecond, Rs. 52 billion ($10,920 million) as compared writh about Rs. 26billion.l/ In real terms the increase proposed is somewihat less. Pricesof investment goods increased about 8 per cent over the Second Plan periodand assuming this rate to continue through the Third Plan, the latterwould be roughly 85 per cent larger than the Second Plan in real terms.By any standards the Third Plan represents a very substantial stepping-upof the country's investment effort.
86. For the Third, as in the Second Plan, the Government is treatinginvestment in the Indus Basin Works as outside the frame of the Plan. Theforeign exchange and a large portion of the rupee costs of this undertakinghave, of course, been provided by the group of friendly oountries throughthe Indus Fund. The costs of the proposed Tarbela project are also notincluded in thle Plan. The proposed Third Plan expenditures, together withprojected disbursements on the Indus Works are shown in Table 1 incomparison with corresponding expenditures and financing for the SecondPlan. Since no decision has been reached as to when and whether theTarbela project will be undertaken during the Third Plan, its costsand financing are not included in this table. These data do, howiever,include the Rural Works Program, which was treated as outside the SecondPlan but which has now been incorporated as an integral part of the ThirdPlan. Thus just over Rs. 55 billion (about $11.6 billion) would be spenton all development undertakings in Pakistan during thle Third Plan periodif Tarbela is excluded.
l/About Rs. 25,500 million of this was spent on the Second Plan itselfand about Rs. 800 million on the Rural Works program. Projectedexpenditures on the latter are included in the Third Plan.
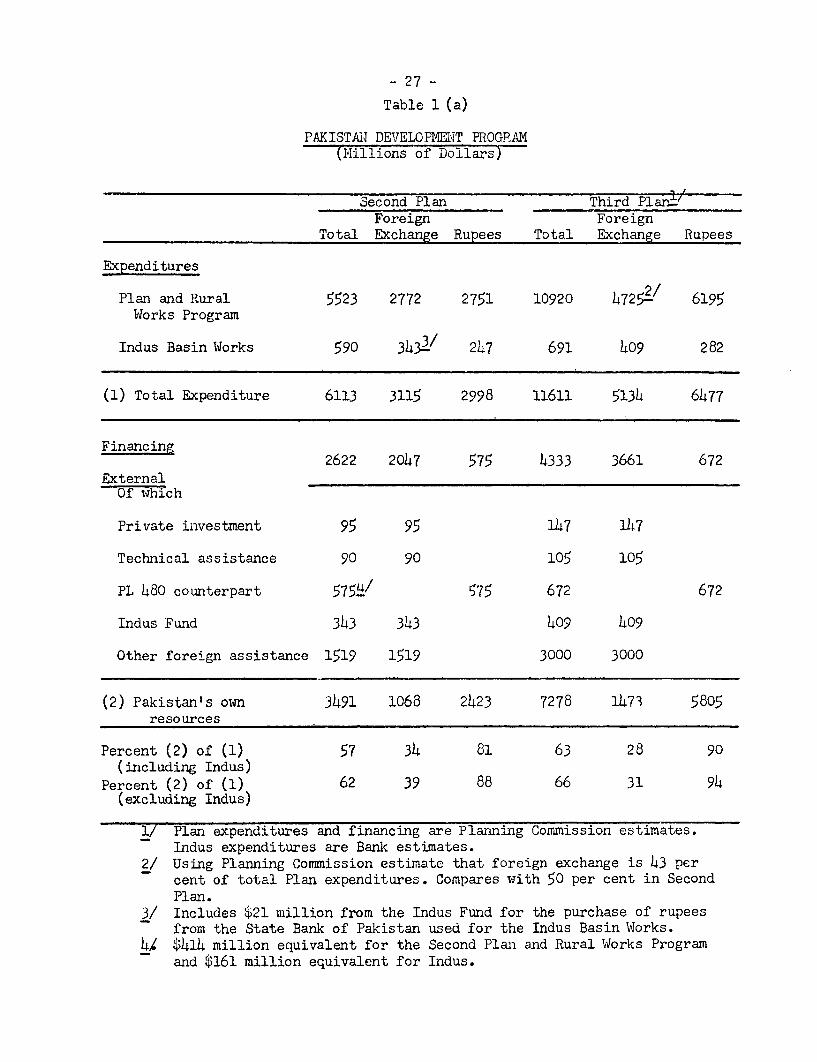
- 27 -
Table 1 (a)
PAKISTAII DEVELOPMKj\T PROGPAM(IMillions of Dollars)
Second Plan Third PlUi'Foreign Foreign
Total Exchange Rupees Total Exchange Rupees
Expenditures
Plan and Rural 5523 2772 2751 10920 47252' 6195Wiorks Program
Indus Basin Works 590 3433/ 247 691 409 282
(1) Total Expenditure 6113 3115 2998 11611 513k 6477
Financing2622 2047 575 4333 3661 672
ExternalOf which
Private investment 95 95 147 147
Technical assistance 90 90 105 105
PL 480 counterpart 5754/ 575 672 672
Tndus Fund 343 343 409 409
Other foreign assistance 1519 1519 3000 3000
(2) Pakistan's own 3491 1068 2423 7278 1473 5805resources
Percent (2) of (1) 57 34 81 63 28 90(including Indus)
Percent (2) of (1) 62 39 88 66 31 94(excluding Indus)
1/ Plan expenditures and financing are Planning Commission estimates.Indus expenditures are Bank estimates.
2/ Using Planning Commission estimate that foreign exchange is 43 percent of total Plan expenditures. Compares with 50 per cent in SecondPlan.
3/ Includes $21 million from the Indus Fund for the purchase of rupeesfrom the State Bank of Pakistan used for the Indus Basin Works.
V. $414 million equivalent for the Second Plan and Rural Works Programand $161 million equivalent for Indus.
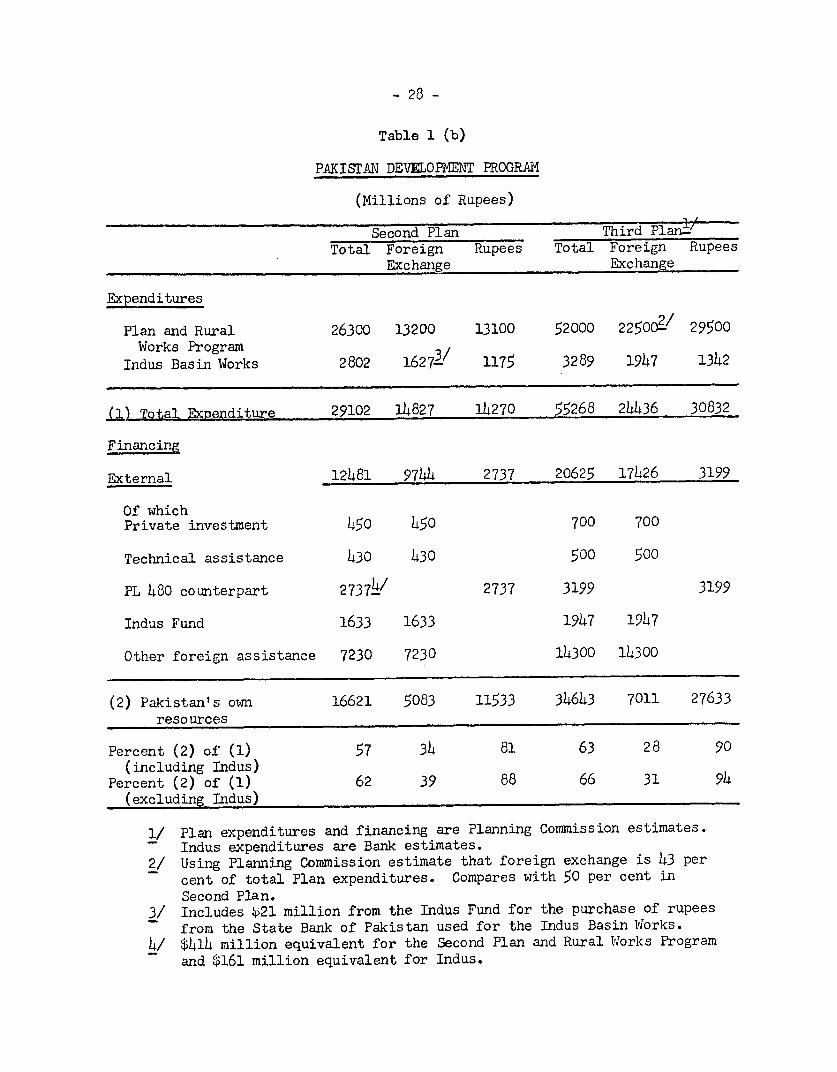
- 28 -
Table 1 (b)
PAKISTAN DEVELOPETNT PROGRA1M
(Millions of Rupees)
Second Plan Third Plan1 'Total Foreign Rupees Total Foreign Rupees
Exchange Exchange
Expenditures
Plan and Rural 26300 13200 13100 52000 225002/ 29500Works Program
Indus Basin Works 2802 16273/ 1175 3289 1947 1342
(1) Total Expenditure 29102 14827 14270 55268 24436 30832
Financing
External 12481 9744 2737 20625 17426 3199
Of whichPrivate investment 450 450 700 700
Technical assistance 430 430 500 500
PL 480 counterpart 27374/ 2737 3199 3199
Indus Fund 1633 1633 1947 1947
Other foreign assistance 7230 7230 14300 14300
(2) Pakistan's own 16621 5083 11533 34643 7011 27633resources
Percent (2) of (1) 57 34 81 63 28 90(including Indus)
Percent (2) of (1) 62 39 88 66 31 94(excluding ILdus)
1/ Plan expenditures and financing are Planning Commission estimates.- Indus expenditures are Bank estimates.2/ Using Planning Commission estimate that foreign exchange is 43 per
cent of total Plan expenditures. Compares with 50 per cent inSecond Plan.
3/ Includes %621 million from the Indus Fund for the purchase of rupeesfrom the State Bank of Pakistan used for the Indus Basin Works.
4/ $414 million equivalent for the Second Plan and Rural Works Programand $161 million equivalent for Indus.
- 29 -
87. In making comparisons between the two Plans, it must be bornein mird that during the Second Plan Palkistan had a rapidly acceleratingannual rate of development expenditures which increased about 156 per centbetween 1959/60 and 1964'65. As between the last year of the Second Planand 1969/70, the increase proposed is 68 per cent. Thus comparing theaggregates for the two Plans over-emphasizes the acceleration in spendingthat is involved. What is envisaged is a steadily increasing annual amountof development spending and foreign resource inputs during the Third Plan,with the former increasing about 11 per cent a year and the latter abouthalf that rate or 5.6 per cent annually.
88. Table 1 also shows the proposed sources of financing for thisdevelopment effort. Appendix Tables 31 and 32 give the expenditures andfinancing for the Plan and for the Indus undertaking separately. Thelatter would be entirely financed from external sources. On the foreignexchange side, the financing would be from the funds already committed bythe Indus Club, and on the rupee side from PL 480 counterpart.
89. The authors of the Plan contemplate that, despite the sharpincrease in investment envisaged, the mobilization of domestic resourcesthrough private and public savings would increase consideraby more thanthe increase in investment. During the Second Plan period, about 57 percent of total development outlays (including Indus) was raised internally.For the Third Plan period, this would be about 63 per cent. For the Planitself (excluding Indus) the Pakistan contribution i-s planned to be 66 percent as compared with about 62 per cent in the Second Plan. This willinvolve a marginal rate of domestic saving of 22 per cent as compared with21 per cent for the Second Plan
90. It will be observed from Table 1 that the direct and indirectforeign exchange component of the development program (including Indus)is e;xpected to decline from about 51 per cent in the Second Plan to 43 percent in the Third. This is based on an estimate of the Planning Commissionand seems to reflect expected import substitution in the capital equipmentfield. The mission feels that this assumption may be a little optiXiistic.However, the larger Rural Works Program during the Third Plan will makefor a somewhat lower foreign exchange component. During the Second Planabout 34 per cent of the foreign exchange costs of the Plan plus Indus wasmet from Pakistan's own foreign exchange earnings. This would decline to28 per cent for the Third Plan. Thus, although exports are expected toincrease at a rapid rate (9.5 per cent is forecast by the Government andabout 8 per cent by the Mission), the proportion of export earningsavailable after paying for consumer goods imorts and meeting debt serviceis not likely to increase quite as rapidly as gross investment.
Development Exoenditures as Compared with Investment
91. It is necessary to distinguish between Plan expenditures andthe total gross investment taking place in the economy. The latter is themore relevant for growth analysis. Plan expenditure includes a certainamount for development, but not strictly investment purposes. Ecpenseinvolved in the initial operation of public projects is an example. Thistype of outlay is estimated at about Rs. 4,600 million for the Third Plan,
- 30 -
roughly 9 per cent of total Plan expenditure. On the other hand, invest-ment in the non-monetized sector of the economy and inventory investmentare not included in the Plan. These two elements are estimated atRs. 3,950 million, roughly balancing the non-investment expenditures inthe Plan (see Table 2). However, there is no statistical basis fordetermining investment in the non-monetized sector and the amount includedis estimated by assuming that a small percentage (2%) of farm income isinvested in the non-monetary sector. Obviously any such estimate is a guess.2/
I/ By doing a census type survey of investment for 1962/63 and extrapolatingby treating investment in other years as a function of inputs of steel,cement, machinery and equipment, (using 1962/63 parameters) the PlanningCommission has estinated gross fixed investment in broad sectors forthe Second Plan. Using parameters derived from this analysis theinvestment output relationships proposed for the Third Plan have beenchecked for consistency with the overall and sectoral growth targetsusing input/output model projections. More detailed work with a largernumber of sectors is required but the results to date indicate a fairdegree of consistency in the Flan.
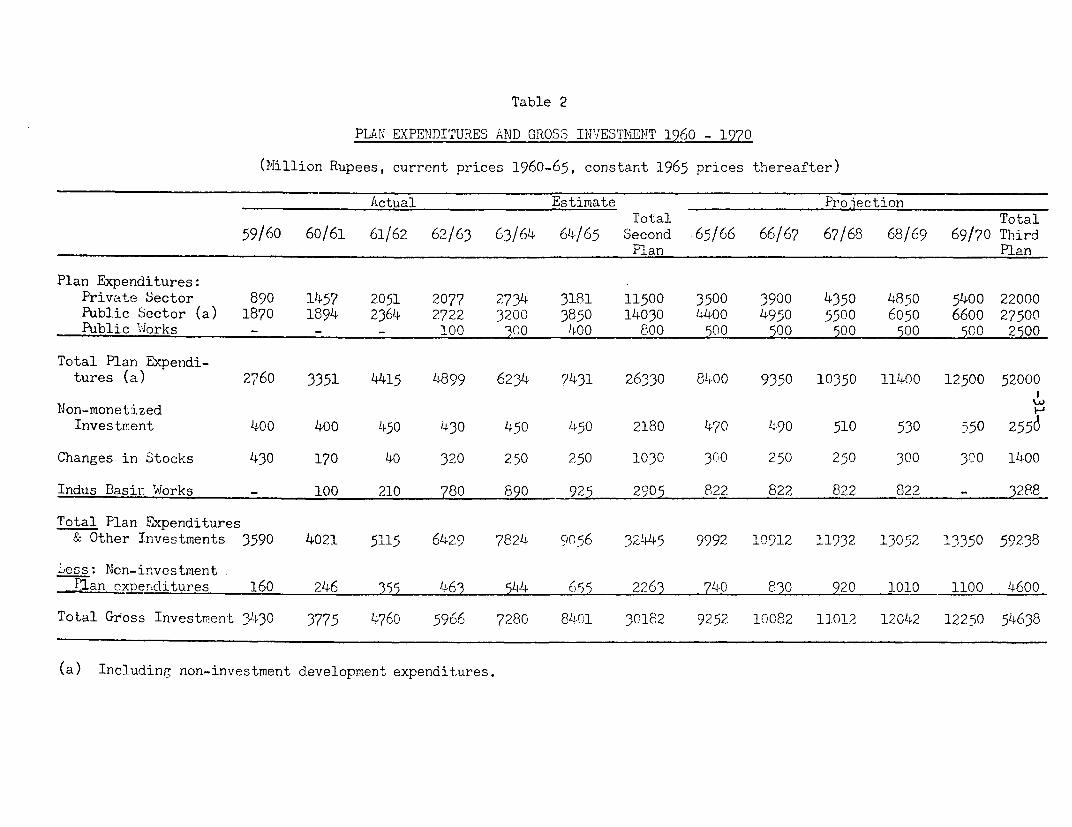
Table 2
PLAN EXPENDITURES AND GROSS INVESTMENT 1960 - 1970
(Mvlillion Rupees, current prices 1960-65, constant 1965 prices thereafter)
Actual Estimate ProjectionTotal Total
59/60 60/61 61/62 62/63 63/64 64/65 Second 65/66 66/67 67/68 68/69 69/70 ThirdPlan Plan
Plan Expenditures:Private Sector 890 1457 2051 2077 2734 3181 11500 3500 3900 4350 4850 5400 22000Public Sector (a) 1870 1894 2364 2722 3200 3850 14030 4400 4950 5500 6050 6600 27500Public Vlorks - - - 100 300 400 800 500 500 500 500 500 2500
Total Plan Expendi-tures (a) 2760 3351 4415 4899 6234 7431 26330 8400 9350 10350 11400 12500 52000
Non-monetizedInvestment 400 400 450 430 450 450 2180 470 490 510 530 550 2556
Changes in Stocks 430 170 40 320 250 250 1030 300 250 250 300 3°0 1400
Indus Basin Works - 100 210 780 890 925 2005 822 822 822 822 - 3288
Total Plan Expenditures& Other Investments 3590 4021 5115 6429 7824 9056 32445 9992 10912 11932 13052 13350 59238
,ess: Non-investmentPlan expenditures 160 246 355 463 5W4 655 2263 740 830 920 1010 1100 4600
Total Gross Investment 314130 3775 4760 5966 7280 8401 30182 9252 10082 11012 12042 12250 54638
(a) Including non-investment development expenditures.

- 32 -
Allocations as Between the Public and Private Sectors
92. Of the Rs. 52 billion of Third Plan expenditures, public sectorexpenditures (including the financing of private sector investment frompublic funds) are not to exceed Rs. 30 billion. For the Second Planpublic sector development outlays (including the Rural Works Programs isexpected to be about Rs. 14.8 billion out of Rs. 26.3 billion. The shareof the public sector would thus increase~ a little fi7om about 56 per centto 58 per cent as between the two Plans. Public development expenditureas a percentage of the total of such expenditures has been increasingsteadily over the last fifteen years, rising from only 29 per cent in1949/50 to 50 per cent in 1959/60 and to over 57 per cent in 1964/65.However, there is a considerable amount of public development expenditureused to finance private investment, and non-Plan investment (stocks andnon-monetized investment) is largely in the private sector. Taking accountof these factors the share of private investment in the total (excludingIndus) will probably not change much as between the two Plans. The shareof the public sector may rise a little because of the public sector industriesplanned for East Pakistan.
93. As in other mainly private enterprise economies, the Plan invest-ment targets for the public sector are more explicitly defined (in termsof sectors and projects) than is true of the private sector. The formeris an operationaI program while the latter is an "indicative" one, reflect-ing the plannerst conception of how private sector development shouldproceed. This is not to say that the Government is without means ofsteering private investment into lines it considers best for national growth.The sanctioning of industrial investment and the advancing or withholdingof Pakistan Industrial Bank and Agricultural Development Bank credit arethe most direct of these means. Import controls, tariffs and fiscal measuresare others, the first of which is gradually being supplanted by the secondand third. The export bonus scheme, inasmuch as it provides differentexport rates for different commodities and the program of providing taxrelief as incentive for new industries, are other means at the Government'scommand for encouraging or discouraging particular private investments.Recently in East Pakistan, the East Pakistan Industrial Development Corpora-tion arrangements for joint participation in the jute goods industry withthe private sector is another means used to influence the direction ofprivate investment.
Regional Allocation of Investment
9h. The Third Plan provides that about 54 per cent of public sectorand 52 per cent of total investment will be in East Pakistan. The invest-ment in public sector industries in the Eastern Province is expected toincrease threefold during the Third as compared with the Second Plan.During the last five years, a particular effort has been made to acceleratethe rate of development in East Pakistan and, according to the revisednational accounts estimates, the growth of per capita income from 1959/60to 1963/64 was 2.7 per cent per year in East Pakistan as compared withonly 2.4 per cent in the IJest. The same relationship obtained between thegrowth in GNP which, during the first four years of the Second Plan, averaged5.4 per cent in East Pakistan and 5.0 per cent in West Pakistan. In 1963/64
- 33 -
per capita income in West Pakistan was still 25 per cent higher thanin East Pakistan.
Growth Targ-et
95. The overall increase in real GNP now projected for the ThirdPlan is 37 per cent or 6.5 per cent a year compounded, about 13 per centa year larger than during the Second Plan. This target had just beenestablished when the Bank Mission left Pakistan. The previous one was30 per cent. The bench marks from which Third Plan growth will be measuredare the trend values for 1964/65 -1/
96. The raising of the sights was because recent improvements innational accounts estimates indicated that a higher rate of growth hadbeen achieved during the Second Plan than previously thought, with resultinghigher "bench marks" (1964/65) for savings, investment and other parametersof growth for the Third Plan. The higher rate of growth will, accordingto Pakistani estimates be, in a sense, self-generating, since it will evokehigher levels of domestic resource mobilization. On this basis the overalllevel of the Plan was raised from Rs. 45,500 billion to Rs. 52,000 billionwithout increasing the requirement for foreign assistance. The growthtargets for the productive sectors of the economy are shown in Table 3.The national accounts show a growth in the agricultural sector of 3.5 percent a year and in the rest of the economy of 7.1 per cent per annum during-the Second Flan, Broadly speaking, the growth strategy of the Third Planis to maintain this rate of increase in non-agricultural sectors and step-up the growth of the agricultural sector by 2 per cent, i.e. from 3.5 to5,0 per cent a year. This is an over-simplification, since the differentelements in the non-agricultural sector are calculated to grow at disparaterates. Obviously, also, the composition of Gross Domestic Product asbetween the agricultural and non-agricultural sectors will change as willthe composition of the non-agricultural part of production. As Table 3shows, the most striking change in the annual growth rates is in construc-tion, wshich is largely connected with the stimulus given to that sector bythe Indus Basin and Rural Works program during the Second Plan.
1/ Based on a ten-year least squares computation.
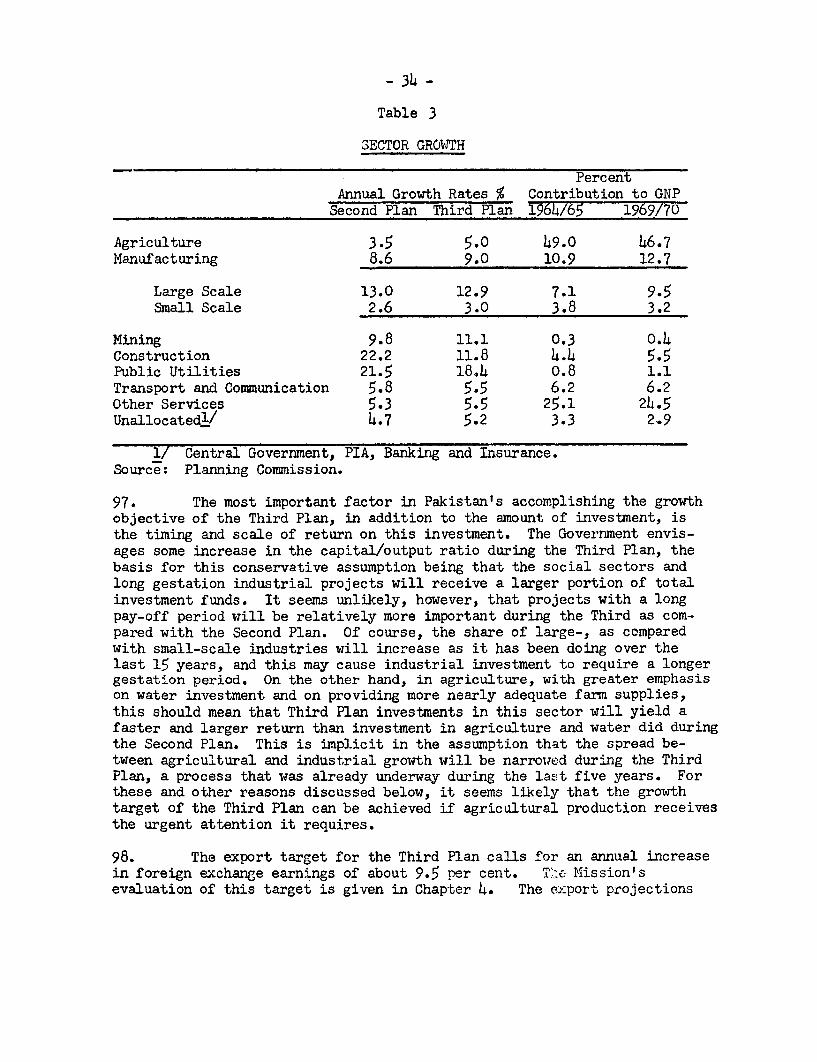
- 34 -
Table 3
SECTOR GROWTH
PercentAnnual Growth Rates % Contribution to GNP
Second Plan Third Plan 1964/65 1969/70
Agriculture 3.5 5.0 49.0 46.7lManufacturing 8.6 9.0 10.9 12.7
Large Scale 13.0 12.9 7.1 9.5Small Scale 2.6 3.0 3.8 3.2
Mining 9.8 11.1 0.3 0.4Construction 22.2 11.8 4.4 5.5Public Utilities 21.5 18.4 0.8 1.1Transport and Communication 5.8 5.5 6.2 6.2Other Services 5.3 5.5 25.1 24.5Unallocatedl/ 4.7 5.2 3.3 2.9
1/ Central Government, PIA, Banking and Insurance.Source: Planning Commission.
97. The most important factor in Pakistan's accomplishing the growthobjective of the Third Plan, in addition to the amount of investment, isthe timing and scale of return on this investment. The Government envis-ages some increase in the capital/output ratio during the Third Plan, thebasis for this conservative assumption being that the social sectors andlong gestation industrial projects will receive a larger portion of totalinvestment funds. It seems unlikely, however, that projects with a longpay-off period will be relatively more important during the Third as com-pared with the Second Plan. Of course, the share of large-, as comparedwith small-scale industries will increase as it has been doing over thelast 15 years, and this may cause industrial investment to require a longergestation period. On the other hand, in agriculture, with greater emphasison water investment and on providing more nearly adequate farm supplies,this should mean that Third Plan investments in this sector will yield afaster and larger return than investment in agriculture and water did duringthe Second Plan. This is implicit in the assumption that the spread be-tween agricultural and industrial growth will be narrowed during the ThirdPlan, a process that was already underway during the last five years. Forthese and other reasons discussed below, it seems likely that the growthtarget of the Third Plan can be achieved if agricultural production receivesthe urgent attention it requires.
98. The export target for the Third Plan calls for an annual increasein foreign exchange earnings of about 9.5 per cent. T e Mission'sevaluation of this target is given in Chap-ter 4. The export projections
- 35 -
will involve further important shifts in their composition away from agri-cultural raw materials towards manufactured products. The agriculturalcomponent of exports has already declined from 90 per cent in 1951/52 toabout 52 per cent in 1964/65, largely because of the growth of the textileindustry. As indicated above, the expansion of exports during the ThirdPlan is expected to reduce gross foreign capital requirements from about9 to 8.2 per cent of GNP.
99. The principal indicators that Pakistan is moving towards self-sufficiency during the Third Plan are that the ratio of the increase inimports to increase in GNP (marginal import rate) is expected to declinefrom 15.5 per cent in 1965/66 to 12.1 per cent in 1969/70 and the factthat the relative increase in capital requirements measured by the capi-tal/output ratio (assumed as about 2.8 per cent) times the growth rate(6.5 per cent) is about 18, or lower than the projected marginal rate ofsaving of 23 to 24 per cent. This means that the resource gap at theassumed growth rate should narrow in relation to investment, and laterabsolutely. Other supporting evidence is that exports should increasefaster than imports by a fair margin (8.1 as compared with 7.2 per centper annum).
100. The growth in population estimated at between 2.6 and 3 per centper annum is being tackled by increased emphasis on family planning duringthe Third Plan. The Mission is not optimistic about the near-term resultsand, however successful, the program will not affect the size of the laborforce during the next 15 years or so. However, it seems probable that therate of increase of capital stock during the Third Plan will be consider-ably greater than the increase in the labor force, so that productivityper worker should continue to rise even after tacing into account someincrease in the capital/output ratio.
Points of Emphasis in the Third Plan
101. The principal objectives of the Third Plan may be summarized asfollows: (1) to increase the rate of economic growth of the economy byabout 1 per cent per annum as compared with the Second Plan; (2) toaccomplish this primarily by increasing the mobilization of domestic re-sources, and thus reduce the resource gap as a percentage of total invest-ment; (3) bring about a more balanced growth in the economy by increasingthe rate of growth of agricultural output byl.5 per cent a year and bydirecting a larger share of industrial investment towards capital goodsindustries; this will require a sharp increase in the proportion of totalindustrial investment that is channeled through the public sector parti-cularly in East Pakistan; (4) increase exports in relation to GNP; and(5) narrow the discrepancy between per capita income in the two Provinces.
102. Aside from financial limitations, the principal constraintsduring the Third Plan are likely to be (1) the required regional divisionof investment; (2) social welfare objectives which may (in the short-runat least) run somewhat counter to optimum savings and return on investment;(3) lack of basic and technical education; and (4) public administration.
CHAPrER 3
DOMESrIC RESOURCES FOR THE PLAN
103. This chapter will consider the feasibility of mobilizing theamount of domestic resources which the Planning Comission conlsiders willbe necessary to carry out the Plan. In the concluding chapter we willdiscuss the overall investment target for the economy as a whole, itsimplications for domestic consumption, and the external assistance thatappears necessary to achieve the growth target of 6.5 per cent a year.
104. Two considerations are paramount in assessing the feasibility ofmobilizing Rs. 35,500 million of domestic financial resources for develop-ment during the Third Plan: First, the economy's capacity to generate therequired levels of income and savings; second, the prospect of transferringan adequate proportion of the savinr into private and public developmentexpenditure. With the economy growing during the Second Plan at 5.2 percent a year in constant prices, it was possible to mobilize over Rs. 16,000million (Table 1, Chapter 2) of domestic resources for development purposesas the average rate of domestic savings increased from about 6.5 to 10.5per cent of the gross domestic product. Under the assumptions of foreignassistance in the Third Plan frame, the domestic financial resources re-quired would mean the average savings rate would have to be raised toaround 14 per cent of the gross domestic product. This implies that alittle more than a fifth of the total additional income generated wouldbe saved.
105. During the-SecondL Plan, the Mission estimates that the marginalsavings rate was, about 21 per cent and the Third Plan calls for it to in-crease only to 22 per cet, assuming, of course, that the planned economicgrowth actually oceurs.-.
106. While the increase appears modest, to expect an economy with percapita GNP of around $80 to save nearly a quarter of any addition shows aconsiderable confidence in the willingness of the people to undergo aus-terity and of the Goverrment to adopt strong measures.
107. The Planners pointed out, however, that, owing to the higherlevels of per capita income during the Third Plan than in the Second, theper capita marginal rate of saving could decline from about 33 per centto 28 per cent. On a per capita basis, proportionately less of the addi-tional1 income would be required to be saved, thus imposing relativelyless austerity on the nation.
1/ One percentage point addition to the marginal rate of savings meansover Rs. 1.7 billion of additional domestic resources for the Plan.
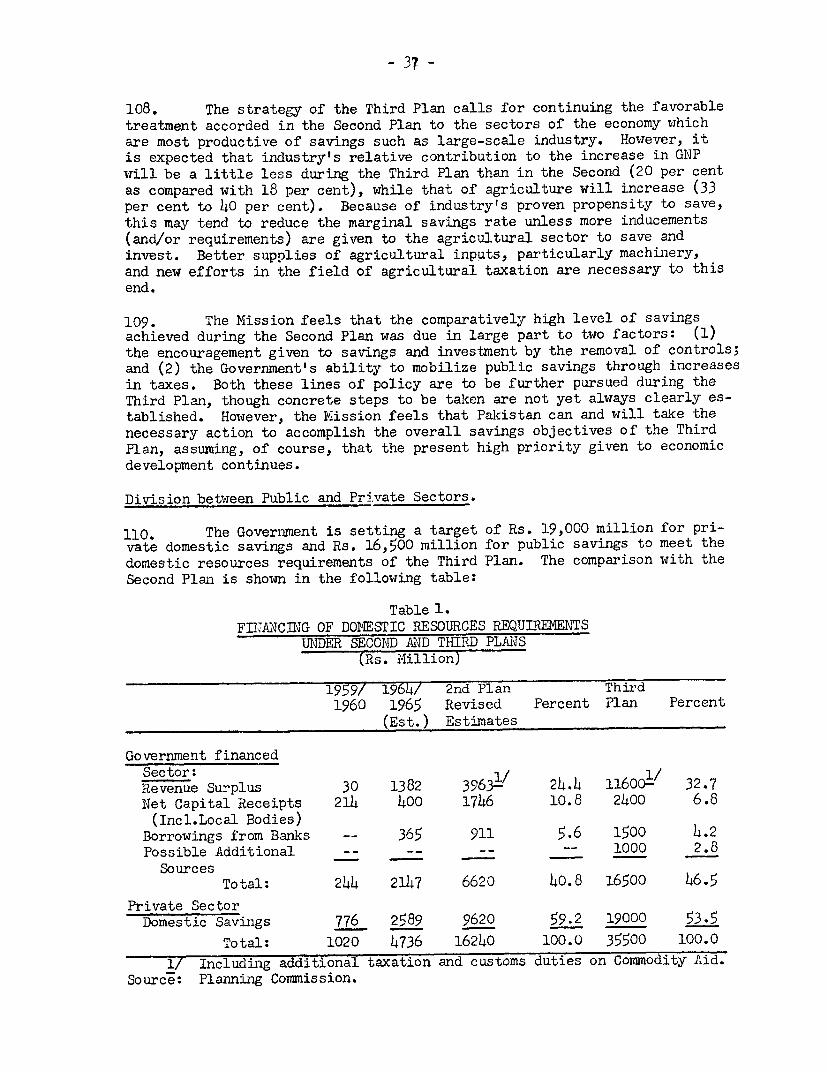
- 37 -
108. The strategy of the Third Plan calls for continuing the favorabletreatment accorded in the Second Plan to the sectors of the economy whichare most productive of savings such as large-scale industry. However, itis expected that industry's relative contribution to the increase in GNPwill be a little less during the Third Plan than in the Second (20 per centas compared with 18 per cent), while that of agriculture will increase (33per cent to 40 per cent). Because of industry's proven propensity to save,this may tend to reduce the marginal savings rate unless more inducements(and/or requirements) are given to the agricultural sector to save andinvest. Better supplies of agricultural inputs, particularly machinery,and new efforts in the field of agricultural taxation are necessary to thisend.
109. The Mission feels that the comparatively high level of savingsachieved during the Second Plan was due in large part to two factors: (1)the encouragement given to savings and investment by the removal of controls;and (2) the Government's ability to mobilize public savings through increasesin taxes. Both these lines of policy are to be further pursued during theThird Plan, though concrete steps to be taken are not yet always clearly es-tablished. Howiever, the Mission feels that Pakistan can and will take thenecessary action to accomplish the overall savings objectives of the ThirdPlan, assuming, of course, that the present high priority given to economicdevelopment continues.
Division between Public and Private Sectors.
110. The Goverlnment is setting a target of Rs. 19,000 million for pri-vate domestic savings and Rs. 16,500 million for public savings to meet thedomestic resources requirements of the Third Plan. The comparison with theSecond Plani is shown in the following table:
Table 1.FEIANCING OF DOMESTIC RESOURCES REQUIREMENTS
UNDER SECOND AND THIRD PLANS(Rs. Million)
1959/ 1964L/ 2nd Plan Third1960 1965 Revised Percent Plan Percent
(Est.) Estimates
Government financedSector: 1 1/Revenue Surplus 30 1382 3963Y- 24.4 11600- 32.7Net Capital Receipts 214 400 1746 10.8 2400 6.8(Incl.Local Bodies)
Borrowings from Banks -- 365 911 5.6 1500 4.2Possible Additional 1000 2.8
SourcesTotal: 244 2147 6620 40.8 16500 46.5
Private SectorDomestic Savings 776 2589 9620 59.2 19000 53.5
Total: 1020 4736 16240 100.0 35500 100.01/ Includinlg additional taxation and customs duties on Commodity Aid.
Source: Planning Commission.
- 38 -
i11. Thus the Third Plan will involve a considerably larger transferof development resources from the private to the public sector in propor-tion to total domestic savings than the Second Plan. At the same time,domestic savings retained for investment in the private sector would haveto be approximately doubled.
112. Private Sector. The assumption that this larger transfer of financialresources to the Government is compatible with the private investment targetdepends on private economic activity continuing to pick up momentum. Therise in domestic private savings flowing into fixed monetized investmentfrom about Rs. 800 million in 1959/60 to around Rs. 2,600 miliion in 1964/65is remarkable. A further increase to Rs. 3,000-h,000 million by 1969/70appears feasible. Domestic private investment of this magnitude is dependentupon continued fiscal incentives favorable for investment and other positivefactors influencing the investment climate. The recent trade liberalizationshould be one of such incentives.
113. The Plan contains only very rough estimates of the specific sourcesof the Rs. 19 billion of private development funds. The Goverrimeiit estimatesthat self-financing and reinvestment of profits will contribute Rs. 10 bil-lion, bank credit expansion Rs. 6 billion and net issues on the capitalmarket Rs. 3 billion. The Rs. 6 billion of bank credit expansion includescredit advanced by specialized government corporations (except PICIC, whichprovides foreign loans). The contributions from these sources in the SecondPlan are estimated at Rs. 4.5 billion, Rs. 4 billion and Rs. 1.12 billion,respectively. Thus self-financing and issues on the capital market are ex-pected to increase by about 120 per cent and 168 per cent respectively, whilebank credit expansion would increase by 50 per cent. Tne bank credit expan-sion seems compatible with monetary stability but perlaps not if the publicsector also requires substantial deficit financing. Experience during theSecond Plan indicates that the other targets may be attainable. The overallprivate savings target would involve a private sector marginal savings rateof about 10 per cent of GNP, the same as that achieved during the Second Plan.
114. The bulk of the private savings is expected to come from the indus-trial sector through reinvested earnings, new capital issues and other formsof self-financing. This, of course, is the fastest growing part of theeconomy. Self-financing of investment in the agricultural sector, stimulatedby price incentives and other measures, and self-financing in housing areexpected to increase significantly. In particular, the Government is lookingfor a spurt in private investment in East Pakistan in response to fiscalincentives, distribution of foreign loans through PICIC and IDBP and througha modified industrial investment schedule.
115. Given the amount of credit expansion proposed, the savings andinvestment targets for the private sector may be reached. However, thiswill mean a continuance of austerity in consumption and wages during thePlan period.
- 39 -
116. Public Sector. In the Mission's view, securing sufficient domesticresources to finance the public sector program will present a more seriousproblem because of the relatively larger portion of total domestic savingsdestined for the public sector, the lack, at present, of a firm programfor securing all the necessary revenues, and the greater commitment of theGovernment to the public sector program because of the nature of the plan-ning and plan implementation processes in Pakistan. As noted above, thepublic program is "operational", whereas the private program is "indica-tive".
117. The Government estimates that the consolidated revenues of theCentral and Provincial Governments on the basis of a 37 per cent growthrate will increase by approximately two-thirds. It is also expected thatnon-development expenditures will increase more slowly than revenues,rising by 36 per cent from Rs. 16.7 billion to about Rs. 22.8 billion.Excluding debt servicing and recurring expenditures of the developmentdepartments, the increase in administrative expenditure (including de-fence) has been about 6 per cent a year and the comparable figure for theThird Plan is under 3 per cent. The resulting revenue surplus, which isthe principal item of government domestic development financing, is esti-mated at Rs. 11.6 billion or about triple the Second Plan volume ofRs. 3.96 billion (including returns from new taxes and increases in rates).The returns from additional taxation, a key element in the forecast, aretentatively set by the Planning Commission at Rs. 3.0 billion, pendingthe report of a high level Commission on Taxation and Tariffs, appointedby the National Economic Council both for this purpose and to recommendimprovements in tax administration and in the tariff structure.l/
118. The net proceeds of the capital transactions of the Central andProvincial Governments, including the local authorities, are estimated atRs. 2.4 billion and compare with about Rs. 1.7 billion raised during thefive years ending 1964/65. Gross receipts in this category are estimatedat almost Rs. 900 million above the Second Plan but a third of this in-crease will be utilized for meeting the increased liability on account offoreign loan repayments.
119. To obtain one billion of the remainder of Rs. 2.5 billion ofdomestic resources required for the government-financed development pro-gram, it is planned to transfer private resources to the public sector byassociating more private investment with public corporations, particularlythe PIDC's. The remaining Rs. 1.5 billion would be obtained by means of
1/ The Commission on Taxation and Tariff was appointed on March 23, 1964,to study taxation measures which could be taken at Central, Provincialand local levels for mobilizing additionalresources for the Third Plan;to study the working of tax collection machinery at Central and Pro-vincial levels; and to review and make recommendations for rationaliz-ing the existing tariff structure. It lhas not yet reported.
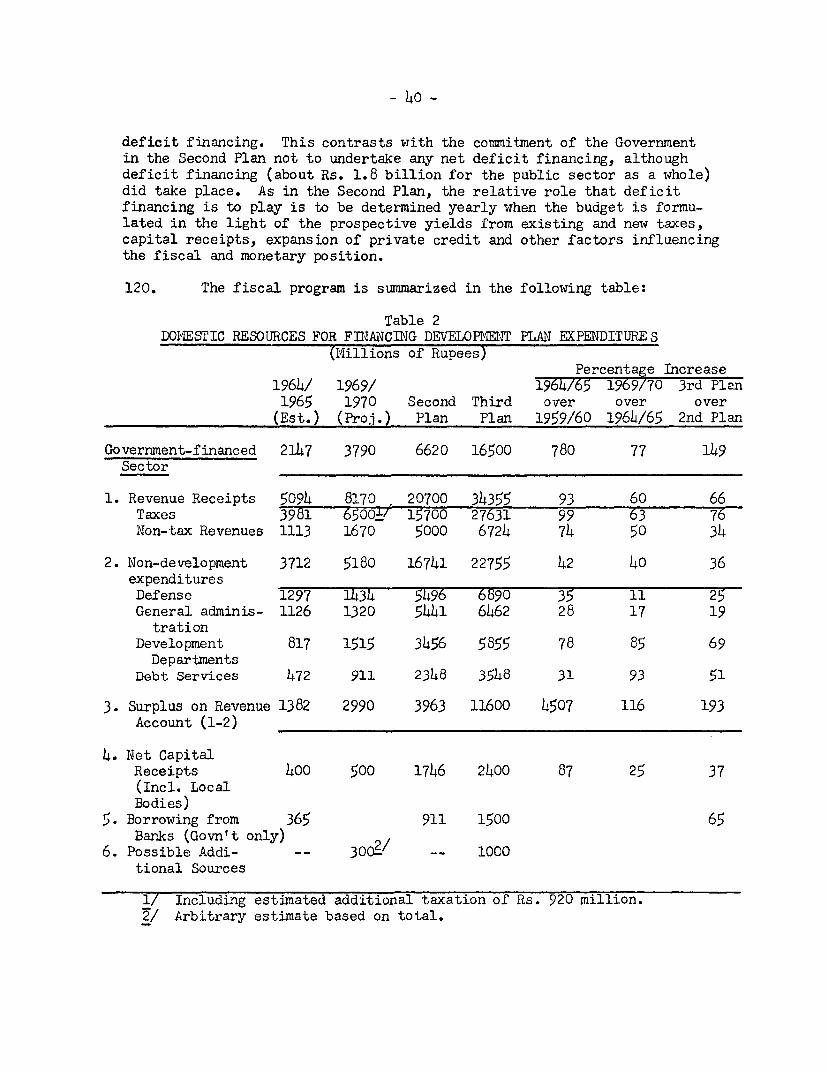
- 40 -
deficit financing. This contrasts with the commitment of the Governmentin the Second Plan not to undertake any net deficit financing, althoughdeficit financing (about Rs. 1.8 billion for the public sector as a whole)did take place. As in the Second Plan, the relative role that deficitfinancing is to play is to be determined yearly when the budget is formu-lated in the light of the prospective yields from existing and new taxes,capital receipts, expansion of private credit and other factors influencingthe fiscal and monetary position.
120. The fiscal program is summarized in the following table:
Table 2DOKESTIC RESOURCES FOR FINANCIlNG DEVELOP12NT PLAN EXPENDITURES
(Millions of Rupees)Percentage Increase
1964/ 1969/ 1964/65 1969/70 3rd Plan1965 1970 Second Third over over over
(Est.) (Proj.) Plan Plan 1959/60 1964/65 2nd Plan
Government-financed 2147 3790 6620 16500 780 77 149Sector
1. Revenue Receipts 5094 8170 20700 34355 93 60 66Taxes 3981 6500'/ 15700 27631 99 63 76Non-tax Revenues 1113 1670 5000 6724 74 50 34
2. Non-development 3712 5180 16741 22755 42 40 36expendituresDefense 1297 1434 5496 6690 35 11 25General adminis- 1126 1320 5441 6462 28 17 19
trationDevelopment 817 1515 3456 5855 78 85 69Departments
Debt Services 472 911 2348 3548 31 93 51
3. Surplus on Revenue 1382 2990 3963 11600 4507 116 193Account (1-2)
4. Net CapitalReceipts 400 500 1746 2400 87 25 37(Incl. LocalBodies)
5. Borrowing from 365 911 1500 65Banks (Govn't only)
6. Possible Addi- -- 30-- 1000tional Sources
1/ Including estimated additional taxation of Rs. 920 million.2/ Arbitrary estimate based on total.
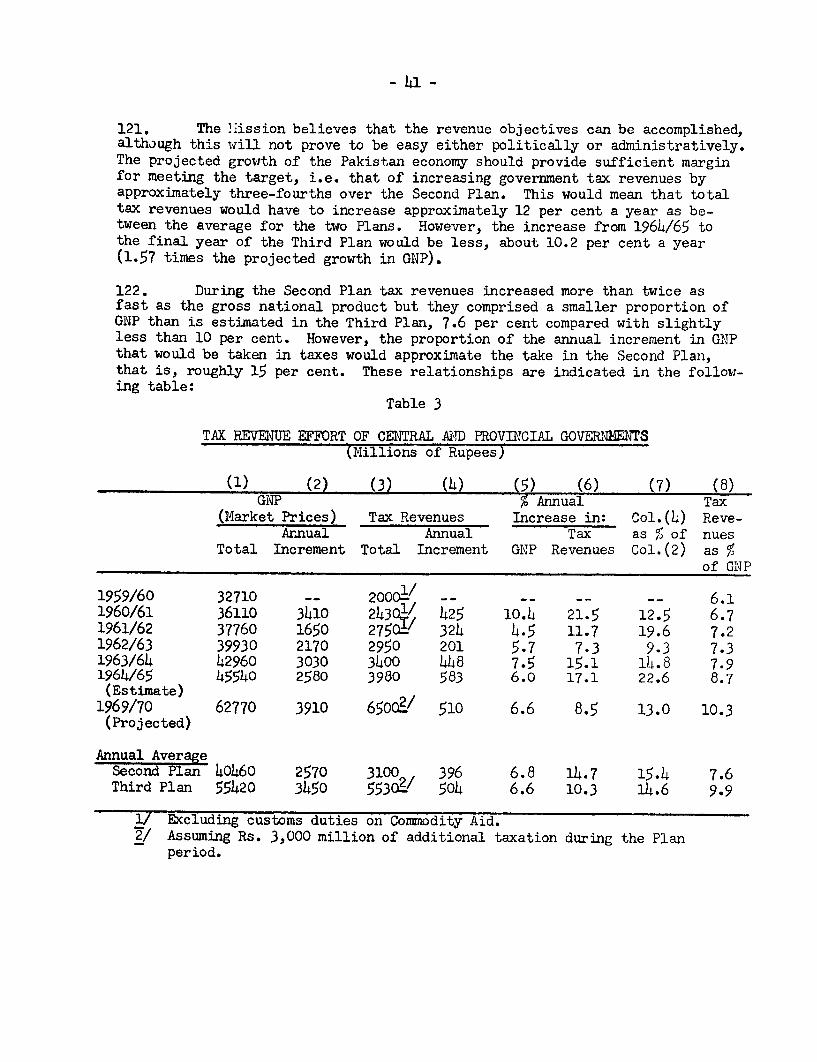
- 41 -
121. The liission believes that the revenue objectives can be accomplished,although this will not prove to be easy either politically or administratively.The projected growth of the Pakistan economy should provide sufficient marginfor meeting the target, i.e. that of increasing government tax revenues byapproximately three-fourths over the Second Plan. This would mean that totaltax revenues would have to increase approximately 12 per cent a year as be-tween the average for the two Plans. However, the increase from 1964/65 tothe final year of the Third Plan would be less, about 10.2 per cent a year(1.57 times the projected growth in GNP).
122. During the Second Plan tax revenues increased more than twice asfast as the gross national product but they comprised a smaller proportion ofGNP than is estimated in the Third Plan, 7.6 per cent compared with slightlyless than 10 per cent. However, the proportion of the annual increment in GNPthat would be taken in taxes would approximate the take in the Second Plan,that is, roughly 15 per cent. These relationships are indicated in the follow-ing table:
Table 3
TAX REVENlUE EFFORT OF CENTRAL ATD PROVINCIAL GOVEILNkNTS(Millions of Rupees)
(1) (2) (3) (4) (5) (6) (7) (8)GNP % Annual Tax
(Market Prices) Tax Revenues Increase in: Col.(4) Reve-Annual Annual Tax as a of nues
Total Increment Total Increment GNP Revenues Col.(2) as %of GNP
1959/60 32710 __ 2000./ - _ __ 6.11960/61 36110 3410 2430 / 425 10.4 21.5 12.5 6.71961/62 37760 1650 2750/ 324 4.5 11.7 19.6 7.21962/63 39930 2170 2950 201 5.7 7.3 9.3 7.31963/64 42960 3030 3400 bL8 7.5 15.1 1h.8 7.91964/65 45540 2580 3980 583 6.o 17.1 22.6 8.7(Estimate)
1969/70 62770 3910 6500Q/ 510 6.6 8.5 13.0 10.3(Projected)
Annual AverageSecond Plan 40460 2570 3100 396 6.8 14.7 15.4 7.6Third Plan 55420 3450 5538/ 504 6.6 10.3 14.6 9.9
1/ Excluding customs duties on Commodity Aid.2/ Assuming Rs. 3,000 million of additional taxation during the Plan
period.
- 42 -
123. Further discussion of Pakistan's tax system, changes in recentyears and an analysis of the bases for the projections is in Annexes 8and9.
124. Non-tax revenues are expected to yield about Rs. 6.7 billioncompared with Rs. 5.0 billion in the Second Plan. The nearly two-foldgain in non-tax receipts from Rs. 640 million in 1959/60 to an estimatedRs. 1,113 million in 1964/65 might suggest that the Third Plan projectionof a 34 per cent increase by 1969/70 is too modest. It implies that non-tax receipts would be laggirg a little behind the growth of the economy.However, this conclusion of under-estimation may not be warranted. Debtservices (i.e., interest receipts primarily on loans from the CentralGovernment to the Provincial Governments and on loans extended by thelatter to municipalities, railways and public corporations) were theprincipal source of non-tax revenues in the Second Plan and are expectedto maintain this position in the Third Plan. This source of revenue isnot likely to increase rapidly. With new post offices opening, postaland telephone and telegraph traffic expanding, and expansion of the tele-communication system, net receipts from these sources are expected rough-ly to double in volume. Receipts from other sources (i.e., fines, fees,forfeitures, and collections for services rendered by General Administra-tion and Beneficient Departments, irrigation receipts, Currency and Mintreceipts, revenues from sale of timber and other forest receipts, "extra-ordinary" receipts, etc.) are pro-ected at their estimated 1964/65 levelsor at slowly rising trends.1
125. The projections of non-development spending in the Third Planimply that there iiill be no necessity for large increases in defense out-lays. They also iaiply that it will be possible to keep the averageannual increase in administration expenses at approximately 3 per cent.The Second Plan experience strongly suggests that the Central and Pro-vincial Governments may be unable to raaintain non-development expendi-tures at these rates.
126. A deceleration in the upvard trend in ordinary civilian expeindi-tures from an average rate in the Second Plan of roughly v per cent peryear to an average rate in the Third Plan of about 3Uz per cent is hardly tobe expected. This wJould imply no significant salary adjustments during the
1/ In the case of net irrigation receipts in lWlest Pakistan and receiptsfrom Civil Administration and Beneficient Departments in East Pakistan,the levels are below those achieved in the Second Plan. However, netreceipts other than interest receipts, posts and telegraphs and currencyand mint would in aggregate increase approximately 35 per cent over theSecond Plan volume. Government enterprises such as posts and telegraphsare pushing up rates and tariffs and it may be possible to transfer someof the additional income to Government; raising fees, fines, etc. couldalso provide opportunities for augmenting non-revenue receipts.
- 43 -
next five years. The non-development expenditures of the developmentdepartments are expected to increase by approximately 85 per cent duringthe next five years compared with roughly 78 per cent during the SecondPlan. In viewy of the prospective expansion of capital outlays in theThird Plan, there is a danger that the current expenditures requiredby the old aind nei capital investments may be much larger than presentlyenvisaged.
127. Miost of the outlays will fall on provincial budgets. The non-development expenditures of the Provincial Governments have escalatedsharply with the widening of their administrative responsibilities underthe new 1962 Constitution and increased expenditures of development depart-ments and debt services in both Wings. In the three years ending in June1965, not counting debt services, they will have grown by approximately athird in West Pakistan and by a fourth in East Pakistan. On a comparablebasis the projections for the next five years indicate an even more rapidgrowth, averaging about 15 per cent per year in the West and 13 per centper year in the East. Even if these rates of increase are sharply reduced,unless new sources of provincial tax revenues are located and effectivemeasures are taken to increase non-tax revenues much more rapidly thanestimated, the small but dwindling revenue surplus of the ProvincialGovernments, made possible by tax sharing with the Center, will disappear.The Provincial Goverrments would then be turning increasingly to the Centerfor more tax sharing and grants to finance current expenditures, drainingthese funds away from development uses. The findings and recommendationsof the Financial Commission in respect to the taxes to be reserved for theCenter, the possibilities of transferring certain taxes to the Provinces,the tax-sharing formulas, etc., will be reflected in the Third Plan asfinally written.
128. In summary, it seems likely that the non-development expendituresare understated by perhaps 5 per cent and that the revenue surplus in theThird Plan on this account might turn out to be around Rs. 1.0 billionsmaller than visualized.
129. The Third Plan projection of Rs. 2,400 million of net capitalreceipts, including contributions from local bodies, should not be toodifficult to attain considering the experience during the Second Plan andthe magnitude of domestic savings envisaged during the next five years.Savings mobilized in this form are expected to rise moderately from anestimated level of Rs. 400 million in 1964/65 to about Rs. 500 million ayear in the Third Plan. If the ratio of net capital receipts to grossdomestic savings achieved during the past five years could be maintainedduring 1965/66-1969/70, net capital receipts would easily exceed Rs. 3,400million, or Rs. 1 billion larger than projected. This would offset theprobable under-estimation of current expenditures, but of course it iscontingent upon efforts to mobilize small savings and sell governmentassets to the private sector.
- 44 -
130. The Government regards its projections of revenue surplus and netcapital receipts as conservative and sees the possibility that domestic re-source mobilization through these means may be larger. However, if actualdomestic and foreign resources fall short of the Rs. 30,000 million ceilingestablished on the implementation of the public sector program, the Govern-ment sees several possible choices ahead. One, which the Mission stronglysupports, is to look to private enterprise to take on some of the under-takings presently reserved for the public sector. This might be done ona joint venture basis (see Annex 3 ). Revising the pricing policies ofpublic enterprises to realize some profits is another possibility. Thepricing policies of the public enterprises should be re-examined with aview to enabling them to carry more of the burden of their future expansionout of their own resources.
131. Finally, the Government would rely on deficit financing tenta-tively estimated at Rs. 1,500 million, which it regards as consistent withthe likely demand for money and credit needs of the private sector duringthe Third Plan. The Mission does not favor this as a planned developmentresource. The private sector is likely to require all the credit expansioncompatible with monetary stability. The Government would be well advisedto seek all possible financing of the development program through non-expan-sionary means rather than commit itself to deficit financing for 9 per centof its required domestic resources.
Conclusion.
132. The Mission feels that the overall savings target of the ThirdPlan may be achieved. However, the problems connected with transferringsufficient funds to the public sector, so that 46 per cent of total domes-tic development financialresources are used for government-financed projects,are formidable and some have not yet been resolved. This is evident perhapsin the Government's reliance on deficit financing and other uncertainsources of funds to make up 15 per cent or so of public sector domesticresources. The Mission does not predict that no funds from these sourcescan or should prudently be used. However, in one way or another, theirmobilization or use will affect the scale of investment possible in theprivate sector. This, together with the uncertainties surrounding thePL 480 program alluded to in the next chapter, leads to the conclusionthat about Rs 2.5 billion of the domestic resources counted on for the pub-lic sector program may not be forthcoming without impinging on the privatesector program. This shortfall might be increased to about Rs. 3 billionif the Tarbela project is undertaken fairly early in the Third Plan period.
CHAPTER 4
EXTERNAL RESOURCES
133. The gap between the proposed Plan expenditure of Rs. 52 billionand the domestic resource projection of Rs. 35.5 billion discussed in thepreceding chapter would be met by an inflow of foreign resources ofRs. 16.5 billion ($3,465 million) which is the gross foreign assistancerequirement estimated for the Plan. In addition, to complete the IndusBasin Works, which would be financed with foreign resources, an estimateddisbursement of about Rs. 3 billion will be required.
134. If the proposed Tarbela project is undertaken early in the Planperiod, an additional requirement for foreign resources of perhaps aboutRs. 2 billion would be involved. Thus, Pakistan's total resources gapduring the Third Plan, assuming the postulated mobilization of domesticresources would be between Rs. 19.5 billion ($4,095 million) and Rs. 21.5billion ($4,515 million) depending upon whether and when the Tarbelaproject is undertaken.
135. In table 1, chapter 2, which excludes Tarbela, externalfinancing is given as Rs. 20,625 million and internal as Rs. 34,643million for the Plan and Indus. The reason for the difference be-tween these amounts and the Rs. 19,500 million external and Rs. 35,500million internal resources referred to above is that the Third Planpostulates Rs. 2,200 million of PL 480 counterpart to be used for theIndus Basin Works and Rs. 1,000 million for the Plan. These amountshave been included as external resources in the table in Chapter 1.However, according to present estimates, the Indus Basin Works, exclud-ing Tarbela will only require about Rs. 1,340 million during the ThirdPlan. Thus there would be Rs. 860 million for other purposes, and inthe aforementioned table this is reflected in a reduction of Pakistaniresources from Rs. 35,500 million to about Rs. 34,640 million. IfTarbela is undertaken early in the Third Plan,between Rs. 600 millionand Rs. 1,000 million would probably be required for its rupee financing.In this event, the rupee requirements for Indus and Tarbela could beapproximately covered from PL 4o80 counterpart, if PL 480 supplies comeup to the Planning Commission's estimates and Rs. 35,500 million ofdomestic resources are generated for the Plan.
136. The Mission finds it very difficult at this stage to estimatePL 480 absorption. The Planning Commission estimate would involve anincrease of about $150 million or $30 million (23 per cent) a year overthe Second Plan. In the face of the target increase in domestic agri-cultural production of 5 per cent a year (substantially more for food-grain production) to also postulate an increase in the absorption ofPL 480 supplies implies a substantial increase either in per capitadomestic food consumption or in exports of agricultural products orboth. An increase in the former may well occur, but the export positionis uncertain because of PL 480 policies in respect of the export ofagricultural products (mainly rice) while Pakistan is receiving PL 480
- 46 -
wheat. In our own estimates of Pakistan's official capital requirements(table 1, chapter 6), we have assumed PL 480 counterpart of $10 million ayear less than the Planning Commission's estimates. If the problem withU.S. authorities is resolved satisfactorily, the generation of aboutRs. 2,500 million of PL 480 counterpart during the Third Plan may befeasible. This wouild be about Rs. 500 million short of the amount re-quired for Indus, Tarbela and the Planoi/ However, the uncertainty of thesituation counsels a conservative evaluation of the domestic resources forthe Third Plan as mentioned in chapter 3.
137. Apart from the Rs. 1 billion of PL 480 counterpart, Rs. 15.5billion ($3,255 million) of other foreign resources would be required forthe Plan. Of this, about Rs. 700 million ($147 million) might be met fromnet private foreign investment and Rs. 500 million ($105 million) fromtechnical assistance. This would have Rs. 14.3 billion ($3,000 million)to be met from project and non-project loans and grants.
138. The Planning Commission has estimated that Rs. 22.5 billion($4,725 million) of development imports (capital equipment and materialsto make capital equipment plus technical assistance) will be required forthe Plan itself. The Kission believes this estimate is reasonable thoughperhaps a little conservative. Deducting for private investment and tech-nical assistance receipts anticipated, this would leave about $4,473million of development imports to be covered from the above-mentioned$3,000 million of foreign aid and about $1,473 million of Pakistan'sforeign exchange earnings. The rest of this chapter will examine whetherPakistan's export prospects are sufficiently promising to finance thisflow of development imports together with the requirements for non-devel-opment imports and foreign debt service.
139. The following table summarizes the balance of payments for theSecond Plan and for the Third Plan as estimated by the Government.
1/ If started in 1966 the Tarbela project would involve disbursementstotalling about $350 million up to June 30, 1970, according toestimates of the Bank Group. About $225 million of this would bein foreign exchange and $125 million equivalent (roughly Rs. 600million) in rupees. At the end of the Second Plan, the undisbursedcommitments for the Indus project should be about $600 million.There is no firm basis at present for calculating the final cost ofthe Basin Works, but barring events that might increase such costs,the residual left for Tarbela is estimated at between $165 millionand $230 million. $275 million to $340 million additional in foreignexchange would be required up to 1976 for the completion of theproject.
The rupee costs of Tarbela during the Third Plan are, of course,small in relation to the rupees the Government hopes to raise for thepublic sector for the Plan and the rupee costs of the Indus BasinWorks which total about Rs. 18 billion. Rupee requirements forTarbela would be between 3 and 4 per cent of this amount.
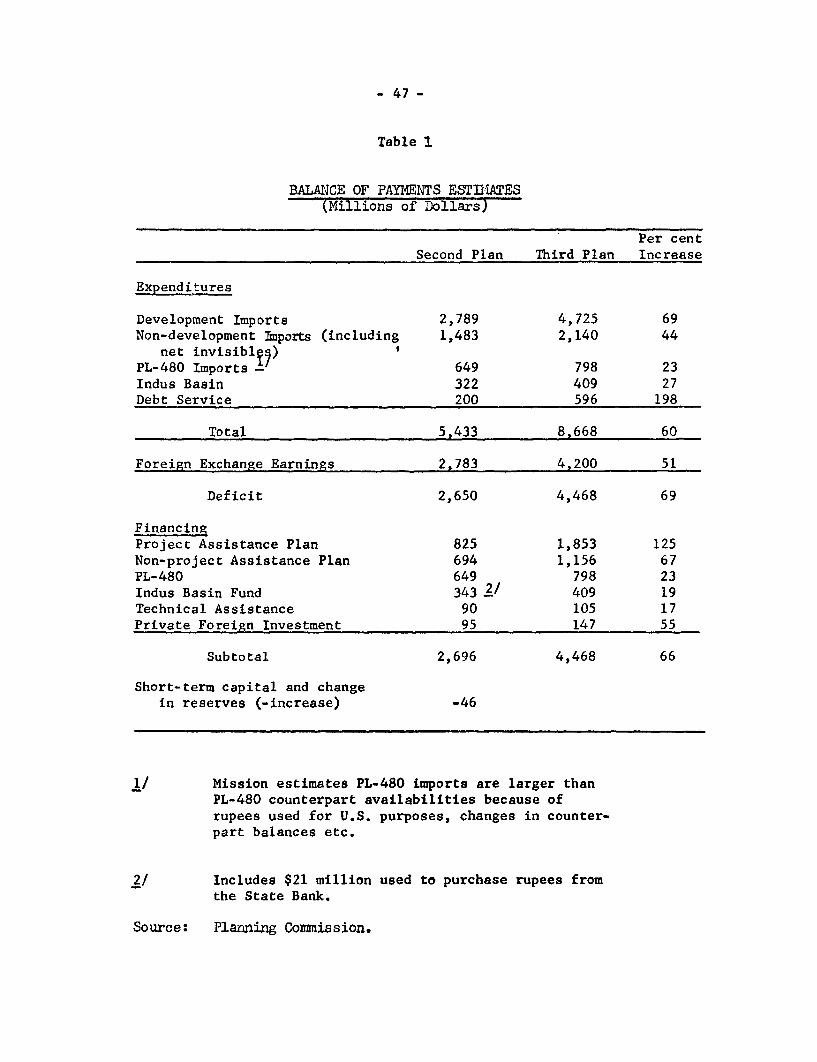
- 47 -
Table 1
BAIXCE OF PAYIDNTS ESTl:iATES(Millions of Dollars)
Per centSecond Plan Third Plan Increase
Expenditures
Development Imports 2,789 4,725 69Non-development Imports (including 1,483 2,140 44
net invisiblT)PL-480 Imports - 649 798 23Indus Basin 322 409 27Debt Service 200 596 198
Total 5,433 8,668 60
Foreign Exchange Earnings 2,783 4,200 51
Deficit 2,650 4,468 69
FinancingProject Assistance Plan 825 1,853 125Non-project Assistance Plan 694 1,156 67PL-480 649 798 23Indus Basin Fund 343 2/ 409 19Technical Assistance 90 105 17Private Foreign Investment 95 147 55
Subtotal 2,696 4,468 66
Short-term capital and changein reserves (-increase) -46
1/ Mission estimates PL-480 imports are larger thanPL-480 counterpart availabilities because ofrupees used for U.S. purposes, changes in counter-part balances etc.
2/ Includes $21 million used to purchase rupees fromthe State Bank.
Source: Planning Commission.
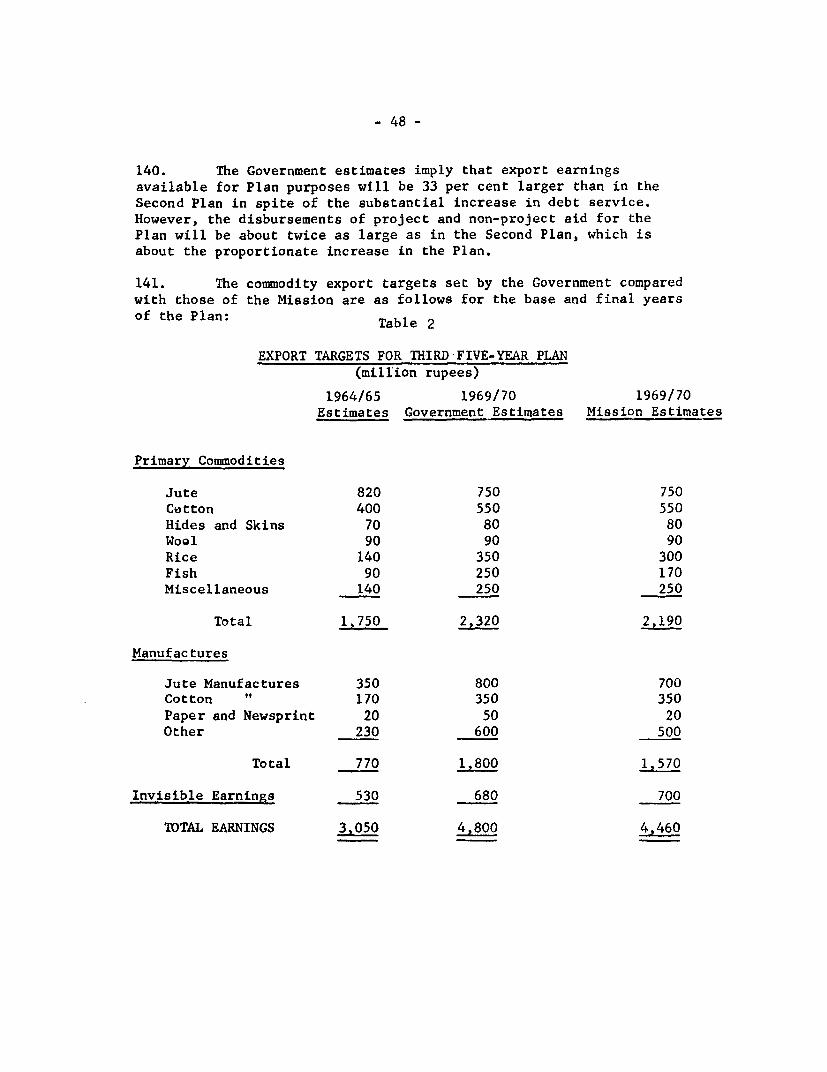
- 48 -
140. The Government estimates imply that export earningsavailable for Plan purposes will be 33 per cent larger than in theSecond Plan in spite of the substantial increase in debt service.However, the disbursements of project and non-project aid for thePlan will be about twice as large as in the Second Plan, which isabout the proportionate increase in the Plan.
141. The commodity export targets set by the Government comparedwith those of the Mission are as follows for the base and final yearsof the Plan: Table 2
EXPORT TARGETS FOR THIRD FIVE-YEAR PLAN(million rupees)
1964/65 1969/70 1969/70Estimates Government Estimates Mission Estimates
Primary Commodities
Jute 820 750 750Cotton 400 550 550Hides and Skins 70 80 80Wool 90 90 90Rice 140 350 300Fish 90 250 170Miscellaneous 140 250 250
Total 1,750 2,320 2,190
Manufactures
Jute Manufactures 350 800 700Cotton " 170 350 350Paper and Newsprint 20 50 20Other 230 600 500
Total 770 1,80 1,570
Invisible Earnings 530 680 700
TOTAL EARNINGS 3,050 4,800 4,460
- 49 -
Exports
142. Our more detailed comments on Pakistan's export targetsare in Annex 1 . Only general comments on some of the principalitems are given below. About 88% of Pakistan's present merchandiseexports are what may be called traditional exports, namely, primarycommodities and textile goods made from jute and cotton. Thesubstantial acceleration of export earnings in recent years hadincreased this proportion slightly from what it was at the beginningof the Second Plan. The increases have been predominantly in rawcotton and rice. The future outloek is for the maintenance of thepresent pattern, with the major shift occurring in the case of juteand cotton from the raw fibers to fabrics. Products of other lightindustries are expected to increase faster than overall exports, buttheir share in the total is unlikely to grow by more than a fewpercentage points.
143. On the supply side, the overall growth targets for exportsbetween 1964/65 and 1969/70, and prospects of their being achieved,are therefore very largely a function of agricultural development.As pointed out in the next chapter, prospects in the next five yearsare particularly good for agricultural production in West Pakistan,owing to the presently very favorable relation between yields andadditional inputs of fertilizer and irrigation water. Cotton. finerice, and miscellaneous primary commodities are produced almostentirely in West Pakistan. The mission believes that the Governmentis right in setting ambitious targets for the export of these items,and thinks that it is reasonable to expect that their combined earn-ings could increase from a present level of PRs.680 million to aboutPRs.l,100 million in 1969/70, or by over 60%. The most importantsingle commodity, however, is raw jute, accounting for over one-fourthof total export earnings. Here the scope for increased productionis less bright, and with drastic expansion of use by domestic mills itis expeoted that export earnings from raw; jute will decline somewhat.
144. The target for both jute and cotton manufactures is atleast to double the present value of exports, which of course impliesnot only a large effort by industry by also in the supply of thefibers. While there is hardly any doubt about the availability ofcotton in the volume proposed for both export and mill consumption,the same cannot be said for jute. Although the potential foragricultural development in East Pakistan is very large if viewed fromthe purely technical angle, with the high fertility of the soil and therelatively low cost of lift irrigation water, structural and adminis-trative problems at the present stage make it difficult to achieve anearly breakthrough. Jute production has in fact been stationary over
the last five years; a major effort as well as a considerable amountof ingenuity for the improvement of production and marketing will bea precondition for meeting the proposed requirements of both exportand mill consumption. To achieve the export target for cotton tex-tiles, it will be necessary to reduce the attractions of the homemarket relative to exports, thus inducing manufactures to lowerexport prices.
145. While the targets for the major raw materials, althoughconspicuously high, appear on the whole to be capable of achievement,the Mission has serious doubts in the case of fish about the realismof increasing exports by over 150 per cent from a present level ofRs. 90 million. Similar doubts exist with regard to the new targetfor miscellaneous manufactures.
146. On the demand side, Pakistan is not a typical country witha "commodity problem". The largest single export item -- raw jute --today accounts for not more than 27 per cent of all earnings and itsforeign markets, although not growing fast, are relatively stable bycomparison with sugar or coffee. And the next largest item, raw cotton,is a relatively safe bet because of Pakistan's small share in worldexports; furthermore, whatever may happen to those two comnodities, itwill not happen at the same time. On other export items, Pakistan iseven more a marginal supplier than for cotton.
1h7. Pakistan's problem lies more in her terms of trade whichhave long been declining because of the predominance of raw materialexports, and they are not likely to improve significantly during theThird Plan. Whatever gains may be made in export prices of rawmaterials can be offset by rising import prices.
148. However, there is not much choice for Pakistan's exportstrategy. To maximize earnings, raw material exports have to be pro-moted along with the policy of diversification. Clearly, however,exports of manufactures have to be expanded as fast as quality con-siderations permit. The Mission endorses the objective of doublingthem in five years, even though this implies some sacrifice to domesticconsumers. During the Second Plan, about 13 per cent of the incrementin the value added by manufacturing industries was exported; during theThird Plan, this ratio should go up to 18 per cent, which means that,with the same rate of growth in output, there will be a slower growthof domestic consumption.
149. Pakistan's industry is young but has shown some signs ofvigor. For those industries which have a profitable home market,strong incentives are needed to activate their export capability.Others, like the jute industry, have been most effective in promot-ing their sales abroad. This is a hopeful sign; the strategy in theThird Plan is to diversify exports by adding more manufactured goodsto the existing range. Still, at this early stage, products of
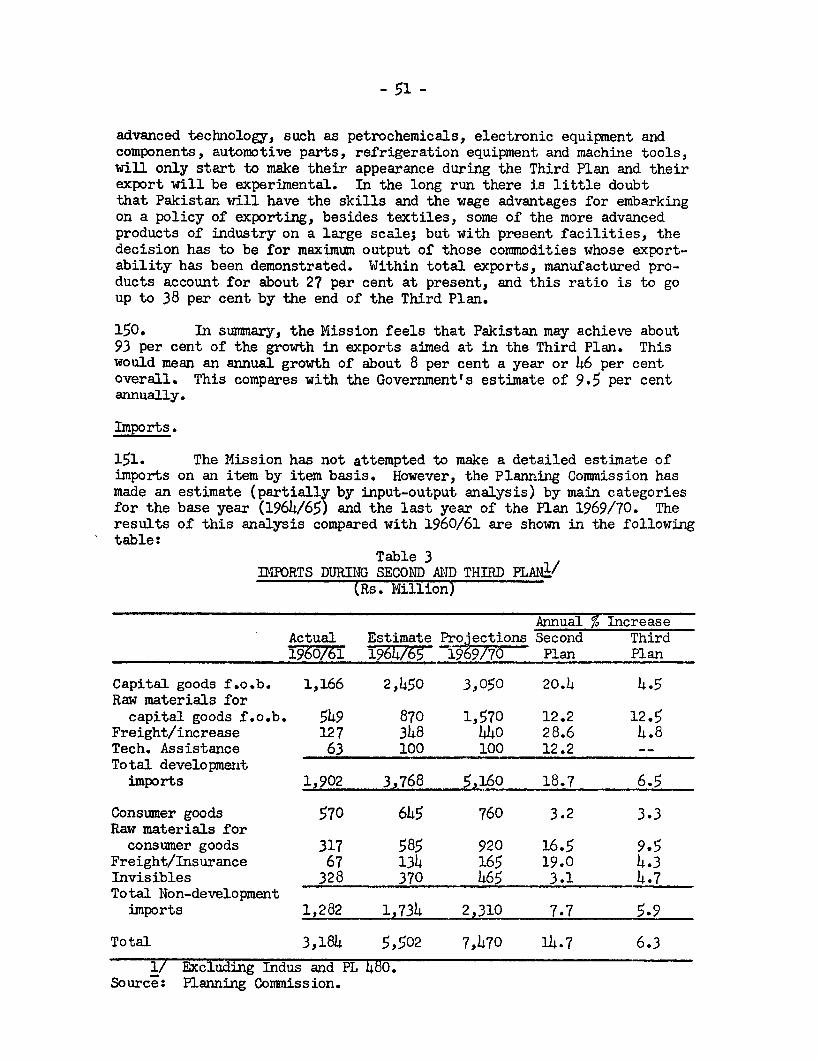
- 51 -
advanced technology, such as petrochemicals, electronic equipment andcomponents, automotive parts, refrigeration equipment and machine tools,will only start to make their appearance during the Third Plan and theirexport will be experimental. In the long run there is little doubtthat Pakistan will have the skills and the wage advantages for embarkingon a policy of exporting, besides textiles, some of the more advancedproducts of industry on a large scale; but with present facilities, thedecision has to be for maximum output of those commodities whose export-ability has been demonstrated. Within total exports, manufactured pro-ducts account for about 27 per cent at present, and this ratio is to goup to 38 per cent by the end of the Third Plan.
150. In summary, the Mission feels that Pakistan may achieve about93 per cent of the growth in exports aimed at in the Third Plan. Thiswould mean an annual growth of about 8 per cent a year or 46 per centoverall. This compares with the Government's estimate of 9.5 per centannually.
Imports.
151. The Mission has not attempted to make a detailed estimate ofimports on an item by item basis. However, the Planning Commission hasmade an estimate (partially by input-output analysis) by main categoriesfor the base year (1964/65) and the last year of the Plan 1969/70. Theresults of this analysis compared with 1960/61 are shown in the followingtable:
Table 3ISflORTS DURING SECOND AND THIRD PLAN_'
(Rs. Million)
Annual % IncreaseActual Estimate Projections Second Third1960/61 1964/76 1969/70 Plan Plan
Capital goods f.o.b. 1,166 2,450 3,050 20.4 4.5Raw materials for
capital goods f.o.b. 549 870 1,570 12.2 12.5Freight/increase 127 348 440 28.6 4.8Tech. Assistance 63 100 100 12.2 --Total development
imports 1,902 3,768 5,160 18.7 6.5
Consumer goods 570 645 760 3.2 3.3Raw materials for
consumer goods 317 585 920 16.5 9.5Freight/Insurance 67 134 165 19.0 4.3Invisibles 328 370 465 3.1 4.7Total Non-development
imports 1,282 1,734 2,310 7.7 5.9
Total 3,184 5,502 7,470 14.7 6.3
1/ Excluding Indus and PL 480.Source: Planning Commission.
- 52 -
152. Using the results for these two years, imports for the Planas a whole were estimated as shown in table 1 above. The total importrequirement (excluding debt service) would be Rs. 38,815 million. TheMission made an independent estimate of import requirements by sub-tracting gross domestic savings from gross investment and adding thedifference (the internal resources gap) to our projection of exports.As is shown in table 1, chapter 6, our total was Rs. 39,769 million.We then checked our derived imports against estimated year-to-year finaldemand (exports plus investment plus consumption) and found that theimport dependency ratio was fairly stable (in fact rising slightly) ascompared with the last years of the Second Plan (see table 1, chapter 6).
153. The most striking change as between the annual increase inimports during the Second and Third Plans (see table 1 above) is in theimports of capital goods.
154. In the absence of import substitution, the Plan requirements forimported capital goods would increase very substantially in the next fiveyears. During the Second Plan period, the increase in capital goods im-ports was in pace with the increase in Plan expenditures (excluding worksprogram), namely 20.5 per cent per year. The average annual increase inthese expenditures during the next five years is expected to be 11.2 percent. If imports of capital goods would keep in the same relation, theywould reach Rs. 4s170 million by 1969-70. The Planning Commission pro-jects a figure of only Rs. 3,050 million implying an annual increase of4.5 per cent. This is in line with the emphasis on capital goods indus-tries in the industrial sector of the Third Plan. The projected growthrate for the latter is 10.6 per cent per annum while it is only 7.9 percent per annum for consumer goods output. The implication of this forthe balance of payments is that import substitution will be primarily inthe intermediary and capital goods fields. The remaining scope forimport substitution of an economical kind is small in consumer goods.
155. Not the whole explanation for the relatively slower growth ofcapital goods imports is on account of direct import substitution; infact the change in the physical mix of sectoral investments from theSecond to the Third Plan (A greater proportional share fo education,health, rural works and social investment within the total Plan -- seenext chapter) results in a greater proportional use of the country's ownphysical resources for over-all investment. It is not possible at thisstage to quantify this effect. The Planning Commission assumes that theforeign exchange component of the Third Plan will be 43.3 per cent asagainst 50.5 per cent for the Second; this takes account of both importsubstitution and the change in investment patterns. A third element,the increase in non-investment outlays in the Third Plan (a large partin the form of subsidies and free supply of Government services to agri-culture) has only a negligible effect on imports, since they grow inabout the same proportion as total Plan expenditures. The projectionsof imports imply that the combined effect of these factors in the caseof capital goods imports is a reduction of import requirements in 1969/70
- 53 -
by Rs. 1,120 million. As a consequence the ratio of capital goods imports(f.o.b.) to total development expenditures would decrease from about 33 percent in the Second Plan to 27 per cent during the Third Plan period (seetable 4 below). Direct import substitution of capital goods is projectedto be Rs. 322 million, which would leave about Rs. 800 million to be ac-counted for by the change in the Plan composition in favor of investmentswith a lower import component. This indirect substitution effect wouldseem to be quite large and the Mission feels that it may be somewhat over-stated. Of course, if imports of capital goods are larger than anticipated,requirements for materials to produce capital goods domestically would bereduced, although not in proportion.
156. In the field of intermediary manufactured goods, the scope aswell as the need for import substitution is considerably larger than incapital goods industries. Some substitution should also be expected infreight charges through substnatial investment presently contemplated forshipping. But this is likely to be partly or wholly offset by the struc-tural change in industrial output. Consumers goods industries which pro-duce the greater part of manufacturing output have so far relied heavilyon domestic raw materials (cotton, jute, food), and their import componentis only about 16 per cent. Capital goods and intermediary goods indus-tries which are to grow considerably faster during the Third Plan, have torely on imported raw materials to the extent of about 47 per cent; and thispercentage is likely to grow even higher because of the higher quality oftheir inputs. The existing foundries and rerolling mills, importing pigiron and billets, have a higher ratio of domestic value added to the valueof output than the proposed heavy electrical machinery plants or themachine tool factories, importing high grade steel alloys, aluminum andcopper.
157. Detailed enough material is not available for the Mission tomake an accurate estimate of these factors. The Planning Commission., whileprojecting a five-year increase in total industrial production of 52.3 percent, calculated an increase in the requirement of raw material importsconsiderably larger, namely, by 71.1 per cent. This wJould mean that evenafter assuming some import substitution in intermediary products, the netadditional foreign exchange cost attributable to industry's growing importdependence would be as much as Rs. 274 million in the last year of theThird Plan. This compares with a saving of Rs. 322 million through importsubstitution of investment goods. Although the Mission thinks that thebasic considerations underlying these projections are correct, there wouldseem to be some ground for expecting an overall net import substitution alittle larger than Rs. 48 million.
158. The import dependence of Plan investment would appear to be some-what under-estimated for the Third Plan, particularly if the rates ofincrease in table 3 above are compared, where development imports are ex-pected to increase by just 6.5 per cent per year, compared with 18.7 percent during the Second Plan. This is, however, somewhat misleadingbecause of the delays in foreign aid disbursements during the early years,resulting in a rapid increase in subsequent years.
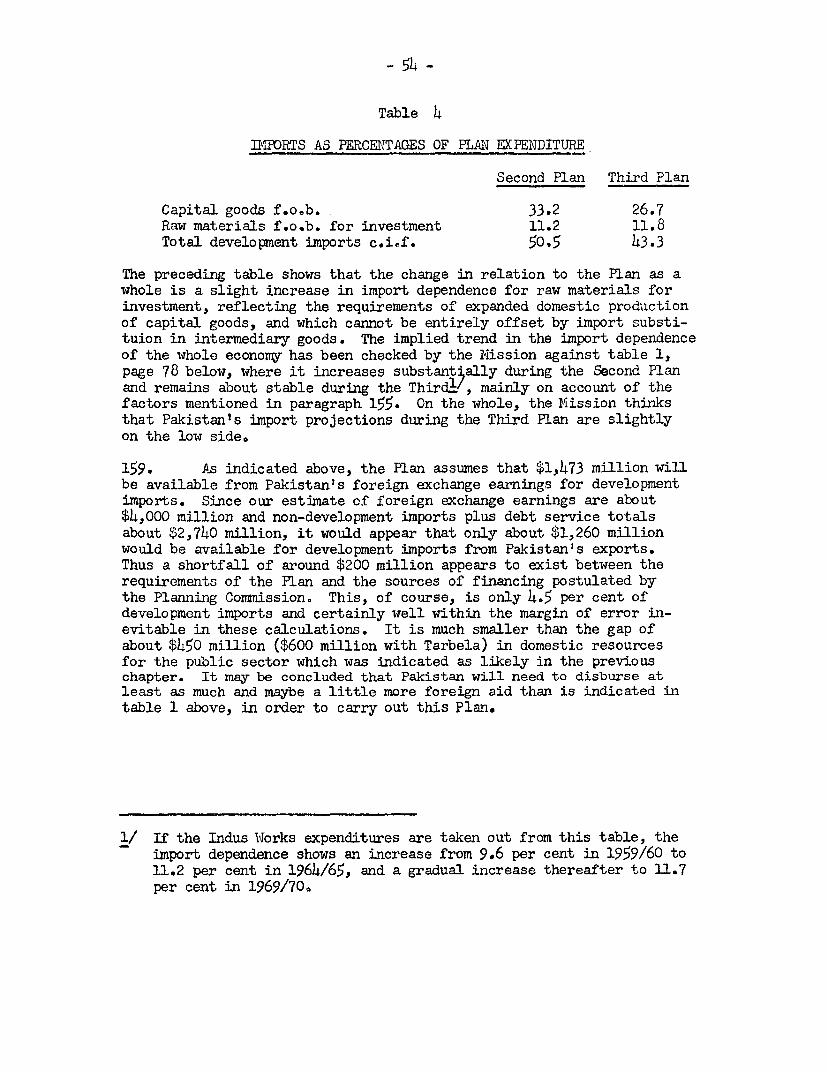
Table 4
IMIORTS AS PERCENTAGES OF PIAN EXPENDITURE
Second Plan Third Plan
Capital goods f.o.b. 33.2 26.7Raw materials f.o.b. for investment 11.2 11.8Total development imports c.i.f. 50.5 43.3
The preceding table shows that the change in relation to the Plan as awhole is a slight increase in import dependence for raw materials forinvestment, reflecting the requirements of expanded domestic productionof capital goods, and which cannot be entirely offset by import substi-tuion in intermediary goods. The implied trend in the import dependenceof the whole economy has been checked by the Mission against table 1,page 78 below, where it increases substant ally during the Second Planand remains about stable during the Thirdl!, mainly on account of thefactors mentioned in paragraph 155. On the whole, the Mission thinksthat Pakistan's import projections during the Third Plan are slightlyon the low side.
159. As indicated above, the Plan assumes that $14,473 million willbe available from Pakistan's foreign exchange earnings for developmentimports. Since our estimate of foreign exchange earnings are about$4,000 million and non-development imports plus debt service totalsabout $2,740 million, it would appear that only about $1,260 millionwould be available for development imports from Pakistan's exports.Thus a shortfall of around $200 million appears to exist between therequirements of the Plan and the sources of financing postulated bythe Planning Commission. This, of course, is only 4.5 per cent ofdevelopment imports and certainly well within the margin of error in-evitable in these calculations. It is much smaller than the gap ofabout $450 million ($600 million with Tarbela) in domestic resourcesfor the public sector which was indicated as likely in the previouschapter. It may be concluded that Pakistan will need to disburse atleast as much and maybe a little more foreign aid than is indicated intable 1 above, in order to carry out this Plan.
1/ If the Indus lWorks expenditures are taken out from this table, theimport dependence shows an increase from 9.6 per cent in 1959/60 to11.2 per cent in 1964/65, and a gradual increase thereafter to 11.7per cent in 1969/70.
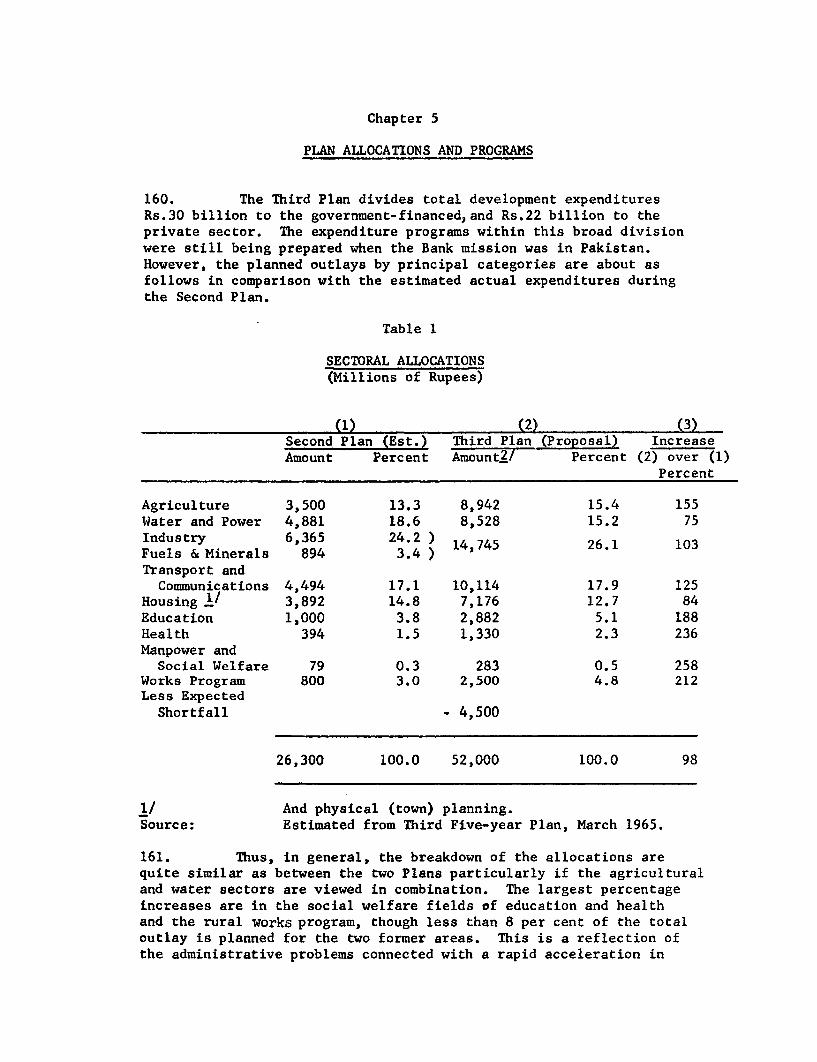
Chapter 5
PLAN ALLOCATIONS AND PROGRAMS
160. The Third Plan divides total development expendituresRs.30 billion to the government-financed, and Rs.22 billion to theprivate sector. The expenditure programs within this broad divisionwere still being prepared when the Bank mission was in Pakistan.However, the planned outlays by principal categories are about asfollows in comparison with the estimated actual expenditures duringthe Second Plan.
Table 1
SECTORAL ALLOCATIONS(Millions of Rupees)
(1) (2) (3)Second Plan (Est.) Third Plan (Proposal) IncreaseAmount Percent Amount2/ Percent (2) over (1)
Percent
Agriculture 3,500 13.3 8,942 15.4 155Water and Power 4,881 18.6 8,528 15.2 75Industry 6,365 24.2 ) 14,745 26.1 103Fuels & Minerals 894 3.4 )Transport andCommunications 4,494 17.1 10,114 17.9 125
Housing I/ 3,892 14.8 7,176 12.7 84Education 1,000 3.8 2,882 5.1 188Health 394 1.5 1,330 2.3 236Manpower and
Social Welfare 79 0.3 283 0.5 258Works Program 800 3.0 2,500 4.8 212Less Expected
Shortfall - 4,500
26,300 100.0 52,000 100.0 98
1/ And physical (town) planning.Source: Estimated from Third Five-year Plan, March 1965.
161. Thus, in general, the breakdown of the allocations arequite similar as between the two Plans particularly if the agriculturaland water sectors are viewed in combination. The largest percentageincreases are in the social welfare fields of education and healthand the rural works program, though less than 8 per cent of the totaloutlay is planned for the two former areas. This is a reflection ofthe administrative problems connected with a rapid acceleration in
- 56 -
these fields and perhaps also of a desire to concentrate on physicalproduction at this stage of development. However, there is a verypressing need to improve both primary (literacy rate is about 15per cent) and technical education in Pakistan. The elimination ofilliteracy is recognized as an important goal in Pakistan's longerterm planning discussed in the next chapter. The mission feels that evena larger expansion of the education allocation during the Third Planwould be desirable.
162. The sectoral allocations indicated above are, of course,only a guide to annual development programming. During the SecondPlan there were significant departures from the original allocationsboth between and within the public and private sectors, mainly foradministrative and other pragmatic reasons. The authorities wouldbe well advised to preserve flexibility during the Third Plan as well.The shortfall of resources that the mission foresees for the publicBector,particularly if Tarbela is undertakeiz and the managerial andother advantages of having the private sector undertake some ofthe industriess and agricultural supply functions now earmarked forthe public sectors are compelling reasons for such flexibility.
163. The Mission's comments on the principal sector programsare summarized as follows. More detailed discussions of each sectorare in their respective annexes.
Agriculture
164. The Third Plan calls for a sharp acceleration of growthin the agricultural sector from the 3.5 per cent par year during theSecond Plan to 5 per cent per year. To achieve this, the highestpriority is being given to measures to increase water availabilityand use of fertilizer. The Plan calls for maintaining strong farmincentives and strong support for the entire range of agriculturalprograms. Allocations of public development expenditures foragriculture and water have been roughly doubled over the levelsachieved in the Second Plan and provisions are also being made for aconsiderable increase in development credit for financing private on-farm investments. Together these programs amount to over 30 per centof planned development expenditures (35 per cent including the RuralWorks Program). Provisions have also been made for increasing thesupply of essential farm inputs and gradually transferring responsi-bilities to the private sector. Research and extension activities areto be strengthened further and increased emphasis is to be givento land consolidation, colonization, range land development, soilconservation and agricultural marketing.
165. Water Development. Experience during the Second Plan -demonstrates clearly that water has been the major limiting factorin both West and East Pakistan. In West Pakistan, the problem hasbeen one of trying to spread too little water over too much land.In East Pakistan the problem has been too much water in the rainyseason and not enough in the dry season. This has resulted in periodicdroughts, floods, water-logging, salinity and consequent low yields.
- 57 -
The 20 per cent increase in water availability developed during theSecond Plan has been the major growth factor in West Pakistan. Theimprovements in flood control and drainage resulting from the CoastalEmbankment Project and otber smaller works have been important factorsin East Pakistan. With better control of water and reduced crop losses,more intensive cropping has been made possible and farmers have been ina better position to invest in other inputs such as better varieties ofseeds, fertilizers and farm machinery.
166. In the Third Plan, public investments in water will be roughlydoubled. In West Pakistan, the aim is to develop 24 million acre feet ofadditional water, almost a 40 per cent increase in irrigation water.Efforts will be concentrated on developing the sweet water areas andconsiderable encouragement is to be given to private tubewell development.The low lift pump irrigation programs in East Pakistan will be acceler-ated and possibilities for large scale sale of small low lift pumps toindividual farmers and development of private tubewells will also be givenpriority. Major emphasis is to be given to completion of the CoastalEmbankments Project and other on-going projects and rapid implementationof a major flood control program for East Pakistan. As a result of theseprograms, in both wings 5.5 million acres of land will be newly irrigatedand 21.7 million acres will receive an improved water supply. This isexpected to provide about 35 to 40 per cent of the planned increase inoutput and provide the basis for improvements in cropping practices and
i ncreases in other inputs.
167. In both East and West Pakistan, apart from on-going projectswhich have already been financed, there are very few major projects whichhave reached the stage of detailed formulation. Considering the lagswhich can be expected between detailed project formulation, financing,construction, operation and actual use of the water, an all-out effortwill be required to carry out the water development program. This willcall for rapid completion of on-going projects, maximum support to privatesector development and a sharp acceleration in preparation of new projects.On the basis of past performance and the present status of the preparationof projects, the Mission doubts whether a development of this magnitude canbe carried out in the five-year period.
168. Fertilizer and Other Inputs. Fertilizer use which has increased from31,000 nutrient tons (NPK) to an estimated 162,000 tons (NPK) during theSecond Plan is expected to increase to 484,o00 tons (NPK) at the end of theThird Plan. The Plan calls for construction of additional fertilizer plants,continuation of subsidies to offset high costs of domestic production, con-tinued imports at a level sufficient to avoid recurrence of shortages andfurther transfer of distribution to the private sector. Necessary creditarrangements are also to be provided. Fertilizer is expected to produceabout one-third of the planned increase in agricultural output. However,since demand is already in excess of domestic supply, every effort willhave to be made to step up imports and to expedite construction of newplants.
- 58 -
169. Plant protection, improved seed, mechanization, improvedpractices and increased labor inputs are expected to provide theremaining 30 per cent of the planned increase in output. Plantprotection becomes increasingly important with intensification ofproduction and higher yields. On the present subsidized governmentoperated basis only 12 per cent of the cultivated area is covered andthe target is to reach 19 per cent in 1969/70. The mission does notbelieve that this is adequate and that immediate steps should be takento encourage maximum private sector participation. Similarly, theimproved seed and the mechanization programs place too much emphasison subsidized government services and do not provide sufficient scopefor private sector development. (Annex 2 ).
170. Agricultural Administration and Development. The public sectorprogram for agricultural development has lagged behind targets set inthe Second Plan. The major reorganization of agricultural agenciescarried out during the first several years of the Plan was undoubtedlydisruptive. On the other hand, the sharp increase in private tube-well development and the unfilled demand for tractors, farm machinery,fertilizers and plant protection services show clearly that farmershave become development minded. The increase in agricultural outputwhich has been achieved in spite of the limited availability ofessential farm inputs and the inadequate farm credit system indicatesa considerable scope for further acceleration of growth.
171. To date, developmental expenditures for agriculture properhave consisted largely of subsidies for various inputs and expensesassociated with building up a large governmental bureaucracy engagedin large part in administering a wide range of services. The missionbelieves that Palkistan could absorb a much higher level of inputs ifa larger share of the supply and service functions were turned overto the private sector and government concentrated on those areaswhich cannot be handled by the private sector. This could bring about asubstantial savings in development expenditures and personnel currentlyearmarked for subsidized inputs and services and make it possible toprovide adequate support for the essential agricultural functions ofgovernment.
172. While considerable progress has been made in strengtheningand expanding research and extension services, a number of seriousgaps remain. In the past water has been the most important limitingfactor. As a result of the water development program, water is nolonger a limiting factor in many areas. Suitable crop varieties andfertilizer are becoming increasingly important in maximizing cropoutput. This calls for an accelerated research program aimed atdeveloping more high yielding varieties responsive to conditions ofoptimum water and fertilizer application. It also calls for afurther expansion in extension activities to expedite the transfer ofresults from the research stations to the better farmers.
- 59 -
173. With the increased intensification of agriculture whichis currently underway, the cash requirements of farmers for fertilizer,seed, farm machinery, tubewells and land improvement can be expectedto increase sharply. To date, a substantial part of the investmentsin tubewells and farm machinery has come out of private savings andnon-institutional forms of credit. The Third Plan provides for onlya modest increase in institutional forms of farm credit. "Taccaviloans" (direct government loans) will be maintained at about currentlevels and expenditures on cooperative credit are to be increasedsomewhat. The Agricultural Development Bank of Pakistan, which hasbeen the principal source of agricultural development credit, plansto increase its lending operations by about 50 percent in the next fiveyears. The mission believes that a much greater increase will benecessary if the objectives of the Plan are to be realized.
174. Conclusions. In summary, the proposed growth rate of 5per cent per year during the Third Plan is extremely ambitious. To achievethis rate an all-out effort will be required. Immediate steps shouldbe taken to assure action in the following key areas:
1. Water. A general acceleration of the public waterdevelopment program, particularly the preparation of flood control,irrigation, drainage and reclamation projects integrated into therespective provincial water resource development plans and maximumencouragement to private tubewells and low-lift pumps.
2. Fertilizer. Highest priority to fertilizer imports andconstruction of additional fertilizer plants to prevent recurrenceof current shortage (including timely release of necessary foreignexchange for fertilizer imports).
3. Strengthening and expanding extension and researchactivities in order to carry out an intensive campaign to stimulate properuse of fertilizer (phosphatic as well as nitrogenous), plant protectionmeasures, improved seed and improved cultural practices.
4. Maximum encouragement to private sector participationin the production and distribution of all inputs with a view towardreducing government's role as rapidly as is consistent with an orderlytransition and acceleration in the use of inputs.
5. A sharp increase in institutional credit to farmers,particularly the lending activities of the Agricultural DevelopmentBank of Pakistan.
6. Maintaining adequate incentives to farmers through amarket support system aimed at a gradual improvement of the terms oftrade.
Until project preparation has proceeded much further,it is not possibleto pass final judgment on the financial allocation for agriculture butit is probably about the minimum required to do the job envisaged.
- 60 -
Industry
175. The industrial sector of the Plan had been programmed onlyin a general way when the mission was in Pakistan. In West Pakistanan inventory had been made of major industrial projects underway orin the planning stage. In East Pakistan, this analysis was still inprogress. A few preliminary studies have bean undertaken for someprojects in the chemical and engineering sectors. This work had not yetprovided a substantial basis for Plan projections.
176. Based on general projections given to the mission, productionby industries producing investment goods and intermediate productswould increase at 10.6% per annum compared with 7.9% for consumer goodsindustries. The share of the former in total industrial output wouldrise from about 33 per cent in 1964/65 to about 36 per cent in 1969/70.The manufacturing sector as a whole would grow by 9.5 per cent perannum versus 9.2 per cent per annum during the Second Plan. Largescale industry would grow 12.1 per cent per annum compared to 13.3 percent. The contribution of industry to economic growth during theThird Plan would be about 18 per cent as compared with 20 per centduring the Second Plan.
177. It is assumed that the relative share of factory industriesin the total manufacturing output would increase at the expense ofcottage and other small scale industries. Though there would be ahigher growth than in the past in the latter activities (by about 3 percent a year versus 2.6 per cent during the Second Plan), the share ofsmall scale industries would decline from about 32 per cent of totalindustry in 1964/65 to 24% in 1969/70. However, the productivityassumptionsfor small industry are not specifically stated and thebasic data available for estimating value added in this sub-sectorare extremely weak. The mission recommends that necessary benchmarkdata should be collected through a quinquennial census of smallindustries in both the Provinces.
178. The employment impact of the proposed expansion in factoryindustries is still under study. It is assumed that the increases foremployment promotion in organized industries in the urban areas willcontinue and include fuller utilization of existing industrial capacityby the introduction of multiple shifts and removing handicaps, suchas the non-availability of raw materials and spare parts. However,in some industries such as petrochemicals and steel, it is necessaryto use high productivity techniques. Since the Third Plan stresses theneed to develop more capital intensive industries, it will be difficultto reconcile the need to provide more industrial employment opportunities,especially in the urban areas, with the introduction of industrieswhich are not labor intensive.
- 61 -
179. Of the total projected increase of Rs. 3,089 millionindustrial output during the Third Plan, the Planners expectRs. 1,954 million to be absorbed by the domestic market andRs.1,135 million to be exported. Rs. 900 million of the domesticabsorption would be import substitution and Rs. 1,054 million normalincrease in domestic demand. Thus, about two-thirds of theincreased industrial production will be directly related to the"international" sector of the economy, i.e., exports and importsubstitution, emphasizing the need for greater attention to Pakistan'scompetitive position.
180. Despite the mission's reservations on some of the industries,we feel that the target of Rs. 900 million of import substitution maybe met during the Third Plan, though some of the projects suggestedwill not be ready in time to yield import substitution by 1969/70.Since import substitution will occur once the plant is built, whetheror not it is economic, one can speak with greater assurance aboutimport substitution capability than about exports.l/
181. The mission believes that the projected overall industrialgrowth rate of 9.5 per cent a year is attainable. The share of large,as compared with small scale, industries will increase as it has beendoing over the last fifteen years. Large scale industries should growat a rate of 12.1 per cent per annumi, which is below the average rateof 13.3 per cent registered during the last five years. The reasonfor the small deceleration is that consumer goods will grow at aslightly lower rate than during the Second Plan. The mission feelsthat this assumption is acceptable, although Plan targets for importantitems such as sugar and edible oil may be on the low side. However,it is also felt that Plan targets for textiles and jute goods areoptimistic and, given the weight of these industries in the totalindustrial output, one may expect that, on the whole, consumer goodswill not go faster during the Third Plan than during the Second Plan.
182. Intermediate goods would grow at a higher rate during theThird Plan, i.e., 10.5% per annum. A large part of the increase willbe due to the development of fertilizers, various metal products, paperand cement, for which there is a growing market. Several new plantsare under construction or are to be undertaken soon.
183. Production of capital goods will continue to bring only asmall contribution to total industrial output and the Plan assumesthat it is not likely to grow faster than during the Second Plan,i.e. 10.8 per cent per annum. Since most of the heavy capital goodsprojects included in the Plan will not be in full production before 1969/70,such an approach seems realistic.
1/ See Chapter 4.
- 62 -
184. On balance, the assumption of a slightly higher increasein intermediate products should not result in an overall industrialgrowth rate superior to that achieved during the Second Plan. ThePakistan industrial structure should remain what it has been for anumber of years, based on consumer goods and only progressively shift-ing towards the output of intermediate and, to a minor extent, heavycapital goods.
185. Investments in organized industry would grow from Rs. 5,656million during the Second Plan to about Rs. 13,000 million during theThird Plan. Two-thirds of planned investments would be made by theprivate sector. East Pakistan would absorb about 55 per cent of totalinvestments. However, investment costs are still largely tentative andonly a small part of the projection is supported by specific costestimates for industrial projects. For that reason, they can only beused as partial check on the econometric calculations on which theglobal investment targets for manufacturing are based.
186. The calculations of investment requirements were basedupon the assumption that there would be a gradual increase in theratio of investment to output from about 1.65 in 1960/65 to about 3.0in 1965/70. This would result mainly from more capital intensiveinvestments. Although the mission agrees that the capital/outputratio is likely to increase during the Third Plan, the percentageof "capital intensive" industries is not likely to be so much higherthan it was during the Second Plan as to justify such a steepincrease of the capital/output ratio. The mission feels that thereis a tendency to a systematic over-evaluation of the investmentrequirements for fixed capital, perhaps by as much as 25 per cent.
187. Since it is important to arrive at a reasonably correctview of the need for industrial investments (particularly from thepoint of view of the balance of payments outlook and the need forindustrial finance), the mission recommends that a critical review bemade of the basic assumptions underlying the investment cost estimates.The cooperation of industrial associations and major firms should beobtained in revising these estimates. More weight should be givento the peculiar circumstances currently facing each industry andrelatively less weight to econometric calculations, useful as the latterare for checking.
188. Investment Pblicy. One important objective of the investmentprogram during the Third Plan will be to shift the emphasis fromconsumer goods industry to the establishment of capital goods industriesand so to reduce the country's dependence on foreign assistance forthe import of capital goods. The mission has substantial reservationsregarding this policy, both because of the capital-intensive characterof capital goods industries and the comparative small contribution theywill make to reducing unemployment.
1/ Steel mills, heavy machinery, machine tools, heavychemicals, heavy electricals.
- 63 -
189. Undoubtedly, Pakistan, as other developing countries, findsherself in a difficult situation as she tries to diversify her economyand move in the direction of a balanced structure. She env-isages her-self as faced with an inelastic demand abroad for the prorj' :t-; of herconsumer goods industries, but at the same time she wiil !.a7re realdifficulty in achieving large enough markets at home and a±-odd forcapital goods industries so that the economies of scale an be obtained.There is also a danger that the pace of investment and iLld'strial growthwill be gradually s'lowed after the painless and profitable take-overof the existing market from foreign competition has been accomplished.This can be seen, for instance, with the textile industry which had arelatively slow growth during the Second Plan. One possibility wouldthen be to induce investment in the production of the equipment andintermediate goods used in the consumption goods industries. That is,import substitution could be extended to the prior stages of production.
190. The Planners apparently feel, with justification, thatprofits to be obtained from capital goods production in Pakistan willbe comparatively low. For this reason, most of these industries areproposed for the public or semi-public sectors leading to questionsof management and real costs to the economy. What is required insteadis that profits from private consumer goods industries be divertedfrom reinvestment there to investment in equipment and material supply-ing industries. But the capital market is not sufficiently developedto make this kind of reallocation of profits easy. The most likely placefor reinvestment of profits is in the industry where they are earned.Development banks and some big industrialists are becoming progres-sively interested in non-consumption goods industries, but thisdevelopment is still at an early stage. Moreover, capital is requiredin much larger amounts per unit of output in the steel or themachine tool industry than it is in the consumer goods industries.Tnis puts an even greater strain on already scarce capital resources.
191. The principal argument for balanced economic growth,namely that it will produce external economies such as cheaper factorsof production and sources of materials, must be weighed against theobvious drawback of the limited market. Eventually, Pakistan willdevelop new sources of raw materials and such a development should begiven high priority. By developing local raw materials and perhapsnew consumer goods industries to utilize their products, Pakistanwill achieve some of the important linkage effects that balancedgrowth is expected to produce. However, this is a long-termconsideration and in the shorter run several industries are beingconstructed which, by their capital intensive character, result inthe utilization of the relatively scarce factor, capital, the realcost of which is higher than its market price. On the other hand, labor,the real cost of which is considerably lower than its market price,goes comparatively underutilized. Therefore, we may conclude that, whilethere are some possibilities in Pakistan of producing capital goods,there are very important limiting factors involved.
- 64 -
192. The Third Plan will continue to rely on private enter-prise for achieving most of its investment and industrial targets.However, the size of the public sector allocation for industriesis proportionately larger than in the Second Plan, i.e., 35 per cent ofthe total compared to 24 per cent in the Second Plan. The reasongiven is that there is a "need for accelerating the pace of industriali-zation in East Pakistan where private capital or initiative is notadequate". In fact, the potential investment capacity of the privatesector in the East Wing is unknown. Some industries (such as the juteindustry) have shown high rates of return and actual private invest-ment during the Second Plan seems to have been about 20 per cent abovePlan targets. One of the weaknesses of the private sector in EastPakistan remains the persistent lack of skills and entrepreneurship.The same is true of the public sector except where imported talent isused.
193. In order to give to East Pakistan a larger share inindustrial investments, the Plan allocates a very substantial amountto the State-owned Industrial Development Corporation (EPIDC).However, the mission was informed that government now considers theallocation to the "public" sector should in fact cover a number ofprojects in which EPIDC (and also West Pakistan PIDC) would havesome participation, but which could also be financed by developmentbanks, domestic and/or foreign private investors and the generalpublic. The mission strongly supports that approach. Those publicsector schemes of the Third Plan in which domestic or foreigncompanies have an interest should be set up under such arrangementswhenever possible. Several investors have already expressed interestin new projects included in the public sector. Government is stillworking on the future allocation for industry in the public sector.The mission hopes that the final allocation will clearly show the projectswhich are intended to be financed by joint ventures, and will indicatethe tentative amount of EPIDC participation in such ventures. Thenthe total amount of funds earmarked for government investments inindustry could be substantially reduced.
194. Conclusions. The mission is generally in agreement with theindustrial program in terms of the projected overall growth rate.However, we believe that the magnitude of industrial investments isover-estimated to achieve this growth target. We also have reservationsregarding the possibility of raising investments in East Pakistan tothe projected high level in such a short period of time. The missionrecommends that a critical review be made of the basic assumptionsunderlying the investment cost estimates. Most important,the Governmentshould approach the development of highly capital intensive industryvery cautiously and, where such industries are undertaken, if possible,obtain the participation of the private sector, financially andmanagerially. The mission is not impressed with the argumentfrequently heard in Pakistan that where the market will accommodate onlyone plant (usually one in each wing) it must be in the public sectorto avoid monopoly pricing. International prices plus tariff wouldgovern selling prices in Pakistan unless the present undesirablepractice of banning imports is continued and extended.
- 65 -
Power
195. The Third Five-year Plan proposes to more than doublecapital expenditures on power from Rs. 1,772 million during theSecond Plan to Rs. 3,628 million for the Third. Investments to bemade in East Pakistan would be 40 per cent of total expendituresagainst 20 per cent during the Second Plan.
196. The program would concentrate heavily on transmissionand distribution schemes, which are now the bottleneck in theelectric supply industry. Expenditures on transmission and distributionwould then be about two-thirds of the total allocation.
197. Installed capacity would reach 2.6 million kw in 1969/70against 1.1 million kw in 1964/65, indicating the scale of the program.East Pakistan capacity would grow from 0.2 million kw to 0.7 millionkw., which may be overly optimistic unless demand increases at amuch faster rate than now seems likely. West Pakistan (includingKarachi) would have 1.5 million kw capacity in 1969/70 compared to0.64 million in 1964/65. The target may also prove somewhatoptimistic, but seems attainable on the demand side if the tubewellprogram gains even more momentum and the industrial targets can beachieved.
198. In West Pakistan, an estimate of load growth has been madefor the WAPDA system in the form of a power market survey. Aspecial question is the tubewell pumping loads, which are especiallydifficult to forecast. The load is projected to grow over 120 percent between 1965 and 1970. WAPDA's forecast for 1970 has been judgedsomewhat optimistic by the Bank study, "Report on a Dam in the Indusat Tarbela". The report forecasts a total load of 930 mw in 1970versus 1,005 mw envisaged by WAPDA. Realistic judgments regardingthe proper projection of load requirements for planning purposes mustawait completion of the comprehensive phase of the study of the waterand power resources of West Pakistan, sponsored by the World Bank.WAPDA's and the Bank's preliminary results are indicated in Annex 4
199. Projections made by WAPDA for the period up to 1970indicated that, in West Pakistan, it would be desirable to allocate60 per cent of the total Plan allocation for power to distribution.The actual allocation seems to be 57 per cent. This ratio confirmsthe distribution problem now existing in the grid area. It isestimated that 100,000 new customers will be connected in each yearof the Plan. The provision of these service connections is coveredby a planned allocation of Rs. 425 million. All efforts should bemade to improve the distribution system during the next five years.Since it is known that resources are urgently needed to improve thedistribution system, which is getting almost 60 per cent of the totalPlan allocation, the mission feels that the proposed expenditure ofRs. 1,708 million for the WAPDA program in West Pakistan should notbe considered excessive.
- 66 -
200. In East Pakistan, the WAPDA power program is estimatedto cost Rs. 1,481 million against Rs. 353 million during the SecondPlan. The estimated load in 1970 would be 713 mw against 180 mwin 1965. The mission considers this forecast as optimistic on thedemand side. Agricultural use of power is expected to jump from 10 mwin 1966 and 20 mw in 1968 to about 120 mw at the end of the Plan.Some increase can be expected as a result of newly installed tubewells,but such a sharp increase over just one or two years is over-optimistic.Also, the forecast assumes a very large growth in power consumptionin small towns and villages, but time will be required before thedistribution system can be improved to the extent needed to handle theincrease. Finally, industrial use is supposed to grow at a very fastrate. The mission has some doubts regarding the full achievement ofindustrial targets in East Pakistan which are discussed in Annex 2For the above reasons, it is doubtful whether the deficits in capacity willbe as large as implied in the Plan. Some shortage may develop duringthe early years of the Plan and until capacity is built at Karnafuli,Siddhiranj and Khulna, but the number of new plants proposed for1969/70 is definitely on the high side.
201. A large allocation of Rs. 578 million has been providedfor secondary transmission and distribui:ion and fcr rural electrification.This reflects the uy:enri net!d to i:Yprove the distribLtion system.However, the proposed 3,50C miles of new line3 is unrealistic giventhe administrative capablLities of WAPDA and the heavy requirements inforeign exchange. A balance will lave to be s..ruck betweea the needto improve the existing distribution system and the desire to connectmany small localities to the main line. One of the most costlyitems is the rural electrification scheme which aims at bringing powerto about 2,000 villages. IF a village is located near a tubewellin which electricity is to be installed, there may be goodjustification for immediate electrification of the village. However,the number of consumers that WAPDA expects will take electricity onceit is brought to the villages is way out of proportion with what can beachieved. In other words, the mission feels that the difference inincome level between the villages and the larger urban areas has beenunderestimated.
202. The mission realizes that East Pakistan needs cheaper, moreabundant and better distributed power. To achieve these objectivesit is quite legitimate to provide for a generous provision under theThird Plan, but it must also be realized that many of the Second Planschemes remain to be completed and that WAPDA's present capabilitiesto undertake a very large number of new projects at the same time arelimited. For these reasons, we feel that the allocation of Rs. 1,481million Lor power in East Pakistan is definitely high.
- 67 -
203. Transport and Communications. Better transport facilitiesare necessary in Pakistan if an improved rate of growth is to beachieved. In the Third Plan a larger allocation has been providedin order to move the planned increase in agricultural and industrialproduction. With this increase in planned production will go achange in traffic patterns. The railways and IWTA, while continuingto carry the long haul mineral and agricultural production, willlose some traffic to road transport particularly in West Pakistan.
204. The Third Plan proposes to continue with general aimsof earlier Plans. The priority of transport has increased slightlybeing given about 18 per cent of total expenditure compared with 17per cent in the First and Second Plans. In East Pakistan muchimproved land, water, road and air transport is contemplated and inWest Pakistan ongoing road projects, renewal of railway equipmentand improvement in port facilities and expansion of the shippingfleet.
205. Inter-modal transport studies are being undertaken andas a result there may well be further changes in emphasis. If roadsare to gain in importance, then road transport will have to expandwith larger truck fleets and concommitant maintenance and spare partsservices. Emphasis on road transport should lead to more domesticassembly of trucks or the import of a greater number of completevehicles. The development of a spares and components industry wouldbe of great value to the economy, by reducing the requirement forforeign exchange.
206. The increase in the international shipping fleet raisesquestions since in the present state of the world shipping market manycountries are eager to sell new or old ships to Pakistan. The shipswill have to be used well to cover their costs.
206. With such large areas and the division of the country, thereis a great need for better communications. Telephones are to beincreased in number, there are proposals for improved postal servicesbetween the Provinces, for a co-axial cable to join the Wings andfor a submarine cable between Karachi and Chittagong. The relativeimportance of these various programs needs to be assessed. As faras the mission was able to judge the allocation for transport andcommunications seems reasonable.
207. Education. The main objectives in the education sector in theThird Plan are to widen the base of primary education and makeavailable increased facilities for technical and vocational training.With the aim of reducing wastage in primary schools and consolidatinguniversity education as well as diversifying courses in secondaryschools, larger finances are proposed.

- 68 -
208. Quality as against quantity is the rationale. Althoughit is open to question whether more funds should be devoted toeducation, there would still remain the difficulty of obtaining atan early date an adequate supply of teachers and other personnelto mount a larger program, The position should be kept under reviewin annual programs and continuing research and improvement instatistical information on education should be undertaken in orderthat the program can be as flexible as possible and use resourcesmost efficiently.
209. Health, Manpower, Social Welfare, and Housing. An increaseof 1 in the percentage allocation has been proposed for the healthand social welfare sectors in the Third Plan. Emphasis is to beplaced on preventive rather than curative medicine. It is proposedto do this by improving water supplies, sewerage services and similarfacilities. Since many of the diseases in Pakistan are water-borne,these can be controlled through improving water supplies, whichalthough important to the health of the population are projectswithin the housing and physical planning sector. Rural healthcenters and other organizations for providing advice are to be increasedin number but the shortage of skilled manpower will prevent a greatexpansion of services within the period of the Third Plan.
210. Family planning has been given much greater importancein the Third Plan. The program is included in the health sector whereit is possible that it will not receive the attention it deserves.The importance of success or failure in population control is suchthat the subject might be made the responsibility of a separateministry. There will be family planning advisers in all the impnrtantministries associated with the program but while advice-is valuable,energetic administration of the program will be vital for its success.Much thought and effort is being given to the problem.
211. Linked with this question of population cortrol is thatof manpower and employment. Unemployment is one of the gravestproblems facing Pakistan; it is estimated that almost one-fifth of theavailable manpower is wasted every year for lack of opportunity.It is said that the Second Five-Year Plan absorbed all the new additionsto the labor force, thanks partially to the employment createdby the Rural Works Program. It is calculated that employment forsome 6.5 million persons will be generated by investments during theThird Five-Year Plan, cutting a little into the unemployed backlog.The possible use of labor intensive schemes requires further studyas the capital intensive methods employed by developed countries arenot of particular advantage to Pakistan.
212. Most of the housing and town planning investment will bain the private sector and is therefore outside the direct control ofGovernment. An exception is construction on the new capitals atIslamabad and Dacca but requirements for theae-were largely providedin the Second Plan. The reduction, percentageiiwise in the allocationfor housing may be more a wish than a reality in view of theurbanization going on and the activity of the private housing sector.

- 69 -
213. The Mission regrets that more resources cannot be devoted tosocial welfare programs in the Plan. However, imaginative administrationcan make up, in part, for the lack of financial resources.
CHAPTER 6
PROSPECTS
The Perspective Plan.
214. The Planning Commission has outlined broad goals for the economyduring the twenty years from 1965 to 1985. The Third Plan has been formu-lated within this general framework. In addition to more than quadruplingGNP (annual target growth rate 7.2 per cent) and tripling per capita income,four other major objectives to be accomplished by the end of the twenty-yearperiod or sooner are in this Perspective Plan. They are: (1) full employ-ment by about 1975; (2) equalize per capita incomes in the two Provinces;(3) universal literacy; and (4) elimination of requirements for further netcapital inflow after 1985.
215. We will not attempt to appraise the Perspective Plan which isprimarily a set of targets and broad policies. It is an excellent state-ment of objectives. The Government intends to revise it every time a newFive-Year Plan is prepared, and presumably project it for another fiveyears so that a twienty-year perspective is held always in view. It is ofinterest, however, to examine to what extent the lines of development ex-pected during the Third Plan will advance the economy towards the attain-ment of these long-range objectives.
216. The growth rate set as the objective of the Perspective Planappears to have been attained only in 1963/64, a year of exceptional agri-cultural production, and it is well above the target for the Third Plan.The Mission has not taken issue with the Third Plan growth rate. Pakistancertainly needs encouragement to strive for as substantial a degree ofprogress as possible within the limits of resources and capabilities. How-ever, there is a possibility that the Second, and even more so the ThirdPlan growth rates will not be easy to exceed. During the late 1950's thePakistan economy was largely stagnant and some elements, such as exports,were declining. The growth achieved during the Second Plan was a recoveryfrom that condition. For this reason, it may not be easy to exceed it inthe future. Also, only four years (1964/65 results are still uncertain)is too short a period, particularly in a predominantly agricultural economyon which to base long-term trends. The very favorable agricultural resultsin 1963/64 had a lot to do with the growth for the Second Plan as a whole.
217. The Perspective Plan target assumes that manufacturing industrywill continue to be the leading sector and will increase its share of GNPfrom 12 to 21 per cent over the twenty years, while the share of agricul-ture will decline from 49 to 36 per cent. This is in line with currenttrends, but both sectors will have to continue to grow a little faster thanprojected for the Third Plan to attain the Perspective Plan target. Itappears that the amount of investment and saving projected for the Perspec-tive Plan period is high (to increase marginal savings above 22 per centwill be difficult), but the Mission feels that the capital/output ratio ofabout the present level is reasonable and this is roughly what is projectedfor the Perspective Plan. Domestic savings will naturally be affected by
- 71 -
attempts to more nearly equalize income distribution both between and withinthe Provinces. At the same time, the Mission agrees with the Planners thata higher level of consumption is not inconsistent with and rather is a condi-tion for rapid economic growth in the long run.
218. In respect of the full employment objective (defined as decreasingunemployment from over 20 per cent in 1965 to about 5 per cent of the laborforce in 1985), experience during the Second Plan does not make for optimism.Hopefully, the rate of growth of the population may start to decline before1985. if the family planning program succeeds, but this will not affect thelabor force during the Perspective Plan period. The Planning Commissionestimates that the labor force will increase by 7 million in 1980-85, culmi-nating in a total increase of 27 million over the twenty-year period. The useof rural works type investment is proposed to offset the capital-intensivecharacter of industrial investment. One must conclude that no plans arebeing considered to adequately cope with Pakistan's unemployment problem.
219. The objective of equalizing per capita incomes in the two Provincesis politically, rather than economically, motivated. I;hether it can beachieved without accepting a lower return on investment, and thus lower averageincomes in the country as a whole than otherwise would be possible, depends agreat deal on the development of improved administration in East Pakistan andalso curbing population growth in that Province. Otherwise, the allocation oflarger public sector investment resources to East Pakistan may contribute tothe objective but at a considerable price in terms of the economic growth ofthe whole economy. The concern expressed in the Plan that differential growthrates favoring East Pakistan may be difficult to reverse when parity is a-chieved seems somewhat premature.
220. The goal of universal literacy by 1985 should be vigorously pursuedbut will require more attention to primary education than it is given in theThird Plan.
221. The last objective of becoming independent of net capital inflowafter 1985 is premised upon considerably larger capital inflows in the interim(particularly during the next ten years) than Pakistan has had in the past,substantial as they have been. During the Third Plan, Pakistan's internal andexternal resource gap will continue to increase, but if exports and savingsmaterialize as expected, it will start to decrease as a proportion of totalinvestment. This, of course, is a first step in the direction indicated bythe Perspective Plan. No one can say at this stage how long it will requireto reach the point where only refinancing of old debt will be required. Thiswill depend not only on the factors determining Pakistan's economic growth butalso on the level of real per capita income and consumption that Pakistan andher friends abroad consider satisfactory for the political and social stabilityof the country.
221a. The Perspective Plan assumes that the marginal rate of saving will risefrom 22 per cent in the Third Plan to 28 per cent in 1975-80. Also, the propen-sity to import will be reduced from 12 per cent in 1970 to 4 per cent in 1985.These are quite optimistic assumptions. Nevertheless, our calculations indicatethat, with these assumptions, while the requirement for net capital inflow wouldstart to decline during the Fourth Plan, it will not be eliminated by 1985 oreven by 1990 (Appendix table 35). Furthermore, even if f ture official capital iEsecure on very easy terms f2 per cent, 5 years grace, 25 years repayment), amor-tization will increase about as fast as the need for net capital inflow declines.The assumptions in Appendix table 35 are those of the Plann mg Commission's, use,in preparing the Perspective Plan.
- 72 -
Third Plan Prospects.
222. Pakistan has clearly enjoyed a rapidly accelerating rate of eco-nomic growth during the last decade, and the Mission feels that this willcontinue during the Third Plan. If the level of investment resources en-visaged is available, the Third Plan growyth target (6.5 per cent a year)appears to be reasonable though the hazards surrounding its accomplishmentsare obviously considerable in a country so heavily dependent on agricultureand the natural risks associated thererxith. While this Third Plan growthtarget is high even in relation to the successes of the Second Plan, it isnot out of line with the results in the last two years. The most crucialsector will, of course, be agriculture. If the increase in the annual agri-cultural growth rate from 3.5 to 5 per cent is achieved, the 37 per centcumulative growth in real terms for the economy as a whole should be withinreach. Therefore, a speed-up in the use of resources directed towards quickreturns in agriculture will be essential.
Requirement for External Investment Resources.
223. Using as independent variables the 6.5 per cent a year annualgrowth rate projected for the Third Plan, the rate of growth of exportsestimated in Chapter 4 (over 8 per cent), a marginal rate of savings of22 per cent, and the capital output implied by the investment levels postu-lated in the Plan, the Mission has calculated the external capital require-ments Pakistan will probably need to carry out the Plan. The results ofthis projection are shown in Table 1. In this computation, the differencebetwieen gross investment and gross domestic savings (internal resource gap)has been added to the Missicn's estimate of exports plus net factor incomepayments abroad to calculate the required level of imports. The latter wasthen checked against the economy's total use of economic resources (finaldemand). The resulting import dependency ratio is consistent with previousexperience. Also the close similarity between our derived import require-ments and those directly calculated by the Planning Commission by input-output analysis gives us some confidence in our results (see Chapter 4).
224. The total national resources provided by this flow of imports plusgross domestic product will provide the investment resources required for thePlan plus consumption per capita increasing between 3.0 and 3.2 per cent ayear.
225. The gross inflow of foreign resources required for all purposesexcept amortization of foreign debt during the Third Plan would be about$4,307 million and, including the foreign debt repayment, slightly over$4,554 million. After allowing for PL 480 imports, private foreign invest-ment and of technical assistance, the gross official capital requirementwould be reduced to about $3,633 million for the five-year period (last linein Table 1). This includes, of course, the expenditures on the Indus Replace-ment Works../ If the disbursement estimated for the latter is excluded (the
1/ But not the Tarbela project.
- 73 -
estimated $409 million for this will come from the Indus Fund), the residualto be covered from the present foreign aid pipeline or from new coimmitmentswould be $3,225 million.
226. The lMission believes that the substantial aid pipeline which islikely to be nearly $1.1 billion (including uncommitted pledges) at the endof the Second Plan could be drawn down by at least $200 million during theThird Plan. This would reduce the additional aid requirement to about$3 billion.
227. Looking at the problem from the standpoint of the consortium, afurther reduction may be made for aid from non-consortium sources. TheMission believes that $200 million or so may be forthcoming. In round numbers,the Third Plan as now proposed seems to require about $2.8 billion in consor-tium aid. The Pa'd.stan request is for $2.7 billion.
228. The Mission agrees with that amount as a fair estimate of the aidrequired to carry out a Plan of Rs. 52 billion. We feel that, if this levelof aid is not forthcoming, either the overall level of the Plan expenditureswould have to be reduced or the structure of the program would have to bechanged to reduce its foreign exchange content, combined with reasures tofurther raise the rate of domestic saving.
Mobilization of Domestic Resources.
229. During the Second Plan, 57 per cent of total development funds(including Indus) were mobilized by the domestic economy, and 43 per centwere obtained from abroad. This involved a marginal rate of saving of about21 per cent. For the Third Plan, the Government expects to mobilize nearly63 per cent internally (68 per cent excluding Indus), involving a marginalrate of saving of about 22 per cent. The average rate of saving would haveto rise to 13.5 per cent during the Third Plan as compared with about 10 percent for the Second. We believe that this is a reasonable target.
230. However, the Mission is not equally sanguine about the financingfor the public sector program of Rs. 30 billion while maintaining financialstability. In Chapter 3 we concluded that there is considerable scope forimposing new taxes or raising existing tax rates to realize about Rs. 3billion additional taxes, assuming that the economy grows at about the rateenvisaged in the Plan. This would mean an increase in the portion of GNPaccruing to the Government from about 11 to 13 per cent. This is still amodest percentage of the national product to be set aside for governmentexpenditures. However, public savings within the presenit revenue frameworkplus the additional taxes would provide only about 14.3 billion of theRs. 16.5 billion required for the public sector.
231. This would indicate that the public sector program is over Rs. 2billion higher than present public savings estimates warrant. The Governmentintends to make up this shortfall be deficit financing (Rs. 1.5 billion) andfrom certain other schemes for increasing transfers from the private to the
- 74 -
public sector. Ln view of the lilcely requirements of the private sectorfor new credits, the Mission does not believe that any dependence shouldbe placed on meeting public sector expenditures by deficit financing.During the last few years, the private sector credit requirements haveabsorbed all the monetary expansion that the economy could safely stand.
232. As for additional transfers from the private sector, it must beborne in mind that in principle all private savings are already fully ear-marked for private sector investments or they w-rould have to come from newcredit creation iwhich might have inflationary consequences. On the otherhand, some of the measures suggested, such as securing private investmentsin joint ventures with the public sector, have merit. Also, some govern-ment expenditures classed as development and included in the Plan whichrepresent free government services should, in future, be provided againstpayment. This wiould reduce the net demand on government budgets andaccomplish part of the desired transfer of resources from the privatesector.
233. Therefore, while there are elements of doubt in the financingof the public sector program and a somewhat lower expenditure target wouldbe wise, wie believe the problem can be met if the Government does not adoptan inflexible policy regarding annual expenditure targets and adapts themto its best year-to-year estimates of available financial resources. Wedo not feel, in any case, that the foreign aid requiremrient is overstated.It is based, in part, on quite an optimistic export forecast and on quitea low estimate of the foreign exchange content of the Plan. Therefore,the proposed inflow of externally financed resources would still be re-quired even if total Plan expenditures should fall somewihat below presentexpectations.
Aid Requirement for 1965/66.
234. The Government expects that its requirement for foreign aid willincrease progressively over the course of the Third Plan_/ and has re-quested $500 million of new pledges for 1965/66. $300 million of this wouldbe for project commitments and $200 million for non-project aid. It seemsprobable that Pakistan will end the Second Plan with upwards of $75 millionof pledges of project aid still uncommitted but firmly earmarked for projects.Our analysis of the trade liberalization program to date indicates that inorder for this program to have its intended impact of substantially raisingutilization of existing capacity and providing the business community withconfidence in the future of the liberalization program, the request for non-project aid should be met. Although the implementation of many projectsremaains slow, the rising termpo of commitments and disbursements (Appendixtable 6) indicates that Pakistan will be able to utilize effectively theforeign aid requested.
1/ The annual phasing of the Third Plan increases from Rs. 8,400 millionin 1965/66 to Rs. 12,500 million in 1969/70.
- 75 -
Foreign Debt Position.
235. Pakistan's external public debt has been increasing substantiallyin recent years. By the end of 1964, including the undisbursed portion, itamounted to about $1,714 million as compared with approximately $1,200million a year before (Appendix table 1). Judging by the additional commit-ments expected in the last six months of the Second Plan, the total may bejust over $2 billion by June 30, 1965. A little over half of this or about$1,060 million will probably have been disbursed by that date, leaving apipeline of around $953 million (Appendix table 6) at the start of the ThirdPlan.
236. Thanks to the favorable terms on which over 60 per cent ofPakistan's foreign aid requirements have been met in recent years, foreigndebt service has been increasing much less rapidly than the principalamount of debt outstanding. The additional debt likely to be incurredduring the last year of the Second Plan (1964/65) will increase her debtservice payments over the period of the Third Plan by only about 23 percent, even though debt outstanding is likely to increase by about 47 percent in that year.
237. The service on Pakistan's existing foreign public debt through1978/79 is shown by the heavy line at the bottom of the chart (line A). Therelatively flat contour of the curve reflects the favorable terms on whichaid has been received.
238. Pakistan's export performance during the Second Plan and the evenmore optimistic outlook for the Third Plan has made her debt service ratio,present and future, considerably less ominous than it was formerly thoughtto be. Thus, although service on existing debt rises from about $64 millionin 1964/65 to over $85 million in 1968/69 (the peak year of service onpresent debt), exports are expected to increase about propartionately sothat the ratio would remain at about 10 per cent. Including service on thenew debt that should be incurred to finance the Third Plan, the debt serviceratio will rise to about 17 per cent by 1969/70.
239. In the chart (line B), we have projected Pakistan's foreign publicdebt service tbrough 1978/79 under the assumption that the amount of foreignassistance required will average about $600 million a year and that it willbe provided on the same terms as last year's consortium pledges. We haveassumed that the growth of exports will not continue at the Third Plan rateafter 1970 but will decline to 6 per cent a year. This seems realistic inview of the likely reduction in the growth of such items as jute manufac-tures. We would expect, however, that this would be compensated by a corres-ponding slow-down in the growth of imports. In any event, these longer-termprojections do not alter the fact that debt service is likely to require over20 per cent of Pakistan's foreign exchange earnings starting about 1974/75.
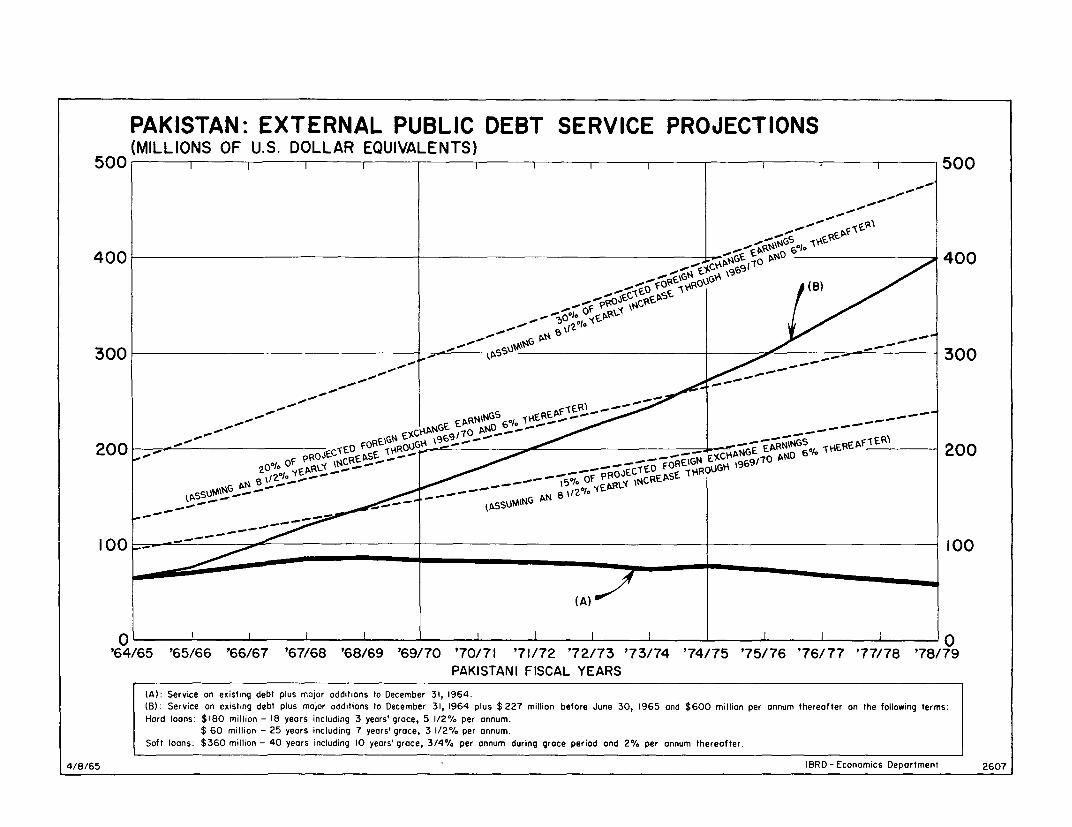
PAKISTAN: EXTERNAL PUBLIC DEBT SERVICE PROJECTIONS(MILLIONS OF U.S. DOLLAR EQUIVALENTS)
500 I I 1 1 1 I E X 500
400 4 400
300 300
AP,%AKITN,ISA ER
- - ~ o
200/65 IBD-coomc Departmt - Q4
2002o00/ 0
jF-TE SE TAft- 1907oFPpoJECCRE~A
I 00~ ~~~~~~~~-~NB~ 100
(A)
0 0 _ _ _ _ _ _ _ _ _ _ _ _ _ _'64/65 '65/66 '66/67 '67/68 '68/69 '69/70 '70/71 '71/72 '72/73 '73/74 '74/75 '75/76 '76/77 '77/78 '78/79
PAKISTANI FISCAL YEARS
4/8/65 I BRD - Economics Department 2607
- 76 -
Out of $600 million a year gross capital inflow, by 1978/72 over $216 millionwould be required for amortization. The resulting net capital inflow of$384 million is only a little over half that required for Pakistan's Perspec-tive Plan (Appendix table 35). In an economny so heavily dependent on agri-culture this must be considered rather large, thus emphasizing again the needfor as much aid as possible on easy terms. However, thankcs to her exportperformance and prospects as well as the overall growth of the economy,Pakistan now appears to be more creditworthy for some additional loans onconverntional terms. The Mission would hope that they will not need to exceedabout 20 per cent of her aid requirements.
Economic Policies.
240. In the 1963/64 and 1964/65 budgets, the Government took tax measuresadequate to meet the fiscal requirements of the Second Plan and particularlyin 1964/65 to substitute tariffs and internal taxes for direct import controlsas a means of containing demand for imports. However, the Government has uti-lized only a portion of the authority given to it in the 1964/65 budget toimpose higher levies on imported goods. The Mission believes that this autho-rity should be much more fully utilized in the future to the advantage of boththe balance of payments and the fiscal positioni of the Government and shouldbe extended to items not on the free list. Also, in the field of taxation, wehave made a number of other recommendations (see Annex 9), notably, suggestionsmade in previous reports that the time has now come to reduice the incentivesgiven to industries in the form of tax holidays and to treat income from agri-culture on the same basis as other incomes insofar as direct taxation is con-cerned. Certainly, these and other measures will be necessary to meet thefinancial requirements of the public sector program.
241. In respect of monetary policy, the Mission feels that the measures(see paragraph 45) taken early this year were necessary and in no way incom-patible with the Government's trade liberalization program. In fact, theywere very necessary to enable this program to be carried out without a conti-nuing excessive drain on the country's foreign exchange reserves. A betterbalanced flow of industrial materials, components and spare parts is requiredas the next step in trade liberalization. However, the Mission does not be-lieve that further large-scale import liberalization should be undertaken untilthe increase in exports forecast by the Government becomes a reality. In thisconnection, it would be desirable to abolish the remaining export tax on rawjute in order to provide adequate incentives for increase in production whichwill be necessary to meet the export targets. In respect of exports of indus-trial products, the Mission understands that the Government intends to continuethe present simplified export bonus arrangements. While this scheme needs tobe continued for the time being, it should be further simplified and modifiedto become a more effective instrument of export promotion and import liberali-zation.
242. Ln addition to the obvious need of Pakistan for rapid economicgrowth, the country's most serious problems are the apparently still risingrate of population growth and the large amount of unemployment or under-employment in both the rural and urban areas. IJhile a program of populationcontrol is clearly essential, it will not cope with unemployment over thenext several Five-Year Plans. While recent estimates of the growth in jobsduring the Third Plan indicates that some inroads will be made into the 20 per
- 77 -
cent unemploynent, the liiission has doubts regarding its statistical basisfor this forecast. During the Second Plan, the growth of jobs barely keptpace with the increase of labor force. IJhile the tripling of the ruralworks program may contribute considerably to reducing rural unemployment,the capital intensive character of much of the planned industrial invest-ment in the Third Plan may result in a larger investment per new workerthan the economy can afford. The M4ission believes that the Governmentneeds to take more account of this factor than it has done up to now insanctioning projects.
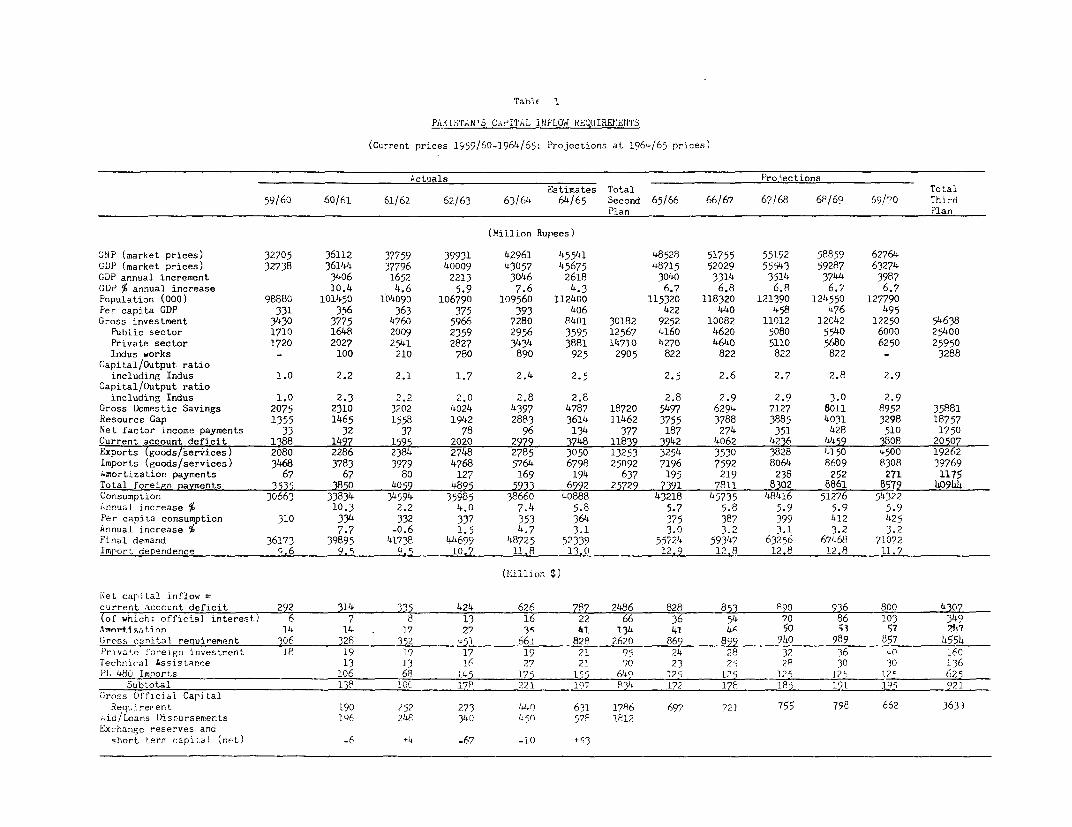
Tablf 1
PAKSlTANS CA,PITA~L !NFLO1Y REQUIREIENTS
(Current prices 1959/6o-1.964/65; Projections at, 1964/65 prices)
Actuals Pro jectionsEstimates Total Total
59/6o 60/61 61/62 62/63 63/04 64/65 Second 65/66 66/67 67/68 6P/69 69/70 ThirdPlan Plan
(Million Rupees)
GNP (market prices) 32705 36112 37759 39931 42961 45541 48528 51755 55192 58859 62764GDP (market prices) 32738 36144P 37796 40009 43057 45675 48715 52029 55543 592897 63274GDP annual increment 3406 1652 2213 3046 2618 3040 3314 3514 3744 3987GDP % annual increase 10.4 4.6 5.9 7.6 4.3 6.7 6.8 6.8 6.7 6.7Population (000) 98880 101450 1:04090 106790 109560 112400 115320 118320 121390 124550 127790Per capita GDP 331 356 363 375 393 406 422 440 458 476 495Gross investment 3430 3775 4760 5966 7280 8401 30182 9252 10082 11012 12042 12250 54638Public sector 1710 1648 2009 2359 2956 3595 12567 4160 4620 5080 5540 6000 25400Private sector 1720 2027 2541 2827 3434 3881 14710 4270 4640 5110 5680 6250 25950Indus works - 100 210 780 890 925 2905 822 822 822 822 - 3288Capital/Output ratio
including Indus 1.0 2.2 2.1 1.7 2.4 2.5 2.5 2.6 2.7 2.8 2.9Capital/Output ratioincluding Indus 1.0 2.3 2.2 2.0 2.8 2.8 2.8 2.9 2.9 3.0 2.9Gross Domestic Savingm 2075 2310 3202 4024 4397 4787 18720 5497 6294 7127 8011 8952 35881Resource Gap 1355 1465 1558 1942 2883 3614 11462 3755 3788 3885 4031 3298 18757Net factor income payments 33 32 37 78 96 134 377 187 274 351 428 510 1750Current account deficit 1388 1497 1595 2020 2979 3748 11839 3942 4062 4236 4459 38108 20507Exports (goos/esice) 200 2286 2384 2748 275 3050 13253 3254 3530 3828 4150 4500 196
Imports (goods/services) 3468 3783 3979 4768 5764 6798 25092 7196 7592 8064 8609 8308 39769iAimortization payments 67 67 80 127 169 194 637 195 219 238 252 271 1175Total foreiF-n paymsents 3535 3850 4059 4895 5933 6992 25729 7391 7811 8302 8861 8579 hO9LdConsumption 30663 338934 34594 35985 38660 40888 43218 45735 48416 51276 54322ionnual increase % 10.3 2.2 4.0 7.4 5.8 5.7 5.8 5.9 5.9 5.9Per capita consumption 310 334 332 337 353 364 375 387 399 412 425Annual increase % 7.7 -0.6 1.5 4.-7 3.1 3.0 3.2 3.1 3.2 3.2Final demand 361-73 39895 41738 L44699 48725 512339 55724 59347 63256 67468 71072lImport dependence o6 9.51 0.5 10.7 11.8 13.0 12.9 12.8 12.8 1.2.8 13.7
(I-aillion $)
Net capital inflow current account deficit 292 314 335 424 626 787 2486 828 853 P.90 936 800 4307?(of which: offici-al intere-t. 6 78 13 6 22 66 365 086 103 349ArmortiA ziAon 14 IL- 17 27 3- 41. 134 41 48 50 53 57 7Orposs canital requirement 306 328 352 451 - -661 828 2620 869 899 94~0 989 857 )tSShprivate fn,eign investment 1 19 i 19 17 19 21 95 24 28 32, 36 40 160Techrical Assistance 13 ]3 16 27 21 90 23 25 2R 30 30 136PL 4890 Imports 106 68 145 17 5 155 6249 1251 12-5 I;,5 125 121 625
Subtotal 138 1 0( 178 221 -197, R34 172 178 18L 191 195 921"inrca Official CapitalRequ.irer en t 190 ?52 273 144 631 1786 697? 72) 755 798 662 3633
;.id/t,oans Disrursements 196, 244F 340 n 050-, 578 1812Exchange reserves and
short. terrr capi:.a. (net) -6 + -67 -10 453
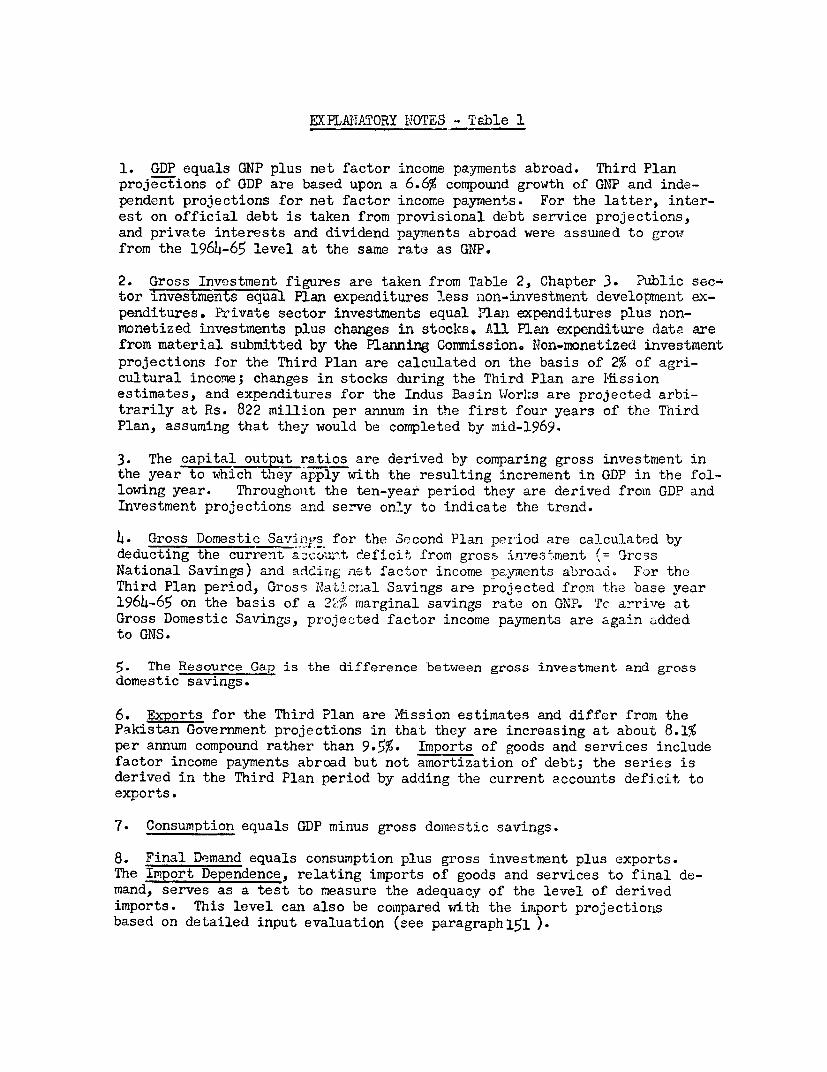
EXPLANATORY NOTES - Table 1
1. GD? equals GNP plus net factor income payments abroad. Third Planprojections of GDP are based upon a 6.6% compound growth of GNP and inde-pendent projections for net factor income payments. For the latter, inter-est on official debt is taken from provisional debt service projections,and private interests and dividend payments abroad were assuiaed to growfrom the 1964-65 level at the same rate as GNP.
2. Gross Investment figures are taken from Table 2, Chapter 3. Public sec-tor investineM eq`ta1 Plan expenditures less non-investment development ex-penditures. Peivate sector investments equal Plan expenditures plus non-monetized investments plus changes in stoclks. All Plan expenditure data arefrom material submitted by the Planning Commission. Non-monetized investmentprojections for the Third Plan are calculated on the basis of 2% of agri-cultural income; changes in stocks during the Third Plan are M4issionestimates, and expenditures for the Indus Basin Works are projected arbi-trarily at Rs. 822 million per annum in the first four years of the ThirdPlan, assuming that they would be completed by mid-1969.
3. The capital output ratios are derived by comparing gross investnment inthe year to which they apply with the resulting increment in GDP in the fol-lowing year. Throughoutt the ten-year period they are derived from GDP andInvestment projections and serve only to indicate the trend.
4. Gross Domestic Savlnos for the Second Plan period are calculated bydeducting the current az:court deficit from gross invest.ment (= GrcssNational Savings) and addirng net factor income payments abroad. For theThird Plan period, Gross Naticnal Savings are projected from the base year1964-65 on the basis of a 2,5 rnarginal savings rate on GNP. To arrive atGross Domestic Savings, projected factor income payments are again addedto GNS.
5. The Resource Gap is the difference between gross investment and grossdomestic savings.
6. Exports for the Third Plan are Mission estimates and differ from thePakistan Government projections in that they are increasing at about 8.1%per annum compound rather than 9.5%. Imports of goods and services includefactor income payments abroad but not amortization of debt; the series isderived in the Third Plan period by adding the current accounts deficit toexports.
7. Consumption equals GDP minus gross domestic savings.
8. Final Demand equals consumption plus gross investment plus exports.The Import Dependence, relating imports of goods and services to final de-mand, serves as a test to measure the adequacy of the level of derivedimports. This level can also be comnpared with the import projectionsbased on detailed input evaluation (see paragraphl51 )-
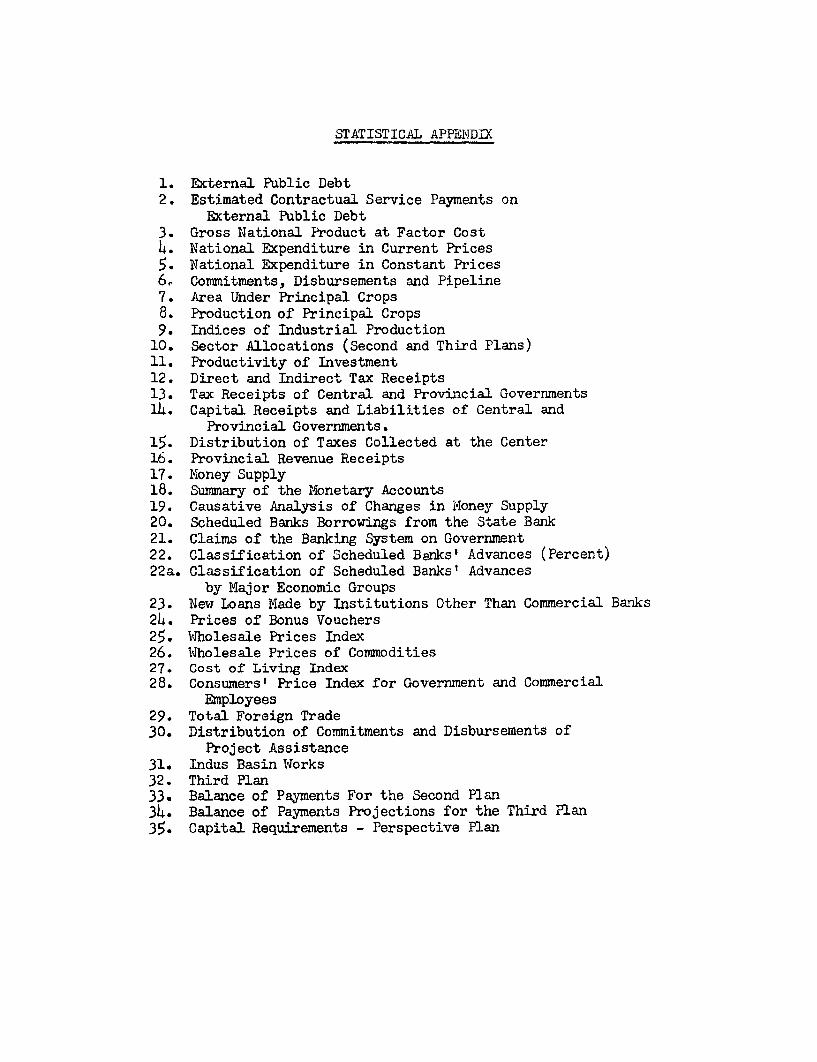
STATISTICAL APPENDSD
1. External Public Debt2. Estimated Contractual Service Payments on
External Public Debt3. Gross National Product at Factor Cost4. National Expenditure in Current Prices5. National Expenditure in Constant Prices6. Commitments, Disbursements and Pipeline7. Area Under Principal Crops8. Production of Principal Crops9. Indices of Industrial Production
10. Sector Allocations (Second and Third Plans)11. Productivity of Investment12. Direct and Indirect Tax Receipts13. Tax Receipts of Central and Provirncial Governments14. Capital Receipts and Liabilities of Central and
Provincial Governments.15. Distribution of Taxes Collected at the Center16. Provincial Revenue Receipts17. Money Supply18. Sunmiary of the Monetary Accounts19. Causative Analysis of Changes in Money Supply20. Scheduled Banks Borrowings from the State Bank21. Claims of the Banking System on Government22. Classification of Scheduled Banks' Advances (Percent)22a. Classification of Scheduled Banks' Advances
by Major Economic Groups23. New Loans Made by Institutions Other Than Commercial Banks24. Prices of Bonus Vouchers25. Wholesale Prices Index26. Wholesale Prices of Commodities27. Cost of Living Index28. Consumers' Price Index for Government and Commercial
Employees29. Total Foreign Trade30. Distribution of Commitments and Disbursements of
Project Assistance31. Indus Basin Works32. Third Plan33. Balance of Payments For the Second Plan34. Balance of Payments Projections for the Third Plan35. Capital Requirements - Perspective Plan
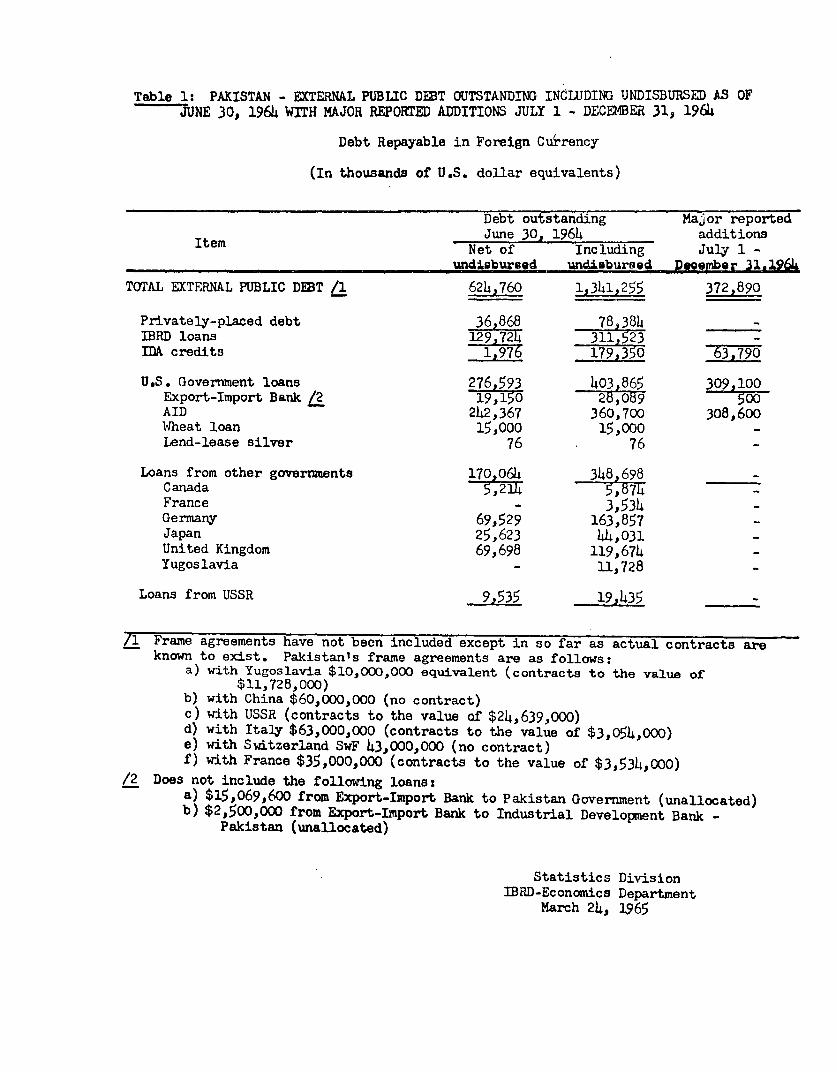
Table 1: PAKISTAN - EXTERNAL PUBLIC DEBT OUTSTANDING INCLUDING UNDISBURSED AS OFJUNE 30, 1964 WITH MAJOR REPORTED ADDITIONS JULY 1 - DECEMBER 31, 1964
Debt Repayable in Foreign Currency
(In thousands of U.S. dollar equivalents)
Debt outstanding Major reportedItem June 30, 1964 additions
Net of Including July 1 -_undisbursed undiaburesd Pgcember 11.1964
TOTAL EXTERNAL PUBLIC DEBT /1 624,760 1,341,255 372,890
Privately-placed debt 36,868 78,384 IBRD loans 1292724 311,523 -IDA credits 16 179,350 63,790
U,S. Government loans 276,593 403,865 309.100Export-Import Bank /2 19,1502O 500AID 2h2,367 360,700 308,600IWheat loan 15,000 15,000-Lend-lease silver 76 76
Loans from other governments 170 064 348 698 -CanadaFrance - 3,534 -Germany 69,529 163,857 -Japan 25,623 44,031 _United Kingdom 69,698 119,674 -Yugoslavia - 11,728 -
Loans from USSR 9,535 19,435 _
/1 Frame agreements have not been included except in so far as actual contracts areknown to exist. Pakistan's frame agreements are as follows:
a) with Yugoslavia $10,000,000 equivalent (contracts to the value of$11,728,000)
b) with China $60,000,000 (no contract)c) with USSR (contracts to the value of $24,639,000)d) with Italy $63,000,000 (contracts to the value of $3,054,00o)e) with Switzerland SwF 43,000,000 (no contract)f) with France $35,000,000 (contracts to the value of $3,534,000)
/2 Does not include the following loans:a) $15,069,600 from Export-Import Bank to Pakistan Government (unallocated)b) $2,500,000 from Export-Import Bank to Industrial Developnient Bank -
Pakistan (unallocated)
Statistics DivisionIBRD-Econamics Department
March 24, 1965
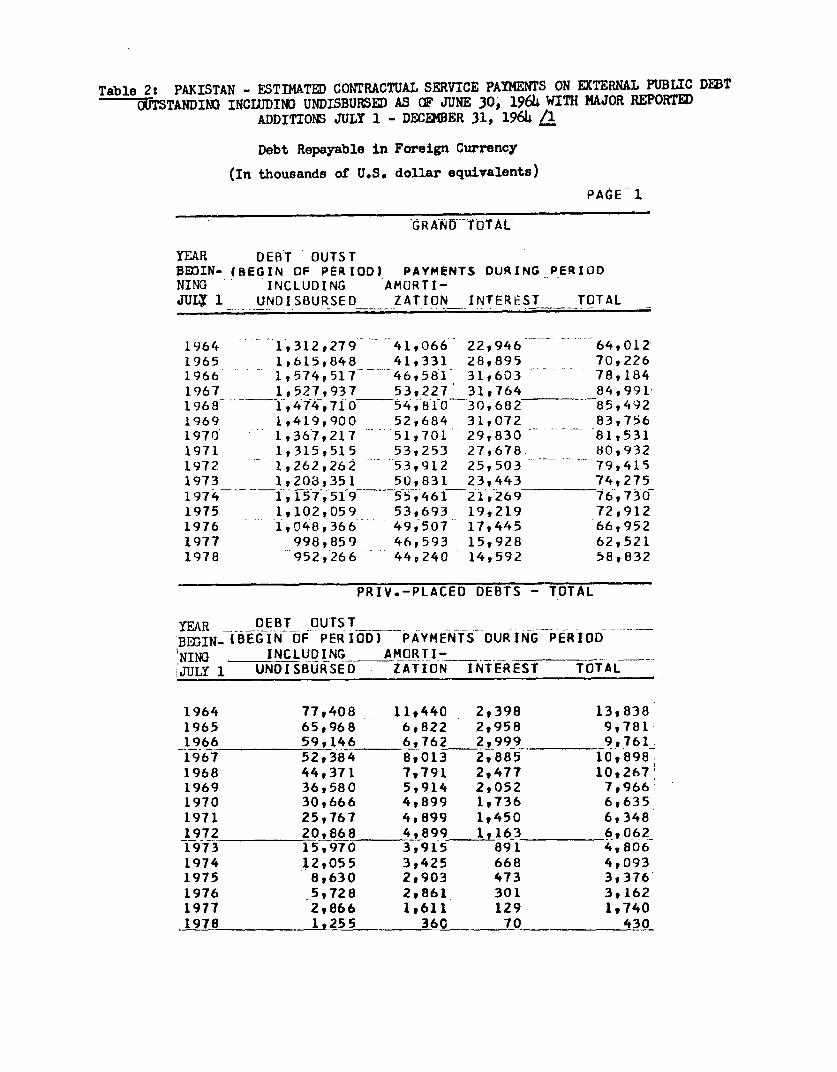
Table 2: PAKISTAN - ESTIMATED CONTRACTUAL SERVICE PAYMES ON EXTERNAL PUBLIC DEBTOUTSTANDIN3 INCUDING UNDISBURSED AS OF JUNE 30, l964 WITH MAJOR REPORTED
ADDITION JULY 1 - DECEMBER 31, 1964 /1
Debt Repayable in Foreign Currency
(In thousands of U.So dollar equivalents)
PAGE 1
-GRAND-- TOtAL
YEAR DEBT OUTSTBEGIN- (BEGIN OF PERIOD) PAYMENTS DURING PERIODNING INCLUDING AMORTI-JUIJ 1 UNDISBURSED ZATION INTEREST TOTAL
1964 1,312,279 41,066 22,946 64,0121965 1,615,848 41,331 28,895 70,2261966 1,574,517 46,581 31,603 78,1841967 1,527,937 53,227 31,764 84,9911968 1,474,710 54,810 3O,682 85,4921969 1,419,900 52,684 31,072 83,7561970 1,367,217 51,701 29,830 81,5311971 1,315,515 53,253 27,678. 80,9321972 1,262,262 53,912 25,503 79,4151973 1,203,351 50,831 23,443 74,2751974 1,157,519 55,'461 21,269 76,7301975 1,102,059 53,693 19,219 72,9121976 1,048,366 - 49,507 17,445 66,9521977 998,859 46,593 15,928 62,5211978 952,266 44,240 14,592 58,832
PRIV.-PLACED DEBTS - TOTAL
YEAR _ DEBT OUtSTBrnIN_-(BEGIN OF PERIOD) PAYMENTS DURING PERIODNING INCLUDING AMORTI-__ __ __JULY 1 UNDISflURSED zATION INTEREST TOTAL
1964 77,408 11,440 2,398 13,8381965 65,968 6,822 2,958 9,7811966 59,146 6,762 2,999 9,1611967 52,384 8,013 2,885 10,8981968 449371 7,791 2,477 10926711969 36,580 5,914 2,052 7,9661970 30,666 4,899 1,736 6,6351971 25,767 4,899 1,450 6,3481972 20,868 4,899 1,_63 6,0621973 15,970 3,915 891 4,8061974 12,055 3,425 668 4,0931975 8,630 2,903 473 393761976 5,728 2,861 301 3,1621977 2,866 1,611 129 1,7401978 1,255 360 70 430
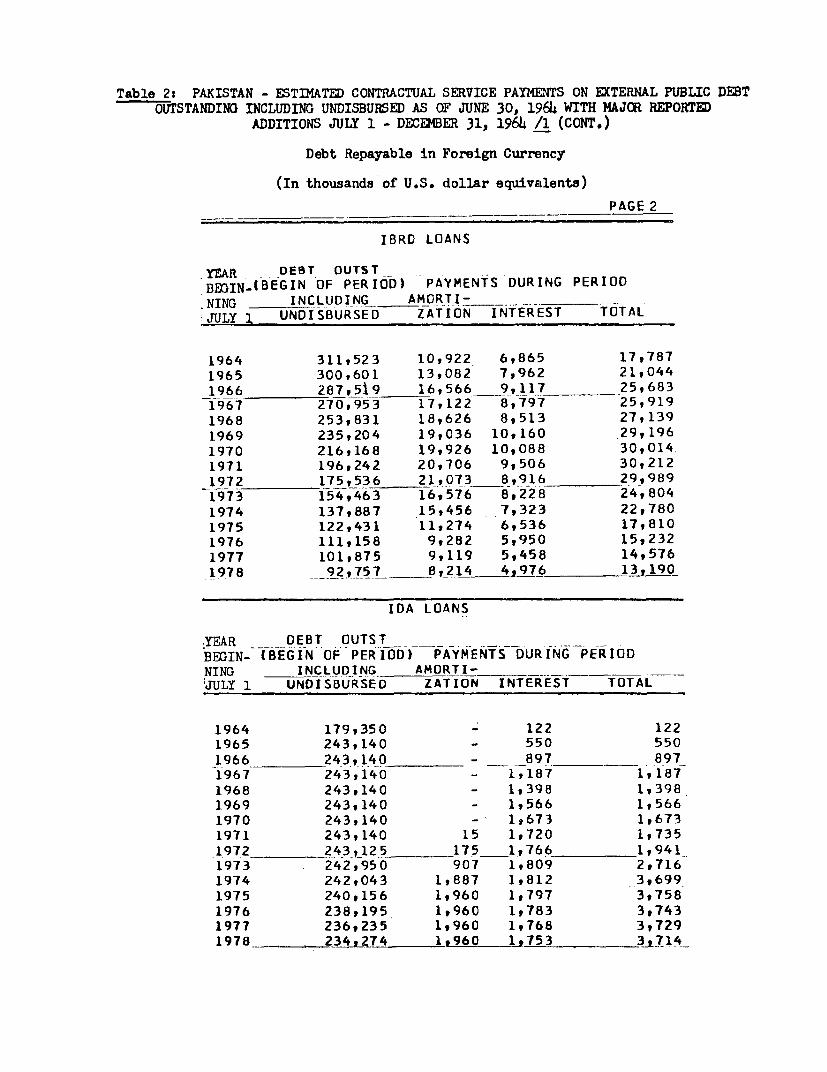
Table 2: PAKISTAN - ETfKATED CONTRACTUAL SERVICE PAYMENTS ON EXTERNAL PUBLIC DEBTOUTSTANDINO INCLUDIN UNDISBURIED AS OF JUNE 30, l964 WITH MAJCR REPORTED
ADDITIONS JULY 1 - DECEMBER 31, 1964 /1 (CONT.)
Debt Repayable in Foreign Currency
(In thousands of U.S. dollar equivalents)
PAGE_2
IBRD LOANS
YEAR DEST OUTSTBEGINBIBEGIN OF PERIOD) PAYMENTS DURING PERIOD.NING INCLUDING AMORTI- __ _
jULY 1 UNDISBURSED ZATION INTEREST TOTAL
1964 311,523 10,922 6,865 17,7871965 300,601 13,082 7,962 21,0441966 287,5i9 16,566 9,117 25,6831967 270,953 17,122 8,797 25,9191968 253,831 18,626 8,513 27,1391969 235,204 19,036 10,160 29,1961970 216,168 19,926 10,088 30,0141971 196,242 20,706 9,506 30,2121972 175,536 21,073 8,916 29,9891973 154,463 16,576 8,228 24,8041974 137,887 15,456 7,323 22,7801975 122,431 11,274 6,536 17,8101976 111,158 9,282 5,950 15,2321977 101,875 9,119 5,458 14,576
1978 _92757 8_214 4,976 13 190
IDA LOANS
YEAR DEBT OUTSTBEGIN- (BEGIN OF PERIOD) PAYMENTS DURING PERIODNING INCLUDING AMORTI-_ __ __ _JULY 1 UNDISBURSED ZATION INTEREST TOTAL
1964 179,350 - 122 1221965 243,140 - 550 5501966 243,140 - 897 8971967 243,140 - 1,187 1,1871968 243,140 - 1,398 1,3981969 243,140 - 1,566 1,5661970 243,140 - 1,673 1,6731971 243,140 15 1,720 1,7351972 243,_125 175_1,766 1,9411973 242,950 907 1,809 2,7161974 242,043 1,887 1,812 3,6991975 240,156 1,960 1,797 3,7581976 238,195 1,960 1,783 3,7431977 236,235 1,960 1,768 3,7291978 234,274 1,960 1,753 3 kt 1 4
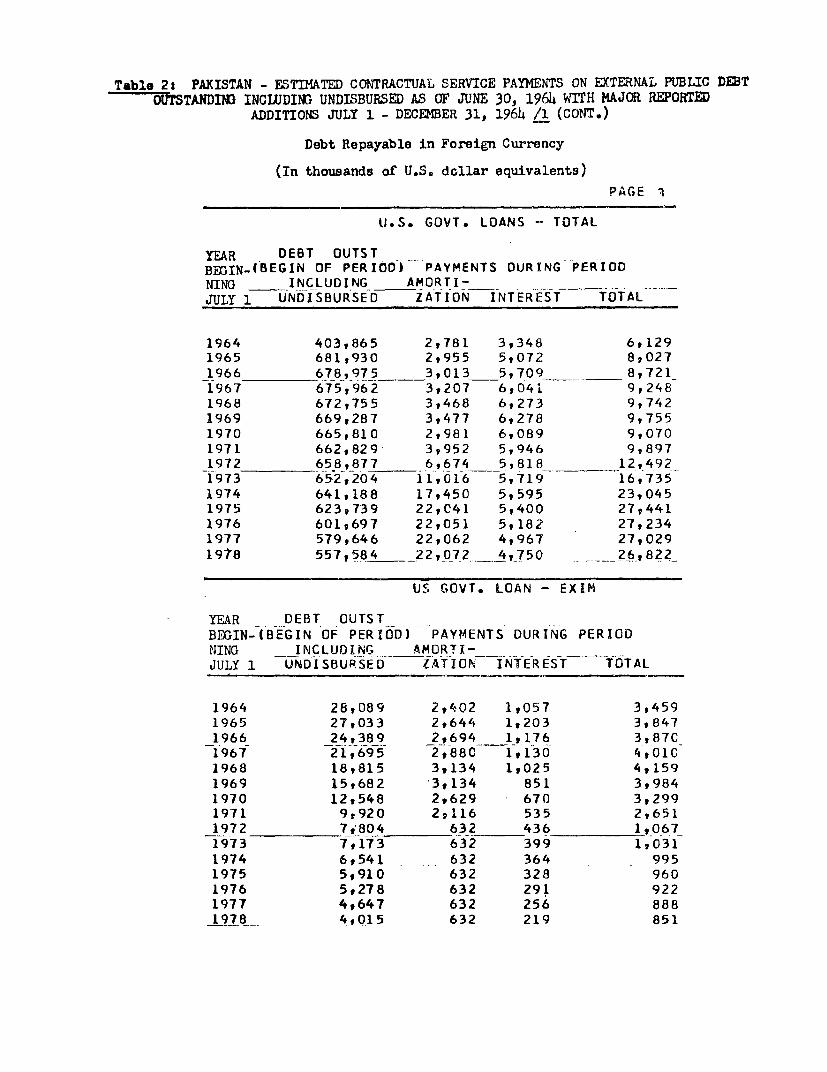
Table 2: PAKISTAN - ESTIMTED CONTRACTUAL SERVICE PAYMENTS ON EXTERNAL PUBLIC DEBTRITSTANDII3 INCWDING UNDISBURSED AS OF JUNE 30, 1964 WITH MAJOR REPORTED
ADDITIONS JULY 1 - DECE25ER 31, 1964 /1 (CONT.)
Debt Repayable in Foreign Currency
(In thousands of U.S. dollar equivalents)
PAGE i
U.S. GOVT. LOANS -- TOTAL
ER DEBT OUTSTBEGIN-(BEGIN OF PERIOD) PAYMENTS DURING PERIODNINC} INCLUDING AMORTI-___JULY 1 UNDISBURSED ZATION INTEREST TOTAL
1964 403,865 2,781 3,348 6,1291965 681,930 2,955 5,072 8,0271966 678,975 3,013 5,709_ 8,7211967 675,962 3,207 6,041 9,2481968 672,755 3,468 6,273 9,7421969 669,287 3,477 6,278 9,7551970 665,810 2,981 6,089 9,0701971 662,829 3,952 5,946 998971972 658,877 6,674 5,818 12,4921973 652,204 11,016 5,719 16,7351974 641,188 17,450 5,595 23,0451975 6239739 22,041 5,400 2794411976 601,697 22,051 5,182 27,2341977 579,646 22,062 4,967 27,0291978 557,584 _22,072._ 4,750 26,822
US GOVT. LOAN - EXIM
YEAR DEBT OUTSTBEGIN-(BEGIN OF PERIOD) PAYMENTS DURING PERIODNING INCLUDING AMORTl-____JULY 1 UNDISBUP.SED tATION INTEREST TOTAL
1964 28,089 2,402 1,057 3,4591965 27,033 2,644 1,203 3,8471966 24,389 2,694 1,176 3,87C1967 21t695 2,880 1,130 4t01C1968 18,815 3,134 1,025 4,1591969 15,682 3,134 851 3,9841970 12,548 2,629 670 3t2991971 9r920 2P116 535 2,6511972 7,804 632 436 1t0671973 7,173 632 399 103 11974 6,541 632 364 9951975 5,910 632 328 9601976 5,278 632 291 9221977 4,647 632 256 8881978 4,015 632 219 851
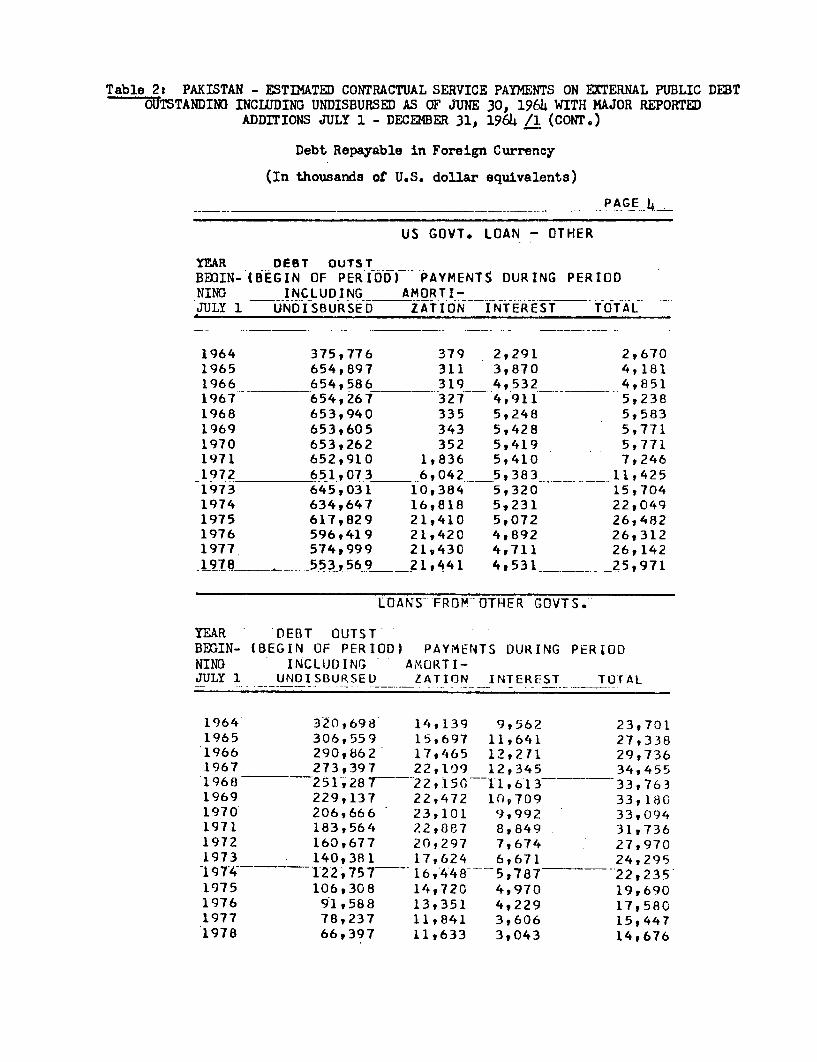
Table 2: PAKISTAN - ESTIKATED CONTRACTUAL SERVICE PAYMENTS ON EXTERNAL PUBLIC DEBTOUTSTANDING INCLUDING UNDISBURSED AS OF JUNE 30, l964 WITH MAJOR REPORTED
ADDTrIONS JULY 1 - DECEM2BER 31, 1964 /1 (CONT.)
Debt Repayable in Foreign Currency
(In thousands of U.S. dollar equivalents)
__ ___________________________________ _ _ _ PAGE 4 _
US GOVT. LOAN - OTHER
YEAR DEST OUTSTBE3IN- (BEGIN OF PERIOD) b AYMENTS DURING PERIODNING INCLUDING AMORTI-JULY 1 UNDISBURSED ZATION INTEREST TOTAL
1964 375,776 379 2,291 2,6701965 654,897 311 3,870 4,1811966 654,586 319 4,532 4,8511967 654,267 327 4,911 5,2381968 653,940 335 5,248 5,5831969 653,605 343 5,428 5,7711970 653,262 352 5,419 5,7711971 652,910 1,836 5,410 7,2461972 651,073 6,042 5,383 11,4251973 645,031 10,384 5,320 15,7041974 634,647 16,818 5,231 22,0491975 617,829 21,410 5,072 26,4821976 596,419 21,420 4,892 26,3121977 574,999 219430 4,711 26,142197 553,569 __21,441 4,531____ _25,971
LOANS-FROM--OTHER GOVTS.
YEAR DEBT OUTSTBEGIN- (BEGIN OF PERIOD) PAYM1ENTS DURING PERIODNING INCLUDING AMORTI-JULY 1 UNDISBURSED ZATION INTEREST TOTAL
1964' 320,698' 14,139 9,562 23,7011965 306,559 15,697 11,641 27,3381966 290,862 17,465 12,271 29,7361967 273,397 22,109 12,345 34,45519683 251-, 287---22,1tl-ll,613- - 33,7631969 229,137 22,472 10v709 33,1801970 206,666 23,101 9,992 33,0941971 183,564 22,887 8,849 31,7361972 160,677 20,297 7,674 27,9701973 _ 140,381 17,624 6,671_ 24,295
-197'4- '1'22,757- 16,'4'48--- 5,787 '22,2351975 106,308 14,720 4,970 19,6901976 91,588 13,351 4,229 17,5801977 78,237 11,841 3,606 15,4471978 66,397 11,633 3,043 14,676
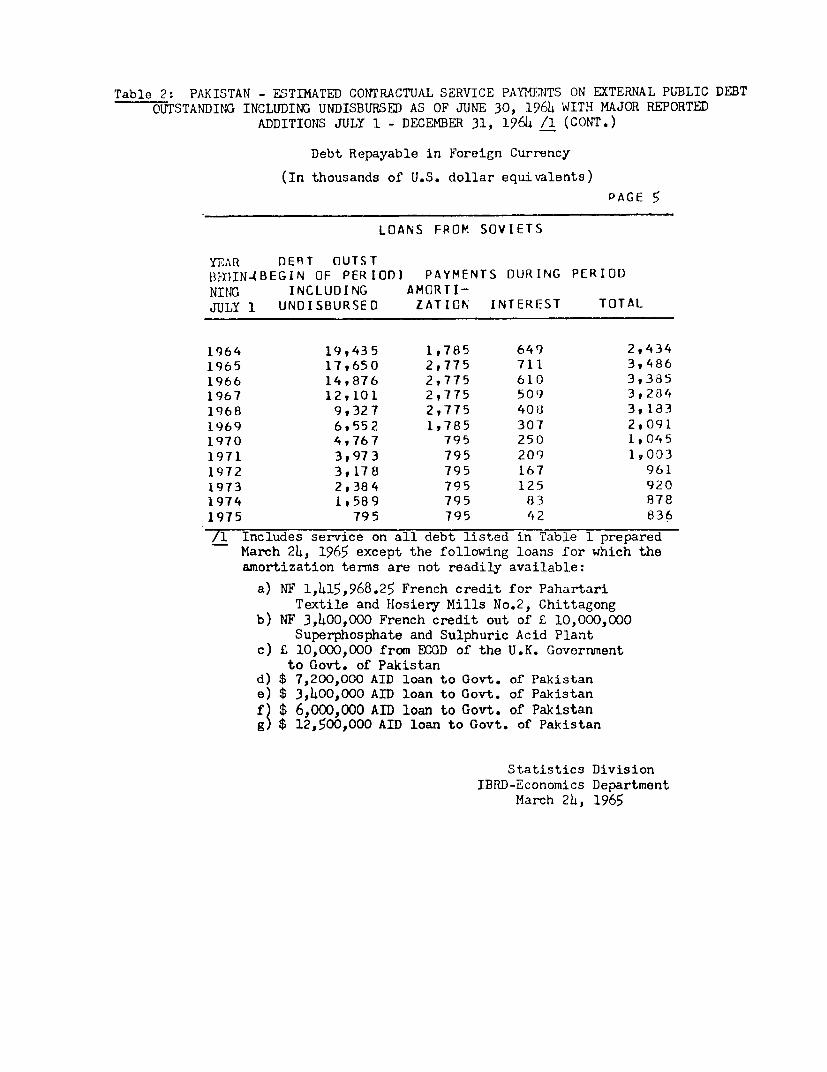
Table 2: PAKISTAN - ESTIMATED CONTRACTUAL SERVICE PAYMENTS ON EXTERNAL PUBLIC DEBTOUTSTANDING INCLUDING UNDISBURSED AS OF JUNE 30, 1964 WITH MAJOR REPORTED
ADDITIONS JULY 1 - DECEMBER 31, 1964 /1 (CONT.)
Debt Repayable in Foreign Currency
(In thousands of U.S. dollar equivalents)
PAGE 5
LOANS FROM SOVIETS
Y1-AR DEBT OUTSTBI3XIN-ABEGIN OF PERIOD) PAYMENTS DURING PERIODNING INCLUDING AMORTI-JULY 1 UNDISBURSED ZATION INTEREST TOTAL
1964 19,435 1,785 649 2,4341965 17,650 2,775 711 3,4861966 14,876 2,775 610 3,3851967 12,101 2,775 5019 3,2841968 9,327 2,775 4013 3,1331969 6,552 1,785 307 2,0911970 4,767 795 250 1,0451971 3,973 795 209 1,0031972 3,178 795 167 9611973 2,384 795 125 9201974 1,589 795 83 8781975 795 795 42 836
/1 Includes service on all debt listed in Table 1 preparedMarch 24, 1965 except the following loans for which theamortization terms are not readily available:
a) NF 1,415,968.25 French credit for PahartariTextile and Hosiery Mills No.2, Chittagong
b) NF 3,400,000 French credit out of £ 10,000,000Superphosphate and Sulphuric Acid Plant
c) £ 10,000,000 from ECGD of the U.K. Governmentto Govt. of Pakistan
d) $ 7,200,000 AID loan to Govt. of Pakistane) $ 3,400,000 AID loan to Govt. of Pakistanf) $ 6,000,000 AID loan to Govt. of Pakistang $ 12,500,000 AID loan to Govt. of Pakistan
Statistics DivisionIBRD-Economics Department
March 2h, 1965
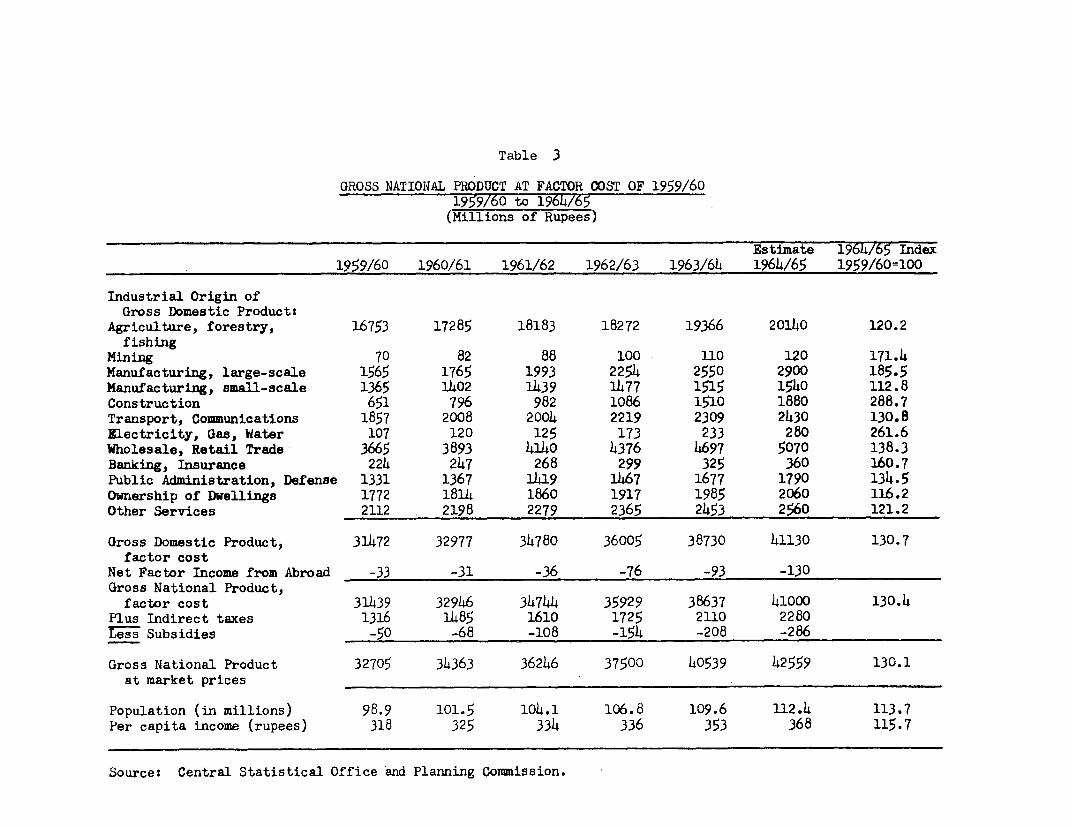
Table 3
GROSS NATIONAL PRODUCT AT FACTOR COST OF 1959/601959/60 to 1964/65
(Millions of Rupees)
Estimate 1964/65 Index1959/60 1960/61 1961/62 1962/63 1963/64 1964/65 1959/60=100
Industrial Origin ofGross Domestic Product:
Agriculture, forestry, 16753 17285 18183 18272 19366 20140 120.2fishing
Mining 70 82 88 100 110 120 171.4Manufacturing, large-scale 1565 1765 1993 2254 2550 2900 185.5Manufacturing, sm1ll-scale 1365 1402 1439 1477 1515 1540 112.8Construction 651 796 982 1086 1510 1880 288.7Transport, Communications 1857 2008 2004 2219 2309 2430 130.8Electricity, Gas, Water 107 120 125 173 233 280 261.6Wholesale, Retail Trade 3665 3893 4140 4376 4697 5070 138.3Banking, Insurance 224 247 268 299 325 360 160.7Public Administration, Defense 1331 1367 1419 1467 1677 1790 134.5Ownership of Dwellings 1772 1814 1860 1917 1985 2060 116.2Other Services 2112 2198 2279 2365 2453 2560 121.2
Gross Domestic Product, 31472 32977 34780 36005 38730 41130 130.7factor costNet Factor Income from Abroad -33 -31 -36 -76 -93 -130Gross National Product,
factor cost 31439 32946 34744 35929 38637 41000 130.4Plus Indirect taxes 1316 1485 1610 1725 2110 2280ress Subsidies -50 -68 -108 -154 -208 -286
Gross National Product 32705 34363 36246 37500 40539 42559 130.1at market prices ___
Population (in millions) 98.9 101.5 104.1 106.8 109.6 112.4 113.7Per capita income (rupees) 318 325 334 336 353 368 115.7
Sourcet Central Statistical Office and Planning Commission.
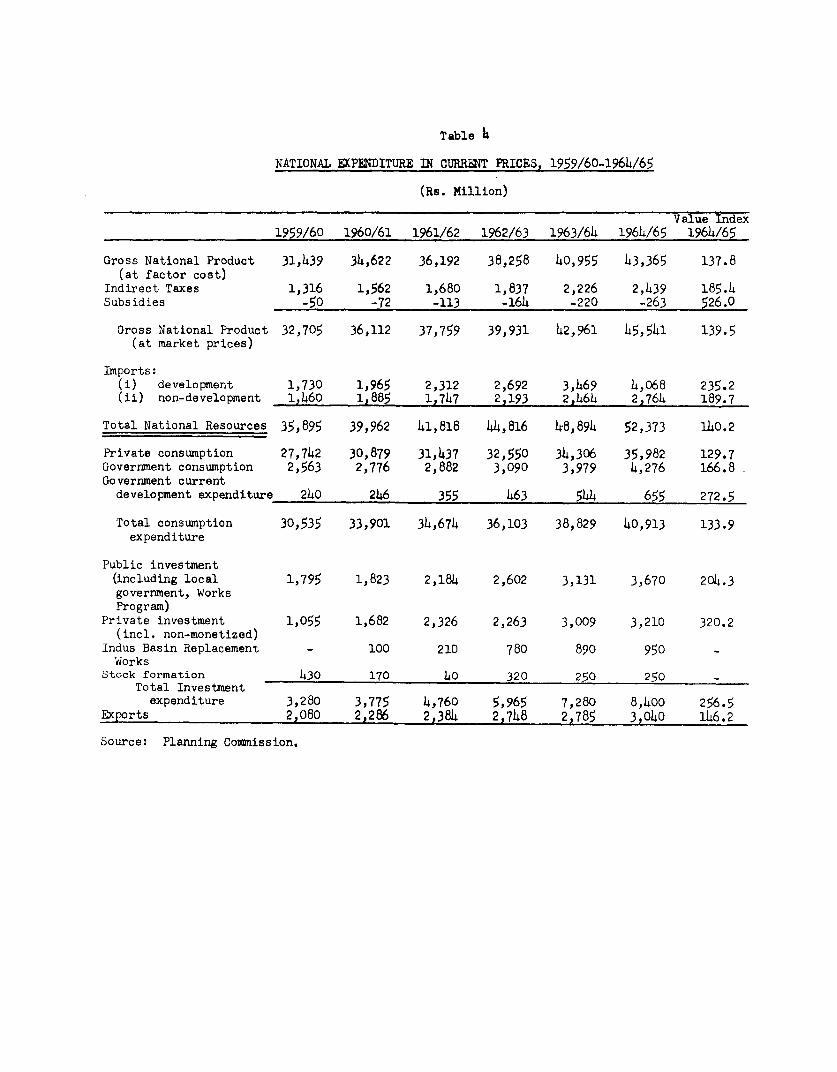
Table 4
NATIONAL EXPENDITURE IN CURRENT PRICES, 1959/60-1964/65
(Rs. Million)
Value Index
1959/60 1960/61 1961/62 1962/63 1963/64 1964/65 1964/65
Gross National Product 31,439 34,622 36,192 38,258 40,955 43,365 137.8(at factor cost)
Indirect Taxes 1,316 1,562 1,680 1,837 2,226 2,439 185.4Subsidies -50 -72 -113 -164 -220 -263 526.0
Gross National Product 32,705 36,112 37,759 39,931 42,961 45,541 139.5(at market prices)
Imports:(i) development 1,730 1,965 2,312 2,692 3,469 4,068 235.2
(ii) non-development 1,460 1,885 1,747 2,193 2,464 2,764 189.7
Total National Resources 35,895 39,962 41,818 44,816 48,894 52,373 140.2
Private consumption 27,742 30,879 31,437 32,550 34,306 35,982 129.7Government consumption 2,563 2,776 2,882 3,090 3,979 4,276 166.8Government current
development expenditure 240 246 355 463 544 655 272.5
Total consumption 30,535 33,901 34,674 36,103 38,829 40,913 133.9expenditure
Public investment(including local 1,795 1,823 2,184 2,602 3,131 3,670 204.3government, WorksProgram)
Private investment 1,055 1,682 2,326 2,263 3,009 3,210 320.2(incl. non-monetized)
Indus Basin Replacement - 100 210 780 890 950 -
WorksStock formation 430 170 40 320 250 250 -
Total Investmentexpenditure 3,280 3,775 4,760 5,965 7,280 8,400 256.5
Exports 2,080 2,286 2,384 2,748 2,785 3,040 146.2
Source: Planning Commission.
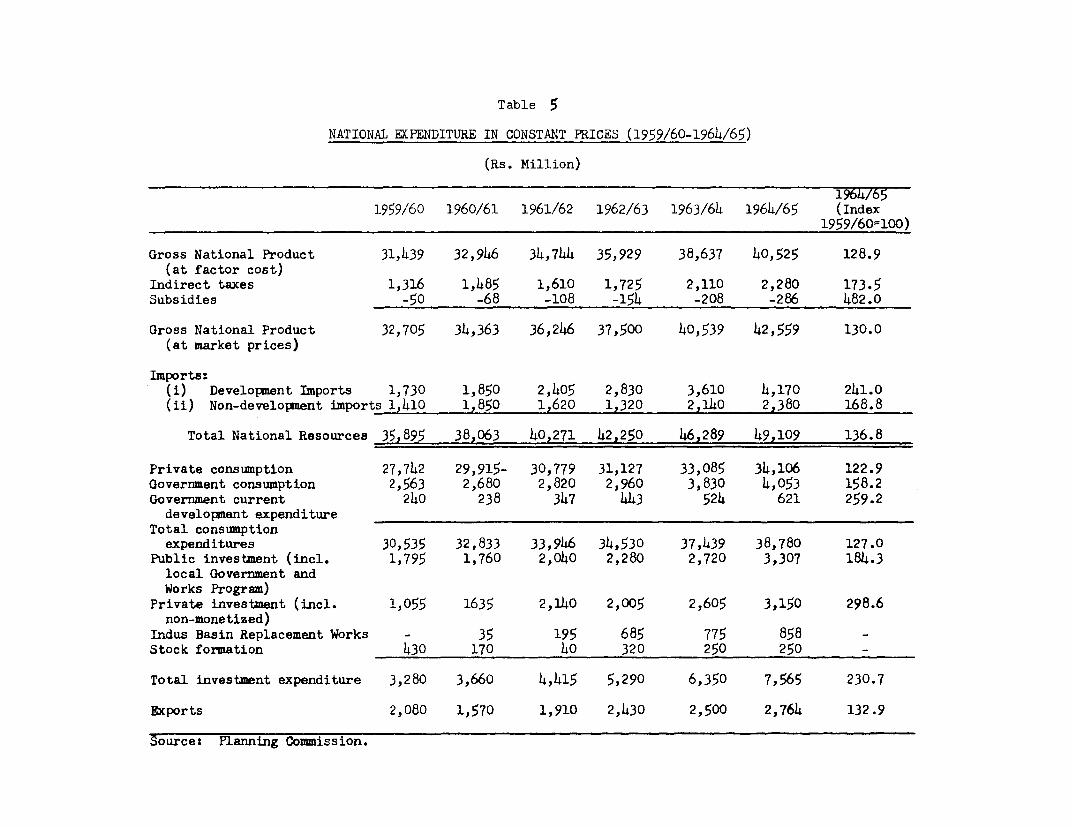
Table 5
NATIONAL EX PEDITURE IN CONSTANT PRICES (1959/60-1964/65)
(Rs. Million)
1964/651959/60 1960/61 1961/62 1962/63 1963/64 1964/65 (Index
1959/60=100)
Gross National Product 31,439 32,946 34,744 35,929 38,637 40,525 128.9(at factor cost)
Indirect taxes 1,316 1,485 1,610 1,725 2,110 2,280 173.5Subsidies -50 -68 -108 -154 -208 -286 482.0
Gross National Product 32,705 34,363 36,246 37,500 40,539 42,559 130.0(at market prices)
Imports:(i) Development Imports 1,730 1,850 2,405 2,830 3,610 4,170 241.0(ii) Non-development imports 1,410 1,850 1,620 1,320 2,140 2,380 168.8
Total National Resources 35,895 38,063 40,271 42,250 46,289 49,109 136.8
Private consumption 27,742 29,915- 30,779 31,127 33,085 34,106 122.9Government consumption 2,563 2,680 2,820 2,960 3,830 4,053 158.2Government current 240 238 347 443 524 621 259.2development expenditure
Total consumptionexpenditures 30,535 32,833 33,946 34,530 37,439 38,780 127.0
Public investment (incl. 1,795 1,760 2,040 2,280 2,720 3,307 184.3local Government andWorks Program)
Private investment (incl. 1,055 1635 2,140 2,005 2,605 3,150 298.6non-monetized)
Indus Basin Replacement Works - 35 195 685 775 858 -Stock formation 430 170 40 320 250 250 -
Total investment expenditure 3,280 3,660 4,415 5,290 6,350 7,565 230.7
Exports 2,080 1,570 1,910 2,430 2,500 2,764 132.9
Source: Planning Commission.
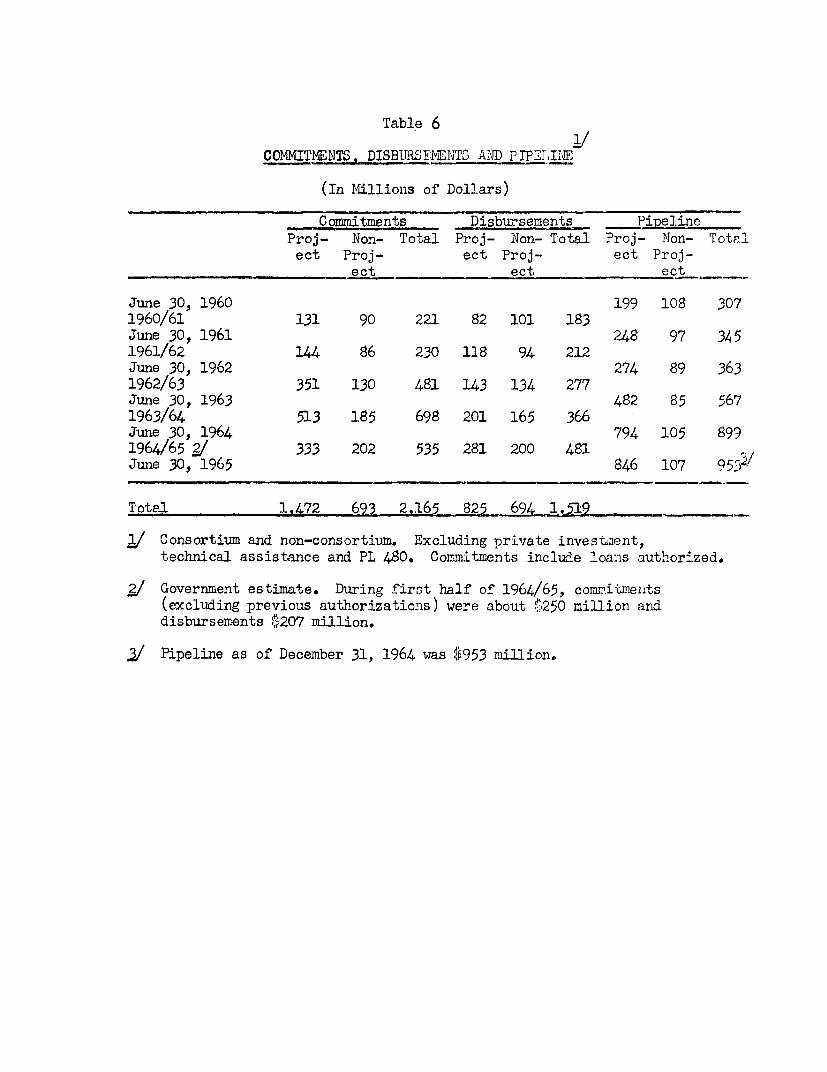
Table 6
COMMITMENTS, DISBURSEMENTS A:JD PIPT,INE
(In Millions of Dollars)
Commitments Disbursements PiDOlineProj- Non- Total Proj- Non- Total Proj- Non- Totalect Proj- ect Proj- ect Proj-
ect ect ect
June 30, 1960 199 108 3071960/61 131 90 221 82 101 183June 30, 1961 248 97 3451961/62 144 86 230 118 94 212June 30, 1962 274 89 3631962/63 351 130 481 143 134 277June 30, 1963 482 85 5671963/64 513 185 698 201 165 366June 30, 1964 794 105 8991964/65 g/ 333 202 535 281 200 481June 30, 1965 846 107 95.3
Total 1,472 693 2,165 825 694 11519_
2,/ Consortium and non-consortium. Excluding private investnent,technical assistance and PL 480. Commitments include loans authorized.
2/ Government estimate. During first half of 1964/65, comnitfmelets(excluding previous authorizations) were about i250 million arnddisbursements $207 million.
.2/ Pipeline as of December 31, 1964 was $953 million.
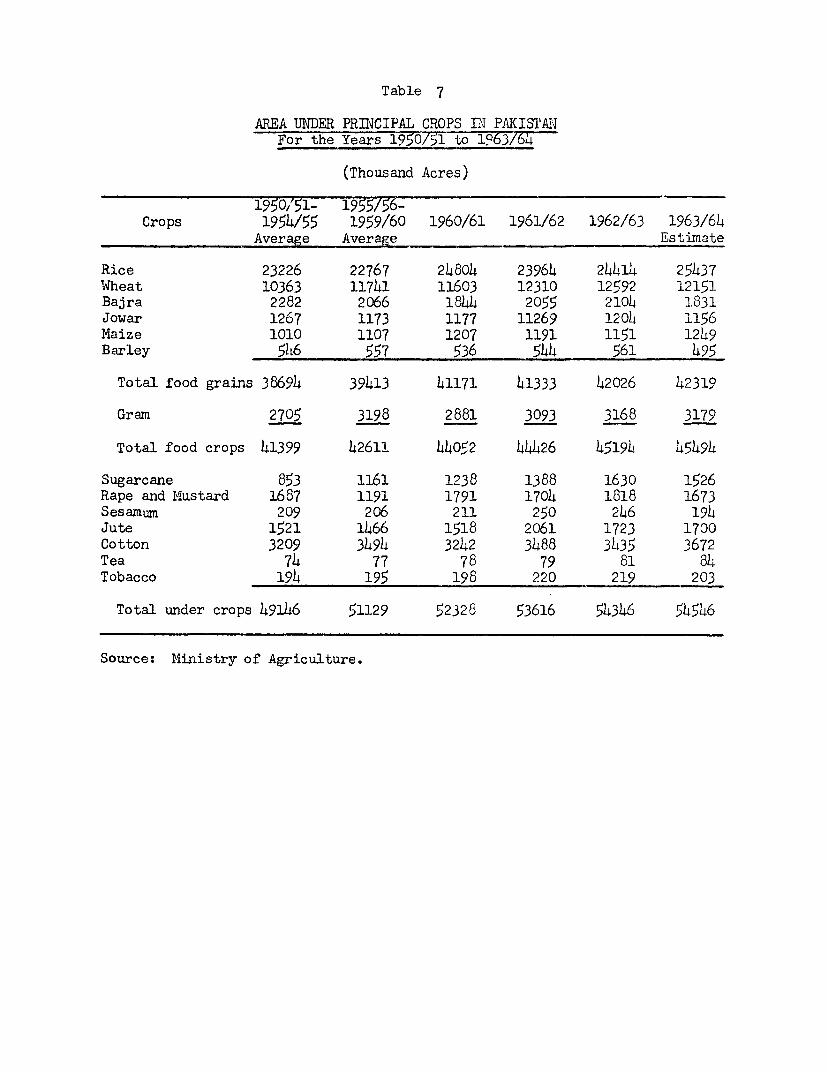
Table 7
AREA UNDER PRINCIPAL CROPS DI PAKISTANFor the Years 1950/51 to 1963/674
(Thousand Acres)
1950,'51- 1955/56-Crops 1954/55 1959/60 1960/61 1961/62 1962/63 1963/64
Average Average Estimate
Rice 23226 22767 24804 23964 24414 25437Wheat 10363 11741 11603 12310 12592 12151Bajra 2282 2066 1844 2055 2104 1831Jowar 1267 1173 1177 11269 1204 1156Maize 1010 1107 1207 1191 1151 1249Barley 546 557 536 544 561 495
Total food grains 38694 39413 41171 41333 42026 42319
Gram 2705 3198 2881 3093 3168 3179
Total food crops 41399 42611 4405f2 44426 4519L, 45494
Sugarcane 853 1161 1238 1388 1630 1526Rape and Mustard 1687 1191 1791 1704 1818 1673Sesamum 209 206 211 250 246 194Jute 1521 1466 1518 2061 1723 1700Cotton 3209 3494 3242 3488 3435 3672Tea 74 77 78 79 81 84Tobacco 194 195 198 220 219 203
Total under crops 49146 51129 52328 53616 54346 54546
Source: Ministry of Agriculture.
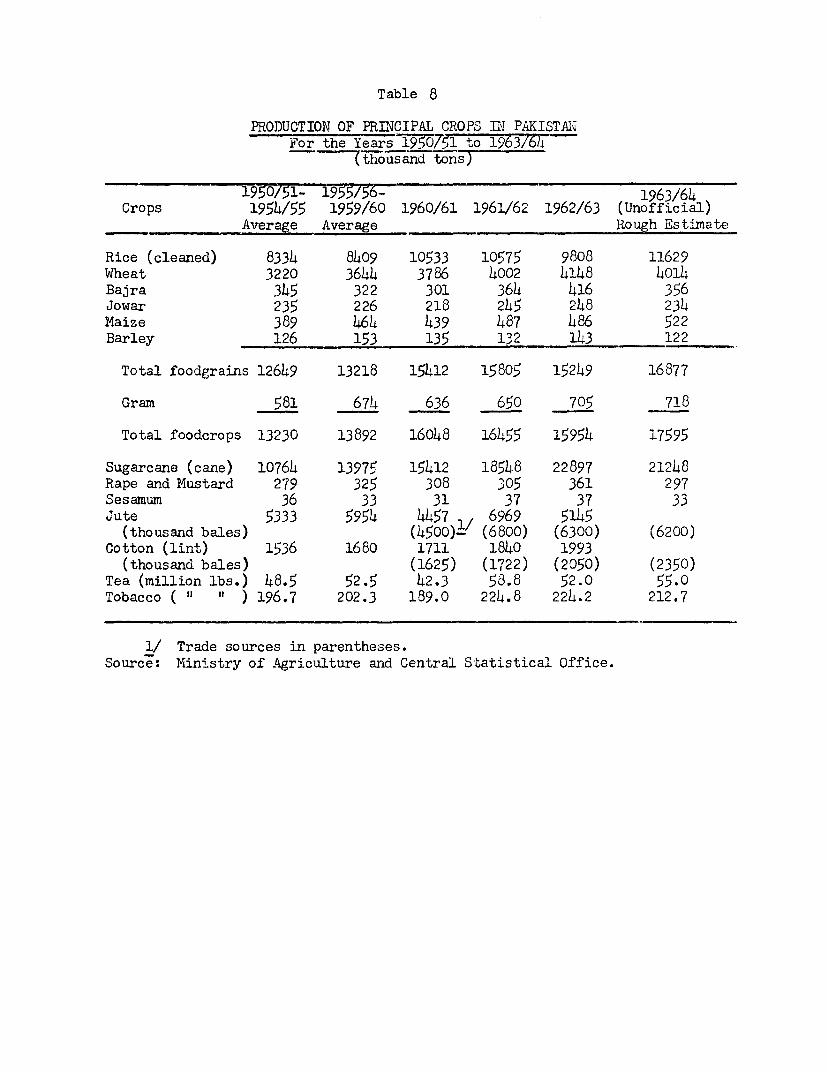
Table 8
PRODUCTION OF PRINCIPAL CROPS EN PAKISTATiFor the Years 1950751 to 1963/64
(thousand tons)
1950/51- 1955/56- 1963/64Crops 1954/55 1959/60 1960/61 1961/62 1962/63 (Unofficial)
-Average Average Rough Estimate
Rice (cleaned) 8334 8409 10533 10575 9808 11629Wheat 3220 3644 3786 4002 4148 4oi4Bajra 345 322 301 364 416 356Jowar 235 226 218 245 248 234Maize 389 464 439 487 486 522Barley 126 153 135 132 143 122
Total foodgrains 12649 13218 15412 15805 15249 16877
Gram 581 674 636 650 705 718
Total foodcrops 13230 13892 16048 16455 15954 17595
Sugarcane (cane) 10764 13975 15412 18548 22897 21248Rape and Mustard 279 325 308 305 361 297Sesamum 36 33 31 37 37 33Jute 5333 5954 4457 6969 5145
(thousand bales) (4500)1' (6800) (6300) (6200)Cotton (lint) 1536 1680 1711 1840 1993
(thousand bales) (1625) (1722) (2050) (2350)Tea (million lbs.) 48.5 52.5 42.3 58.8 52.0 55.0Tobacco ( " " ) 196.7 202.3 189.0 224.8 224.2 212.7
1/ Trade sources in parentheses.Source: Ministry of Agriculture and Central Statistical Office.
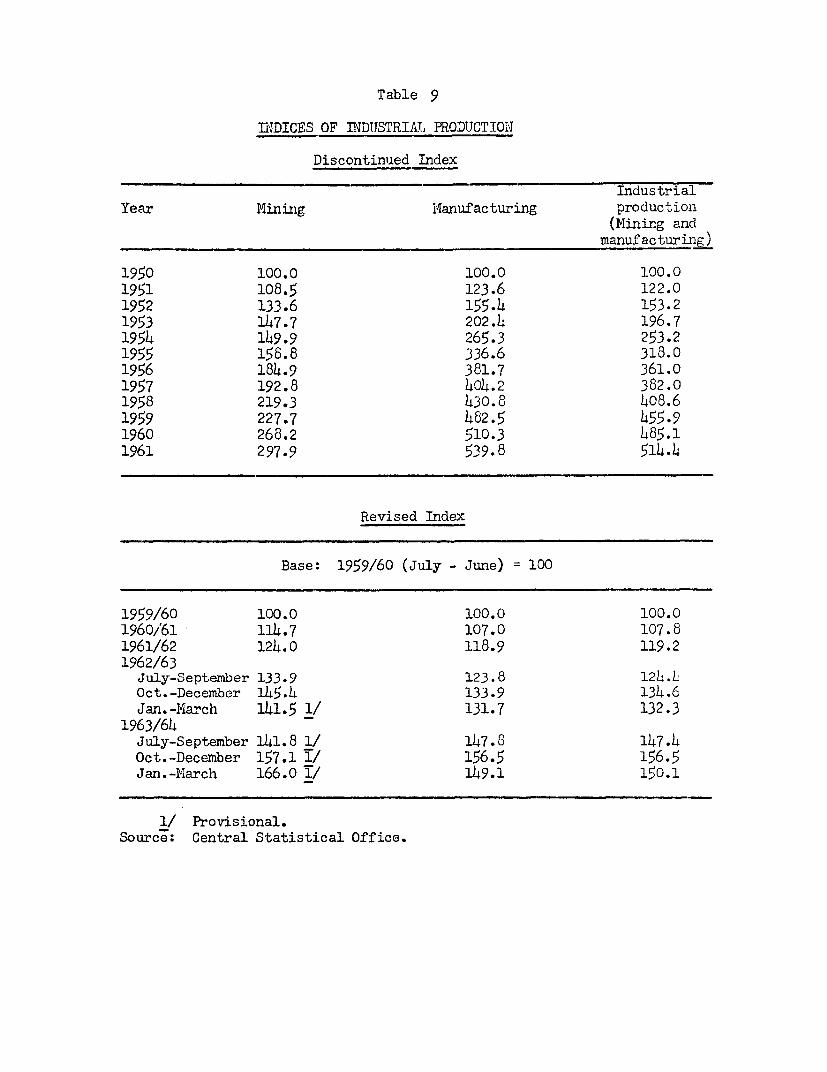
Table 9
IiDICES OF INDUTSTRIAL PRODUCTION
Discontinu.ed Index
IndustrialYear Mining iManufacturing production
(Mining andmanufacturing)
1950 100.0 100.0 100.01951 108.5 123.6 122.01952 133.6 155.4 153.21953 147.7 202.4 196.71954 149.9 265.3 253.21955 156.8 336.6 318.01956 184.9 381.7 361.01957 192.8 404.2 382.01958 219.3 430.8 408.61959 227.7 482.5 455.91960 268.2 510.3 485.11961 297.9 539.8 514.4
Revised Index
Base: 1959/60 (July - June) 100
1959/60 100.0 100.0 100.01960/61 114.7 107.0 107.81961/62 124.0 118.9 119.21962/63
July-September 133.9 123.8 124.4Oct.-December 145.4 133.9 134.6Jan.-March 141.5 1/ 131.7 132.3
1963/64July-September 141.8 1/ 147.8 147.4Oct.-December 157.1 1/ 156.5 156.5Jan.-March 166.0 1/ 149.1 150.1
1/ Provisional.Source: Central Statistical Office.
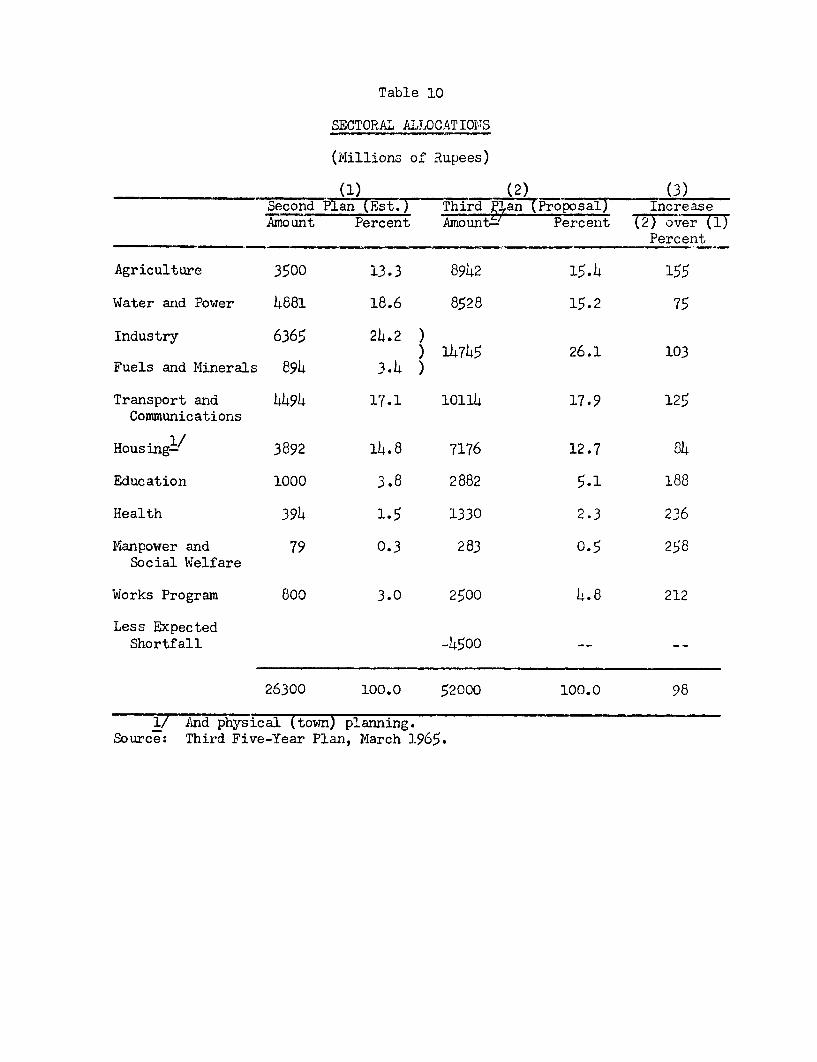
Table 10
SECTORAL ALLOCATIOFS
(Millions of Rupees)
(1) (2) (3)Second an (Est. Third aan(Prosa) IncreaseAmount Percent Amount-' Percent (2) overT(1)
Percent
Agriculture 3500 13.3 8942 15.4 155
Water and Power 4881 18.6 8528 15.2 75
Industry 6365 24.2 )) 14745 26.1 103
Fuels and Minerals 894 3.4 )
Transport and 4494 17.1 10114 17.9 125Communications
Housing/ 3892 14.8 7176 12.7 84
Education 1000 3.8 2882 5.1 188
Health 394 1.5 1330 2.3 236
Manpower and 79 0.3 283 0.5 258Social Welfare
Works Program 800 3.0 2500 4.8 212
Less ExpectedShortfall 45000
26300 100.0 52000 100.0 98
1/ And physical (town) planning.Source: Third Five-Year Plan, March 1965.
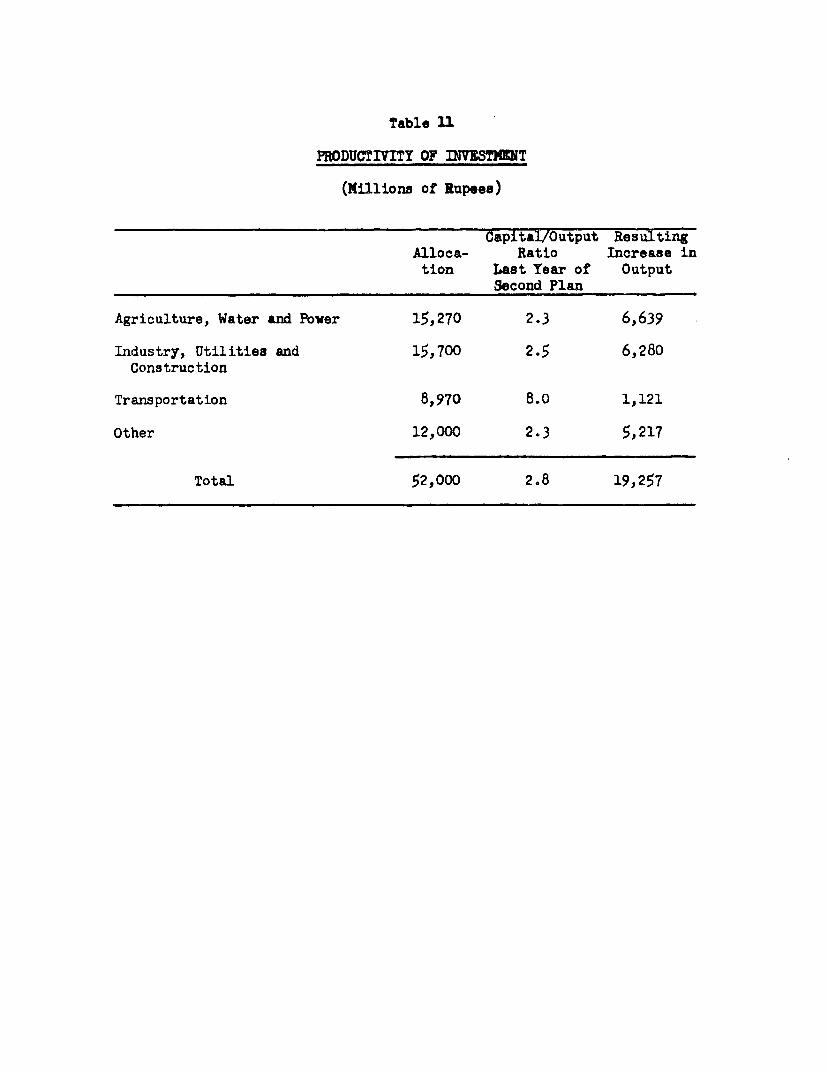
Table 11
PRODUCTIVITY OF INVEST1RNIOT
(Millions of Rupees)
Capital/Output ResultingAlloca- Ratio Increase intion Last Year of Output
Second Plan
Agriculture, Water and Power 15,270 2.3 6,639
Industry, Utilities and 15,700 2.5 6,280Construction
Transportation 8,970 8.0 1,121
Other 12,000 2.3 5,217
Total 52,000 2.8 19,257
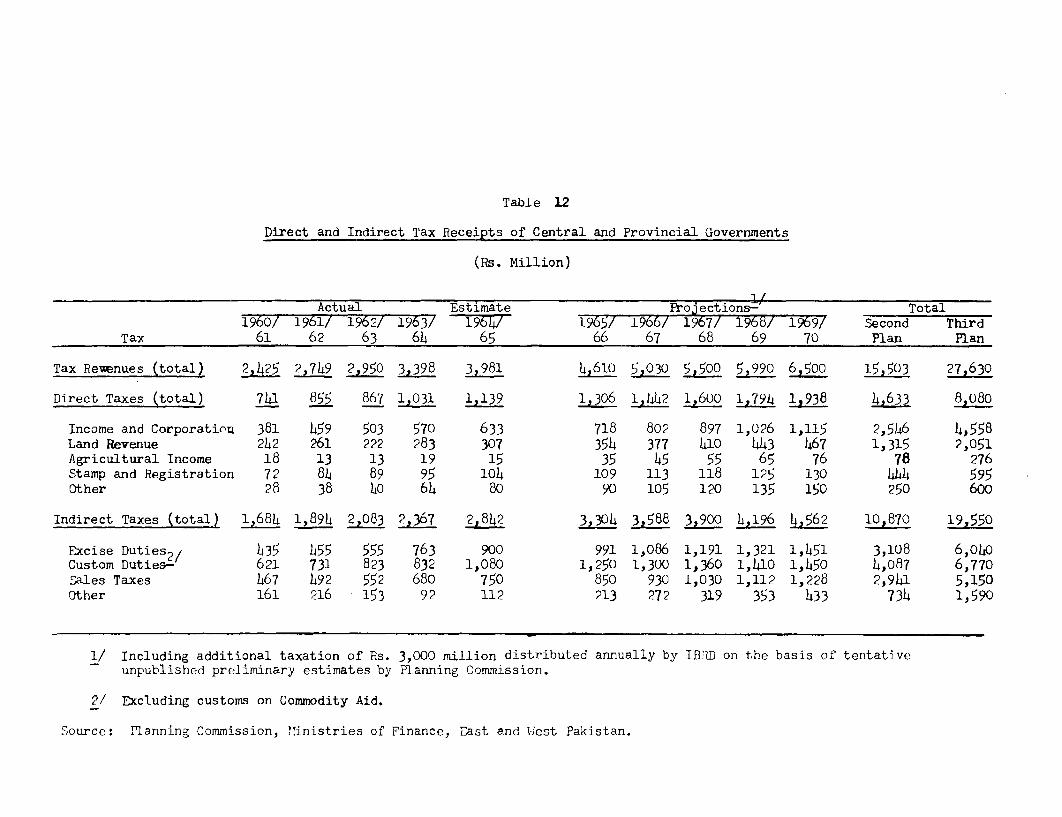
Table 12
Direct and Indirect Tax Receipts of Central and Provincial Governments
(Rs. Million)
Actual Estimate Project_on__ _ Total1960/ 1961/ 1962/ 1963/ 1-- %1965/ 1966/ 1967/ 1968/ 19 9/ Second Third
Tax 61 62 63 64 65 66 67 68 69 70 Plan Plan
Tax Rewenues (total) 2 425 2,749 2,950 3,398 3,981 4,610 5,030 5,500 5,990 6,500 15,503 27,630
Direct Taxes (total) 741 855 867 1,031 1,139 1,306 1,442 1,600 1,794 1,938 46338O80
Income and Corporaticu 381 459 503 570 633 718 802 897 1,026 1,115 2,546 4,558Land Revenue 2)2 261 222 283 307 354 377 410 443 467 1,315 2,051Agricultural Income 18 13 13 19 15 35 45 55 65 76 78 276Stamp and Registration 72 84 89 95 104 109 113 118 125 130 414 595Other 28 38 40 64 80 90 105 120 135 150 250 600
Indirect Taxes (total) 1,684 1,894 2,083 2,367 2,842 3304 3,588 3,900 4,196 4,562 10,870 19,550
Excise Duties2/ 435 $55 555 763 900 991 1,086 1,191 1,321 1,451 3,108 6,040Custom Duties- 621 731 823 832 1,080 1,250 1,300 1,360 1,410 1,450 4,087 6,770Sales Taxes 467 492 552 680 750 850 930 1,030 1,112 1,228 2,941 5,150Other 161 216 153 92 112 213 272 319 353 433 734 1,590
1/ Including additional taxation of Rs. 3,000 million distributed annually by IB7dD on the basis of tentativeunpublished preliminary estimates by Planning Commission.
2/ Excluding customs on Commodity Aid.
Source: Planning Commission, 'Iinistries of Finance, East and tIest Pakistan.
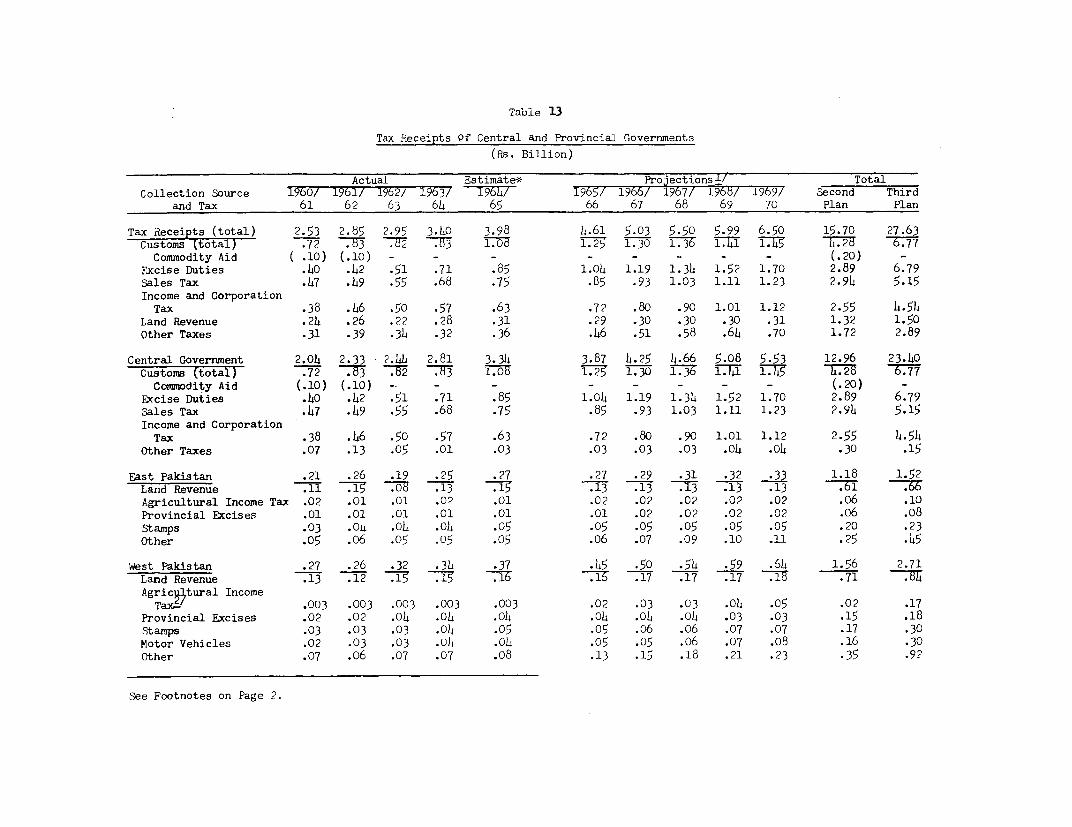
Table 13
Tax Receipts Qf Central -And Provincial Governments
(Rs. Billion)
Actual Estimate* ProJections'/ TotalCollection Source 1960/ 1961/ 1962/ 1963/ T7967 1965/ 1966/ 1967/ 1968/ 1969/ Second Third
and Tax 61 62 63 64 65 66 67 68 69 70 Plan Plan
Tax Receipts (total) 2.53 2.85 2.95 3.40 3.98 4.61 5.03 5.50 5.99 6.50 15.70 27.63Customs (totai) .72 T.7 3 .1. 05 1.25 1.30 1.36 1.1 1.45 6.77Commodity Aid ( .10) (.10) - - - - (.20) -
Fxcise Duties .40 .42 .51 .71 .85 1.04 1.19 1.34 1.52 1.70 2.89 6.79Sales Tax .47 .19 .55 .68 .75 .85 .93 1.03 1.11 1.23 2.94 5.15Income and CorporationTax .38 .46 .50 .57 .63 .72 .80 .90 1.01 1.12 2.55 4.54
Land Revenue .24 .26 .22 .28 .31 .29 .30 .30 .30 .31 1.32 1.50Other Taxes .31 .39 .34 .32 .36 .46 .51 .58 .64 .70 1.72 2.89
Central Government 2.04 2.33 2."4 2.81 3.34 3.87 4.25 4.66 5.08 5.53 12.96 23.40Customs (total) .72 1.07 1.725 1.30 1. -3T 7- 677
Commodity Aid (.10) (.10) -- - - - - - - - (.20) -Excise Duties .40 .42 .51 .71 .85 1.04 1.19 1.34 1.52 1.70 2.89 6.79Sales Tax .47 .49 .55 .68 .75 .85 .93 1.03 1.11 1.23 2.94 5.15Income and Corporation
Tax .38 .46 .50 .57 .63 .72 .80 .90 1.01 1.12 2.55 4.54Other Taxes .07 .13 .05 .01 .03 .03 .03 .03 .04 .04 .30 .15
East Pakistan .21 .26 .19 .25 .27 .27 .29 .31 .32 .33 1.18 1.52Land Revenue .11 .15 .08 .13 .5 *.13 *.13 T173 .13 -.13 .6T1 -- 6Agricultural Income Tax .02 .01 .01 .02 .01 .02 .02 .02 .02 .02 .o6 .10Provincial Excises .01 .01 .01 .01 .01 .01 .02 .02 .02 .02 .o6 .08Stamps .03 .04 .04 .04 .05 .05 .05 .05 .05 .05 .20 .23Other .05 .06 .05 .05 .05 .06 .07 .09 .10 .11 .25 .45
West Pakistan .27 .26 .32 .34 .37 .45 .50 .54 .59 .61 1.56 2.71Land Revenue .13 .12 17 .1T5 .16 T17 .17 .17 17T .71 --- BTAgrictural Income
Tax-/ .003 .003 .003 .003 .003 .02 .03 .03 .04 .05 .02 .17Provincial Excises .02 .02 .04 .h0 .04 .04 .1 .0*4 .03 .03 .15 .18Stamps .03 .03 .03 .04 .05 .05 .06 .o6 .07 .07 .17 .30Motor Vehicles .02 .03 .03 .o1 .04 .05 .05 .06 .07 .08 .16 .30Other .07 .06 .07 .07 .08 .13 .15 .18 .21 .23 .35 .*92
See Footnotes on Page 2.
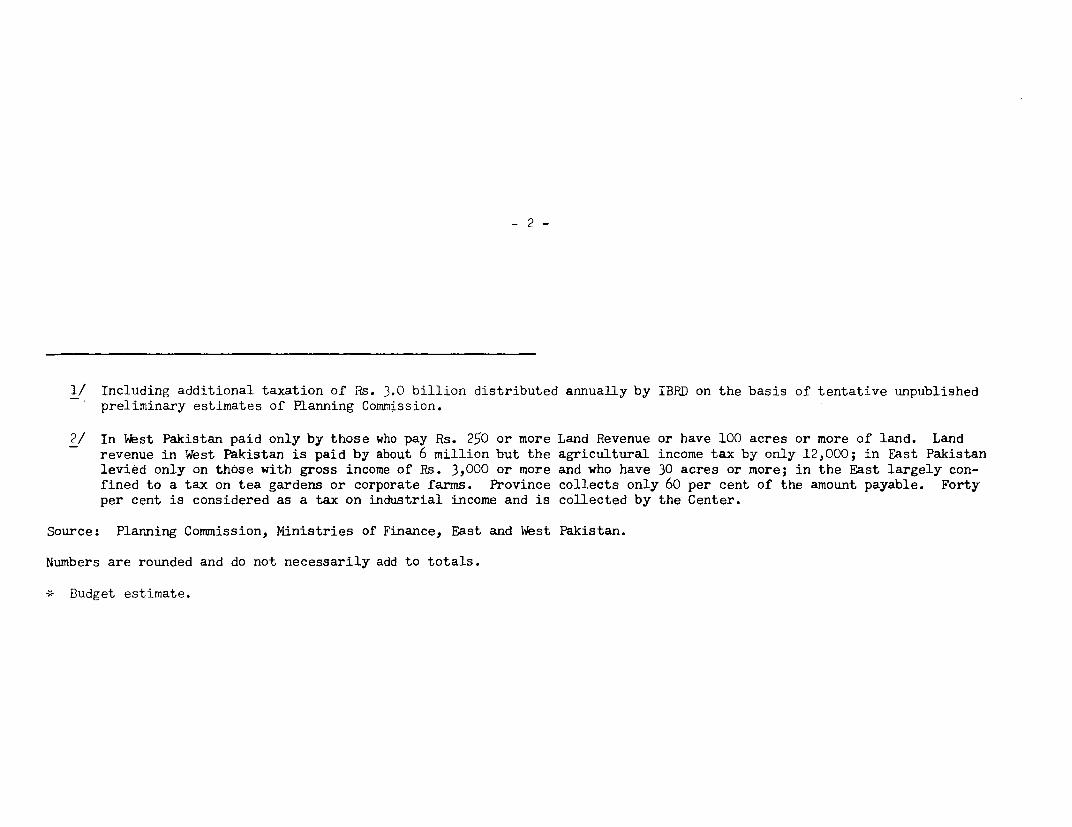
2
1/ Including additional taxation of Rs. 3.0 billion distributed annually by IBRD on the basis of tentative unpublishedpreliminary estimates of Planning Commission.
2/ In West Pakistan paid only by those who pay Rs. 250 or more Land Revenue or have 100 acres or more of land. Landrevenue in West Pakistan is paid by about 6 million but the agricultural income tax by only 12,000; in East Pakistanlevied only on those with gross income of Rs. 3,000 or more and who have 30 acres or more; in the East largely con-fined to a tax on tea gardens or corporate farms. Province collects only 60 per cent of the amount payable. Fortyper cent is considered as a tax on industrial income and is collected by the Center.
Source: Planning Commission, Ministries of Finance, East and West Pakistan.
Numbers are rounded and do not necessarily add to totals.
* Budget estimate.
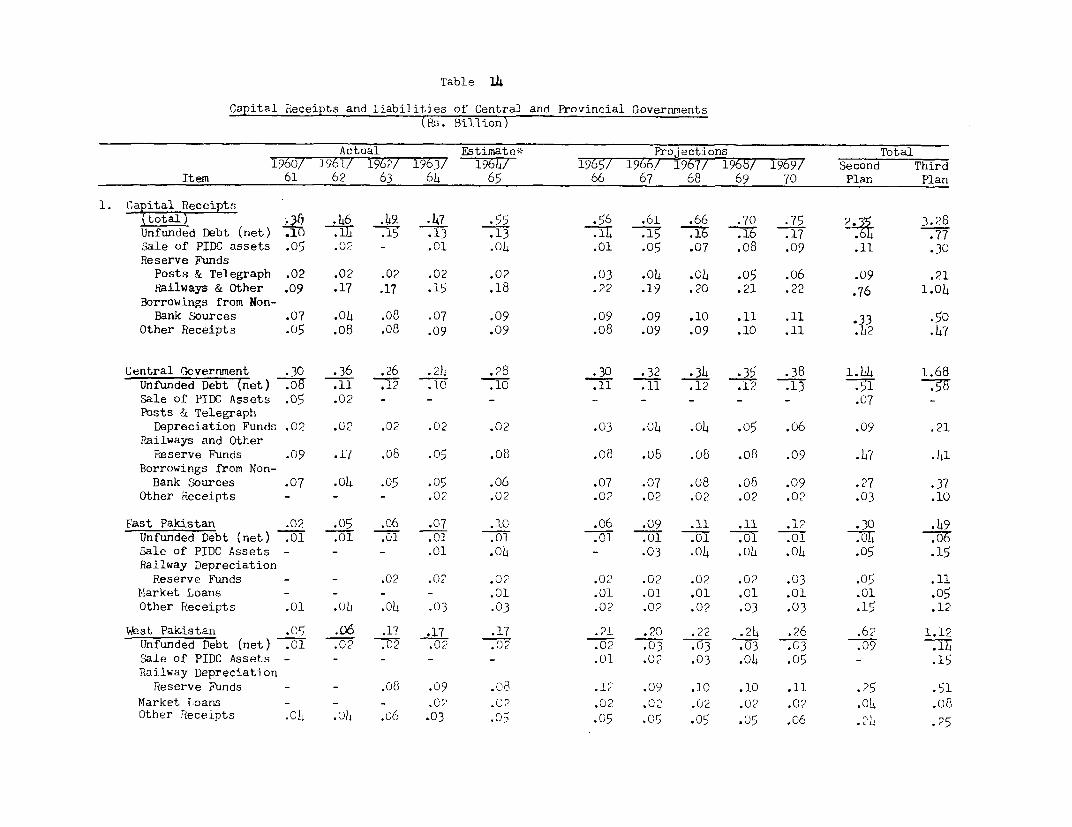
Table L4
Capital Receipts and Liabilities of Central and Provincial Governments(R,s. Billion)
Actual Estimate,- Projections Total1)60/ 1961/ 1962/ 1963/ 196h/ -196/ 1966/ 1967/ 1W6/ T1969/ Second Third
Item 61 62 63 64 65 66 67 68 69 70 Plan Plan
1. Capital Receipts(o tal) .46 .49 *47 .55 .56 .61 .66 .70 .75 3.28Unfunded Debt (net) .10 T1TT .1 .13 .13 17 T1 .15 .16 .17 .b .77Sale of PIDC assets .05 .02 - .01 .04 .01 .05 .07 .o8 .09 .11 .30Reserve Funds
Posts & Telegraph .02 .02 .02 .02 .02 .03 .04 .04 .05 .o6 .09 .21Railways & Other .09 .17 .17 .15 .18 .22 .19 .20 .21 .22 .76 1.04
Borrowings from Non-Bank Sources .07 .04 .08 .07 .09 .09 .09 .10 .11 .11 .33 .50
Other Receipts .05 .08 .08 .09 .09 .08 .09 .09 .10 .11 .B2 .47
Central Government .30 .36 .26 .24 .28 .30 .32 .34 .35 .38 1.44 1.68Unfunded Debt (net) T0 .11 .12 .10 .10 .11 .12 .12 .13 .51Sale of PIDC Assets .05 .02 - - - - - - - - .07 -
Posts Ri TelegraphDepreciation Funds .02 .02 .02 .02 .02 .03 .04 .04 .05 .06 .09 .21
Railways and OtherReserve Funds .09 .17 .08 .05 .08 .08 .o8 .08 .08 .09 .47 .41
Borrowings from Non-Bank Sources .07 .o4 .05 .05 .06 .07 .07 .08 .o8 .09 .27 .37
Other Receipts - - - .02 .02 .02 .02 .02 .02 .02 .03 .10
F,ast Pakistan .02 .05 .06 .07 .10 .o6 .09 .11 .11 .12 .30 .49Unfunded Debt (net) .01 .01 .01 .01 .01 .1 .01 .01 .01 -- T .06Sale of PIDC Assets - - - .01 .04 - .03 .04 .4 .04 .05 .15Railway Depreciation
Reserve Funds - - .02 .02 .02 .02 .02 .0? .02 .03 .05 .11Ilarket Loans - - - - .01 .01 .01 .01 .01 .01 .01 .05Other Receipts .01 .0 °4 .03 .03 .02 .02 .02 .03 .03 .15 .12
Webst Pakistan .05 .06 .17 .17 .17 .21 .20 .22 .24 .26 .6? 1.12Unfunded Debt (net) .01 .02 .02 .02 .Oc .02 .o3 .03 .03 .o3 .09 .7hSale of PIDC Assets .01 .02 .03 .04 .05 - .15Railway Depreciation
Reserve Funds - - .08 .09 .08 .12 .09 .10 .10 .11 .25 .51
Market Loans - - - .0, .0? .02 .02 .02 .02 .02 .04 .o8Other Receipts .014 .0) .o6 .03 .05 .05 .05 .05 .05 .06 .2L .25
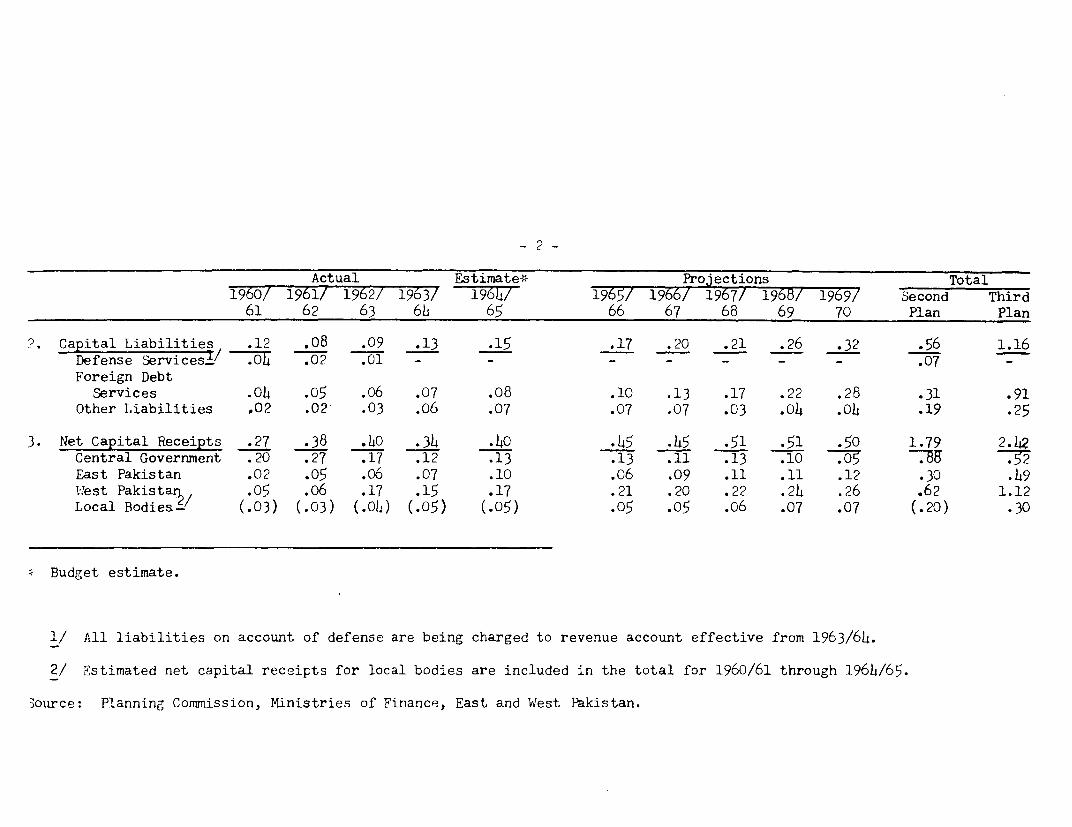
-2-
Actual Estimate* Projections Total1960/ 1961/ 1962/ 1963/ 1964/ 1965/ 1966/ 1967/ 1968/ 1969/ Second Third
61 62 63 6) 65 66 67 68 69 70 Plan Plan
?. Capital Liabilities .12 .08 .09 .13 .15 .17 .20 .21 .26 .32 .56 1.16Defense Services0 7 .02 .01 - _ _ _ _ _Foreign Debt
Services .04 .05 .06 .07 .08 .10 .13 .17 .22 .28 .31 .91Other Liabilities .02 .02 .03 .o6 .07 .07 .07 .03 04 .04 .19 .25
3. Net Capital Receipts .27 .38 .40 .34 .40 .45 .45 .51 .51 .50 1.79 2.42Central Government .20 .27 .17 .12 .13 .13 .11 .13 .10 .05 w .5East Pakistan .02 .05 .06 .07 .10 .06 .09 .11 .11 .12 .30 .49Ilest Pakistan2 .05 .06 .17 .15 .17 .21 .20 .22 .24 .26 .62 1.12Local Bodies . (.03) (.03) (.04) (.05) (.05) .05 .05 .06 .07 .07 (.20) .30
Budget estimate.
1/ All liabilities on account of defense are being charged to revenue account effective from 1963/64.
2/ Estimated net capital receipts for local bodies are included in the total for 1960/61 through 196)/65.
3ource: Planning Commission, Ministries of Finance, East and West Fakistan.
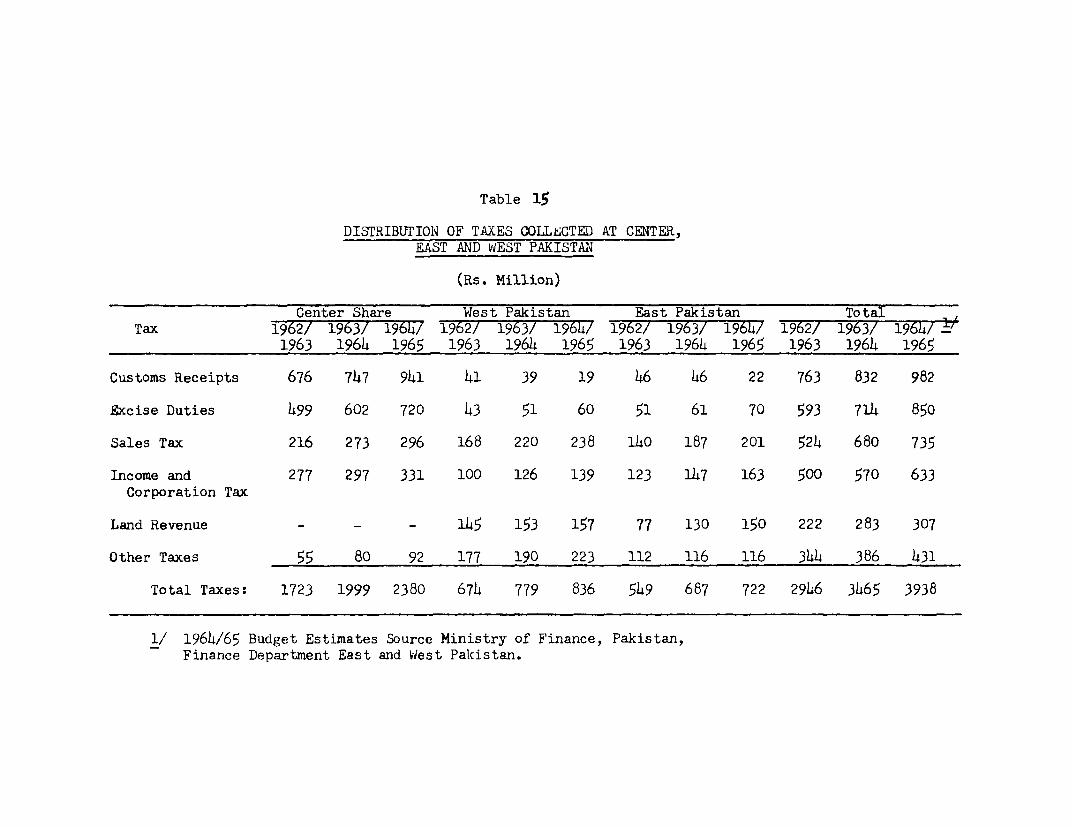
Table 15
DISTRIBUTION4 OF TAXES COLLECTED AT CENTER,EAST AND WEST PAKISTAN
(Rs. Million)
Center Share West Pakistan East Pakistan TotalTax 1962/ 1963/ 1964/ 19627 1963/ 1964/ 1962/ 1963/ 19647 1962/ 1963/ 1964/ It'
1963 1964 1965 1963 1964 1965 1963 1964 1965 1963 1964 1965
Customs Receipts 676 747 941 41 39 19 46 46 22 763 832 982
Excise Duties 499 602 720 43 51 60 51 61 70 593 714 850
Sales Tax 216 273 296 168 220 238 1i0 187 201 524 680 735
Income and 277 297 331 100 126 139 123 147 163 500 570 633Corporation Tax
Land Revenue - - - 145 153 157 77 130 150 222 283 307
Other Taxes 55 80 92 177 190 223 112 116 116 344 386 431
Total Taxes: 1723 1999 2380 674 779 836 549 687 722 2946 3465 3938
1/ 1964/65 Budget Estimates Source Ministry of Finance, Pakistan,Finance Department East and Viest Pakistan.
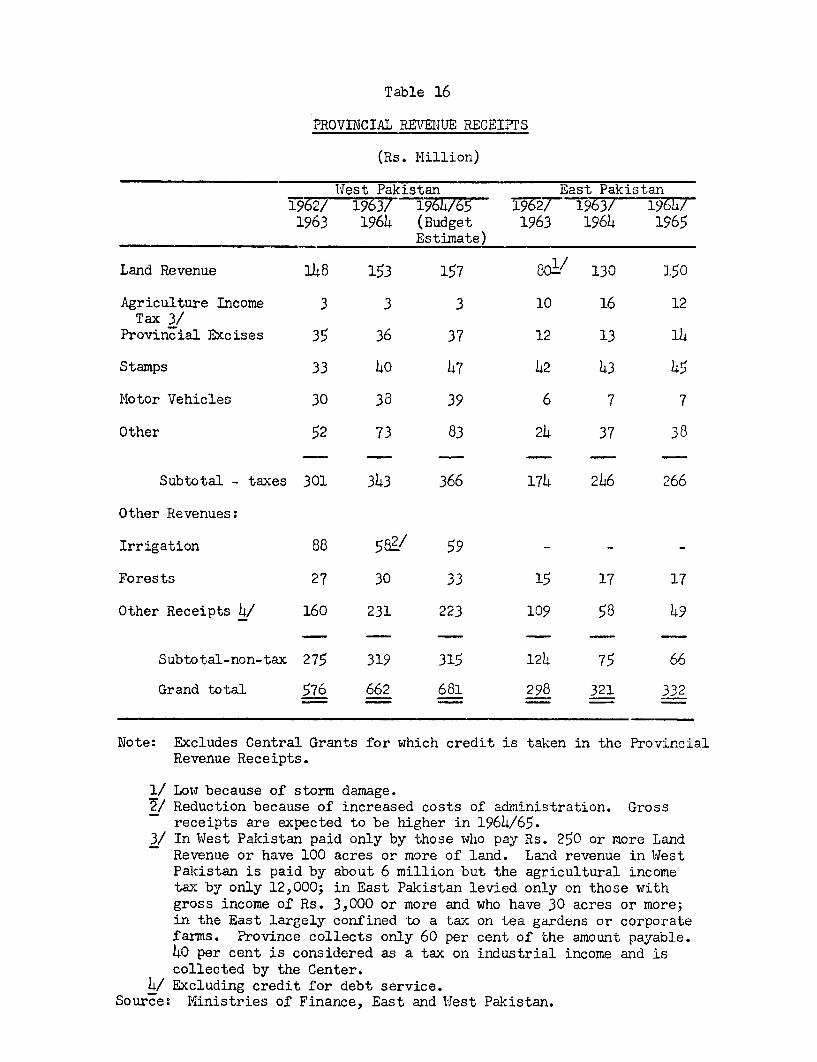
Table 16
PROVINCIAL REVENUE RECEIPTS
(Rs. Million)
lWest Pakistan East Pakistan1962/ 1963/ 1964/65 Uq27-T 1963/ 1964/
1963 1964 (Budget 1963 1964 1965Estimate)
Land Revenue 148 153 157 6o0/ 130 1.50
Agriculture Income 3 3 3 10 16 12Tax 3/
Provincial Excises 35 36 37 12 13 14
Stamps 33 40 47 42 43 45
MIotor Vehicles 30 38 39 6 7 7
Other 52 73 83 24 37 38
Subtotal - taxes 301 343 366 174 246 266
Other Revenues:
Irrigation 88 58.2! 59 - - -
Forests 27 30 33 15 17 17
Other Receipts 4/ 160 231 223 109 58 49
Subtotal-non-tax 275 319 315 124 75 66
Grand total 576 662 681 298 321 332
Note: Excludes Central Grants for which credit is taken in the ProvincialRevenue Receipts.
1/ Low because of storm damage.T/ Reduction because of increased costs of administration. Gross
receipts are expected to be higher in 1964/65.3/ In West Pakistan paid only by those who pay Rs. 250 or more Land
Revenue or have 100 acres or more of land. Land revenue in WestPalcistan is paid by about 6 million but the agricultural incometaxS by only 12,000; in East Pakistan levied only on those withgross income of Rs. 3,000 or more and who have 30 acres or more;in the East largely confined to a tax on tea gardens or corporatefarms. Province collects only 60 per cent of the amount payable.40 per cent is considered as a tax on industrial income and iscollected by the Center.
4/ Excluding credit for debt service.Source: M4inistries of Finance, East and West Pakistan.
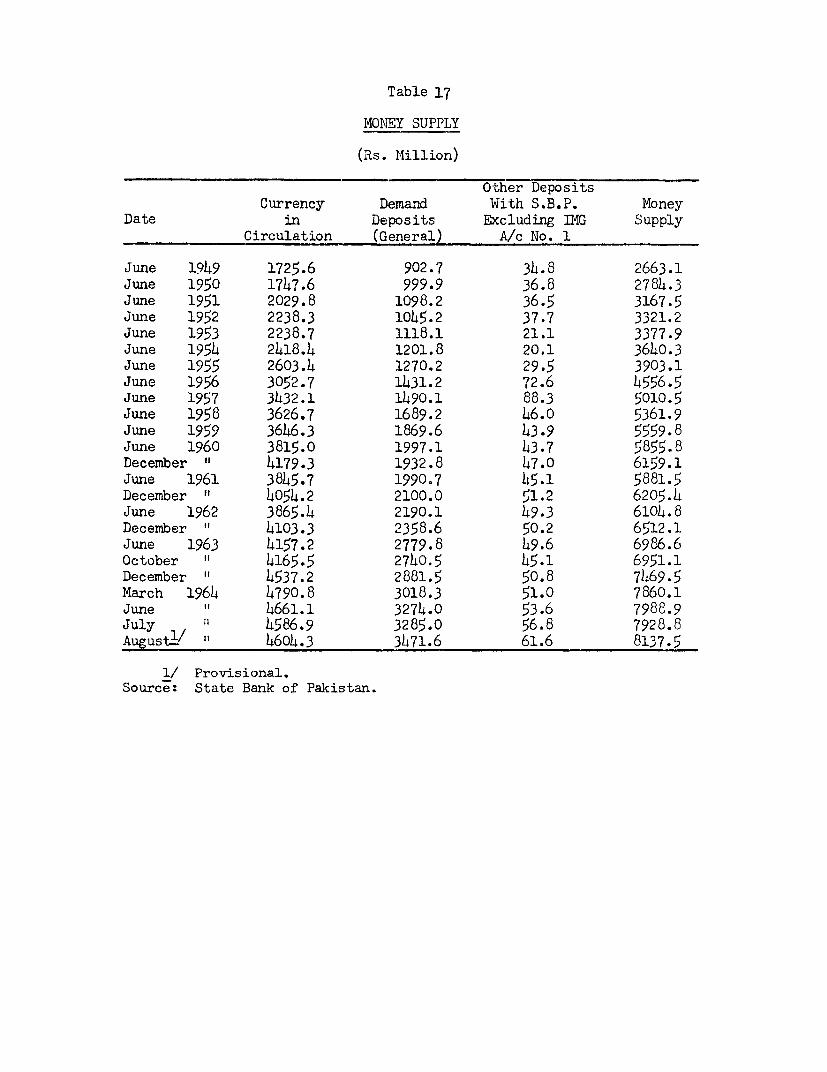
Table 17
MONEY SUPPLY
(Rs. Million)
Other DepositsCurrency Demand With S.B.P. Money
Date in Deposits Excluding IMG SupplyCirculation (General) A/c No. 1
June 1949 1725.6 902.7 34.8 2663.1June 1950 1747.6 999.9 36.8 2784.3June 1951 2029.8 1098.2 36.5 3167.5June 1952 2238.3 1045.2 37.7 3321.2June 1953 2238.7 1118.1 21.1 3377.9June 1954 2418.4 1201.8 20.1 3640.3June 1955 2603.4 1270.2 29.5 3903.1June 1956 3052.7 i431.2 72.6 4556.5June 1957 3432.1 1490.1 88.3 5010.5June 1958 3626.7 1689.2 46.0 5361.9June 1959 3646.3 1869.6 43.9 5559.8June 1960 3815.0 1997.1 43.7 5855.8December " 4179.3 1932.8 47.0 6159.1June 1961 3845.7 1990.7 45.1 5881.5December "I 4054.2 2100.0 51.2 6205.4June 1962 3865.4 2190.1 49.3 6104.8December " 4103.3 2358.6 50.2 6512.1June 1963 4157.2 2779.8 49.6 6986.6October 4165.5 2740.5 45.1 6951.1December 4537.2 2881.5 50.8 7469.5March 1964 4790.8 3018.3 51.0 7860.1June 4661.1 3274.0 53.6 7988.9July 4586.9 3285,0 56.8 7928.8Augustl/" 4604.3 3471.6 61.6 8137.5
1/ Provisional.Source: State Bank of Pakistan.
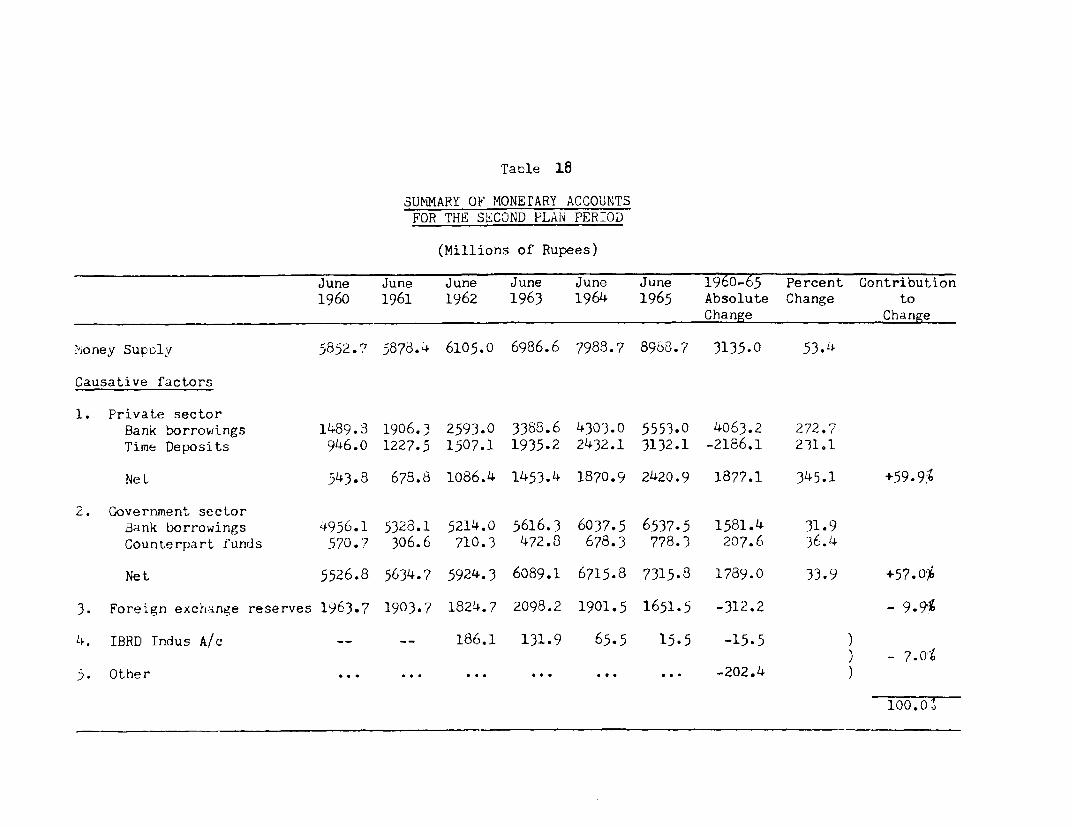
Table 18
SUhMARY OF MONErARY ACCOUNTSFOR THE SECOND PLAiN PERIOD
(Millions of Rupees)
June June June June June June 1960-65 Percent Contribution1960 1961 1962 1963 1964 1965 Absolute Change to
____________________________ __ _ _Change Change
Money Supply 5852.7 5878.4 6105.0 6986.6 7988.7 8988.7 3135.0 53.4
Causative factors
1. Private sectorBank borrowings 1489.3 1906.3 2593.0 3388.6 4303.0 5553.0 4063.2 272.7Time Deposits 946.0 1227.5 1507.1 1935.2 2432.1 3132.1 -2186.1 231.1
Net 543.3 678.8 1086.4 1453.4 1870.9 2420.9 1877.1 345.1 +59.9%
2. Government sectorBank borrowings 4956.1 5328.1 5214.0 5616.3 6037.5 6537.5 1581.4 31.9Counterpart funds 570.7 306.6 710.3 472.8 678.3 778.3 207.6 36.4
Net 5526.8 5634.7 5924.3 6089.1 6715.8 7315.8 1789.0 33.9 +57.0t%
3. Foreign exchi-nge reserves 1963.7 1903.7 1824.7 2098.2 1901.5 1651.5 -312.2 - 9.9
4. IBRD Indus A/c -- -- 186.1 131.9 65.5 15.5 -15.5 )) - 7.0`
5. Other ... ... ... ... ... ... -202.4
100.0!.
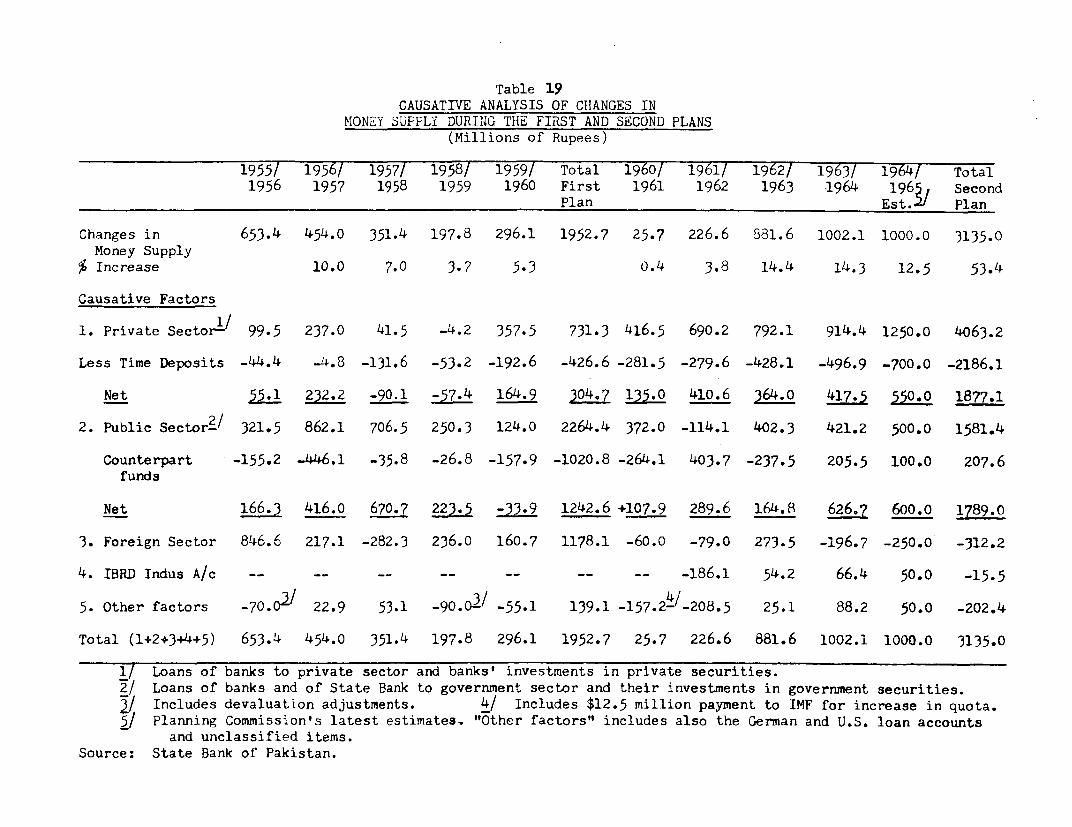
Table 19CAUSATIVE ANALYSIS OF CHANGES IN
MONEY SUPPLY DURING THE FIRST AND SECOND PLANS(Millions of Rupees)
1955/ 1956/ 1957/ 1958/ 1959/ Total 1960/ 1961/ 1962/ 1963/ 1964/ Total1956 1957 1958 1959 1960 First 1961 1962 1963 .1964 1965, Second
Plan Est.-- Plan
Changes in 653.4 454.0 351.4 197.8 296.1 1952.7 25.7 226.6 881.6 1002.1 1000.0 3135.0Money Supply
% Increase 10.0 7.0 13.7 5.3 o.4 3.8 14.4 14.3 12.5 53.4
Causative Factors
1. Private Sector-/ 99.5 237.0 41.5 -4.2 357.5 731.3 416.5 690.2 792.1 914.4 1250.0 4063.2
Less Time Deposits -44.4 -4.8 -131.6 -53.2 -192.6 -426.6 -281.5 -279.6 -428.1 -496.9 -700.0 -2186.1
Net .1 232.2 -90.1 -57.4 164.9 304.7 135.0 410.6 364.0 417.5 550.0 1877.1
2. Public Sector2/ 321.5 862.1 706.5 250.3 124.0 2264.4 372.0 -114.1 402.3 421.2 500.0 1581.4
Counterpart -155.2 -446.1 -35.8 -26.8 -157.9 -1020.8 -264.1 403.7 -237.5 205.5 100.0 207.6funds
Net 166.3 416.0 670.7 223.5 -33.9 1242.6 +107.9 289.6 164.8 626.7 600.0 1789.0
3. Foreign Sector 846.6 217.1 -282.3 236.0 160.7 1178.1 -60.0 -79.0 273.5 -196.7 -2500. -312.2
4. IBRD Indus A/c -- -- -- -- -- -- -- -186.1 54.2 66.4 50.0 -15.5
5. Other factors -70.02) 22.9 53.1 -90 03/ -55.1 139.1 -157.2-/-208.5 25.1 88.2 50.0 -202.4
Total (1+2+3+4+5) 653.4 454.0 351.4 197.8 296.1 1952.7 25.7 226.6 881.6 1002.1 1000.0 3135.0
1/ Loans of banks to private sector and banks' investments in private securities.2/ Loans of banks and of State Bank to government sector and their investments in government securities.
Includes devaluation adjustments. 4/ Includes $12.5 million payment to IMF for increase in quota.5/ Planning Commission's latest estimatesw "Other factors" includes also the German and U.S. loan accounts
and unclassified items.Source: State Bank of Pakistan.
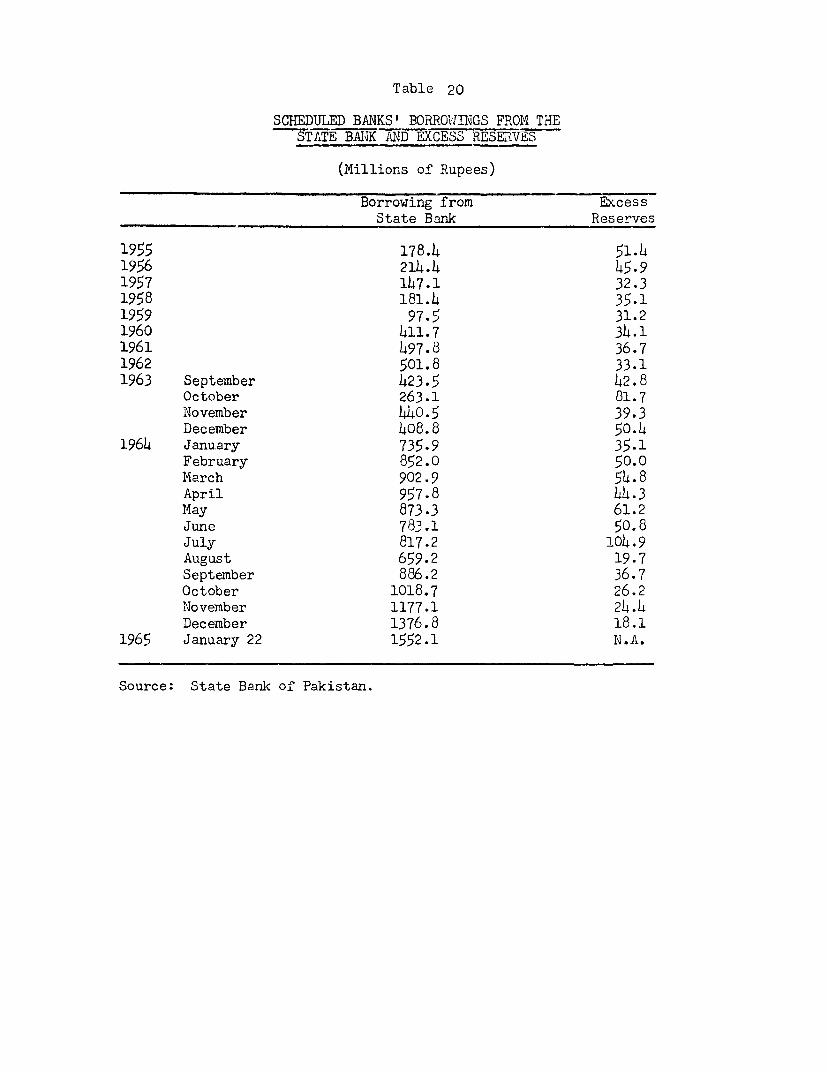
Table 20
SCHEDULED BANKS' BORROWINGS FROM THESTATE BAI, AND EXCESS RESERVES
(Millions of Rupees)
Borrowing from ExcessState Bank Reserves
1955 178.4 51.41956 214.4 45.91957 147.1 32.31958 181.4 35.11959 97.5 31.21960 411.7 34.11961 497.8 36.71962 501.8 33.11963 September 423.5 42.8
October 263.1 81.7November 440.5 39.3December 408.8 50.4
1964 January 735.9 35.1February 852.0 50.0March 902.9 54.8April 957.8 44.3May 873.3 61.2June 783.1 50.8July 817.2 104.9August 659.2 19.7September 886.2 36.7October 1018.7 26.2November 1177.1 24.4December 1376.8 18.1
1965 January 22 1552.1 N.A.
Source: State Bank of Pakistan.
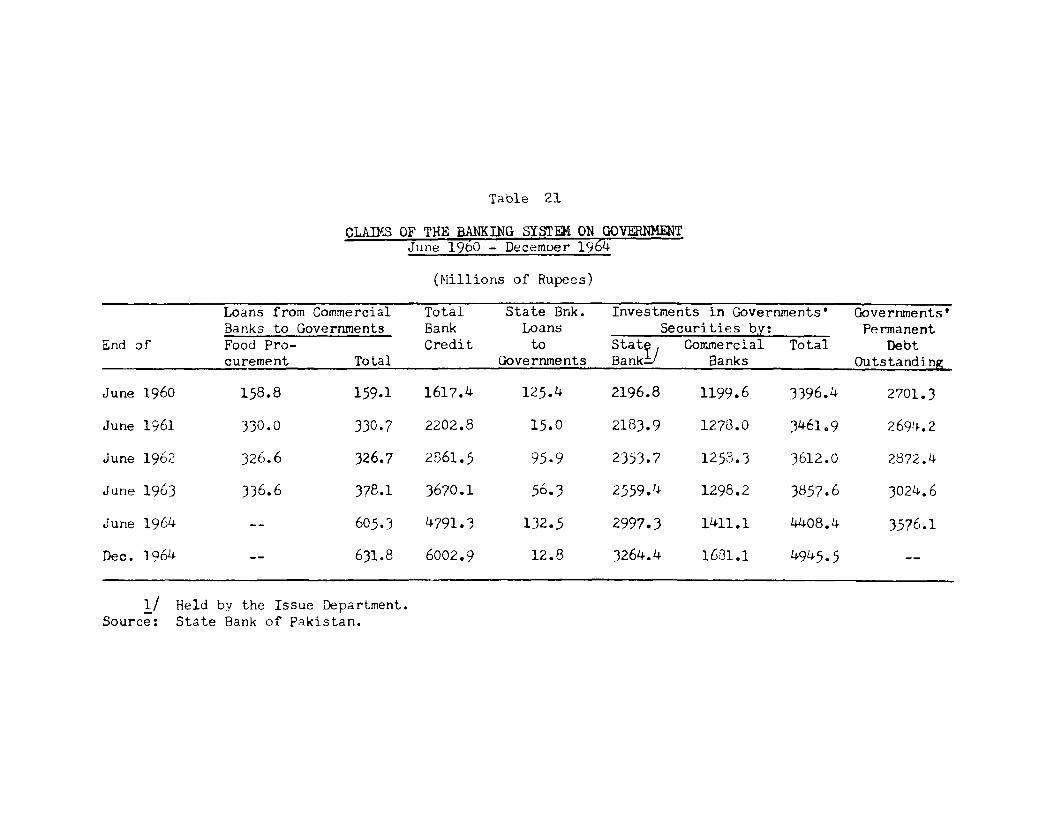
Table 21
CLAIMS OF THE BANKING SYSTEK ON GOVENW4ENTJune 1960 - December 1964
(Millions of Rupees)
Loans from Commercial Total State Bnk. Investments in Governments' Governments'Banks to Governments Bank Loans Securities by: Permanent
End of Food Pro- Credit to Stat 1 Commercial Total Debtcurement Total Governments Bank-/ Banks Outstanding
June 1960 158.8 159.1 1617.4 125.4 2196.8 1199.6 3396.4 2701.3
June 1961 330.0 330.7 2202.8 15.0 2183.9 1278.0 3461.9 2694.2
June 1962 326.6 326.7 2861.5 95.9 2353.7 1253.3 3612.0 2872.4
June 1963 336.6 378.1 3670.1 56.3 2559.4 1298.2 3857.6 3024.6
June 1964 -- 605.3 4791.3 132.5 2997.3 1411.1 4408.4 3576.1
Dec. 1964 __ 631.8 6002.9 12.8 3264.4 1631.1 4945.5 __
1/ Held by the Issue Department.Source: State Bank of Pakistan.
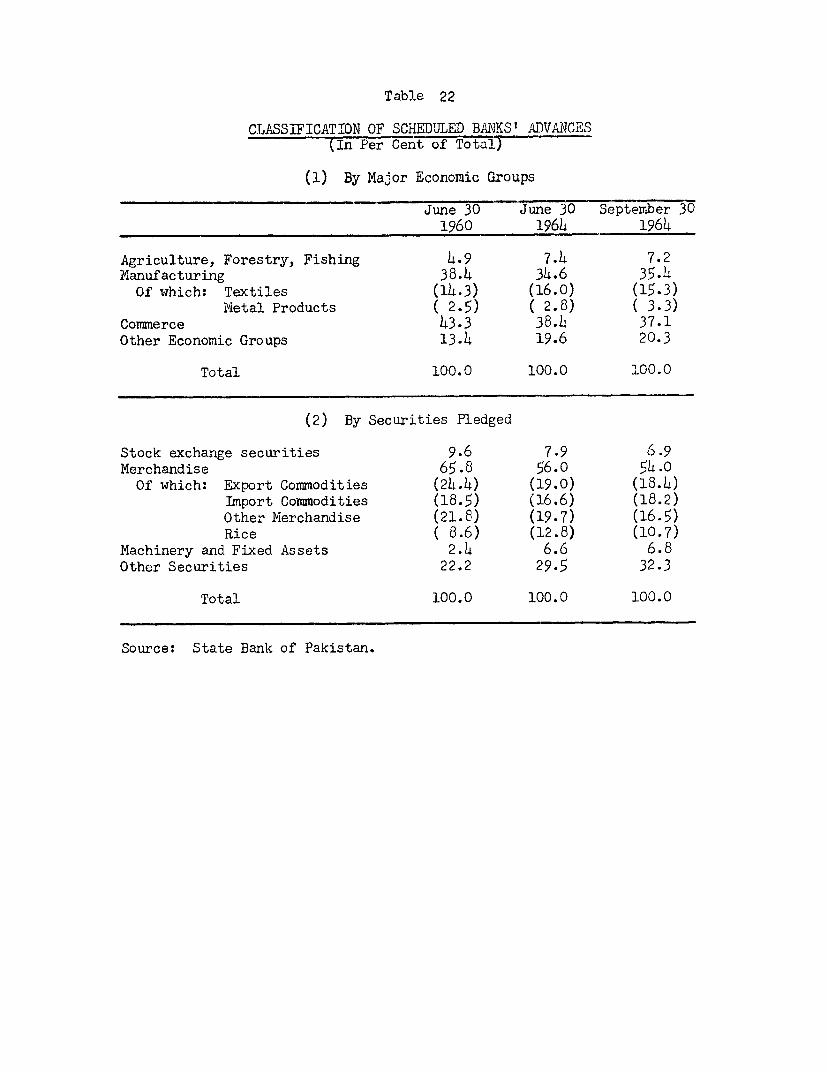
Table 22
CLASSIFICATION OF SCHEDULJED BAINKS1 ADVANCES(In Per Cent of Total)
(1) By Major Economic Groups
June 30 June 30 September 301960 1964 1964
Agriculture, Forestry, Fishing 4.9 7.4 7.2Manufacturing 38.4 34.6 35-4Of which: Textiles (14-3) (16.0) (15-3)
Metal Products ( 2.5) ( 2.8) ( 3-3)Commerce 43.3 38.h 37.1Other Economic Groups 13.4 19.6 20.3
Total 100.0 100.0 100.0
(2) By Securities Pledged
Stock exchange securities 9.6 7.9 6.9Merchandise 65.8 56.o 54.0Of which: Export Commodities (24.4) (19.0) (18.4)
Import Commodities (18.5) (16.6) (18.2)Other Merchandise (21.8) (19-7) (16.5)Rice ( 8.6) (12.8) (10-7)
Machinery and Fixed Assets 2.4 6.6 6.8Other Securities 22.2 29.5 32.3
Total 100.0 100.0 100.0
Source: State Bank of Pakistan.
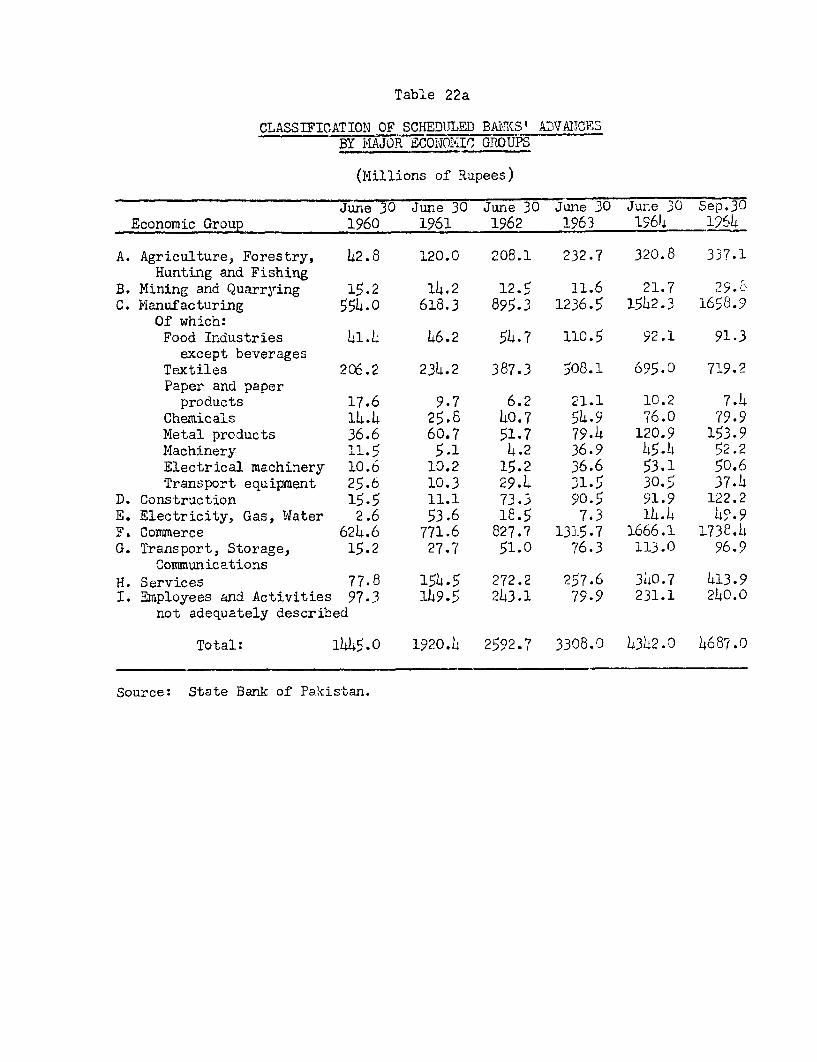
Table 22a
CLASSIFICATION OF SCHEDIJLED BA1dXS' ADVANCESBY MAJOR ECONnOIC GROUPS
(1Millions of Rupees)
June 30 June 30 Jurne 30 June 30 June 30 Sep.30Economic Group 1960 1961 1962 1963 1964 1)964
A. Agriculture, Forestry, 42.8 120.0 208.1 232.7 320.8 337.1Hunting and Fishing
B. Mining and Quarrying 15.2 14.2 12.5 11.6 21.7 29.8oC. Manufacturing 554.0 618.3 895.3 1236.5 1542.3 1658.9
Of which:Food Industries 41.1 46.2 54.7 110.5 92.1 91.3
except beveragesTextiles 206.2 234.2 387.3 508.1 695.0 719.2Paper and paper
products 17.6 9.7 6.2 21.1 10.2 7.4Chemicals 14.4 25.8 40.7 54.9 76.0 7g.9Metal products 36.6 60.7 51.7 79.4 120.9 153.9Machinery 11.5 5.1 4.2 36.9 45.4t 52.2Electrical machinery 10.6 10.2 15.2 36.6 53.1 50.6Transport equipment 25.6 10.3 29.4 31-5 30.5 37.4
D. Construction 15.5 11.1 73.3 90.5 91.9 122.2E. Electricity, Gas, Water 2.6 53.6 18.5 7.3 14.4 4°.9F. Commerce 624.6 771.6 827.7 131]5.7 1666.1 1738.4G. Transport, Storage, 15.2 27.7 51.0 76.3 113.0 96.9
CommunicationsH. Services 77.8 154.5 272.2 257.6 340.7 413.9I. Employees and Activities 97.3 149.5 243.1 79.9 231.1 240.0
not adequately described
Total: 1445.0 1920.4 2592.7 3308.0 14342.0 4687.0
Source: State Bank of Pakistan.
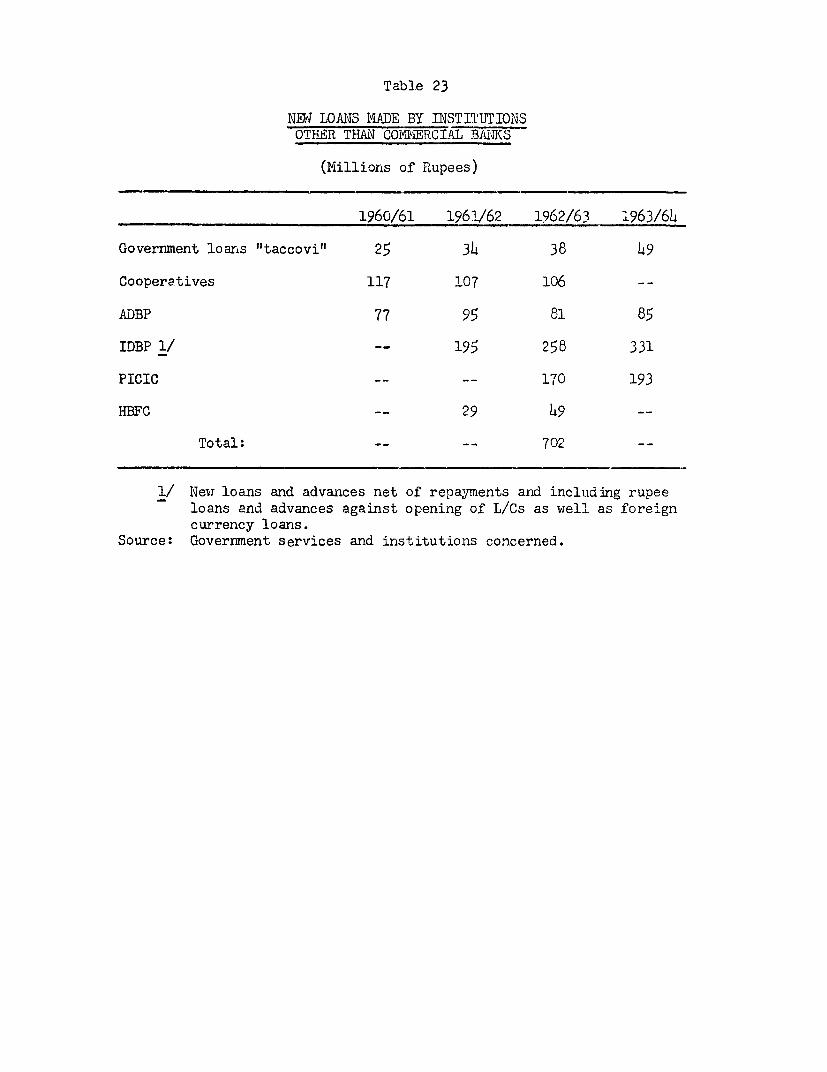
Table 23
NEa LOANS MADE BY INSTITUTIONSOTHER THA1N COERCIAL BAIZS
(Yiillioris of Rupees)
1960/61 1961/62 1962/63 1963/64
Government loar.s "taccovill 25 34 38 49
Cooperatives 117 107 106 --
ADBP 77 95 81 85
IDBP 1/ -- 195 258 331
PICIC -- -- 170 193
HBFC -- 29 9 --
Total: -- -- 702 --
1/ Newr loans and advances net of repayments anad including rupeeloans and advances against opening of L/Cs as well as foreigncurrency loans.
Source: Government services and institutions concerned.
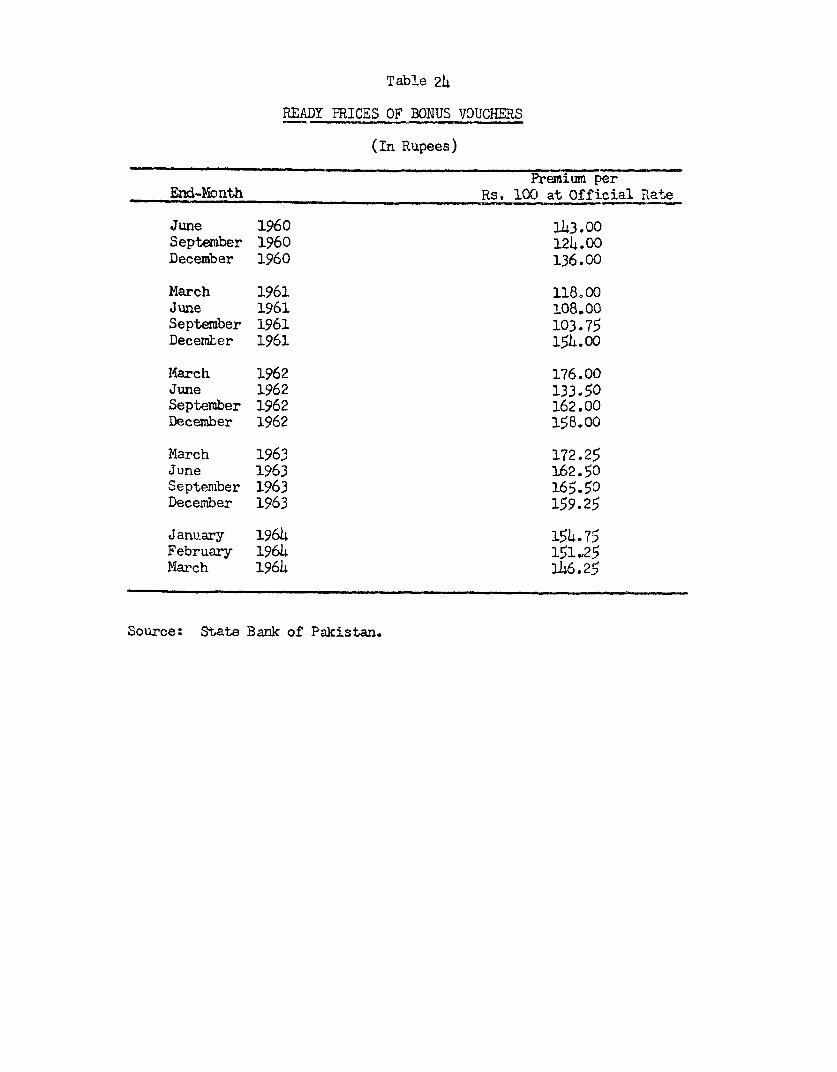
Table 24
READY PRICES OF BONUS VOUCHERS
(In Rupees)
Premium perEnd-Month Rs. 100 at Official Rate
June 1960 143.00September 1960 124.00
December 1960 136.00
March 1961 118O00June 1961 108.00September 1961 103.75December 1961 154.00
March 1962 176.00June 1962 133.50September 1962 162.00December 1962 158.00
March 1963 172.25June 1963 162.50September 1963 165.50December 1963 159.25
January 1964 154.75February 1964 151)25March 1964 146.25
Source: State Bank of Pakistan.
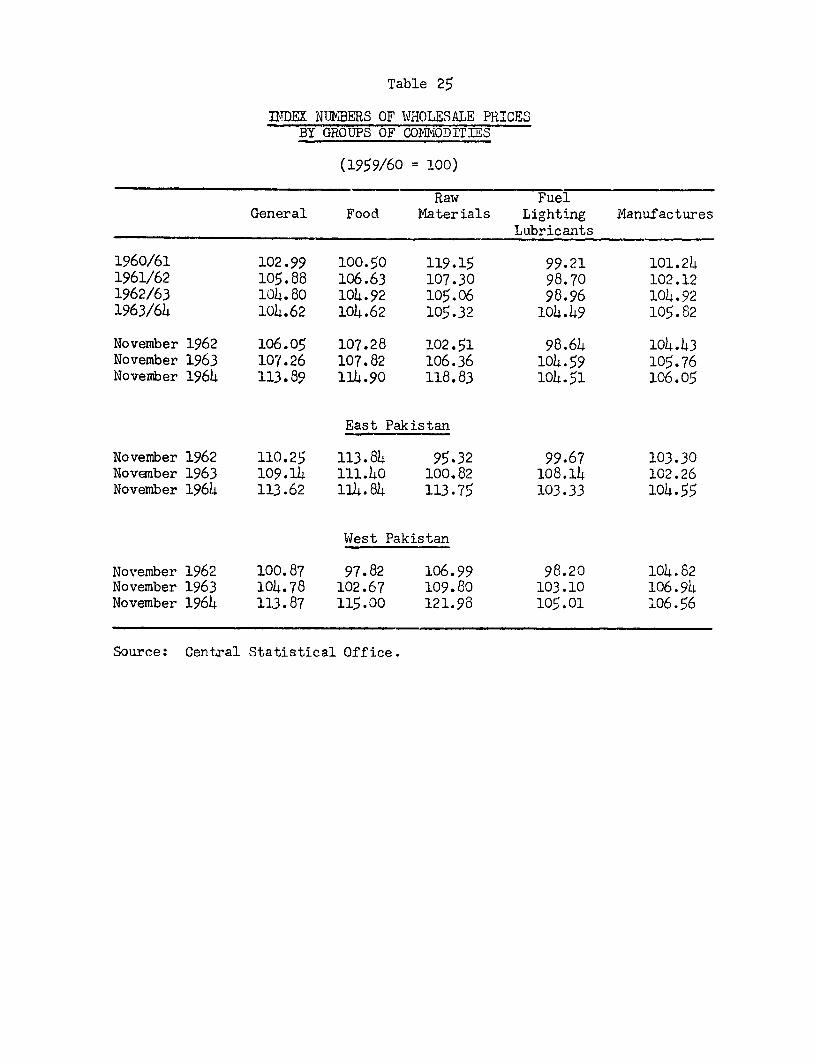
Table 25
TDEY( NTUKBERS OF WHOLESALE PRICESBY GROUPS OF COMNODITIES
(1959/60 = 100)
Raw FuelGeneral Food Materials Lighting Manufactures
Lubricants
1960/61 102.99 100.50 119.15 99.21 101.241961/62 105.88 106.63 107.30 98.70 102.121962/63 104.80 104.92 105.06 98.96 104.921963/64 104.62 104.62 105.32 104.49 105.82
November 1962 106.05 107.28 102.51 98.64 104.43November 1963 107.26 107.82 106.36 104.59 105.76November 1964 113.89 114.90 118.83 104.51 106.05
East Pakistan
November 1962 110.25 113.84 95.32 99.67 103.30November 1963 109.14 111.40 100.82 108.14 102.26November 1964 113.62 114.84 113.75 103.33 104.55
West Pakistan
November 1962 100.87 97.82 106.99 98.20 104.82November 1963 104.78 102.67 109.80 103.10 106.94November 1964 113.87 115.00 121.98 105.01 106.56
Source: Central Statistical Office.
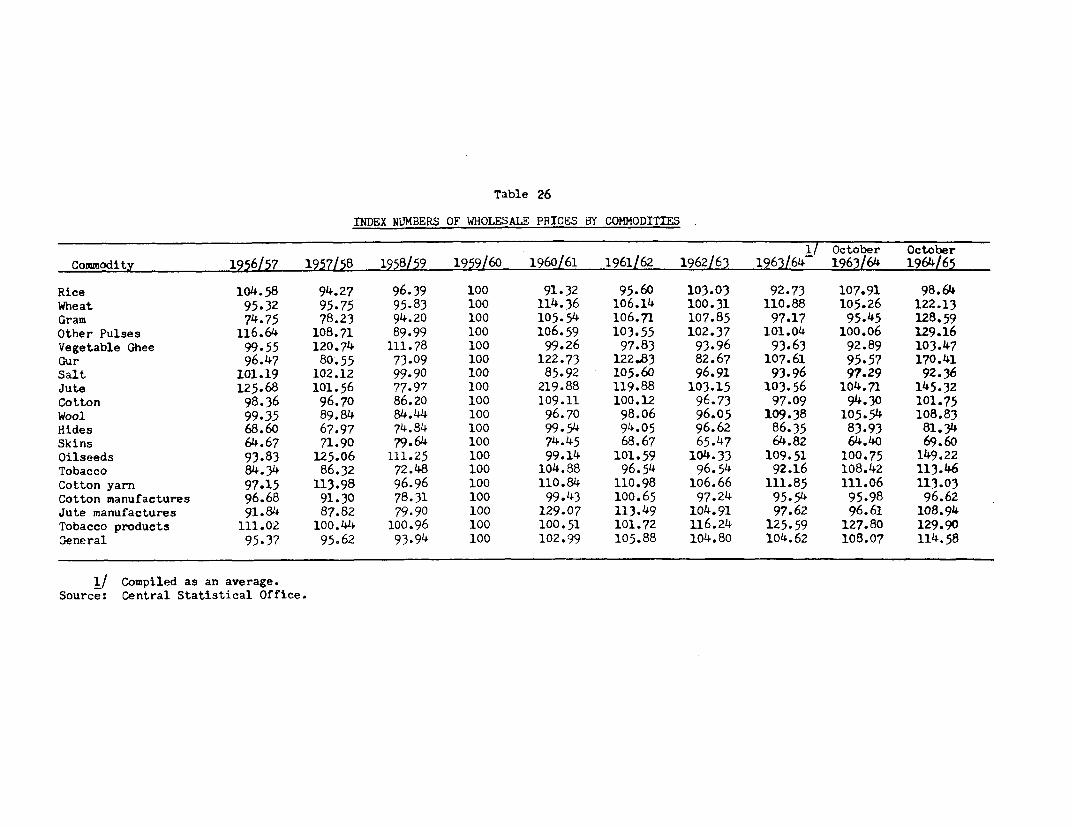
Table 26
INDEX NUMBERS OF WHOLESALE PRICES BY COMMODITIES
1/ October OctoberCommodity 1956/57 1957/58 1958/59 1959/60 1960/61 1961162 1962/63 1963/64 1963/64 1964/65
Rice 104.58 94.27 96.39 100 91.32 95.60 103.03 92-73 107.91 98.64Wheat 95.32 95.75 95.83 100 114.36 106.14 100.31 110.88 105.26 122.13Gram 74.75 78.23 94.20 100 105.54 106.71 107.85 97.17 95.45 128.59Other Pulses 116.64 108.71 89.99 100 106.59 103.55 102.37 101.04 100.06 129.16Vegetable Ghee 99.55 120.74 111.78 100 99.26 97.83 93.96 93.63 92.89 103.47Gur 96.47 80-.55 73-09 100 122.73 122.83 82.67 107.61 95.57 170.41Salt 101.19 102.12 99.90 100 85.92 105.60 96.91 93.96 97.29 92.36Jute 125.68 101.56 77.97 100 219.88 119.88 103.15 103.56 104.71 145.32Cotton 98.36 96.70 86.20 100 109.11 100.12 96-73 97.09 94.30 101.75Wool 99-35 89.84 84.44 100 96.70 98.06 96.05 109.38 105.54 108.83Hides 68.60 67.97 74.84 100 99.54 94.05 96.62 86.35 83.93 81.34Skins 64.67 71.90 79.64 100 74.45 68.67 65.47 64.82 64.40 69.60Oilseeds 93.83 125.06 111.25 100 99.14 101.59 104.33 109.51 100.75 149.22Tobacco 84.34 86.32 72.48 100 104.88 96.54 96.54 92.16 108.42 113.46Cotton yarn 97-15 113.98 96.96 100 110.84 110.98 106.66 111.85 111.06 113.03Cotton manufactures 96.68 91.30 78.31 100 99.43 100.65 97.24 95.54 95.98 96.62Jute manufactures 91.84 87.82 79.90 100 129.07 113.49 104.91 97.62 96.61 108.94Tobacco products 111.02 100.44 100.96 100 100.51 101.72 116.24 125.59 127.80 129.90General 95.37 95.62 93.94 100 102.99 105.88 104.80 104.62 108.07 114.58
I/ Compiled as an average.Source: Central Statistical Office.
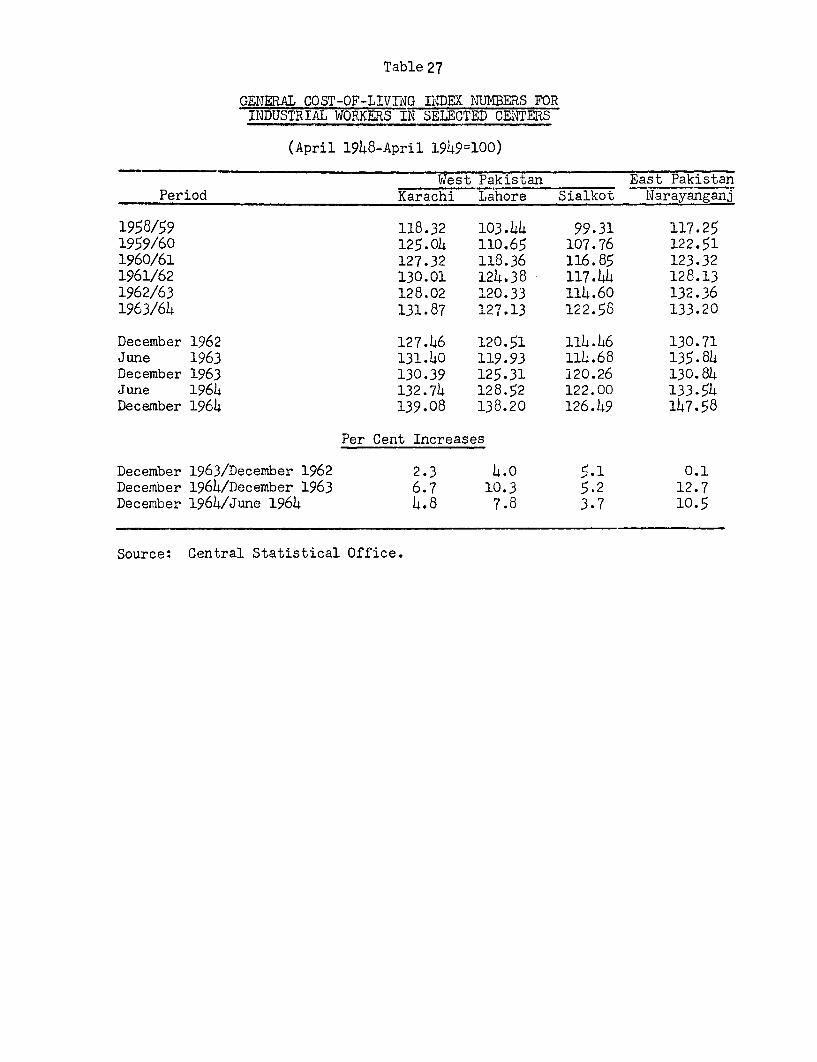
Table 27
GENIERAL COST-OF-LIVINiG IDEX NU'MBERS FORINDUSTRIAL WORKERS IN SELECTED CENTERS
(April 1948-April 1949=100)
West Pakistan East PakistanPeriod Karachi Lahore Sialkot Narayanganj
1958/59 118.32 103.44 99.31 117.251959/60 125.04 110.65 107.76 122.511960/61 127.32 118.36 116.85 123.321961/62 130.01 124.38 117.44 128.131962/63 128.02 120.33 114.60 132.361963/64 131.87 127.13 122.58 133.20
December 1962 127.46 120.51 114.46 130.71June 1963 131.40 119.93 114.68 135.84December 1963 130.39 125.31 320.26 130.84June 1964 132.74 128.52 122.00 133.54December 1964 139.08 138.20 126.49 147.58
Per Cent Increases
December 1963/December 1962 2.3 4.0 5.1 0.1Dece.mber 1964/December 1963 6.7 10.3 5.2 12.7December 1964/June 1964 4.8 7.8 3.7 10.5
Source: Central Statistical Office.
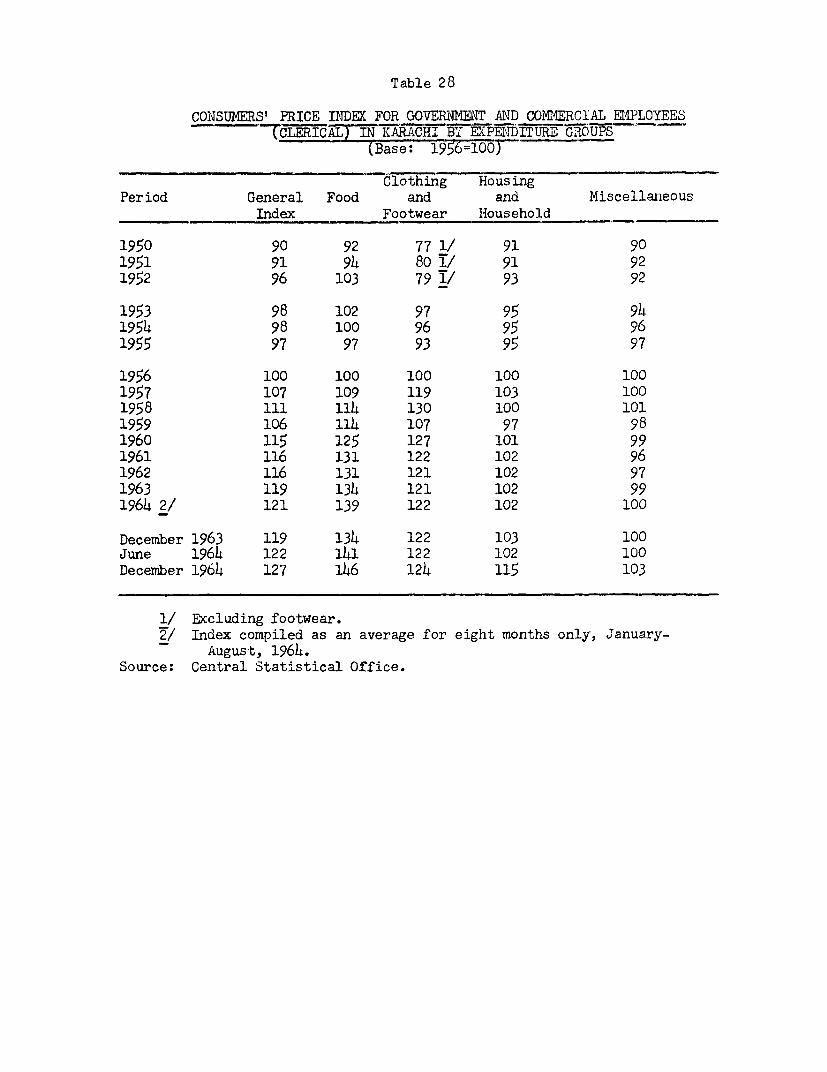
Table 28
CONSUMERS' PRICE INDEX FOR GOVERNMENT ANiD COMERCIAL EMPLOYEES(CLERICA)INTKARACHI BY EXPEifDITURE GROUPS
(Base: 1956=100)
Clothing HousingPeriod General Food and and Miscellaweous
Index Footwear Household
1950 90 92 77 1/ 91 901951 91 94 80 o/ 91 921952 96 103 79 _/ 93 92
1953 98 102 97 95 941954 98 100 96 95 961955 97 97 93 95 97
1956 100 100 100 100 1001957 107 109 119 103 1001958 ill 114 130 100 1011959 106 114 107 97 981960 115 125 127 101 991961 116 131 122 102 961962 116 131 121 102 971963 119 134 121 102 991964 2/ 121 139 122 102 100
December 1963 119 134 122 103 100June 1964 122 141 122 102 100December 1964 127 146 124 115 103
1/ EXcluding footwear.2/ Index compiled as an average for eight months only, January-
August, 1964.Source: Central Statistical Office.
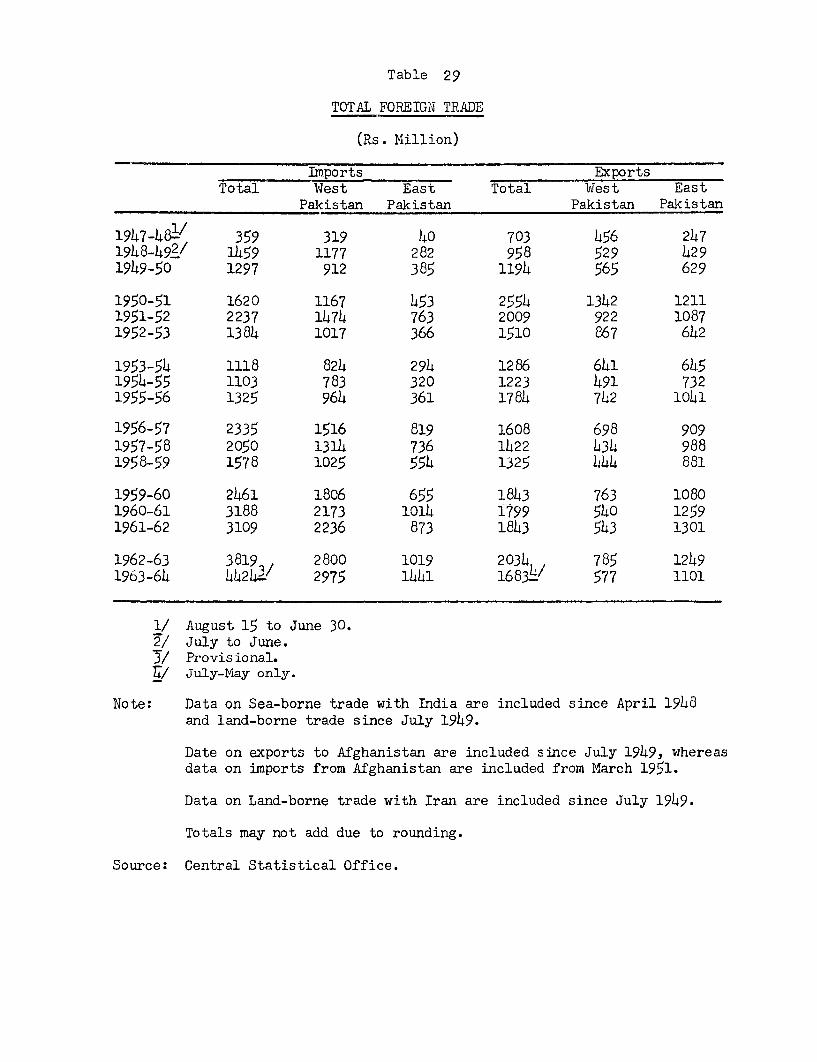
Table 29
TOTAL FOREIGN TRADE
(Rs. Million)
Imports ExportsTotal West East Total West East
Pakistan Pakistan Pakistan Pakistan
1947-481Y 359 319 40 703 456 2471948-492/ 1459 1177 282 958 529 4291949-50 1297 912 385 1194 565 629
1950-51 1620 1167 453 2554 1342 12111951-52 2237 1474 763 2009 922 10871952-53 1384 1017 366 1510 867 642
1953-54 1118 824 294 1286 641 6451954-55 1103 783 320 1223 491 7321955-56 1325 964 361 1784 742 1041
1956-57 2335 1516 819 1608 698 9091957-58 2050 1314 736 1422 434 9881958-59 1578 1025 554 1325 444 881
1959-60 2461 1806 655 1843 763 10801960-61 3188 2173 1014 1799 540 12591961-62 3109 2236 873 1843 543 1301
1962-63 3819 2800 1019 2034 785 12491963-64 44243/ 2975 1441 16834/ 577 1101
1/ August 15 to June 30.2/ July to June.3/ Provisional.77/ July-may only.
Note: Data on Sea-borne trade with India are included since April 1948and land-borne trade since July 1949.
Date on exports to Afghanistan are included since July 1949, whereasdata on imports from Afghanistan are included from March 1951.
Data on Land-borne trade with Iran are included since July 1949.
Totals may not add due to rounding.
Source: Central Statistical Office.
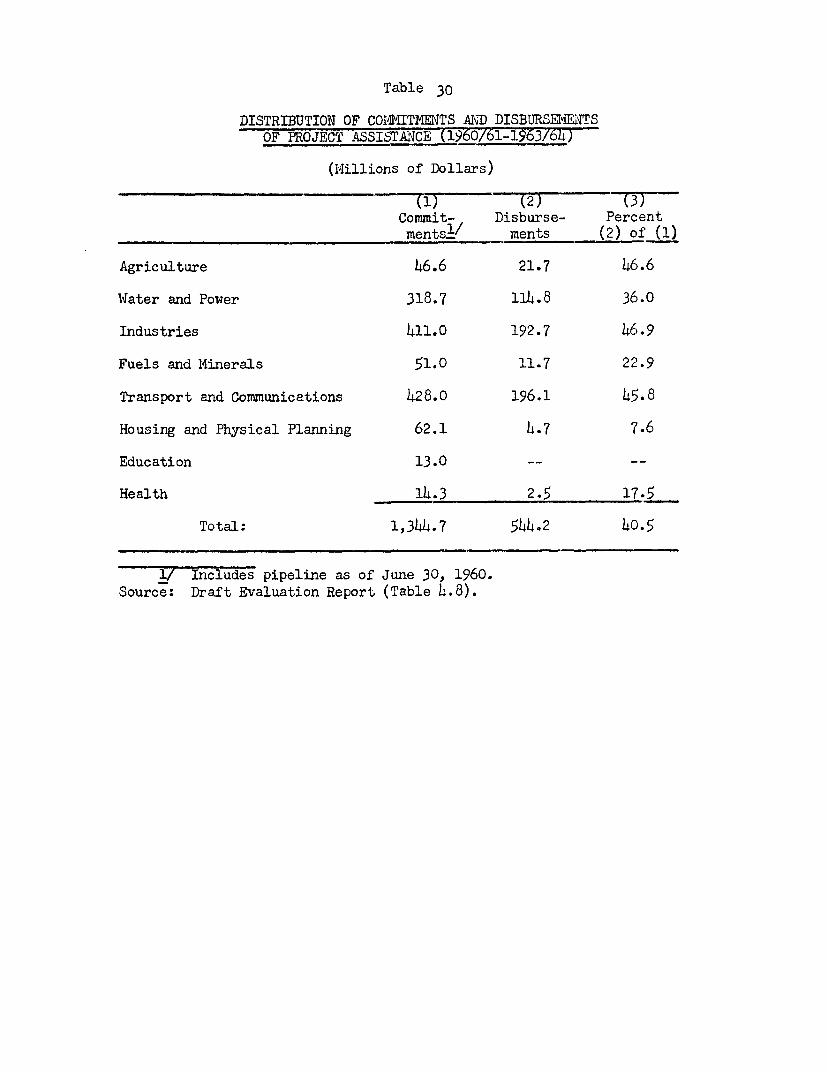
Table 30
DISTRIBUTION OF COIOMTMITS AND DISBURSE1VENTSOF PROJECT ASSISTANCE (1960/61-1963/64)
(Millions of Dollars)
- (1) ~~~~(2) (F37Commit- Disburse- Percentmentsl/ ments (2) of (1)
Agriculture 46.6 21.7 46.6
Water and Power 318.7 114.8 36.0
Industries 411.0 192.7 46.9
Fuels and Minerals 51.0 11.7 22.9
Transport and Communications 428.0 196.1 45.8
Housing and Physical Planning 62.1 4.7 7.6
Education 13.0 -- --
Health 14.3 2.5 17.5
Total: 1,344.7 544.2 40.5
l/ Includes pipeline as of June 30, 1960.Source: Draft Evaluation Report (Table 4.8).
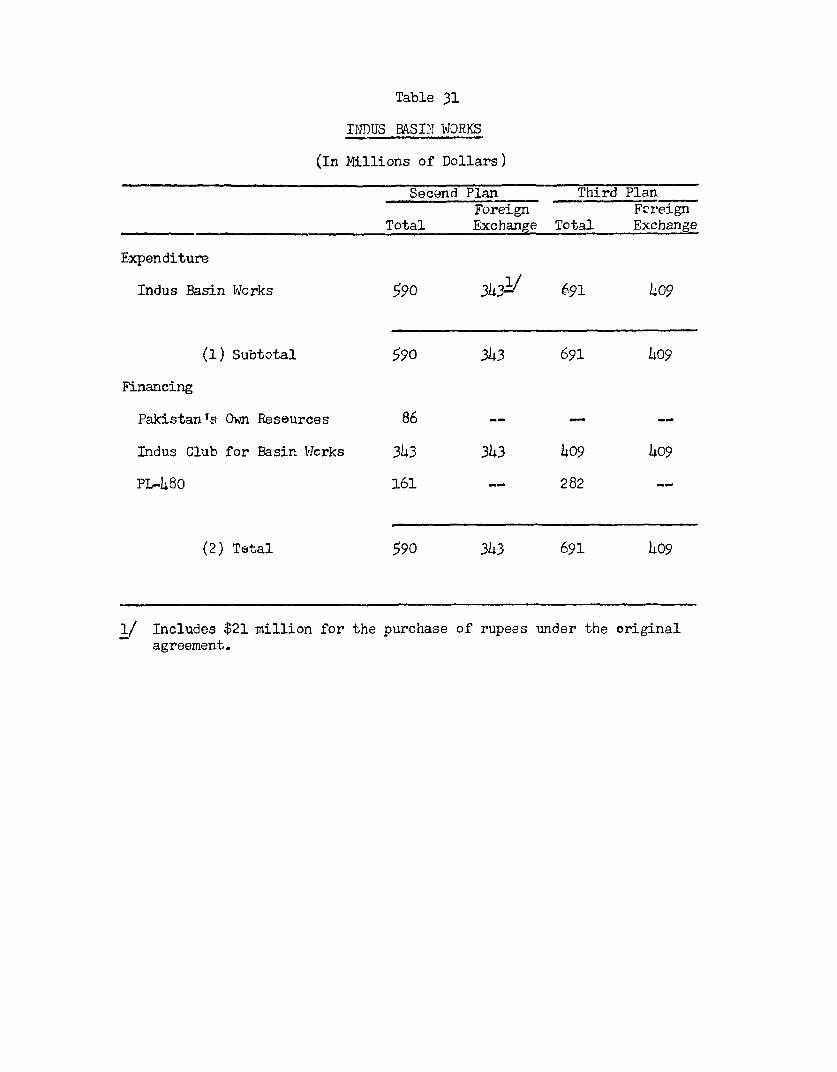
Table 31
INDUS BASIN WORKS
(In Millions of Dollars)
Second Plan Third PlanForeign F.reign
Total Exchange Total Exchange
Expenditure
Indus Basin Works 590 343 O 691 409
(1) Subtotal 590 343 691 409
F'inancing
Pakistan's Own Reseurces 86 -- -_
Indus Club for Basin Wcrks 343 343 409 409
PL-480 161 -- 282 --
(2) Total 590 343 691 409
1/ Includes $21 million for the purchase of rupees under the originalagreement.
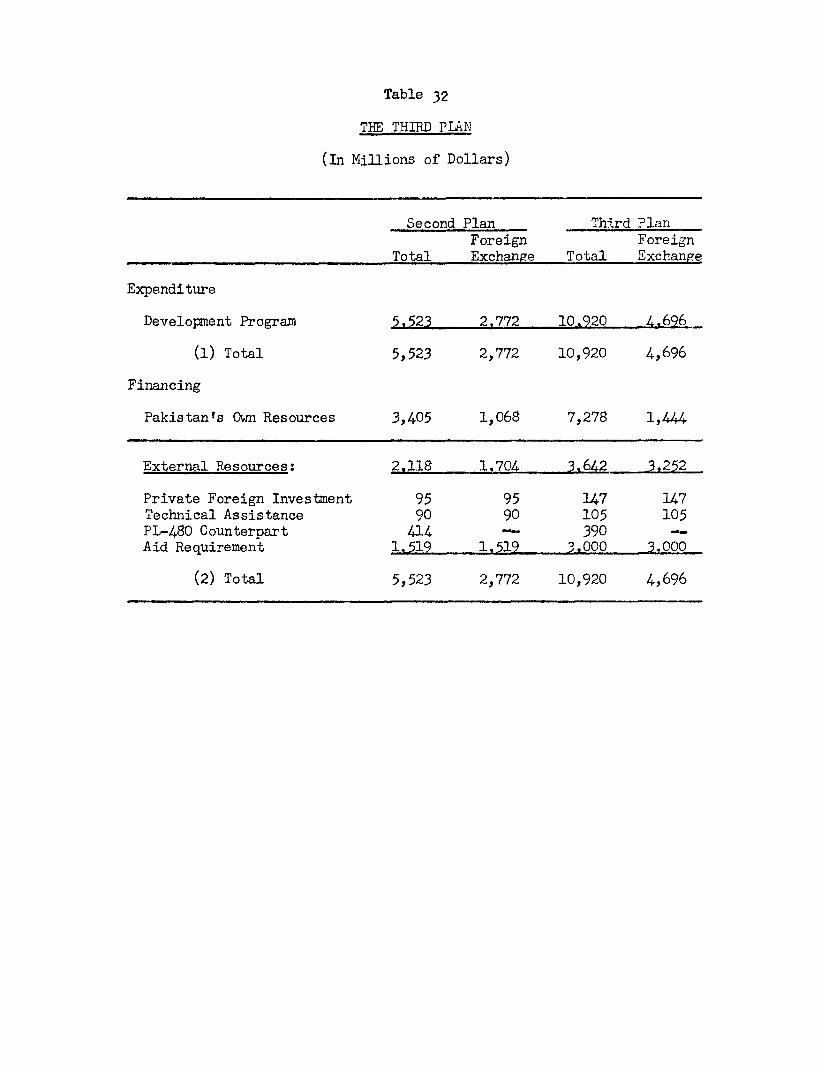
Table 32
THE THIRD PLAN
(In Millions of Dollars)
Second Plan Third PlanForeign Foreign
Total Exchange Total Exchange
Expenditure
Development Program 5,523 2.772 10.920 4.696_
(1) Total 5,523 2,772 10,920 4,696
Financing
Pakistan's Own Resources 3,405 1,068 7,278 1,444
External Resources: 2.118 1,704 3.642 3,252
Private Foreign Investment 95 95 147 147Technical Assistance 90 90 105 105PL-480 Counterpart 414 -- 390 Aid Requirement 1.519 1.519 3.000 3.000
(2) Total 5,523 2,772 10,920 4,696
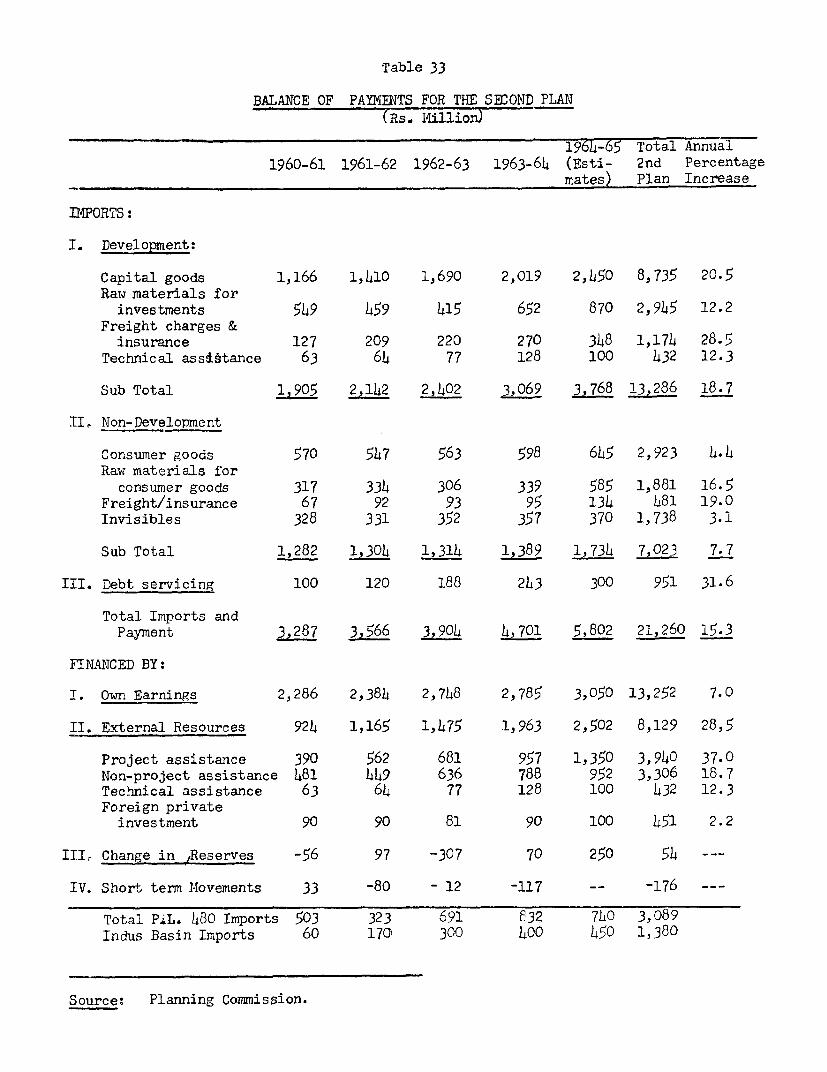
Table 33
BALANCE OF PAYMENTS FOR THE SECOND PLAN(Rs. I4illion)
1964-65 Total Annual1960-61 1961-62 1962-63 1963-64 (Esti- 2nd Percentage
mates) Plan Increase
IMPORTS:
I. Development:
Capital goods 1,166 1,410 1,690 2,019 2,450 8,735 20.5Raw materials for
investments 549 459 415 652 870 2,945 12.2Freight charges &
insurance 127 209 220 270 348 1,174 28.5Technical assistance 63 64 77 128 100 432 12.3
Sub Total 1,905 2,142 2,402 3,069 3,768 13,286 18.7
II, Non-Development
Consumer goods 570 547 563 598 645 2,923 4.4Raw materials for
consumer goods 317 334 306 339 585 1,881 16.5Freight/insurance 67 92 93 95 134 481 19.0Invisibles 328 331 352 357 370 1,738 3.1
Sub Total 1,282 1,304 1,314 1,389 1,734 7,023 7.7
III. Debt servicing 100 120 188 243 300 951 31.6
Total Imports andPayment 3,287 3,566 3,904 4,701 5,802 21,260 15.3
FINANCED BY:
I. Own Earnings 2,286 2,384 2,748 2,785 3,050 13,252 7.0
II. External Resources 924 1,165 1,475 1,963 2,502 8,129 28,5
Project assistance 390 562 681 957 1,350 3,940 37.0Non-project assistance 481 4h9 636 788 952 3,306 18.7Technical assistance 63 64 77 128 100 432 12.3Foreign private
investment 90 90 81 90 100 451 2.2
III, Change in ,Reserves -56 97 -307 70 250 54 --
IV. Short term Movements 33 -80 - 12 -117 -- -176 ---
Total P4L. 480 Imports 503 323 691 632 7L0 3,089Indus Basin Imports 60 170, 300 400 450 1,380
Source: Planning Commission.
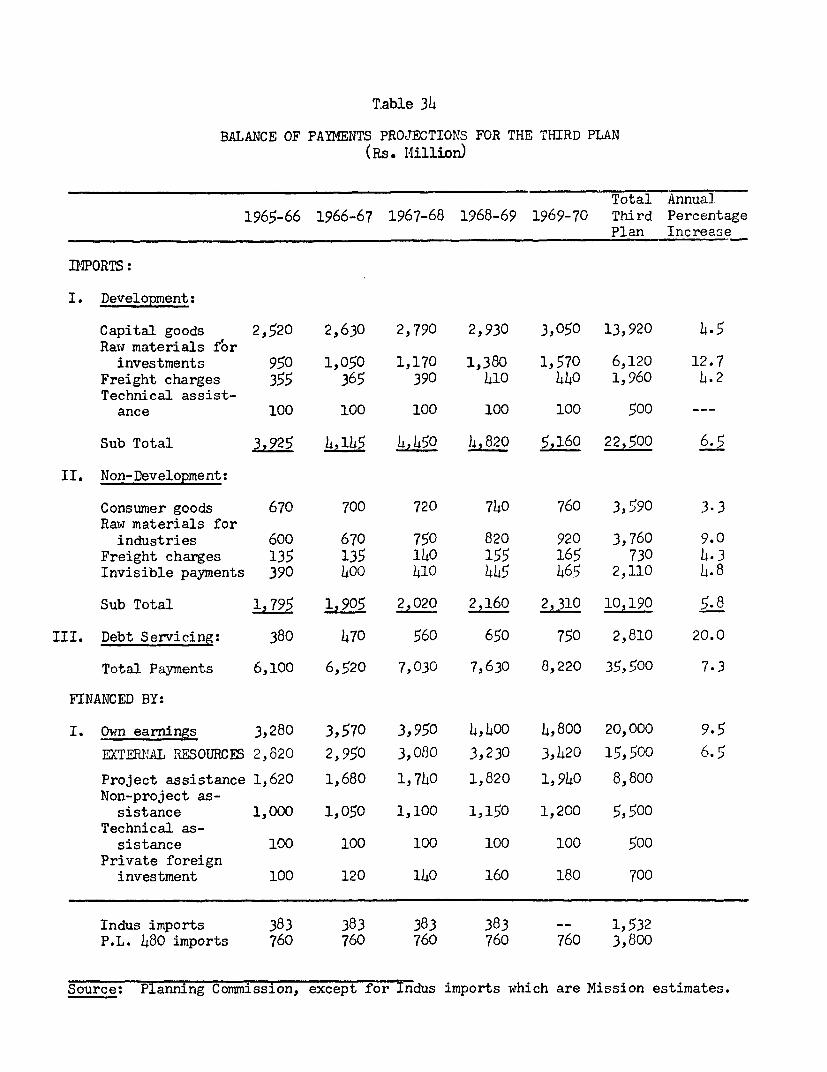
T.able 34
BALANCE OF PAYMENTS PROJECTIONS FOR THE THIRD PLAN(Rs. 4illion)
Total Annual1965-66 1966-67 1967-68 1968-69 1969-70 Third Percentage
Plan Increase
IMPORTS:
I. Development:
Capital goods 2,520 2,630 2,790 2,930 3,050 13,920 4.5Raw materials for
investments 950 1,050 1,170 1,380 1,570 6,120 12.7Freight charges 355 365 390 410 440 1,960 4.2Technical assist-
ance 100 100 100 100 100 500 ---
Sub Total 3,925 4,145 4,450 4,820 5,160 22,500 6.5
II. Non-Development:
Consumer goods 670 700 720 740 760 3,590 3.3Raw materials for
industries 600 670 750 820 920 3,760 9.0Freight charges 135 135 140 155 165 730 4.3Invisible payments 390 400 410 445 465 2,110 4.8
Sub Total 1,795 1,905 2,020 2,160 2,310 10,190 5.8
III. Debt Servicing: 380 470 560 650 750 2,810 20.0
Total Payments 6,100 6,520 7,030 7,630 8,220 35,500 7.3
FINANCED BY:
I. Own earnings 3,280 3,570 3,950 4,400 4,800 20,000 9.5EXTERU1'AL IRESOURCES 2,620 2,950 3,080 3,230 3,420 15,500 6.5
Project assistance 1,620 1,680 1,740 1,820 1,940 8,800Non-project as-
sistance 1,000 1,050 1,100 1,150 1,200 5,500Technical as-
sistance 100 100 100 100 100 500Private foreign
investment 100 120 140 160 180 700
Indus imports 383 383 383 383 __ 1,532P.L. 480 imports 760 760 760 760 760 3,800
Source: Planning Commission, except for Indus imports which are Mission estimates.
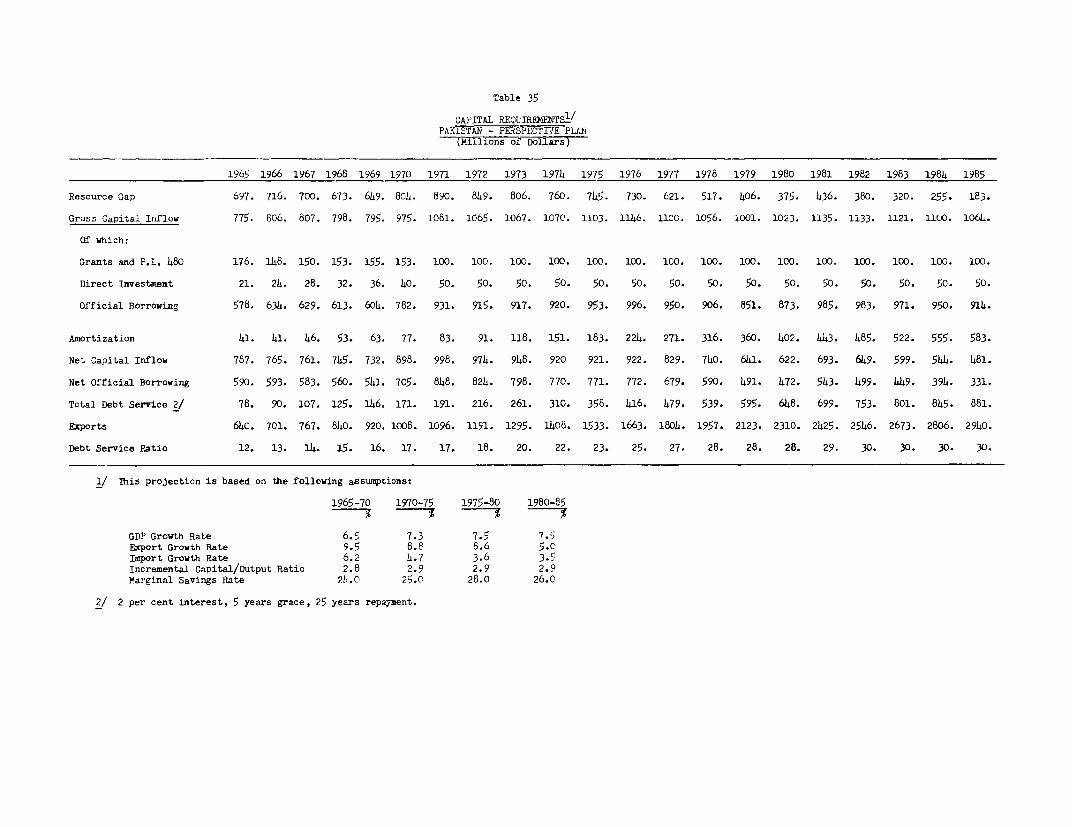
Table 35
CAPITAL REQUIREMENTS1/PAKISTAN - PERSPECTIVE PLJWi
(4illions of Dollars)
1965 1966 1967 1968 1969 1970 1971 1972 1973 1974 1975 1976 1977 1978 1979 1980 1981 1982 1983 1984 1985
Resource Gap 697. 716. 700. 673. 649. 804. 890. 849. 806. 760. 745. 730. 621. 517. 406. 375. 436. 380. 320. 255. 183.
Gross Capital Inflow 775. 806. 807. 798. 795. 975. 1081. 1065. 1067. 1070. 1103. 1146. 1CO. 1056. 1001. 1023. 1135. 1133. 1121. 1100. 1061.
Of which:
Grants and P.L. 480 176. 148. 150. 153. 155. 153. 100. 100. 100. 100. 100. 100. 100. 100. 100. 100. 100. 100. 100. 100. 100.
Direct Inmvestment 21. 24. 28. 32. 36. 40. 50. 50. 50. 50. 50. 50. 50. 50. 50. 50. 50. 50. 50. 50. 50.
Official Borrowing 578. 634. 629. 613. 604. 782. 931. 915. 917. 920. 953. 996. 950. 906. 851. 873. 985. 983. 971. 950. 914.
Amortization 41. 41. 46. 53. 63. 77. 83. 91. 118. 151. 183. 224. 271. 316. 360. 402. 443. 485. 522. 555. 583.
Net Capital Inflow 787. 765. 761. 745. 732. 898. 998. 974. 948. 920 921. 922. 829. 740. 641. 622. 693. 619. 599. 544. 481.
Net Official Borrowing 590. 593. 583. 560. 541. 705. 848. 824. 798. 770. 771. 772. 679. 590. 491. 472. 543. 499. 449. 394. 331.
Total Debt Service 2/ 78. 90. 107. 125. 146. 171. 191. 216. 261. 310. 358. 416. 479. 539. 595. 648. 699. 753. 801. 845. 881.
Exports 610. 701. 767. 840. 920. 1008. 1096. 1151. 1295. 1408. 1533. 1663. 1804. 1957. 2123. 2310. 2425. 2546. 2673. 2806. 2940.
Debt Service Ratio 12. 13. 14. 15. 16. 17. 17. 18. 20. 22. 23. 25. 27. 28. 28. 28. 29. 30. 30. 30. 30.
1/ This projection is based on the following assumptions:
1965-70 1970-75 1975-80 1980-85
GDP Growth Rate 6.5 7.3 7.5 7.5Export Growth Rate 9.5 8.8 8.6 5.cImport Growth Rate 6.2 4.7 3.6 3.5Incremental Capital/Output Ratio 2.8 2.9 2.9 2.9Marginal Savings Rate 27.0 25.0 28.0 26.0
2/ 2 per cent interest, 5 years grace, 25 years repayment.