Embed Size (px)
Citation preview
1
IL&FS Transportation Networks Ltd
Analyst MeetJune 1, 2015CIN - L45203MH2000PLC129790

2
IL&FS Transportation - Overview
3
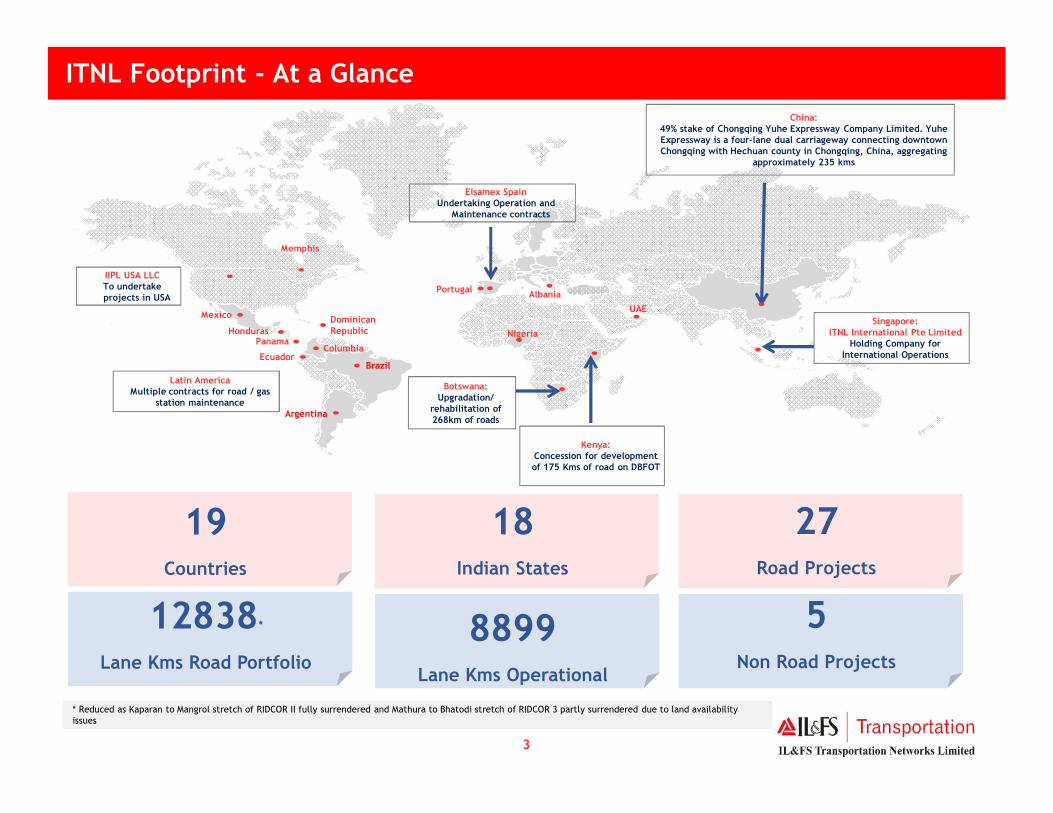
27Road Projects
18Indian States
19 Countries
5Non Road Projects
8899Lane Kms Operational
12838*
Lane Kms Road Portfolio
ITNL Footprint - At a Glance
Singapore: ITNL International Pte Limited
Holding Company for International Operations
China: 49% stake of Chongqing Yuhe Expressway Company Limited. YuheExpressway is a four-lane dual carriageway connecting downtown Chongqing with Hechuan county in Chongqing, China, aggregating
approximately 235 kms
Elsamex SpainUndertaking Operation and
Maintenance contracts
Botswana: Upgradation/
rehabilitation of 268km of roads
Kenya: Concession for development of 175 Kms of road on DBFOT
Latin AmericaMultiple contracts for road / gas
station maintenance
IIPL USA LLCTo undertake projects in USA
Mexico
Columbia
Brazil
Argentina
Ecuador
PanamaHonduras
Dominican Republic Nigeria
UAE
Portugal Albania
Memphis
* Reduced as Kaparan to Mangrol stretch of RIDCOR II fully surrendered and Mathura to Bhatodi stretch of RIDCOR 3 partly surrendered due to land availability issues

4
Revenue Growth Trends – Select Roads *
GRICL
747850
1037 1067 10751197
0
200
400
600
800
1000
1200
1400
FY 10 FY 11 FY 12 FY 13 FY 14 FY 15
Toll Collection (INR mn)
RIDCOR (Phase I & II)
Noida Toll Bridge
706 696774
888994 1035
0
200
400
600
800
1000
1200
FY 10 FY 11 FY 12 FY 13 FY 14 FY 15
Toll Collection (INR mn)
8261063
1,634
2,0622,365 2,488
0
500
1000
1500
2000
2500
FY 10 FY 11 FY 12 FY 13 FY 14 FY 15
Toll Collection (INR mn)
Yuhe Expressway
3,293
4,0624,599
0
1000
2000
3000
4000
5000
FY 13 FY 14 FY 15
Toll Collection (INR mn)
4* Not adjusted for consolidation

5
Order book – Geographic Spread
Rajasthan11.23%
Uttar Pradesh2.03%
Maharashtra10.29%
Kerala0.08%
Andhra Pradesh/ Telangana1.56%
Jharkhand & W.Bengal15.49%
Haryana,\8.83%
Jammu & Kashmir34.47%
Himachal Pradesh12.74%
Madhya Pradesh1.45%
Meghalaya0.46%
Orissa & W. Bengal0.51%
Total order book of USD 1.87 billion
Order book details as of March 31, 2015 : INR?USD = 63.5 as at May 22, 2015
ITNL’s Order Book: Composition & Spread
Road- Annuity
Road- Toll
Non Road
34%
11%
55%
NHAI
Non- NHAI
Non Road Projects
52%
11%
37%
Order book – Project Type
Order book – Sourcing
5

6
ITNL – Steady Revenue Growth and Improving EBITDA Margins
Source: Company information
Source: Company informationNote: Includes rights under Service Concession Agreement, which represents Annuity & Toll Assets at Net Value* Not adjusted for Dividend payout
INR MN INR MN
INR MN INR MN
41,274
57,294
67,888 68,025 68,283
4329 4970 5202 4630 4436
10.49%8.67%
7.66%6.81% 6.50%
0%
5%
10%
15%
20%
0
10,000
20,000
30,000
40,000
50,000
60,000
70,000
80,000
FY 2011 FY 2012 FY 2013 FY 2014 FY 2015
Revenues Net Profit Profit Margin
FY 2011 – FY 2015 Revenue CAGR = 13.41%
12,335
15,894
19,81821,051
24,658
30%
28%29%
31%
36%
20%
25%
30%
35%
40%
0
5,000
10,000
15,000
20,000
25,000
30,000
FY 2011 FY 2012 FY 2013 FY 2014 FY 2015EBITDA EBITDA Margin
FY 2011 – FY 2015 EBITDA CAGR = 18.91%
55,055
1,10,662
1,62,135
2,16,032
2,54,175
0
50,000
1,00,000
1,50,000
2,00,000
2,50,000
3,00,000
FY 2011 FY 2012 FY 2013 FY 2014 FY 2015Net Fixed Assets
FY 2011 - FY 2014 NFA CAGR = 20.12%
53,948
1,02,259
1,43,591
1,88,165
2,35,135
22392 27638 3639850,038 58,379
70.7%
78.7%79.8%
79.0% 80.1%
64.0%
69.0%
74.0%
79.0%
84.0%
0
50,000
1,00,000
1,50,000
2,00,000
2,50,000
3,00,000
FY 2011 FY 2012 FY 2013 FY 2014 FY2015Debt Equity Debt / Total Capital
*

7
India Road Sector Outlook

8
Infrastructure Segment – Poised for Growth
• Of the 3,091 kms awarded by NHAI in 2014 – 15, only 24% (5 projects) went on BOT mode
• Close to three fourth of length to be awarded on EPC over the next couple of years
• NHAI has amicably terminated stuck projects which would aid future awarding
Aggregate investment in Roads to nearly double over the next 5 years
National Highway - Awarding to pick up gradually from current low levels
Sources: CRISIL Research, NHAI* Annual avg additional awarding of 2,500 kms by MoRTH
Sources: NHAI, MORTH, CRISIL Research
NHAI AwardingInvestment in Roads
27%
30%
57%
60%16%
10%
Past five years 2009-10 to 2013-14 Next five years 2014-15 to 2018-19
National Highways State Roads Rural Roads
USD bn KmUSD 0.12bn
USD 0.07bn
5,032
1,707 1,115 1,522
3,091
3,953 4,469
5,132
5,365 240
4,412
955
1,083 683
4,269 *
2010
-11
2011
-12
2012
-13
2013
-14
2014
-15P
2015
-16P
2016
-17P
2017
-18P
2018
-19P
Actual Awarding Terminated Awarding by MoRTH

9
Road Sector Opportunity
Program To be Awarded (in Km)
NHDP-III 2,805
NHDP-IV 9,892
NHDP-V 2,944
SARDP-NE 278
Total 15,919
NHDP Overall Progress
• India’s road network increased to 4.2 mn km from 3.3 mn km
• The 13th Finance Commission has decided to provide acentral grant of USD 3.3 bn over the period 2011 -15 fordevelopment of state roads across the country. This is inaddition to the normal expenditure that is undertaken
• National highways, which comprise 2% of the total network,carry 40% of the traffic; are overloaded at many places orcorridors
• Only ~24% of national highways are four-laned
Composition of the Indian Road Sector –(‘000 kms)
Source: www.nhai.org accessed on March 31, 2015
79 131
2,650
467
National Highways
State Highways
Rural and other roads
Major and other district roads 7,522
7,142
12,109
14,799
6,500
1,000
700
380
5846
6708
9304
4907
3556
41
4
0 3,000 6,000 9,000 12,000 15,000
I
II
III
IV
V
VI
VII
PC*
Completed/Under Imp (km) Total Length (km)
Balance road awards under NHDP to be substantially executed over next 2-3 years
* Port Connectivity

10
n NHAI has awarded a total of 27 projects measuring ~3,091 kms in FY 15 versus 1,522 kms in FY14
n NHAI’s total expenditure in FY 15 was 21,000 crores, FY 16 target is 75,000 crores; increase of55,000 crores to be funded by increased budget allocation (15,000 crores) and borrowings(40,000 crores)
n Favorable budget allocation to MoRTH and NHAI
− Conversion of existing excise duty on petrol and diesel of Rs. 4 per litre into Road Cess will bringadditional Rs. 400 billion for roads
n RBI rate cuts by 50 bps favorable although banks have only recently transferred ~10-20bps savings to the borrowers; further softening of interest cycle likely to reduce theborrowing costs
n Announcements likely to benefit the sector in the longer run
− “5:25” scheme to address ALM mismatch; helps concessionaire to make debt repaymentcoterminous with project cash flows
− Infrastructure investment trusts (InvIT’s)
− Infra bonds – exempt from requirement of CRR, SLR; likely to bring down cost of funds in thelonger run
− Establishment of National Investment & Infrastructure Fund; initial corpus of INR 200 billion toraise debt to be infused as equity in infrastructure projects
Key Updates : Macro
NHAI Activity
Government Initiatives
11
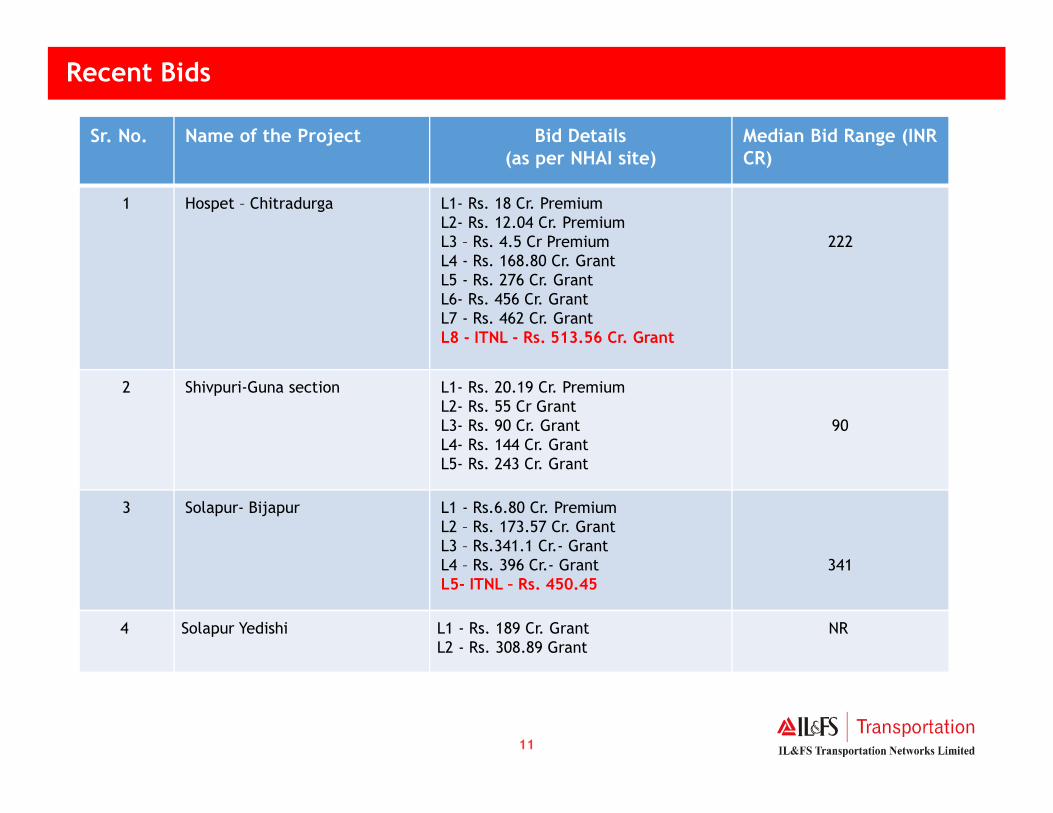
Sr. No. Name of the Project Bid Details(as per NHAI site)
Median Bid Range (INR CR)
1 Hospet – Chitradurga L1- Rs. 18 Cr. PremiumL2- Rs. 12.04 Cr. PremiumL3 – Rs. 4.5 Cr PremiumL4 - Rs. 168.80 Cr. GrantL5 - Rs. 276 Cr. GrantL6- Rs. 456 Cr. GrantL7 - Rs. 462 Cr. GrantL8 - ITNL - Rs. 513.56 Cr. Grant
222
2 Shivpuri-Guna section L1- Rs. 20.19 Cr. PremiumL2- Rs. 55 Cr GrantL3- Rs. 90 Cr. GrantL4- Rs. 144 Cr. GrantL5- Rs. 243 Cr. Grant
90
3 Solapur- Bijapur L1 - Rs.6.80 Cr. PremiumL2 – Rs. 173.57 Cr. GrantL3 – Rs.341.1 Cr.- GrantL4 – Rs. 396 Cr.- GrantL5- ITNL – Rs. 450.45
341
4 Solapur Yedishi L1 - Rs. 189 Cr. GrantL2 - Rs. 308.89 Grant
NR
Recent Bids

12
Sr. No. Name of the Project Bid Details(as per NHAI site)
Median Bid Range (INR CR)
4 Mukarba Chowk - Panipat Section L1 – Rs. 189 Cr. GrantL2 – Rs. 198.9 Cr. GrantL3 – Rs. 297 Cr. GrantL4 - Rs. 360 Cr. GrantL5 - Rs. 487 Cr. Grant
297
6 Yedishi Aurangabad L1- Rs. 558 Cr. GrantL2- Rs. 625.89 Cr. GrantL3 - ITNL - Rs. 654.9 Cr. Grant
625
7 Kaithal Rajasthan L1 – Rs. 234 Cr. Grant NR
8 Bikaner Phalodi Section L1 - Rs. 327 Cr. Grant NR
9 Agra Etawah L1 – Rs. 81 Cr. PremiumL2 – Rs. 16.88 Cr. PremiumL3 – Rs. 26 Cr. Grant
26
Recent Bids….continued

13
RISK SHARING MATRIX - Existing vs Modified MCA + Hybrid Model
Land acquisition
Forest Clearance
Environment Clearance
Utility Shifting
Design & Construction
Modification/Change of Scope
Operation and maintenance
Force Majeure
Service/ Performance std.
Traffic / Revenue risk
Financing Risk
NHAI Concessionaire
• Proposed Changes in Model Concession
Agreement:
1. 80% land CP non-waivable
2. Rationalization of TPC
definition
3. Easing exit norms further
• Proposed Hybrid model of concession:
1. Revenue risk borne by NHAI
2. Bid parameter is TPC
3. 40% of TPC to be funded by
NHAI
4. Concessionaire to close balance
60% on suitable D/E mix
Proposed Amendments
11
Annuity

14
ITNL Accounting – FAQ’s

15
ITNL : Accounting Explained
Background
§ Government has introduced Contractual Service arrangements to attract Private sector participation in the development, financing, operation and maintenance of infrastructural facilities for public services
§ An arrangement of this nature involves a private sector entity constructing, operating and maintaining those infrastructural facilities for a specified period of time
§ The operator is paid for its services over the period of the arrangement
§ Such an arrangement is described as a build-operate-transfer or a public to private Service Concession Arrangement
§ Paragraph 10 of the guidance note issuedby the ICAI sets out the principles forrecognising and measuring obligations andrelated rights in SCA
§ Accordingly, revenue and costs relating toconstruction are accounted as per theStandard on Construction Accounting andrecognised either as an Intangible Assetor a Financial Asset as prescribed
§ In substance, under the SCA, theconcessionaire renders services and inreturn receives either a right to collect auser fee or a right to receive cash oranother financial asset from the grantorof the concession
Guidance Note on SCA

16
ITNL Accounting: Asset Classfication
1. Financial Assets (Annuity)
Where a concessionaire has an unconditional contractual right to receive cash for a predetermined period (Annuity) from the grantor of the concession, such a concession isrecognised as a Financial Asset
Financial Assets are disclosed in the Balance Sheet under ‘Other Non-Current Assets’ as‘Receivable against Service Concession Arrangement’
2. Intangible Assets (Right to receive User Fee)
Where a Concessionaire receives a right to charge users of the public service, such aconcession is recognised as an Intangible Asset
Such assets are disclosed in the Balance Sheet under ‘Fixed Assets’ as follows:
Completed Projects - ‘Rights under Service Concession Arrangement’
Projects under Development- ‘Intangible Assets under Development’

17
Accounting for Financial Assets:
§ A Financial Asset is recognised as “Receivable under
Service Concession Arrangement (SCA)” at the fair
value of the constructed asset which comprises of the
construction cost plus the margin as per the SCA.
§ “Finance cost” is charged to the Profit and Loss
Account during construction and operations
§ “Finance income” representing the intrinsic value of
the asset, is calculated using the effective interest
rate method and is debited to “Receivable under SCA”
and credited to the Profit and Loss Account.
§ O&M and Overlay expenses are charged to the Profit
and Loss Account. The same is added to “Receivable
under SCA” at fair value & recognised as O&M Income
§ Annuity received is reduced from the “Receivable
under SCA”
ITNL : Accounting Explained contd....
Accounting for Intangible Assets:
§ An “Intangible Asset” is recognised at the fair value of
the constructed asset which comprises of the
construction cost & margins as per SCA
§ Finance cost during construction is capitalised as per
Accounting Standard 16
§ Toll collected from users is credited to the Profit and
Loss Account
§ Finance cost and O&M Expenses are charged to the
Profit and Loss Account
§ Estimated Overlay cost is provided for each year by a
charge to the Profit and Loss Account and actual
expenditure is set off against the provision so created
§ The Intangible is amortized over the concession period
in the ratio that the toll revenue in a year bears to
the estimated toll revenues over the concession

18
Road Ahead

19
Strategy Snapshot
Process Flow
Business Goals
Financial Results
Core Systems
Environment, Safety
Risk Management
Regulatory & Social
Pipeline Creation
Opportunity Identification
Design, Bid, Develop
Parentage
O&M , Tolling Ops
Leadership Culture
Expand Revenue, Profitability
Asset efficiency, churn
Long term shareholder value
Portfolio Expansion Portfolio Optimization
Brand Value
Capital Structure
Health, Quality

20
1. Portfolio Scaling
Business Verticals Approach & Opportunity
Concession Portfolio
O&M Portfolio –International
• NHAI’s stated target is to award around 9000 kms in FY 16 through BOT and EPC route
• Decreased intensity of competition in BOT space to provide a window of opportunity to selectively win projects with higher returns
• New hybrid model likely to be a win-win for all stakeholders
• Overseas concessions will be opportunistic where risk – reward ratio is significantly skewed in our favor vis-à-vis domestic concessions and equity ask is minimal
• Expand O&M footprint in emerging economies by targeting multilaterally funded projects to mitigate payment and sovereign risks
• Expand domestic OPRC portfolio through Elsamex India e.g. Case in point was 5 year OPRC contract won by Elsamex in India for Rs315 crores (186 kms)
O&M Portfolio –Domestic

21
2. Portfolio Optimization & Financial Management
Portfolio Optimization Balance Sheet ManagementImprove Asset Utilization
Focused on completing current order book on time and to finish the balance length in projects like Pune Sholapur, Moradabad Bareilly
• Tolling at projected capacity / rates not happening till full length not completed; delay in handover of land for feeder roads, bypasses etc
Portfolio Churn
Recycle capital through divestures of toll and annuity assets
• Divested 42% stake in GRICL to global infrastructure specialist fund at record P/B value
• Annuity assets have limited upside potential and dilution of bunch of assets to potential yield investor can be evaluated subject to market conditions
• Financial requirements entail: 1. Equity pending to be infused in existing
portfolio is ~Rs 655 crores, of which more than 60% is for Rapid Metro Gurgaon Phase II;
2. Financial support for new projects getting operational (J curve effect)
• Recapitalize balance sheet: Resolution taken for fund raise; likely routes QIP / CB / PIPE
• Refinancing of annuity portfolio to capture interest arbitrage (post construction and softening of interest curve); potential to release sub-debt
• Management of receivables; existing receivables likely to be released gradually as portfolio approaches completion, will help reduce debt
• Portfolio churn likely to free up equity/sub-debt which has the potential to reduce both holdco and consolidated debt
• Longer term goals include:1. Consol D/E 32. Consol EBIDTA margin expansion to 35-40%3. Consol RoE expansion back to 18% - 22% range

22
THANK YOU