Embed Size (px)
Citation preview

ISSN 0019-5723
INDIAN LABOUR JOURNAL (A MONTHLY PUBLICATION)
Volume 56 September 2015 No. 9
GOVERNMENT OF INDIA
MINISTRY OF LABOUR AND EMPLOYMENT
LABOUR BUREAU
SHIMLA/CHANDIGARH
EDITORIAL COMMITTEE
Chairman Dr. M. Mathisekaran
Editor I.S.Negi
Associate Editor R.C.Jarial
Staff Writers
Laxmi Kant
Ravinder Kumar
NOTE TO CONTRIBUTORS
Non-controversial articles on labour matters of topical interest (e.g. labour and
wage policy; industrial relations; industrial management; trade union movement; labour
welfare; workers‘ participation in management; employment/ unemployment; labour
research of empirical value and of general interest etc.) are accepted for publication in
the Journal. The articles generally not exceeding ten thousand words may be sent in a
floppy diskette of 3.5‖ or C.D in Microsoft Word only with a print out in double space
on one side foolscap paper, addressed to the Director General, Labour Bureau,
‗Cleremont‘, Shimla -171 004 alongwith a declaration by the author that the article has
neither been published nor submitted for publication elsewhere. All references and
footnotes, may be given only at the end of the articles.
Authors are solely responsible for the factual accuracy and the opinion
expressed in their signed articles. The Labour Bureau, however, reserves the right to
edit, amend and delete any portion of the article with a view to make it more
presentable and to reject any article, if not found suitable. The articles which are
rejected will not be returned and no correspondence will be entertained on the articles
which are rejected by the Editorial Committee.
A copy of the Journal, in which the article appears, is supplied to the author.
An honorarium up to Rs. 1,000 is also payable as per rules for each article published.
Our address: The Director General, Labour Bureau ‘Cleremont’, Shimla 171 004
Fax No: 0177-2655253 Website: http://labourbureaunew.gov.in E-mail [email protected], [email protected]
PREFACE
―The Indian Labour Journal‖ earlier known as ―Indian Labour Gazette‖ is a monthly publication being brought out since July, 1943. This publication is the only official publication of its kind in the country disseminating latest labour statistics and research in the field of labour which has immense utility for diverse stakeholders such as Employers‘ and Employees‘ Organizations, Research Scholars, Central and State Governments, Autonomous Bodies, Courts, Universities etc.
The September issue of the Journal is special issue in which Labour Bureau attempts to bring out major developments in the field of labour that have taken place during the period July, 2014 to June, 2015 in the form of a special article titled ―68
th Year of Independence – a Kaleidoscopic View of Labour
Activities‖ to mark the India‘s Independence.
Suggestions for further improvement of the publication are welcome.
DR. M. MATHISEKARAN
DIRECTOR GENERAL
LABOUR BUREAU,
SHIMLA-171004

INDIAN LABOUR JOURNAL
Published Monthly by
LABOUR BUREAU SHIMLA/CHANDIGARH
(First Published in July, 1943 as Indian Labour Gazette)
Vol.56 September, 2015 No 9
CONTENTS Page
SPECIAL ARTICLE
Sixty Eight Year of Independence- a Kaleidoscopic View of Labour activities 935
LABOUR ACTIVITIES
Labour Situation 953
Industrial Disputes 956
NEWS IN BRIEF
(a) INDIAN LABOUR
Government Looks to Scale Up Social Schemes 958
Recruitment Outsourcing is the Next Big Thing 958
India can be Human Resource Capital of World, Says PM 958
Changes in Labour Laws after Consultation with Trade Unions: PM 959
Labour Law Recast to Add More Leave to Maternity 959
States Directed to Ensure Social Security Benefits for Outsourced Staff 959
Punjab Skill Development Mission to Upgrade 1 Lakh Youths 960
Industries/Services declared Public Utility Services under the Industrial Disputes Act 1947 960
Consumer Price Index Numbers for Industrial Workers 961
Consumer Price Index Numbers for Agricultural Labourers and Rural Labourers 961
( b) FOREIGN LABOUR
US Unemployment Hits Seven-Year Low after Adding 223,000 Jobs in June 962
Pace of UK Hiring Slows Further in June 962
Australian Business Looking at India as 'New China' 962
For H-1B Visa Holders, Double Income will be A Reality Soon 962
Almost 30000 Workers Supported by the European Globalisation Adjustment Fund during 2013 and 2014
963
U.S. Labour Costs Rise at Slowest Pace in Three Decades 963
LABOUR DECISIONS
If employer shows that the financial arrangement made for the family subsequent to the death of the employee is adequate, compassionate appointment may be refused
964

Indian Labour Journal, September 2015
934
LABOUR LITERATURE
Important Articles of Labour Interest Published in the Periodicals Received in the Labour Bureau
965
STATISTICS
Section A- Monthly Statistics 969
Section B- Serial Statistics 1017
ANY REPRODUCTION FROM THE JOURNAL SHOULD BE SUITABLY ACKNOWLEDGED
Subscription and complaints, if any, regarding the distribution of the Indian
Labour Journal should be sent only to
THE CONTROLLER OF PUBLICATIONS, CIVIL LINES, DELHI 110054
Pre-payable subscription rates for the Indian Labour Journal
Annual Rate of Subscription Rs.1200.00
Sale per copy Rs.100.00

Indian Labour Journal, September 2015
935
SPECIAL ARTICLE
SIXTY EIGHT YEAR OF INDEPENDENCE- A KALEIDOSCOPIC VIEW OF
LABOUR ACTIVITIES *
As per provisional results of Census 2011, 2001-11 is the first decade in independent
India where in the population momentum coupled with declining fertility has dampened the pace
of net additions to population. The net addition (between 2001-2011) is less than that of the
pervious decade by 0.86 million. However, the growth rate of the labour force will continue to
be higher than that of the population until 2021. According to an Indian Labour Report (Time
Lease, 2007), 300 million youth will enter the labour force by 2025, and 25 per cent of the
world‘s workers in the next three years will be Indians. Population projections indicate that in
2020 the average age of India‘s population will be the lowest in the world—around 29 years
compared to 37 years in China and the United States of America, 45 years in West Europe, and
48 years in Japan. Consequently, while the global economy is expected to witness a shortage of
young population of around 56 million by 2020, India will be the only country with a youth
surplus of 47 million (Report on Education, Skill Development and Labour Force (2013-14)
Volume III, Labour Bureau, 2014). The main issue to address then is not just providing
employment but increasing the employability of the labour force in India (Economic Survey
2014-15, Volume-II).
In the present article, we have discussed about important labour related activities
regarding bonded labour, unorganised worker, contract labour, child labour, women labour,
industrial relations, employment and training, social security, labour statistics and intelligence
etc.
1. Highlights of Important Labour Related Activities
1.1 The Apprentice Act 1961 was amended on 18.12.2014 to make it more responsive to
industry and youth. The Apprentice Protsahan Yojana was also launched to support MSMEs in
the manufacturing sector in engaging apprentices. Government is also working affirmatively to
bring a single uniform law for the MSME sector to ensure operational efficiency and improve
productivity while ensuring job creation on a large scale.
1.2 A unified labour portal scheme called ShramSuvidha Portal has been launched for
timely redressal of grievances and for creating a conducive environment for industrial
development. Its main features are: (i) Unique Labour Identification Number (LIN) allotted to
around 0.7 million units facilitating online registration; (ii) filing of selfcertified, simplified
single online return instead of 16 separate returns by industry; (iii) transparent labour inspection
scheme via computerized system as per risk-based criteria and uploading of inspection reports
within 72 hours by labour inspectors.
1.3 Under Employees‘ State Insurance Corporation (ESIC) Project Panchdeep: Digitization
of internal and external processes to ensure efficiency in operations, especially services to
employers and insured persons. The portal enables employers to file monthly contributions,
generate temporary identity cards and create monthly contribution challans online, issue of
pehchan card for insured persons for fast and convenient delivery of services. Through the IP
Portal, insured persons can check contributions paid/payable by employers, family details,
* The article generally covers the developments during the period July, 2014 to June, 2015

Indian Labour Journal, September 2015
936
entitlement to various benefits, and status of claims. Integration of its services will promote ease
of business and curb transaction costs.
1.4 Under Employees Provident Fund (EPF): Digitization of complete database of 42.3
million EPF subscribers and allotment of universal account number (UAN) to each member,
which facilitates portability of member accounts. UAN is being seeded with bank account,
Aadhar Card and other KYC details to promote financial inclusion. Direct access to EPF
accounts will enable members to access and consolidate previous accounts. Online pensioners
can view their account and disbursement details online. The statutory wage ceiling under the
Employees Provident Fund and Miscellaneous Provisions (EPF&MP) Act was enhanced to Rs.
15000 per month from 01.09.2014. A minimum pension of Rs.1000 has been introduced for
pensioners under the Employees‘ Pension Scheme 1995 w.e.f 01.09.2014.
1.5 For Unorganized Workers: The Rashtriya Swasthya Bima Yojana (RSBY) is a scheme
under the Unorganized Workers‘ Social Security Act 2008. It is a smart card-based cashless
health insurance scheme, including maternity benefit, which provides a cover of Rs 30,000 per
family per annum on a family floater basis to below poverty line (BPL) families in the
unorganized sector. It is proposed to extend the RSBY to all unorganized workers in a phased
manner.
1.6 A National Council for Vocational Training-Management Information System (NCVT-
MIS) portal has been developed for streamlining the functioning of Industrial Training Institutes
(ITI), Apprenticeship Scheme, and assessment/certification of all NCVT training courses.
1.7 The National Career Service(NCS) is being implemented as a mission mode project to
transform the National Employment Service and provide various job-related services such as
online registration of job seekers and job vacancies, career counselling, vocational guidance, and
information on skills development courses, internships, and apprenticeship.
1.8 To commemorate the birth anniversary of Pandit Deen Dayal Upadhyaya on
25.09.2014, the Ministry of Labour & Employment inaugurated the Pandit Deen Dayal
Upadhyaya Shramev Jayate Karyakram. A day long Conference of State Labour and
Employment Ministers, State Health Ministers looking after the work of RSBY and State
Ministers for Vocational Training was held on 16.10.2014 in New Delhi under the Chairmanship
of Shri Narendra Singh Tomar, the then Hon‘ble Minister of Steel, Mines, Labour &
Employment. Hon‘ble Prime Minister of India, Shri Narendra Modi inaugurated the Conference.
The Conference had five themes related to increasing productivity, employability in the country,
development of entrepreneurship, enhancing ease of compliance for the industry and ensuring
labour Welfare.
1.9 The Ministry of Labour & Employment continues to have consultation with the social
partners to obtain a consensus for enacting new laws or bringing about changes in the existing
laws. The objective of the Ministry is to knit the views of all the social partners in framing the
policy for working class. Accordingly, the Ministry held several tripartite meetings of various
Committees / Boards during the year which, inter-alia, include:
i. The meetings of Central Board of Trustees (EPF) held on 21.08.2014 and 19.12.2014;
ii. The meetings of Executive Committee of Employees Provident Fund held on
27.06.2014 and 18.12.2014;
iii. The meetings of the Committee on Employees State Insurance Corporation held on
31.07.2014 and 04.12.2014;
Indian Labour Journal, September 2015
937
iv. The meetings of Standing Committee, Employees State Insurance Corporation held on
06.06.2014;
v. The Meeting of Medical Benefit Council held on 11.08.2014;
vi. The meeting of Governing Body of Central Board for Workers Education held on
26.05.2014 and 10.11.2014;
vii. Meeting of the Executive Council was held on 16.06.2014;
viii. The Meeting of Executive Council of V.V.Giri National Labour Institute was held on
16.06.2014;
ix. A tripartite consultation meeting was held under the Chairmanship of Shri Narender
Singh Tomar, the then Hon‘ble Minister for Labour & Employment on 20.10.2014 to
discuss the participation of Workers Management Bill, 1990;
x. A Tripartite Meeting held on 13.01.2015 to discuss the various issues pertaining to
Ministry of Labour & Employment;
xi. Tripartite Meeting held on 03.02.2015 to discuss the Small Factories (Regulation of
Employment and Conditions of Service) Bill, 2014;
xii. Tripartite consultation on comprehensive amendments to the Employees‘ Provident
Fund and Miscellaneous Provisions Act, 1952 were held on 03.02.2015;
xiii. Tripartite Committee on Factories Act, 1948 was held on 19.02.2015.
1.10 Maintenance of harmonious industrial relations remains an avowed objective of
Ministry of Labour & Employment. Due to constant endeavour of the Industrial Relations
Machineries of both the Centre and the States, the overall industrial relations climate has
generally remained peaceful and cordial. While the number of incidences of strikes and lockouts
reported during 2009 were 345, these figures stood at 149 (Provisional) during 2014 and have
exhibited a declining trend over the period. Similarly, the figures for mandays lost were 17.62
million in 2009 and 3.68 million (Provisional) during 2014. As regards the spatial / industry wise
dispersion of the incidences of strikes and lockouts, there exist wide spread variation among
different States/UTs. Wage & Allowance, Charter of Demands, Bonus, Personnel,
Retrenchment, Indiscipline & Violence and Others are major reasons for these strikes and
lockouts.
1.11 103rd
Session of the International Labour Conference (ILC) was held from 28th May to
12 June, 2014 in Geneva. A high level Indian Tripartite Delegation attended the ILC. Besides
officials from Ministry of Labour & Employment, the delegation included 9 representatives each
from Workers (Central Trade Union Organizations) and Central Organisation of employers‘ side
in the ILC. The Conference was followed by 321st Session of the Governing Body meeting of
ILO on June 21. Various Ministers, Vice-Ministers and Deputy Ministers were accredited for
participation in this ILC. Heads of States and Governments with participants representing
governments, employers and workers from the ILO Member States attended the conference.
2. Wage Fixation under the Minimum Wages Act, 1948
Under the Minimum Wages Act, 1948 both Central and State Governments are
―Appropriate Governments‖ for fixation/revision of minimum rates of wages for employments
covered by the Schedule to the Act. There are 45 scheduled employments in the Central sphere
while in the State sphere the number of such employments is as many as 1697. The minimum
rates of wages also include Special Allowance i.e. Variable Dearness Allowance (VDA) linked
to Consumer Price Index Number, which is revised twice a year effective from April and
Indian Labour Journal, September 2015
938
October. The Central Government and twenty-six States/UTs have adopted VDA as a
component of minimum wage.
3. Bonded Labour
The practice of bonded labour system has been abolished throughout the country with
the enactment of Bonded Labour System (Abolition) Act, 1976 and made a cognizable offence
punishable by law. Though the responsibility of implementing the Act lies with the State
Government, the Ministry of Labour and Employment, Government of India supplements the
efforts of the State Governments by providing a Central assistance on matching grants (50:50)
basis for the rehabilitation of bonded labour under a Centrally Sponsored Plan Scheme for
rehabilitation of bonded labour. The scheme was launched by Ministry of Labour &
Employment in May, 1978. The said Plan Scheme has been drastically modified in May 2000 to
provide for 100% assistance for conducting district wise surveys for identification of bonded
labour, awareness generation activities, and evaluatory studies. The Rehabilitation grant has also
been raised from Rs.10,000/- per identified bonded labour to Rs.20,000/-per identified bonded
labour. Further, in the case of North-Eastern States, 100% rehabilitation grant is provided in case
they fail to provide their matching contribution. A sum of Rs. 8097.32 Lakh has been released
under the scheme to the State Governments upto 31.03.2014 for rehabilitations of 2,79,360
bonded labourers. Besides, the State Governments have also been advised to integrate/dovetail
the Centrally Sponsored Scheme for rehabilitation of bonded labour with other ongoing poverty
alleviation schemes, such as, Swaran Jayanti Gram Swarojgar Yojana (SJGSRY), Special
Component Plan for Scheduled Castes, Tribal Sub-Plan etc. A Special Group has been
constituted under the Chairmanship of the Secretary (Labour and Employment) to review the
implementation of the Bonded Labour System (Abolition) Act, 1976.
4. Unorganised Worker
4.1 The term ‗unorganised worker‘ has been defined under the Unorganised Workers‘
Social Security Act, 2008, as a home based worker, self-employed worker or a wage worker in
the unorganised sector and includes a worker in the organised sector who is not covered by any
of the Acts mentioned in Schedule-II of Act i.e. The Employee‘s Compensation Act, 1923, The
Industrial Disputes Act, 1947, The Employees‘ State Insurance Act, 1948, The Employees
Provident Funds and Miscellaneous Provisions Act, 1952, The Maternity Benefit Act, 1961 and
The Payment of Gratuity Act, 1972. As per the survey carried out by the National Sample
Survey Organisation in the year 2009-10, the total employment in both organized and
unorganized sector in the country was of the order of 46.5 crore. Out of this, about 43.7 crore
were in the unorganized sector. Of 43.7 crore workers in unorganized sector, 24.6 crore workers
were employed in agriculture sector, 4.4 crore in construction, and remaining were in
manufacturing activities, trade and transport, communication & services. A large number of
unorganized workers are home based and are engaged in occupations such as beedi rolling,
agarbatti making, papad making, tailoring, and embroidery work.
4.2 The unorganized workers suffer from cycles of excessive seasonality of employment,
lack of a formal employer-employee relationship and inadequate social security protection. In
order to protect them, various welfare schemes have been put in place by the Government of
India. Some of the important Acts/Schemes are, Social Security Act, 2008; Rashtriya Swasthya
Bima Yojana; Aam Aadmi Bima Yojana; Indira Gandhi National Old Age Pension Scheme;
Mahatma Gandhi National Employment Guarantee Act, 2005 etc. The Govt. has also constituted
funds for some specific categories of workers in the unorganised sector like beedi workers, cine
workers and certain non-coal mine workers. The funds are used to provide various kinds of

Indian Labour Journal, September 2015
939
welfare activities to the workers in the field of health care, housing, education assistance for
children, water supply etc.
5. Contract Labour
Contract labour generally refers to workers engaged by a contractor for the user
enterprises. These workers are millions in number and are engaged mainly in agricultural
operations, plantation, construction industry, ports & docks, oil fields, factories, railways,
shipping, airlines, road transport, etc. The Contract Labour (Regulation and Abolition) Act, 1970
was enacted to protect and safeguard the interests of these workers. The Act applies to every
establishment/ contractor in which 20 or more workmen are employed. It also applies to
establishments of the Government and local authorities. The Central Government and State
Governments, in their capacity as ―appropriate‖ Governments, are required to set up Central and
State Advisory Contract Labour Boards to advise respective Governments on matters arising out
of the administration of the Act as are referred to them. The Central Advisory Contract Labour
Board (CACLB) is a statutory body, tripartite in constitution and quasi-judicial in nature. The
non-official members hold office for a term of three years. Till date, 85 meetings of the Central
Advisory Contract Labour Board have been held. Every establishment and contractor, to whom
the Act applies, has to register itself/obtain a license for execution of contract work. The
interests of contract workers are protected in terms of wages, hours of work, welfare, health and
social security. The amenities to be provided to contract labour include canteen, rest rooms, first
aid facilities and other basic necessities at the work place such as drinking water etc. The
liability to ensure payment of wages and other benefits is primarily that of the contractor, and, in
case of default, that of the principal employer.
6. Child Labour
6.1 Government of India stands committed to the elimination of child labour in the country.
Our Constitution provides for protection of children from involvement in economic activities
and avocations unsuited to their age. Directive Principles of State Policy in the Constitution
strongly reiterates this commitment and this is also provided for in the Fundamental Rights.
Realizing the multifaceted nature of this problem, Government had embarked on a holistic and
multi-pronged approach to eliminate child labour from the country in a phased manner,
beginning with children working in hazardous occupations and processes and progressively
covering those working in other occupations also. On the one hand, it provides for legal action
for enforcement purposes and on the other, it also focuses on general development programmes
for the economic empowerment of the families of children as well as project based action in
areas of high concentration of child labour.
6.2 As per the Child Labour (Prohibition & Regulation) Act, employment of children
below the age of 14 years is prohibited in notified hazardous occupations and processes. The Act
also regulates employment of children in non-hazardous occupations and processes. There are at
present 18 hazardous occupations and 65 processes, where employment of children is prohibited.
The Act provides for constitution of the Child Labour Technical Advisory Committee (which is
a body of experts) to advise the Central Government on inclusion of additional occupations and
processes to the Schedule of the Act. Under the Child Labour (Prohibition & Regulation) Act,
1986, during the last 5 years more than 11 lakh inspections were carried out, resulting in
approximately 0.24 lakh prosecutions out of which about 6238 convictions were obtained. As
per NSSO survey 2009-10, the working children were estimated at 49.84 lakh as against 90.75
lakh in 2004-05. However, as per 2011 census, the total number of working children between the
age group 5-14 years in the country was 43.53 lakh as against 1.26 crore in 2001.
Indian Labour Journal, September 2015
940
6.3 Constitutional and legislative provisions providing protection to children against
employment has been elaborated in the National Child Labour Policy announced in 1987. The
policy addresses the complex issue of Child Labour in a comprehensive, holistic and integrated
manner. For rehabilitation of child labour, Government had initiated the National Child Labour
Project (NCLP) Scheme in 1988 to rehabilitate working children in 12 child labour endemic
districts of the country. As on date the scheme is sanctioned in 270 districts. Under the NCLP
Scheme, children are withdrawn from work and put into special training centres, where they are
provided with bridging education, vocational training, mid-day meal, stipend, healthcare
facilities etc. and finally mainstreamed to the formal education system. At present, there are
around 5167 NCLP training centres being run in the country with an enrolment of approximately
2.35 lakh children. As on 31.12.2014, more than 10.25 lakh working children have already been
mainstreamed to regular education system under the NCLP Scheme.
7 Women Labour
7.1 Women form an integral part of the Indian workforce. As per Census 2011, the total
number of female workers in India is 149.8 million comprising of 121.8 and 28.0 million in rural
and urban areas respectively. Out of total 149.8 million female workers, 35.9 million females are
working as cultivators and another 61.5 million are agricultural labourers. Of the remaining, 8.5
million are in household Industry and 43.7 million are classified as other workers. Also, the
work participation rate for women is 25.51 per cent in 2011 as compared to 25.63 per cent in
2001. The work participation rate of women was however 22.27 per cent in 1991. The work
participation rate for women in rural areas is 30.02 per cent as compared to 15.44 per cent in the
urban areas.
7.2 The Equal Remuneration Act, 1976 provides for payment of equal remuneration to men
and women workers for same work or work of similar nature without any discrimination and
also prevent discrimination against women employees while making recruitment for the same
work or work of similar nature, or in any condition of service subsequent to recruitment such as
promotions, training or transfer. The provisions of the Act have been extended to all categories
of employment. The Act is implemented at two levels viz. Central level and State level.
7.3 Employment Exchanges take special care to cater to the job needs of women registered
with them. For the period from January, 2013 to December, 2013, 58,761 women were placed
in various employments. Statutory provisions have also been made in certain Labour laws for
organizing child care centers for the benefit of women workers. These include Factories Act,
1948, the Beedi & Cigar Workers (Conditions of Employment) Act, 1966, the Mines Act, 1952,
the Plantation Act, 1951 and the Building and other Construction Workers (Regulation of
Employment and Conditions of Service) Act, 1996.
8. Inter-State Migrant Labour and Emigration
8.1 According to the 2001 Census, 314.54 million persons had changed their place of
residence within the country and out of this, 29.90 million or 9 per cent left their place for work.
In order to protect the rights and safeguard the interests of migrant workers, the Inter-State
Migrant Workmen (Regulation of Employment and Conditions of Service) Act, 1979 was
enacted.
8.2 The Act, which regulates the employment of inter-state migrant workmen and provides
for their conditions of service, is implemented both by the Central and State governments in their
respective jurisdictions. It applies to every establishment, and the contractor, who employ five or
more inter-state migrant workmen. The Act has provision for issue of Passbook to every inter-

Indian Labour Journal, September 2015
941
state migrant workmen with full details, payment of displacement allowance equivalent to 50 per
cent of monthly wages or Rs.75/- whichever is higher, payment of journey allowance including
payment of wage during the period of journey, suitable residential accommodations, medical
facilities and protective clothing, payment of wages, equal pay for equal work etc.
8.3 The problem of migration is sought to be checked through a multi dimensional course
of action through rural development, provision of improved infrastructural facilities, equitable
dispersal of resources to remove regional disparities, employment generation, land reforms,
increased literacy, financial assistance etc. In order to generate better employment opportunities
at State level, the Government have launched a number of schemes like Swarnjayanti Gram
Swarozgar Yojna (SGSY), Pradhan Mantri Gram Sadak Yojana (PMGSY), Sampoorna Gramin
Rozgar Yojana (SGRY), National Food for Work Programme (NFFWP), Indra Awass Yojna
(IAY), Integrated Wastelands Development Programme (IWDP), Drought Prone Areas
Programme (DPAP), Desert Development Programme (DDP) etc. Further, the Government have
also enacted the National Rural Employment Guarantee Act to provide 100 days guaranteed
employment to rural households.
9. Central Industrial Relations Machinery (CIRM)
9.1 Chief Labour Commissioner (Central)‘s [CLC(C)] Organisation, also known as Central
Industrial Relations Machinery (CIRM), which is an attached office of the Ministry of Labour
and Employment has been entrusted with the task of maintaining harmonious Industrial
Relations, enforcement of Labour Laws and verification of Trade Union Membership in central
sphere. The offices of CIRM are spread over different parts of the country with zonal, regional
and area level formations.
9.2 During the year 2013-2014 the CIRM intervened in 586 threatened strikes and its
conciliatory efforts succeeded in averting 578 strikes, which represent a success rate of 98.6%.
The Industrial Disputes handled by the Machinery during the year 2014-15 for the period of
April-September the CIRM intervened in 86 threatened strikes and its conciliatory efforts
successes in averting 78 strike, which represent a success rate in 90.7%. An important function
of CIRM is the enforcement of Labour Laws in the establishments for which the Central
Government is the Appropriate Government. There are approximately 1.5 lakh establishments in
the Central Sphere. The Inspecting Officers of CIRM inspect these establishments under
different Labour enactments through routine Inspections and Special Drives for Inspections
under the crash inspection programmes and taskforce inspections to secure benefits of the
beneficial legislations to workers. Special emphasis is given to enforcement of beneficial
enactments such as Contract Labour (Regulation & Abolition) Act, 1970, Minimum Wages Act,
1948 and Building and Other Construction Workers (Regulation of Employment & Conditions
of Service) Act, 1996 in the unorganised Sector. Prosecutions are launched against persistent
defaulters and in respect of major violations.
10. Industrial Relations
The Ministry monitors the extent of industrial harmony based on the information that it
collects on the number and spatial dispersion of strikes, lockouts, number of workers involved
and mandays lost, number of units reporting retrenchment and the extent of layoffs. During
2014 (Provisional), there were 149 industrial disputes ( Strikes and Lockouts) in both State and
Central Spheres resulting in work-stoppages, which involved 1,015,982 workers with a time-loss
of 3,679,817 or 3.68 million man-days as against 328 disputes involving 1,043,033 workers with
a time-loss of 17,760,361 or 17.76 million man-days during 2013 ( Provisional ). In 2014, the
Public Sector accounted for 1.66 million man-days or 45 per cent of the total time-loss. The

Indian Labour Journal, September 2015
942
Central Sphere registered a time-loss of 1.15 million man-days or 31.28 per cent of the total
time-loss whereas the State Sphere registered a time-loss of 2.53 million man-days or 68.72 per
cent of the total time-loss in 2014(Provisional). The State and Central Spheres taken together,
Andhra Pradesh alone was responsible for a time-loss of 1.04 million man-days or 28.38 per cent
followed by Tamil Nadu, Kerala, West Bengal and Rajasthan with 0.68, 0.38, 0.30 and 0.27
million man-days or 18.61, 10.39, 8.20 and 7.38 per cent respectively of the total time-loss.
Amongst the various industry divisions, ‗Manufacturing Division (Ind. Codes 10 to 33)‘
registered a time-loss of 2.01 million man-days or 54.58 per cent followed by ‗Financial &
Insurance Activities (Industry Code 64 to 66)‘ with a time-loss 1.10 million or 29.93 percent of
the total time-loss. ‗Wages & Allowances‘ was the main cause amongst the cause group
registered a time-loss of 2.08 million man-days or 56.58 per cent followed by ‗Charter of
Demands‘ ‗Indiscipline‘ and ‗Bonus‘ with 0.50, 0.36 and 0.30 million man-days or 13.45, 9.68
and 8.18 per cent respectively.
11. Employment and Training
11.1 With each successive Five Year Plan, there has been expansion of the activities of the
Employment Service and Training Service in the Centre and the States. The total number of
Employment Exchanges functioning at the end of October, 2014 is 978 (including 75 University
Employment Information and Guidance Bureaux); and the total number of Industrial Training
Institutes (both Government and Private) is 10,341 with a seating capacity of around 14.53 lakh.
Directorate General of Employment & Training (DGE&T) continues to improve quality of
productivity throughout the economy by systematic supply of trained manpower to the Industry
through various vocational training programmes.
11.2 DGE&T coordinate and oversee the employment generation taking place in the country
through the National Employment Service in India. The network of Employment Service has
expanded from 18 Employment Exchanges in 1951 to 978 Employment Exchanges as on
31.10.2014. A key role played by the Employment Exchanges is to motivate and guide the
unemployed youth for taking up self-employment ventures in view of shrinkage in wage paid
jobs. In 22 selected Employment Exchanges, Special Cells for Promotion of Self-Employment
have been working. In order to maintain regular & reliable Employment Market Information,
Employment Service in the States has been implementing the Employment Market Information
(EMI) programme. The programme covers all establishments in the Public Sector and
nonagricultural establishments in the Private Sector employing 10 or more workers.
12. Social Security
12.1 The social security legislations in India derive their strength and spirit from the
Directive Principles of State Policy as contained in the Constitution of India. These provide for
mandatory social security benefits either solely at the cost of the employers or on the basis of
joint contribution of the employers and the employees. With a view to promote welfare and
provide social security to the labour force, Govt. has enacted a number of legislations in the area
of social security for the workers. The important among them are as under.
12.2 Employees’ Compensation Act, 1923 – The main objective of the Act is to impose an
obligation upon the employers to pay compensation to workers for accidents arising out of and
in the course of employment. The Act applies to the persons employed in factories, mines,
plantations, mechanically propelled vehicles, construction works and certain other hazardous
occupations. The Act provides for payment of compensation to the employees and their
dependents in case of injury and accident (including certain occupational diseases) arising out of
and in the course of employment and resulting in disablement or death. The rate of compensation

Indian Labour Journal, September 2015
943
in case of death is an amount equal to fifty per cent of the monthly wages of the deceased
workman multiplied by the relevant factor or an amount of Rs.120000, whichever is more.
Where permanent total disablement results from the injury, the compensation will be an amount
equal to sixty per cent of the monthly wages of the injured workman multiplied by the relevant
factor or an amount of Rs.140000, whichever is more.
12.3 Employees’ State Insurance Act, 1948 - The Employees‘ State Insurance Act, 1948
applies to factories employing 10 or more persons. The provisions of the Act are being brought
into force area-wise in stages. The Act contains an enabling provision under which the
―appropriate government‖ is empowered to extend the provisions of the Act to other classes of
establishments; industrial, commercial, agricultural or otherwise. Under these provisions, the
State Governments have extended the provisions of the Act to shops, hotels, restaurants, cinemas
including preview theatres, road motor transport undertakings, newspaper establishments,
educational and medical institutions employing 10 or more employees. 24 State Governments /
Union Territories have reduced the threshold for coverage of shops and establishments to 10 or
more persons. Employees of factories and establishments covered under the Act drawing
monthly wages upto Rs.15,000/- per month and Rs.25,000/- per month for persons with
disabilities are covered under the Scheme. The ESI Scheme is now operated in 815 centres
situated in 31 States/ Union Territories. As on 31.03.2014, 1.95 crore insured persons and about
7.58 crore beneficiaries are covered under the Scheme. The number of factories and
establishments covered by the end of the year had gone up to about 6.70 lakh. The ESI Scheme
is mainly financed by contributions from the employers and employees. The rates of the
employers‘ and the employees‘ share of contribution are 4.75% and 1.75%, respectively. The
State Governments‘ share of the expenditure on the provision of medical care is to the extent of
12.5%. All contributions received under the ESI Act and all other money belonging to the fund
which are not immediately required for defraying day to day expenses are invested in the manner
prescribed under ESI (Central) Rules. As on 31.10.2014, the total investment of fund was
Rs.39684.09 crore. Besides from medical care, the beneficiaries under ESI Scheme are also
provided an array of cash benefits. It is payable in times of physical distress due to sickness
temporary or permanent disablement resulting in loss of earning capacity, confinement in respect
of insured women etc. Dependants of insured persons who die of employment injury caused by
accident or occupational disease are entitled to monthly payments called the dependant benefits.
12.4 Employees’ Provident Funds and Miscellaneous Provisions Act, 1952 - The
Employees‘ Provident Funds and Miscellaneous Provisions Act, 1952 is a welfare legislation
enacted for the purpose of instituting provident funds, pension fund and deposit linked insurance
fund for employees working in factories and other establishments. The Act aims at providing
social security and timely monetary assistance to industrial employees and their families when
they are in distress and/or unable to meet family and social obligations and to protect them in old
age, disablement, early death of the bread winner and in some other contingencies. Presently, the
Act is applicable to 187 specified industries/classes of establishments as is specified in Schedule
I of the Act or any activity notified by the Central Government in the Official Gazette and
employing twenty or more persons. At present three schemes viz., the Employees Provident
Fund Scheme, 1952; the Employees Pension Scheme, 1995, and the Employees Deposit Linked
Insurance Scheme 1976 are in operation under the Act. The Central Board of Trustees consisting
of a Chairman and representatives of the Central Government, State Governments and the
Employers‘& Employees‘ Organisations administers the EPFO.
12.5 Employees’ Provident Funds Scheme, 1952 – The Employees‘ Provident Funds &
Miscellaneous Provisions Act, 1952 initially provided for framing of the Scheme– Employees‘

Indian Labour Journal, September 2015
944
Provident Funds Scheme, 1952 that came into force with effect from 1.11.1952. It aims at
making provision for the future of the covered employees after they retire and also for their
dependants in case of unfortunate death. With effect from 01.09.2014, an employee, on joining
the employment in a covered establishment and getting wages upto Rs.15,000/- is required to
become a member of the fund. The rate of Provident Fund contribution is 12 per cent (in case of
General Establishments) and 10 per cent (in case of notified Establishments) of the monthly
wages of the subscribers.
12.6 Employees’ Deposit Linked Insurance Scheme, 1976- The scheme became
operational w.e.f. 01.08.1976 and covers all employees who are members of the Provident Fund
Scheme. Under the scheme, member-employees are not required to contribute while the
employers are required to contribute to the Insurance Fund at the rate of 0.5 per cent of the
wages of the members.
12.7 Employees Pension Scheme, 1995: The Employees‘ Pension Scheme (EPS) came into
effect from 16.11.1995 replacing the Employees‘ Family Pension Scheme, 1971. The scheme
derives its financial resource by partial diversion of 8.33 per cent from the employer‘ share of
Provident Fund Contribution. The Central Government contributes @ 1.16 per cent in the
Employees Pension Fund. Minimum 10 years eligible service is required for entitlement to
pension. Superannuation pension is payable on attaining the age of 58 years. Pension on a
discounted rate is also payable on attaining the age of 50 years provided the member is not in
service. Where eligible service is less than 10 years, the member has an option to obtain scheme
certificate or claim withdrawal benefits.
12.8 Maternity Benefit Act, 1961- The Maternity Benefit Act, 1961 regulates the
employment of women in factories, mines, the circus industry, plantation units and shops or
establishments employing 10 or more persons except the employees covered under the
Employees State Insurance (ESI) Act, 1948 for certain periods before and after birth and
provides for maternity and other benefits. It extends to the whole of India, except the State of
Sikkim. It also provides for maternity leave and payment of certain monetary benefits to women
workers subject to fulfilment of certain conditions during the period when they are out of
employment on account of pregnancy. The services of a woman worker cannot be terminated
during the period of her absence on account of pregnancy except for gross misconduct.
Maximum period for which a woman can get maternity benefit is twelve weeks. The Act has
been amended in 2008. A medical bonus of Rs.3,500/- is being provided from 19.12.2011 under
the Act.
12.9 Payment of Gratuity Act, 1972- The Act provides for a scheme of compulsory
payment of gratuity to employees engaged in factories, mines, oil fields, plantations, ports,
railway companies, motor transport undertakings, shops or other establishments on the
termination of his employment after he has rendered continue service for not less than 5 years on
his superannuation, or on his retirement or resignation, or on his death or disablement due to
accident or disease. Provided that the completion of continuous service of 5 years shall not be
necessary where the termination of the employment of any employees is due to death or
disablement. Payment of Gratuity is an employer‘s liability under the extant provisions of the
Act. For every completed year of service or part thereof in excess of six months, the employer
pays gratuity to an employee at the rate of fifteen days‘ wages based on the rate of wages last
drawn. As per section 4(3) of the Act, the amount of the gratuity payable to an employee shall
not exceed Rs.1000000.

Indian Labour Journal, September 2015
945
13. Workers’ Education Programme
13.1 Central Board for Workers Education (CBWE), Ministry of Labour & Employment,
was established in 1958 to implement Workers Education Scheme at National, Regional, Unit
and Village Levels. Its headquarters is at Nagpur. The Board operates through 50 Regional
Directorates and 9 Sub-Regional Directorates. The six Zonal Directorates situated at Delhi,
Guwahati, Kolkata, Mumbai, Chennai and Bhopal monitor the activities of the Regional
Directorates in their respective zone. The Indian Institute of Workers Education (IIWE),
Mumbai, an apex level training Institute of the Board, was established in 1970. Training
programmes of the Board for workers in organised sector are conducted at three levels-
(i) At the first level, training is imparted to the candidates selected as Education Officers.
After successful completion of the training, these Education Officers conduct
various programmes from the Regional Directorates.
(ii) At the second level, workers from different establishments, sponsored by trade unions
are trained at Regional level.
(iii) At the third level, the Trainers conduct classes for the rank and file of workers in their
respective establishments.
13.2 Programmes for representatives from Central Trade Union Organizations / Federations
and Voluntary Organizations on different subjects are conducted by the IIWE in addition to
giving pre-employment training to Education Officers and reorientation to Regional Director and
Education Officers of the Board as well. In view of the specialized training needs to tackle some
of the specific issues by Trade Unions, three cells namely (i) Industrial Health, Safety and
Environment (ii) Education for Rural and Unorganised Sector Workers and (iii) Women and
Child Labour have been established in the Institute.
13.3 Initially the Board concentrated its activities in the organized sector. The Board shifted
its emphasis to rural sector in 1977-1978 on the recommendations of Workers Education Review
Committee. Initially started with seven pilot projects, the rural workers education programmes
have now become a regular and continuing programme. Rural Volunteers are given one week
orientation/Refresher Courses at Regional Directorates to assist Education Officers in
conducting Rural Awareness Camps. These camps are attended by landless labour, tribal labour,
artisans, forest workers and educated unemployed in rural areas etc. Tailor made programmes of
one to four days durations, based on the functional and educational needs of workers, for
Handloom, Powerloom, Khadi & Village Industries, Industrial Estates, Small Scale Units,
Handicrafts, Sericulture, Coir Industry, Beedi Industry and Workers of Weaker Sections such as
women workers, handicapped workers, rickshaw drivers, construction workers, civic and
sanitation workers are also organized by the Board. During the period July, 2014 to June, 2015,
the Board has conducted 9185 programmes of various durations and trained 331022 workers of
organized, unorganized and rural sectors.
14. Occupational Safety & Health; Directorate General Factory Advice Service and
Labour Institutes (DGFASLI)
14.1 The Directorate General Factory Advice Service and Labour Institutes (DGFASLI)
functions as a service organization to advise Government, Industries, Trade Unions and others
in regard to matters relating to safety, health and welfare of workers employed in factories, ports
and docks. It serves as a technical arm of the Ministry of Labour and Employment, Government
of India in framing of new legislation, proposing amendments to the existing comprehensive
legislation on the safety, health and welfare, viz., the Factories Act 1948, framing Model Rules

Indian Labour Journal, September 2015
946
thereunder for the guidance of State Governments, providing technical comments on the drafts
of ILO conventions and recommendations at the consideration/adoption stage, advising the
Ministry regarding ratification of ILO conventions and compiling and preparing annual reports
on the details of effect given to the ratified ILO conventions. It also maintains liaison with the
State Governments for the effective enforcement of the Factories Act, 1948. Besides the
advisory function, the DGFASLI administers the Dock Workers (Safety, Health and Welfare)
Act, 1986 and the Regulations framed thereunder. These Regulations cover safety of all workers
engaged in dock work including loading and unloading of cargo etc., within the port premises
and chipping and painting of ships. These Regulations have been made in line with the ILO
convention No.152 concerning Occupational Safety and Health in Dock Work to achieve better
standards of safety, health and welfare of dock workers.
14.2 DGFASLI through its five Labour Institutes at Mumbai, Kolkata, Kanpur, Chennai and
Faridabad provided services to industries on various problems concerning occupational safety,
health, and well being of the workers in the form of training, advice, consultancy, etc. During
the period 54 Consultancy Studies/Survey were completed and reports submitted to units
concerned. As required under statutes, 5 Diploma Courses of one year duration for 214 students
were held for meeting the requirement of safety officers in industries, 2 programmes on
Associate Fellow in Industrial Health of three months duration were held for 46 medical doctors
for providing better medical services to the organizations, 2 one Month Certificate course for
Supervisors working in Hazardous Processes were held for 21 supervisors for providing
competent supervision at workplaces. Besides these, the organization also conducted 42
Workshops and Seminars for 2589 delegates, 48 longer duration programmes (3 or more days)
for 798 participants from 356 organisations, 35 Short duration programmes (1-2 days) for 839
participants from 226 organisations and 197 Appreciation programmes for 4542 beneficiaries of
managerial personnel, trade unions and workers etc.
14.3 The Major Hazards & Chemical Safety Division at the Central Labour Institute,
Mumbai advises State Governments and MAH units on control of Major Accident Hazards,
preparation of emergency plans, Safety Audit, Risk Assessment etc. The services provided by
the division are utilized by major accident hazards units, numbering 1756 involved in handling
or processing 225 chemicals.
15 Labour Statistics; Labour Bureau
15.1 The Bureau is entrusted with the work of compiling and publishing Consumer Price
Index Numbers for Industrial, Rural and Agricultural Workers and a data base on employment,
wages, earnings, strikes and lockouts, labour turnover, working and living conditions, etc. Apart
from carrying out research studies and surveys on Quick Employment, Employment & Un-
employment and also on labour problems on a countrywide basis, the Bureau brings out Annual
Reports on the working of a number of labour enactments. In addition it conducts regular
training courses on Labour Statistics, brings out reports, pamphlets and brochures on studies and
surveys conducted by it on various labour subjects. The regular publications of the Bureau
include (i) Indian Labour Journal (Monthly), (ii) Indian Labour Year Book, (iii) Indian Labour
Statistics, (iv) Pocket Book of Labour Statistics, (v) Industrial Disputes in India, (vi) Statistics
on Closures, Retrenchments and lay-off in India, (vii) Annual Report on CPI (IW), (viii) Annual
Report on CPI-AL/RL, (ix) Wage Rates in Rural India, (x) A.S.I. reports on Absenteeism,
Labour Turnover; Employment and Labour cost, (xi) Statistics of Factories, (xii) Report on the
working of the Minimum Wages Act, 1948 - all annual, and (xiii) Trade Unions in India
(Biennial). Some of the important activities undertaken by the Bureau are discussed in the
ensuing paragraphs.
Indian Labour Journal, September 2015
947
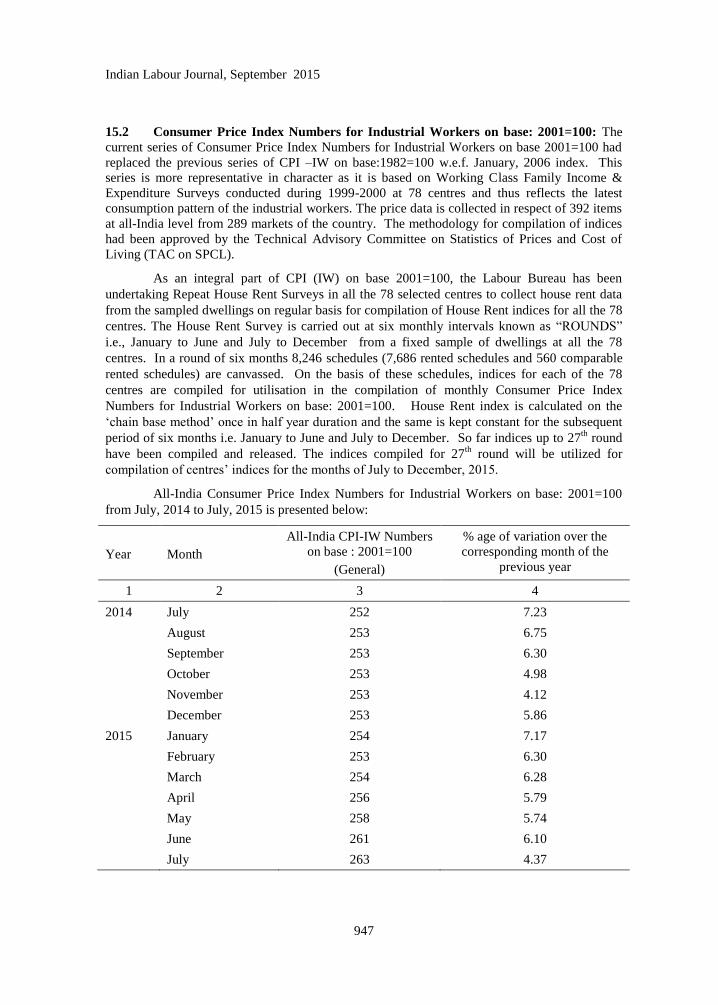
15.2 Consumer Price Index Numbers for Industrial Workers on base: 2001=100: The
current series of Consumer Price Index Numbers for Industrial Workers on base 2001=100 had
replaced the previous series of CPI –IW on base:1982=100 w.e.f. January, 2006 index. This
series is more representative in character as it is based on Working Class Family Income &
Expenditure Surveys conducted during 1999-2000 at 78 centres and thus reflects the latest
consumption pattern of the industrial workers. The price data is collected in respect of 392 items
at all-India level from 289 markets of the country. The methodology for compilation of indices
had been approved by the Technical Advisory Committee on Statistics of Prices and Cost of
Living (TAC on SPCL).
As an integral part of CPI (IW) on base 2001=100, the Labour Bureau has been
undertaking Repeat House Rent Surveys in all the 78 selected centres to collect house rent data
from the sampled dwellings on regular basis for compilation of House Rent indices for all the 78
centres. The House Rent Survey is carried out at six monthly intervals known as ―ROUNDS‖
i.e., January to June and July to December from a fixed sample of dwellings at all the 78
centres. In a round of six months 8,246 schedules (7,686 rented schedules and 560 comparable
rented schedules) are canvassed. On the basis of these schedules, indices for each of the 78
centres are compiled for utilisation in the compilation of monthly Consumer Price Index
Numbers for Industrial Workers on base: 2001=100. House Rent index is calculated on the
‗chain base method‘ once in half year duration and the same is kept constant for the subsequent
period of six months i.e. January to June and July to December. So far indices up to 27th
round
have been compiled and released. The indices compiled for 27th round will be utilized for
compilation of centres‘ indices for the months of July to December, 2015.
All-India Consumer Price Index Numbers for Industrial Workers on base: 2001=100
from July, 2014 to July, 2015 is presented below:
Year
Month
All-India CPI-IW Numbers
on base : 2001=100
(General)
% age of variation over the
corresponding month of the
previous year
1 2 3 4
2014 July 252 7.23
August 253 6.75
September 253 6.30
October 253 4.98
November 253 4.12
December 253 5.86
2015 January 254 7.17
February 253 6.30
March 254 6.28
April 256 5.79
May 258 5.74
June 261 6.10
July 263 4.37
Indian Labour Journal, September 2015
948
The movement of All-India index from July, 2014 to July, 2015 showed fluctuating
trend. The index increased by 1 point from 252 points in July, 2014 to 253 points in August,
2014 and remained stationary up to December, 2014. It again increased by 1 point in January,
2015 but decreased by 1 point in February, 2015 to attain its previous level of 253 points.
Thereafter, it continuously increased and reached at the peak level of 263 points in July, 2015.
The point to point rate of inflation during July, 2014 to July, 2015 also showed a
fluctuating trend. The rate of inflation which was 7.23 percent in the month of July, 2014 started
declining in subsequent months to touch the lowest level of 4.12 percent in November, 2014. It,
however, increased to 5.86 percent and 7.17 percent respectively in successive two months.
Thereafter, it again started declining to reach at 5.74 percent in May, 2015. In the month of June
2015, it again increased to 6.10% which, however, declined to 4.37 percent in the month of July,
2015.
15.3 Consumer Price Index Numbers for Agricultural and Rural Labourers - The
Consumer Price Index Numbers, which measure the temporal change in prices of fixed basket of
goods & services consumed by the target group, is compiled by the Labour Bureau. The current
series of Consumer Price Index Numbers for Agricultural and Rural Labourers on base 1986-
87=100 which came into being w.e.f. November, 1995 replacing the old series of CPI Numbers
for Agricultural Labourers on base 1960-61=100 is compiled for 20 States and also for all India.
For construction of current series of Index Numbers the rural retail prices are collected by the
Field Operation Division of NSSO from 600 representative sample villages spread over 20
States. The weights utilized in compilation of index numbers were derived from the consumer
expenditure data collected by the NSSO during 38th
round of NSS (1983). The indices of both
the series i.e. CPI-AL and RL are compiled every month as per the methodology approved by
the Technical Advisory Committee on Statistics of Prices and Cost of Living and released on the
20th
day of the succeeding month. The movement in all-India index for agricultural labourers
and rural labourers during the period July, 2014 to June, 2015 showed a fluctuating trend.
The index for Agricultural Labourers increased from 799 points in July, 2014 to 813
points in October, 2014. After remaining static during November 2014, it started decreasing to
reach the level of 803 in February, 2015. The index however started increasing from 805 in
April, 2015 and finally settled at the peak level of 820 points in June, 2015. Similarly the index
for Rural Labourers increased from 801 points in July, 2014 to 816 points in November, 2014.
After showing a decreasing trend during December, 2014 to February, 2015, the index started
increasing from 807 in March, 2015 and reached the peak level of 824 points in June, 2015.
15.4 Compilation of Wage Rate Data - Labour Bureau has been compiling and maintaining
average daily wage rate data in respect of selected agricultural and non-agricultural occupations
based on the data collected by the Field Operation Division of National Sample Survey
Organisation (NSSO) from 600 sample villages spread over 66 N.S.S. regions in 20 states on
monthly basis w.e.f. April 1998. The average daily wage rate data was collected for 11
agricultural and 7 non-agricultural occupations till October 2013. However, following the
recommendations of the Working Group constituted by the CSO on advise of the National
Statistical Commission, wage rate is now being collected and compiled for 25 occupations (12
agricultural and 13 non-agricultural). The occupation and sex-wise wage rate data for the period
July, 2014 to June, 2015 were compiled and published regularly in Indian Labour Journal.
Besides, a publication titled ‗Wage Rates in Rural India‘ containing wage rate data for July 2013
to June 2014 was also brought out.
15.5 Rural Labour Enquiries (RLE) – The Rural Labour Enquiries are conducted by the
National Sample Survey Organization (NSSO) alongwith its general employment and
unemployment surveys on quinquennial basis. On the basis of each enquiry, the Labour Bureau

Indian Labour Journal, September 2015
949
brings out five analytical reports on various aspects covering Wages & Earnings, Indebtedness,
Consumption Expenditure, Employment & Unemployment and General Characteristics of Rural
Labour Households. The data relating to the survey conducted during 61st round (July, 2004–
June, 2005) had been received and the all five RLE reports have since been released. The work
on data relating to the survey conducted during 66th
round (July, 2009–June, 2010) is under
progress.
15.6 Improvement of Labour Statistics (ILS) -
I - Regular training programmes :
Training programmes on Labour Statistics are being organised under the Improvement
of Labour Statistics Training-cum-Liaison Scheme.
The 52nd
Central Training Course on Labour Statistics was organised at Labour Bureau,
Shimla during 3rd
to 5th
September 2014. In which 28 delegates from various States /
Central Departments participated.
II - Training programmes sponsored by National Statistical Systems Training Academy
(NSSTA):
Training programme on 8th
January 2015 for fourteen participants from International
Statistical Education Centre (ISEC) Kolkata,
Training programme during 02/02/2015 to 04/02/2015 for twenty Indian Statistical
Service (ISS) probationers 37th batch.
Training programme during 09/02/2015 to 12/02/2015 for twenty Indian Statistical
Service (ISS) probationers 36th batch.
III – Adhoc training programmes :
Half day training programme on 17th
November, 2014 for eighteen trainees from
Maharashtra Institute of Labour Studies, Mumbai.
Half day training programme on 2nd
December, 2014 for twenty seven employees from
Ordnance Factory Medak, Telangana.
Half day training programme on 25th
June, 2015 for twenty employees from Ordnance
Factory Medak, Telangana
IV - Training programmes for primary units i.e. factories/establishments:
During July 2014 to June 2015 Labour Bureau‘s Regional Office Kanpur organised
nine training programmes at Kanpur, Unnao, Jammu, Srinagar, Patna, Gaya, Faridabad, Kanpur
and Shillong for the benefits of primary units and for State labour department officials in which
261 officers / officials from factories / Establishments took part.
15.7 Collection of Labour Statistics under the Annual Survey of Industries- Under the
ASI Scheme, data is being collected by National Sample Survey Office (NSSO) and Labour
Bureau is disseminating data collected under Labour part i.e. part-I (Block-E) and part-II of ASI
Schedule. All factories registered under section 2m(i) and 2m(ii) of Factories Act,1948 and Bidi
& Cigar Workers (Conditions of Employment) Act,1966 are covered under ASI. From 1976-77
round of ASI, data under ASI is collected under two schemes viz (i) Census Sector (ii) Sample
Sector. All factories (i) employing 100 or more workers, (ii) units in Manipur, Meghalaya,
Nagaland, Tripura and Andaman &Nicobar Island and (iii) all factories declared submitting Joint
Indian Labour Journal, September 2015
950
Returns as identified by FOD (NSSO) in the frame are covered in Census Sector. All the units
which are not covered under the Census Sector, are covered on sample basis under the Sample
Sector.
Under the Scheme, statistics are collected and disseminated on Absenteeism, Labour
Turnover, Employment, Man-days worked, Labour Cost and Wages and Earning. So far, reports
up to ASI 2011-12 in the following two volumes, which includes the results of both census and
sample sectors, have been released: (i) ASI Volume-I - Statistics on Employment and Labour
Cost (ii) ASI Volume-II - Absenteeism, Labour Turnover, Employment and Labour Cost.
15.8 Occupational Wage Survey (OWS) - The survey aims to collect occupation-wise data
on wage rates, employment, dearness allowance and earnings in organized sector. A meeting of
the Steering Committee under the Chairpersonship of the Secretary, L & E was held on
16.06.2014 wherein it was decided that revision of all the Indices will be top priority for Labour
Bureau. The conduct of Occupational Wage Survey is a pre-requisite for revision of base of
Wage Rate Index which at present is being compiled on base 1963-65=100. The requisite
weights and base year rate is obtained from the conduct of OWS. Therefore, it was proposed to
conduct 7th
round of OWS consisting of 56 industries. Proposal in this regard has been prepared
and sent to the Ministry for approval. Collection of frame for Mining, Plantation and Service
Industries is under progress.
15.9 Compilation of Wage Rate Indices (WRI) - Wage Rate Index numbers depicts
movement of relative change experienced in the wage rates over a period of time. These indices
are being compiled by the Labour Bureau for selected industries since 1969. Initially, Wage
Rate Index Numbers were compiled for twelve selected Manufacturing industries. However,
during 1976, nine more industries, comprising of three plantations, four mining and two
manufacturing, were added to the list of industries for the compilation of index numbers.
The present Wage Rate Indices are being compiled on the base year 1963 - 1965 = 100.
The base year data on wage rates and employment were obtained from the Second Occupational
Wage Survey, which was conducted by the Bureau in 1963-65. The main criteria for selecting an
industry for compilation of W.R.I. Index were its importance in the national economy and
employment in the base year. Fourteen selected manufacturing industries accounted for nearly
67 percent of the total employment in the Manufacturing Sector during the base year. Similarly,
four mining industries together accounted for nearly 95 percent of the total employment in the
Mining Sector whereas the three selected plantations industries accounted for almost the entire
employment in the Plantation Sector during base year. Further, in each of these selected
industries, the selected occupations together accounted for 75 percent or more of the total
employment in the industry.
For compiling Wage Rate Index Numbers, the requisite data on minimum and
maximum wage rates, which is defined as basic wage plus dearness allowance, wherever paid
separately, are being collected for the month of January every year. The indices are generated
using the Laspeyre`s formula, which is the ratio of the weighted average of wages of the current
year to wages of the base year, employment in the base year as weights. The Wage Rate Indices
in respect of 21 industries for the year 2014 has been published in the Indian Labour Journal.
15.10 Annual Employment-Unemployment Survey - In order to fill the data gap for
ascertaining the employment-unemployment scenario in the country, Labour Bureau has been
entrusted by the Ministry the task of conducting Annual Employment-Unemployment surveys
(EUS). So far four such surveys have been conducted by Labour Bureau and there on reports
released. The field work of 5th
Annual Employment-Unemployment Survey is in progress.

Indian Labour Journal, September 2015
951
The fourth Annual Employment-Unemployment Survey was launched in the month of
January, 2014. In the fourth Annual Employment-Unemployment Survey, all the districts in the
36 States/UTs of the country were covered. The sample size in the fourth EUS was about 1.36
lakh household schedules.
Labour Force Participation Rate (LFPR), Worker Population Ratio (WPR) and
Unemployment Rate (UR) for persons aged 15 years & above according to Usual Principal
Status approach (UPS) based on 4th
Annual Employment-Unemployment Survey are as follows:
LFPR, WPR and UR for persons aged 15 years & above according to Usual Principal
Status (UPS) approach based on 4th
Annual Employment-Unemployment Survey
(in per cent)
Perameter Male Female Persons
LFPR 74.4 25.8 52.5
WPR 71.4 23.8 49.9
UR 4.1 7.7 4.9
Quarterly Quick Employment Surveys (QES) – Labour Bureau has been conducting quarterly
quick employment surveys in the selected labour-intensive and export-oriented sectors to assess
the effect of economic slowdown on employment in India since January, 2009. So far twenty
four such surveys have been conducted by Labour Bureau and reports thereon released. The field
work of 25th
& 26th
quick employment survey is completed & data processing is in progress.
According to the survey results, overall estimated employment in all selected sectors
has experienced a net addition of 37.46 lakh persons starting from the 1st
survey (October, 2008
to December, 2008) till the 24th
Survey (October, 2014 to December, 2014). Under Quick
Employment Survey, during July, 2014 to June, 2015, 21st, 22
nd, 23
rd & 24
th surveys are
conducted. The brief features of the surveys conducted are as follows.
The 21st quarterly quick employment survey for the reference period January-March,
2014 was conducted in the month of July/August, 2014. At overall level, the employment
declined by 0.36 lakh during the period March, 2014 over December, 2013.
The 22nd
quarterly quick employment survey for the reference period April-June, 2014
was conducted in the month of July/August, 2014. At overall level, the employment increased by
1.82 lakh during the period June, 14 over March, 14.
The 23rd
quarterly quick employment survey for the reference period July-September,
2014 was conducted in the month of January, 2015. At overall level, the employment increased
by 1.58 lakh during the period September, 2014 over June, 2014.
The 24th
quarterly quick employment survey for the reference period October-
December, 2014 was conducted in the month of January, 2015. At overall level, the employment
increased by 1.17 lakh during the period December, 14 over September, 14.
15.11 Factories Act, 1948 - Labour Statistics under the Factories Act, 1948 is collected,
compiled and disseminated on All-India basis for formulation of Labour Policies. The data is
received in the form of consolidated annual returns under the Factories Act, 1948. The returns
are received from the Chief Inspector of Factories and the Labour Commissioners of the
States/U.Ts. The State Government/U.T. consolidates these returns and sends annual returns to
the Labour Bureau in the prescribed proformae. The Bureau in turn tabulates these returns and

Indian Labour Journal, September 2015
952
consolidates the statements at All-India level and brings out report viz., ―Statistics of Factories‖
on an annual basis. The data after finalization is supplied to various agencies which include
I.L.O., C.S.O. and DGFASLI, etc. Besides, the data is also published in other periodic
publications of Labour Bureau viz, I.L.J., I.L.Y.B., Pocket Book and I.L.S etc. During July,
2014 to June, 2015 Reviews/Reports on Statistics of Factories for 2012 has been published and
uploaded on the website of the Bureau. The review/report for the year 2013 is under progress.
15.12 Trade Unions Act, 1926 - Under Trade Unions Act, 1926 data of Annual Return
received from States/Union Territories are compiled and disseminated at All-India basis for the
formulation of Labour policies of Trade Unions. The data is received in the form of
consolidated annual returns under the Trade Unions Act, 1926. The returns are received from
Registrar of Trade Unions and the Labour Commissioners of States/U.Ts. who consolidate these
returns and send annual returns and Labour Bureau consolidates the data at All-India level and
brings out Biennial Review on Trade Unions in India. These statistics are supplied to various
agencies which include I.L.O., C.S.O., DGFASLI etc. Besides the data is also disseminated
through the various publications of Labour Bureau viz., I.L.J., I.L.Y.B., Pocket Book of Labour
Statistics and I.L.S. etc. During July, 2014 to June, 2015 data tables under this Act i.e. Trade
Unions in India -2012 has been published and uploaded on the website of the Bureau. The
review/report for the year 2013 is under progress.
16. Labour Research & Training; V.V.Giri National Labour Institute
16.1 V.V. Giri National Labour Institute is a premier institution involved with research, training,
education and publication on labour and related issues. The Institute, established in 1974, is
an autonomous body of the Ministry of Labour and Employment, Government of India. The
Institute was renamed in 1995 in honour of the former President of India, Shri V.V. Giri, a
renowned trade union leader.
16.2 The Institute has initiated 22 Research Projects on major themes like Employment;
Migration; Minimum Wages; Contract Labour; Labour Laws; Rural Labour; Informal
Sector; Child Labour; Skill Development; Agrarian Relations; Social Security; Labour
History; Migration; Gender Issues and Health & Labour. Out of which 17 projects have
been completed. 10 research projects are sponsored projects. The Institute initiated the
establishment of SAARC Regional Centre on Child Labour. The Institute has the following
core competencies in Training and Education: Labour Administration; Industrial Relations;
Labour Legislations; Leadership Development; Capacity Building; Rural Labour Camps;
Child Labour; Health Issues; Gender Issues in Labour; and Research Methods in Labour.
The Institute conducted 124 training programmes during 2014-15 which were attended by
3264 participants. The Institute is currently empanelled as a training institution for
organizing international training programmes under the ITEC/SCAAP scheme of the
Ministry of External Affairs, Govt. of India. 7 International Programmes were organised
during 2014-2015 on key areas like: Labour and Employment Relations in a Global
Economy, Leadership Development, HIV/AIDS and Labour, Social Security, Research
Methods, Skill Development & Employment Relations and Gender Issues. These
programmes were attended by 158 participants from approx 48 countries.
Indian Labour Journal, September 2015
953
LABOUR ACTIVITIES
LABOUR SITUATION
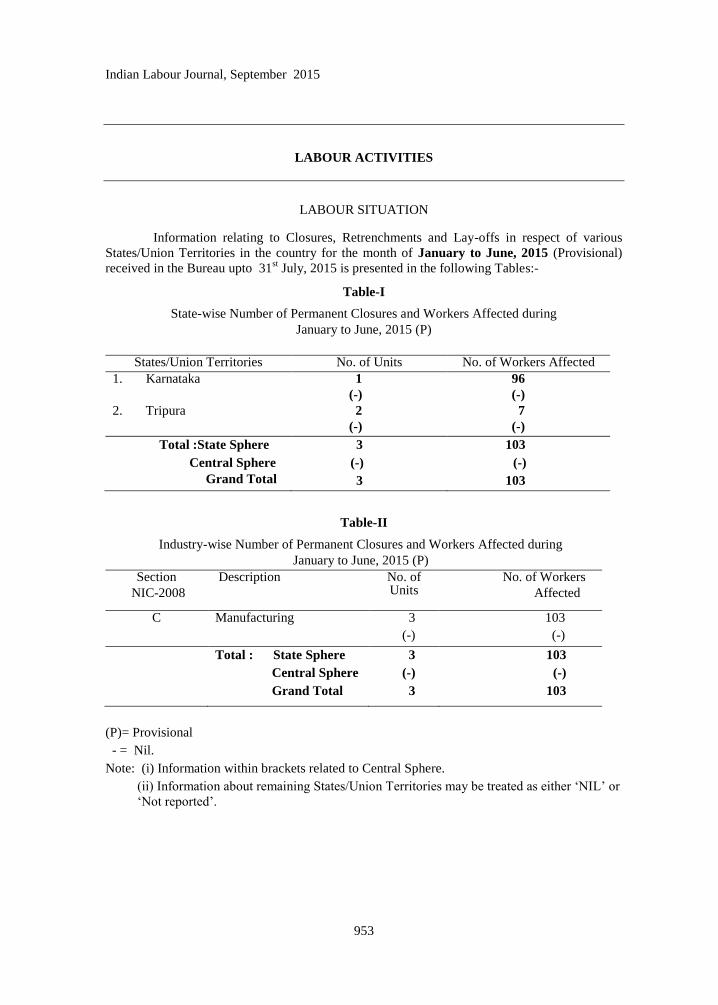
Information relating to Closures, Retrenchments and Lay-offs in respect of various
States/Union Territories in the country for the month of January to June, 2015 (Provisional)
received in the Bureau upto 31st July, 2015 is presented in the following Tables:-
Table-I
State-wise Number of Permanent Closures and Workers Affected during
January to June, 2015 (P)
States/Union Territories No. of Units No. of Workers Affected
1. Karnataka 1 96
(-) (-)
2. Tripura 2 7
(-) (-)
Total :State Sphere
Central Sphere
Grand Total
3
(-)
3
103
(-)
103
Table-II
Industry-wise Number of Permanent Closures and Workers Affected during
January to June, 2015 (P)
Section
NIC-2008
Description No. of Units
No. of Workers
Affected
C Manufacturing 3 103
(-) (-)
Total : State Sphere
Central Sphere
Grand Total
3
(-)
3
103
(-)
103
(P)= Provisional
- = Nil.
Note: (i) Information within brackets related to Central Sphere.
(ii) Information about remaining States/Union Territories may be treated as either ‗NIL‘ or
‗Not reported‘.

Indian Labour Journal, September 2015
954
Table-III
State-wise Number of Units affecting Retrenchments and Workers Retrenched thereby during January to June, 2015 (P)
State/Union Territory No. of Units No. of Workers affected
1. Kerala 1 24
(-) (-)
2. Odisha - -
(8) (163)
3. Rajasthan - -
(1) (87)
Total : State Sphere 1 24
Central Sphere (9) (250)
Grand Total 10 274
Table-IV
Industry-wise Number of Units affecting Retrenchments and Workers Retrenched during January to June, 2015 (P)
Section NIC-2008
Description No. of Units No. of Workers affected
B Mining and quarrying - -
(9) (250)
C Manufacturing 1 24
(-) (-)
Total: State Sphere 1 24
Central Sphere (9) (250)
Grand Total 10 274
Table-V
State-wise Number of Units Affecting Lay-offs, Workers Laid-off and Mandays Lost during January to June, 2015 (P)
States/Union Territories No. of Units No. of Workers Affected
Mandays Lost
1. Kerala 10 (-)
531 (-)
26412 (-)
2. Puducherry 2 898 89832 (-) (-) (-)
Total : State Sphere Central Sphere
Grand Total
12 (-) 12
1429 (-)
1429
116244 (-)
116244
(P)= Provisional
- = Nil.
Note: (i) Information within brackets related to Central Sphere.
(ii) Information about remaining States/Union Territories may be treated as either ‗NIL‘ or
‗Not reported‘.
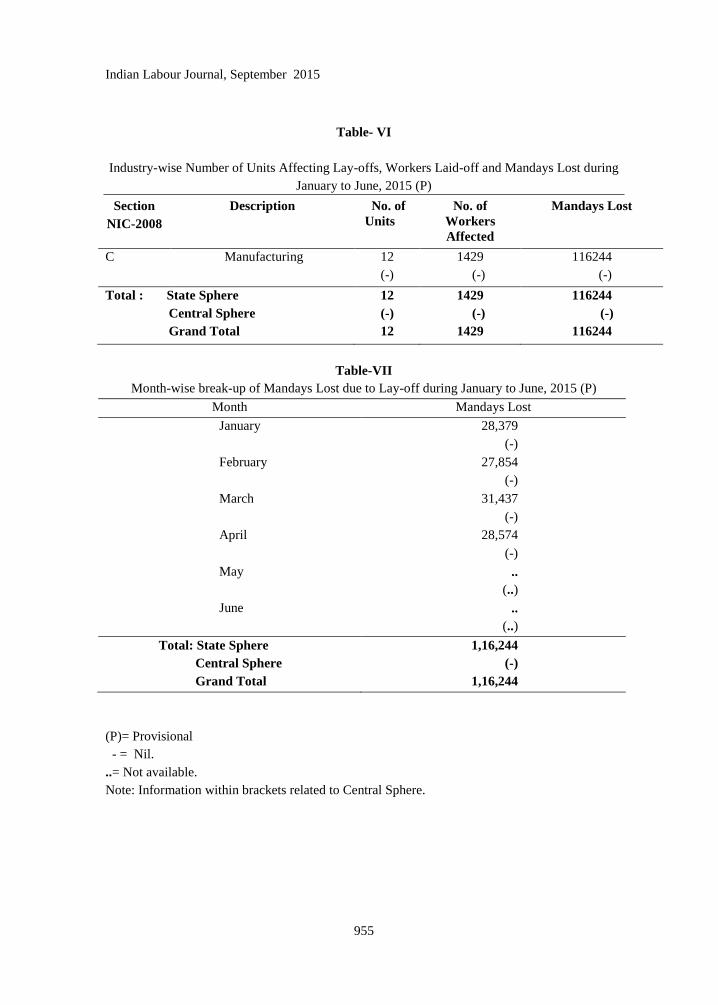
Indian Labour Journal, September 2015
955
Table- VI
Industry-wise Number of Units Affecting Lay-offs, Workers Laid-off and Mandays Lost during
January to June, 2015 (P)
Section
NIC-2008
Description No. of
Units
No. of
Workers
Affected
Mandays Lost
C Manufacturing 12
(-)
1429
(-)
116244
(-)
Total : State Sphere
Central Sphere
Grand Total
12
(-)
12
1429
(-)
1429
116244
(-)
116244
Table-VII
Month-wise break-up of Mandays Lost due to Lay-off during January to June, 2015 (P)
Month Mandays Lost
January 28,379
(-)
February 27,854
(-)
March 31,437
(-)
April 28,574
(-)
May ..
(..)
June ..
(..)
Total: State Sphere
Central Sphere
Grand Total
1,16,244
(-)
1,16,244
(P)= Provisional
- = Nil.
..= Not available.
Note: Information within brackets related to Central Sphere.

Indian Labour Journal, September 2015
956
Industrial Disputes during January to June, 2015 (Provisional)
The statistics of work-stoppages due to Industrial Disputes during January to June,
2015 based on the returns received from different State Labour Departments / Regional Labour
Commissioners (Central) are presented in the following tables:
As per available information 64 Industrial Disputes resulting in work-stoppages were
reported during January to June, 2015 in which 144332 workers were involved and 880300
mandays lost were reported. Besides, there were 4 disputes which occurred due to reasons other
than Industrial Disputes also. In the said disputes 5445 workers were involved and 422450
mandays were lost.
Table VIII
Number of Mandays Lost on Account of Work-stoppages during January to June 2014 and 2015
Number of Mandays Lost on Account of
Month Industrial Disputes Reasons Other Than Industrial Disputes 2014 (P) 2015 (P) 2014 (P) 2015(P)
1 2 3 4 5
January 120722 365645 147535 146035
February 731524 193108 135710 130190
March 127295 176093 141125 141325
April 154672 116162 140145 4900
May 144403 21367 141325 ..
June 178650 7925 141080 ..
Total 1457266 880300 846920 422450
(P) = Provisional and based on the returns /clarifications received in the Bureau till 31st July,
2015.
.. = Not available.
N.B:- Figures for 2015 are not comparable with those for 2014 due to non-receipt of data from
various States / Union Territories.

Indian Labour Journal, September 2015
957
Table IX
State-wise Major* Industrial Disputes in India including Industrial Disputes
Due to Reasons other than Industrial Disputes till June, 2015 (P)
Name of the State /
Union Territory /
Sphere / Sector /
Number of
Establishments
affected
Strike/
Lockout
Cause No. of
Workers
involved
No. of
Mandays
lost
(in
000‘s)
Wages
lost
(Rs. in
Lakhs)
Production
loss
(Rs. in
Lakhs)
1 2 3 4 5 6 7
CENTRAL SPHERE NIL
STATE SPHERE Rajasthan
One Unit
(Private Sector)
Lockout Indiscipline 270 240.4 328.05 1866.66
((P) = Provisional and based on the returns /clarifications received in the Bureau till 31st July, 2015.
.. = Not available.
* = All disputes in which there was a time-loss of 50,000 or more mandays during the period under
review or since the beginning of the disputes are classified as major disputes.
N.B:- Information in this statement has been given only those case(s) which has/have been received in the
current month sent by different State Labour Departments / Regional Labour Commissioners (Central) in their latest monthly return relating to current year.
Be more dedicated to making solid achievements than in
running after swift but synthetic happiness.
APJ Abdul Kalam

Indian Labour Journal, September 2015
958
NEWS IN BRIEF
(a) INDIAN LABOUR The news items reported below have been gleaned from various official and unofficial
sources. Hence, the Labour Bureau is not in a position to vouchsafe the authenticity of the unofficial news items. Government Looks to Scale Up Social Schemes - Jolted by the high number of landless casual labourers struggling with poverty, the government's social intervention schemes are set to get a reality check, especially in skill development and housing. First up is a plan to massively scale up the skilling programme to address the widespread income deprivation thrown up in the Socio Economic and Caste Census 2011 released recently. The large number of people lacking proper houses will get priority in the prime minister's housing initiative. The rural development ministry is taking stock of the data and will make adjustments. The SECC data showed that a third of India's rural households are landless and depend on manual labour for an income, reflecting the extent of poverty that is prevalent in the villages. "The data shows how much we had underestimated poverty figures. It has to become a much larger concern for us. SECC numbers have also challenged our assessment of urbanisation with 73% households still in rural areas," said Amitabh Kundu, senior fellow, Delhi Policy Group, a think tank based in New Delhi. The rural development ministry will soon present its scheme to provide housing for all in the rural areas - an improved version of the Indira Awas Yojna - for the Prime Minister's approval. With 13% (2.37 crore) of rural households still living in houses with only one room, kuccha walls and kuccha roof, the government will have to double its target to providing 40 lakh houses annually. The new housing scheme will offer a variety of designs, based on the geographical requirements of the state, and encourage the use of local materials in construction. The government will increase spending on the skill development programme. The rural development ministry will ask the Centre to remove the 25% ceiling on expenditure allowed under the Deen Dayal Upadhyay Grameen Kaushalya Yojna, which is aimed at developing the skills and productive capacity of rural youth from poor families.
(The Economic Times, 06.07.2015) Recruitment Outsourcing is the Next Big Thing - HR services and staffing firms in India are expanding their teams and operations to cater to the rapidly growing demand for recruitment process outsourcing (RPO) as organisations increasingly farm out all or part of the hiring functions to focus on their core businesses. With the estimated Rs.400 crore RPO business in India expected to grow at a staggering 40-50 per cent a year for the next few years, firms such as PeopleStrong, Manpower Group, Quess Corp, Randstad and TeamLease Services are attracting a steady stream of new clients. There is an increasingly sharper focus on understanding of the Indian market for RPO projects, said Pankaj Bansal, cofounder of PeopleStrong. "Corporates are looking not only for a specialisation in sourcing but also in processing and technology, to which attention was not paid a couple of years ago," he said. As hiring increases and the war for talent intensifies, more and more companies are expected to outsource their recruitment process work. This model helps provide a cost-effective and consistent talent acquisition process, keeping turnaround time low and allowing companies to scale up quickly when the business environment improves. In India, software, technology and IT sectors are the major torchbearers for RPO growth. However, mid-sized to large companies in manufacturing, telecom, pharmaceuticals, healthcare and banking sectors are also driving demand. In the global market, multinational companies are increasingly seeking a single RPO service provider across multiple locations, with India being one of the primary markets.
(The Economic Times, 14.07.2015)
India can be Human Resource Capital of World, Says PM - Linking skill development to his government‘s ―war against poverty‖, Prime Minister Narendra Modi said that India has the potential to emerge as the ―human resource capital‖ of the world as China has become a global

Indian Labour Journal, September 2015
959
―manufacturing factory‖. ―We have to map the requirements of the entire world and then provide human resource to them,‖ Modi said as he launched the National Mission for Skill Development to ―provide the overall institutional framework to rapidly implement and scale up skill development efforts across India‖. The mission has set a target to skill 24 lakh workers this year and 40.2 crore workers by 2022. It will be led by a governing council which will be chaired by the PM and include ministers for finance, skill development and entrepreneurship, human resource development, rural development, labour and employment, overseas affairs, information technology, deputy chairman of NITI Aayog and three chief ministers as members. The PM also launched the new National Skill Development and Entrepreneurship Policy 2015, Pradhan Mantri Kaushal Vikas Yojana and a skill loan scheme to encourage more youth to take up vocational training. Pointing out that 65 per cent of the country‘s population is under the age of 35, the PM said the key priority is to create employment opportunities for the youth as well as create avenues to skill them in a structured manner to improve their employability. ―If they don‘t have skills and opportunity, then how will they meet challenges? Instead, they too will become a challenge,‖ he said, adding that the government will work together with states in a structured manner to promote skill training as an alternative to higher education.
(The Indian Express, 16.07.2015) Changes in Labour Laws after Consultation with Trade Unions: PM - With labour reforms facing stiff resistance from trade unions, Prime Minister Narendra Modi said changes in the laws will be carried out through consensus and in consultation with them. Inaugurating the 46th Indian Labour Conference, he said, ―Changes in the labour laws will be made with the concurrence of the unions and the consultation process will continue‖. The government has set up a high-level inter-ministerial committee under Finance Minister Arun Jaitley to hold discussions with the unions on issues concerning labour. Talking about different interest groups, the PM said that there was a thin line dividing the interest of industry and industrialists, government and nation, and labour and labour organisations. The Prime Minister also regretted that the number of apprentices in the country was very low and asked the industry to provide more opportunities to them with a view to increase their numbers from three lakh to at least 20 lakh. The number of apprentices in China is two crore, Japan one crore and Germany 30 lakh as against only three lakh in India, he said. The Prime Minister also expressed concern over the lack of respect for the workers in Indian society. ―There is a wrong habit which has crept in, we do not respect our labour enough, he said,‖ adding that the law was needed for those who do not treat labour as fellow human beings. He also made a case for simplification of the labour laws which currently are complex and can be interpreted by all stake holders for their own benefit.
(The Tribune, 20.07.2015)
Labour Law Recast to Add More Leave to Maternity - The NDA government is looking to enhance maternity leave for working women from three months to six months, virtually double bonus payments to employees and make gratuity portable between jobs. "The changes in the Payment of Bonus Act would raise the salary limit for getting a bonus from Rs 10,000 per month to Rs 19,000, and are at an advanced stage with a draft Cabinet note being moved earlier this month for comments from ministries," said a senior labour ministry official. Separately, the government is initiating stakeholder consultations to amend the Maternity Benefits Act of 1961 and the Payment of Gratuity Act of 1972, the official added. Currently, companies are legally required to grant 12 weeks of maternity leave to employees though several leading employers offer additional time off and other benefits. For instance, Accenture offers five months off to new mothers while Flipkart offers 24 weeks paid leave. Citibank also offers a creche allowance to new mothers, as do some other multinational firms and investment banks.
(The Economic Times, 22.07.2015) States Directed to Ensure Social Security Benefits for Outsourced Staff - Union Minister for Labour and Employment Bandaru Dattatraya has urged to all the Chief Ministers and Lieutenant Governors to ensure compliance regarding social security coverage of outsourced staff working in the Government departments, Public Sector Undertakings, State Cooperatives and other bodies. He directed States to convene a meeting of all the Departments and other Public Sector

Indian Labour Journal, September 2015
960
Institutions to ensure that every employee gets social security benefits. The State administration may associate Additional Central Provident Fund Commissioner-in-charge of the State in this regard, the Minister added. In a letter addressed to all the CMs and LGs, the Minister said National Human Rights Commission was also monitoring the implementation as the social security is considered as a human right of an individual. It has been observed that various Departments, PSUs, State Cooperatives and other State run bodies are increasingly employing a large number of staff on outsourcing basis. The Employees‘ Provident Fund Organisation has reported that a significant number of such employees are not getting any social security benefits. This is violation of the social security rights of such employees, the Minister added.
(The Hindu Business Line, 22.07.2015) Punjab Skill Development Mission to Upgrade 1 Lakh Youths - Punjab Government said it has chalked out a detailed action plan under its Skill Development mission to upgrade 1 lakh youths to make them employable. The detailed modalities and action plans of the various skill development initiatives of Punjab Skill development mission was reviewed by Sarvesh Kaushal, Chief Secretary, Punjab while chairing the steering committee of the Mission, said an official spokesperson. Punjab Government had notified the 'Punjab Skill Development Mission' to oversee and co-ordinate the implementation of various skill development schemes across all the departments, he said. Steering Committee has been constituted to frame policies for the mission under the guidance of governing council and takes financial and administrative decisions concerning the mission. Disclosing this, he said during the meeting, a detailed presentation regarding the present status of the establishment of Multi Skill Development Centers (MSDC) was made by the Mission Director R K Verma. Chief Secretary was apprised that the detailed project report of setting up MSDC at Ludhiana has been finalized and sent to National Skill Development Council for final approval. The modalities of setting up MSDCs at Amritsar, Jalandhar, Bathinda, Hoshiarpur and Ropar like identification of space, course finalization, building & architectural plans, training infrastructure, finalization of services providers were also discussed during the meeting.
(Business Standard, 28.07.2015)
Industries/Services Declared/Granted Extension as Public Utility Services under the Industrial Disputes Act, 1947– As per the information received in the Bureau, the following Industries/Services have been declared Public Utility Services for a period of six months with effect from the date mentioned against them.
Sl. No.
Authority Making Declaration
Industry/Service Date of Declaration/ Extension
1 Central Government I. Services in industry engaged in manufacture or production of mineral oil (crude oil) motor and aviation spirit, diesel oil, kerosene oil, fuel oil, diverse hydrocarbon oils and their blends including synthetic fuels, lubricating oils and the like
16.07.2015
II. Services in Uranium Industry 20.07.2015
Indian Labour Journal, September 2015
961
Consumer Price Index Numbers for Industrial Workers (CPI-IW) on base 2001=100 and Agricultural and Rural Labourers on base 1986-87=100 for the month July, 2015
Consumer Price Index Numbers for Industrial Workers - The All-India CPI-IW for July, 2015 increased by 2 points and pegged at 263 (two hundred and sixty three). On l-month percentage change, it increased by (+) 0.77 per cent between June, 2015 and July, 2015 when compared with the increase of (+) 2.44 per cent between the same two months a year ago. The maximum upward pressure to the change in current index came from Housing group contributing (+) 1.33 percentage points to the total change. At item level, Wheat Atta, Arhar Dal, Mustard Oil, Onion, Garlic, Tomato, Gourd, Electricity Charges, etc. are responsible for the increase in index. However, this increase was restricted by Rice, Wheat, Coconut Oil, Coconut, Lemon, Sugar, Primary & Secondary School Books, Petrol, etc., putting downward pressure on the index. The year-on-year inflation measured by monthly CPI-IW stood at 4.37 per cent for July, 2015 as compared to 6.10 per cent for the previous month and 7.23 per cent during the corresponding month of the previous year. Similarly, the Food inflation stood at 3.21 per cent against 6.67 per cent of the previous month and 8.11 per cent during the corresponding month of the previous year. At centre level, Haldia reported the highest increase of 19 points followed by Jamshedpur (15 points) and Bhilai (8 points). Among others, 6 points increase was observed in 2 centres, 5 points in 6 centres, 4 points in 7 centres, 3 points in 12 centres, 2 points in 14 centres and 1 point in 9 centres. On the contrary, Quilon centre recorded a maximum decrease of 6 points. Among others, 3 points decrease was observed in 2 centres, 2 points in 4 centres and 1 point in 7 centres. Rest of the 11 centres‘ indices remained stationary.The indices of 34 centres are above All India Index and other 43 centres‘ indices are below national average. The index of Vishakhapathnam is at par with All-India index.
(Labour Bureau) Consumer Price Index Numbers for Agricultural Labourers and Rural The All-India Consumer Price Index Numbers for Agricultural Labourers and Rural Labourers (Base: 1986-87=100) for July, 2015 increased by 2 points and 3 points to stand at 822 (Eight hundred and twenty two) points and 827 (Eight hundred and twenty seven) points respectively. The rise/fall in index varied from State to State. In case of Agricultural Labourers, it recorded an increase between 1 to 10 points in 16 States and a decrease between 1 to 11 points in 4 States. Haryana and Karnataka States with 910 points topped the index table whereas Himachal Pradesh with 676 points stood at the bottom. In case of Rural Labourers, it recorded an increase between 2 to 12 points in 16 States and a decrease of 6 and 11 points in 2 States. The index however remained stationary in 2 States. Haryana with 909 points topped the index table whereas Himachal Pradesh with 715 points stood at the bottom. The Consumer Price Index Numbers of Tripura & West Bengal States in case of Agricultural Labourers registered the maximum increase of 10 points each and Tripura State in case of Rual Labourers registered the maximum increase of 12 points mainly due to increase in the prices of rice, wheat atta, pulses, mustard oil, fish fresh, onion, chillies green, vegetables & fruits and firewood. On the contrary, Index of Orissa State registered the maximum decrease of 11 points each for Agricultural Labourers and Rural Labourers due to decrease in the prices of rice, chira, pulses, groundnut oil, vegetables & fruits and sugar. Point to point rate of inflation based on the CPI-AL and CPI-RL decreased from 4.46% and 4.70% in June, 2015 to 2.88% and 3.25% in July, 2015. Inflation based on food index of CPI-AL and CPI-RL is 1.15% and 1.40% respectively during July, 2015.
(Labour Bureau)

Indian Labour Journal, September 2015
962
(b) FOREIGN LABOUR
US Unemployment Hits Seven-Year Low after Adding 223,000 Jobs in June - The US unemployment rate has fallen to 5.3% – the lowest in seven years – after the economy added 223,000 jobs in June. The drop in the unemployment rate from 5.5% in May to 5.3% in June takes it to the level that the US government considers full employment, and heightens expectations that the Federal Reserve will raise interest rates. However, the Labor Department said the biggest reason for the fall in the unemployment rate was because people out of work gave up looking for a job and were thus no longer counted as unemployed. Labor secretary Thomas Perez welcomed ―another solid jobs report‖. ―Not only is the quantity of jobs growing but the quality too,‖ he said. Perez added that more work needed to be done and that wages needed to rise. ―There‘s no magic bullet that will raise wages for everyone,‖ he said. But he said that the Obama administration‘s move to raise the number of people who qualify for overtime payments and efforts to raise the minimum wage would help. The addition of 223,000 jobs was lower than the 233,000 economists had expected. The department also had to revise down, by 60,000, the number of jobs it previously said were added in April and May. The US economy has been adding jobs at an average rate of 217,000 a month so far in 2015.
(The Guardian, 02.07.2015)
Pace of UK Hiring Slows Further in June - Permanent staff placements by recruitment agencies in Britain rose at their slowest pace in more than two years in June, largely due to a lack of skilled candidates, a survey showed. Salaries for permanent hires grew at their slowest pace in four months but remained well above the historical trend, according to the survey produced by the Recruitment and Employment Confederation (REC) and accountants KPMG. "Recruiters are struggling to fill vacancies for everything from software engineers to sales," Bernard Brown, a partner at KPMG, said. Skills shortages were driving up pay, he added. The Bank of England is watching Britain's labour market closely as it considers when to start raising interest rates from their record low of 0.5 percent. Official data has shown an increase in earnings in recent months.
(Reuters, 08.07.2015) Australian Business Looking at India as 'New China' - Those Australians who are worried over the slowing Chinese economy may have some reasons to smile as Canberra is already working desperately to stitch up a Free Trade Agreement with the world's second-most populous country - India. If everything goes according to the Australians' plan there is every reason to believe that India would become one of the largest trading partners of Australia. She has the potential to become what is being called in some circles as Australia's "new China" - the largest trading partner at this stage. The Australian eagerness to open such a vast market as India to its service and manufacturing sectors is reflected through the statements made by its federal ministers. "We are working through the night ... putting pressure on them (India) to help us to get to the point where we can have a similar, very positive agreement," Treasurer Joe Hockey told a conference held in Canberra recently. Joe Hockey's statement came after the China-Australia Free Trade Agreement (ChAFTA) was signed mid-June. Canberra intends to finalise a similar FTA with New Delhi by the end of this year. A number of commentators are writing on how Australian and Indian geopolitical and economic interests are converging and how they can harness the synergies to the benefit of both the parties. If the signals being emitted from South Block are being interpreted correctly, India is also showing some enthusiasm to conclude the negotiations for the Comprehensive Economic Cooperation Agreement (CECA) this year. The sense of optimism among the Australian stakeholders for India is definitely palpable. Australian corporate honchos, especially those linked with services sector, are particularly buoyed by the thought of massive revenue the Indian market can churn. A similar sentiment is being nursed by India's famed IT services sector which has been asking for barriers to be removed.
(Business Standard, 12.07.2015)
For H-1B Visa Holders, Double Income will be A Reality Soon - The US Citizenship and Immigration Services (USCIS) has started accepting employment authorisation applications
Indian Labour Journal, September 2015
963
from May 26, 2015 from dependent spouses of H-1B visa holders. This is the first time that H-4 spouses are being allowed to work in the US and an estimated 1,80,000 spouses have become eligible. ―While not all spouses on H-4 visas will be eligible to work in the US, many will be, including a large number from India,‖ said Mumbai-based immigration lawyer Poorvi Chothani. She added that there are thousands of Indians in the US who are waiting for employment-based visa or Green Card, and many of their spouses on H-4 visas will benefit and can apply for employment authorisation. The US department of homeland security has said that it will issue the Employment Authorization Documents (EADs) within 90 days of receiving the application. ―The benefit of the employment authorisation under H-4 visa is that there are no restrictions or minimum wage requirement, thus many Indian spouses can take up daycare and other jobs,‖ Chothani said. She added that unlike the primary H-1B visa holder, H4 employment authorisation applicants would not be required to show any minimum qualifications either. While all H-4 visa holders are not eligible to apply for the employment authorisation document, nevertheless there is a lot of enthusiasm among the Indian community in the US after the change in the H-4 visa rules, which was announced by the US government in February 2015.
(The Economic Times, 13.07.2015) Almost 30000 Workers Supported by the European Globalisation Adjustment Fund during 2013 and 2014 - During 2013-14, the European Globalisation Adjustment Fund (EGF) helped a total of 27610 workers, who had been dismissed due to the economic crisis and the effects of globalisation, to find new job opportunities. A report adopted shows that, during this period, the EGF provided more than €114.4 million to assist workers in 13 Member States (Austria, Belgium, Denmark, Finland, France, Germany, Greece, Ireland, Italy, the Netherlands, Poland, Romania and Spain) in their transition and towards new job opportunities. The EGF funding was matched by another €94.1 million from national resources. European Commissioner for Employment, Social Affairs, Skills and Labour Mobility Marianne Thyssen said: "During times when public resources are limited, the EGF has been providing welcome support to workers made redundant in mass lay-offs caused by globalisation or the crisis. Through personalised and targeted assistance we have supported the transition of some of the most vulnerable workers into new jobs, leading to an encouraging re-employment rate of almost 50%". The EGF report gives an overview of applications for support measures made in 2013-2014 and also includes results from a number of cases for which final reports were received in 2013-2014. It shows that half the workers (7,656 out of 15,245) who participated in the EGF measures found new jobs or became self-employed. An additional 667 people were at that time in education or training to increase their future employability. Member States reported that the personal situation, employability and self-confidence of the workers concerned had visibly improved thanks to the EGF assistance and services.
(EU News, 22.07.2015) U.S. Labour Costs Rise at Slowest Pace in Three Decades - U.S. labour costs rose at the slowest pace in at least three decades in the spring, a sign of persistently sluggish wage growth that could weigh on the Federal Reserve‘s decision to raise short-term interest rates. The employment-cost index, a broad measure of workers‘ wages and benefits, climbed a seasonally adjusted 0.2% in the second quarter from the first quarter, the Labor Department said. That marked the smallest quarterly gain since record keeping began in 1982. Economists surveyed by The Wall Street Journal expected a 0.6% increase. Civilian worker wages and salaries, reflecting more than two-thirds of employment costs, grew 0.2% in April through June, also the smallest gain on record. Benefits climbed 0.1%. Compensation costs can ebb and flow from quarter to quarter. Over a broader period, wages and benefits are growing modestly. Total compensation grew 2.0% in the second quarter compared to a year earlier. That was a slower pace than the 2.6% year over year growth in the winter. The latest figures came after months of tentative signs that workers‘ wages were finally picking up from years of tepid growth. The report suggests slack remains in the labour market despite a long stretch of hiring and a sharp drop in unemployment. Another measure of wages, gleaned from the Labor Department‘s monthly jobs report, has disappointed recently. The average hourly earnings of private-sector workers-which exclude benefits - rose a modest 2% in the year through June.
(The Wall Street Journal, 31.07.2015)
Indian Labour Journal, September 2015
964
LABOUR DECISION
If employer shows that the financial arrangement made for the family subsequent to the
death of the employee is adequate, compassionate appointment may be refused - In this
case, the father of the respondent died while in service after completing more than 28 years of
service as an Assistant Manager in the State Bank of India. The respondent applied for a job on
compassionate basis and his application was turned down by the Bank which led to the writ
petition. The writ petition was allowed by the learned Single Judge and the appeal of the Bank
therefrom was dismissed by a Division Bench of the High Court of Allahabad. Hence this appeal
by special leave. It was submitted by learned senior counsel appearing for appellants that earlier
in the year 1979 there was a different scheme which was prevalent in the matter of
compassionate appointment. In view of the apex Court‘s 1994 judgment in Umesh Kumar
Nagpal vs. State of Haryana & Ors., the Bank framed new policy in the year 1998 wherein it was
stated that when the Bank is satisfied that the financial condition of the family is such that it
requires employment that compassionate appointment will be offered. In the present case, all
relevant factors were considered. It was noticed that the salary of the deceased at the time of his
death was Rs.8,970/-. His family was given an amount of Rs.5,98,092/- plus 0.25 lakh as
terminal benefits. If the said amount was to be invested properly, it would get interest at least of
Rs.5,000/- p.m. This was apart from the family pension of Rs.4208+Admissible D.A. The Bank,
therefore, took the view that the circumstances do not warrant the compassionate appointment
for the respondent which was applied for. On the other hand, learned counsel appearing for the
respondent, submitted that this was a hard case, and the deceased has left behind a large family.
Apart from the widow, he had two sons and five daughters and three of them were unmarried.
Considering this fact it was expected that the Bank should provide appointment to one of the
members of the family when the main bread earner had passed away. After hearing both the
parties, the apex Court observed that in all the matters of compassionate appointment it must be
noticed that it is basically a way out for the family which is financially in difficulties on account
of the death of the bread earner. It is not an avenue for a regular employment as such. This is in
fact an exception to the provisions under Article 16 of the Constitution. That being so, if an
employer points out that the financial arrangement made for the family subsequent to the death
of the employee is adequate, the members of the family cannot insist that one of them ought to
be provided a comparable appointment. This being the principle which has been adopted all
throughout, hence it is difficult for the apex Court to accept the submission made on behalf of
the respondent. In the present case, the Bank has made appropriate financial provision.
Therefore, the appeal was allowed and the judgment rendered by the learned Single Judge as
well as by the Division Bench was set aside.
(State Bank of India & Ors. Vs. Surya Narain Tripathi, All India Services Law Journal, Volume-
118, Part-II, February, 2015, pp.139-142)

Indian Labour Journal, September 2015
965
LABOUR LITERATURE
IMPORTANT ARTICLES OF LABOUR INTEREST PUBLISHED IN THE PERIODICALS
AND NEWSPAPERS RECEIVED IN THE LABOUR BUREAU
EMPLOYMENT AND
UNEMPLOYMENT
Bhagirathi Panda National Rural Employment Guarantee Scheme: Development Practice at the Crossroads; Economic & Political Weekly, Vol. L, No. 23, June 6, 2015; pp. 126-131.
INDUSTRIAL RELATIONS
Debi S. Saini Indian Industrial Relations Law: Case for Reform; The Indian Journal of Industrial Relations, Vol.50, No.1, July, 2014; pp. 118-132.
LABOUR LAWS AND REGULATIONS
J.S.Sodhi Labour Law Reform in India; The Indian Journal of Industrial Relations, Vol.50, No.1, July, 2014; pp. 100-117.
Martha Alter Chen, Roopa Madhav & Kamala Sankaran
Legal Reforms for the Self-Employed: Three Urban Cases; ibid. pp. 133-150.
LABOUR MARKET
Anamitra ROYCHOWDHURY The Labour Market Flexibility Debate in India: Re-examining the Case for Signing Voluntary Contracts; International Labour Review, Vol. 153, September 2014/3, pp. 473-487.
Achin Chakraborty Reforming Labour Markets in States: Revisiting the Futility Thesis; Economic & Political Weekly, Vol. L, No.20, May 16, 2015; pp. 52-57.
Zakir Husain, Mousumi Dutta Grandparental Childcare and Labour Market Participation of Mothers in India; Economic & Political Weekly, Vol. L, No. 21, May 23, 2015; pp.74-82.
Yasuo Dan The Development of New Businesses and Quasi-Internal Labor Markets in Japanese Firms; Japan Labor Review, Vol. 12, No.2, Spring 2015; pp. 28-48.
Dinesh Narayanan Reforming Work Laws is Hard Labour; The Economic Times, dated 14
th July, 2015, p. 12.
Yoichi Shimada Labor Mobility and Employment Policy; Japan Labor Review, Vol. 12, No.2, Spring 2015; pp. 49-64.
MIGRATION
Ratnakar Tripathy Strategic Lives: When the Indian Knowledge Migrant Returns Home; Economic & Political Weekly, Vol. L, No. 24, June 13, 2015; pp.81-89.
TRADE UNION
Shashi Kant Prasad When Technology Trumps Labour: Trade Union Leadership and Banks; Economic &
Indian Labour Journal, September 2015
966
Political Weekly, Vol. L, No.20, May 16, 2015; pp. 84-89.
WAGES
Habibah TOLOS, Peijie WANG, Miao ZHANG and Rory SHAND
Retirement Systems and Pension Reform: A Malaysian Perspective; International Labour Review, Vol. 153, September 2014/3, pp. 489-502.
Ashima Goyal, Akash Kumar Baikar Psychology, Cyclicality or Social Programmes: Rural Wage and Inflation Dynamics in India; Economic & Political Weekly, Vol. L, No. 23, June 6, 2015; pp. 116-125.
Charan Singh, Kanchan Bharati, Ayanendu Sanyal
Ageing in India: Need for Universal Pension Scheme; Economic & Political Weekly, Vol. L, No.18, May 2, 2015; pp. 40-46.
MISCELLANEOUS
Debasish Nandy Child Rights of Families Engaged in Sugarcane Farming in Maharashtra; Artha Vijnana, Vol. LVI, No.2, June 2014; pp. 185-195.
Kunal Sen, Deb Kusum Das Where have All the Workers Gone? Puzzle of Declining Labour Intensity in Organised Indian Manufacturing; Economic & Political Weekly, Vol. L, No. 23, June 6, 2015; pp.108-115.
Naoko Shimazaki Support for Workers Displaced in the Decline of the Japanese Coal Industry: Formal and Informal Support; Japan Labor Review, Vol. 12, No.2, Spring 2015; pp. 6-27.
Renu Kohli Recharging Services Exports; The Financial Express, dated 1
st July, 2015; p. 8.
Nirvikar Singh Skilling India, Schooling India; The Financial Express, dated 28
th July, 2015; p. 8.
Once you start a working on something, don't be afraid of failure
and don't abandon it. People who work sincerely are the happiest."
-CHANAKYA
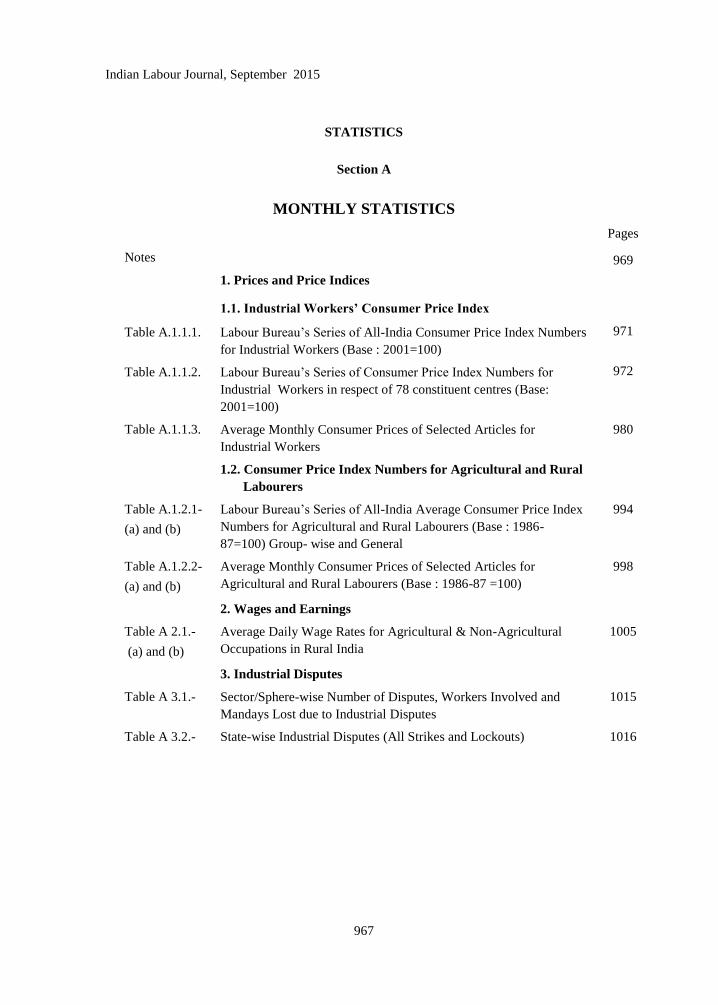
Indian Labour Journal, September 2015
967
STATISTICS
Section A
MONTHLY STATISTICS
Pages
Notes 969
1. Prices and Price Indices
1.1. Industrial Workers’ Consumer Price Index
Table A.1.1.1. Labour Bureau‘s Series of All-India Consumer Price Index Numbers
for Industrial Workers (Base : 2001=100)
971
Table A.1.1.2. Labour Bureau‘s Series of Consumer Price Index Numbers for
Industrial Workers in respect of 78 constituent centres (Base:
2001=100)
972
Table A.1.1.3. Average Monthly Consumer Prices of Selected Articles for
Industrial Workers
980
1.2. Consumer Price Index Numbers for Agricultural and Rural
Labourers
Table A.1.2.1-
(a) and (b)
Labour Bureau‘s Series of All-India Average Consumer Price Index
Numbers for Agricultural and Rural Labourers (Base : 1986-
87=100) Group- wise and General
994
Table A.1.2.2-
(a) and (b)
Average Monthly Consumer Prices of Selected Articles for
Agricultural and Rural Labourers (Base : 1986-87 =100)
998
2. Wages and Earnings
Table A 2.1.-
(a) and (b)
Average Daily Wage Rates for Agricultural & Non-Agricultural
Occupations in Rural India
1005
3. Industrial Disputes
Table A 3.1.- Sector/Sphere-wise Number of Disputes, Workers Involved and
Mandays Lost due to Industrial Disputes
1015
Table A 3.2.- State-wise Industrial Disputes (All Strikes and Lockouts) 1016

Indian Labour Journal, September 2015
968
Section B
SERIAL STATISTICS
Pages
Notes 1017
1. Prices and Price Indices
1.1. Industrial Workers Consumer Price Index
Table B.1.1.1 All India Average Consumer Price Index Numbers for Industrial
Workers (Base 2001=100)
1019
Table B.1.1.2 Labour Bureau‘s Series of Consumer Price Index Numbers for
Industrials Workers (Base : 2001=100)
1020
1.2. Agricultural Labourers Consumer Price Index
Table B. 1.2.1
(a) and (b)
All-India Average Consumer Price Index Numbers for
Agricultural Labourers (General & Food) (Base 1986-87=100)
1031
Table B.1.2.2
(a) and (b)
Labour Bureau‘s Series of Consumer Price Index Numbers for
Agricultural Labourers (General Index on Base : 1986-87=100)
1033
1.3. Consumer Price Index for Urban and Rural Areas
Table B. 1.3. All India Consumer Price Index Numbers for Urban Non-Manual
Employees/Cunsumer Price Index for Urban and Rural Areas
1039
1.4. Wholesale Price Index
Table B.1.4. All-India Index Numbers of Wholesale Prices- New Series 1040
2. Wages And Earnings
Table B.2.1. Earnings (Basic Wage and Dearness Allowances) of the Lowest-
Paid Workers/Operatives in Cotton Textile Mills
1043
3. Industrial Disputes
Table B. 3.1. Industrial Disputes (All Strikes and Lockouts) 1045

Indian Labour Journal, September 2015
969
SECTION A
MONTHLY STATISTICS
N o t e s
1. Prices and Price Indices
1. 1. Industrial Workers Consumer Price Index
A.1.1.1. Labour Bureau’s Series of All India Consumer Price Index Numbers for Industrial Workers (Base: 2001=100) – The All-India Consumer Price Index Numbers for Industrial Workers on Base : 2001=100 General and Group-wise along with Linking Factors with previous base: 1982=100 are presented in Table A.1.1.1. The All India Index is a weighted average of 78 constituent centre Indices compiled by the Labour Bureau. The current series of the Index Numbers has been introduced with effect from January, 2006 index replacing the series on base: 1982=100. The All India General Index as well as Group Indices for previous series on base: 1982=100 can be obtained by multiplying the current series indices by the respective Linking Factors. A note on the scope and methods of construction of these index numbers was published in April 2006 issue of the ―Indian Labour Journal‖. The All India Consumer Price Index Number for the month of June, 2015 stood at 261 with an increase of 3 point compared to previous month.
A.1.1.2. Labour Bureau’s Series of Consumer Price Index Numbers for Industrial Workers in respect of 78 constituent centres on Base: 2001=100 – The Consumer Price Index Numbers for industrial workers on Base: 2001=100 for 78 centres compiled by the Labour Bureau are presented group wise in Table A.1.1.2 for the months of May, 2015 and June, 2015.
The Index Numbers measure the extent to which the overall levels of retail prices of goods and services consumed by Industrial Workers has changed when compared with the base period viz., 2001=100. As compared to the previous month the magnitude of rise/fall in the General Index varies from centre to centre. During June, 2015 Quilon reported the highest increase of 15 Points followed by Godavarikhani (9 Points) and Raniganj (7 Points). Among others, 6 Points increase was observed in 4 centres, 5 Points in 9 centres, 4 Points in 11 centres, 3 points in 8 centres, 2 points in 15 centres and 1 point in 11 centres. On the contrary, Ghaziabad centre recorded a maximum decrease of 2 points. Among others, 1 point decrease was observed in 6 centres. Rest of the 10 centres‘ indices remained stationary.
A 1.1.3. Average Monthly Consumer Prices of Selected Articles for Industrial Workers –
The average monthly consumer prices of selected articles based on individual quotations obtained from the selected outlets which are utilised in the compilation of Consumer Price Index Numbers (Base: 2001=100) for Industrial Workers for 78 centres for the month of June, 2015 are set out in Table A.1.1.3. The prices reported in the table are averages of open markets prices of specified varieties of an item prevailing in the selected outlets in the selected market(s) in a given centre during the month in case of non-rationed items. So far as rationed items are concerned, the prices for the centres covered under informal rationing are the weighted average prices, the weights being the proportion of the quantity available through Public Distribution System and quantity procured from the open market in different centres in relation to base year requirements of an average family. In case of centres covered under Statutory Rationing the prices are average of the fair prices of variety (ies) of an item distributed through Fair Price Shops.
1.2 Consumer Price Index Numbers for Agricultural and Rural Labourers:
A.1.2.1 (a) and (b) Labour Bureau’s Series of Consumer Price Index Numbers for Agricultural and Rural Labourers on Base: 1986-87=100 - All-India Consumer Price Index Numbers for Agricultural and Rural Labourers on Base: 1986-87=100 replacing the earlier series on base 1960-61=100 were released with effect from November, 1995. The all-India index is a weighted average of 20 constituent State indices compiled by the Labour Bureau for Agricultural and Rural Labourers separately. A detailed note on the scope and method of construction of these indices was published in February, 1996 issue of the Indian Labour Journal.
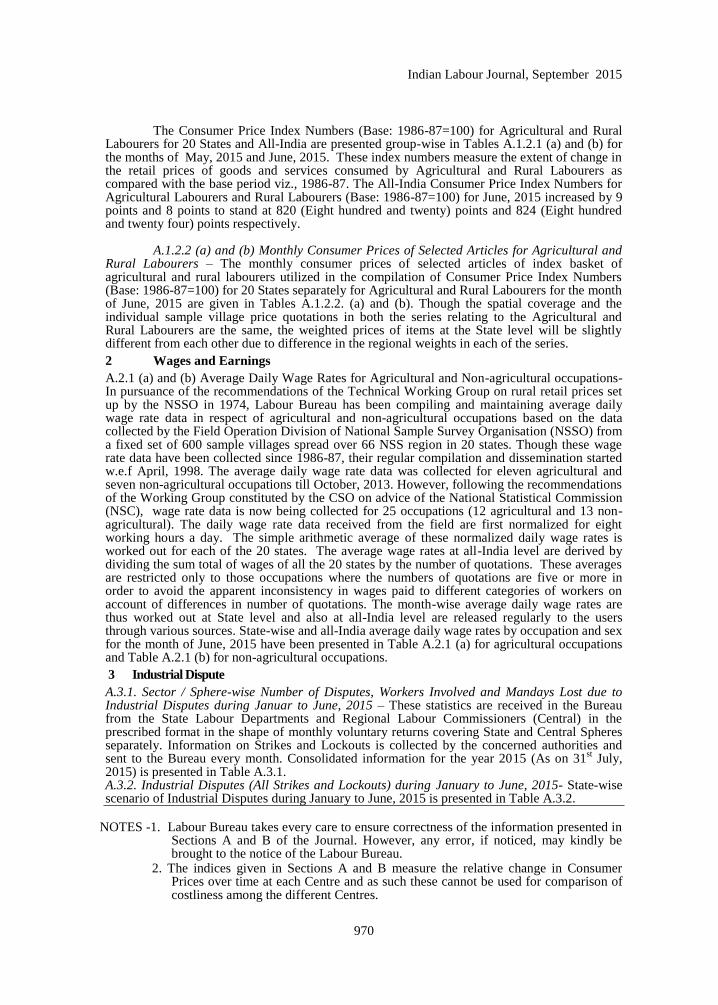
Indian Labour Journal, September 2015
970
The Consumer Price Index Numbers (Base: 1986-87=100) for Agricultural and Rural Labourers for 20 States and All-India are presented group-wise in Tables A.1.2.1 (a) and (b) for the months of May, 2015 and June, 2015. These index numbers measure the extent of change in the retail prices of goods and services consumed by Agricultural and Rural Labourers as compared with the base period viz., 1986-87. The All-India Consumer Price Index Numbers for Agricultural Labourers and Rural Labourers (Base: 1986-87=100) for June, 2015 increased by 9 points and 8 points to stand at 820 (Eight hundred and twenty) points and 824 (Eight hundred and twenty four) points respectively.
A.1.2.2 (a) and (b) Monthly Consumer Prices of Selected Articles for Agricultural and Rural Labourers – The monthly consumer prices of selected articles of index basket of agricultural and rural labourers utilized in the compilation of Consumer Price Index Numbers (Base: 1986-87=100) for 20 States separately for Agricultural and Rural Labourers for the month of June, 2015 are given in Tables A.1.2.2. (a) and (b). Though the spatial coverage and the individual sample village price quotations in both the series relating to the Agricultural and Rural Labourers are the same, the weighted prices of items at the State level will be slightly different from each other due to difference in the regional weights in each of the series. 2 Wages and Earnings
A.2.1 (a) and (b) Average Daily Wage Rates for Agricultural and Non-agricultural occupations- In pursuance of the recommendations of the Technical Working Group on rural retail prices set up by the NSSO in 1974, Labour Bureau has been compiling and maintaining average daily wage rate data in respect of agricultural and non-agricultural occupations based on the data collected by the Field Operation Division of National Sample Survey Organisation (NSSO) from a fixed set of 600 sample villages spread over 66 NSS region in 20 states. Though these wage rate data have been collected since 1986-87, their regular compilation and dissemination started w.e.f April, 1998. The average daily wage rate data was collected for eleven agricultural and seven non-agricultural occupations till October, 2013. However, following the recommendations of the Working Group constituted by the CSO on advice of the National Statistical Commission (NSC), wage rate data is now being collected for 25 occupations (12 agricultural and 13 non-agricultural). The daily wage rate data received from the field are first normalized for eight working hours a day. The simple arithmetic average of these normalized daily wage rates is worked out for each of the 20 states. The average wage rates at all-India level are derived by dividing the sum total of wages of all the 20 states by the number of quotations. These averages are restricted only to those occupations where the numbers of quotations are five or more in order to avoid the apparent inconsistency in wages paid to different categories of workers on account of differences in number of quotations. The month-wise average daily wage rates are thus worked out at State level and also at all-India level are released regularly to the users through various sources. State-wise and all-India average daily wage rates by occupation and sex for the month of June, 2015 have been presented in Table A.2.1 (a) for agricultural occupations and Table A.2.1 (b) for non-agricultural occupations.
3 Industrial Dispute
A.3.1. Sector / Sphere-wise Number of Disputes, Workers Involved and Mandays Lost due to Industrial Disputes during Januar to June, 2015 – These statistics are received in the Bureau from the State Labour Departments and Regional Labour Commissioners (Central) in the prescribed format in the shape of monthly voluntary returns covering State and Central Spheres separately. Information on Strikes and Lockouts is collected by the concerned authorities and sent to the Bureau every month. Consolidated information for the year 2015 (As on 31
st July,
2015) is presented in Table A.3.1. A.3.2. Industrial Disputes (All Strikes and Lockouts) during January to June, 2015- State-wise scenario of Industrial Disputes during January to June, 2015 is presented in Table A.3.2.
NOTES -1. Labour Bureau takes every care to ensure correctness of the information presented in
Sections A and B of the Journal. However, any error, if noticed, may kindly be brought to the notice of the Labour Bureau.
2. The indices given in Sections A and B measure the relative change in Consumer Prices over time at each Centre and as such these cannot be used for comparison of costliness among the different Centres.
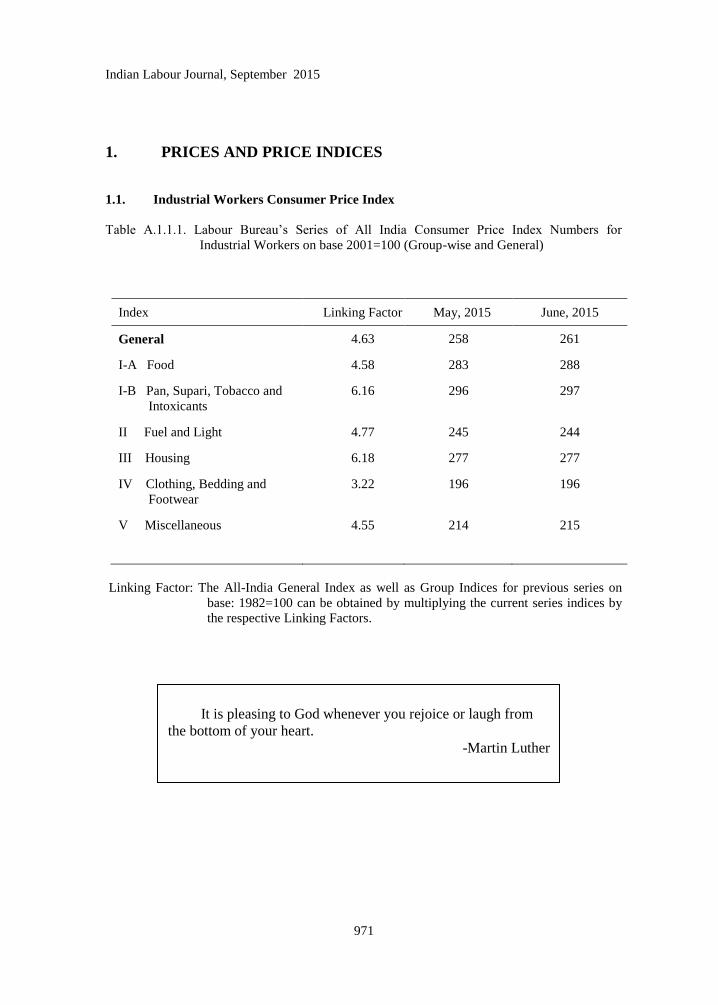
Indian Labour Journal, September 2015
971
1. PRICES AND PRICE INDICES
1.1. Industrial Workers Consumer Price Index
Table A.1.1.1. Labour Bureau‘s Series of All India Consumer Price Index Numbers for
Industrial Workers on base 2001=100 (Group-wise and General)
Index Linking Factor May, 2015 June, 2015
General 4.63 258 261
I-A Food 4.58 283 288
I-B Pan, Supari, Tobacco and
Intoxicants
6.16 296 297
II Fuel and Light 4.77 245 244
III Housing 6.18 277 277
IV Clothing, Bedding and
Footwear
3.22 196 196
V Miscellaneous 4.55 214 215
Linking Factor: The All-India General Index as well as Group Indices for previous series on
base: 1982=100 can be obtained by multiplying the current series indices by
the respective Linking Factors.
It is pleasing to God whenever you rejoice or laugh from
the bottom of your heart.
-Martin Luther

Indian Labour Journal, September 2015
972
Table A.1.1.2 – Labour Bureau‘s Series of Consumer Price Index Numbers for Industrial
Sl.
No
State/Union
Territory/ Centre
Linking factor for
General Index with
previous base
1982=100
General Index Food Index
May,
2015
June,
2015
May,
2015
June,
2015
1 2 3 4 5 6 7
ANDHRA PRADESH
1 Guntur 4.57 256 257 276 277
2 Vijayawada N 246 252 282 295
3 Visakhapatnam 4.64 260 264 298 307
ASSAM
4 Doom-Dooma
Tinsukia
4.04 229 234 226 235
5 Guwahati 4.80 219 224 226 238
6 Labac-Silchar 3.65 241 246 256 264
7 Mariani-Jorhat 4.01 227 228 235 239
8 Rangapara-Tezpur 4.17 222 227 243 251
BIHAR
9 Munger-Jamalpur 4.30 269 271 278 278
CHANDIGARH
10 Chandigarh 5.26 254 253 274 272
CHHATTISGARH
11 Bhilai 4.20 287 288 288 290
DELHI
12 Delhi 5.60 232 232 264 262
GOA
13 Goa 5.59 282 282 341 339
GUJARAT
14 Ahmedabad 4.62 247 250 278 283
15 Bhavnagar 4.76 240 240 252 253
16 Rajkot 4.38 248 247 275 274
17 Surat 4.54 235 237 268 271
18 Vadodra 4.39 241 243 270 275

Indian Labour Journal, September 2015
973
Workers (Group-wise & General 2001=100)
Pan. Supari,
Tobacco and
Intoxicants Index
Fuel & Light
Index
Housing Index Clothing, Bedding
& Footwear Index
Misc. Index
May,
2015
June,
2015
May,
2015
June,
2015
May,
2015
June,
2015
May,
2015
June,
2015
May,
2015
June,
2015
8 9 10 11 12 13 14 15 16 17
325 325 323 323 194 194 185 185 216 218
300 300 167 168 226 226 211 211 205 206
243 243 160 160 340 340 231 231 204 204
266 249 173 173 307 307 198 197 217 217
257 257 203 204 195 195 230 230 224 225
260 249 220 220 180 180 193 193 230 230
254 235 254 245 157 157 168 177 236 236
189 186 160 160 154 154 264 264 213 216
292 317 279 289 306 306 205 206 252 259
247 247 232 234 322 322 218 218 174 175
268 268 218 219 528 528 167 167 213 214
254 254 211 211 209 209 208 209 202 202
211 211 197 197 281 281 221 227 221 222
421 425 177 178 208 208 178 178 246 246
253 253 166 166 259 259 196 196 215 217
309 309 171 171 255 255 166 166 209 210
422 422 166 165 223 223 154 154 219 220
360 355 182 182 239 239 156 156 222 223

Indian Labour Journal, September 2015
974
Table A.1.1.2. Contd.
Sl.
No
State/Union Territory /
Centre
Linking factor for
General Index with
previous base
1982=100
General Index Food Index
May,
2015
June,
2015
May,
2015
June,
2015
1 2 3 4 5 6 7
HARYANA
19 Faridabad 4.79 237 236 279 278
20 Yamunanagar 4.34 245 246 282 283
HIMACHAL PRADESH
21 Himachal Pradesh 4.53 229 230 251 252
JAMMU & KASHMIR
22 Srinagar 5.62 232 232 245 245
JHARKHAND
23 Bokaro N 269 270 274 276
24 Giridih N 287 286 279 276
25 Jamshedpur 4.23 277 283 245 258
26 Jharia 3.72 283 286 264 268
27 Kodarma 3.89 287 291 268 276
28 Ranchi-Hatia 4.20 292 295 265 272
KARNATAKA
29 Bangalore 4.51 265 269 307 311
30 Belgaum 5.02 266 270 301 308
31 Hubli-Dharwar 4.71 279 281 286 290
32 Mercara 4.47 268 271 293 298
33 Mysore N 265 268 294 301
KERALA
34 Ernakulam 4.52 263 264 313 317
35 Mundakayam 4.37 273 275 299 304
36 Quilon 4.61 273 288 299 327
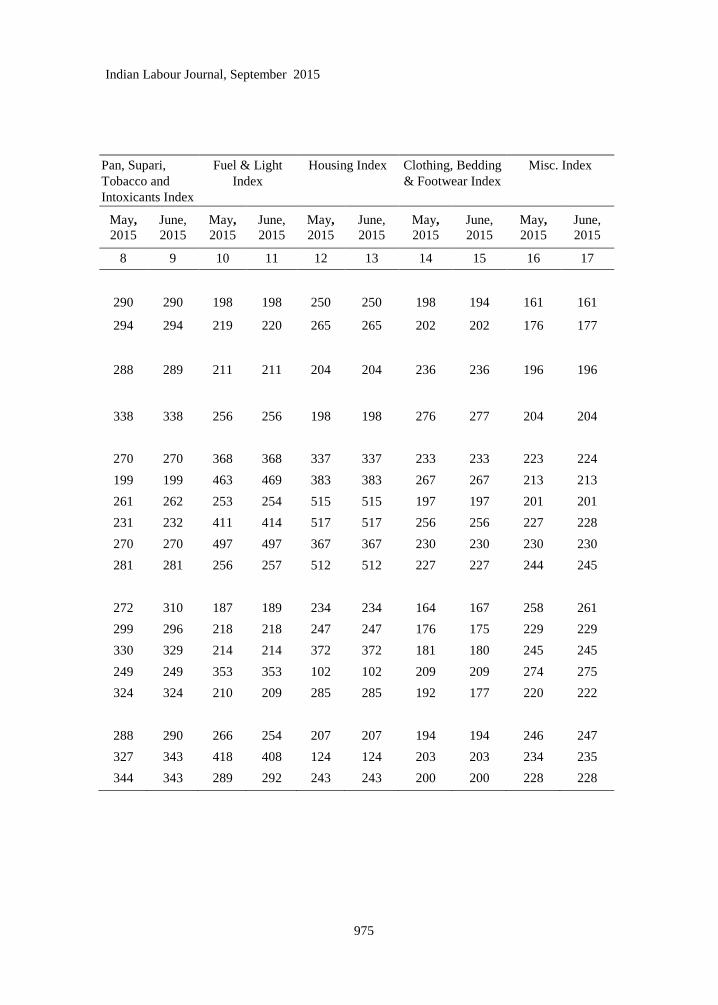
Indian Labour Journal, September 2015
975
Pan, Supari,
Tobacco and
Intoxicants Index
Fuel & Light
Index
Housing Index Clothing, Bedding
& Footwear Index
Misc. Index
May,
2015
June,
2015
May,
2015
June,
2015
May,
2015
June,
2015
May,
2015
June,
2015
May,
2015
June,
2015
8 9 10 11 12 13 14 15 16 17
290 290 198 198 250 250 198 194 161 161
294 294 219 220 265 265 202 202 176 177
288 289 211 211 204 204 236 236 196 196
338 338 256 256 198 198 276 277 204 204
270 270 368 368 337 337 233 233 223 224
199 199 463 469 383 383 267 267 213 213
261 262 253 254 515 515 197 197 201 201
231 232 411 414 517 517 256 256 227 228
270 270 497 497 367 367 230 230 230 230
281 281 256 257 512 512 227 227 244 245
272 310 187 189 234 234 164 167 258 261
299 296 218 218 247 247 176 175 229 229
330 329 214 214 372 372 181 180 245 245
249 249 353 353 102 102 209 209 274 275
324 324 210 209 285 285 192 177 220 222
288 290 266 254 207 207 194 194 246 247
327 343 418 408 124 124 203 203 234 235
344 343 289 292 243 243 200 200 228 228
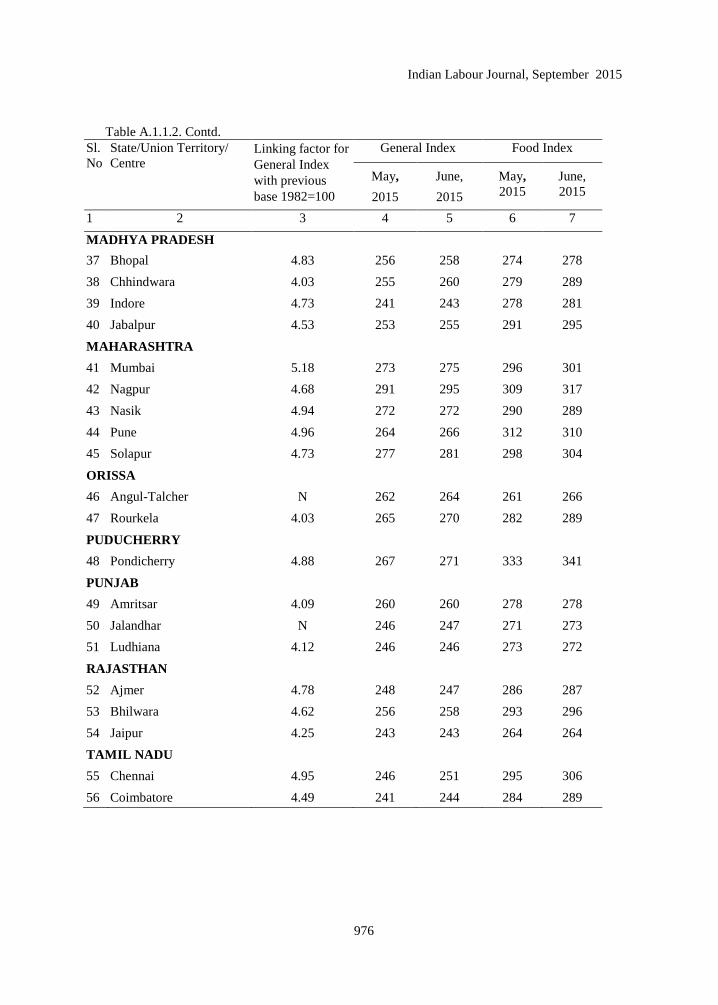
Indian Labour Journal, September 2015
976
Table A.1.1.2. Contd.
Sl.
No
State/Union Territory/
Centre Linking factor for
General Index
with previous
base 1982=100
General Index Food Index
May,
2015
June,
2015
May,
2015
June,
2015
1 2 3 4 5 6 7
MADHYA PRADESH
37 Bhopal 4.83 256 258 274 278
38 Chhindwara 4.03 255 260 279 289
39 Indore 4.73 241 243 278 281
40 Jabalpur 4.53 253 255 291 295
MAHARASHTRA
41 Mumbai 5.18 273 275 296 301
42 Nagpur 4.68 291 295 309 317
43 Nasik 4.94 272 272 290 289
44 Pune 4.96 264 266 312 310
45 Solapur 4.73 277 281 298 304
ORISSA
46 Angul-Talcher N 262 264 261 266
47 Rourkela 4.03 265 270 282 289
PUDUCHERRY
48 Pondicherry 4.88 267 271 333 341
PUNJAB
49 Amritsar 4.09 260 260 278 278
50 Jalandhar N 246 247 271 273
51 Ludhiana 4.12 246 246 273 272
RAJASTHAN
52 Ajmer 4.78 248 247 286 287
53 Bhilwara 4.62 256 258 293 296
54 Jaipur 4.25 243 243 264 264
TAMIL NADU
55 Chennai 4.95 246 251 295 306
56 Coimbatore 4.49 241 244 284 289

Indian Labour Journal, September 2015
977
Pan, Supari,
Tobacco and
Intoxicants Index
Fuel & Light
Index
Housing Index Clothing, Bedding
& Footwear Index
Misc. Index
May,
2015
June,
2015
May,
2015
June,
2015
May,
2015
June,
2015
May,
2015
June,
2015
May,
2015
June,
2015
8 9 10 11 12 13 14 15 16 17
308 308 221 221 310 310 165 165 213 214
283 288 374 374 216 216 174 175 201 202
354 354 222 221 183 183 154 154 233 235
347 356 231 228 309 309 132 132 207 208
316 318 304 296 264 264 196 196 237 238
334 331 234 239 399 399 195 195 209 209
300 300 228 232 346 346 194 194 211 212
301 311 223 228 222 222 226 226 238 244
326 340 285 289 281 281 213 213 227 227
341 341 248 248 414 414 180 181 194 196
241 243 227 228 368 368 199 204 183 186
280 279 290 289 173 173 179 179 227 229
288 288 246 247 320 320 200 200 193 195
297 302 253 253 241 241 206 205 215 215
274 276 231 231 212 212 237 239 223 224
335 335 223 218 263 263 188 188 201 202
305 310 271 270 194 194 168 169 217 218
295 302 186 185 239 239 193 193 225 228
403 403 189 189 200 200 173 173 210 211
334 333 190 190 190 190 176 176 217 220

Indian Labour Journal, September 2015
978
Table A.1.1.2. Concld.
Sl.
No
State/Union Territory
Centre
Linking factor for
General Index
with previous
base 1982=100
General Index Food Index
May,
2015
June,
2015
May,
2015
June,
2015
1 2 3 4 5 6 7
57 Coonoor 4.58 261 263 293 298
58 Madurai 4.51 261 260 322 321
59 Salem 4.45 248 252 278 285
60 Tiruchirapally 5.01 258 258 304 303
TELEGANA
61 Godavarikhani N 269 278 298 316
62 Hyderabad 4.79 226 229 279 286
63 Warrangal 4.75 266 272 317 329
TRIPURA
64 Tripura 4.17 223 223 232 233
UTTAR PRADESH
65 Agra 4.36 263 267 264 271
66 Ghaziabad 4.78 254 252 272 269
67 Kanpur 4.50 264 265 291 294
68 Lucknow N 256 261 287 296
69 Varanasi 4.96 259 262 289 294
WEST BENGAL
70 Asansol 4.37 287 288 275 278
71 Darjeeling 3.80 231 237 250 259
72 Durgapur 5.13 284 286 253 257
73 Haldia 5.64 263 268 248 259
74 Howrah 5.42 237 238 269 270
75 Jalpaiguri 3.96 246 250 253 259
76 Kolkata 5.12 247 251 279 286
77 Raniganj 4.02 230 237 250 262
78 Siliguri N 236 238 258 263

Indian Labour Journal, September 2015
979
Pan, Supari,
Tobacco and
Intoxicants Index
Fuel & Light
Index
Housing Index Clothing, Bedding
& Footwear Index
Misc. Index
May,
2015
June,
2015
May,
2015
June,
2015
May,
2015
June,
2015
May,
2015
June,
2015
May,
2015
June,
2015
8 9 10 11 12 13 14 15 16 17
310 312 247 246 321 321 167 167 202 202
388 388 183 183 162 162 194 194 224 224
372 365 194 194 165 165 164 164 232 232
325 325 181 181 286 286 159 159 191 192
195 195 184 184 392 392 197 197 199 200
287 287 157 157 189 189 159 159 194 194
273 273 164 164 272 272 176 176 210 212
354 350 286 289 131 131 163 163 212 212
320 320 238 240 384 384 211 213 206 210
274 283 225 225 277 277 217 217 225 224
301 301 231 232 363 363 204 204 192 192
302 302 234 236 321 321 233 233 186 187
289 288 258 258 314 314 192 192 201 201
279 279 387 388 485 485 222 222 197 197
202 203 309 309 108 108 205 205 196 197
284 284 242 242 688 688 217 217 198 198
329 329 222 224 362 362 192 193 165 169
349 350 255 255 211 211 194 197 177 177
240 238 373 375 104 104 222 222 229 229
333 334 244 244 199 199 216 216 205 205
230 231 258 260 229 229 188 189 174 175
195 195 303 298 103 103 182 183 216 216
N- New Centre in the New Series on base: 2001=100.

Indian Labour Journal, September 2015
980
Table A.1.1.3 - Average Monthly Consumer Prices of Selected Articles for Industrial Workers,
June, 2015
Sl.
No
Article Unit Guntur Vijaya-
wada
Vishakha
-patnam
Doom
Dooma
Tinsukia
Guwa-
hati
Labac
Silchar
1 2 3 4 5 6 7 8 9
1 Rice Kg. 35.65 36.44 38.30 17.12 26.06 14.72
2 Wheat:
a. Wheat Whole Kg. - - 29.44 - - -
b. Wheat Atta Kg. 42.00 32.50 45.00 5.21 25.80 5.36
3 Jowar Kg. - - - - - -
4 Arhar Dal Kg. 110.00 104.88 120.50 104.25 110.00 110.00
5 Moong Dal Kg. - 107.00 129.32 120.00 111.00 117.50
6 Masur Dal Kg. - - - 95.00 92.88 105.00
7 Groundnut oil Litre 105.41 95.25 114.36 - - -
8 Mustard Oil Litre - - - 113.13 114.63 115.00
9 Vanaspati Litre - - 72.50 100.00 107.50 -
10 Goat Meat/Mutton Kg. 460.00 480.00 500.00 360.00 380.00 400.00
11 Fish Fresh Kg. 125.00 110.00 120.00 200.00 155.00 298.75
12 Milk Litre 48.00 41.00 43.50 35.00 45.00 47.50
13 Dairy Milk Litre 42.00 42.00 44.00 - - -
14 Pure Ghee Litre 409.99 440.00 350.35 - - -
15 Onion Kg. 27.75 26.63 29.07 30.75 30.00 32.50
16 Chillies Dry 100 gms. 10.45 15.75 11.75 16.00 16.00 15.00
17 Sugar Kg. 30.79 30.93 33.47 34.00 31.63 35.00
18 Gur Kg. - 44.50 41.44 50.00 - 62.50
19 Tea Leaf 100gms 45.50 42.00 45.75 18.00 25.00 26.40
20 Fire Wood 40 Kg. 400.00 452.00 280.00 120.00 180.00 187.50
21 Soft Coke 40 Kg. - - - - - -
22 Kerosene Oil Litre 15.00 15.00 15.00 16.00 15.00 15.00
23 Toilet Soap 75gms. 18.00 14.55 18.00 15.00 12.72 14.40
24 Washing Soap 225 gms. 14.63 14.85 14.51 26.10 26.10 14.06
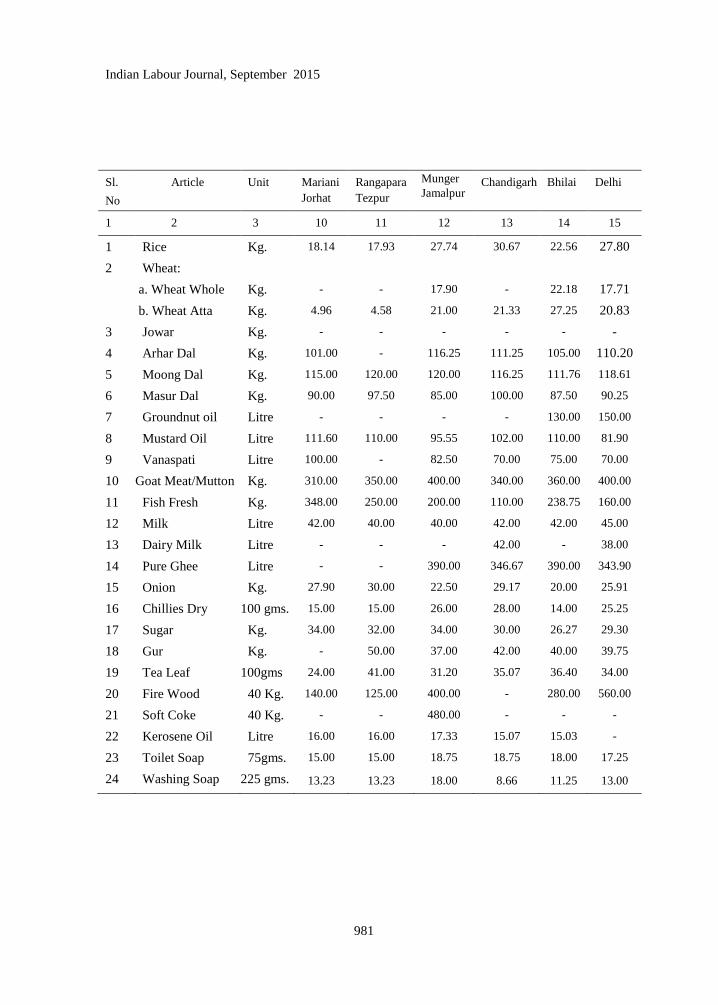
Indian Labour Journal, September 2015
981
Sl.
No
Article Unit Mariani
Jorhat
Rangapara
Tezpur
Munger
Jamalpur Chandigarh
Bhilai Delhi
1 2 3 10 11 12 13 14 15
1 Rice Kg. 18.14 17.93 27.74 30.67 22.56 27.80
2 Wheat:
a. Wheat Whole Kg. - - 17.90 - 22.18 17.71
b. Wheat Atta Kg. 4.96 4.58 21.00 21.33 27.25 20.83
3 Jowar Kg. - - - - - -
4 Arhar Dal Kg. 101.00 - 116.25 111.25 105.00 110.20
5 Moong Dal Kg. 115.00 120.00 120.00 116.25 111.76 118.61
6 Masur Dal Kg. 90.00 97.50 85.00 100.00 87.50 90.25
7 Groundnut oil Litre - - - - 130.00 150.00
8 Mustard Oil Litre 111.60 110.00 95.55 102.00 110.00 81.90
9 Vanaspati Litre 100.00 - 82.50 70.00 75.00 70.00
10 Goat Meat/Mutton Kg. 310.00 350.00 400.00 340.00 360.00 400.00
11 Fish Fresh Kg. 348.00 250.00 200.00 110.00 238.75 160.00
12 Milk Litre 42.00 40.00 40.00 42.00 42.00 45.00
13 Dairy Milk Litre - - - 42.00 - 38.00
14 Pure Ghee Litre - - 390.00 346.67 390.00 343.90
15 Onion Kg. 27.90 30.00 22.50 29.17 20.00 25.91
16 Chillies Dry 100 gms. 15.00 15.00 26.00 28.00 14.00 25.25
17 Sugar Kg. 34.00 32.00 34.00 30.00 26.27 29.30
18 Gur Kg. - 50.00 37.00 42.00 40.00 39.75
19 Tea Leaf 100gms 24.00 41.00 31.20 35.07 36.40 34.00
20 Fire Wood 40 Kg. 140.00 125.00 400.00 - 280.00 560.00
21 Soft Coke 40 Kg. - - 480.00 - - -
22 Kerosene Oil Litre 16.00 16.00 17.33 15.07 15.03 -
23 Toilet Soap 75gms. 15.00 15.00 18.75 18.75 18.00 17.25
24 Washing Soap 225 gms. 13.23 13.23 18.00 8.66 11.25 13.00

Indian Labour Journal, September 2015
982
Table A.1.1.3 contd...
Sl.
No
Article Unit Goa Ahmedabad Bhav-
nagar
Rajkot Surat Vadodara
1 2 3 16 17 18 19 20 21
1 Rice Kg. 26.37 30.43 29.09 31.88 32.51 30.41
2 Wheat:
a. Wheat Whole Kg. 23.88 22.91 18.41 20.82 21.47 19.22
b. Wheat Atta Kg. 25.40 24.12 32.50 30.00 24.30 26.67
3 Jowar Kg. 32.50 - - - 34.40 33.10
4 Arhar Dal Kg. 120.83 104.48 100.00 110.00 109.00 88.07
5 Moong Dal Kg. 125.50 100.00 120.00 100.00 104.00 100.00
6 Masur Dal Kg. 92.08 90.96 86.67 - 81.00 103.00
7 Groundnut oil Litre 140.00 100.10 110.00 115.00 104.65 104.77
8 Mustard Oil Litre 109.20 100.10 - 86.45 101.92 -
9 Vanaspati Litre 94.06 67.68 70.00 65.66 70.20 72.00
10 Goat Meat/Mutton Kg. 425.00 380.00 300.00 400.00 380.00 400.00
11 Fish Fresh Kg. 454.44 - 130.00 200.00 180.00 140.00
12 Milk Litre 43.67 44.88 52.00 42.00 47.80 44.00
13 Dairy Milk Litre 41.34 36.00 50.00 40.00 45.00 45.34
14 Pure Ghee Litre 398.33 380.00 385.01 322.79 410.00 415.00
15 Onion Kg. 29.94 26.80 30.00 22.00 30.00 22.00
16 Chillies Dry 100 gms. 19.67 25.00 25.00 25.00 25.00 23.07
17 Sugar Kg. 27.48 29.21 29.87 29.06 29.18 29.45
18 Gur Kg. 41.17 47.06 36.00 41.60 44.60 45.60
19 Tea Leaf 100gms 30.00 34.00 34.00 32.80 35.20 34.00
20 Fire Wood 40 Kg. 383.32 330.00 160.00 200.00 350.00 360.00
21 Soft Coke 40 Kg. - - - - - -
22 Kerosene Oil Litre 15.79 14.70 15.65 15.19 14.75 14.51
23 Toilet Soap 75gms. 18.00 18.75 18.00 18.00 18.00 18.00
24 Washing Soap 225 gms. 26.10 10.47 21.60 12.37 23.69 26.10
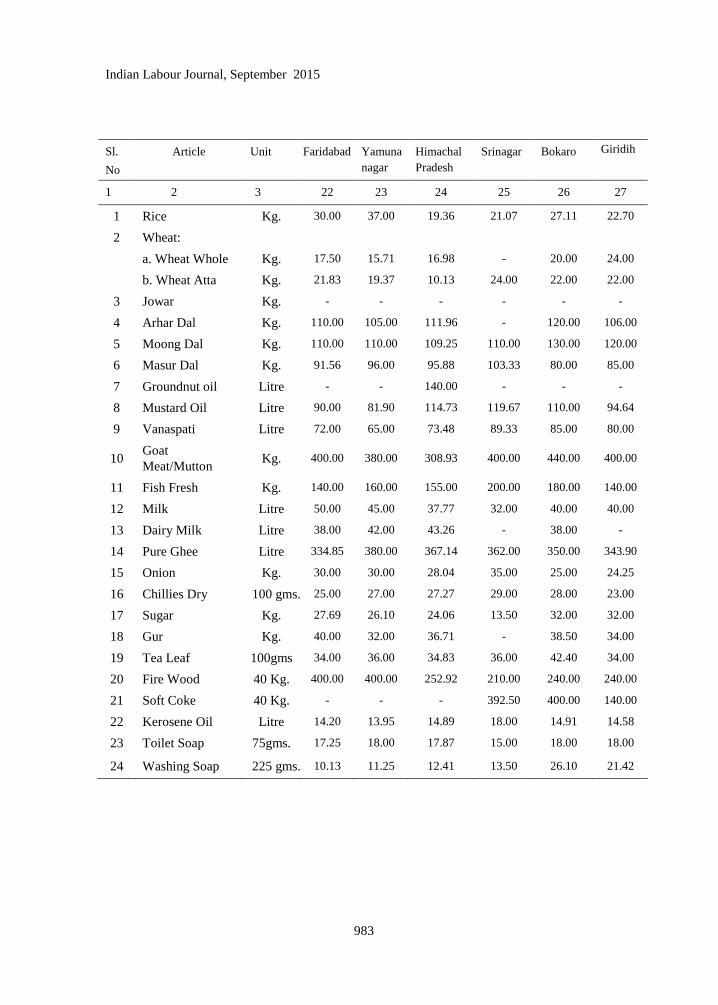
Indian Labour Journal, September 2015
983
Sl.
No
Article Unit Faridabad Yamuna
nagar
Himachal
Pradesh
Srinagar Bokaro Giridih
1 2 3 22 23 24 25 26 27
1 Rice Kg. 30.00 37.00 19.36 21.07 27.11 22.70
2 Wheat:
a. Wheat Whole Kg. 17.50 15.71 16.98 - 20.00 24.00
b. Wheat Atta Kg. 21.83 19.37 10.13 24.00 22.00 22.00
3 Jowar Kg. - - - - - -
4 Arhar Dal Kg. 110.00 105.00 111.96 - 120.00 106.00
5 Moong Dal Kg. 110.00 110.00 109.25 110.00 130.00 120.00
6 Masur Dal Kg. 91.56 96.00 95.88 103.33 80.00 85.00
7 Groundnut oil Litre - - 140.00 - - -
8 Mustard Oil Litre 90.00 81.90 114.73 119.67 110.00 94.64
9 Vanaspati Litre 72.00 65.00 73.48 89.33 85.00 80.00
10 Goat
Meat/Mutton Kg. 400.00 380.00 308.93 400.00 440.00 400.00
11 Fish Fresh Kg. 140.00 160.00 155.00 200.00 180.00 140.00
12 Milk Litre 50.00 45.00 37.77 32.00 40.00 40.00
13 Dairy Milk Litre 38.00 42.00 43.26 - 38.00 -
14 Pure Ghee Litre 334.85 380.00 367.14 362.00 350.00 343.90
15 Onion Kg. 30.00 30.00 28.04 35.00 25.00 24.25
16 Chillies Dry 100 gms. 25.00 27.00 27.27 29.00 28.00 23.00
17 Sugar Kg. 27.69 26.10 24.06 13.50 32.00 32.00
18 Gur Kg. 40.00 32.00 36.71 - 38.50 34.00
19 Tea Leaf 100gms 34.00 36.00 34.83 36.00 42.40 34.00
20 Fire Wood 40 Kg. 400.00 400.00 252.92 210.00 240.00 240.00
21 Soft Coke 40 Kg. - - - 392.50 400.00 140.00
22 Kerosene Oil Litre 14.20 13.95 14.89 18.00 14.91 14.58
23 Toilet Soap 75gms. 17.25 18.00 17.87 15.00 18.00 18.00
24 Washing Soap 225 gms. 10.13 11.25 12.41 13.50 26.10 21.42

Indian Labour Journal, September 2015
984
Table A.1.1.3 contd...
Sl.
No
Article Unit Jamshedpur Jharia Kodarma Ranchi
Hatia
Bengluru
1 2 3 28 29 30 31 32
1 Rice Kg. 22.97 22.96 18.33 23.85 41.57
2 Wheat:
a. Wheat Whole Kg. 21.06 20.50 18.00 27.00 30.08
b. Wheat Atta Kg. 23.06 21.50 22.00 22.08 27.15
3 Jowar Kg. - - - - -
4 Arhar Dal Kg. 112.50 105.00 110.25 114.83 116.25
5 Moong Dal Kg. 116.06 109.75 115.00 116.00 125.27
6 Masur Dal Kg. 89.00 83.65 90.00 90.00 -
7 Groundnut oil Litre 143.50 - - - 102.75
8 Mustard Oil Litre 105.88 94.41 98.96 110.00 -
9 Vanaspati Litre 70.00 76.00 80.00 80.00 72.58
10 Goat Meat/Mutton Kg. 409.38 396.00 380.00 385.00 412.50
11 Fish Fresh Kg. 151.25 140.00 140.00 130.00 149.17
12 Milk Litre 40.00 38.00 40.00 40.00 30.00
13 Dairy Milk Litre 38.00 - - 38.00 30.00
14 Pure Ghee Litre 343.90 325.80 395.00 350.00 371.34
15 Onion Kg. 25.94 23.50 26.50 25.08 30.90
16 Chillies Dry 100 gms. 26.00 25.00 16.00 29.00 14.35
17 Sugar Kg. 29.75 29.50 32.00 31.92 29.00
18 Gur Kg. 39.25 37.50 34.00 37.53 50.67
19 Tea Leaf 100gms 32.40 34.80 30.40 42.40 34.92
20 Fire Wood 40 Kg. 200.00 280.00 300.00 313.33 253.32
21 Soft Coke 40 Kg. 440.00 240.00 400.00 380.00 -
22 Kerosene Oil Litre 14.22 14.47 15.02 14.63 18.00
23 Toilet Soap 75gms. 18.00 18.00 14.40 18.00 17.94
24 Washing Soap 225 gms. 13.64 23.68 23.69 9.00 14.33

Indian Labour Journal, September 2015
985
Sl.
No
Article Unit Belgaum Hubli
Dharwar
Mercara Mysore Erna-
kulam
Munda-
kayam
1 2 3 33 34 35 36 37 38
1 Rice Kg. 32.27 32.69 29.78 40.04 25.89 29.80
2 Wheat:
a. Wheat Whole Kg. 28.65 28.14 30.63 33.60 73.19 7.95
b. Wheat Atta Kg. - - 45.13 34.50 36.00 33.42
3 Jowar Kg. 29.25 29.00 - - - -
4 Arhar Dal Kg. 113.13 109.50 102.50 122.00 115.75 108.58
5 Moong Dal Kg. 109.38 110.50 118.75 114.50 113.50 110.50
6 Masur Dal Kg. 88.75 82.00 - 95.22 - 78.88
7 Groundnut oil Litre 83.71 76.02 123.38 112.75 - -
8 Mustard Oil Litre - - - - - -
9 Vanaspati Litre 92.50 71.72 99.88 87.86 - -
10 Goat Meat/Mutton Kg. 380.00 406.25 362.50 380.00 465.00 438.33
11 Fish Fresh Kg. 160.00 130.00 146.25 140.00 200.00 169.17
12 Milk Litre 45.00 45.00 30.00 31.00 43.00 38.00
13 Dairy Milk Litre 30.00 31.06 - 30.00 38.00 -
14 Pure Ghee Litre 374.00 374.00 - 374.00 435.00 -
15 Onion Kg. 26.88 29.75 28.45 25.44 55.75 56.17
16 Chillies Dry 100 gms. 14.31 17.30 11.46 12.32 11.34 12.67
17 Sugar Kg. 26.00 26.88 29.52 28.22 28.13 27.69
18 Gur Kg. 34.50 34.50 43.97 45.00 49.25 50.58
19 Tea Leaf 100gms 35.00 25.00 35.00 35.00 31.00 30.00
20 Fire Wood 40 Kg. 280.00 300.00 160.00 240.00 240.00 216.00
21 Soft Coke 40 Kg. - - - - - -
22 Kerosene Oil Litre 18.00 18.00 18.00 18.00 17.00 17.00
23 Toilet Soap 75gms. 18.00 18.00 18.00 18.00 19.50 14.40
24 Washing Soap 225 gms. 14.40 8.03 14.40 16.20 14.40 17.25

Indian Labour Journal, September 2015
986
Table A.1.1.3 contd...
Sl.
No
Article Unit Quilon Bhopal Chhind-
wara
Indore Jabalpur Mum-
bai
1 2 3 39 40 41 42 43 44
1 Rice Kg. 27.85 30.53 24.96 24.50 24.30 46.28
2 Wheat:
a. Wheat Whole Kg. 6.36 20.71 19.93 26.16 22.03 29.59
b. Wheat Atta Kg. 36.00 21.00 20.00 20.00 21.20 -
3 Jowar Kg. - - - - - 37.86
4 Arhar Dal Kg. 73.50 113.00 103.00 110.70 116.00 115.27
5 Moong Dal Kg. 110.00 112.34 100.00 120.00 108.50 119.36
6 Masur Dal Kg. - 84.66 90.00 90.00 78.70 95.42
7 Groundnut oil Litre 116.00 125.00 148.00 102.33 150.00 126.01
8 Mustard Oil Litre - 108.33 118.00 91.00 100.00 107.21
9 Vanaspati Litre - 75.00 59.00 70.65 66.80 98.10
10 Goat Meat/Mutton Kg. 480.00 400.00 300.00 381.50 351.50 430.63
11 Fish Fresh Kg. 212.50 230.00 120.00 161.00 154.00 1000.00
12 Milk Litre 38.00 51.17 45.00 40.00 48.80 58.00
13 Dairy Milk Litre 38.00 46.00 44.00 32.00 36.00 34.00
14 Pure Ghee Litre - 380.00 364.00 360.00 362.18 394.22
15 Onion Kg. 46.38 21.67 24.75 25.00 19.75 28.16
16 Chillies Dry 100gms. 12.50 16.42 15.50 19.60 15.50 23.69
17 Sugar Kg. 29.56 28.59 25.91 23.79 26.80 30.72
18 Gur Kg. 50.00 32.58 26.25 39.70 31.18 56.70
19 Tea Leaf 100gms 30.00 34.80 35.20 36.00 34.00 40.80
20 Fire Wood 40 Kg. 200.00 313.33 280.00 240.00 204.75 -
21 Soft Coke 40 Kg. - - - - - -
22 Kerosene Oil Litre 17.00 15.92 16.56 15.19 15.30 15.46
23 Toilet Soap 75gms. 19.50 18.75 18.00 18.00 18.00 18.00
24 Washing Soap 225gms. 13.64 15.30 9.00 18.00 27.00 23.69

Indian Labour Journal, September 2015
987
Sl.
No
Article Unit Nagpur Nasik Pune Sholapur Angul-
Talcher
1 2 3 45 46 47 48 49
1 Rice Kg. 37.11 30.24 41.54 27.57 23.72
2 Wheat:
a. Wheat Whole Kg. 26.66 23.19 32.75 21.11 7.57
b. Wheat Atta Kg. 25.00 25.00 - 26.00 17.33
3 Jowar Kg. - 36.00 39.75 32.00 -
4 Arhar Dal Kg. 109.28 120.00 120.00 112.00 105.00
5 Moong Dal Kg. 122.55 120.00 122.50 110.00 105.00
6 Masur Dal Kg. 87.77 100.00 90.33 90.00 100.00
7 Groundnut oil Litre 101.72 118.30 130.00 76.44 160.00
8 Mustard Oil Litre 116.83 145.00 - - 93.28
9 Vanaspati Litre 85.08 80.73 84.54 80.00 85.00
10 Goat Meat/Mutton Kg. 400.00 410.00 406.67 400.00 400.00
11 Fish Fresh Kg. 167.00 600.00 758.33 150.00 160.00
12 Milk Litre 48.00 52.00 50.00 42.00 40.00
13 Dairy Milk Litre 39.00 42.00 32.00 50.00 -
14 Pure Ghee Litre 395.00 392.83 430.00 - 420.00
15 Onion Kg. 25.67 14.25 23.33 24.00 27.50
16 Chillies Dry 100 gms. 20.00 42.00 26.50 28.00 15.00
17 Sugar Kg. 27.24 29.93 24.78 25.60 32.00
18 Gur Kg. 50.55 41.50 48.67 34.00 36.00
19 Tea Leaf 100gms 40.00 40.80 29.91 23.57 33.60
20 Fire Wood 40 Kg. 335.00 320.00 380.00 480.00 240.00
21 Soft Coke 40 Kg. - - - - 200.00
22 Kerosene Oil Litre 16.00 15.97 15.60 16.30 15.00
23 Toilet Soap 75gms. 18.38 18.00 18.25 18.75 18.00
24 Washing Soap 225 gms. 23.69 16.88 9.00 26.10 22.50
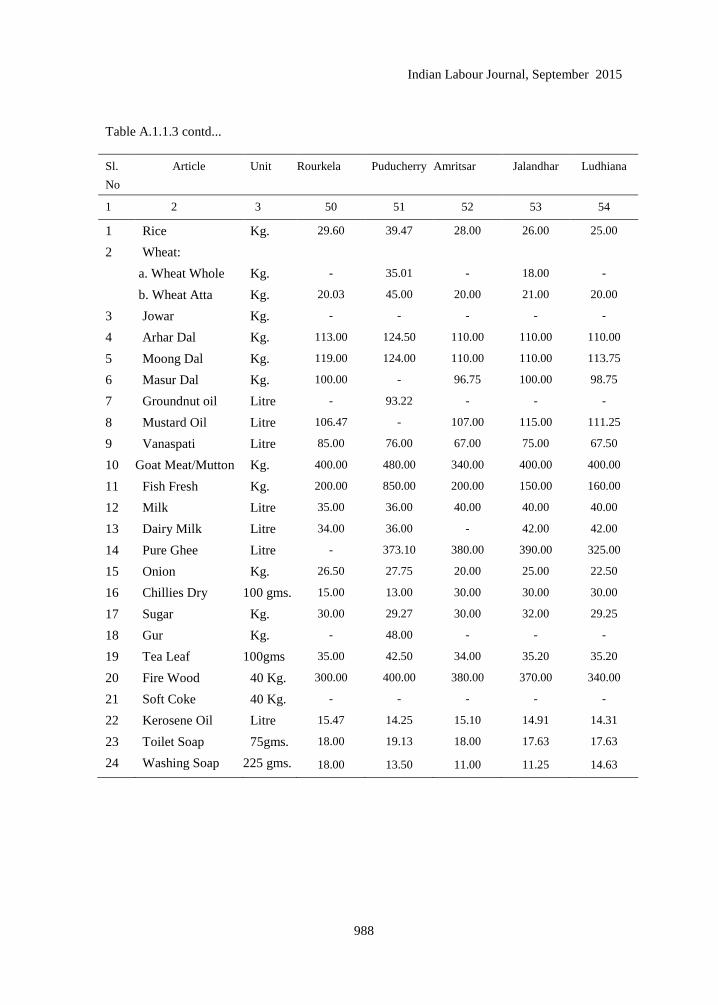
Indian Labour Journal, September 2015
988
Table A.1.1.3 contd...
Sl.
No
Article Unit Rourkela Puducherry Amritsar Jalandhar Ludhiana
1 2 3 50 51 52 53 54
1 Rice Kg. 29.60 39.47 28.00 26.00 25.00
2 Wheat:
a. Wheat Whole Kg. - 35.01 - 18.00 -
b. Wheat Atta Kg. 20.03 45.00 20.00 21.00 20.00
3 Jowar Kg. - - - - -
4 Arhar Dal Kg. 113.00 124.50 110.00 110.00 110.00
5 Moong Dal Kg. 119.00 124.00 110.00 110.00 113.75
6 Masur Dal Kg. 100.00 - 96.75 100.00 98.75
7 Groundnut oil Litre - 93.22 - - -
8 Mustard Oil Litre 106.47 - 107.00 115.00 111.25
9 Vanaspati Litre 85.00 76.00 67.00 75.00 67.50
10 Goat Meat/Mutton Kg. 400.00 480.00 340.00 400.00 400.00
11 Fish Fresh Kg. 200.00 850.00 200.00 150.00 160.00
12 Milk Litre 35.00 36.00 40.00 40.00 40.00
13 Dairy Milk Litre 34.00 36.00 - 42.00 42.00
14 Pure Ghee Litre - 373.10 380.00 390.00 325.00
15 Onion Kg. 26.50 27.75 20.00 25.00 22.50
16 Chillies Dry 100 gms. 15.00 13.00 30.00 30.00 30.00
17 Sugar Kg. 30.00 29.27 30.00 32.00 29.25
18 Gur Kg. - 48.00 - - -
19 Tea Leaf 100gms 35.00 42.50 34.00 35.20 35.20
20 Fire Wood 40 Kg. 300.00 400.00 380.00 370.00 340.00
21 Soft Coke 40 Kg. - - - - -
22 Kerosene Oil Litre 15.47 14.25 15.10 14.91 14.31
23 Toilet Soap 75gms. 18.00 19.13 18.00 17.63 17.63
24 Washing Soap 225 gms. 18.00 13.50 11.00 11.25 14.63

Indian Labour Journal, September 2015
989
Sl.
No
Article Unit Ajmer Bhilwara Jaipur Chennai Coimba-
tore
1 2 3 55 56 57 58 59
1 Rice Kg. 30.00 37.63 35.25 29.11 24.04
2 Wheat:
a. Wheat Whole Kg. 24.00 19.37 20.98 20.42 22.32
b. Wheat Atta Kg. 26.85 25.00 23.00 43.96 44.00
3 Jowar Kg. - - - - -
4 Arhar Dal Kg. 120.00 110.00 110.00 114.77 125.21
5 Moong Dal Kg. 120.00 103.75 114.00 117.05 118.95
6 Masur Dal Kg. 100.00 90.00 94.00 - -
7 Groundnut oil Litre 120.00 119.38 133.00 109.12 112.56
8 Mustard Oil Litre 125.00 121.25 120.00 - -
9 Vanaspati Litre 80.00 - 69.50 77.66 -
10 Goat Meat/Mutton Kg. 360.00 340.00 357.50 501.50 448.75
11 Fish Fresh Kg. 240.00 218.75 - 613.75 706.25
12 Milk Litre 46.00 42.50 46.00 - 32.00
13 Dairy Milk Litre 38.00 34.00 36.00 37.00 41.00
14 Pure Ghee Litre 360.00 370.00 316.75 410.00 389.94
15 Onion Kg. 25.00 26.25 25.60 29.53 29.50
16 Chillies Dry 100 gms. 28.00 27.50 28.00 19.67 12.32
17 Sugar Kg. 29.90 28.87 29.67 18.36 23.75
18 Gur Kg. 37.80 36.63 36.00 52.23 50.95
19 Tea Leaf 100gms 36.40 34.40 36.40 44.67 43.00
20 Fire Wood 40 Kg. 280.00 220.00 320.00 423.33 360.00
21 Soft Coke 40 Kg. - - - - -
22 Kerosene Oil Litre 17.50 17.25 17.25 13.70 13.90
23 Toilet Soap 75gms. 18.00 18.00 18.75 19.00 19.22
24 Washing Soap 225 gms. 12.38 9.96 10.80 14.30 11.25

Indian Labour Journal, September 2015
990
Table A.1.1.3 contd...
Sl.
No
Article Unit Coonoor Madurai Salem Tiruchirapally Godavari-
khani
1 2 3 60 61 62 63 64
1 Rice Kg. 21.64 31.24 31.13 20.80 29.20
2 Wheat:
a. Wheat Whole Kg. 10.17 27.00 20.27 18.48 26.50
b. Wheat Atta Kg. 44.75 47.00 41.50 42.00 28.00
3 Jowar Kg. - - - - -
4 Arhar Dal Kg. 110.00 120.00 110.25 111.00 115.50
5 Moong Dal Kg. 109.82 129.25 112.75 111.00 115.50
6 Masur Dal Kg. 83.50 - - 85.50 88.50
7 Groundnut oil Litre 115.96 125.01 101.81 81.45 108.80
8 Mustard Oil Litre - - - - -
9 Vanaspati Litre - 82.00 - - -
10 Goat Meat/Mutton Kg. 450.00 440.00 420.00 440.00 440.00
11 Fish Fresh Kg. 180.00 172.50 612.50 60.00 120.00
12 Milk Litre 40.00 40.00 40.00 42.67 40.00
13 Dairy Milk Litre 44.00 41.00 41.00 44.00 -
14 Pure Ghee Litre 364.00 391.30 - 415.00 -
15 Onion Kg. 55.00 26.25 45.00 28.80 20.00
16 Chillies Dry 100 gms. 13.00 11.00 11.00 11.00 12.00
17 Sugar Kg. 25.54 24.94 14.74 19.27 26.99
18 Gur Kg. - 45.50 - 49.50 -
19 Tea Leaf 100gms 44.25 43.50 43.25 45.00 35.00
20 Fire Wood 40 Kg. 320.00 240.00 192.00 160.00 240.00
21 Soft Coke 40 Kg. - - - - -
22 Kerosene Oil Litre 14.10 14.00 14.00 13.90 15.00
23 Toilet Soap 75gms 19.50 18.19 18.56 19.13 17.81
24 Washing Soap 225 gms. 15.30 22.50 12.38 12.60 9.81
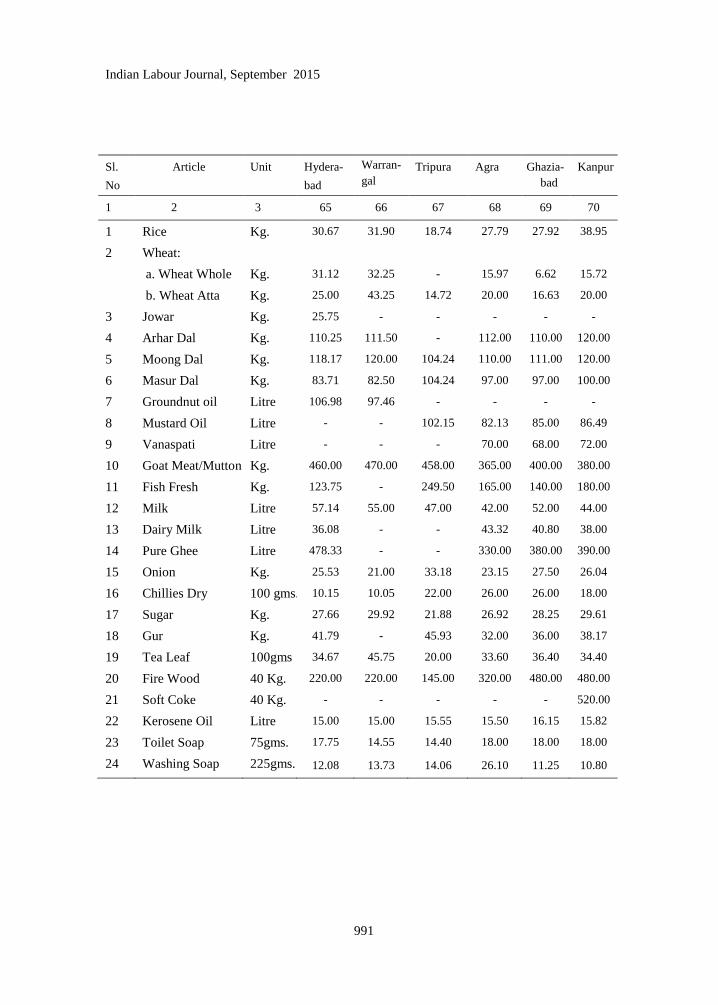
Indian Labour Journal, September 2015
991
Sl.
No
Article Unit Hydera-
bad
Warran-
gal
Tripura Agra Ghazia-
bad
Kanpur
1 2 3 65 66 67 68 69 70
1 Rice Kg. 30.67 31.90 18.74 27.79 27.92 38.95
2 Wheat:
a. Wheat Whole Kg. 31.12 32.25 - 15.97 6.62 15.72
b. Wheat Atta Kg. 25.00 43.25 14.72 20.00 16.63 20.00
3 Jowar Kg. 25.75 - - - - -
4 Arhar Dal Kg. 110.25 111.50 - 112.00 110.00 120.00
5 Moong Dal Kg. 118.17 120.00 104.24 110.00 111.00 120.00
6 Masur Dal Kg. 83.71 82.50 104.24 97.00 97.00 100.00
7 Groundnut oil Litre 106.98 97.46 - - - -
8 Mustard Oil Litre - - 102.15 82.13 85.00 86.49
9 Vanaspati Litre - - - 70.00 68.00 72.00
10 Goat Meat/Mutton Kg. 460.00 470.00 458.00 365.00 400.00 380.00
11 Fish Fresh Kg. 123.75 - 249.50 165.00 140.00 180.00
12 Milk Litre 57.14 55.00 47.00 42.00 52.00 44.00
13 Dairy Milk Litre 36.08 - - 43.32 40.80 38.00
14 Pure Ghee Litre 478.33 - - 330.00 380.00 390.00
15 Onion Kg. 25.53 21.00 33.18 23.15 27.50 26.04
16 Chillies Dry 100 gms. 10.15 10.05 22.00 26.00 26.00 18.00
17 Sugar Kg. 27.66 29.92 21.88 26.92 28.25 29.61
18 Gur Kg. 41.79 - 45.93 32.00 36.00 38.17
19 Tea Leaf 100gms 34.67 45.75 20.00 33.60 36.40 34.40
20 Fire Wood 40 Kg. 220.00 220.00 145.00 320.00 480.00 480.00
21 Soft Coke 40 Kg. - - - - - 520.00
22 Kerosene Oil Litre 15.00 15.00 15.55 15.50 16.15 15.82
23 Toilet Soap 75gms. 17.75 14.55 14.40 18.00 18.00 18.00
24 Washing Soap 225gms. 12.08 13.73 14.06 26.10 11.25 10.80

Indian Labour Journal, September 2015
992
Table A.1.1.3 concld.
Sl.
No
Article Unit Lucknow Varanasi Asansol Darjee-
Ling
Durga-
pur
1 2 3 71 72 73 74 75
1 Rice Kg. 31.97 32.93 32.43 21.22 29.88
2 Wheat:
a. Wheat Whole Kg. 18.17 18.58 10.12 13.55 6.73
b. Wheat Atta Kg. 22.00 22.00 22.51 2.12 15.80
3 Jowar Kg. - - - - -
4 Arhar Dal Kg. 115.81 115.00 90.00 120.00 114.00
5 Moong Dal Kg. 120.00 120.00 127.50 118.75 155.00
6 Masur Dal Kg. 91.25 90.00 100.00 100.25 108.00
7 Groundnut oil Litre - - - - -
8 Mustard Oil Litre 115.00 100.10 91.68 100.10 101.92
9 Vanaspati Litre 70.00 70.00 100.00 80.00 96.00
10 Goat Meat/Mutton Kg. 400.00 380.00 425.00 436.67 420.00
11 Fish Fresh Kg. 200.00 160.00 250.00 171.25 300.00
12 Milk Litre 48.00 45.00 36.00 30.00 34.00
13 Dairy Milk Litre 48.00 46.00 36.00 - 22.80
14 Pure Ghee Litre 360.00 384.63 434.40 430.00 488.70
15 Onion Kg. 25.00 21.95 30.00 32.00 26.88
16 Chillies Dry 100 gms. 30.00 28.00 15.75 14.00 24.00
17 Sugar Kg. 29.74 29.65 35.13 30.60 31.88
18 Gur Kg. 40.00 40.00 45.00 50.00 40.00
19 Tea Leaf 100gms 34.80 33.60 33.20 20.00 35.20
20 Fire Wood 40 Kg. 560.00 480.00 360.00 495.00 240.00
21 Soft Coke 40 Kg. - 600.00 360.00 640.00 460.00
22 Kerosene Oil Litre 15.74 15.92 15.41 15.39 15.50
23 Toilet Soap 75gms. 18.00 18.00 18.00 14.40 18.00
24 Washing Soap 225 gms. 26.10 26.10 22.50 22.50 18.00

Indian Labour Journal, September 2015
993
Sl.
No
Article Unit Haldia Howrah Jalpai-
guri
Kolkata Rani-
ganj
Sili-
guri
1 2 3 76 77 78 79 80 81
1 Rice Kg. 33.88 31.65 21.26 31.63 29.78 18.09
2 Wheat:
a. Wheat Whole Kg. 6.85 6.75 11.58 6.73 - 13.20
b. Wheat Atta Kg. 12.67 17.47 3.02 19.09 17.29 5.16
3 Jowar Kg. - - - - - -
4 Arhar Dal Kg. 110.00 106.67 105.00 110.00 110.00 102.00
5 Moong Dal Kg. 140.00 136.67 118.75 140.00 120.00 120.00
6 Masur Dal Kg. 110.00 110.00 108.00 107.50 100.00 110.00
7 Groundnut oil Litre 178.33 - - - - -
8 Mustard Oil Litre 100.10 92.52 91.00 100.10 94.64 100.10
9 Vanaspati Litre - 98.00 90.00 100.50 95.00 95.00
10 Goat Meat/Mutton Kg. 433.33 456.67 435.00 474.00 400.00 450.00
11 Fish Fresh Kg. 233.33 250.00 220.00 267.00 230.00 200.00
12 Milk Litre 35.00 38.00 37.50 38.00 34.00 36.67
13 Dairy Milk Litre 38.00 36.00 - 36.00 - -
14 Pure Ghee Litre 470.60 480.00 - 434.40 343.90 -
15 Onion Kg. 30.00 30.00 28.25 35.63 30.00 30.00
16 Chillies Dry 100gms. 24.00 20.00 13.75 17.80 15.00 12.00
17 Sugar Kg. 31.49 34.19 27.50 31.60 29.90 28.06
18 Gur Kg. 50.00 44.50 40.63 47.00 38.00 40.00
19 Tea Leaf 100gms 34.00 33.20 34.80 33.60 33.20 32.00
20 Fire Wood 40 Kg. 270.00 306.67 250.00 322.00 200.00 286.67
21 Soft Coke 40 Kg. 560.00 453.33 - 480.00 150.00 -
22 Kerosene Oil Litre 16.00 26.55 15.81 25.80 15.50 15.09
23 Toilet Soap 75gms. 18.00 18.00 18.00 18.00 18.00 14.40
24 Washing Soap 225gms. 18.76 20.45 26.10 22.50 22.50 26.10
Items do not feature in index basket of respective centres.
Notes ―The prices are average prices based on individual quotations obtained from
selected outlets in a given centre and are not strictly comparable between centres
as they relate to different varieties of varying specifications‖.
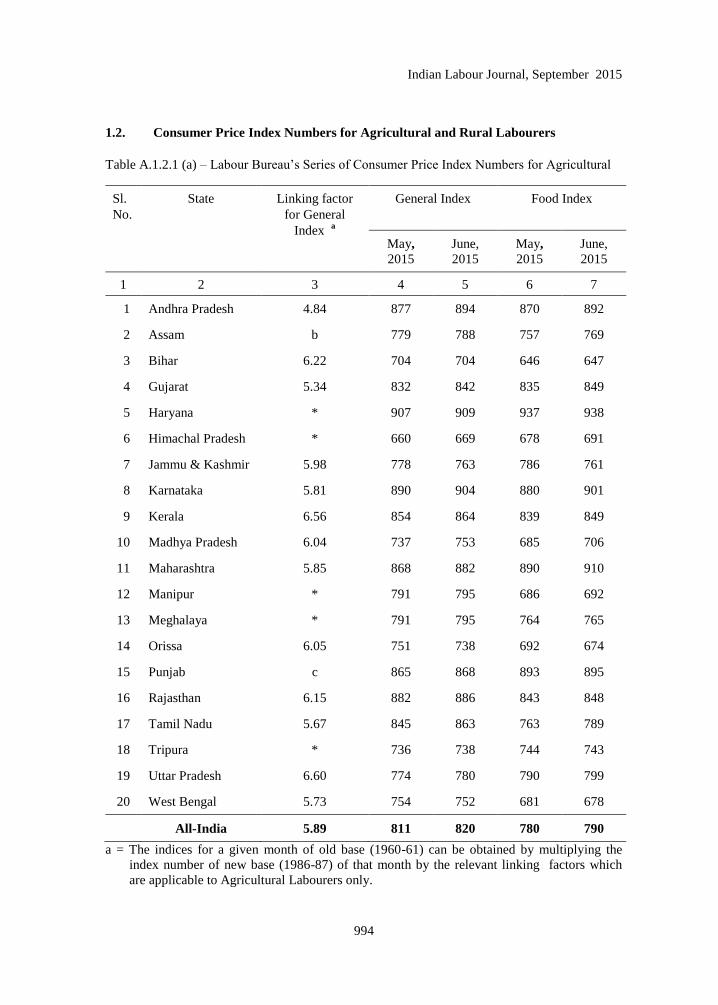
Indian Labour Journal, September 2015
994
1.2. Consumer Price Index Numbers for Agricultural and Rural Labourers
Table A.1.2.1 (a) – Labour Bureau‘s Series of Consumer Price Index Numbers for Agricultural
Sl.
No.
State
Linking factor
for General
Index a
General Index Food Index
May,
2015
June,
2015
May,
2015
June,
2015
1 2 3 4 5 6 7
1 Andhra Pradesh 4.84 877 894 870 892
2 Assam b 779 788 757 769
3 Bihar 6.22 704 704 646 647
4 Gujarat 5.34 832 842 835 849
5 Haryana * 907 909 937 938
6 Himachal Pradesh * 660 669 678 691
7 Jammu & Kashmir 5.98 778 763 786 761
8 Karnataka 5.81 890 904 880 901
9 Kerala 6.56 854 864 839 849
10 Madhya Pradesh 6.04 737 753 685 706
11 Maharashtra 5.85 868 882 890 910
12 Manipur * 791 795 686 692
13 Meghalaya * 791 795 764 765
14 Orissa 6.05 751 738 692 674
15 Punjab c 865 868 893 895
16 Rajasthan 6.15 882 886 843 848
17 Tamil Nadu 5.67 845 863 763 789
18 Tripura * 736 738 744 743
19 Uttar Pradesh 6.60 774 780 790 799
20 West Bengal 5.73 754 752 681 678
All-India 5.89 811 820 780 790
a = The indices for a given month of old base (1960-61) can be obtained by multiplying the
index number of new base (1986-87) of that month by the relevant linking factors which
are applicable to Agricultural Labourers only.

Indian Labour Journal, September 2015
995
Labourers (Group-wise and General) (Base: 1986-87=100)
Pan, Supari, Tobacco
& Intoxicants Index
Fuel & Light Index Clothing, Bedding &
Footwear Index
Miscellaneous Index
May,
2015
June,
2015
May,
2015
June,
2015
May,
2015
June,
2015
May,
2015
June,
2015
8 9 10 11 12 13 14 15
1225 1234 885 911 854 860 808 811
1174 1146 780 781 822 842 675 679
905 906 1025 1023 930 934 728 729
1269 1275 747 742 698 699 817 820
916 922 1227 1237 844 852 653 655
1163 1164 374 374 607 614 750 756
1337 1361 643 643 759 765 791 813
1276 1267 746 749 851 852 931 934
1529 1551 855 855 760 762 777 786
1212 1217 970 976 759 763 748 749
1159 1167 905 910 701 702 758 760
1382 1382 1575 1567 823 832 674 675
987 1006 836 857 915 917 742 740
1135 1162 1137 1137 906 913 702 705
1100 1099 1231 1230 674 680 659 663
1383 1384 1207 1212 831 832 784 789
1573 1571 953 952 770 772 1004 1009
1102 1138 429 430 777 785 703 704
1001 1005 802 801 748 750 641 641
912 921 1045 1047 1158 1164 923 924
1204 1210 932 936 814 818 791 794
b & c = To obtain linking factors for Assam and Punjab, please refer article in February, 1996
issue of the Indian Labour Journal.
* = Indices compiled and published for the first time w.e.f. November, 1995.

Indian Labour Journal, September 2015
996
Table A.1.2.1 (b) – Labour Bureau‘s Series of Consumer Price Index Numbers for Rural
Sl.
No
State General Index Food Index Pan, Supari,
Tobacco &
Intoxicants Index
May,
2015
June,
2015
May,
2015
June,
2015
May,
2015
June,
2015
1 2 3 4 5 6 7 8
1 Andhra Pradesh 874 892 870 893 1228 1237
2 Assam 788 797 771 784 1169 1138
3 Bihar 710 711 646 646 907 909
4 Gujarat 831 841 838 852 1261 1266
5 Haryana 905 907 944 943 948 954
6 Himachal Pradesh 695 708 705 723 1281 1279
7 Jammu & Kashmir 771 759 774 754 1449 1485
8 Karnataka 883 899 866 891 1286 1277
9 Kerala 867 877 853 864 1532 1553
10 Madhya Pradesh 760 776 688 708 1202 1207
11 Maharashtra 863 877 879 899 1161 1169
12 Manipur 794 799 686 692 1373 1373
13 Meghalaya 792 796 762 763 1000 1020
14 Orissa 751 739 693 675 1133 1161
15 Punjab 863 865 894 896 1107 1106
16 Rajasthan 864 869 827 832 1352 1354
17 Tamil Nadu 840 857 775 800 1585 1583
18 Tripura 728 729 733 731 1113 1145
19 Uttar Pradesh 770 776 792 801 997 1003
20 West Bengal 765 763 685 682 920 929
All India 816 824 785 796 1217 1222

Indian Labour Journal, September 2015
997
Labourers (Group wise and General) (Base: 1986-87=100)
Fuel & Light Index Clothing, Bedding &
Footwear Index
Miscellaneous Index
May,
2015
June,
2015
May,
2015
June,
2015
May,
2015
June,
2015
9 10 11 12 13 14
881 906 835 839 810 813
777 778 820 836 670 675
1028 1026 923 931 734 735
748 743 707 709 819 822
1227 1236 822 832 649 652
383 384 708 718 739 745
636 636 751 754 770 775
748 750 819 820 977 981
855 855 772 774 801 811
967 973 894 902 768 769
897 902 782 784 761 763
1579 1570 836 846 665 665
835 856 861 876 744 741
1131 1131 895 901 701 704
1216 1215 751 754 658 662
1210 1215 826 830 757 762
945 944 720 722 919 923
425 426 772 781 678 678
806 806 765 768 601 601
1075 1078 1111 1115 929 931
930 933 824 828 789 792

Indian Labour Journal, September 2015
998
Table A.1.2.2 (a) - State-wise monthly consumer prices of selected articles of Agricultural
Sl.
No.
Item Unit Andhra Pradesh Assam Bihar Gujarat
1 2 3 4 5 6 7
1. Rice Kg. 16.20 22.20 15.16 17.31
2. Wheat: - - - -
(a) Wheat whole Kg. - - 11.75 5.15
(b) Wheat Atta Kg. - 25.59 18.79 23.46
3. Jowar Kg. 24.21 - - -
4. Bajra: - - - -
(a) Bajra whole Kg. 18.73 - - 14.79
(b) Bajra Atta Kg. - - - 19.49
5. Maize: - - - -
(a) Maize whole Kg. - - 12.13 15.34
(b) Maize Atta Kg. - - - 21.17
6. Ragi Kg. 25.53 - - -
7. Arhar Dal Kg. 106.04 84.54 101.65 102.28
8. Groundnut Oil Litre 95.26 - - 114.12
9. Mustard Oil Litre - 110.98 98.24
10. Goat Meat/Mutton Kg. 411.29 333.71 379.49 324.36
11. Fish Fresh Kg. 161.48 250.18 140.76 139.17
12. Milk Litre 40.39 44.62 33.66 44.14
13. Onion Kg. 24.65 28.38 22.36 23.54
14. Chillies Dry 100Gms 11.89 15.91 12.22 15.48
15. Potato Kg. 22.79 11.72 10.68 12.46
16. Sugar Kg. 18.10 22.47 31.71 24.74
17. Gur Kg. 39.58 53.99 34.46 37.49
18. Tea Leaf 100Gms 40.38 22.02 29.24 24.04
19. Firewood 40 Kg. 174.80 136.30 237.18 70.52
20. Kerosene Oil Litre 15.00 17.87 16.95 15.40
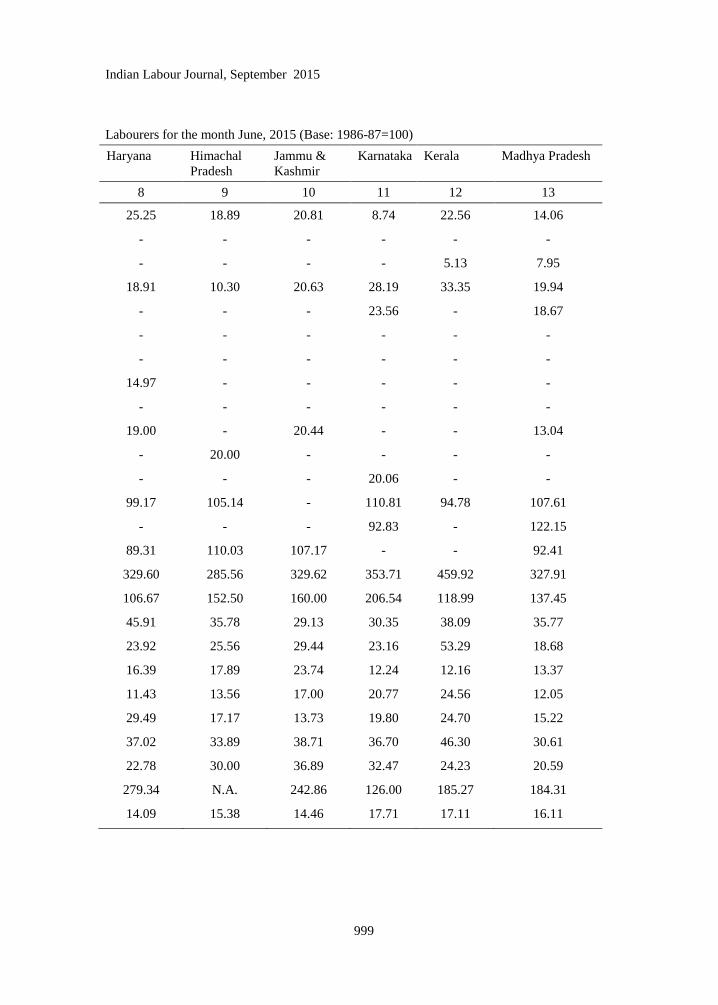
Indian Labour Journal, September 2015
999
Labourers for the month June, 2015 (Base: 1986-87=100)
Haryana Himachal
Pradesh
Jammu &
Kashmir
Karnataka Kerala Madhya Pradesh
8 9 10 11 12 13
25.25 18.89 20.81 8.74 22.56 14.06
- - - - - -
- - - - 5.13 7.95
18.91 10.30 20.63 28.19 33.35 19.94
- - - 23.56 - 18.67
- - - - - -
- - - - - -
14.97 - - - - -
- - - - - -
19.00 - 20.44 - - 13.04
- 20.00 - - - -
- - - 20.06 - -
99.17 105.14 - 110.81 94.78 107.61
- - - 92.83 - 122.15
89.31 110.03 107.17 - - 92.41
329.60 285.56 329.62 353.71 459.92 327.91
106.67 152.50 160.00 206.54 118.99 137.45
45.91 35.78 29.13 30.35 38.09 35.77
23.92 25.56 29.44 23.16 53.29 18.68
16.39 17.89 23.74 12.24 12.16 13.37
11.43 13.56 17.00 20.77 24.56 12.05
29.49 17.17 13.73 19.80 24.70 15.22
37.02 33.89 38.71 36.70 46.30 30.61
22.78 30.00 36.89 32.47 24.23 20.59
279.34 N.A. 242.86 126.00 185.27 184.31
14.09 15.38 14.46 17.71 17.11 16.11

Indian Labour Journal, September 2015
1000
Table A.1.2.2 (a) concld.
Sl.
No.
Item Unit Maharashtra Manipur Meghalaya Orissa
1 2 3 14 15 16 17
1. Rice Kg. 13.59 17.88 15.49 16.50
2. Wheat: - -
(a) Wheat whole Kg. 10.83 - - -
(b) Wheat Atta Kg. - - 25.38 19.17
3. Jowar Kg. 20.81 - - -
4. Bajra:
(a) Bajra whole Kg. 18.57 - - -
(b) Bajra Atta Kg. - - - -
5. Maize: - - -
(a) Maize whole Kg. - - - -
(b) Maize Atta Kg. - - - -
6. Ragi Kg. - - - 17.34
7. Arhar Dal Kg. 107.59 100.56 85.44 106.79
8. Groundnut Oil Litre 109.50 - - 96.04
9. Mustard Oil Litre - 110.56 100.00 103.33
10. Goat Meat/Mutton Kg. 380.26 - - 393.98
11. Fish Fresh Kg. 127.52 206.11 198.75 134.79
12. Milk Litre 40.56 41.00 46.33 29.07
13. Onion Kg. 20.81 33.89 33.89 24.01
14. Chillies Dry 100 gm. 12.32 17.11 19.33 12.92
15. Potato Kg. 19.07 18.89 12.78 10.12
16. Sugar Kg. 20.54 40.22 22.00 32.44
17. Gur Kg. 24.04 - - 41.09
18. Tea Leaf 100 gm. 24.01 20.20 25.50 30.33
19. Firewood 40. Kg. 176.27 265.00 175.56 153.73
20. Kerosene Oil Litre 16.53 20.94 34.44 16.04
- = Items do not feature in the Index Basket.
N.A. = Not Available.

Indian Labour Journal, September 2015
1001
Punjab Rajasthan Tamil
Nadu
Tripura Uttar
Pradesh
West Bengal
18 19 20 21 22 23
27.49 29.23 7.56 19.71 17.15 21.97
- - -
16.04 6.96 - - 7.65 -
19.43 20.22 36.91 28.00 17.81 11.68
- 29.64 24.54 - 20.38 -
- - - - -
- 13.76 20.39 - 14.00 -
- - - - -
- - - - -
- 13.67 - - 14.78 -
23.38 - - - -
- - 23.79 - -
- 105.37 113.15 - 107.56 86.09
- 115.66 104.05 - - -
97.14 90.69 - 108.25 90.67 100.60
335.94 330.85 421.15 474.44 331.67 444.98
- - 166.43 250.00 131.48 139.54
40.75 39.49 34.55 41.22 37.83 28.49
21.47 20.92 39.11 32.33 20.95 24.05
15.71 13.68 11.19 18.00 14.70 13.89
8.50 12.40 24.15 16.78 9.70 8.25
30.55 15.21 13.52 21.84 18.10 26.00
36.44 33.88 47.21 52.56 33.53 36.57
21.47 21.32 43.34 21.89 29.98 20.60
265.83 220.10 188.36 115.00 235.66 217.00
16.07 17.26 14.01 16.27 15.83 15.80
Note:- The prices are average prices based on individual quotations obtained from the selected
outlets of the sample villages of a given State and are not comparable with each other due
to their varying specifications. Besides, the prices of all the items utilised in compilation
of C.P.I. Numbers for Agricultural Labourers are not being published due to resource
constraints.
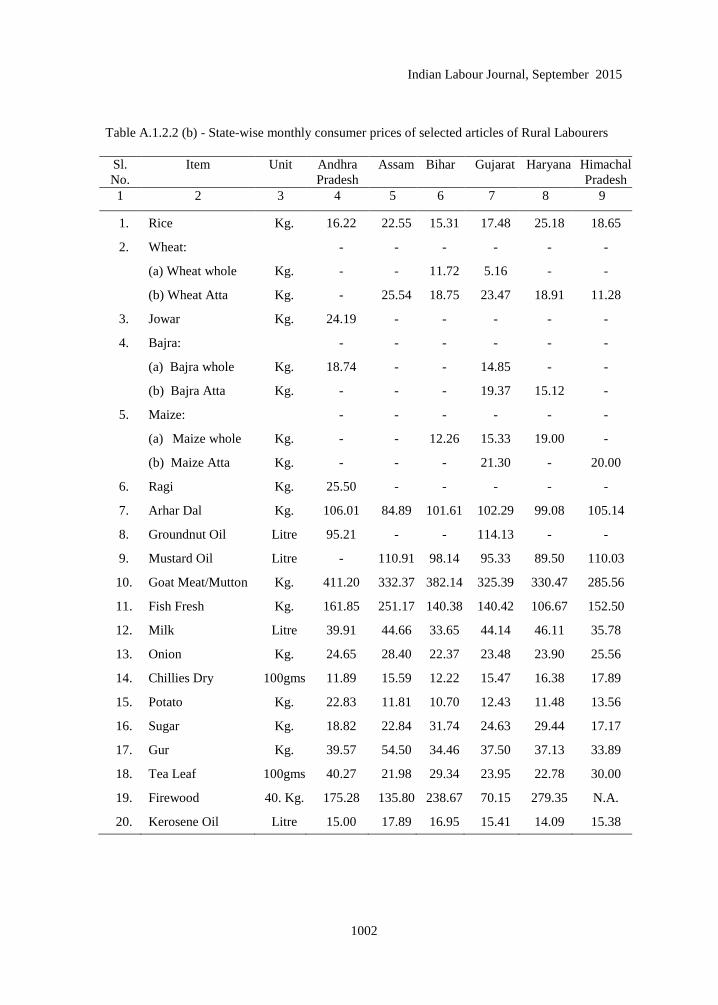
Indian Labour Journal, September 2015
1002
Table A.1.2.2 (b) - State-wise monthly consumer prices of selected articles of Rural Labourers
Sl.
No.
Item Unit Andhra
Pradesh
Assam Bihar Gujarat Haryana Himachal
Pradesh
1 2 3 4 5 6 7 8 9
1. Rice Kg. 16.22 22.55 15.31 17.48 25.18 18.65
2. Wheat: - - - - - -
(a) Wheat whole Kg. - - 11.72 5.16 - -
(b) Wheat Atta Kg. - 25.54 18.75 23.47 18.91 11.28
3. Jowar Kg. 24.19 - - - - -
4. Bajra: - - - - - -
(a) Bajra whole Kg. 18.74 - - 14.85 - -
(b) Bajra Atta Kg. - - - 19.37 15.12 -
5. Maize: - - - - - -
(a) Maize whole Kg. - - 12.26 15.33 19.00 -
(b) Maize Atta Kg. - - - 21.30 - 20.00
6. Ragi Kg. 25.50 - - - - -
7. Arhar Dal Kg. 106.01 84.89 101.61 102.29 99.08 105.14
8. Groundnut Oil Litre 95.21 - - 114.13 - -
9. Mustard Oil Litre - 110.91 98.14 95.33 89.50 110.03
10. Goat Meat/Mutton Kg. 411.20 332.37 382.14 325.39 330.47 285.56
11. Fish Fresh Kg. 161.85 251.17 140.38 140.42 106.67 152.50
12. Milk Litre 39.91 44.66 33.65 44.14 46.11 35.78
13. Onion Kg. 24.65 28.40 22.37 23.48 23.90 25.56
14. Chillies Dry 100gms 11.89 15.59 12.22 15.47 16.38 17.89
15. Potato Kg. 22.83 11.81 10.70 12.43 11.48 13.56
16. Sugar Kg. 18.82 22.84 31.74 24.63 29.44 17.17
17. Gur Kg. 39.57 54.50 34.46 37.50 37.13 33.89
18. Tea Leaf 100gms 40.27 21.98 29.34 23.95 22.78 30.00
19. Firewood 40. Kg. 175.28 135.80 238.67 70.15 279.35 N.A.
20. Kerosene Oil Litre 15.00 17.89 16.95 15.41 14.09 15.38
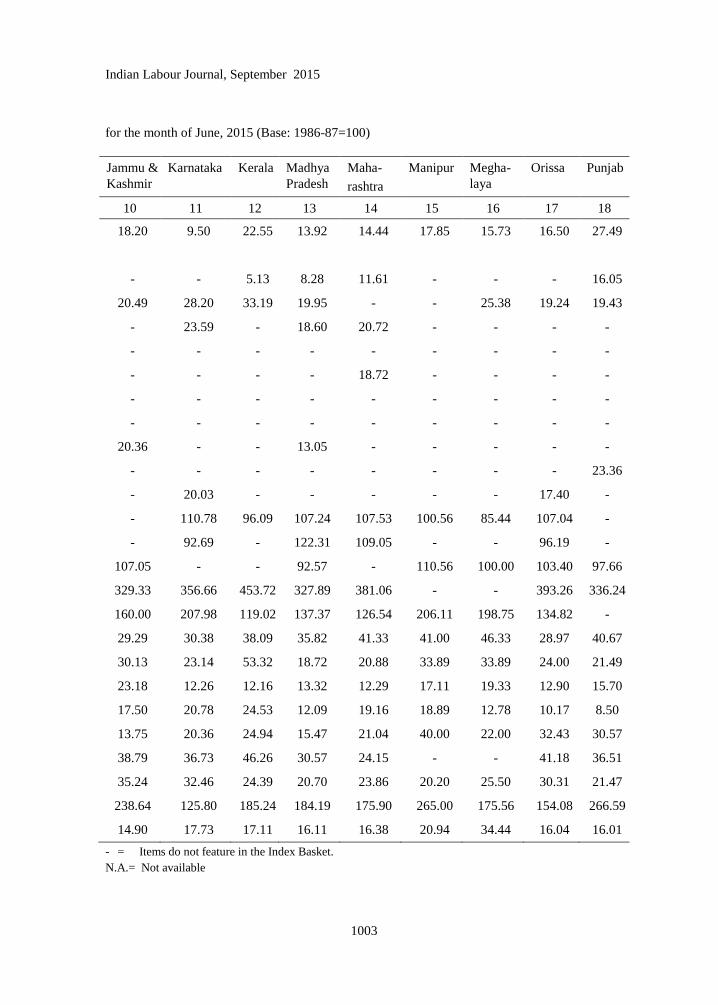
Indian Labour Journal, September 2015
1003
for the month of June, 2015 (Base: 1986-87=100)
Jammu &
Kashmir
Karnataka Kerala Madhya
Pradesh
Maha-
rashtra
Manipur Megha-
laya
Orissa Punjab
10 11 12 13 14 15 16 17 18
18.20 9.50 22.55 13.92 14.44 17.85 15.73 16.50 27.49
- - 5.13 8.28 11.61 - - - 16.05
20.49 28.20 33.19 19.95 - - 25.38 19.24 19.43
- 23.59 - 18.60 20.72 - - - -
- - - - - - - - -
- - - - 18.72 - - - -
- - - - - - - - -
- - - - - - - - -
20.36 - - 13.05 - - - - -
- - - - - - - - 23.36
- 20.03 - - - - - 17.40 -
- 110.78 96.09 107.24 107.53 100.56 85.44 107.04 -
- 92.69 - 122.31 109.05 - - 96.19 -
107.05 - - 92.57 - 110.56 100.00 103.40 97.66
329.33 356.66 453.72 327.89 381.06 - - 393.26 336.24
160.00 207.98 119.02 137.37 126.54 206.11 198.75 134.82 -
29.29 30.38 38.09 35.82 41.33 41.00 46.33 28.97 40.67
30.13 23.14 53.32 18.72 20.88 33.89 33.89 24.00 21.49
23.18 12.26 12.16 13.32 12.29 17.11 19.33 12.90 15.70
17.50 20.78 24.53 12.09 19.16 18.89 12.78 10.17 8.50
13.75 20.36 24.94 15.47 21.04 40.00 22.00 32.43 30.57
38.79 36.73 46.26 30.57 24.15 - - 41.18 36.51
35.24 32.46 24.39 20.70 23.86 20.20 25.50 30.31 21.47
238.64 125.80 185.24 184.19 175.90 265.00 175.56 154.08 266.59
14.90 17.73 17.11 16.11 16.38 20.94 34.44 16.04 16.01
- = Items do not feature in the Index Basket.
N.A.= Not available

Indian Labour Journal, September 2015
1004
Table A.1.2.2 (b)-Concld.
Sl.
No.
Item Unit Rajasthan Tamil
Nadu
Tripura Uttar
Pradesh
West
Bengal
1 2 3 19 20 21 22 23
1. Rice Kg. 29.68 8.18 19.59 17.10 21.98
2. Wheat:
(a) Wheat whole Kg. 4.91 - - 7.90 -
(b) Wheat Atta Kg. 20.20 36.96 28.00 17.68 11.94
3. Jowar Kg. 29.66 24.22 - 19.87 -
4. Bajra: - - - -
(a) Bajra whole Kg. 13.99 20.36 - 13.98 -
(b) Bajra Atta Kg. - - - -
5. Maize:
( a ) Maize whole Kg. 13.60 - - 14.72 -
(b) Maize Atta Kg. - - - - -
6. Ragi Kg. - 23.76 - - -
7. Arhar Dal Kg. 107.17 112.93 - 107.57 88.06
8. Groundnut Oil Litre 115.68 104.96 - - -
9. Mustard Oil Litre 91.80 - 108.25 90.64 100.66
10. Goat Meat/Mutton Kg. 329.50 422.32 474.44 332.05 444.05
11. Fish Fresh Kg. - 166.89 250.00 130.70 138.84
12. Milk Litre 39.50 34.61 41.22 37.84 28.58
13. Onion Kg. 20.90 39.10 32.33 21.04 24.07
14. Chillies Dry 100gm. 13.73 11.16 18.00 14.66 13.92
15. Potato Kg. 12.35 24.08 16.78 9.73 8.26
16. Sugar Kg. 16.76 13.82 15.85 17.43 26.07
17. Gur Kg. 33.52 47.29 52.56 33.50 36.58
18. Tea Leaf 100 gm. 21.38 43.31 21.89 29.68 20.63
19. Firewood 40. Kg. 220.80 188.20 115.00 237.59 218.97
20. Kerosene Oil Litre 17.26 14.00 16.27 15.77 15.80
Note:-The prices are average prices based on individual quotations obtained from the selected outlets of the
sample villages of a given State and are not comparable with each other due to their varying
specifications. Besides, the prices of all the items utilized in compilation of C.P.I. Numbers. for
Rural Labourers are not being published due to resource constraints.

Indian Labour Journal, September 2015
1005
2. WAGES AND EARNINGS
Table A.2.1 (a) - Average Daily Wage Rates for Agricultural Occupations in Rural India during
June, 2015 (By States and Sex).
( in Rupees)
Sl.
No
States Ploughing/Tilling Workers Sowing (including Planting/
Transplanting/Weeding workers)
Men Women Children Men Women Children
1 2 3 4 5 6 7 8
1 Andhra Pradesh 266.12 @ - 223.12 163.30 -
2 Assam 265.18 - - 233.17 190.00 -
3 Bihar 249.14 - - 232.32 192.03 @
4 Gujarat 215.00 @ - 188.83 180.18 -
5 Haryana 363.33 @ - 338.75 326.25 -
6 Himachal Pradesh 393.14 - - 326.71 @ -
7 Jammu & Kashmir 446.44 @ - 417.56 @ -
8 Karnataka 290.83 @ - 238.79 176.94 @
9 Kerala 735.63 - - 656.79 452.44 -
10 Madhya Pradesh 188.89 165.71 - 173.57 163.08 -
11 Maharashtra 253.98 173.33 - 212.24 148.21 -
12 Manipur 306.25 - - 285.56 246.00 -
13 Meghalaya 232.50 @ - 228.89 162.50 @
14 Orissa 232.93 - - 205.37 158.67 -
15 Punjab @ - - 322.73 @ -
16 Rajasthan 272.86 - - 281.82 195.56 -
17 Tamil Nadu 490.52 - - 323.71 212.76 -
18 Tripura 210.00 - - 210.00 - -
19 Uttar Pradesh 209.03 @ - 200.13 174.26 @
20 West Bengal 289.49 @ - 209.08 194.72 -
All India 274.97 187.85 - 244.64 195.70 106.67
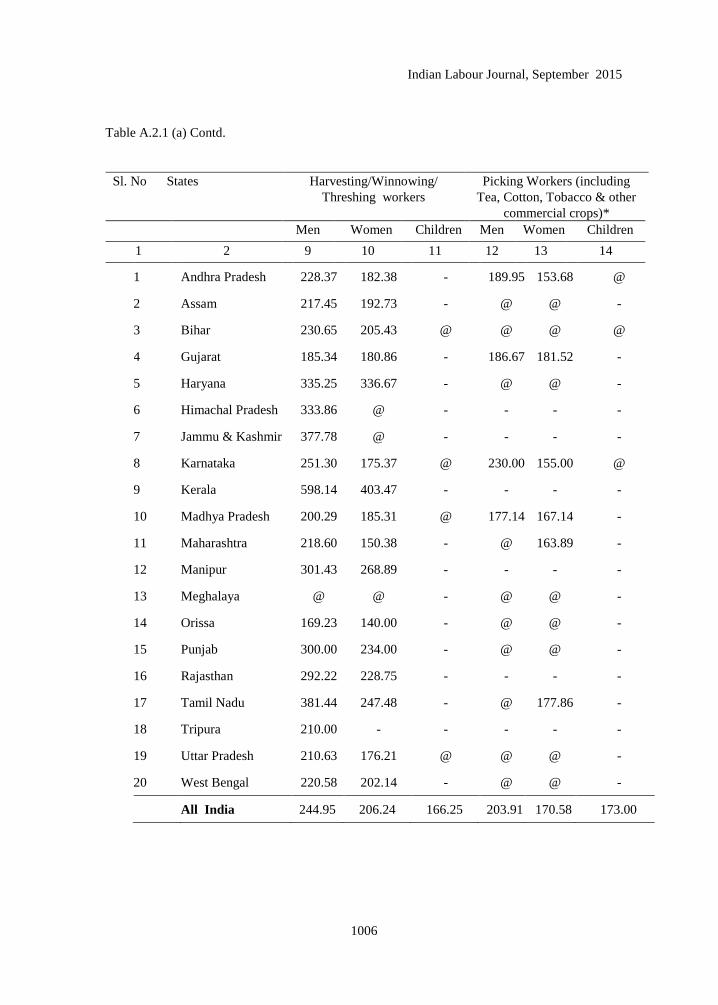
Indian Labour Journal, September 2015
1006
Table A.2.1 (a) Contd.
Sl. No States Harvesting/Winnowing/
Threshing workers
Picking Workers (including
Tea, Cotton, Tobacco & other
commercial crops)*
Men Women Children Men Women Children
1 2 9 10 11 12 13 14
1 Andhra Pradesh 228.37 182.38 - 189.95 153.68 @
2 Assam 217.45 192.73 - @ @ -
3 Bihar 230.65 205.43 @ @ @ @
4 Gujarat 185.34 180.86 - 186.67 181.52 -
5 Haryana 335.25 336.67 - @ @ -
6 Himachal Pradesh 333.86 @ - - - -
7 Jammu & Kashmir 377.78 @ - - - -
8 Karnataka 251.30 175.37 @ 230.00 155.00 @
9 Kerala 598.14 403.47 - - - -
10 Madhya Pradesh 200.29 185.31 @ 177.14 167.14 -
11 Maharashtra 218.60 150.38 - @ 163.89 -
12 Manipur 301.43 268.89 - - - -
13 Meghalaya @ @ - @ @ -
14 Orissa 169.23 140.00 - @ @ -
15 Punjab 300.00 234.00 - @ @ -
16 Rajasthan 292.22 228.75 - - - -
17 Tamil Nadu 381.44 247.48 - @ 177.86 -
18 Tripura 210.00 - - - - -
19 Uttar Pradesh 210.63 176.21 @ @ @ -
20 West Bengal 220.58 202.14 - @ @ -
All India 244.95 206.24 166.25 203.91 170.58 173.00
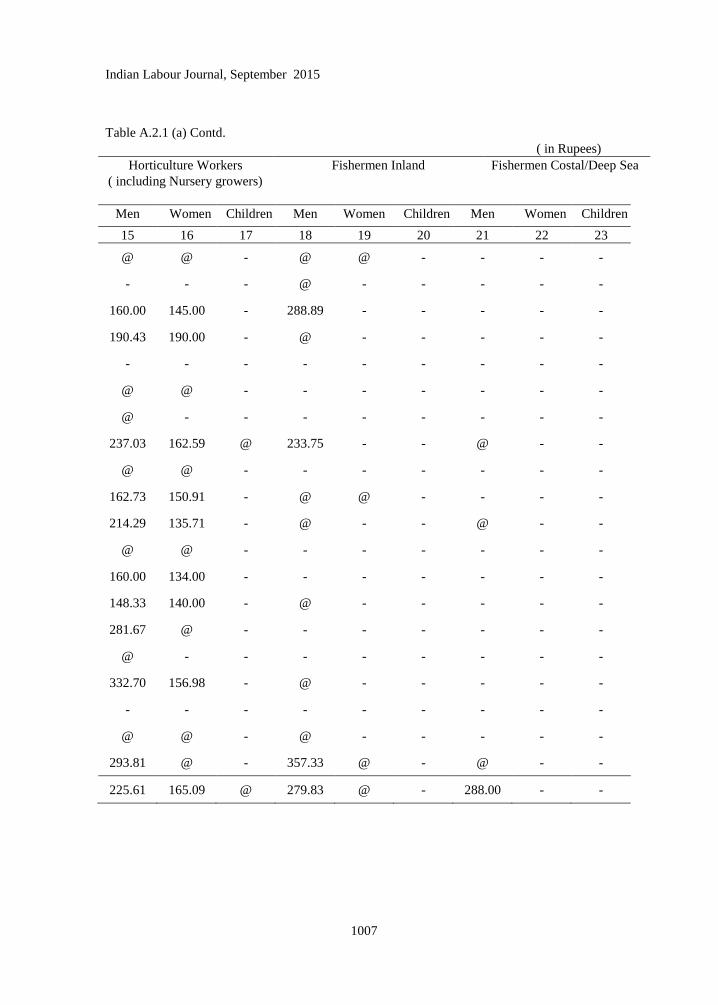
Indian Labour Journal, September 2015
1007
Table A.2.1 (a) Contd.
( in Rupees)
Horticulture Workers
( including Nursery growers)
Fishermen Inland Fishermen Costal/Deep Sea
Men Women Children Men Women Children Men Women Children
15 16 17 18 19 20 21 22 23
@ @ - @ @ - - - -
- - - @ - - - - -
160.00 145.00 - 288.89 - - - - -
190.43 190.00 - @ - - - - -
- - - - - - - - -
@ @ - - - - - - -
@ - - - - - - - -
237.03 162.59 @ 233.75 - - @ - -
@ @ - - - - - - -
162.73 150.91 - @ @ - - - -
214.29 135.71 - @ - - @ - -
@ @ - - - - - - -
160.00 134.00 - - - - - - -
148.33 140.00 - @ - - - - -
281.67 @ - - - - - - -
@ - - - - - - - -
332.70 156.98 - @ - - - - -
- - - - - - - - -
@ @ - @ - - - - -
293.81 @ - 357.33 @ - @ - -
225.61 165.09 @ 279.83 @ - 288.00 - -

Indian Labour Journal, September 2015
1008
Table A.2.1 (a) Contd.
Sl.
No
States Loggers and Wood Cutters Animal husbandry workers: including
Poultry workers, dairy workers &
Herdsman
Men Women Children Men Women Children
1 2 24 25 26 27 28 29
1 Andhra Pradesh 279.26 - - 163.50 @ @
2 Assam 248.13 - - @ - -
3 Bihar 254.58 - - 165.62 143.50 @
4 Gujarat 201.00 @ - 160.91 176.00 -
5 Haryana @ - - 304.80 @ -
6 Himachal Pradesh @ - - @ @ -
7 Jammu & Kashmir 483.33 - - 434.29 - -
8 Karnataka 280.48 - - 213.06 156.00 @
9 Kerala 981.16 - - 548.57 - -
10 Madhya Pradesh 151.82 @ @ 116.61 103.33 81.75
11 Maharashtra 245.13 - - 176.44 150.00 123.33
12 Manipur @ - - 257.14 - -
13 Meghalaya 200.00 - - 164.44 @ -
14 Orissa 221.78 - - 125.69 113.33 @
15 Punjab @ - - 290.14 @ -
16 Rajasthan 230.00 @ - 197.50 @ -
17 Tamil Nadu 417.84 @ - 375.67 @ -
18 Tripura 298.89 - - 221.11 - -
19 Uttar Pradesh 274.05 @ - 195.45 @ -
20 West Bengal 284.27 - - 172.90 188.52 96.90
All India 316.24 156.36 @ 190.14 143.19 88.52

Indian Labour Journal, September 2015
1009
Table A.2.1 (a) Concld.
( in Rupees)
Packaging Labourers General Agricultural
Labourers including Watering
& Irrigation workers etc.
Plant protection workers
(applying pesticides, treating
seeds, etc.)
Men Women Children Men Women Children Men Women Children
30 31 32 33 34 35 36 37 38
@ - - 209.52 145.02 @ 344.20 @ -
@ @ - 210.29 208.89 - 245.43 - -
174.17 @ - 203.43 156.93 @ 246.43 @ -
161.43 @ - 173.41 169.33 - 169.17 - -
@ - - 351.09 @ - 350.33 - -
@ @ - 312.43 312.00 - @ @ -
@ - - 385.71 @ - @ - -
249.06 163.33 - 212.78 150.71 - 260.95 - -
@ - - 589.52 410.17 - 655.13 - -
142.86 142.00 @ 159.29 142.61 117.50 177.94 - -
225.00 154.17 - 195.22 130.74 @ 253.33 @ -
@ - - @ - - - - -
@ - - 200.00 150.00 @ @ - -
@ @ - 187.36 162.31 @ @ - -
300.00 @ - 301.40 @ - 310.00 - -
- - - 269.29 229.09 - @ - -
360.00 @ - 348.85 194.29 - 441.48 @ -
- - - 208.89 - - - - -
@ @ - 197.25 169.62 151.90 223.00 @ -
262.29 @ - 220.69 199.59 - 216.60 175.45 -
227.92 182.18 @ 231.60 177.15 122.82 282.14 174.80 -
- = Indicates that the particular category of workers, i.e. men/ women /children were not engaged
in that operation either because of their non-availability; or the activity connected with the
occupation was not undertaken in the State; or the activity was out of season in the State, etc.
* =Picking includes picking of tea, cotton bolls, tobacco & other commercial crops
@ =Number of quotations are less than five.
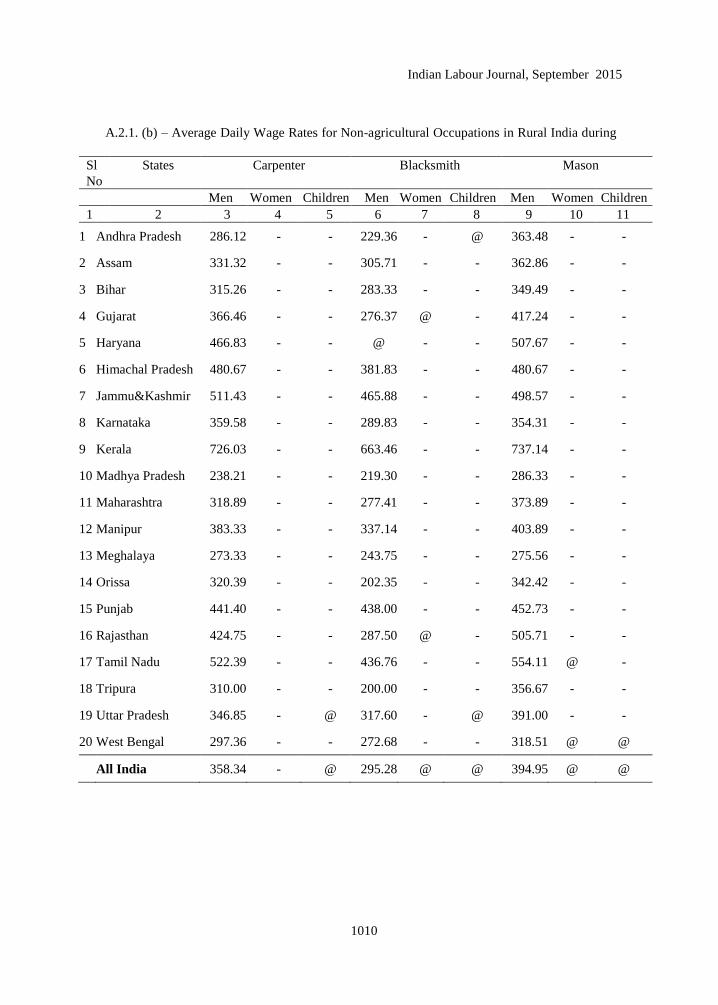
Indian Labour Journal, September 2015
1010
A.2.1. (b) – Average Daily Wage Rates for Non-agricultural Occupations in Rural India during
Sl
No
States Carpenter Blacksmith Mason
Men Women Children Men Women Children Men Women Children
1 2 3 4 5 6 7 8 9 10 11
1 Andhra Pradesh 286.12 - - 229.36 - @ 363.48 - -
2 Assam 331.32 - - 305.71 - - 362.86 - -
3 Bihar 315.26 - - 283.33 - - 349.49 - -
4 Gujarat 366.46 - - 276.37 @ - 417.24 - -
5 Haryana 466.83 - - @ - - 507.67 - -
6 Himachal Pradesh 480.67 - - 381.83 - - 480.67 - -
7 Jammu&Kashmir 511.43 - - 465.88 - - 498.57 - -
8 Karnataka 359.58 - - 289.83 - - 354.31 - -
9 Kerala 726.03 - - 663.46 - - 737.14 - -
10 Madhya Pradesh 238.21 - - 219.30 - - 286.33 - -
11 Maharashtra 318.89 - - 277.41 - - 373.89 - -
12 Manipur 383.33 - - 337.14 - - 403.89 - -
13 Meghalaya 273.33 - - 243.75 - - 275.56 - -
14 Orissa 320.39 - - 202.35 - - 342.42 - -
15 Punjab 441.40 - - 438.00 - - 452.73 - -
16 Rajasthan 424.75 - - 287.50 @ - 505.71 - -
17 Tamil Nadu 522.39 - - 436.76 - - 554.11 @ -
18 Tripura 310.00 - - 200.00 - - 356.67 - -
19 Uttar Pradesh 346.85 - @ 317.60 - @ 391.00 - -
20 West Bengal 297.36 - - 272.68 - - 318.51 @ @
All India 358.34 - @ 295.28 @ @ 394.95 @ @

Indian Labour Journal, September 2015
1011
June, 2015 (By States and Sex)
( in Rupees)
Weavers Beedi Makers Bamboo, Cane Basket Weavers
Men Women Children Men Women Children Men Women Children
12 13 14 15 16 17 18 19 20
@ - - @ 123.64 - 188.21 122.22 -
@ - - - - - 237.05 - -
@ @ - 152.00 @ - 167.08 @ -
@ - - @ @ - @ - -
@ - - @ - - @ @ -
@ - - - - - @ - -
- - - - - - @ - -
202.50 @ - 147.62 140.56 - 246.67 214.17 -
- @ - @ @ - @ - -
@ @ @ 106.67 99.38 @ 173.75 165.71 -
@ - - - - - 240.91 170.00 -
@ 262.50 - - - - @ @ -
@ @ - - - - @ @ -
@ - - @ @ - @ @ -
@ @ - - - - @ @ -
- - - - - - - - -
@ @ - @ @ - @ - -
300.00 - - 200.00 - - 300.00 - -
@ - - @ @ - 226.00 @ -
@ @ - 178.75 166.35 @ 140.24 124.85 @
253.63 215.80 @ 169.91 123.72 @ 219.17 165.49 @

Indian Labour Journal, September 2015
1012
Table A.2.1 (b) Contd.
( in Rupees)
Sl
No
States Handicraft Workers Plumbers
Men Women Children Men Women Children
1 2 21 22 23 24 25 26
1 Andhra Pradesh @ - - 322.36 - -
2 Assam - @ - @ - -
3 Bihar @ @ - 312.15 - -
4 Gujarat @ @ - 292.14 - -
5 Haryana @ - - 502.00 - -
6 Himachal Pradesh @ - - 449.43 - -
7 Jammu & Kashmir - - - 548.00 - -
8 Karnataka 331.25 @ - 319.58 - -
9 Kerala @ - - 696.25 - -
10 Madhya Pradesh @ @ - 236.00 - -
11 Maharashtra @ - - 305.17 - -
12 Manipur @ @ - @ - -
13 Meghalaya @ - - @ - -
14 Orissa - - - 297.50 - -
15 Punjab - - - 520.83 - -
16 Rajasthan - - - 416.15 - -
17 Tamil Nadu @ - - 491.73 - -
18 Tripura 300.00 - - 288.89 - -
19 Uttar Pradesh @ - - 347.50 - -
20 West Bengal @ @ @ 300.39 - -
All India 321.73 188.48 @ 387.86 - -

Indian Labour Journal, September 2015
1013
Table A.2.1 (b) Contd.
( in Rupees)
Electrician Construction Workers (for roads,
dams, industrial & project
construction work & well diggers
LMV & Tractors drivers
Men Women Children Men Women Children Men Women Children
27 28 29 30 31 32 33 34 35
306.20 - - 250.78 183.38 - 295.34 - -
296.25 - - 252.37 220.00 - 303.65 - -
318.08 - - 237.98 194.33 - 257.24 - -
288.33 - - 232.86 192.78 - 220.43 - -
470.20 - - 362.91 367.14 - 398.20 - -
465.14 - - 309.14 - - 287.48 - -
550.71 - - 417.50 @ - 392.33 - -
321.11 - - 287.12 197.31 - 304.17 - -
689.10 - - 782.60 @ - 739.44 - -
232.56 - - 183.83 167.94 @ 227.86 @ @
314.74 - - 264.53 196.30 - 282.98 - -
366.67 - - 332.14 @ - 455.56 - -
@ - - 225.00 @ - @ - -
267.78 - - 202.94 159.30 - 254.69 - -
509.72 - - 313.92 250.00 - 332.21 - -
417.50 - - 331.25 294.23 - 369.41 - -
482.12 - - 388.09 249.47 - 452.56 - -
294.44 - - 200.00 - - 300.00 - -
351.85 - - 230.14 193.10 @ 256.39 - -
333.62 - - 233.78 200.64 - 311.51 - -
373.98 - - 282.22 204.30 146.67 306.51 @ @

Indian Labour Journal, September 2015
1014
Table A.2.1 (b) Concld
( in Rupees)
Sl
No
States Non-agricultural labourers
(Including porters, loaders)
Sweeping/ Cleaning Workers
Men Women Children Men Women Children
1 2 36 37 38 39 40 41
1 Andhra Pradesh 220.02 145.71 - 140.63 121.44 -
2 Assam 220.07 211.25 - 202.33 @ -
3 Bihar 214.14 181.67 - 208.00 @ -
4 Gujarat 191.05 194.17 - 125.24 126.67 -
5 Haryana 352.00 - - 307.45 311.11 -
6 Himachal Pradesh 252.67 @ - @ @ -
7 Jammu & Kashmir 397.37 - - @ @ -
8 Karnataka 217.50 146.50 - 167.24 157.04 -
9 Kerala 623.74 @ - @ 453.67 -
10 Madhya Pradesh 163.41 125.29 82.86 160.27 156.21 @
11 Maharashtra 203.13 131.36 @ 200.51 137.19 @
12 Manipur @ @ - @ 160.33 -
13 Meghalaya 194.44 - - @ @ -
14 Orissa 179.95 170.90 - 126.67 115.00 -
15 Punjab 277.50 - - 223.13 205.63 -
16 Rajasthan 290.00 279.00 - @ @ -
17 Tamil Nadu 371.83 257.63 @ 169.60 197.08 -
18 Tripura 200.00 - - 203.33 - -
19 Uttar Pr adesh 210.11 178.33 @ 185.44 151.56 @
20 West Bengal 234.60 207.50 - 311.83 288.06 -
All India 245.65 179.90 96.36 199.75 189.00 @
-= Indicates that the particular category of workers, i.e. men/ women /children were not
engaged in that operation either because of their non-availability; or the activity connected with the occupation was not undertaken in the State; or the activity was out of season in the State, etc.etc
@ = Number of quotations are less than five. Note:- The average daily wage rates at all-India level are derived by dividing the sum total of
wages by number of quotations of all the states taken together.

Indian Labour Journal, September 2015
1015
3. INDUSTRIAL DISPUTES
Table A.3.1 Sector/Sphere-wise Number of Disputes, Workers involved and Mandays Lost
due to Industrial Disputes during January to June, 2015 (P)
Sphere/
Item Public Sector Private Sector Total
Number of Number of Number of
Dis-
putes
Workers
Involved
Mandays
Lost
Dis-
putes
Workers
Involved
Mandays
Lost
Dis-
putes
Workers
Involved
Mandays
Lost
1 2 3 4 5 6 7 8 9 10
(i) Central Sphere
Strikes 14 122650 229754 2 4037 4037 16 126687 233791
Lockouts - - - - - - - - -
Strikes &
Lockouts
(Total-i)
14 122650 229754 2 4037 4037 16 126687 233791
(ii) State Sphere
Strikes 3
354
662
30
13766
394926
33
14120
395588
Lockouts -
-
-
15
3525
250921
15
3525
250921
Strikes &
Lockouts
(Total-ii)
3
354
662
45
17291
645847
48
17645
646509
Grand Total
(Total-i+ ii)
17 123004 230416 47 21328 649884 64 144332 880300
(P) = Provisional and based on the returns /clarifications received in the Bureau till 31st July,
2015.
- = Nil

Indian Labour Journal, September 2015
1016
Table A.3.2- Industrial Disputes (All Strikes and Lockouts) during January to June, 2015 (P)
State/Union Territory Number of
Disputes Workers
Involved
Mandays Lost
1 2 3 4 Andhra Pradesh 9 4985 343045 Arunachal Pradesh .. .. .. Assam 2 393 4476 Bihar .. .. .. Chhattisgarh 3 6491 20246 Goa @ @ @ Gujarat 3 910 9105 Haryana 2 425 32416 Himachal Pradesh .. .. .. Jammu & Kashmir .. .. .. Jharkhand .. .. .. Karnataka 2 3266 5782 Kerala 8 1902 150805 Madhya Pradesh 6 64971 130364 Maharashtra 1 19740 39480 Manipur .. .. .. Meghalaya @ @ @ Mizoram # # # Nagaland .. .. .. Orissa .. .. .. Punjab - - - Rajasthan 7 7509 41101 Sikkim # # # Tamil Nadu 19 7604 77344 Telangana .. .. .. Tripura @ @ @ Uttarakhand .. .. .. Uttar Pradesh 1 839 839 West Bengal 1 25297 25297 A & N Islands @ @ @ Chandigarh @ @ @ Dadra & Nagar Haveli .. .. .. Delhi .. .. .. Daman & Diu - - - Lakshadweep @ @ @ Puducherry @ @ @ All India 64 144332 880300 (P) = Provisional and based on the returns /clarifications received in the Bureau till 31st July,2015.
.. = Not available - = Nil @ = Partially received
# = ID Act 1947 is to be implemented.
Indian Labour Journal, September 2015
1017
SECTION B
SERIAL STATISTICS
N O T E
1 Prices and Price Indices
1.1. Industrial Worker’s Consumer Price Index
B.1.1.1. All-India Consumer Price Index Numbers for Industrial Workers – The All India
Consumer Price Index Numbers (General and Food) on base 1982=100 were being published
since their first release with effect from October, 1988 index replacing the old series on base:
1960=100. The Labour Bureau has released the new series of Consumer Price Index Numbers
for Industrial Workers on base: 2001=100 with the index of January, 2006 which has replaced
the previous series on base: 1982=100. The indices for the old base (1960=100) series can be
derived by multiplying the 1982 series indices by the Linking Factors, which are 4.93 for the
general index and 4.98 for the food index. Similarly, the indices for 1982 series can be derived
by multiplying the 2001 series indices by the Linking factors, which are 4.63 and 4.58 for
General and Food group respectively. The Annual Average (Calendar year 1992 to 2014 as well
as Financial year 1992-93 to 2014-2015) and monthly All India Index Numbers (General&
Food) from June, 2014 to June, 2015 have been presented in Table B.1.1.1.
B.1.1.2. Labour Bureau’s Series of Consumer Price Index Numbers for Industrial Workers – Serial Statistics in respect of Consumer Price Index Numbers for Industrial Workers on base 1982=100 and new series on base: 2001=100 (General Index only) for 78 centres are set out in Table B.1.1.2.
1.2 Consumer Price Index Numbers for Agricultural Labourers
B.1.2.1(a) and (b). All-India Consumer Price Index Numbers for Agricultural and Rural
Labourers (Base: 1986-87=100) – Serial statistics relating to the All-India Consumer Price
Index Numbers (General and Food) for Agricultural and Rural Labourers on base 1986-87=100
separately for Agricultural Years from 1995-96 to 2014-15, Financial Years from 1995-96 to
2014-15 and Calendar Years from 1995 to 2014, along with month-wise indices and 12-monthly
moving averages from June, 2014 to June, 2015 are presented in Tables B.1.2.1 (a) and (b)
respectively.
B.1.2.2 (a) and (b) Labour Bureau’s Series of Consumer Price Index Numbers for
Agricultural Labourers and Rural Labourers on Base: 1986-87=100 – Serial statistics
in respect of Consumer Price Index Numbers (General Index) for Agricultural
Labourers and Rural Labourers (Base: 1986-87=100) for 20 States are given in Tables
B.1.2.2 (a) and (b) respectively.
Indian Labour Journal, September 2015
1018
1.3. Urban Non-Manual Employees Consumer Price Index / Consumer Price Index for
Urban and Rural Areas
B.1.3. Consumer Price Index Numbers for Urban Non-Manual Employees (Base:1984-85=100); Consumer Price Index for Urban and Rural Areas on base: 2010=100 and on base 2012=100
Consumer Price Index for Urban Non-Manual Employees on base: 1984-85=100 were compiled and published by the Central Statistical Organisation (CSO), New Delhi. The Price collection for CPI (UNME) was discontinued with effect from April, 2008. As decided by the National Statistical Commission, linked all-India CPI (UNME) numbers for the year 2008 to 2010 are given in Serial Statistics.
The Central Statistics Office (CSO) released Consumer Price Indices (CPI) on base 2010=100 for all-India and States/UTs separately for rural, urban and combined every month with effect from January, 2011 uptill December 2014. The base has further been revised as 2012=100 with the release of January 2015 index. Consumer Price Index for Urban and Rural areas for the period June, 2014 to June, 2015 have been presented in Table B.1.3.
1.4. Wholesale Price Index
B.1.4. All India Index Numbers of Wholesale prices (Base: 2004-05=100) – The current series of Index Numbers of Wholesale Prices in India on base 2004-05=100 was released w.e.f. September, 2010 by replacing the earlier series. These Index Numbers are compiled and published by the Office of the Economic Adviser, Ministry of Commerce & Industry, Govt. of India, New Delhi. The indices for the period 1992 to 2014 (Annual Averages) June, 2014 to June, 2015 (Monthly Figures) are set out in Table B.1.4.
2. Wages and Earnings
B.2.1. Earnings(Basic Wage and Dearness Allowance) of the Lowest-paid Workers/Operatives in Cotton Textile Mills – The information concerning earnings of cotton producing Centres/States received from the State Governments, Employers‘ Associations and Individual Units is presented in Table B.2.1. The earnings of workers include minimum basic wage and dearness Allowance by whatever name called. The dearness allowance is linked to the Working Class Consumer Price Index Numbers of different Centres and varies from month to month according to the variation in the index.
3. Industrial Disputes
B.3.1. Industrial Disputes (All Strikes and Lockouts) – Industrial Disputes Statistics for the Years 2007 to 2015 are presented in Table B.3.1
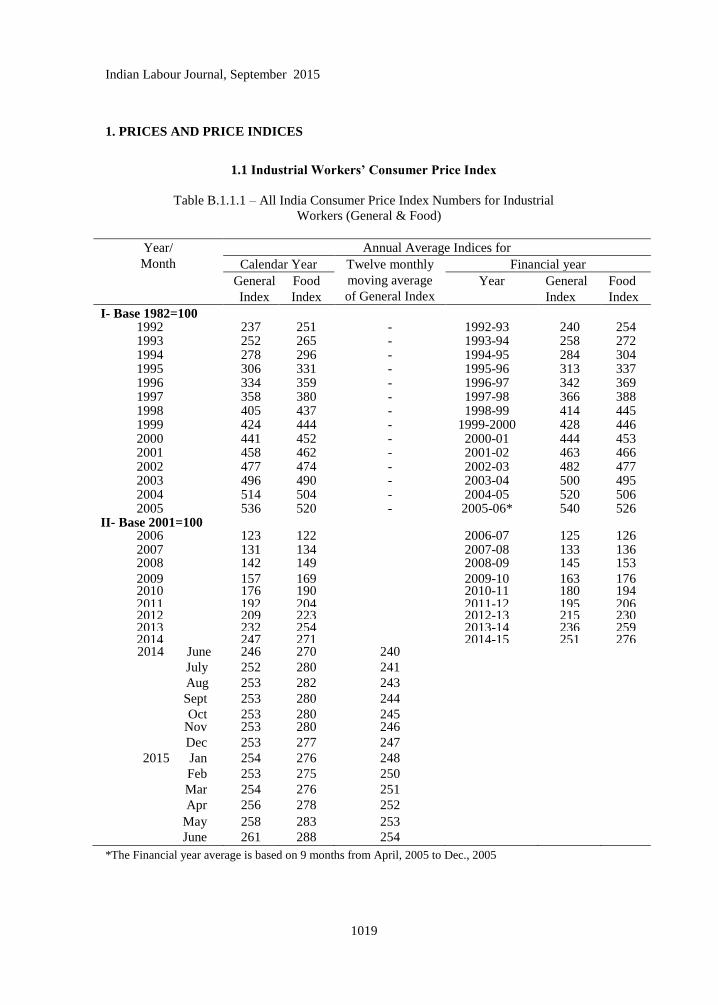
Indian Labour Journal, September 2015
1019
1. PRICES AND PRICE INDICES
1.1 Industrial Workers’ Consumer Price Index
Table B.1.1.1 – All India Consumer Price Index Numbers for Industrial
Workers (General & Food)
Year/
Month
Annual Average Indices for
Calendar Year Twelve monthly
moving average
of General Index
Financial year
General
Index
Food
Index
Year General
Index
Food
Index
I- Base 1982=100 1992 237 251 - 1992-93 240 254 1993 252 265 - 1993-94 258 272 1994 278 296 - 1994-95 284 304 1995 306 331 - 1995-96 313 337 1996 334 359 - 1996-97 342 369 1997 358 380 - 1997-98 366 388 1998 405 437 - 1998-99 414 445 1999 424 444 - 1999-2000 428 446 2000 441 452 - 2000-01 444 453 2001 458 462 - 2001-02 463 466 2002 477 474 - 2002-03 482 477 2003 496 490 - 2003-04 500 495 2004 514 504 - 2004-05 520 506 2005
536 520 - 2005-06* 540 526 II- Base 2001=100
2006 123 122 2006-07 125 126 2007 131 134 2007-08 133 136 2008 142 149 2008-09 145 153
2009 157 169 2009-10 163 176 2010 176 190 2010-11 180 194 2011 192 204 2011-12 195 206 2012 209 223 2012-13 215 230 2013 232 254 2013-14 236 259 2014 247 271 2014-15 251 276
2014 June 246 270 240 July 252 280 241 Aug 253 282 243
Sept 253 280 244 Oct 253 280 245
Nov 253 280 246 Dec 253 277 247
2015 Jan 254 276 248 Feb 253 275 250 Mar 254 276 251 Apr 256 278 252
May 258 283 253 June 261 288 254
*The Financial year average is based on 9 months from April, 2005 to Dec., 2005

Indian Labour Journal, September 2015
1020
Table B.1.1.2- Labour Bureau‘s Series of Consumer Price Index Numbers of Industrial Workers
(General Index)
Year/
month
Guntur Vijaya-
wada
Vishakha
pathanam
DoomDooma
Tinsukia
Guwahati Labac
Silchar
Mariani
Jorhat
Base Year 1960= 100 1960= 100 1960=
100
1960=
100
L. Factor 5.60 * 4.05 * 3.96 3.95
1 2 3 4 5 6 7 8
I- Base-1982=100 1992 239 238 216 235 217 229 1993 256 249 233 252 233 244 1994 281 264 255 280 251 264 1995 305 293 281 312 274 296 1996 332 319 309 341 295 324 1997 356 343 320 357 312 339 1998 394 388 362 405 345 389 1999 414 410 386 436 375 416 2000 431 436 389 460 370 418 2001 438 444 384 471 372 411 2002 473 469 398 480 374 411 2003 504 484 416 496 383 432 2004 510 501 430 516 411 441 2005 523 525 450 531 415 449
II. Base 2001=100
Linking Factor
with previous
base: 1982=100 4.57 * 4.64 4.04 4.80 3.65 4.01
2006 120 119 119 116 115 121 116 2007 126 126 126 125 120 130 127 2008 139 137 135 133 128 143 133 2009 161 161 153 147 143 155 147 2010 181 180 173 160 156 178 158 2011 194 188 192 170 168 186 171 2012 208 207 213 182 184 197 185 2013 233 236 236 196 198 216 195 2014 251 240 249 213 214 243 217 2014 June 249 241 250 210 214 244 216
July 255 246 255 216 216 245 219 Aug 257 245 256 220 217 246 224 Sept 256 241 254 222 219 248 224 Oct 256 241 254 224 221 250 227
Nov 257 243 256 227 219 249 229 Dec 257 241 255 225 217 245 227
2015 Jan 258 243 255 224 217 241 224 Feb 254 242 253 226 216 242 223
Mar 255 242 254 223 216 240 222 Apr 252 243 257 226 219 240 225
May 256 246 260 229 219 241 227 June 257 252 264 234 224 246 228

Indian Labour Journal, September 2015
1021
Rangapara
Tezpur
Monghyr
Jamalpur
Chandigarh Bhilai Delhi Goa Ahmedabad
1960= 100 1960= 100 * 1966= 100 1960= 100 1966= 100 1960= 100
4.29 5.29 3.49 4.97 3.40 4.78
9 10 11 12 13 14 15
230 234 236 214 247 257 241
246 242 252 229 272 285 250
266 267 271 250 299 310 279
295 288 294 272 327 339 303
323 316 315 302 346 373 333
340 331 345 323 380 416 357
390 379 401 361 447 451 399
412 415 447 373 480 482 422
408 416 460 390 514 520 441
419 416 488 407 529 555 460
417 435 514 413 550 577 476
427 459 526 439 570 592 488
433 479 560 459 598 614 507
439 511 615 480 648 634 519
4.17 4.30 5.26 4.20 5.60 5.59 4.62 114 126 125 121 122 121 120
126 134 131 132 128 130 129
131 145 140 145 137 144 138 144 162 155 162 147 164 151 154 182 175 180 163 188 171
163 199 197 206 176 203 186 171 215 213 241 191 222 206 186 238 232 265 209 248 233 213 253 245 277 223 258 238 210 250 243 277 222 266 237 216 255 248 284 229 270 246 219 257 251 282 229 262 243 222 256 251 284 230 252 245 225 268 248 284 230 263 245 224 266 247 285 229 263 244 222 264 246 284 227 261 240 222 263 247 279 228 264 242 222 264 248 277 227 265 241 223 265 249 278 228 275 241 225 269 250 283 229 277 241 222 269 254 287 232 282 247 227 271 253 288 232 282 250

Indian Labour Journal, September 2015
1022
Table B.1.1.2 Contd.
Year/
month
Bhavnagar Rajkot Surat Vadodra Faridabad Yamuna-nagar
Himachal
Pradesh
Base Year 1960= 100 1960=
100 1965= 100
L. Factor 4.99 * * * * 5.53 3.75 1 16 17 18 19 20 21 22
I- Base-1982=100 1992 244 237 252 240 224 218 226 1993 259 246 260 252 244 235 244 1994 294 276 292 278 268 259 268 1995 318 296 320 303 295 292 292 1996 350 332 356 332 326 315 314 1997 373 350 373 350 359 335 340 1998 425 393 417 385 426 378 386 1999 447 409 432 405 435 392 407 2000 466 430 446 430 443 412 430 2001 483 433 474 453 469 428 447 2002 492 447 484 467 480 443 454 2003 504 457 490 470 499 462 466 2004 523 465 490 485 532 486 488 2005 537 496 505 500 550 521 510
II. Base 2001=100
Linking Factor
with previous
base: 1982=100 4.76 4.38 4.54 4.39 4.79 4.34 4.53 2006 119 118 118 120 122 127 120 2007 129 126 127 127 130 133 126 2008 135 132 134 133 145 145 135 2009 147 146 146 147 160 162 147 2010 174 174 162 167 182 183 161 2011 189 193 174 180 194 197 172 2012 206 216 192 198 207 215 188 2013 221 231 218 219 218 230 208 2014 225 237 224 230 226 241 222 2014 June 224 236 222 226 221 241 221
July 233 240 228 233 230 244 227 Aug 235 245 234 241 232 244 229 Sept 234 241 232 239 232 243 228 Oct 233 240 234 240 232 245 227
Nov 233 240 233 237 230 243 225 Dec 231 239 232 233 229 242 224
2015 Jan 231 242 232 237 232 243 225 Feb 229 243 233 236 231 242 225
Mar 236 243 232 237 234 243 226 Apr 237 244 231 241 235 245 227
May 240 248 235 241 237 245 229 June 240 247 237 243 236 246 230

Indian Labour Journal, September 2015
1023
Srinagar Bokaro Giridih Jamshedpur Jharia Kodarma Ranchi Hatia
1960= 100
1960= 100 1960= 100 1960= 100
5.47 4.68 4.63 5.43 *
23 24 25 26 27 28 29
231 226 218 215 233
252 239 226 228 247
271 260 244 248 269
303 280 262 265 292
321 321 286 290 320
347 340 301 310 340
414 385 353 359 402
471 397 363 379 414
480 405 363 368 418
520 419 365 373 426
547 431 374 388 433
574 456 393 402 438
599 479 414 426 470
632 508 442 471 497
5.62 * * 4.23 3.72 3.89 4.20 118 121 134 126 126 132 125
125 130 146 132 136 140 133
134 142 156 142 146 149 148
155 158 177 157 161 169 170
159 168 204 182 180 190 199
172 192 232 213 198 215 220 190 210 250 232 222 236 235
203 229 282 251 262 263 267
217 251 293 265 279 285 286 216 251 289 266 277 285 285 222 257 291 274 281 289 291
223 258 291 272 282 293 294 223 258 289 269 283 294 294
230 257 294 271 283 295 293
224 257 293 268 281 298 293 222 254 289 266 279 286 286 226 254 286 273 280 284 286 225 256 287 274 280 287 287 226 257 288 273 281 287 290 235 261 282 276 282 286 288 232 269 287 277 283 287 292 232 270 286 283 286 291 295
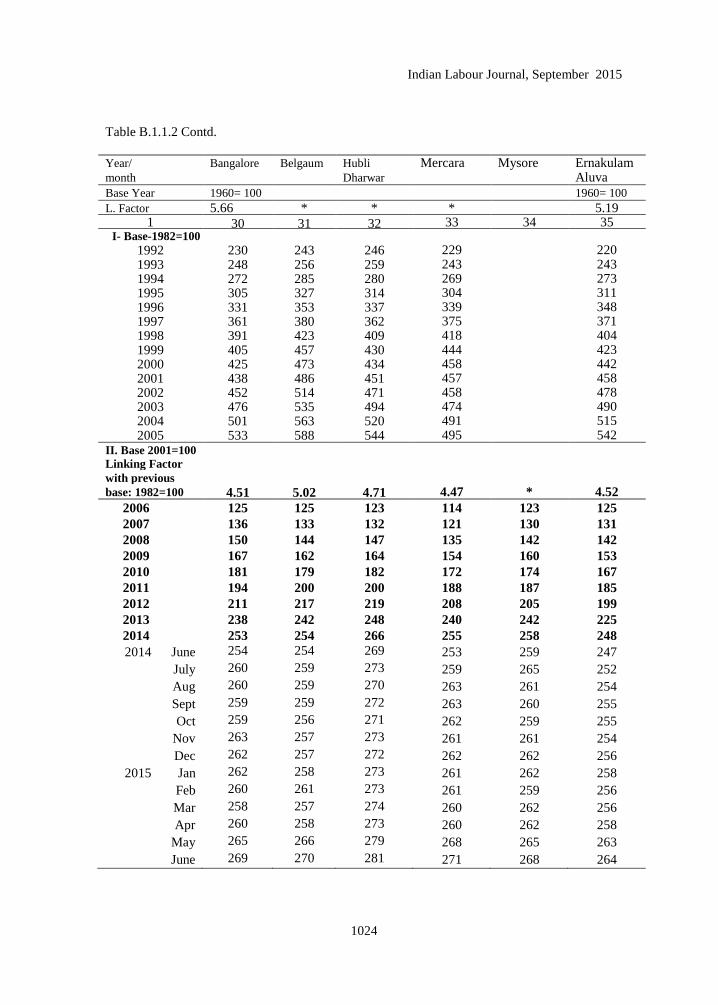
Indian Labour Journal, September 2015
1024
Table B.1.1.2 Contd.
Year/
month
Bangalore Belgaum Hubli
Dharwar
Mercara Mysore Ernakulam Aluva
Base Year 1960= 100 1960= 100
L. Factor 5.66 * * * 5.19 1 30 31 32 33 34 35
I- Base-1982=100 1992 230 243 246 229 220 1993 248 256 259 243 243 1994 272 285 280 269 273 1995 305 327 314 304 311 1996 331 353 337 339 348 1997 361 380 362 375 371 1998 391 423 409 418 404 1999 405 457 430 444 423 2000 425 473 434 458 442 2001 438 486 451 457 458 2002 452 514 471 458 478 2003 476 535 494 474 490 2004 501 563 520 491 515 2005 533 588 544 495 542
II. Base 2001=100 Linking Factor with previous base: 1982=100 4.51 5.02 4.71 4.47 * 4.52
2006 125 125 123 114 123 125
2007 136 133 132 121 130 131
2008 150 144 147 135 142 142
2009 167 162 164 154 160 153
2010 181 179 182 172 174 167
2011 194 200 200 188 187 185
2012 211 217 219 208 205 199
2013 238 242 248 240 242 225
2014 253 254 266 255 258 248
2014 June 254 254 269 253 259 247
July 260 259 273 259 265 252
Aug 260 259 270 263 261 254
Sept 259 259 272 263 260 255
Oct 259 256 271 262 259 255
Nov 263 257 273 261 261 254
Dec 262 257 272 262 262 256
2015 Jan 262 258 273 261 262 258
Feb 260 261 273 261 259 256
Mar 258 257 274 260 262 256
Apr 260 258 273 260 262 258
May 265 266 279 268 265 263
June 269 270 281 271 268 264
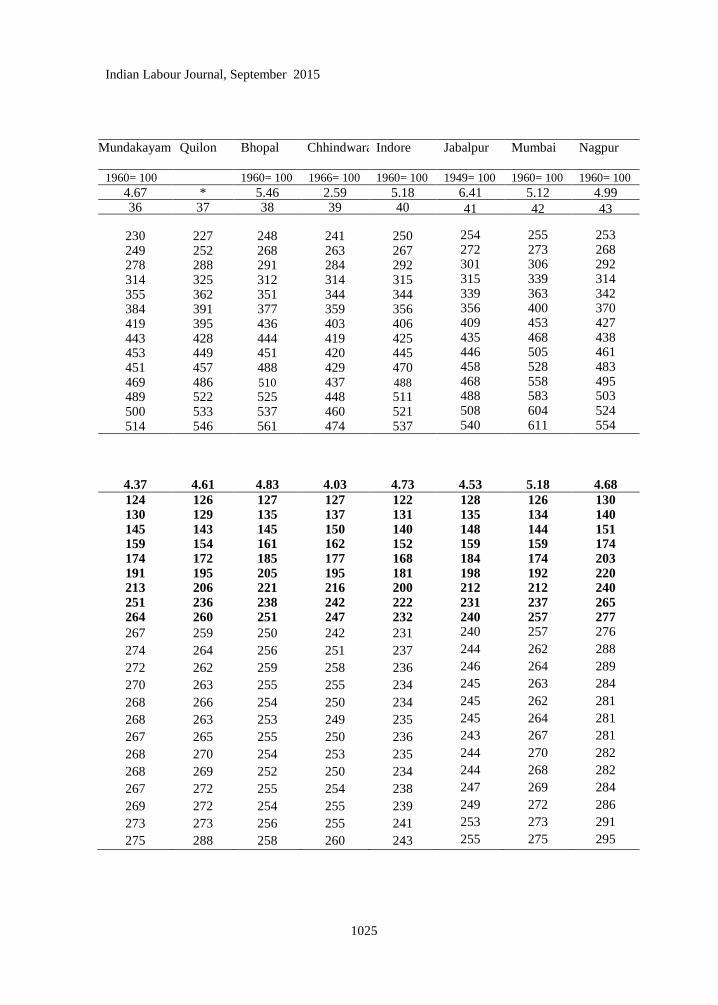
Indian Labour Journal, September 2015
1025
Mundakayam Quilon Bhopal
Chhindwara Indore Jabalpur Mumbai Nagpur
1960= 100 1960= 100 1966= 100 1960= 100 1949= 100 1960= 100 1960= 100
4.67 * 5.46 2.59 5.18 6.41 5.12 4.99 36 37 38 39 40 41 42 43
230 227 248 241 250 254 255 253
249 252 268 263 267 272 273 268
278 288 291 284 292 301 306 292
314 325 312 314 315 315 339 314
355 362 351 344 344 339 363 342
384 391 377 359 356 356 400 370
419 395 436 403 406 409 453 427
443 428 444 419 425 435 468 438
453 449 451 420 445 446 505 461
451 457 488 429 470 458 528 483
469 486 510 437 488 468 558 495
489 522 525 448 511 488 583 503
500 533 537 460 521 508 604 524
514 546 561 474 537 540 611 554
4.37 4.61 4.83 4.03 4.73 4.53 5.18 4.68
124 126 127 127 122 128 126 130 130 129 135 137 131 135 134 140 145 143 145 150 140 148 144 151 159 154 161 162 152 159 159 174 174 172 185 177 168 184 174 203 191 195 205 195 181 198 192 220 213 206 221 216 200 212 212 240 251 236 238 242 222 231 237 265 264 260 251 247 232 240 257 277
267 259 250 242 231 240 257 276
274 264 256 251 237 244 262 288
272 262 259 258 236 246 264 289
270 263 255 255 234 245 263 284
268 266 254 250 234 245 262 281
268 263 253 249 235 245 264 281
267 265 255 250 236 243 267 281
268 270 254 253 235 244 270 282
268 269 252 250 234 244 268 282
267 272 255 254 238 247 269 284
269 272 254 255 239 249 272 286
273 273 256 255 241 253 273 291
275 288 258 260 243 255 275 295

Indian Labour Journal, September 2015
1026
Table B.1.1.2 Contd.
Year/
month
Nasik Pune Solapur Angul Talcher
Rourkela Pondicherry Amritsar
Base Year 1960= 100 1966= 100 1960= 100
L. Factor * * 5.03 3.59 * 5.19 44 45 46 47 48 49 50 I- Base-1982=100
1992 255 253 260 216 256 220 1993 270 266 264 232 279 238 1994 296 296 289 254 313 261 1995 322 330 327 275 344 278 1996 353 359 357 303 387 298 1997 377 388 371 341 428 314 1998 423 448 431 390 464 369 1999 432 466 450 396 467 379 2000 465 493 467 406 477 388 2001 498 516 471 407 482 403 2002 514 528 486 416 510 418 2003 532 554 501 432 543 431 2004 554 574 529 453 556 452 2005 576 589 539 473 580 492
II. Base 2001=100
Linking Factor with
previous
base: 1982=100 4.94 4.96 4.73 *
4.03
4.88
4.09
2006 124 127 123 120 124 123 130 2007 130 136 139 128 137 130 139 2008 139 146 149 143 149 146 149 2009 157 162 160 160 166 163 163 2010 181 181 179 181 186 173 190 2011 204 200 199 200 204 184 208 2012 223 217 216 221 222 209 227 2013 242 237 239 241 245 237 240 2014 255 254 261 256 260 256 255
2014 June 253 252 255 254 258 257 255
July 257 256 262 262 265 262 261
Aug 265 260 264 263 266 262 261
Sept 265 261 262 262 269 260 263
Oct 265 259 267 262 269 258 262
Nov 265 258 270 260 268 259 259
Dec 266 258 271 259 266 262 257
2015 Jan 267 259 272 258 259 264 258
Feb 267 259 272 258 258 261 258
Mar 267 261 272 259 259 260 260
Apr 266 260 276 261 263 264 261
May 272 264 277 262 265 267 260
June 272 266 281 264 270 271 260

Indian Labour Journal, September 2015
1027
Table B.1.1.2 contd.
Jalandhar Ludhiana Ajmer Bhilwara Jaipur
Chennai
Coimbatore Coonoor
1960= 100 1966=100 1960= 100 1960= 100 1960= 100 1960= 100
* 5.01 3.20 5.17 5.05 5.35 4.80
51 52 53 54 55 56 57 58 219 243 240 228 238 228 245 237 253 253 245 258 245 262 262 280 290 269 287 272 291 285 305 310 291 330 303 325 301 332 333 321 356 330 348 320 357 350 346 382 354 377 374 392 393 387 425 383 404 381 411 420 390 446 402 414 396 433 439 403 475 432 433 413 452 460 423 487 441 445 431 472 474 442 513 472 473 441 487 488 452 533 495 497 469 510 505 467 549 500 501 504 537 532 495 565 508 511
* 4.12 4.78 4.62 4.25 4.95 4.49 4.58
126 129 122 125 127 118 119 115 131 134 129 133 134 124 127 122 141 146 138 144 145 135 137 134 155 160 152 158 159 149 151 148 174 175 175 176 179 161 166 168 190 188 191 192 192 171 176 182 205 205 215 215 214 196 193 204 224 222 233 236 230 218 217 224 239 235 240 245 238 230 231 241
239 230 239 240 235 229 232 240
242 240 245 249 243 235 238 246
242 243 246 254 246 234 235 245
243 243 245 250 245 230 236 244
244 243 244 250 243 230 235 248
243 241 244 252 240 241 240 254
244 241 243 257 240 242 242 254
246 243 245 256 240 239 237 251
245 241 245 256 239 237 237 250
245 241 247 257 242 236 236 250
245 245 248 257 242 240 237 253
246 246 248 256 243 246 241 261
247 246 247 258 243 251 244 263

Indian Labour Journal, September 2015
1028
Table B.1.1.2 Contd.
Year/
month
Madurai Salem Tiruchira-pally
Godavari
khani
Hyderabad Warrangal
Base Year 1960= 100 * * 2 1960= 100
L. Factor 5.27 5.23 *
59 60 61 62 63 64 I- Base-1982=100
1992 240 223 240 227 237 1993 256 241 259 237 243
1994 281 287 295 258 274 1995 318 322 330 283 300
1996 346 348 364 308 324
1997 366 364 406 331 344 1998 401 394 435 377 399
1999 423 414 463 395 415 2000 440 432 481 419 440
2001 446 443 488 438 464
2002 459 464 533 468 501 2003 482 483 568 496 526
2004 496 482 544 512 530 2005 509 481 579 532 555
II. Base 2001=100 Linking Factor with
previous base 1982=100
4.51
4.45
5.01 * 4.79 4.75
2006 116 114 119 125 116 123 2007 121 122 126 135 123 133 2008 134 134 141 150 135 149
2009 147 151 156 169 152 172 2010 162 163 174 193 165 199
2011 174 172 184 200 174 204 2012 196 192 208 216 190 222 2013 218 216 232 242 207 247 2014 239 233 253 262 217 259
2014 June 237 231 252 263 215 258
July 244 238 261 269 220 267
Aug 245 239 259 271 221 267
Sept 242 239 260 267 221 265
Oct 245 242 258 268 220 265
Nov 257 247 265 267 221 264
Dec 257 245 270 266 220 263
2015 Jan 253 245 269 267 220 262
Feb 251 243 262 267 221 262
Mar 249 241 250 267 222 265
Apr 253 244 251 265 223 266
May 261 248 258 269 226 266
June 260 252 258 278 229 272
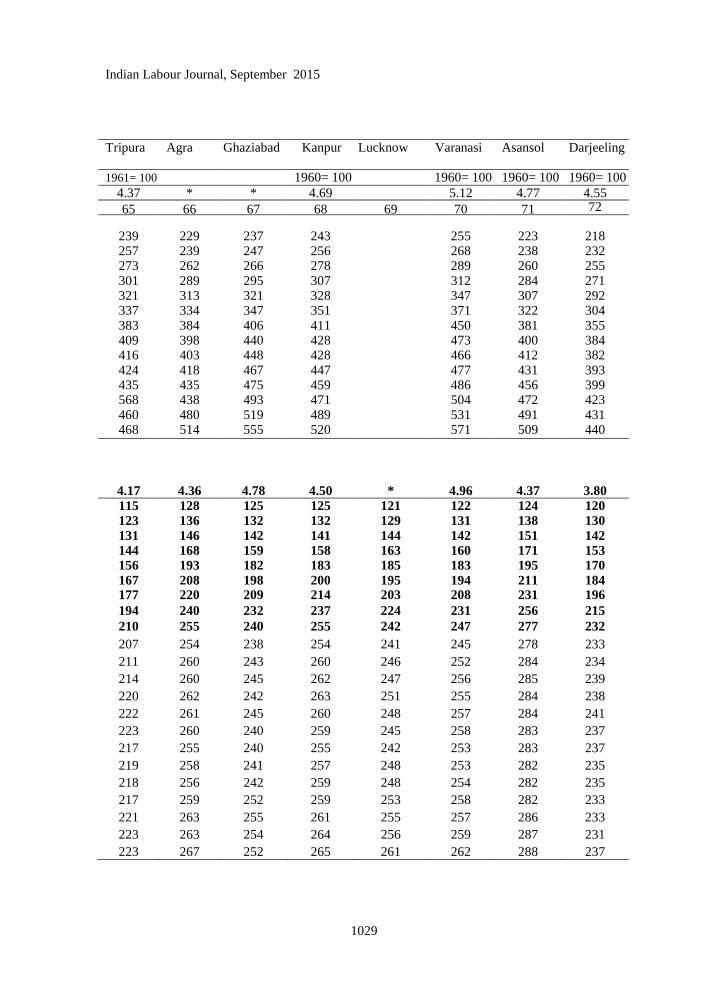
Indian Labour Journal, September 2015
1029
Tripura Agra Ghaziabad Kanpur Lucknow Varanasi Asansol
Darjeeling
1961= 100 1960= 100 1960= 100 1960= 100 1960= 100
4.37 * * 4.69 5.12 4.77 4.55
65 66 67 68 69 70 71 72
239 229 237 243 255 223 218 257 239 247 256 268 238 232 273 262 266 278 289 260 255 301 289 295 307 312 284 271 321 313 321 328 347 307 292 337 334 347 351 371 322 304 383 384 406 411 450 381 355 409 398 440 428 473 400 384 416 403 448 428 466 412 382 424 418 467 447 477 431 393 435 435 475 459 486 456 399 568 438 493 471 504 472 423 460 480 519 489 531 491 431 468 514 555 520 571 509 440
4.17 4.36 4.78 4.50 * 4.96 4.37 3.80
115 128 125 125 121 122 124 120
123 136 132 132 129 131 138 130
131 146 142 141 144 142 151 142
144 168 159 158 163 160 171 153
156 193 182 183 185 183 195 170
167 208 198 200 195 194 211 184 177 220 209 214 203 208 231 196
194 240 232 237 224 231 256 215
210 255 240 255 242 247 277 232
207 254 238 254 241 245 278 233
211 260 243 260 246 252 284 234
214 260 245 262 247 256 285 239
220 262 242 263 251 255 284 238
222 261 245 260 248 257 284 241
223 260 240 259 245 258 283 237
217 255 240 255 242 253 283 237
219 258 241 257 248 253 282 235
218 256 242 259 248 254 282 235
217 259 252 259 253 258 282 233
221 263 255 261 255 257 286 233
223 263 254 264 256 259 287 231
223 267 252 265 261 262 288 237

Indian Labour Journal, September 2015
1030
Table B.1.1.2 Concld.
Year/
month
Durgapur
Haldia Howrah Jalpaiguri Kolkata Raniganj Siliguri
Base Year 1960= 100 1960= 100 1960= 100 1960= 100
L. Factor * * 4.12 4.16 4.74 4.40
73 74 75 76 77 78 79
I- Base-1982=100
1992 242 248 253 221 238 218 1993 262 268 271 232 257 229 1994 286 288 293 252 280 249 1995 312 328 323 280 312 274 1996 346 359 346 299 340 298 1997 368 385 364 312 359 314 1998 430 433 439 379 416 357 1999 443 464 482 399 437 373 2000 472 481 499 400 451 380 2001 509 533 519 407 492 399 2002 553 582 542 417 530 416 2003 564 590 556 421 541 426 2004 581 608 587 440 565 450 2005 592 624 620 452 587 471
II. Base 2001=100
Linking Factor with previous
base 1982=100 5.13 5.64 5.42 3.96 5.12 4.02 *
2006 121 116 121 117 121 124 124 2007 130 124 130 125 132 132 135 2008 140 131 139 136 142 140 144 2009 155 144 154 150 156 156 156 2010 178 161 171 167 172 169 173 2011 193 185 183 179 185 180 187 2012 215 211 199 192 199 195 197 2013 263 230 215 221 222 214 218 2014 282 241 228 241 239 228 233
2014 June 281 242 230 241 240 227 231
July 286 248 233 243 242 232 235
Aug 285 248 232 244 244 234 237
Sept 284 247 233 248 243 235 237
Oct 285 246 235 251 246 235 240
Nov 286 244 233 249 242 235 238
Dec 284 244 235 246 243 233 235
2015 Jan 283 262 235 245 243 232 232
Feb 282 260 233 243 242 233 229
Mar 282 260 233 244 242 232 232
Apr 283 261 237 246 246 231 234
May 284 263 237 246 247 230 236
June 286 268 238 250 251 237 238 * No Linking Factor as these centres were not covered in any of the earlier series Linking Factor - Figures on previous base: 1982=100 and 1960=100 (General Index) can be obtained by multiplying the index numbers of new base: 2001=100 by the respective linking factors given against each centre and rounding off the result to the nearest whole number.
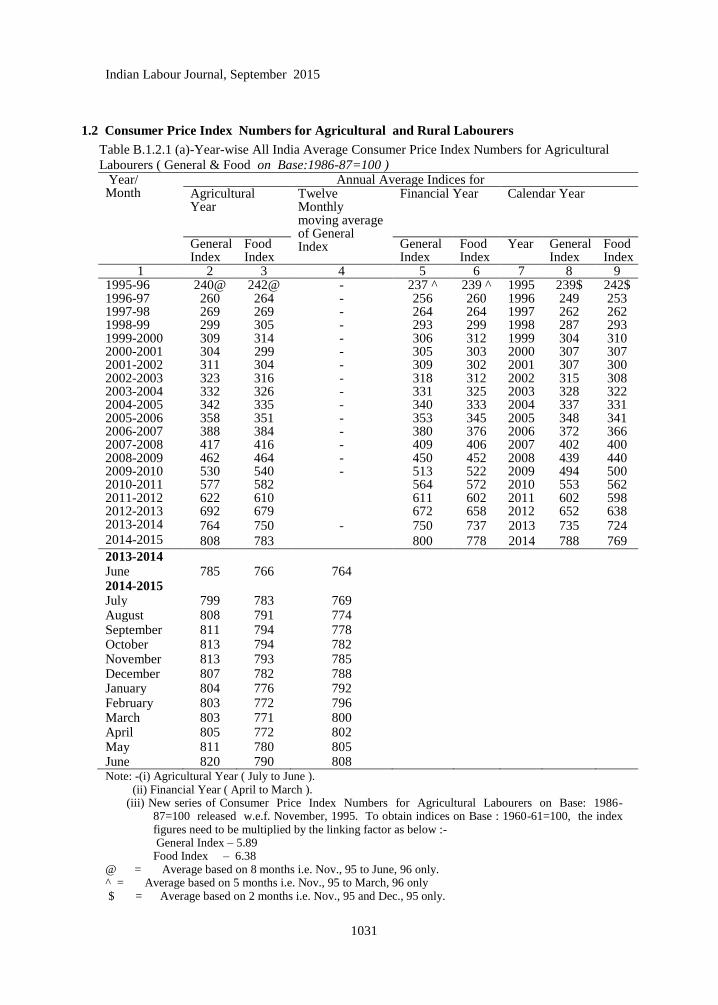
Indian Labour Journal, September 2015
1031
1.2 Consumer Price Index Numbers for Agricultural and Rural Labourers
Table B.1.2.1 (a)-Year-wise All India Average Consumer Price Index Numbers for Agricultural
Labourers ( General & Food on Base:1986-87=100 ) Year/ Month
Annual Average Indices for Agricultural Year
Twelve Monthly moving average of General Index
Financial Year Calendar Year
General Index
Food Index
General Index
Food Index
Year General Index
Food Index
1 2 3 4 5 6 7 8 9 1995-96 240@ 242@ - 237 ^ 239 ^ 1995 239$ 242$ 1996-97 260 264 - 256 260 1996 249 253 1997-98 269 269 - 264 264 1997 262 262 1998-99 299 305 - 293 299 1998 287 293 1999-2000 309 314 - 306 312 1999 304 310 2000-2001 304 299 - 305 303 2000 307 307 2001-2002 311 304 - 309 302 2001 307 300 2002-2003 2003-2004
323 332
316 326
- -
318 331
312 325
2002 2003
315 328
308 322
2004-2005 342 335 - 340 333 2004 337 331 2005-2006 358 351 - 353 345 2005 348 341 2006-2007 388 384 - 380 376 2006 372 366 2007-2008 2008-2009
417 462
416 464
- -
409 450
406 452
2007 2008
402 439
400 440
2009-2010 530 540 - 513 522 2009 494 500 2010-2011 577 582 564 572 2010 553 562 2011-2012 622 610 611 602 2011 602 598 2012-2013 692 679 672 658 2012 652 638 2013-2014 764 750 - 750 737 2013 735 724 2014-2015 808 783 800 778 2014 788 769
2013-2014 June 785 766 764 2014-2015 July 799 783 769 August 808 791 774 September 811 794 778 October 813 794 782 November 813 793 785 December 807 782 788 January 804 776 792 February 803 772 796 March 803 771 800 April 805 772 802 May 811 780 805 June 820 790 808 Note: -(i) Agricultural Year ( July to June ). (ii) Financial Year ( April to March ). (iii) New series of Consumer Price Index Numbers for Agricultural Labourers on Base: 1986-
87=100 released w.e.f. November, 1995. To obtain indices on Base : 1960-61=100, the index figures need to be multiplied by the linking factor as below :-
General Index – 5.89 Food Index – 6.38 @ = Average based on 8 months i.e. Nov., 95 to June, 96 only. ^ = Average based on 5 months i.e. Nov., 95 to March, 96 only $ = Average based on 2 months i.e. Nov., 95 and Dec., 95 only.

Indian Labour Journal, September 2015
1032
Table B.1.2.1 (b)-Year-wise All India Average Consumer Price Index Numbers or Rural
Labourers ( General & Food on Base:1986-87=100 )
Year/
Month
Annual Average Indices for
Agricultural
Year
Twelve
Monthly
moving average
of General
Index
Financial Year Calendar Year
General
Index
Food
Index
General
Index
Food
Index
Year General
Index
Food
Index
1 2 3 4 5 6 7 8 9
1995-96 240@ 242@ - 238^ 240^ 1995 239$ 242$
1996-97 260 264 - 256 260 1996 250 253
1997-98 270 270 - 266 265 1997 263 263
1998-99 299 305 - 294 300 1998 288 293
1999-2000 310 313 - 307 311 1999 305 310
2000-2001 306 300 - 307 303 2000 308 307
2001-2002 313 305 - 311 303 2001 309 302
2002-2003 325 317 - 321 312 2002 318 309
2003-2004 335 327 - 333 326 2003 331 323
2004-2005 344 335 - 342 333 2004 340 332
2005-2006 360 352 - 355 346 2005 351 341
2006-2007
2007-2008
2008-2009
2009-2010
2010-2011
2011-2012
2012-2013
2013-2014
389
418
462
529
577
623
693
765
384
416
463
541
582
611
681
751
-
-
-
-
-
-
-
-
382
409
451
513
564
611
673
751
376
406
452
523
573
603
660
738
2006
2007
2008
2009
2010
2011
2012
2013
373
403
440
494
552
602
654
735
366
399
440
500
563
599
640
725
2014-2015 811 787 - 802 781 2014 791 771
2013-2014 June 787 769 765 2014-2015 July 801 786 770 August 810 795 775 September 813 797 780 October 815 797 784 November 816 796 787 December 810 786 791 January 808 780 795 February 806 776 799 March 807 775 802 April 809 776 805 May 816 785 808 June 824 796 811 Note: -(i) Agricultural Year ( July to June ). (ii) Financial Year (April to March).
(iii) New series of Consumer Price Index Numbers for Rural Labourers on Base: 1986-
87=100 was introduced for the first time w.e.f. November, 1995.
@ = Average based on 8 months i.e. Nov., 95 to June, 96 only.
^ = Average based on 5 months i.e. Nov., 95 to March, 96 only
$ = Average based on 2 months i.e. Nov., 95 and Dec., 95 only.

Indian Labour Journal, September 2015
1033
Table B.1.2.2.(a)-State-wsie Labour Bureau‘s Series of Consumer Price Index Numbers for
Agricultural Labourers ( General Index on Base: 1986-87=100 )
Agricultural
Year/Month
Andhra
Pradesh
Assam Bihar Gujarat Haryana Himachal
Pradesh
Jammu &
Kashmir
Karnataka
Linking factor 4.84 b 6.22 5.34 * * 5.98 5.81
1 2 3 4 5 6 7 8 9
1995-96 @ 243 244 223 241 235 220 226 251
1996-97 268 259 250 254 265 240 252 266
1997-98 282 281 252 270 278 256 269 276
1998-99 309 311 285 297 306 283 303 306
1999-2000 318 323 300 310 312 294 323 316
2000-2001 317 322 282 314 313 292 326 302
2001-2002 328 320 290 320 322 298 331 309
2002-2003 342 330 299 332 329 308 344 325
2003-2004
2004-2005
347
357
343
347
311
324
339
350
341
359
321
325
345
348
341
340
2005-2006 371 362 347 369 376 343 359 341
2006-2007 401 388 384 403 403 367 392 367
2007-2008 430 417 411 424 447 376 413 406
2008-2009 484 451 446 459 498 406 453 458
2009-2010 552 520 500 538 588 455 524 535
2010-2011 603 580 532 583 642 484 568 595
2011-2012 668 622 552 627 690 513 608 665
2012-2013 733 682 617 694 765 555 671 750
2013-2014 820 740 691 777 840 619 730 826
2014-2015 873 789 718 822 898 660 765 877
2013-2014
June 840 769 723 787 855 636 749 846
2014-2015
July 859 783 730 802 877 648 759 860
August 866 769 732 818 892 654 763 866
September 865 801 733 832 901 666 770 868
October 869 803 734 827 902 665 780 869
November 874 805 736 822 896 661 769 870
December 875 802 717 825 894 655 758 871
January 876 789 708 819 895 658 757 878
February 875 774 707 812 899 658 754 883
March 874 772 708 815 902 664 762 884
April 875 775 706 816 904 661 767 884
May 877 779 704 832 907 660 778 890
June 894 788 704 842 909 669 763 904

Indian Labour Journal, September 2015
1034
Table B.1.2.2.(a)-Concld.
Agricultural
Year/Month
Kerala Madhya
Pradesh
Maharashtra Manipur Meghalaya Orissa
Linking factor 6.56 6.04 5.85 * * 6.05
1 10 11 12 13 14 15
1995-96 @ 259 237 248 244 252 236
1996-97 281 261 256 252 264 254
1997-98 292 273 266 268 282 262
1998-99 305 300 291 292 321 289
1999-2000 312 313 304 312 338 316
2000-2001 321 310 303 316 346 304
2001-2002 321 310 306 304 351 300
2002-2003 330 318 321 300 343 298
2003-2004
2004-2005
342
351
318
330
335
350
308
310
350
360
314
320
2005-2006 356 352 368 328 382 334
2006-2007 374 388 402 337 410 365
2007-2008 403 412 432 367 439 400
2008-2009 454 459 475 407 484 438
2009-2010 496 525 562 455 540 495
2010-2011 562 569 619 527 576 538
2011-2012 601 615 691 594 633 562
2012-2013 665 679 760 639 706 631
2013-2014 772 723 804 718 756 714
2014-2015 840 737 861 787 794 764
2013-2014
June 805 723 833 755 792 733
2014-2015
July 818 735 841 770 798 752
August 838 746 852 781 798 771
September 837 750 857 791 808 777
October 835 752 862 802 813 779
November 842 744 862 798 807 779
December 838 733 859 784 800 764
January 842 727 858 779 782 764
February 834 724 861 782 776 764
March 835 722 864 786 772 763
April 843 725 865 787 782 766
May 854 737 868 791 791 751
June 864 753 882 795 795 738
Note:- Agricultural Year ( July to June )
@ = Average based on 8 months i.e. from November, 1995 to June, 1996 only.
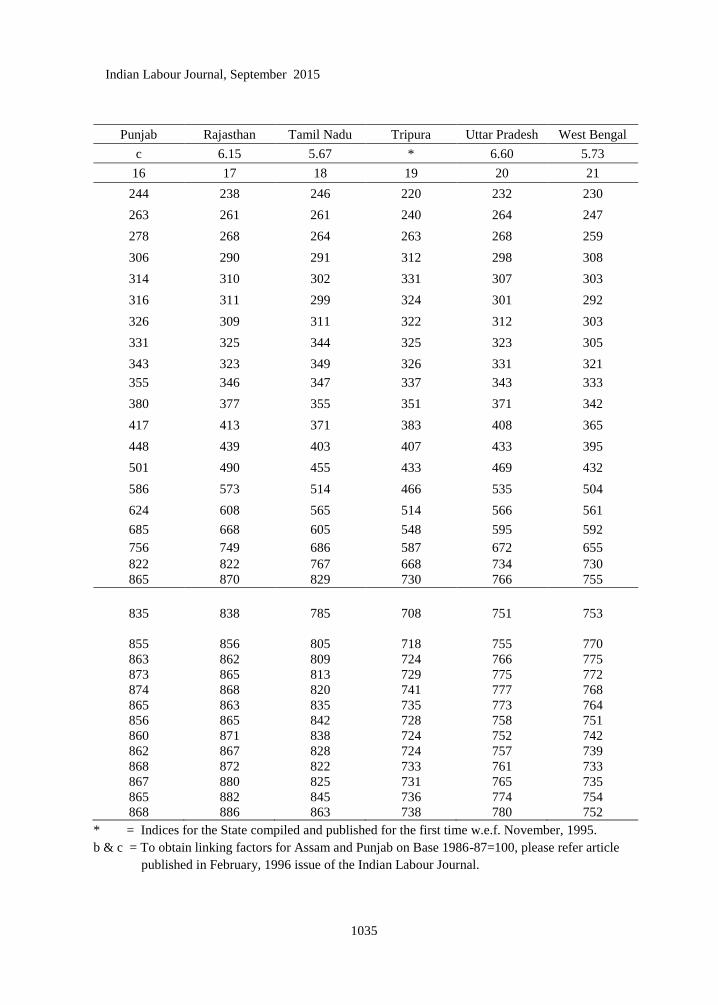
Indian Labour Journal, September 2015
1035
Punjab Rajasthan Tamil Nadu Tripura Uttar Pradesh West Bengal
c 6.15 5.67 * 6.60 5.73
16 17 18 19 20 21
244 238 246 220 232 230
263 261 261 240 264 247
278 268 264 263 268 259
306 290 291 312 298 308
314 310 302 331 307 303
316 311 299 324 301 292
326 309 311 322 312 303
331 325 344 325 323 305
343
355
323
346
349
347
326
337
331
343
321
333
380 377 355 351 371 342
417 413 371 383 408 365
448 439 403 407 433 395
501 490 455 433 469 432
586 573 514 466 535 504
624 608 565 514 566 561
685 668 605 548 595 592
756 749 686 587 672 655
822 822 767 668 734 730
865 870 829 730 766 755
835 838 785 708 751 753
855 856 805 718 755 770
863 862 809 724 766 775
873 865 813 729 775 772
874 868 820 741 777 768
865 863 835 735 773 764
856 865 842 728 758 751
860 871 838 724 752 742
862 867 828 724 757 739
868 872 822 733 761 733
867 880 825 731 765 735
865 882 845 736 774 754
868 886 863 738 780 752
* = Indices for the State compiled and published for the first time w.e.f. November, 1995.
b & c = To obtain linking factors for Assam and Punjab on Base 1986-87=100, please refer article
published in February, 1996 issue of the Indian Labour Journal.

Indian Labour Journal, September 2015
1036
Table B.1.2.2 (b)-State-wise Labour Bureau‘s Series of Consumer Price Index Numbers for
Rural Labourers ( General Index Base: 1986-87=100 )
Agricultural
Year/Month
Andhra
Pradesh
Assam Bihar Gujarat Haryana Himachal
Pradesh
Jammu &
Kashmir
Karnataka
1 2 3 4 5 6 7 8 9
1995-96 @ 244 243 223 241 237 221 225 250
1996-97 269 258 250 254 266 240 250 266
1997-98 282 278 254 270 279 258 266 276
1998-99 309 310 287 298 306 284 297 306
1999-2000 318 321 302 311 312 295 316 316
2000-2001 318 321 284 315 314 294 319 304
2001-2002 328 320 292 322 323 304 324 311
2002-2003 343 330 301 333 330 314 337 326
2003-2004
2004-2005
348
357
344
348
313
326
341
351
342
361
326
331
340
344
341
340
2005-2006 371 364 348 371 378 350 359 341
2006-2007 401 390 384 403 404 377 393 367
2007-2008 429 419 412 425 445 388 413 407
2008-2009 482 454 447 460 495 420 451 459
2009-2010 550 524 500 538 583 474 521 534
2010-2011 599 583 532 583 638 503 564 594
2011-2012 665 625 555 626 685 535 602 665
2012-2013 732 686 620 692 759 582 668 747
2013-2014 817 746 695 775 834 653 726 820
2014-2015 870 796 724 821 893 696 760 871
2013-2014
June 838 774 727 787 848 670 744 840
2014-2015
July 856 788 735 801 870 684 754 853
August 863 800 736 817 885 693 760 860
September 862 806 737 831 894 705 768 863
October 866 811 738 826 894 705 779 863
November 871 812 741 821 889 698 766 864
December 872 810 722 824 889 691 756 865
January 873 796 713 818 891 691 748 872
February 872 780 713 811 894 688 746 876
March 871 779 714 814 897 695 756 878
April 872 783 712 816 901 694 757 877
May 874 788 710 831 905 695 771 883
June 892 797 711 841 907 708 759 899
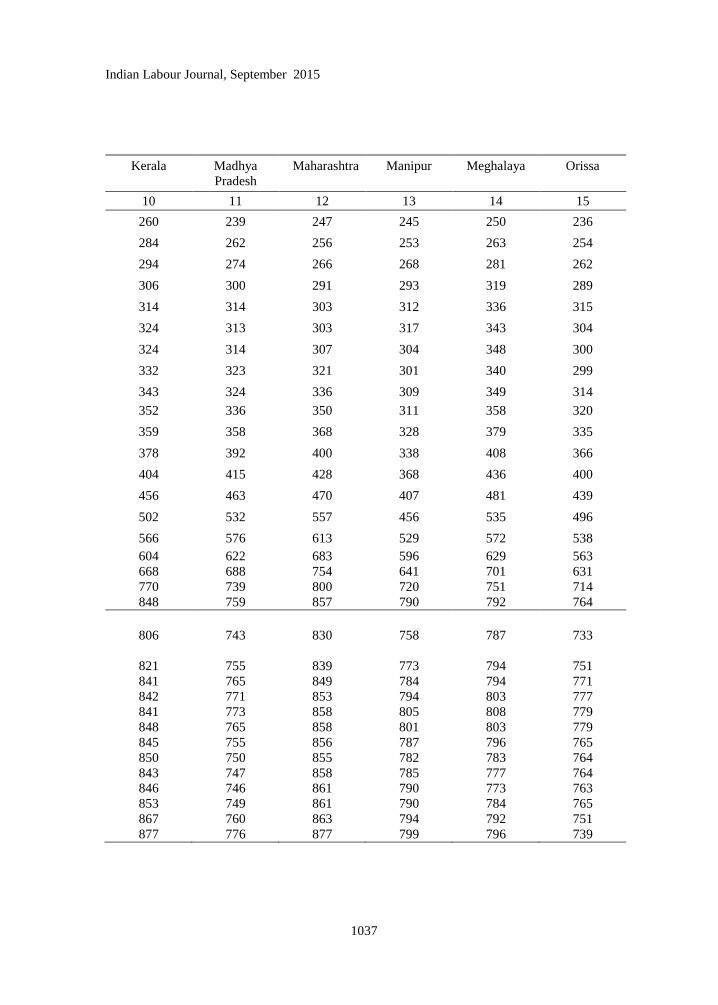
Indian Labour Journal, September 2015
1037
Kerala Madhya
Pradesh
Maharashtra Manipur Meghalaya Orissa
10 11 12 13 14 15
260 239 247 245 250 236
284 262 256 253 263 254
294 274 266 268 281 262
306 300 291 293 319 289
314 314 303 312 336 315
324 313 303 317 343 304
324 314 307 304 348 300
332 323 321 301 340 299
343
352
324
336
336
350
309
311
349
358
314
320
359 358 368 328 379 335
378 392 400 338 408 366
404 415 428 368 436 400
456 463 470 407 481 439
502 532 557 456 535 496
566 576 613 529 572 538
604 622 683 596 629 563
668 688 754 641 701 631
770 739 800 720 751 714
848 759 857 790 792 764
806 743 830 758 787 733
821 755 839 773 794 751
841 765 849 784 794 771
842 771 853 794 803 777
841 773 858 805 808 779
848 765 858 801 803 779
845 755 856 787 796 765
850 750 855 782 783 764
843 747 858 785 777 764
846 746 861 790 773 763
853 749 861 790 784 765
867 760 863 794 792 751
877 776 877 799 796 739

Indian Labour Journal, September 2015
1038
Table B.1.2.2 (b) - Concld.
Agricultural
Year/Month
Punjab Rajasthan Tamil
Nadu
Tripura Uttar
Pradesh
West
Bengal
1 16 17 18 19 20 21
1995-96 @ 247 239 244 219 231 232
1996-97 265 262 260 237 262 248
1997-98 281 270 265 261 267 260
1998-99 309 292 290 308 297 309
1999-2000 317 310 301 328 307 304
2000-2001 320 312 299 318 303 293
2001-2002 330 311 311 316 316 305
2002-2003 336 326 343 318 326 308
2003-2004
2004-2005
347
359
323
345
348
348
318
329
335
346
324
336
2005-2006 384 375 355 344 372 346
2006-2007 419 412 370 373 409 368
2007-2008 449 438 402 399 434 398
2008-2009 501 486 452 429 469 435
2009-2010 585 567 509 462 532 506
2010-2011 622 600 559 512 563 564
2011-2012 681 661 603 547 597 597
2012-2013 749 740 683 586 672 662
2013-2014 813 809 761 662 732 739
2014-2015 860 854 824 723 764 765
2013-2014
June 830 823 781 699 750 763
2014-2015
July 848 840 800 710 753 780
August 855 847 804 716 763 785
September 866 850 809 721 772 782
October 866 852 815 733 774 779
November 858 848 830 730 771 775
December 852 848 836 722 757 761
January 856 856 833 717 750 753
February 859 851 824 718 755 750
March 864 857 819 725 759 744
April 864 864 821 722 762 746
May 863 864 840 728 770 765
June 865 869 857 729 776 763 Note: – Agricultural Year ( July to June )
@ = Average based on 8 months i.e. from November, 1995 to June, 1996 only.

Indian Labour Journal, September 2015
1039
1.3. Urban Non-Manual Employees’ Consumer Price Index
Table B.1.3. All India Consumer Price Index Numbers for Urban Non-Manual Employees
(Base: 1984-85=100)
Year/Month General Index
1 2
1992 199
1993 212 1994 231
1995 254 1996 276
1997 297 1998 330
1999 348 2000 366
2001 386 2002 402
2003 416 2004 432
2005 451 2006 478
2007 509 2008 548
2009 612
2010 687 Consumer Price Index for Rural and Urban Areas on base: 2010=100*
Year/Month Rural Urban
General Index General Index
2011 110.8 108.1 2012 121.4 118.8 2013 133.6 130.8 2014 143.5 139.7
2014 June 142.5 139.4
July 145.0 141.9
August 146.7 143.0
September 147.0 142.5
October 147.2 142.6
November 147.5 142.8
December 146.7 142.5
2015 January** 120.2 118.5
February 120.6 118.7
March 121.1 119.1
April 121.6 119.7
May 122.4 120.7
June 124.1 121.7
* New series of CPI has been introduced w.e.f. Jan., 2011 in place of UNME.
** Revised New Series of CPI has been introduced w.e.f. Jan., 2015 with base 2012= 100.
Figures for last two months are provisional
Source: Central Statistical Organisation, New Delhi.

Indian Labour Journal, September 2015
1040
1.4. Wholesale Price Index
Table B.1.4 – Index Numbers of Wholesale Prices in India
Year/
Month
All
Commodities
I. Primary Articles II. Fuel Power
Light and
Lubricants All Food
Articles
Non-Food
Articles
Minerals
1 2 3 4 5 6 7
I Base 1981-1982=100
1992 224.7 233.2 266.8 231.6 115.5 219.3 1993 242.1 245.3 281.8 238.5 128.5 254.3 1994 267.4 273.7 303.6 285.5 141.6 278.3 1995 292.4 301.4 331.1 322.1 151.5 284.1 1996 309.0 320.7 362.7 327.0 156.4 311.2 1997 325.6 335.5 384.3 335.1 160.9 355.8 1998 348.2 371.9 431.8 368.2 163.7 380.7 1999 360.3 388.1 454.3 378.9 168.8 403.0
II Base 1993-94=100
2000 152.8 161.5 170.0 144.6 110.2 196.0 2001 160.7 167.0 174.3 152.6 118.4 224.8 2002 164.7 171.7 178.6 158.6 119.4 234.9 2003 173.4 180.0 181.0 182.4 118.3 250.6 2004 184.9 187.5 185.1 190.7 223.8 273.5 2005 193.7 191.3 192.4 180.2 298.6 300.8 2006 203.0 203.4 205.6 182.6 397.4 322.2 2007 212.8 220.8 220.0 206.1 430.1 322.9 2008 232.2 243.0 234.6 234.4 616.4 354.5 2009 237.0 264.0 264.0 237.2 605.9 334.3
III Base: 2004-05 = 100
2010 140.1 175.9 174.6 155.9 244.0 144.2 2011 153.4 197.1 190.4 183.1 299.2 163.3
2012 164.9 215 206.5 196.8 345 182.5 2013 175.4 237.8 234.1 210.7 347.9 200.5 2014 181.9 249.2 249.1 215.1 344.8 210.1 2014June 182.6 249.9 249.7 216.4 345.6 212.3
July 184.6 256.6 258.6 218.1 346.1 214.7
Aug 185.7 261.7 265.4 218.7 347.0 214.0 Sept. 185.0 258.2 261.8 214.3 347.3 213.4 Oct. 183.9 255.0 258.5 210.0 348.1 210.7 Nov 181.5 252.4 257.5 208.5 327.4 199.3 Dec 179.8 249.0 252.7 209.1 325.7 194.6
2015 Jan 178.3 246.6 252.4 207.6 301.1 189.7 Feb 175.8 241.9 250.5 206.0 261.7 181.3 Mar 176.1 239.6 249.4 202.2 252.1 187.3 Apr 176.0 241.8 252.7 203.5 246.6 184.2
May 177.7 244.9 253.9 213.9 247.7 189.8 June 178.6 248.4 257.3 218.5 248.5 191.0
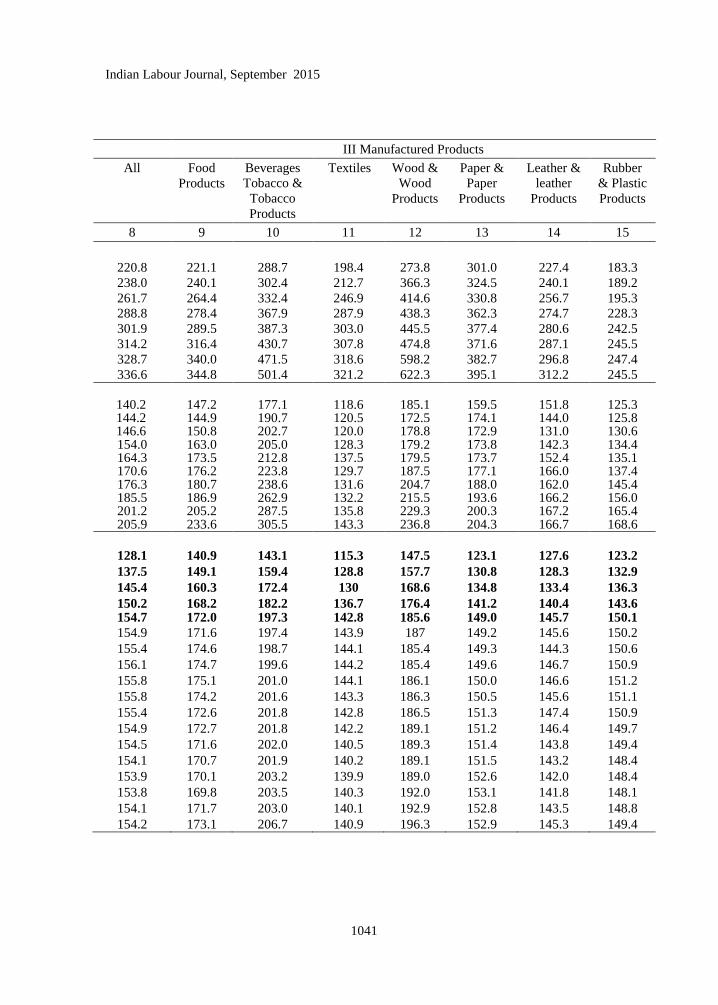
Indian Labour Journal, September 2015
1041
III Manufactured Products
All Food
Products
Beverages
Tobacco &
Tobacco
Products
Textiles Wood &
Wood
Products
Paper &
Paper
Products
Leather &
leather
Products
Rubber
& Plastic
Products
8 9 10 11 12 13 14 15
220.8 221.1 288.7 198.4 273.8 301.0 227.4 183.3
238.0 240.1 302.4 212.7 366.3 324.5 240.1 189.2
261.7 264.4 332.4 246.9 414.6 330.8 256.7 195.3
288.8 278.4 367.9 287.9 438.3 362.3 274.7 228.3
301.9 289.5 387.3 303.0 445.5 377.4 280.6 242.5
314.2 316.4 430.7 307.8 474.8 371.6 287.1 245.5
328.7 340.0 471.5 318.6 598.2 382.7 296.8 247.4
336.6 344.8 501.4 321.2 622.3 395.1 312.2 245.5
140.2 147.2 177.1 118.6 185.1 159.5 151.8 125.3 144.2 144.9 190.7 120.5 172.5 174.1 144.0 125.8 146.6 150.8 202.7 120.0 178.8 172.9 131.0 130.6
154.0 163.0 205.0 128.3 179.2 173.8 142.3 134.4 164.3 173.5 212.8 137.5 179.5 173.7 152.4 135.1 170.6 176.2 223.8 129.7 187.5 177.1 166.0 137.4 176.3 180.7 238.6 131.6 204.7 188.0 162.0 145.4 185.5 186.9 262.9 132.2 215.5 193.6 166.2 156.0 201.2 205.2 287.5 135.8 229.3 200.3 167.2 165.4 205.9 233.6 305.5 143.3 236.8 204.3 166.7 168.6
128.1 140.9 143.1 115.3 147.5 123.1 127.6 123.2
137.5 149.1 159.4 128.8 157.7 130.8 128.3 132.9
145.4 160.3 172.4 130 168.6 134.8 133.4 136.3
150.2 168.2 182.2 136.7 176.4 141.2 140.4 143.6 154.7 172.0 197.3 142.8 185.6 149.0 145.7 150.1
154.9 171.6 197.4 143.9 187 149.2 145.6 150.2
155.4 174.6 198.7 144.1 185.4 149.3 144.3 150.6
156.1 174.7 199.6 144.2 185.4 149.6 146.7 150.9
155.8 175.1 201.0 144.1 186.1 150.0 146.6 151.2
155.8 174.2 201.6 143.3 186.3 150.5 145.6 151.1
155.4 172.6 201.8 142.8 186.5 151.3 147.4 150.9
154.9 172.7 201.8 142.2 189.1 151.2 146.4 149.7
154.5 171.6 202.0 140.5 189.3 151.4 143.8 149.4
154.1 170.7 201.9 140.2 189.1 151.5 143.2 148.4
153.9 170.1 203.2 139.9 189.0 152.6 142.0 148.4
153.8 169.8 203.5 140.3 192.0 153.1 141.8 148.1
154.1 171.7 203.0 140.1 192.9 152.8 143.5 148.8
154.2 173.1 206.7 140.9 196.3 152.9 145.3 149.4
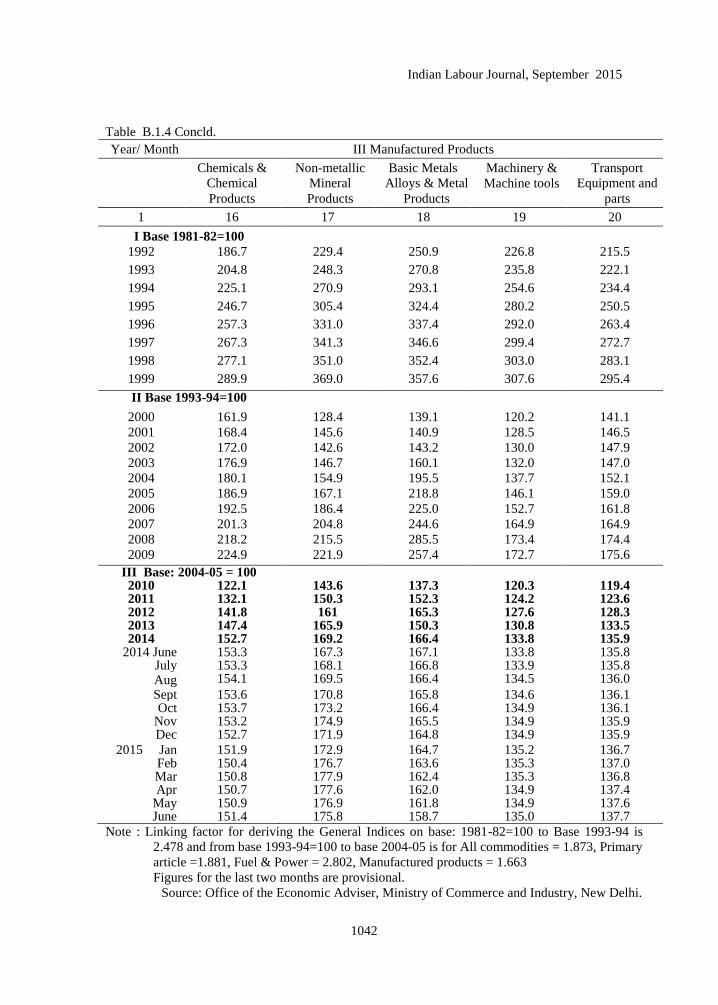
Indian Labour Journal, September 2015
1042
Table B.1.4 Concld.
Year/ Month III Manufactured Products
Chemicals &
Chemical
Products
Non-metallic
Mineral
Products
Basic Metals
Alloys & Metal
Products
Machinery &
Machine tools
Transport
Equipment and
parts
1 16 17 18 19 20
I Base 1981-82=100
1992 186.7 229.4 250.9 226.8 215.5
1993 204.8 248.3 270.8 235.8 222.1
1994 225.1 270.9 293.1 254.6 234.4
1995 246.7 305.4 324.4 280.2 250.5
1996 257.3 331.0 337.4 292.0 263.4
1997 267.3 341.3 346.6 299.4 272.7
1998 277.1 351.0 352.4 303.0 283.1
1999 289.9 369.0 357.6 307.6 295.4
II Base 1993-94=100
2000 161.9 128.4 139.1 120.2 141.1
2001 168.4 145.6 140.9 128.5 146.5
2002 172.0 142.6 143.2 130.0 147.9
2003 176.9 146.7 160.1 132.0 147.0
2004 180.1 154.9 195.5 137.7 152.1
2005 186.9 167.1 218.8 146.1 159.0
2006 192.5 186.4 225.0 152.7 161.8
2007 201.3 204.8 244.6 164.9 164.9
2008 218.2 215.5 285.5 173.4 174.4
2009 224.9 221.9 257.4 172.7 175.6
III Base: 2004-05 = 100 2010 122.1 143.6 137.3 120.3 119.4 2011 132.1 150.3 152.3 124.2 123.6 2012 141.8 161 165.3 127.6 128.3 2013 147.4 165.9 150.3 130.8 133.5 2014 152.7 169.2 166.4 133.8 135.9
2014 June 153.3 167.3 167.1 133.8 135.8 July 153.3 168.1 166.8 133.9 135.8 Aug 154.1 169.5 166.4 134.5 136.0
Sept 153.6 170.8 165.8 134.6 136.1 Oct 153.7 173.2 166.4 134.9 136.1
Nov 153.2 174.9 165.5 134.9 135.9 Dec 152.7 171.9 164.8 134.9 135.9
2015 Jan 151.9 172.9 164.7 135.2 136.7 Feb 150.4 176.7 163.6 135.3 137.0 Mar 150.8 177.9 162.4 135.3 136.8 Apr 150.7 177.6 162.0 134.9 137.4
May 150.9 176.9 161.8 134.9 137.6 June 151.4 175.8 158.7 135.0 137.7
Note : Linking factor for deriving the General Indices on base: 1981-82=100 to Base 1993-94 is
2.478 and from base 1993-94=100 to base 2004-05 is for All commodities = 1.873, Primary
article =1.881, Fuel & Power = 2.802, Manufactured products = 1.663
Figures for the last two months are provisional.
Source: Office of the Economic Adviser, Ministry of Commerce and Industry, New Delhi.
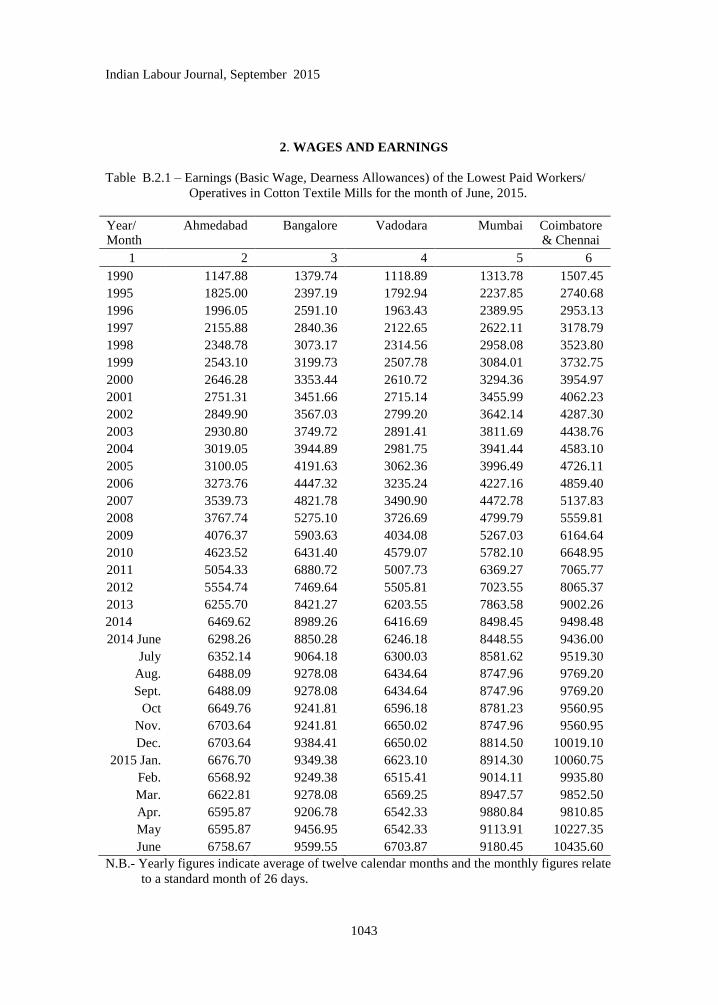
Indian Labour Journal, September 2015
1043
2. WAGES AND EARNINGS
Table B.2.1 – Earnings (Basic Wage, Dearness Allowances) of the Lowest Paid Workers/
Operatives in Cotton Textile Mills for the month of June, 2015.
Year/ Month
Ahmedabad Bangalore Vadodara Mumbai Coimbatore & Chennai
1 2 3 4 5 6
1990 1147.88 1379.74 1118.89 1313.78 1507.45
1995 1825.00 2397.19 1792.94 2237.85 2740.68
1996 1996.05 2591.10 1963.43 2389.95 2953.13
1997 2155.88 2840.36 2122.65 2622.11 3178.79
1998 2348.78 3073.17 2314.56 2958.08 3523.80
1999 2543.10 3199.73 2507.78 3084.01 3732.75
2000 2646.28 3353.44 2610.72 3294.36 3954.97
2001 2751.31 3451.66 2715.14 3455.99 4062.23
2002 2849.90 3567.03 2799.20 3642.14 4287.30
2003 2930.80 3749.72 2891.41 3811.69 4438.76
2004 3019.05 3944.89 2981.75 3941.44 4583.10
2005 3100.05 4191.63 3062.36 3996.49 4726.11
2006 3273.76 4447.32 3235.24 4227.16 4859.40
2007 3539.73 4821.78 3490.90 4472.78 5137.83
2008 3767.74 5275.10 3726.69 4799.79 5559.81
2009 4076.37 5903.63 4034.08 5267.03 6164.64
2010 4623.52 6431.40 4579.07 5782.10 6648.95
2011 5054.33 6880.72 5007.73 6369.27 7065.77
2012 5554.74 7469.64 5505.81 7023.55 8065.37
2013 6255.70 8421.27 6203.55 7863.58 9002.26
2014 6469.62 8989.26 6416.69 8498.45 9498.48
2014 June 6298.26 8850.28 6246.18 8448.55 9436.00
July 6352.14 9064.18 6300.03 8581.62 9519.30
Aug. 6488.09 9278.08 6434.64 8747.96 9769.20
Sept. 6488.09 9278.08 6434.64 8747.96 9769.20
Oct 6649.76 9241.81 6596.18 8781.23 9560.95
Nov. 6703.64 9241.81 6650.02 8747.96 9560.95
Dec. 6703.64 9384.41 6650.02 8814.50 10019.10
2015 Jan. 6676.70 9349.38 6623.10 8914.30 10060.75
Feb. 6568.92 9249.38 6515.41 9014.11 9935.80
Mar. 6622.81 9278.08 6569.25 8947.57 9852.50
Apr. 6595.87 9206.78 6542.33 9880.84 9810.85
May 6595.87 9456.95 6542.33 9113.91 10227.35
June 6758.67 9599.55 6703.87 9180.45 10435.60
N.B.- Yearly figures indicate average of twelve calendar months and the monthly figures relate
to a standard month of 26 days.

Indian Labour Journal, September 2015
1044
Table B.2.1 concld.
Year/ Month
Delhi Indore Kanpur Nagpur Solapur Kolkata
1 7 8 9 10 11 12
1990 1070.33 1143.01 1232.60 956.25 1045.37 1195.16
1995 1739.63 1810.43 1949.70 1520.00 1744.67 1887.30
1996 1831.84 1970.78 2078.29 1638.04 1889.84 2099.53
1997 2013.39 2061.69 2243.55 1794.01 1981.08 2229.42
1998 2307.43 2256.09 2553.60 1988.73 2249.74 2452.04
1999 2524.99 2466.82 2743.61 2140.61 2399.14 2728.51
2000 2693.26 2540.94 2750.02 2195.02 2474.53 2796.11
2001 2775.73 2675.21 2839.01 2322.34 2489.57 2964.03
2002 2881.49 2792.85 2931.94 2383.55 2572.85 3292.82
2003 2981.47 2912.04 2995.84 2422.82 2636.12 3347.73
2004 3113.99 2986.63 3112.39 2496.74 2789.17 3478.77
2005 3350.68 3057.48 3279.56 2637.64 2841.65 3599.75
2006 3544.08 3255.16 3592.54 2338.85 2239.55 3797.02
2007 * 3474.05 3833.84 3097.41 * 4097.84
2008 * 3676.41 4062.10 3318.05 * 4420.66
2009 * 3939.07 4487.57 3726.56 * 4775.49
2010 * 4418.29 5238.85 4391.43 * 5362.25
2011 * 4748.82 5731.94 4800.80 * 5755.50
2012 * 5189.95 6104.54 5212.98 * 6134.40
2013 * 5769.71 6741.06 5751.93 * 6783.80
2014 * 6129.88 7303.78 6069.26 * 7478.77
2014 June * 5996.84 7316.16 5915.32 * 7327.15
July * 6155.61 7286.46 5980.89 * 7327.15
Aug. * 6155.61 7344.51 6060.52 * 7558.52
Sept. * 6155.51 7344.51 6060.52 * 7558.52
Oct. * 6279.10 7572.66 6301.27 * 7558.52
Nov. * 6279.10 7601.01 6359.35 * 7716.26
Dec. * 6279.10 7514.61 6308.76 * 7716.26
2015 Jan. * 6261.46 7486.26 6250.68 * 7716.26
Feb. * 6261.46 7372.86 6228.20 * 7737.30
Mar. * 6261.46 7429.56 6235.69 * 7737.30
Apr. * 6279.10 7486.26 6257.24 * 7737.30
May * 6279.10 7542.96 6293.77 * 7695.23
June * 6420.22 7629.36 6359.35 * 7695.23
New series on Consumer Price Index Numbers for Industrial Workers on base 2001=100 has been
introduced w.e.f. the index of January 2006.
Centre linking factor on base 2001=100 is: Ahmedabad (4.62), Bangalore (4.51), Vadodara (4.39), Mumbai
(5.18), Coimbatore / Chennai (4.95), Delhi(5.60), Indore(4.73),Kanpur(4.50), Nagpur (4.68), Sholapur
(4.73) and Kolkata (5.12)
* Earning of Delhi and Sholapur Centres have been discontinued due to closure of Textile Mills.
Source: Monthly returns received from the selected centres.

Indian Labour Journal, September 2015
1045
3. INDUSTRIAL DISPUTES
Table B.3.1- Industrial Disputes (All Strikes and Lockouts) during the period 2007 to 2015
Year Number of
Disputes Workers Involved Mandays Lost (‗000 )
1 2 3 4
2007
389 724574 27167
2008
421 1579298 17433
2009 345 1867204 17622
2010 371 1074473 23131
2011 370 734763 14458
2012
318 1307454 12937
2013(P)
198 1057887 3665
2014(P) 149 1015982 3621
2015(P)
(January to June)
64 144332 880
(P) = Provisional and based on the returns /clarifications received in the Bureau till
31st July, 2015
An ounce of practice is worth more than tons
of preaching.
-Mahatma Gandhi

Indian Labour Journal, September 2015
1046
LET US NOT PRAY TO BE SHELTERED FROM DANGERS
BUT TO BE FEARLESS WHEN FACING THEM.
-RABINDRANATH TAGORE
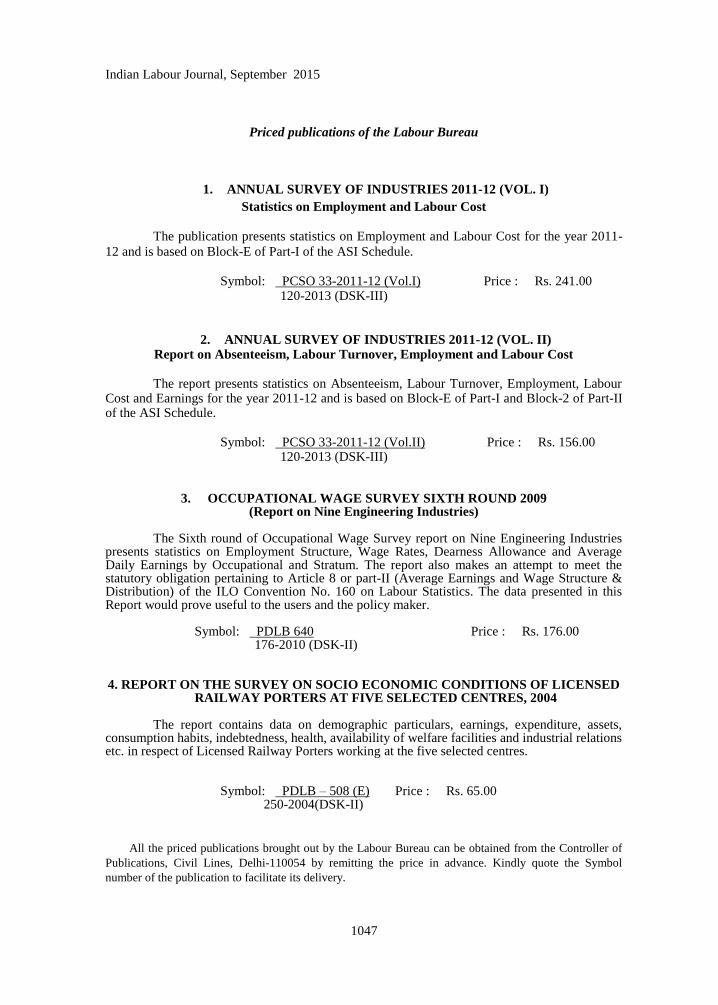
Indian Labour Journal, September 2015
1047
Priced publications of the Labour Bureau
1. ANNUAL SURVEY OF INDUSTRIES 2011-12 (VOL. I)
Statistics on Employment and Labour Cost
The publication presents statistics on Employment and Labour Cost for the year 2011-
12 and is based on Block-E of Part-I of the ASI Schedule.
Symbol: PCSO 33-2011-12 (Vol.I) 120-2013 (DSK-III)
Price : Rs. 241.00
2. ANNUAL SURVEY OF INDUSTRIES 2011-12 (VOL. II) Report on Absenteeism, Labour Turnover, Employment and Labour Cost
The report presents statistics on Absenteeism, Labour Turnover, Employment, Labour
Cost and Earnings for the year 2011-12 and is based on Block-E of Part-I and Block-2 of Part-II of the ASI Schedule.
Symbol: PCSO 33-2011-12 (Vol.II) 120-2013 (DSK-III)
Price : Rs. 156.00
3. OCCUPATIONAL WAGE SURVEY SIXTH ROUND 2009
(Report on Nine Engineering Industries)
The Sixth round of Occupational Wage Survey report on Nine Engineering Industries presents statistics on Employment Structure, Wage Rates, Dearness Allowance and Average Daily Earnings by Occupational and Stratum. The report also makes an attempt to meet the statutory obligation pertaining to Article 8 or part-II (Average Earnings and Wage Structure & Distribution) of the ILO Convention No. 160 on Labour Statistics. The data presented in this Report would prove useful to the users and the policy maker.
Symbol: PDLB 640 176-2010 (DSK-II)
Price : Rs. 176.00
4. REPORT ON THE SURVEY ON SOCIO ECONOMIC CONDITIONS OF LICENSED RAILWAY PORTERS AT FIVE SELECTED CENTRES, 2004
The report contains data on demographic particulars, earnings, expenditure, assets, consumption habits, indebtedness, health, availability of welfare facilities and industrial relations etc. in respect of Licensed Railway Porters working at the five selected centres.
Symbol: PDLB – 508 (E) 250-2004(DSK-II)
Price : Rs. 65.00
All the priced publications brought out by the Labour Bureau can be obtained from the Controller of
Publications, Civil Lines, Delhi-110054 by remitting the price in advance. Kindly quote the Symbol
number of the publication to facilitate its delivery.

Indian Labour Journal, September 2015
1048
5. RURAL LABOUR ENQUIRY REPORT ON WAGES & EARNINGS OF RURAL LABOUR HOUSEHOLDS – 2004-2005
The report contains data on Wages & Earnings of Rural labour Households collected by
the National Sample Survey Organisation during its 61st round (2004-2005) of survey. It gives
information on Wages & Earnings of Rural as well as Agricultural labour Households by States and Categories of Households, in the country, for various agricultural occupations. The data is of immense use to the planners, researchers and policy framers.
Symbol: PDLB - 638 250-2010 (DSK-II)
Price : Rs. 105.00
6. RURAL LABOUR ENQUIRY REPORT ON GENERAL CHARACTERISTICS OF RURAL LABOUR HOUSEHOLDS – 2004-2005
The report contains data on general characteristics of rural labour households, viz.,
demographic structure of labour households; size of households; land holding pattern of households; and number of agricultural and non-agricultural households, etc. – a mine of information on the said subject, which would be of immense value to the researchers, economic planners and policy framers.
Symbol: PDLB – 652 200-2011 (DSK-II)
Price : Rs. 90.00
7. RURAL LABOUR ENQUIRY REPORT ON INDEBTEDNESS AMONG RURAL
LABOUR HOUSEHOLDS – 2004-2005
The report analyses the magnitude and incidence of indebtedness among labour
households in the country on the basis of the results of data collected by National Sample Survey Organisation during its 61
st round (2004-2005) of survey. The data is of immense use to the
planners, researchers and policy framers.
Symbol: PDLB – 645 250-2010 (DSK-II)
Price : Rs. 143.00
8. RURAL LABOUR ENQUIRY REPORT ON CONSUMPTION EXPENDITURE OF RURAL LABOUR HOUSEHOLDS - 2004-2005
The report presents analysis of data on consumption expenditure of the rural labour
households collected by the National Sample Survey Organisation during the 61st round (2004-
05) of the survey. It is hoped that the present publication will prove to be very useful for planning, administration and research purposes in the area.
Symbol: PDLB – 659 260-2012 (DSK-II)
Price : Rs. 140.00
9. RURAL LABOUR ENQUIRY REPORT ON EMPLOYMENT & UNEMPLOYMENT
OF RURAL LABOUR HOUSEHOLDS - 2004-2005
The report presents analysis of data on employment & unemployment of rural labour households on the basis of the results of data collected by National Sample Survey Organisation during its 61
st round (2004-05) of survey. This report has been brought out in two volumes. Vol.-
I presents the main findings whereas Vol.-II contains ‗appendices‘ in which detailed data have been presented. The data is of immense use to the planners, researchers and policy framers.
Symbol: PDLB – 631 250-2008 (DSK-II)
Price (per set) : Rs. 525.00

Indian Labour Journal, September 2015
1049
10. CONSUMER PRICE INDEX NUMBERS FOR AGRICULTURAL AND RURAL
LABOURERS 1986-87=100) Annual Report- 2012-13 (Agricultural Year)
This publication, 16th
in the series, contains detailed information on Consumer price Index Numbers for Agricultural and Rural Labourers ( Base: 1986-87=100) for the period July, 2012 to June, 2013. These index numbers, and especially the CPI (AL), play an important role in fixing/revising the minimum wages of agricultural workers.
Symbol: PDL – 562 150-2013 (DSK-II)
Price: Rs. 105.00
11. CONSUMER PRICE INDEX NUMBERS
(for Industrial Workers) 2001=100 Annual Report- 2013
The publication presents serial statistics on Consumer Price Index Number for Industrial Workers with Base: 2001=100 for 78 industrial centres and also for all India. It also contains major group-wise (food, pan, supari, tobacco and intoxicants, fuel and light, housing, clothing, bedding and footwear and miscellaneous) and subgroups wise indices alongwith Linking Factors for conversion of the index to old base (1982=100).
Symbol: PDL – 563 300-2014 (DSK-II)
Price: Rs. 230.00
12. WAGE RATES IN RURAL INDIA
2012-2013 (Agricultural Year)
The publication, 16th
in the series, contains daily wage rate data in respect of 11 Agricultural and 7 Non-Agricultural Occupations for the period July, 2012 to June, 2013. The data on wage rates play an important role in the calculation of State/National Income, drawing up and implementation of wage policy as well as in fixation/revision of support prices of agricultural crops.
Symbol: PDLB – 663 200-2013 (DSK-II)
Price: Rs.115.00
13. TENTH DIGEST OF INDIAN LABOUR RESEARCH (2008-2011)
The publication present an annotated bibliography of research studies undertaken by various Universities, Government Departments (Central/State), Social Research Institutes, Employers‘ and Workers‘‘ organizations and individual researchers in the field of labour and labour related issues.
Symbol: PDLB – 666 60-2014 (DSK-II)
Price : Rs. 119.00
14. TRADE UNIONS IN INDIA 2010
Trade Unions in India is a biennial publication. It presents information in respect of
Workers and Employers Unions, on Registered Trade Unions submitting returns by their sex-wise membership. Besides, it also presents data of income and expenditure of Workers as well as Employers Unions.
Symbol: PDLB -662 100-2013(DSK-II)
Price : Rs. 94.00
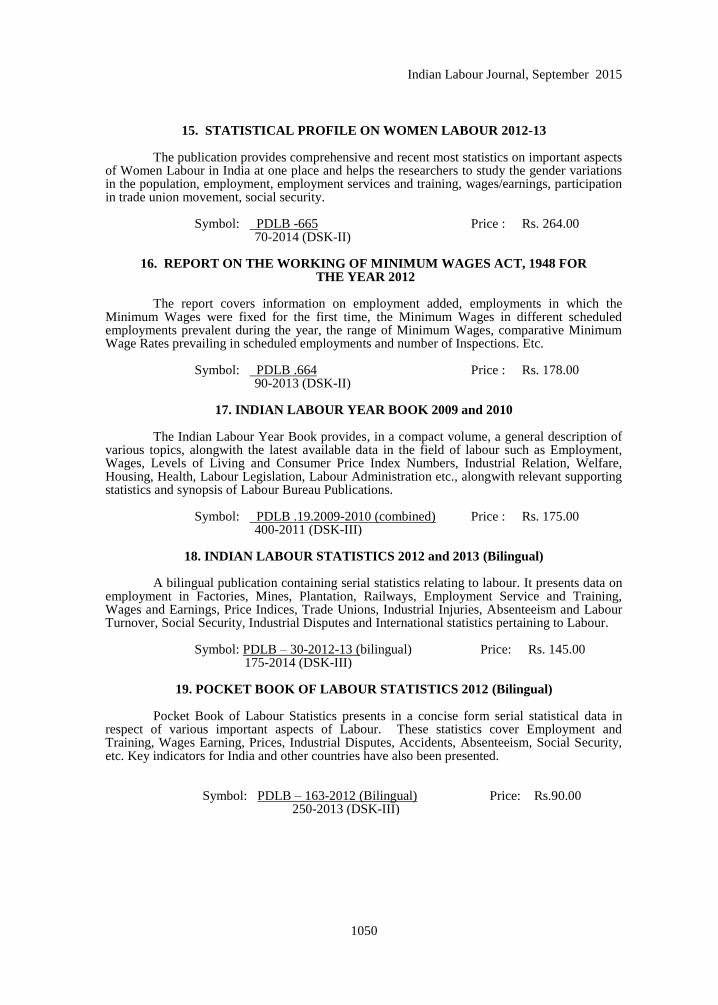
Indian Labour Journal, September 2015
1050
15. STATISTICAL PROFILE ON WOMEN LABOUR 2012-13
The publication provides comprehensive and recent most statistics on important aspects of Women Labour in India at one place and helps the researchers to study the gender variations in the population, employment, employment services and training, wages/earnings, participation in trade union movement, social security.
Symbol: PDLB -665 70-2014 (DSK-II)
Price : Rs. 264.00
16. REPORT ON THE WORKING OF MINIMUM WAGES ACT, 1948 FOR THE YEAR 2012
The report covers information on employment added, employments in which the
Minimum Wages were fixed for the first time, the Minimum Wages in different scheduled employments prevalent during the year, the range of Minimum Wages, comparative Minimum Wage Rates prevailing in scheduled employments and number of Inspections. Etc.
Symbol: PDLB .664 90-2013 (DSK-II)
Price : Rs. 178.00
17. INDIAN LABOUR YEAR BOOK 2009 and 2010
The Indian Labour Year Book provides, in a compact volume, a general description of
various topics, alongwith the latest available data in the field of labour such as Employment, Wages, Levels of Living and Consumer Price Index Numbers, Industrial Relation, Welfare, Housing, Health, Labour Legislation, Labour Administration etc., alongwith relevant supporting statistics and synopsis of Labour Bureau Publications.
Symbol: PDLB .19.2009-2010 (combined) 400-2011 (DSK-III)
Price : Rs. 175.00
18. INDIAN LABOUR STATISTICS 2012 and 2013 (Bilingual)
A bilingual publication containing serial statistics relating to labour. It presents data on
employment in Factories, Mines, Plantation, Railways, Employment Service and Training, Wages and Earnings, Price Indices, Trade Unions, Industrial Injuries, Absenteeism and Labour Turnover, Social Security, Industrial Disputes and International statistics pertaining to Labour.
Symbol: PDLB – 30-2012-13 (bilingual) 175-2014 (DSK-III)
Price: Rs. 145.00
19. POCKET BOOK OF LABOUR STATISTICS 2012 (Bilingual)
Pocket Book of Labour Statistics presents in a concise form serial statistical data in
respect of various important aspects of Labour. These statistics cover Employment and Training, Wages Earning, Prices, Industrial Disputes, Accidents, Absenteeism, Social Security, etc. Key indicators for India and other countries have also been presented.
Symbol: PDLB – 163-2012 (Bilingual) 250-2013 (DSK-III)
Price: Rs.90.00

Indian Labour Journal, September 2015
1051
INDIAN BOOK EXCHANGE
Registration No. ―G 3/DL(N)-04/0008/2003-05‖
Printed by the Printing Unit of Labour Bureau, Shimla
Editor I.S.Negi, Labour Bureau, Shimla and published by
Controller of Publications, Government of India,
Civil Lines, Delhi-110054

![cels.org.arcels.org.ar/common/CELS - Newsletter (September 2015).docx · Web view[newsletter]September 2015 [newsletter] September 2015 September 2015 [newsletter] September 2015](https://img.pdfslide.net/doc/110x75/5b1d07b47f8b9a06758bbf53/celsorg-newsletter-september-2015docx-web-viewnewsletterseptember-2015.jpg)


![ILJ 7 Patrol Opertations[1]](https://img.pdfslide.net/doc/110x75/577cd0b11a28ab9e7892e309/ilj-7-patrol-opertations1.jpg)