Embed Size (px)
Citation preview

Illinois Brand Study 2014LINDA OWENS & SOWMYA ANANDSURVEY RESEARCH LABORATORY
University of Illinois at Chicagowww.srl.uic.edu

2
Study Methodology
Study Populations• Alumni of Illinois• Parents of Illinois students • Residents of Cook, DuPage, and Lake Counties in
Illinois
Methods• Three separate online questionnaires • E-mail invitations to alumni and parents• Letter invitation to IL residents to complete online
3
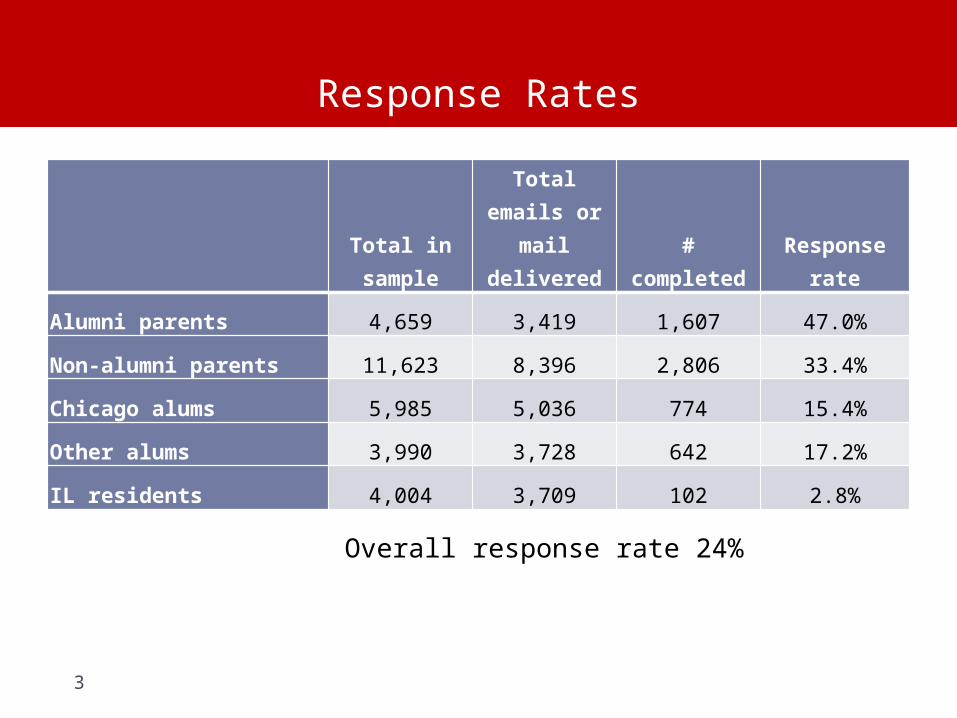
Response Rates
Total in sample
Total emails or
mail delivered
# completed
Response rate
Alumni parents 4,659 3,419 1,607 47.0%
Non-alumni parents 11,623 8,396 2,806 33.4%
Chicago alums 5,985 5,036 774 15.4%
Other alums 3,990 3,728 642 17.2%
IL residents 4,004 3,709 102 2.8%
Overall response rate 24%

4
Questionnaire
Number of questions varied by group Ratings on 5-point scales and some 3-point scales Select one or multiple from list Open-end questions
Can group items into 6 main themes Connection to Illinois Value of an Illinois education Quality of an Illinois education How well Illinois reaches out to
alumni/parents/residents Sources of information about the university Attitudes and intentions regarding giving

5
Questionnaire
Examples Connection to Illinois
How often do you attend events held by the University of Illinois at Urbana-Champaign?
At this time, how strong is your connection to the university?
Value of an Illinois education How would you evaluate the value for money you get from the
educational programs & services provided by the University of Illinois at Urbana-Champaign?
Quality of an Illinois education How well does the education provided by the University of
Illinois at Urbana-Champaign train students for a specific career or profession?

6
Questionnaire
Examples How well Illinois reaches out to alumni/parents/residents
How much does the University of Illinois at Urbana-Champaign value its relationship with alumni/parents/residents?
How close a connection does the University of Illinois at Urbana-Champaign maintain with alumni/parents/residents?
Sources of information about the university How much information do you get about what is happening at the
University of Illinois at Urbana-Champaign? In the past 3 months, have you seen any advertisements featuring the
University of Illinois at Urbana-Champaign?
Attitudes and intentions regarding giving Of the following, which motivates you the most to make a charitable gift
to the university? In the next 5 years, how likely are you to make a financial contribution to
the University of Illinois at Urbana-Champaign?

7
Alumni Results
R2 = 0.290, F (5, n = 1,315) = 108.668, p < 0.000
• Alumni who feel connected more likely to intend to make a financial contribution in the next five years
Unstandardized CoefficientsStandardized Coefficients
t Sig.B Std. Error Beta(Constant) –1.309 0.186 –7.034 0.000
Connect 3.186 0.238 0.349 13.398 0.000
Value 1.285 0.215 0.162 5.985 0.000Change since R attended
0.661 0.156 0.105 4.231 0.000
Outreach 1.075 0.200 0.147 5.374 0.000
Age 0.006 0.002 0.084 3.466 0.001

8
Alumni Results
• Feeling connected also strongly associated with past contributions
Unstandardized CoefficientsStandardized Coefficients
t Sig.B Std. Error Beta(Constant) –1.396 0.158 –8.850 0.000
Connect 1.879 0.194 0.261 9.671 0.000
Quality 0.354 0.167 0.057 2.125 0.034Change since R attended
0.394 0.129 0.079 3.048 0.002
Respondent age 0.018 0.001 0.339 12.687 0.000
R2 = 0.173, F (4, n = 1,308) = 69.423, p < 0.000.

9
Alumni Results
• Unfortunately, connection to Illinois is not very strong
Not strong at
all (1)
Slightly strong
(2)
Moderately strong
(3)
Very strong
(4)Extremely strong (5) Total
At this time, how strong is your connection to the university?
418 402 367 163 64 1,414
29.6% 28.4% 26.0% 11.5% 4.5% 100.0%
Mean 2.3

10
Alumni Results
Northeast Midwest South West
Not strong at all (1)22 284 46 35
41.5% 27.1% 38.0% 31.0%
Slightly strong (2)13 297 33 37
24.5% 28.3% 27.3% 32.7%
Moderately strong (3)12 277 30 31
22.6% 26.4% 24.8% 27.4%
Very strong (4)3 132 11 8
5.7% 12.6% 9.1% 7.1%
Extremely strong (5)3 58 1 2
5.7% 5.5% 0.8% 1.8%
Total53 1,048 121 113
100.0% 100.0% 100.0% 100.0%Mean 2.1 2.4 2.1 2.2
χ2 (12, n = 1,335) = 21.816, p = 0.040.
At this time, how strong is your connection to the university?

11
Alumni Results
• However, there is opportunity to strengthen alumni connections
Decrease greatly/
somewhat (1)
Stay the same (2)
Increase somewhat
(3)Increase
greatly (4) TotalWould you like your current level of connection to the university to increase, decrease, or stay the same in the future?
42 518 616 137 1,313
3.2% 39.5% 46.9% 10.4% 100.0%
Mean 2.6

12
Alumni Results
Chicagoland Elsewhere
Decrease greatly/somewhat (1)21 21
2.9% 3.5%
Stay the same (2)236 281
33.1% 47.1%
Increase somewhat (3)367 248
51.4% 41.5%
Increase greatly (4)90 47
12.6% 7.9%
Total714 597
100.0% 100.0%Mean 2.7 2.5
χ2 (3, n = 1,311) = 30.238, p = 0.000.
Would you like your current level of connection to the university to increase, decrease, or stay the same in the future?
• Chicagoland based alumni would like to increase connection

13
Alumni Results
How Much the University Values Its Relationship with Alumni
χ2 (3, n = 1,335) = 9.237, p = 0.026.
• But, Chicagoland based alumni also have less positive perceptions
Chicagoland Elsewhere
Not at all (1)26 14
3.4% 2.2%
A little (2)157 85
20.3% 13.3%
A moderate amount (3)263 211
34.0% 33.0%
A lot (4)241 246
31.2% 38.4%
A great deal (5)86 84
11.1% 13.1%
Total773 640
100.0% 100.0%Mean 3.3 3.5
14
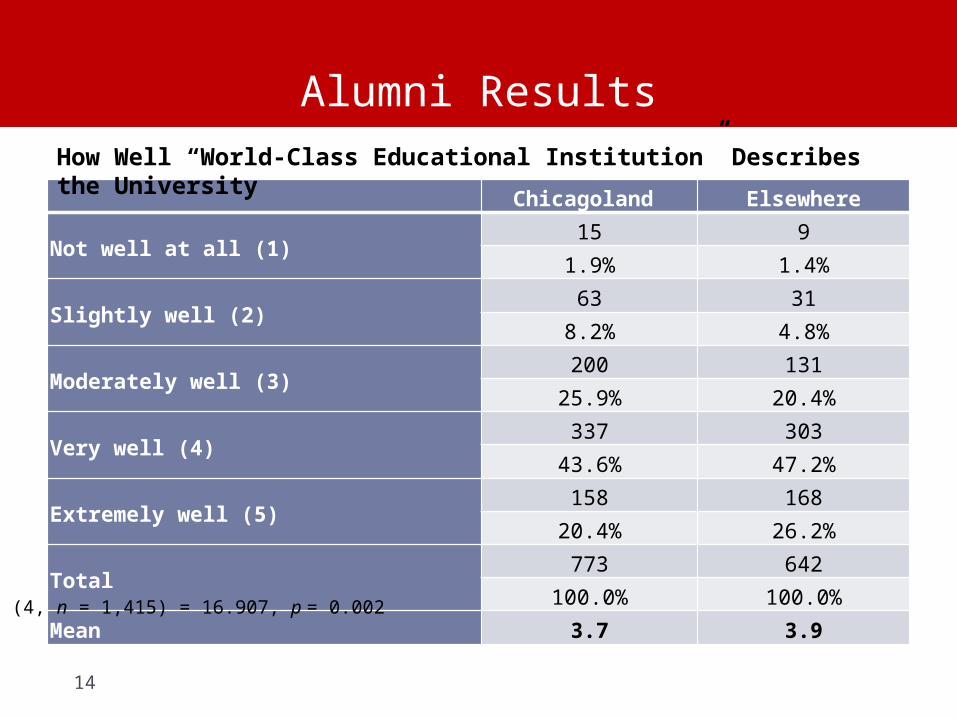
Alumni Results
Chicagoland Elsewhere
Not well at all (1)15 9
1.9% 1.4%
Slightly well (2)63 31
8.2% 4.8%
Moderately well (3)200 131
25.9% 20.4%
Very well (4)337 303
43.6% 47.2%
Extremely well (5)158 168
20.4% 26.2%
Total773 642
100.0% 100.0%Mean 3.7 3.9
χ2 (4, n = 1,415) = 16.907, p = 0.002
How Well “World-Class Educational Institution” Describes the University

15
Alumni Results
Chicagoland ElsewhereNot at all/to a small extent (1)
23 83.3% 1.3%
To some extent (2)180 98
25.5% 16.3%
To a large extent (3)223 220
31.5% 36.7%
To a great extent (4)281 274
39.7% 45.7%
Total707 600
100.0% 100.0%Mean 3.1 3.3
How Much Illinois Research Impacts the World
χ2 (3, n = 1,307) = 22.948, p = 0.000.

16
Alumni ResultsHow Much the Educational Experience Provided by the University Helps to Develop Students’ Critical Thinking and Analytic Skills
χ2 (3, n = 1,309) = 11.182, p = 0.011.
Chicagoland ElsewhereDoes not help at all/helps a little (1)
39 345.4% 5.8%
Helps a moderate amount (2)179 105
24.9% 17.8%
Helps a lot (3)281 237
39.1% 40.1%
Helps a great deal (4)219 215
30.5% 36.4%
Total718 591
100.0% 100.0%Mean 2.9 3.1

17
Alumni ResultsHow Much the Education Provided by the University Improves Students’ Future Earning Potential
χ2 (3, n = 1,335) = 9.237, p = 0.026.
Chicagoland Elsewhere
Not at all/a little (1)35 25
4.8% 4.1%
A moderate amount (2)196 127
26.8% 21.1%
A lot (3)286 234
39.1% 38.8%
A great deal (4)215 217
29.4% 36.0%
Total732 603
100.0% 100.0%Mean 2.9 3.1

18
Parent Results
Very similar results for parents stratum Strength of connection lower among non-alumni
parents, Yet group expresses a slightly greater preference
for increasing their connection.

19
Questions?

20
Thank you!