Embed Size (px)
Citation preview

January 2008
Gap Analysis:
Services and Supports for People with Developmental Disabilities in Illinois
Human Services Research Institute
7420 SW Bridgeport Road Suite #210 Portland Oregon 97224
Voice: 503-924-3783 fax: 503-924-3789 www.hsri.org

[Page left intentionally blank for double-sided copying]
Human Services Research Institute
7420 SW Bridgeport Road Suite #210 Portland Oregon 97224
Voice: 503-924-3783 fax: 503-924-3789 www.hsri.org

Gap Analysis:
Services and Supports for People with Developmental
Disabilities in Illinois
January 2008
Prepared in partnership with the
Illinois Council on Developmental Disabilities
Gary Smith, John Agosta and Jaime Daignault
Contributors: Eric S. Zaharia and Ernest McKenney
Human Services Research Institute 7420 SW Bridgeport Road, Suite 210
Portland, Oregon 97224 503-924-3783
All opinions expressed herein are solely those of the authors and do not reflect the position or policy of the Illinois Council on Developmental Disabilities or any other government authority.

[Page left intentionally blank for double-sided copying]
Human Services Research Institute
7420 SW Bridgeport Road Suite #210 Portland Oregon 97224
Voice: 503-924-3783 fax: 503-924-3789 www.hsri.org

About the Authors
The Human Services Research Institute (HSRI) was founded in 1976 and is a non-profit, tax-exempt corporation. For over 30 years, HSRI has assisted states and the federal government to enhance services and supports to improve the lives of vulnerable citizens, such as those with developmental disabilities or mental illness, or low income families. HSRI has provided consultation in such areas as strategic planning and organizational change, funding, systems integration, quality management and assurance, program evaluation, evidence-based practices, family support, self-advocacy, self-determination, and workforce development. For more information, go to: www.hsri.org.
HSRI has offices located in Cambridge, Massachusetts and Portland, Oregon. This Blueprint was prepared by these three staff of the Oregon office:
Gary Smith joined HSRI in 2001 and serves as a Senior Policy Fellow. He has worked in the human services arena for over 30 years, concentrating on policy analysis and advocating for policy changes to promote person-centered services and supports in the community. He is a nationally recognized expert regarding Medicaid-financed long-term services, focusing on federal and state policies that affect individuals with developmental and other disabilities. Mr. Smith has conducted major projects on behalf of the Centers for Medicare & Medicaid Services (CMS), including National HCBS Quality Inventory and the revision to the HCBS waiver application, including the preparation of the accompany instructions and technical guidance. Mr. Smith also has conducted major technical assistance engagements on behalf of the several states, such as California, Colorado, Georgia, Louisiana, North Carolina, Tennessee and others.
John Agosta is an HSRI Vice President. He completed his doctorate in Rehabilitation Research at the University of Oregon, specializing in research methods and community supports for people with disabilities. Employed at HSRI since 1983, he has been involved with nearly all efforts at HSRI surrounding family support issues, facilitated development of strategic plans, conducted analyses of state systems for people with developmental disabilities (e.g., Arkansas, Idaho, Oregon, Hawaii), and has studied specific facets of the field (e.g., trends in supported employment, managed care, self-determination). He is a nationally recognized expert in topic areas such as family support, self directed supports and community systems regarding policies that affect individuals with developmental disabilities.
Jamie Daignault is a Policy Associate at HSRI. With a graduate degree in Special Education and an undergraduate degree in Family and Human Services, she has worked in the field for several years in both direct service and research capacities. Her primary responsibilities at HSRI presently involve project coordination. Currently, for example, she coordinates a project providing technical assistance to states rebalancing their long-term care systems funded by the Centers for Medicaid and Medicare Services, serves as an instructor for the Self-Advocate Leadership Network, and is co-founder of The Riot!, a national e-newsletter written by and for self-advocates.

[Page left intentionally blank for double-sided copying]

In Memoriam
Gary Smith
t is with great sadness that we must inform you that Gary Smith passed away on November 4, 2007. Gary joined the Human Services Research Institute in 2001 and served as a
Senior Policy Fellow. He was the lead author in compiling this Gap Analysis and other products related to this project.
In fact, this work was among his very last and was special to him. One of his first jobs in public service after leaving the Navy all those years ago was as staff to Governor Jim Thompson. In the mid 1970s he provided budget analysis and oversight for several major state agencies and programs, including developmental disabilities, mental health, public health, Medicaid, and corrections. Because of that experience we understood his strong connection and dedication to this project. And so, from that beginning to this end, the circle is completed.
Overall, Gary was a towering figure in the developmental disabilities field. His prodigious knowledge of Medicaid financing to help fund human services programs and his understanding of the rich history of our field were unmatched. He was a resource to hundreds of people around the country in so many different ways. He was always generous with his time and his expertise and never let an email request for help go unanswered.
More than that, he was committed to what we do and to the well being of people with disabilities. He was constantly trying to exhort us all to do better.
He was a dear friend, one of the funniest and most decent people any have ever met. We will miss him terribly as will all who worked with him.
Please spend a moment to remember Gary Smith.
I

[Page left intentionally blank for double-sided copying]

Table of Contents Introduction .............................................................................................. 1
Purpose of the Gap Analysis ....................................................................... 1 Gap Analysis Framework ............................................................................ 1 Data Sources ............................................................................................ 3
Benchmark #1: Serving Individuals with Reasonable Promptness ............. 5 Background .............................................................................................. 5 Illinois Status ........................................................................................... 6
Benchmark #2: Serving Individuals in the Most integrated Stetting ........... 9 Background .............................................................................................. 9 Illinois Status ......................................................................................... 10
Benchmark #3: Person-Centered Services ............................................... 13 Background ............................................................................................ 13 Illinois Status ......................................................................................... 14
Benchmark #4: Promoting Valued Outcomes ........................................... 17 Background ............................................................................................ 17 Illinois Status ......................................................................................... 18
Benchmark #5: Promoting Access to Services .......................................... 21 Background ............................................................................................ 21 Illinois Status ......................................................................................... 22
Benchmark #6: Service Quality and Oversight ......................................... 25 Background ............................................................................................ 25 Illinois Status ......................................................................................... 26
Benchmark #7: Economy and Efficiency ................................................... 27 Background ............................................................................................ 27 Illinois Status ......................................................................................... 29

[Page left intentionally blank for double-sided copying]

Gap Analysis 1
Introduction The Illinois Council on Developmental Disabilities (ICDD) engaged the Human Services
Research Institute (HSRI) to prepare a Blueprint for System Redesign in Illinois. The Blueprint is intended to serve as a concrete, system redesign action plan for reducing Illinois’ over reliance on serving people with developmental disabilities in large congregate care facilities and increasing access to quality supports in the community.
This is the second in a series of three reports prepared by HSRI on behalf of ICDD. In its first report (Illinois System Environmental Scan Project Brief, submitted February 2007), HSRI reported the results of its interviews of Illinois stakeholders concerning the state’s efforts to support its citizens with developmental disabilities. This report, along with the first, serves as the foundation for the Blueprint.
Purpose of the Gap Analysis A gap analysis is an appraisal that compares an enterprise’s actual to its potential or desired
performance. It is an assessment of what an enterprise is doing currently and where it wants to go in the future. A gap analysis flows from benchmarking (the level of performance achieved by peer enterprises) and other assessments of requirements and current capabilities.
This gap analysis includes comparisons of the present performance of the Illinois system to that of systems in other states. Such comparisons aid in pinpointing areas of strengths and weaknesses in system performance. The gap analysis also draws upon the stakeholder interviews that HSRI conducted, previous studies of the Illinois developmental disabilities service delivery system, and consultation with national experts about critical dimensions of system performance.
We acknowledge that the Illinois Department of Human Services, Division of Developmental Disabilities Services and its stakeholders are working to improve the service delivery system. The DHS/DDD 2007 Strategic Plan and the Governor’s Disability Services Advisory Committee Disability Services Plan Update 2006 demonstrate a vision to improve the system so that it effectively addresses the needs of people with disabilities.
The gap analysis serves as a foundation for the Blueprint for System Redesign in Illinois. The purpose of the Blueprint is to specify an action plan for how Illinois can transform its present system into one so that it relies less on large congregate care facilities and services while ensuring that people with developmental disabilities and their families have access to quality services and supports in the community.
Gap Analysis Framework
As just noted, a gap analysis is conducted against broad expectations for desired system performance. These expectations serve as the basis for appraising current performance. For the purpose of the gap analysis, HSRI has identified seven fundamental, top-level performance benchmarks against which to gauge the provision of publicly-funded services and supports for people with developmental disabilities. As illustrated by the graphic on the following page, Benchmarks 1-4 generally concern system performance dimensions related to gaining entrance to the system, service delivery and associated outcomes. Benchmarks 5-7 concern system infrastructure or the operational elements that under gird the system. Taken together, these benchmarks serve as the basis for the HSRI gap analysis and the Blueprint:

Introduction
Gap Analysis 2
1. People with developmental disabilities have access to and receive necessary publicly-funded services and supports with reasonable promptness. Publicly-funded systems should operate in a fashion so that individuals who have been assessed as needing essential services receive such services and supports within a reasonable period of time. This requires sound system infrastructure to underpin a diverse and agile service delivery capacity. When services are not furnished promptly, individuals and families experience negative life outcomes.
2. Services and supports are provided in the most integrated setting appropriate to the needs of the individual. The U.S. Supreme Court’s Olmstead decision has established the clear benchmark that publicly-funded services must be furnished in the most integrated setting. The decision mandates that states operate services so that individuals are not unnecessarily institutionalized.
3. Services and supports are person-centered. Person-centered service delivery means that services and supports are identified and authorized to address the specific needs of each person as a result of an individualized assessment and through a person-centered planning process. Person-centered service delivery requires flexibility in service selection and service delivery methods. Opportunities for individuals and families to direct and manage services are available. A person-centered system also meaningfully involves people with developmental disabilities in advising decision-makers.
4. The provision of services results in the achievement of valued outcomes for people with developmental disabilities. Services should promote such outcomes as personal independence, employment and community integration. Effective person centered services must be available to address functional and other limitations that impede the achievement of such outcomes by individuals.
5. There is an infrastructure that facilitates the ready access of people with developmental disabilities and families to services. Infrastructure refers to the operational components that undergrid and support the functioning of the direct services system. A well-designed infrastructure is essential to the effective operation of a complex system.
6. Services must continuously meet essential quality standards and there must be confidence that quality oversight systems function effectively and reliably.
System Access Benchmark 1 Reasonable Promptness
Service Delivery Outcomes Benchmark 4
Valued Outcomes
System Infrastructure Benchmark 5
Promoting Service Access
Benchmark 7 Economy & Efficiency
Benchmark 6 Quality & Oversight Seven
Performance Benchmarks
Benchmark 2 Most Integrated Setting
Benchmark 3 Person-Centered Services

Introduction
Gap Analysis 3
Quality assurance systems must ensure that individuals are not exposed to abuse, neglect and exploitation. There must be appropriate oversight to protect the health and welfare of vulnerable persons.
7. The system must promote economy and efficiency in the delivery of services and supports. This means emphasizing the use of lower cost services and supports, building on the supports that families and communities provide, and effectively utilizing federal funding. Systems that do not stress economy and efficiency are not sustainable.
These essential benchmarks serve as the framework for the HSRI gap analysis. In the following sections, information about Illinois’ current performance vis-à-vis these benchmarks is presented.
Data Sources
The gap analysis is based principally on data provided or published by the Illinois Department of Human Services (IDHS) or assembled by the Research and Training Center on Community Living (RTCCL) at the University of Minnesota. Annually, RTCCL conducts a comprehensive nationwide survey of state developmental disabilities agencies to compile information concerning residential and other services and supports for people with developmental disabilities. All states, including Illinois, participate in this survey. In general, RTCCL survey data serve as the source of information that compares Illinois performance to the nation as a whole and selected other states.1 We also draw from data compiled by the Coleman Institute at the University of Colorado.2 Other information sources also were consulted.
In some instances, we compare Illinois performance to that in selected other states. The states selected for this comparison include: (a) the other states in the same federal region as Illinois (IN, MI, MN, OH, WI); (b) other neighboring states (IA, KY, MO); and, (c) other states with populations in the range of 8-12 million (GA, NJ, NC, PA).
1 Robert Prouty, Gary Smith, and K. Charlie Lakin (eds.) (2007). Residential Services for Persons with Developmental Disabilities: Status and Trends Though 2006. Minneapolis: University of Minnesota, Research and Training Center on Community Living. 2 David Braddock et al. (2005). The State of the States in Developmental Disabilities: 2005. Boulder
Colorado: Department of Psychiatry and Coleman Institute for Cognitive Disabilities.

[Page left intentionally blank for double-sided copying]

Gap Analysis 5
Demand for publicly-funded developmental disabilities services is growing nationwide.
Benchmark #1: Serving Individuals with Reasonable Promptness
Assessment: Illinois does not furnish services with reasonable promptness to its citizens with developmental disabilities.
Background
Most of the 5 million people with developmental disabilities in the United States are supported by their families or live independently without specialized publicly-funded developmental disabilities services. Public developmental disabilities service systems provide services and supports to a relatively small percentage (about 20-25 percent) of all individuals with developmental disabilities. Public systems focus principally on persons who have significant functional limitations and who require services over and above the supports that their families are able to provide or that they can obtain through generic human services programs.
Demand for publicly-funded developmental disabilities services is growing nationwide. Generally, it has been increasing at a rate greater than population growth alone. This increase in service demand is the outgrowth of several factors. One of the most important factors is the increased longevity of people with developmental disabilities. The life span of people with developmental disabilities has increased as the result of better health care and is approaching that of the general population. This increased longevity has two ramifications for developmental disabilities service systems: (a) turnover among individuals receiving services is reduced (and, thereby, there is less capacity to absorb new demand) and (b) there is a growing cohort of individuals who live in households with primary caregivers who are themselves aging. About 25 percent of persons with developmental disabilities reside in households with primary caregivers who are age 60 or older. As these caregivers grow older, their capacity to continue to support individuals diminishes. Increased demand also is the result of other factors, including the development of community services and supports that better meet the needs of individuals and families.
The demand for developmental disabilities services is dynamic. Each year, significant numbers of youth with developmental disabilities exit special education systems and need ongoing services and supports as young adults. Other persons seek services because their families cannot continue to support them or need extra assistance. It is not uncommon to observe year-over-year increases in the expressed demand for developmental disabilities of 4 percent or more.
States generally operate their developmental disabilities service systems under fixed capacity limits. Only a handful of states (e.g., AZ and CA) provide for automatic annual caseload increases to accommodate additional eligible individuals. System capacity is managed by capping dollars, “slots” (service openings), or a combination of both. Likewise, capacity is regulated by changes in funding from year to year.
Capped system capacity coupled with rising demand for services has resulted in individuals spilling over onto “waiting lists.” The number of people on a waiting list measures the gap between current system capacity and expressed service demand. This gap grows when the expansion of system capacity does not keep pace with growth in service demand. The waiting list queue will lengthen even though there may have been some growth in system capacity.

Benchmark #1: Serving Individuals with Reasonable Promptness
Gap Analysis 6
In August 2007, there were 7,784 people in Illinois with emergency or critical unmet needs.
Responding to service needs with reasonable promptness means that individuals who have emergency or crisis needs will receive services within 90 days. People who have critical near-term needs should be able to count on receiving services within 6-9 months. If they do not, their needs can rapidly turn into an emergency or crisis situation.
Illinois Status
Until recently, Illinois did not compile systematic information about people with developmental disabilities who need and would qualify for, but are not receiving, services and supports. As a consequence, Illinois did not know where it stood in meeting the needs of its citizens with developmental disabilities. Legislation was enacted to require the state to compile information about unmet service demand. In response, the Department of Human Services (DHS) adopted the Prioritization of Urgency of Need for Services (PUNS) tool that was developed in Pennsylvania in order to systematically compile information about unmet service needs.
PUNS classifies individuals based on an assessment of how soon services must be provided based on urgency of need. Individuals are classified as to whether the service need is an “emergency” (i.e., services are needed right away), “critical” (supports are needed within one year) or “planning” (services are needed within a 1-5 year time frame). The classification of individuals by urgency of need takes into account both the needs of the individual and the caregiver’s situation (e.g., the capacity of the caregiver to continue to support the person). For example, the “emergency need” classification includes people whose caregivers are no longer able to support them, who are at immediate risk of out-of-home placement and/or where there has been a significant deterioration in the person’s condition. The “critical” category includes persons with urgent needs due to the deteriorating condition of their caregivers or who live with aging caregivers over the age of 60. Some people with unmet needs currently receive services but require different or additional services. Urgency of need is used to prioritize the authorization of services when openings are available in Illinois.
According to the DHS PUNS report, dated August 21, 2007, there are 11,214 people with developmental disabilities in Illinois who have unmet service needs. Of these:
• 1,971 (17.6%) are in the emergency need category; • Another 5,813 (51.8%) are in the critical need category; and • 3,430 (30.6%) people have “planning needs.”
The services needed by these individuals include 24-hour residential services (3,214 individuals have emergency or critical unmet needs for these services), non-24 hour supports, personal support, and others. Individuals who have unmet needs are predominantly adults with developmental disabilities age 22 and older (about 67 percent). There also are a significant number of youth with unmet needs who are moving through the special education system toward adulthood. About 32% percent of individuals with unmet needs are age 40 or older. In addition, about 60% of those in the PUNS data set reveal the age of the primary care-giver, and for this group 18 percent of individuals with unmet needs reside with primary caregivers aged 60 or older.
There is no reason to suspect that the PUNS data overstates the extent of unmet service demand in Illinois. Indeed, there are several reasons to believe that the gap between services needed and available in Illinois is larger than measured by the PUNS. In particular:

Benchmark #1: Serving Individuals with Reasonable Promptness
Gap Analysis 7
Currently, Illinois has a system capacity shortfall of almost 35 percent.
• It is unclear as to the extent to which individuals and families are aware that they can come forward and register their needs with the state;
• In many states, registration for services surges once the availability of services begins to increase. This has been the situation in Florida where a new wave of registrations to the state’s waiting list followed on the heels of the expansion of community services post-1999;
• The experience also is that many individuals and families do not come forward to seek services until they are confronted by a personal or family crisis; and
• When current service demand in Illinois is compared to demand in other states, it appears that demand is understated. That is, given the size of Illinois’ population, one would expect that the gap between services needed and available would actually be larger than is presently measured by PUNS.
In our view, PUNS provides a reasonably accurate – albeit probably understated – measure of the current gap between services needed and available in Illinois.
When only the 7,784 individuals in the emergency or critical categories are considered (i.e., the individuals with the most urgent near-term needs), Illinois has a shortfall in system capacity of almost 35 percent. This estimate is calculated by dividing this number by the sum of individuals who currently receive SODC, ICF/DD or HCBS services (i.e., 22,355 people).
In essence, meeting the needs of these individuals would require that services to be expanded by just under one-third to meet urgent service demand. If this demand were met by enrolling all these individuals into the Illinois Medicaid HCBS waiver for people with developmental disabilities, the cost would be about $225.2 million ($112.6 million in state funds). This estimate is based on current HCBS waiver per person costs of $30,027 per year. By any measure, the current gap between services needed and services available in Illinois is large and will be costly to close.
The gap between present capacity and unmet urgent needs means Illinois does not operate its service system in a manner that ensures that people who have critical needs will receive services reasonably promptly. In Illinois, people must wait for the next available service opening or HCBS waiver slot. Such openings are few and far between in a system that is operating near full capacity. Individuals cannot count on getting services right away. In the meantime, their situation deteriorates and caregivers frequently buckle under the stress of long-term unassisted care giving.
The short-fall in system capacity has additional ramifications. People are limited to receiving services in settings where there are openings rather than their most preferred setting. This undermines individual choice. Openings may not be available near the individual’s home community, making it difficult for an individual to maintain ties with their friends and family.
Illinois presently has no long-range plan for closing the gap between system capacity and service demand. No targets have been established to secure a year-over-year reduction in this gap. DHS does not engage in estimating future service demand. Because there is no long-range plan to address service demand, individuals with developmental disabilities and families do not know when their service needs will be met. We acknowledge that there are proposals before state leaders to increase funding in the next fiscal year to expand CILA and other services. In fact, two new HCBS waivers for children were recently approved:

Benchmark #1: Serving Individuals with Reasonable Promptness
Gap Analysis 8
• Effective July 1, 2007, the Children’s Support Waiver was approved and will offer Home-Based Support Services for individuals aged three through 21 years. DHS/DDD may serve up to 600 participants in this waiver. In its first year, many existing service recipients will have their services converted into this waiver, while another 182 individuals selected from the PUNS database will be added in January 2008. If additional funds are appropriated subsequently, the waiver can be amended to increase its capacity.
• Effective July 1, 2007,The Children’s Residential Waiver was approved to offer 24-hour residential supports in licensed group homes for individuals aged three through 21 years. Approved capacity is 175 participants, all of whom are currently receiving services. Unless additional appropriations follow, no further expansion of this waiver is planned.
Budget proposals and initiatives like these will help Illinois to make some progress in closing the gap between system capacity and service demand. Still, longer term strategies are needed to address the future demand for services.
Conclusion
Illinois is not alone in grappling with the steady increase in the demand for developmental disabilities services. Gaps between system capacity and service demand are present in nearly every state, although the relative size of the gap varies considerably state-to-state. In some states (e.g., LA and TX), the situation is much worse than in Illinois. Elsewhere, people face much shorter waiting times (e.g., VT and WY). Other states (e.g., CT, KY, NY and PA) have adopted multi-year plans to reduce their waiting lists. There is no doubt that furnishing services to individuals with developmental disabilities and families who have urgent needs with reasonable promptness is one of the major challenges facing all states.
The present gap in Illinois between system capacity and service demand is large. There is a large cohort of people with developmental disabilities in Illinois who have especially urgent but unmet needs. As the Illinois service system is presently constituted, these individuals have little or no prospect of receiving services any time soon. No strategy has emerged as yet in Illinois to ensure that people who urgently need services will receive them reasonably promptly. Absent such a strategy, there is every danger that the current gap will worsen.
How Illinois might close the present gap is discussed in the Blueprint. `

Gap Analysis 9
The contemporary benchmark for supporting individuals with developmental disabilities in the most integrated setting is a living arrangement that supports six or fewer individuals in the community.
Benchmark #2: Serving Individuals in the Most Integrated Setting
Assessment: Illinois relies on large congregate care facilities to serve people with developmental disabilities to an extraordinary extent. Opportunities for individuals to receive services in the most integrated setting are truncated.
Background
In its landmark Olmstead v. LC & EW decision, the United States Supreme Court affirmed that, under Title II of the Americans with Disabilities Act, states are obliged to operate their programs for people with disabilities in a manner that ensures that individuals receive services in the most integrated setting appropriate to their needs. The Olmstead decision established a clear benchmark for the operation of public programs for people with disabilities.
As a practical matter, “most integrated setting” means that individuals are supported in community settings that are like the typical living arrangements of people without disabilities. The Olmstead decision sent the strong message that people should not be unnecessarily institutionalized. The decision also established affirmative expectations for the transition of persons from institutional settings to the community.
In developmental disabilities services, twenty years ago the substantial majority of individuals were served in large congregate settings (i.e., settings where seven or more persons are served). In 1987, only 27.3 percent of all persons who received residential services were supported in living arrangements for six or fewer persons. About one-half of all individuals were served in very large settings that serve sixteen or more individuals, including 95,000 persons who resided in very large, state-operated public institutions.
By 2006, 70.5 percent of all persons nationwide were supported in living arrangements for six or fewer people. In eleven states (AK, AZ, HI, IN, ME, MD, NV, NH, NM, RI, VT), 90 percent or more of individuals were served in small living arrangements. Nationwide, only 15.3 percent of all persons were served in very large settings with sixteen or more beds. The number of people served in very large public institutions fell to under 39,000 in 2006. The average community living arrangement supported 2.7 individuals versus 7.5 persons in 1987. The steady, marked decline in the use of large and very large residential settings over the past twenty years is the product of several factors, including litigation about the conditions in very large public facilities, the expansion of community services, and the community integration imperative.
Today, in the United States, the benchmark for supporting people with developmental disabilities in the most integrated setting is to employ settings where six and frequently fewer people share a living arrangement. Most states have reconfigured their service systems so that the substantial majority of individuals now are supported in settings that meet this benchmark.

Benchmark #2: Serving Individuals in the Most Integrated Setting
Gap Analysis 10
Illinois Status
Illinois substantially lags the nation and most other states in shifting the delivery of services to the most integrated setting. In 2006, only 37 percent of people with developmental disabilities in Illinois were supported in living arrangements for six or fewer persons, the benchmark standard. People with developmental disabilities in Illinois are twice as likely to be served in very large settings (settings that serve 16 or more persons) than individuals in other states. There are approximately another 1,100 individuals with developmental disabilities who are served in nursing homes and SNF/Peds facilities.
Chart 1 compares the percentage of individuals served in very large facilities in Illinois to the nation and selected other states in 2006. As can be seen, the percentage of people served in such facilities is higher in Illinois than in all the other states except New Jersey and Ohio. Indiana, Minnesota and Wisconsin utilize very large settings at rates that are appreciably below the nationwide rate. Illinois alone accounts for about 10 percent of all persons nationwide who are served in very large facilities. Very large facilities in Illinois include the nine State Operated Developmental Centers (SODCs) and many of the private-sector Intermediate Care Facilities for Persons with Developmental Disabilities (ICFs/DD).
Chart 2 compares Illinois SODC utilization (expressed as individuals served in such facilities per 100,000 persons in the general population) to the nation and selected other states. In 2006, the rate at
which Illinois served individuals in very large state operated facilities was 64 percent higher than the nationwide average. In order for utilization in Illinois to have
Residential Services by Size of Living Arrangement (2006)
Setting Size Illinois
(Persons Served) %
Illinois %
U.S. 0 < 6 7,780 37% 71% 7 - 15 6,612 32% 14%
16 or more 6,452 31% 15% Total 20,844
Percentage of Persons Served in Facilities with 16 or More Beds in 2006
(chart 1)
0.0%
5.0%
10.0%
15.0%
20.0%
25.0%
30.0%
35.0%
40.0%
IL US GA IN IA KY MN MO NJ NC OH PA WI
Utilization of Large State Operated FacilitiesPer 100,000 Population - 2006
(Chart 2)
0.0
5.0
10.0
15.0
20.0
25.0
30.0
35.0
40.0
Utilization 21.0 12.8 10.4 5.5 24.7 10.7 1.7 0.9 16.7 35.0 19.0 13.6 11.1 9.3
IL US GA IN IA KY MI MN MO NJ NC OH PA WI

Benchmark #2: Serving Individuals in the Most Integrated Setting
Gap Analysis 11
SODC Residents (1987 - 2006)(Chart 3)
0
500
1,000
1,500
2,000
2,500
3,000
3,500
4,000
4,500
SODC Residents 4,436 4,340 3,726 3,358 3,191 2,875 2,695
1987 1991 1994 1998 2000 2004 2006
matched the nationwide average, the census of the SODCs would have had to have been about 1,050 people lower than it was in 2006. Illinois utilization of very large state-operated facilities was higher than the rate in all the other selected states with the exceptions of New Jersey and Iowa. There were nine states that did not operate any very large public facilities. In 2006, Illinois ranked 7th among the states in terms of the number of people served in large state-operated facilities relative to state population.
Over the years, Illinois has slowly reduced the number of persons served in the SODCs. Chart 3 shows the trend in the number of persons served at the SODCs. The pace of reduction in the number of persons served at the Illinois SODCs has been slower than the rate nationwide. For example, between 1995 and 2006, the
number of people served in very large public facilities nationwide declined by 40.6 percent. During the same period, the number of people served in the Illinois SODCs declined by 27.8 percent.
The 2002 closure of Lincoln Developmental Center left nine SODCs in operation. Three of the Developmental Centers (Howe, Ludeman and Shapiro) are quite large, serving between 400 and 600 individuals. During fiscal year 2007, DHS planned to reduce the number of SODC
residents by an additional 200 persons. This reduction was undertaken to enrich Developmental Center staffing ratios in order to meet federal quality of care requirements. This reduction will still leave Illinois with a Developmental Center population that is well above the national norm relative to population.
In addition to the SODCs, in 2006, there were another 3,757 individuals who were served in very large non-state facilities. Most of these facilities were classified as ICFs/DD. The number of persons served in these settings has gradually trended downward. Still, more people with developmental disabilities are served in large ICFs/DD in Illinois than in any other state. In 2006, Illinois accounted for one out of every six very large non-state ICF/DD beds nationwide.
Illinois stands apart from the nation and nearly every other state in the extent to which it relies on large and very large facilities to serve people with developmental disabilities. Several factors appear to have contributed:
• The early build out of developmental disabilities services in Illinois centered on the expansion of ICF/DD services, including certification of several large facilities. Many other states instead elected to build out their service systems employing the HCBS waiver program and, thereby, did not establish a large base of ICF/DD facilities. Eighteen states have no very large ICFs/DD and another nine have only one-two such facilities;
• Illinois has keyed its ICF/DD reimbursement system to the operation of larger facilities. Today, that system continues to be based on the operation of 16-bed facilities and, thereby, poses major impediments to agencies that

Benchmark #2: Serving Individuals in the Most Integrated Setting
Gap Analysis 12
operate ICFs/DD that are interested in downsizing their facilities;
• During the early 1990s, Illinois launched the Community Integrated Living Arrangements (CILA) program. At the time, the state’s aim was to promote the delivery of residential services in small settings. Over the years, due principally to funding limitations, CILAs have been upsized and many of them are now larger group homes;
• Illinois has not had a clear plan for the operation of the SODCs; that is, a plan that examines how many SODCs Illinois should operate and for what purpose. Decision making about SODCs has usually been event/crisis driven (e.g., the decision to close Lincoln stemmed from continuing quality of care issues);
• As presently constituted, the Illinois service system is organized around funding silos that impede individuals in moving from one setting to another. For example, people who are served in ICFs/DD but want to live in another community setting cannot easily move – their funding will not follow them; and,
• There are strong constituencies in Illinois for preserving the operation of large ICFs/DD and the SODCs. Most notably, these constituencies include some who have family members residing in these facilities as well as facility staff. Both constituencies argue that: (a) the facilities provide much needed services for residents, (b) individuals have a right to choose residency in these facilities, and (c) they should remain open as a viable service option.
Whatever the factors, Illinois today operates a service system that is at odds fundamentally with the Olmstead decision benchmark that people with disabilities be served in the most integrated setting. The Illinois Disability Services Act signed by Governor Blagojevich in 2003 and other pending legislation (HB 1715, HB 2041, SB 581) illustrate Illinois’ system reform efforts. However, significant effort is needed to transform the system from one that resembles the configuration of developmental disabilities services during the 1980s, to one in line with the way services are commonly configured today.
Conclusion
There are many possible explanations for why the Illinois system lags behind the nation in shifting the delivery of services to the most integrated setting. However, the simple fact is that it is significantly less likely that people with developmental disabilities in Illinois will be supported in the most integrated setting than in nearly any other state.
In the Blueprint, we will outline action steps that Illinois can take to change this situation.
Gap Analysis 13
Benchmark #3: Person-Centered Services
Assessment: Illinois has not configured its developmental disabilities system to embrace person-centered service delivery. Services and funding are tied to “programs” and service provider agencies.
Background
Person-centered service delivery means that services and supports are identified and authorized to address the specific needs of each person based on an individualized assessment and through a person-centered planning process. Such planning places the individual in the lead so that each person can express what he or she wants in life and make decisions about the supports that will be employed to achieve the goals in the plan. Person-centered service delivery requires flexibility in both service selection and service delivery methods.
Person-centered service delivery systems have several key features, including:
• Portability. The funds that are available to support a person are not locked into specific service models. For example, funding for residential services is not tied to particular types of settings but may be used to purchase services and supports in a variety of settings.
• Free Choice of Provider. Individuals can freely select among all qualified providers and can readily change providers when dissatisfied with provider performance.
• Flexibility. Services and supports can be customized around the particular needs and preferences of the individual. Person-centered service delivery recognizes that there are alternative pathways to achieving individual goals.
In this context, person-centered planning serves as the critical, instrumental tool for identifying the best mix of paid services and unpaid supports that will assist each individual in securing valued outcomes while concurrently assuring health and welfare. A person-centered system also is characterized by continuously engaging people with disabilities and families in policy deliberations.
Person-centered systems are inherently fluid. Such systems promote the development of individualized support strategies rather than the operation of set piece service delivery models.
In the past, most states operated their developmental disabilities systems by executing fixed dollar contracts with community agencies to deliver specified services. Contracting tied funding to providers and particular types of services. These practices made it difficult for individuals to change providers or services. Contracting practices also tended to discourage the entry of new providers into the market place.
Over the past twenty years, states have been making important strides toward operating more person-centered service delivery systems. In part, this reconfiguration is the byproduct of the rapid growth of community services. For example, states have shifted away from fixed dollar contracting and switched over to fee-for-service payment methods. Such methods are a more efficient means of purchasing services in large-scale service delivery systems. In addition, standardized fee-for-service payments help states to assure that services are portable and that individuals have free choice of providers. States also have recognized the value of broadening the menu of services and supports so that

Benchmark #3: Person-Centered Services
Gap Analysis 14
A growing number of states are incorporating self-direction into their HCBS waivers for people with developmental disabilities.
Illinois continues to employ contract management methods that impede free selection of providers.
support strategies can be customized to meet the needs of each person so that resources can be better targeted.
The reconfiguration of state systems along person-centered lines also has been prompted by the increased role that Medicaid funding is playing in underwriting developmental disabilities services, especially through the home and community-based services (HCBS) waiver program. Basic federal Medicaid policy requires that beneficiaries be able to exercise free choice of provider. Medicaid financing also has prompted states to switch over to fee-for-service payment methods. In addition, federal HCBS waiver policy provides states considerable latitude in selecting the services that they will offer and the methods of service delivery.
Person-centered service delivery is continuing to evolve. This evolution is taking two forms. The first is the development of methods that assign a total amount of funding (sometimes called Individual Budget Allocations or IBAs) to individuals within which they develop their person-centered plans. The amount of an individual’s funding is determined by taking into account consumer characteristics, support needs, and usual and customary expenditures for people who have similar characteristics and support needs. First pioneered in Wyoming, a number of other states (e.g., Connecticut and Georgia) are now developing similar approaches. The assignment of individual budget amounts creates a framework within which person-centered plans can be developed without sacrificing budget predictability.
Another important development in the evolution of person-centered service delivery is the emergence of self-direction. Self-directed service delivery methods position the individual or families to manage a service budget, including distributing the budget among different types of supports and serving as the employer of service workers. Self-direction gives individuals and families a greater degree of control over services while concurrently encouraging them to seek out the most economical services. Self-direction is a centerpiece of the Oregon HCBS supports waiver. A rapidly growing number of states are incorporating self-direction into their HCBS waivers. For example, Minnesota has implemented a self-directed services option in all its HCBS waivers, including its waiver for people with developmental disabilities.
Person-centered service delivery is inherently consumer-driven and market-based. It stands in contrast to systems that use slot-based contracting with service providers.
Illinois Status
Historically, the Illinois community developmental disabilities service system was structured around grant-in-aid contracts between the state and service providers. The grant-in-aid system tied dollars to service providers. Over the years, Illinois has gradually shifted the purchase of community services toward fee-for-service payment arrangements, in part to secure increased Medicaid funding for community services. This has included enrolling more CILA residents in the HCBS waiver and more recently shifting people who receive day training to the waiver. However, the grant-in-aid framework has not been discarded entirely. Contracts between DHS and service providers continue to be used to control total spending and, by default, available service openings. Fee-for-service billing is nested within these contracts, which mainly encompass day training and CILA services. This type of arrangement impedes the free selection of providers by
Benchmark #3: Person-Centered Services
Gap Analysis 15
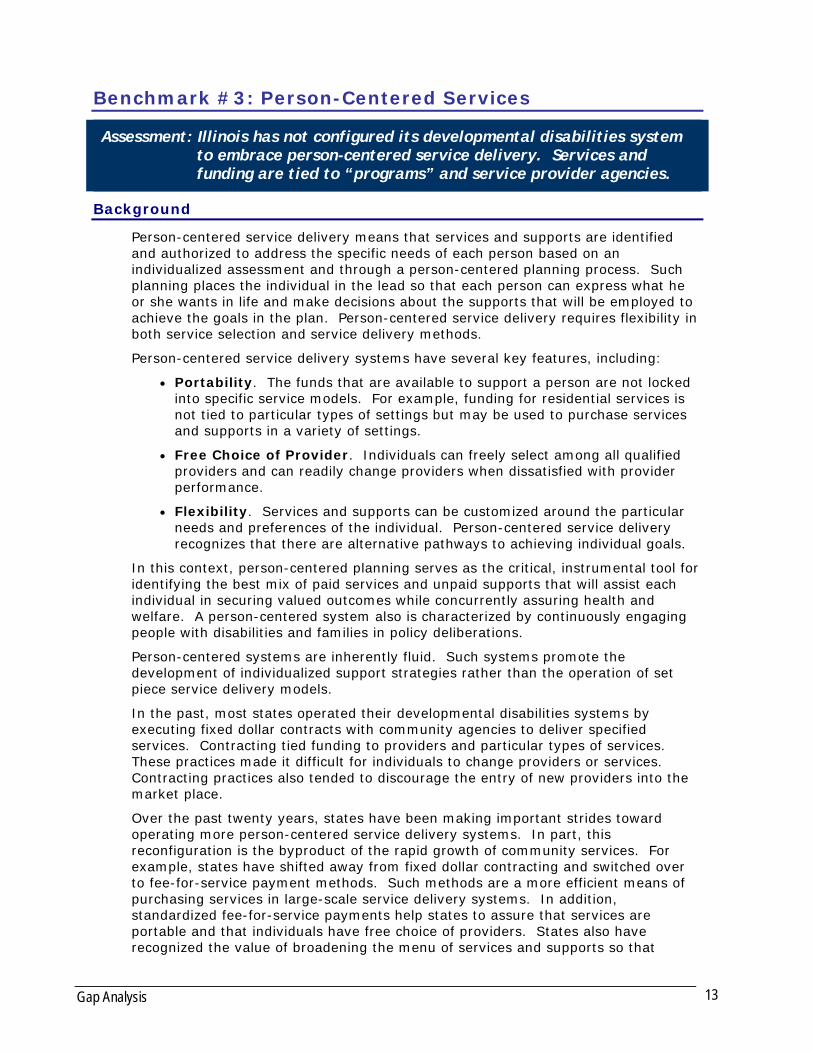
The planned DHS self-direction pilot is a promising development.
individuals. With respect to CILA services, choice is limited to providers with available openings.
The Illinois HCBS waiver for people with developmental disabilities covers a relatively wide range of services. However, the waiver is internally partitioned into sectors (e.g., CILA and home-based services) and each sector is slot controlled. This practice is not consistent with person-centered service delivery principles.
In the case of people who receive ICF/DD services, their funding is not portable. It is locked into the ICF/DD program and cannot be easily redeployed to purchase alternative services in the community. If a person leaves an ICF/DD, the person has no guarantee of receiving services elsewhere in the Illinois system.
The home-based services program affords individuals and families some measure of flexibility and authority over the services that they receive. Within the statutory funding limit (three times the federal Supplemental Security Income (SSI) benefit level for a single adult) that applies to home based services, individuals and families have some measure of latitude to craft service plans that address their priorities. This program is popular among families because of this feature. Home-based services include personal support, non-medical transportation, personal emergency response system, and service facilitation. Additional funding is provided for day training. However, home-based services are nested within the HCBS waiver program and there are stiff requirements that must be met for persons to obtain more services and supports than the home-based services allotment supports.
DHS plans on sponsoring a pilot project to implement self-direction for people who receive CILA services. It is expected that up to 70 individuals will participate in this pilot. These persons will be able to redeploy their waiver funding to secure services
outside a CILA living arrangement. This is a positive development that offers the potential for innovation in the delivery of waiver services in Illinois. For example, the pilot might enable more individuals to receive services and supports in a
home of their own and, ultimately, pave the way in Illinois to a broader reconfiguration of services along person-centered lines.
While there are efforts in Illinois to apply person-centered planning methods, more could be done to utilize this approach to its maximum advantage. Broadly, because dollars are tied to programs and service providers, opportunities for effective person-centered planning are limited in any case. Unless and until greater flexibility and portability is built into the service system, individuals will continue to have limited choices and not a great deal of ability to shape their services and supports.
Finally, the involvement of people with developmental disabilities and families in policy development and system design has been limited. In recent years, the DHS Division of Developmental Disabilities has fostered more opportunities for individuals and families to provide input, especially with respect to the development of the Division’s strategic plan. The Division also has engaged in other activities to open channels of communication with system stakeholders. However, the extent to which individuals and families are consulted concerning policy decisions needs improvement.
Conclusion
By and large, the Illinois developmental disabilities service system is not structured along person-centered lines. The legacy grant-in-aid program continues to influence the system’s structure and impedes portability. Illinois does not have a market-based system that encourages individuals and families to shop for services. It is a

Benchmark #3: Person-Centered Services
Gap Analysis 16
system that partitions services and continues to employ slot controls that limit access to services. In the Blueprint, we will offer suggestions about the steps that Illinois might take to reconfigure its service system along more person-centered lines.

Gap Analysis 17
Benchmark #4: Promoting Valued Outcomes
Assessment: Illinois does not place sufficient emphasis on services and supports that promote valued outcomes for people with developmental disabilities. Illinois lacks critical capabilities to address the needs of people with challenging conditions in the community.
Background
The delivery of developmental disabilities services should result in the achievement of valued outcomes for individuals and families. Such outcomes include increased independence as a result of skills training, community integration, and adults securing regular employment. Additional desired outcomes include ensuring that individuals are free from harm and have reliable, timely access to necessary health care services. Service systems should be held accountable for achieving these basic outcomes such as these for individuals. In addition, system performance should be routinely measured against mission-critical performance benchmarks.
There is solid evidence that person-centered service delivery promotes better outcomes for individuals. When services and supports can be targeted and customized around the needs and preferences of individuals and families, better outcomes are achieved.
The outcomes that a service system can achieve are affected by the services that the system offers, the allocation of resources within the system, and the extent to which a state promotes the achievement of valued outcomes. State policies play a critical role in securing valued outcomes for individuals. For example, over a six year period, Vermont limited and eventually prohibited the use of state funds to pay for daytime services in congregate sheltered workshops. This policy change has resulted in the percentage of adults in Vermont who have integrated community jobs climbing to about 55 percent, one of the highest levels nationwide.
There is marked variation among the states with respect to the number of individuals who secure regular jobs in the community. In some states, only relatively few people secure community employment. Elsewhere, 30 percent or more of all individuals have integrated community jobs. Florida has embarked on a major initiative to secure integrated jobs for one-half of all individuals who are presently served in facility-based day programs. There are several factors that contribute to individuals securing integrated employment. These factors include state leadership and policy setting, the adequacy of payments for supported employment services, and others.
As previously discussed, the extent to which states support people in the most integrated setting varies considerably. Yet, there are several states that have achieved the outcome that nearly all persons are supported in small living arrangements or typical community housing.
In many states, little systematic information is collected about the extent to which the delivery of publicly-funded developmental disabilities services results in the achievement of valued outcomes for individuals. However, today there is better technology available for states to track and measure the extent to which the delivery of services is having a positive impact. For example, the National Association of State Directors of Developmental Disabilities Services (NASDDDS) sponsors the 25-state National Core Indicators (NCI) project that provides states with tools to measure consumer and system outcomes as well as benchmark performance. South Dakota is
Benchmark #4: Promoting Valued Outcomes
Gap Analysis 18
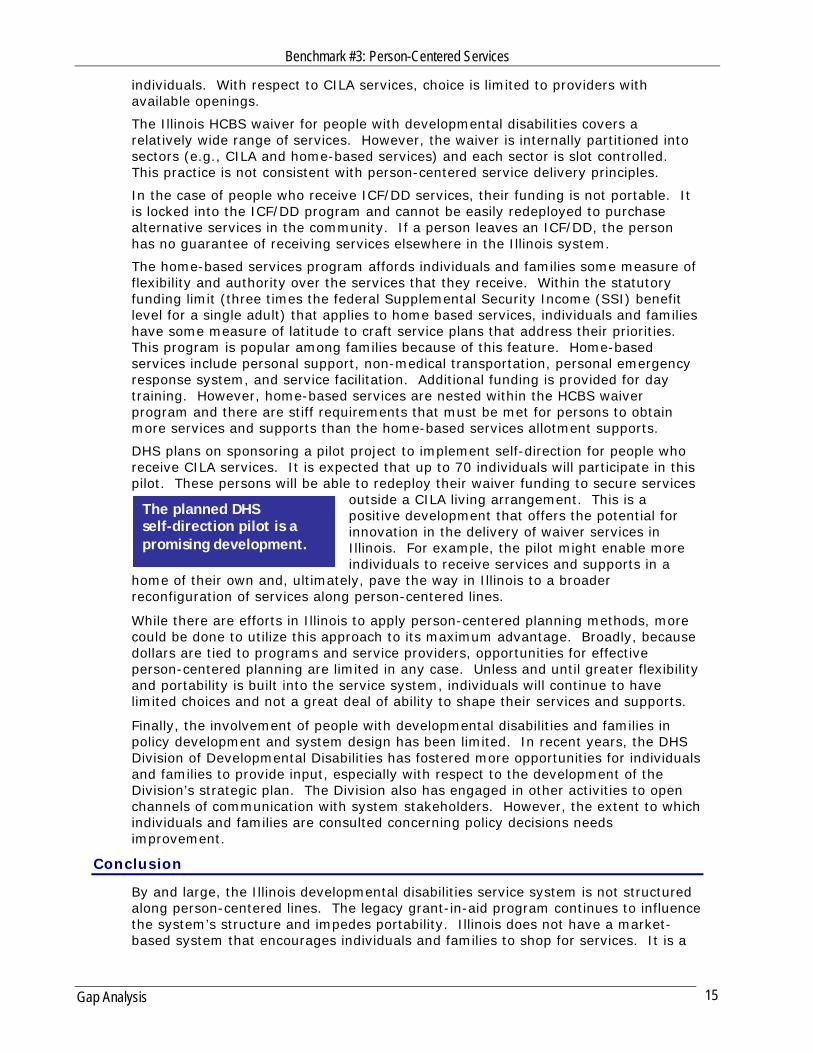
Illinois does not have systems to track individual outcomes or consistently measure system performance.
using these tools to assess the performance of its community system and engage in quality improvement activities. Florida operates a comprehensive system to measure its system and provider performance against the Personal Outcome measures that were developed by the Council on Quality and Leadership. Wisconsin and other states build the assessment of outcomes directly into their basic community agency quality review processes.
Absent a focus on outcomes and system performance, it is virtually impossible for a state to gauge the impact of the delivery of developmental disabilities services. Information about outcomes is enormously valuable on focusing attention on potential areas for improvement. Data-based/data-driven system management is necessary to ensure the effective delivery of services.
A related topic is the extent to which services effectively address substantial functional and other limitations that impede the achievement of personal outcomes for individuals. In every state, there are individuals who have extraordinary medical and behavioral challenges. A measure of the effectiveness of a service delivery system is the extent to which these challenges are effectively addressed within the community without resorting to short or long-term institutionalization. Strategies for addressing such challenges include the operation of crisis networks and the development of centers that can provide clinical expertise to community agencies in addressing medical and behavioral challenges.
Illinois Status
Illinois presently does not have systems in place to track individual outcomes or comprehensively measure system performance. In Illinois, it is impossible to tell in any systematic fashion the extent to which people with developmental disabilities are realizing outcomes that are important to them or how well the overall service system is performing with respect to mission critical outcomes. While DHS/DDD has articulated key values for the service system and desired outcomes for individuals, there presently are no mechanisms in place to systematically measure performance with respect to these values and outcomes.
For example, Illinois does not regularly and systematically compile information from individuals and families concerning their experiences in interacting with the service system or their satisfaction with the services and supports that they receive. There is no continuous feedback loop from Illinois service system customers to state funders. Similarly, there are no feedback loops from/to the state, providers, and individuals and families. Absent such feedback loops, it is very difficult to gauge what is working well in Illinois and what might benefit from improvement.
Illinois performance with respect to some types of outcomes is weak. For example, in 2004 only 13.2 percent of the 26,239 individuals who received state-funded day services in Illinois received supports to secure integrated employment. Nationwide, almost twice as many individuals (23.7 percent) received such supports. In Pennsylvania, 39.7 percent of all persons were engaged in supported employment.
Illinois also lacks coherent strategies to address the needs of individuals with challenging conditions in the community. The lack of community capacity to address the needs of these individuals is frequently cited as a reason to continue to operate the SODCs. Recently, DHS/DDD have proposed to launch a crisis response system that is staged out of the SODCs and includes the operation of two 15-bed SODC units to provide short-term intensive services to individuals in the community who

Benchmark #4: Promoting Valued Outcomes
Gap Analysis 19
experience a crisis. While there may be merit to this proposal, a broader-based strategy that builds clinical competencies and capacities within the community system to address the needs of individuals could have a broader and more durable impact.
Conclusion
Illinois needs to reorient the management of its developmental disabilities system to stress the achievement of valued outcomes for individuals. DHS/DDD should systematically measure system performance. In the Blueprint, suggestions concerning how Illinois might promote valued outcomes for individuals and families and measure system performance are discussed.

[Page left intentionally blank for double-sided copying]

Gap Analysis 21
Most states operate their developmental disabilities service systems through independent local/ regional service coordination entities.
Benchmark #5: Promoting Access to Services
Assessment: Illinois’ developmental disabilities service system infrastructure is fragmented and under-resourced. This poses barriers to people accessing services.
Background
Infrastructure refers to the operational components that undergird and support the functioning of the direct services system. These components include intake and eligibility determination (gate keeping functions), service planning and authorization, service delivery monitoring and resolving problems in service access. Additional components include contracting and the operation of information technology (I/T) systems through which essential processes such as issuing provider payments and tracking service utilization and expenditures are performed.
A well-designed and adequately resourced infrastructure is essential to the effective operation of a complex service delivery system. A weak infrastructure can lead to delays in how quickly people receive services as well as result in other system management problems. The use of Medicaid to finance services puts a premium on a state’s having a well-functioning infrastructure due to the scope of the federal requirements that must be met to secure federal financial participation in the costs of services.
In general, most states operate their developmental disabilities service systems through independent local/regional service coordination entities (i.e., entities that do not furnish direct services). These entities function as the single-point-of-entry (SPOE) into the developmental disabilities system and usually are responsible for ongoing case management and service coordination. SPOEs also authorize the delivery of services in accordance with state policies. SPOE responsibilities typically encompass the full range of developmental disabilities services, including Medicaid-financed services.
In some states (e.g., Arizona, Utah, Washington and Missouri), the state itself functions as the SPOE. Elsewhere (e.g., Wisconsin and Minnesota), county human services agencies serve as the SPOE. In still other states (e.g., California, Colorado and New Hampshire), non-profit agencies perform SPOE functions. Only a few states (e.g., Florida and New Mexico) separate gate keeping and certain other SPOE functions from support coordination. In these states, the state performs gate keeping and support coordination is performed by contracted entities.
The operation of a unified, comprehensive SPOE system is a critical ingredient in the effective management of developmental disabilities services. Such a system ensures the uniform application of state policies systemwide. SPOEs serve as an identifiable portal through which people can seek services. An SPOE-based system also can assure that individual service plans meet essential requirements and that individuals are aware of available services and supports. An independent comprehensive SPOE-based system architecture also is a key ingredient in promoting person-centered service delivery. An effectively functioning SPOE system also aids individuals and families in securing authorized services and should play a proactive role in monitoring the delivery of services. In many states, SPOEs also

Benchmark #5: Promoting Access to Services
Gap Analysis 22
play a critical role in arranging for services and interventions when individuals experience a crisis.
The operation of full-featured I/T systems also is vital to the effective functioning of a developmental disabilities service system. Such systems are absolutely essential in order to manage complex systems efficiently. I/T is critical in managing system financing. It also has emerged as a vital tool in analyzing service utilization, unifying quality assurance and management functions, and providing information to inform quality improvement initiatives. States that operate full-featured I/T systems command information that enables them to implement data-based/data-driven program improvements.
Illinois Status
Over the years, Illinois has developed a network of Pre-Admission Screening (PAS) agents/Independent Support Coordination (ISC) agencies. PAS/ISC agencies perform gate keeping and certain other support coordination functions. PAS/ISC agencies gate keep the entry of individuals into Medicaid-funded services. They also operate the PUNS system. With respect to the HCBS waiver program, these entities furnish “Individual Service and Support Advocacy” (ISSA) services. ISSA services include participation in the development of service plans, approval of individual service plans, advocacy on behalf of the participant and family, visiting individuals four times a year to monitor their health and welfare, and alerting DHS about issues that potentially require intervention. All waiver participants receive ISSA services. However, the amount of ISSA that may be furnished to a waiver participant is limited to 25 hours per year unless an exception is approved by DHS.
The PAS/ISC network performs some of the same functions that SPOEs in other states perform. However, the network does not constitute a full-featured, comprehensive SPOE system. In particular:
• In the case of people served in the HCBS waiver, case management/ service coordination responsibilities are split. With respect to waiver participants who receive CILA and day training services, provider agencies have lead responsibility with respect to service plan development and implementation. ISSA services provide some limited measure of external, independent oversight of the delivery of these services.
• For waiver-funded home-based services, individuals and families must select a “service facilitator” who is employed by a community-agency but not a PAS/ISC/ISSA agency. The service facilitator performs service coordination-type functions, including assisting the individual and the family in developing the service plan, assists the participant and guardian in choosing services and service providers, monitoring the day-to-day provision of services and ensuring participant health and welfare. The costs of service facilitation are charged against the individual’s home-based services budget.
• People who receive non-Medicaid funded services generally fall outside the orbit of PAS/ISC network. They may receive some assistance from the PAS/ISC network but are only assigned an independent service coordinator on an as needed basis.
• ICFs/DD and SODCs furnish case management to their residents. These individuals do not have case managers who are independent of the service provider agency.
As can be seen, the performance of SPOE/service coordination functions splinters by

Benchmark #5: Promoting Access to Services
Gap Analysis 23
In Illinois, service coordination is splintered along funding stream lines.
funding stream and is further fragmented within the HCBS waiver program. The PAS/ISC network has little real authority over the assignment of resources, principally because dollars are tied to provider agency contracts. While the PAS/ISC network serves as the portal to certain types of services, it is not a single portal arrangement. The limitation on the amount of ISSA services that may be furnished to waiver participants is especially problematic. A common complaint in Illinois is that individuals and families are not certain where they should go to obtain services.
For Illinois to operate a full-featured, comprehensive SPOE/service coordination system, the present system would need to be substantially altered. Principally, the alterations that would be necessary include:
• Establishing a true single portal system that spans all state-funded developmental disabilities services and
• Relocating lead service coordination responsibilities (e.g., service plan preparation and service authorization) to independent support coordinators. Unifying support coordination is absolutely necessary to ensure that service plans are person-centered and are developed under a uniform set of person-centered planning principles and guidelines. For sure, the present configuration of key functions in Illinois is at odds with the practices followed in most other states.
Illinois has limited I/T capabilities. Over the years, the state has developed systems to support the operation of the HCBS waiver program. DHS functions as a limited fiscal intermediary for processing HCBS waiver fee for service payments. However, present I/T systems do not span the full range of developmental disabilities services, a situation that in the past has impeded efforts to secure additional federal Medicaid dollars for grant-funded services. Present I/T systems do not have the capability to fully support quality management functions.
Conclusion
Illinois has a problematic infrastructure. Responsibility for mission-critical infrastructure elements is splintered. Service coordination functions that in other states are typically performed by independent entities are split between the PSA/ISC agencies and service providers. How Illinois might address components of its system infrastructure is discussed in the Blueprint.

[Page left intentionally blank for double-sided copying]

Gap Analysis 25
Benchmark #6: Service Quality and Oversight
Assessment: There is a serious lack of confidence in Illinois quality assurance and oversight processes.
Background
It is essential that a state operate effective quality assurance/quality management systems that ensure that people with developmental disabilities are safe and secure and the services that they receive meet essential standards. People with developmental disabilities are vulnerable to abuse, neglect, and exploitation. Consequently, it is important that their health and welfare be continuously monitored.
The shift of the delivery of services to the most integrated setting poses substantial challenges for the operation of effective quality assurance/quality management systems. In particular, the number of sites where services are being delivered has grown quite large. In 2006, nationwide people with developmental disabilities received residential services and supports at over 159,000 sites. In 1997, residential services were delivered at approximately 97,000 sites. Many of the sites where residential services are now furnished are not licensed residences. Consequently, states have had to develop alternative oversight methods for services that are furnished in regular community housing.
State quality assurance/quality management systems are undergoing considerable change. In part, this change is being propelled by the ongoing growth of community services and supports. States are devoting more resources to quality assurance/quality management to keep pace with the ongoing growth of service systems. Some states are coping with this growth by using sampling to gauge provider performance. Another important development is the heightened expectations that the federal Centers for Medicare & Medicaid Services is placing on states with respect to the operation of comprehensive HCBS waiver quality management systems. States are now required to develop and implement a comprehensive Quality Management Strategy (QMS) that spans a wide range of HCBS waiver operations, including assuring the health and welfare of waiver participants. States also are expected to compile evidence about the operation of the QMS, including the extent to which problems that are unearthed are appropriately remediated.
Best practice in quality assurance/quality management now includes the operation of data systems that are capable of pulling together information about the results of quality assurance processes to identify the extent to which problems are being discovered at the provider and system levels. Such data systems must have the capability to integrate quality information. For example, the results of routine monitoring of services should be linked to information gleaned from periodic provider agency quality reviews.
A well-trained, stable workforce is central to assuring the quality of services. When community agencies experience problems in recruiting and retaining direct support professionals, major problems are encountered in assuring quality. Many quality problems are directly traceable to workforce problems.

Benchmark #6: Service Quality and Oversight
Gap Analysis 26
Illinois Status
In Illinois, there is a wide-spread lack of confidence in the quality of services and the effectiveness of state quality management processes. Provider agencies express deep concerns about their ability to meet basic quality standards due to low state payments for services, which affect their ability to recruit and retain workers. Staff turnover rates in Illinois are quite high due to the low pay that providers can offer.
Independent observers in Illinois contend that quality problems are pervasive throughout the system. They express serious concerns about the extent of state oversight of services and follow-up to correct problems. For example, they observe that many of the same problems recur year after year.
In some quarters, the quality of community services is regarded as especially problematic. Services that are provided in the SODCs and ICFs/DD are regarded as more dependable because both types of facilities are subject to survey employing federal standards. For example, the standards that apply to ICF/DD services are portrayed as more stringent than those that apply to CILA living arrangements. At the same time, major problems have arisen with respect to the quality of the care that is furnished in some of the SODCs.
With respect to community services, an important ingredient in assuring the quality of services is the monitoring that is performed by service coordinators. In most states, the monitoring that is performed by service coordinators serves as the primary method for overseeing the quality of services, including identifying emerging problems. In Illinois, this type of external monitoring is not routinely performed on behalf of people who receive state-funded services. In the case of HCBS waiver participants, the ISSAs conduct relatively limited monitoring of services. As previously noted, ISSA services are limited to 25 hours per year per participant. This limitation obviously constricts the ability of ISSAs to conduct any more than the minimum number of visits specified by their contracts with the state.
DHS/DDD has very limited capacity to pull together information about the quality of community services and apply such information to quality improvement strategies.
Finally, Illinois has not implemented strategies to effectively enlist people with developmental disabilities, families, service providers and other stakeholders in its quality assurance/quality management processes. Bringing stakeholders into the processes is important. People with disabilities and families can offer important insights about the quality of services.
Conclusion
The widespread lack of confidence in the quality of services in Illinois is especially revealing. For example, some people with developmental disabilities do not believe that the system should be expanded until current shortcomings are addressed. In the Blueprint, we will outline action steps that Illinois can take to improve its quality assurance/quality management systems.

Gap Analysis 27
Benchmark #7: Economy and Efficiency
Assessment: Illinois’ financial level of effort in supporting services for people with developmental disabilities is subpar. The present system overemphasizes the use of costly service models.
Background
There is no doubt that appropriately supporting people with developmental disabilities requires a substantial financial commitment on the part of a state. Developmental disabilities are life-long. People with developmental disabilities have significant functional impairments and many require day-by-day services and supports. Developmental disabilities services are among the most-costly long-term services. Therefore, it is important that a state employ effective financial management strategies and practices that promote economy and efficiency in the delivery of services.
There is significant variance among the states with respect to their level of financial effort in supporting services for people with developmental disabilities. State fiscal capacity varies due to underlying economic and other differences. However, all other things being equal, states where there is a relatively low level of financial effort in support of developmental disabilities services usually have large waiting lists for services. Service providers struggle to survive in the face of low payment rates that, in turn, result in major problems in meeting basic quality standards and in workforce stability.
Effective financial management of developmental disabilities services is complex and multi-faceted. Key facets include:
• Managing the Application of Federal Medicaid Financing. To the extent that a state can qualify services for federal Medicaid financing, it can stretch its own dollars to serve more people with developmental disabilities. In developmental disabilities services, Medicaid is the principal source of federal financial assistance to states to finance services. In general, maximizing federal Medicaid dollars is a practical necessity in all states. Medicaid financing can play a major role in underwriting the expansion of system capacity to meet service demand. However, Medicaid is a complex program that operates under federal parameters. It presents to states alternative pathways for securing federal dollars to pay for services. As a consequence, there are major differences among the states in their coverages of Medicaid services.
• Promoting Economical Service Delivery. It is in a state’s best interest to channel service demand into lower cost, more economical service delivery alternatives. Some models of developmental disabilities service delivery are extremely costly due to regulatory and other requirements. For example, in 2005, the average nationwide cost of serving an individual in a public or private Intermediate Care Facility for the Mentally Retarded (ICF/MR) was $117,600. In contrast, the average cost of supporting a person through the Medicaid HCBS waiver program was $39,627. In an environment of limited budgets, reliance on high cost service models obviously will shorten a state’s ability to meet current and future service demand.

Benchmark #7: Economy and Efficiency
Gap Analysis 28
• Purchase of service. Government is the principal purchaser of developmental disabilities services. Consequently, state purchase of service policies and practices have major market place ramifications. The rates that a state pays for services affect the viability, quality and availability of services. For example, if state payments for personal assistance services are based on below market wage rates, then individuals and families will experience major difficulties in locating workers who are willing to provide supports. To the extent that state payments are not based on a realistic appraisal of legitimate provider costs, quality will suffer and there will be an insufficient supply of providers to support individuals.
How a state addresses these facets of financial management of developmental disabilities services has major consequences for the state’s ability to support its citizens with developmental disabilities.
Among the states, there have been several noteworthy trends and developments in the financial management of developmental disabilities services. With respect to Medicaid financing of developmental disabilities services, the trend for more than 20 years has been for states to concentrate on expanding HCBS waiver programs for people with developmental disabilities while concurrently reducing the utilization of more costly ICF/MR services.
Chart 1 shows the number of people served in ICFs/MR and through HCBS waivers for people with developmental disabilities. As can be seen, ICF/MR utilization has been declining since 1994. A substantial proportion of the reduction in ICF/MR utilization is the result of the ongoing downsizing and closure of very large state-operated institutions. However, about 40 percent of the reduction in ICF/MR utilization stems from a decline in the number of persons served in non-state ICF/MR services. In contrast, the number of persons served in HCBS waiver programs has grown substantially. In 2006, 81.7 percent of the 538,000 persons with developmental disabilities nationwide who received Medicaid-funded long-term services were served through HCBS waiver programs. As previously noted, the de-emphasis by states of ICF/MR services in favor of employing the HCBS waiver program is due in significant part to the very high costs of ICF/MR services and the relatively lower costs of waiver HCBS.
Between 2000 and 2006, states increased the overall number of people receiving Medicaid-funded long-term services by a little over one-third. In most states, this expansion was fueled by more aggressive leveraging of community developmental disabilities services to capture increased federal Medicaid dollars. Leveraging helped states weather the downturn in state revenues and, in some cases, expand services to additional individuals. The HCBS waiver program now is the principal source of
Persons with Developmental Disabilities Receiving Medicaid Long-Term Services
(Chart 1)
0
50,000
100,000
150,000
200,000
250,000
300,000
350,000
400,000
450,000
500,000
1994 2000 20060.0%
10.0%
20.0%
30.0%
40.0%
50.0%
60.0%
70.0%
80.0%
90.0%
ICF/MR HCBS % HCBS

Benchmark #7: Economy and Efficiency
Gap Analysis 29
States are launching supports waivers to channel demand away from very costly 24/7 residential services.
federal financial assistance to states to underwrite the costs of specialized developmental disabilities services. On an expenditure basis, in 2006 federal-state spending for HCBS accounted for 59.5 percent of the $30.8 billion in Medicaid spending nationwide for specialized developmental disabilities long-term services.
Another important development is the de-emphasis by states of the delivery of 24/7 “comprehensive” residential services in favor of expanding supports services that complement rather than substitute for family caregiver and other supports that are available for individuals. Comprehensive residential services are very costly to deliver, whether in an ICF/MR or another type of community residence. Faced with rapidly rising demand for developmental disabilities services, most states simply cannot afford to respond by scaling up comprehensive services. Instead, many states have launched what are termed “supports waivers” that operate under fixed dollar cost limits and pay for services that complement family care giving.
For example, confronted by a lengthy waiting list, Oregon has implemented a Medicaid HCBS supports waiver that provides a foundation benefit package to eligible individuals and families. Individuals and families can exercise considerable decision-making authority over waiver funds in selecting the services and supports that will best meet their needs. The supports waiver has enabled Oregon to channel demand away from high cost comprehensive services. As a result, Oregon has been able to reduce its overall per person HCBS waiver costs from $39,000 in 2002 to $37,746 in 2006 and expand the number of people receiving services by 35 percent. Oregon expects to eliminate its community waiting list by 2009 through the further expansion of its supports waiver. There are sixteen other states that have designed and implemented similar types of supports waivers for people with developmental disabilities.
Another important development has been the emergence of new approaches to purchasing services. Several states have implemented or are designing relatively sophisticated rate systems. These systems are designed to ensure that payments for services match up with underlying service delivery requirements along with provider agency costs in securing labor and other inputs in the market place. For example, Arizona has implemented a rate system that takes into account market wages, difficulty of care, geographic and other factors that affect provider costs. States also are changing over their purchase of service systems to implement umbrella service authorization limits that are based on the usual and customary costs of serving people with developmental disabilities who have similar support needs and life circumstances. For example, Connecticut has designed a system that establishes cost limits based on statistically significant factors that affect the overall costs of supporting individuals. States are moving toward greater standardization of payment rates based on market factors and assessed consumer needs. Such standardization both promotes efficiency and encourages the entry of new providers into the market place.
Illinois Status
Financial Level of Effort
In comparison to the nation and other states, Illinois funding for developmental disabilities services is subpar. There are two ways to measure a state’s overall level of financial effort in supporting its citizens with developmental disabilities:

Benchmark #7: Economy and Efficiency
Gap Analysis 30
• Fiscal Effort. This method appraises a state’s level of financial effort by measuring its overall spending for developmental disabilities services relative to state personal income. This method takes into account underlying differences in the relative strength of state economies and therefore a state’s capacity to fund developmental disabilities services. All other things being equal, the higher a state’s personal income, the greater a state’s capability to fund developmental disabilities services. By this measure, in 2004 Illinois ranked 38th among the states with respect to its overall level of fiscal effort. By way of comparison, Indiana ranked 24th, Minnesota 4th, Pennsylvania 16th and Wisconsin 15th. In 2004, Illinois fiscal effort was 19 percent below the nationwide average (compared to 15 percent below the nationwide average in 2002). Considering only community services, Illinois ranked 43rd among the states. Even though Illinois is a relatively wealthy state, it devotes a relatively low share of its personal income to developmental disabilities services.
• Expenditures Per Citizen. Another way to measure a state’s level of financial effort is its expenditures per citizen – that is, total developmental disabilities expenditures divided by the state’s population. Chart 2 compares Illinois expenditures per citizen to the nation and the selected other states. In 2004, Illinois spent $111.63 per citizen for developmental disabilities services. The nationwide average ($131.29 per citizen) was 17.6 percent higher. Illinois 2004 spending for developmental disabilities services would have had to have been $250 million higher in 2004 to match the nationwide average. As also can be seen, nearly all the other selected states exhibited a stronger level of financial effort than Illinois.
Measured in either fashion, Illinois’ level of financial effort for developmental disabilities services has been subpar. The state’s relatively low level of financial effort has important ramifications. It explains in part why Illinois is unable to respond to the needs of individuals with critical and emergency unmet needs. The low level of financial effort also evidences itself in the state’s low payment rates for services and low community worker wages.
Utilization of Medicaid Financing
In the past, Illinois did not make maximum use of Medicaid financing to underwrite the costs of developmental disabilities services. One reason for this situation was that securing additional federal Medicaid dollars did not directly translate into expanded services for people with developmental disabilities. In Illinois, federal funds flow into the general fund rather than directly augmenting state
Developmental Disabilities Spending Per Citizen (2004)Chart 2
$0.00
$50.00
$100.00
$150.00
$200.00
$250.00
$300.00
IL US GA IN IA KY MI MN MO NJ NC OH PA WI

Benchmark #7: Economy and Efficiency
Gap Analysis 31
2006 Medicaid DD Expenditures Per Citizen (Chart 4)
$0.00
$20.00
$40.00
$60.00
$80.00
$100.00
$120.00
Illinois USHCBS ICF/MR
appropriations for services. More recently, as a result of the “Gettings Report,”3 DHS has taken steps to capture additional federal Medicaid dollars, principally by shifting the funding of day training and other grant funded services to the HCBS waiver program. In the main, however, these additional federal Medicaid dollars were used to sustain current service levels rather than expand services.
With respect to Medicaid financing of developmental disabilities services, Illinois is noteworthy in two respects:
• A larger proportion of individuals in Illinois who receive Medicaid long-term services are served in ICFs/MR (SODCs and ICFs/DD) than is typical nationwide or in most states. In 2006, 56.9 percent of individuals were supported through the HCBS waiver in Illinois versus 82.9 percent nationwide. As can be seen from Chart 3, all the other selected states served a higher proportion of individuals through the HCBS waiver program than Illinois. The steps taken by DHS to capture additional federal Medicaid dollars has resulted in the proportion of people participating in the Illinois HCBS waiver program increasing. However, this proportion is still well below the nationwide norm.
• The second major difference is that Illinois expends a greater proportion of its Medicaid dollars on ICF/MR services than the nation as a whole or most other states. In 2006, 61.5 percent of the $1 billion in Illinois Medicaid spending for people with developmental disabilities underwrote ICF/MR (SODC and ICF/DD) services. In 2006, nationwide 59.5 percent of Medicaid spending for people with developmental disabilities paid for home and community-based waiver services.
Illinois Medicaid spending for developmental disabilities services lags the nation, as shown by Chart 4. In 2006, Illinois Medicaid spending per citizen for developmental disabilities services was 15.7 percent below the nationwide average.
Illinois also lags the nation and most other selected states in the number of persons who receive Medicaid developmental disabilities services. Chart 5 on the following page shows the number of individuals who received Medicaid ICF/MR or HCB waiver services per 100,000 persons in the
Gettings, R. M., Cooper, R. & Chmura, M. (2003). Financing Services to Individuals with Developmental Disabilities in the State of Illinois. Alexandria, Virginia: National Association of Directors of Developmental Disabilities Services, Inc.
3
% of Medicaid Beneficiaries Receiving HCBS - 2006(Chart 3)
0.0%
10.0%
20.0%
30.0%
40.0%
50.0%
60.0%
70.0%
80.0%
90.0%
100.0%
IL US GA IN IA KY MI MN MO NJ NC OH PA WI

Benchmark #7: Economy and Efficiency
Gap Analysis 32
population during 2006. Illinois furnished Medicaid developmental disabilities
services at a rate that was 12.0 percent below the nationwide average. As also can be seen from the chart, several other states (e.g., IN, IA, MN, PA and WI) furnished Medicaid developmental disabilities services at an appreciably higher rate, relative to state population, than Illinois.
While Illinois has improved its performance in securing federal Medicaid dollars for developmental disabilities, the state lags the nation and most of the other selected states in the proportion of dollars expended on waiver services, how much is spent on Medicaid developmental disabilities services, and the number of individuals who receive such services. Illinois is unusual for the high proportion of Medicaid dollars that are used to underwrite ICF/MR (SODC and ICF/DD) services.
Service Costs
Illinois concentrates its funding for developmental disabilities services on higher cost services furnished in large congregate care facilities. Chart 6 shows 2006 yearly per person costs for various types of services in Illinois. This chart is based on figures provided by DHS. As can be seen, the direct cost of serving a person in a SODC was about twice the cost of supporting a person in an ICF/DD. The overall total cost of supporting a person in a SODC was somewhat higher than indicated on the chart (per diem costs for SODCs are higher than the amount shown because other costs are nested within other state budget cost centers). Per person expenditures for CILA services are nominally lower than ICF/DD costs. Home-based services are the least costly. However, only a small proportion of individuals received home-based services. While CILA per person costs are appreciably lower than ICF/DD costs, they are much closer when the per person day program cost is added to the CILA cost. In addition, ICF/DD costs are
2006 Per Person Expenditures(chart 6)
$0
$20,000
$40,000
$60,000
$80,000
$100,000
$120,000
SODC ICF/DD CILA Home-Based
Persons Receiving Medicaid ServicesPer 100,000 Population in 2006 (Chart 5)
0.0
50.0
100.0
150.0
200.0
250.0
300.0
350.0
400.0
450.0
500.0
IL US GA IN IA KY MN MO NJ NC OH PA WI
2006 Per Person Expenditures (Chart 6)

Benchmark #7: Economy and Efficiency
Gap Analysis 33
2006 Per Person Medicaid Costs(Chart 7)
$0
$20,000
$40,000
$60,000
$80,000
$100,000
$120,000
$140,000
ICF/DD HCBS Weighted
Illinois US
inflated somewhat by the provider tax that is applied to ICFs/DD but not CILAs. As a consequence, when all costs are taken into account, there is little difference between ICF/DD and CILA costs. Similarly, people who receive home-based services also receive additional services over and above the funds directly allotted for home-based services.
In considering these comparisons it should be noted that there may be differences in the service needs of people served across these options. People living in SODCs, for instance, may have more significant needs – on average –than people served in the CILA option. These service options, however, are not configured to serve people strictly according to their level of need. As a result, some people receiving home based services, for example, may have needs on par with others living in ICF/DDs or SODCs.
Illinois SODC per person expenditures are about average when compared to other states. However, ICF/DD per person costs are generally lower than the costs of such services in other states. In 2004, per person ICF/DD costs were about 27 percent lower in Illinois than the nationwide average for comparable facilities.
Chart 7 compares Illinois 2006 per person costs to the national average for ICF/MR (in Illinois, SODC and ICF/DD) and HCBS waiver per person costs. It shows an average cost per person of both types of Medicaid-funded services but factors in the numbers served in each service category. As shown, Illinois ICF/MR costs were appreciably below the nationwide average. HCBS waiver per person expenditures also were about 19 percent lower than the nationwide average. Weighted average per person expenditures were about 9 percent below the nationwide average. However, had Illinois served a higher proportion of Medicaid beneficiaries through the HCBS waiver program, its weighted average per person costs would have fallen even lower when compared to the nationwide average. What drives up Illinois’ weighted per person cost presently is its high reliance on SODCs and ICF/DDs.
Over the near-term, Illinois service costs will change in two ways. The 2006-2007 downsizing of the SODCs will result in higher per person costs at these facilities. Fewer people will be served at the SODCs but this census reduction is not accompanied by a reduction in SODC budgets because the aim of the downsizing is to step up staffing intensity. On other hand, HCBS waiver per person costs are dropping. This drop is the product of increasing the number of people served in the HCBS waiver as the result of the refinancing of low cost non-residential day training services. In 2006, HCBS waiver per person costs dropped to $30,582, a level well below the nationwide average of $39,818 per person.
Broadly, the situation in Illinois is as follows:
• SODC total outlays are holding steady even as the number of people served at the facilities is declining. To the extent that Illinois continues on this course, this means that the SODCs will claim an increasingly disproportionate share of

Benchmark #7: Economy and Efficiency
Gap Analysis 34
Low payments for services leave Illinois with a weakened service delivery platform.
available resources relative to the proportion of individuals that the SODCs serve out of the total number of persons who receive services in Illinois. SODC expenditures per person will continue to track upward.
• Due to the Illinois relatively low payments for ICF/DD services, the impact of placing greater emphasis on supporting people in the most integrated setting would generally be budget neutral on a per person basis. Reducing the number of people served in large and very large ICFs/DD will not yield budget savings.
• Home-based services in Illinois have proven to be the most economical to deliver on a cost per person basis. However, the proportion of people receiving home-based services is relatively low. Home-based services are akin to the types of services that other states are emphasizing through the operation of supports waivers. This suggests that the expansion of home-based services offers some promise in Illinois of improving the overall economy and efficiency of developmental disabilities service delivery.
Payment Policies
The low per person costs of services in Illinois are not so much indicative of economy and efficiency in service delivery as they are the byproduct of problematic payment policies. There is broad agreement in Illinois that the rates that are paid for developmental disabilities services are insufficient to ensure the delivery of high quality, effective supports for individuals.
These enduring low rates in Illinois are a major source of tension within the service delivery system. Funding for an annual cost-of-living-adjustment (COLA) often directly competes with expanding services to support additional individuals. In some years, the COLA has been skipped, resulting in provider agencies being squeezed between rising costs on one hand and flat state payments on the other. The outcomes of this squeeze are low worker wages, workforce problems and upsizing program sites.
Major studies of Illinois payments and rates have been conducted in recent years. For example, the “Powers Report” (Powers, E. T., Powers, N. J. & Merriman, D. (2006): State funding of community agencies for services provided to Illinois residents with mental illnesses and/or developmental disabilities. Final report to the Illinois General Assembly requesters pursuant to Public Act 93-842. Chicago, Illinois) found major shortcomings in state payments for community developmental disabilities services.
Illinois’ low payment rates are a serious problem. Their effect is to leave Illinois with a weakened developmental disabilities service delivery platform. Providers are unable to secure a reliable, high quality workforce. Absent improved payments, the capacity to expand services to reach people with unmet needs is shortened.
Contributing to this problem is that Illinois generally does not have payment rate determination systems that employ well-defined cost models that in turn are informed by solid information about provider and market costs. As a consequence, payments are adrift. Illinois has not established explicit benchmarks for provider reimbursement for the services that the state is purchasing on behalf of people with developmental disabilities.

Benchmark #7: Economy and Efficiency
Gap Analysis 35
Conclusion
Illinois funding for developmental disabilities services is subpar. The state’s level of financial effort is below the nationwide norm. In recent years, Illinois has stepped up its performance in securing Medicaid funding for developmental disabilities services. Unfortunately, these increased revenues have not been translated into an expansion of services. Illinois continues to devote a greater share of its Medicaid dollars to large congregate care services than is typical nationwide and only recently has ramped up its use of the HCBS waiver program. Even though there are long-standing and well-known problems in state payments for developmental disabilities services, there presently are no actions underway to reformulate payments to ensure that they are adequate.
In the Blueprint, we will discuss effective financial management strategies and practices that Illinois might employ to promote economy and efficiency in the delivery of its services.