Embed Size (px)
Citation preview

Illinois Morbidity and Mortality Bulletin August 2017 Vol. 3, Issue 1 Page 1
Analysis of Substances Involved in Opioid Overdose Deaths in Illinois, 2013-2016 Opioid overdoses have increased substantially in recent years in Illinois and across the United States. Recent analysis of death records in Illinois has shown that overdose deaths involving synthetic opioids have increased more than any other category of opioids. However, the specific substances involved in those deaths had not been analyzed prior to this review. For this article, the literal text section on all opioid overdose death records of Illinois residents from 2013 to 2016 was examined for the substances contributing to the …….. read more
Age at Death and Compression of Mortality: Multi-method Analysis of Modality Trends in Illinois, 1990-2010 The concept of compression of mortality describes a process in which improvement of life expectancy leads to a concentration of at-death ages on a narrower range. Compression of mortality may mean a healthier and safer population, as in such situation premature death decreases while natural death increases. This paper assessed the occurrence of compression of mortality in Illinois, analyzing the 1990-2010 population and death data, using the C-family and Ordinary Least Squares Regression methods. The study…. read more
Message from Director Shah
Welcome to the fifth issue of the Illinois Morbidity and Mortality Bulletin (IMMB), an IDPH publication created to present topics of interest to public health communities and professionals in Illinois through scientific analysis and interpretation of data.
In this issue, Heidi Clark and John Tharp use data from Illinois death records to examine the specific substances involved in opioid overdose deaths.
In the second article, Nelson Agbodo and Jesse Nuss assess the occurrence of compression of mortality in Illinois by analyzing the 1990-2010 population and death data using the C-family and Ordinary Least SquaresRegression methods.
We also encourage contributions from public health professionals at the state and local levels, as well as those in hospitals and academic institutions. Please send your manuscripts to the bulletin's editor, Tiefu Shen, M.D., Ph.D. at [email protected] (217.785.1873)
Nirav D. Shah, M.D., J.D. Director Illinois Department of Public Health
In this issue
Analysis of Substances Involved in Opioid Overdose Deaths in Illinois, 2013-2016 Page 2
Age at Death and Compression of Mortality: Multi-method Analysis ofModality Trends in Illinois, 1990-2 010. Page 7
Illinois Morbidity and Mortality Bulletin August 2017 Vol. 3, Issue 1 Page 2
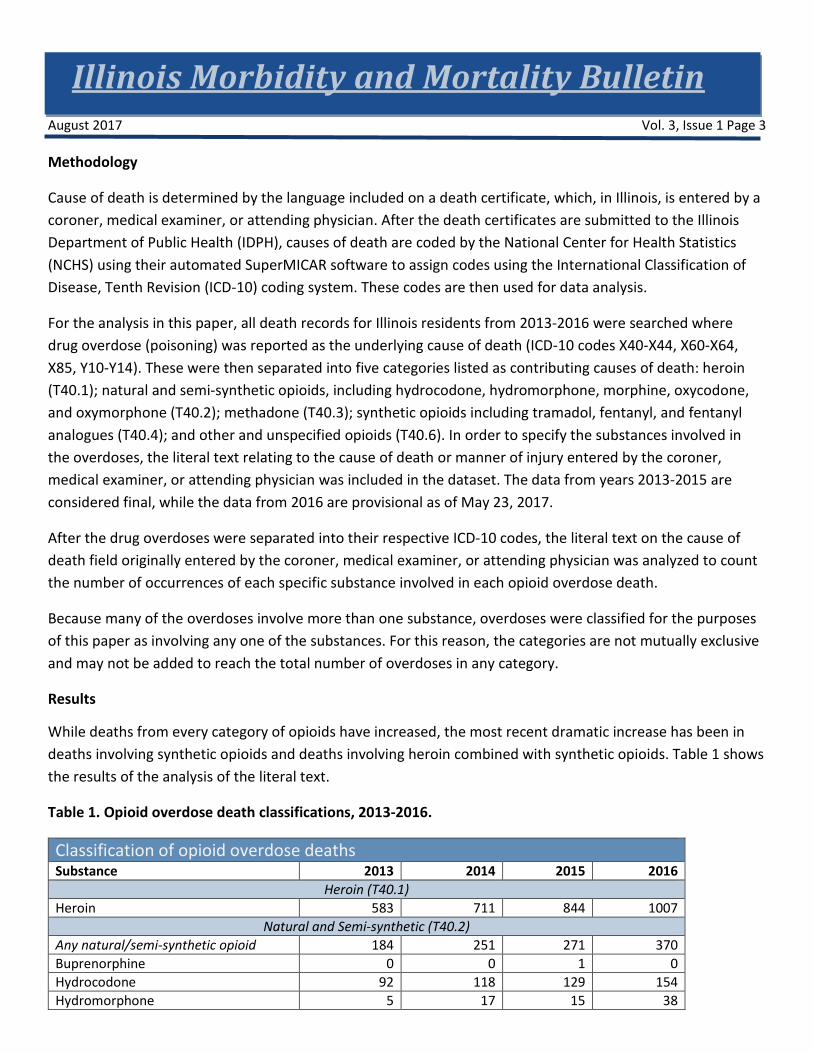
Analysis of Substances Involved in Opioid Overdose Deaths in Illinois, 2013-2016
Heidi Clark, MPH1 John Tharp, MPH2
Abstract
Opioid overdoses have increased substantially in recent years in Illinois and across the United States. Recent analysis of death records in Illinois has shown that overdose deaths involving synthetic opioids have increased more than any other category of opioids. However, the specific substances involved in those deaths had not been analyzed prior to this review. For this article, the literal text section on all opioid overdose death records of Illinois residents from 2013 to 2016 was examined for the substances contributing to the overdoses. The most striking result was the large increase in the number of deaths involving fentanyl and its analogues, which led to the 910% increase in synthetic opioid overdose deaths between 2013 and 2016. This provides public health professionals, law enforcement, and health care providers a more complete understanding of the opioid epidemic facing the State of Illinois.
Introduction
In the past five years, fatal overdoses involving opioids have increased dramatically in Illinois, mirroring the trend seen in the rest of the United States. Nationally, the number of deaths due to opioid overdose quadrupled from 1999 to 2015 (RA Rudd, 2016).
Illinois was one of 19 states that experienced a statistically significant increase in drug overdoses from 2014 to 2015, fueled mainly by the increase in opioid overdoses (RA Rudd, 2016). In 2016, Illinois experienced 1,889 opioid overdose deaths, an increase of 76% from 2013.
Monitoring the overdoses has given all stakeholders, including professionals in health care, public health, and law enforcement, an idea of how to plan interventions and implement best practices to reduce the burden of opioid misuse on the state. Historically, this monitoring involved calculating two categories: heroin overdose deaths and deaths involving non-heroin opioids, referred to as “prescription drug overdoses.” However, the use of the term “prescription” implied that these drugs were manufactured by pharmaceutical companies and were either misused by the person who was prescribed the opioid or that they were diverted to a person who lacked a legitimate prescription. However, recent trends have suggested that many of the non-heroin opioids are imported or manufactured illegally (Gladden RM, 2016), making it necessary to change the terminology in reporting. This paper seeks to improve the understanding of the current status of the opioid epidemic in the State of Illinois, including the specific drugs involved in opioid overdoses.
Illinois Morbidity and Mortality Bulletin August 2017 Vol. 3, Issue 1 Page 3
Methodology
Cause of death is determined by the language included on a death certificate, which, in Illinois, is entered by a coroner, medical examiner, or attending physician. After the death certificates are submitted to the Illinois Department of Public Health (IDPH), causes of death are coded by the National Center for Health Statistics (NCHS) using their automated SuperMICAR software to assign codes using the International Classification of Disease, Tenth Revision (ICD-10) coding system. These codes are then used for data analysis.
For the analysis in this paper, all death records for Illinois residents from 2013-2016 were searched where drug overdose (poisoning) was reported as the underlying cause of death (ICD-10 codes X40-X44, X60-X64, X85, Y10-Y14). These were then separated into five categories listed as contributing causes of death: heroin (T40.1); natural and semi-synthetic opioids, including hydrocodone, hydromorphone, morphine, oxycodone, and oxymorphone (T40.2); methadone (T40.3); synthetic opioids including tramadol, fentanyl, and fentanyl analogues (T40.4); and other and unspecified opioids (T40.6). In order to specify the substances involved in the overdoses, the literal text relating to the cause of death or manner of injury entered by the coroner, medical examiner, or attending physician was included in the dataset. The data from years 2013-2015 are considered final, while the data from 2016 are provisional as of May 23, 2017.
After the drug overdoses were separated into their respective ICD-10 codes, the literal text on the cause of death field originally entered by the coroner, medical examiner, or attending physician was analyzed to count the number of occurrences of each specific substance involved in each opioid overdose death.
Because many of the overdoses involve more than one substance, overdoses were classified for the purposes of this paper as involving any one of the substances. For this reason, the categories are not mutually exclusive and may not be added to reach the total number of overdoses in any category.
Results
While deaths from every category of opioids have increased, the most recent dramatic increase has been in deaths involving synthetic opioids and deaths involving heroin combined with synthetic opioids. Table 1 shows the results of the analysis of the literal text.
Table 1. Opioid overdose death classifications, 2013-2016.
Classification of opioid overdose deaths Substance 2013 2014 2015 2016
Heroin (T40.1) Heroin 583 711 844 1007
Natural and Semi-synthetic (T40.2) Any natural/semi-synthetic opioid 184 251 271 370 Buprenorphine 0 0 1 0 Hydrocodone 92 118 129 154 Hydromorphone 5 17 15 38

Illinois Morbidity and Mortality Bulletin August 2017 Vol. 3, Issue 1 Page 4
Classification of opioid overdose deaths Substance 2013 2014 2015 2016 Morphine 54 74 84 104 Oxycodone 29 49 51 65 Oxymorphone 5 10 8 18
Methadone (T40.3) Methadone 92 106 99 121
Synthetic (T40.4) Any synthetic opioid 87 127 279 879 3-Methyl Fentanyl 0 0 0 1 4-ANPP 0 0 0 219 Acetyl Fentanyl 0 0 10 35 Acrylfentanyl 0 0 0 6 Carfentanil 0 0 0 3 Fentanyl 58 92 234 606 Furanyl Fentanyl 0 0 0 188 Norfentanyl 0 0 0 8 Tramadol 24 29 31 56 U-47700 0 0 0 8
In 2015 and 2016, there was a clear increase in overdose involving multiple opioids. Deaths involving heroin increased steadily from 583 in 2013 to 1007 in 2016, while the deaths involving heroin combined with synthetic opioids increased from 3 in 2013 to 371 in 2016. Interestingly, deaths involving heroin alone (i.e. heroin not mixed with another opioid) increased from 2013-2015 and decreased in 2016. Table 2 shows the number of heroin deaths mixed with different classes of opioids.
Table 2. Heroin deaths
2013 2014 2015 2016 Heroin involved (total) 583 711 844 1007 Heroin alone (not mixed with any other opioids) 564 665 709 588
Heroin combined with Natural/Semi-Synthetic Opioid 13 18 35 53 Heroin combined with Methadone 6 13 16 34 Heroin combined with Synthetic Opioid 3 20 92 371
Discussion
This analysis showed a large increase in all opioid overdoses in the past five years. However, the most striking increase was among those involving synthetic opioids, and in particular those involving fentanyl. Additionally, some synthetic opioids were involved in large numbers of opioid overdose deaths in recent years but were unseen in previous years. For example, 4-ANPP (also known as 4-Aminophenyl-1-phenethylpiperidine, 4-

Illinois Morbidity and Mortality Bulletin August 2017 Vol. 3, Issue 1 Page 5
Anilino-N-phenethylpiperdine, or despropionyl fentanyl) was involved in 219 overdose deaths in 2016, and none in previous years. Furanyl fentanyl also was involved in 188 deaths in 2016 but none in 2015 or earlier.
Because complete national data relating to specific drugs involved in overdoses are only available through the year 2014 (Warner, 2016), it is difficult to compare the current landscape in Illinois with the rest of the country. The years 2013 and 2014 in Illinois and in the rest of the country both showed increases in the percentage of drug overdoses involving fentanyl out of all fatal drug overdoses. In 2013, 3.67 percent of Illinois drug overdoses involved fentanyl. In the same year, 4.3 percent of the national total of drug overdoses involved fentanyl. In 2014, 5.41 percent of Illinois drug overdoses involved fentanyl, while 8.9 percent of those nationally did as well. In 2015, 12.75 percent of drug overdoses involved fentanyl in Illinois, which rose to 25.8 percent in 2016. National numbers are not yet available for 2015 or 2016.
The increase in total heroin deaths combined with the decrease in non-mixed heroin demonstrates the likelihood that more and more of the heroin supply is heroin combined with other opioids. While overdose deaths involving heroin mixed with natural/semi-synthetic, methadone, and synthetic opioids all increased each year from 2013-2016, the most dramatic rise is from 2015 to 2016, especially with synthetic opioids.
Surveillance Challenges
The majority of counties in Illinois utilize elected coroners to perform death investigations rather than medical examiners. The only exception to this rule is the Cook County Medical Examiner’s Office. The literal text on the death certificates is not standardized, leading to difficulties classifying any particular death as involving specific substances. One coroner may classify a death as “morphine (likely heroin),” which would result in NCHS’s SuperMICAR software classifying the death as both a morphine death and a heroin death. Another coroner, using the same toxicology results, may classify the same death as heroin. A third coroner may classify the death as a morphine death. Because heroin quickly metabolizes into 6-Monoacetylmorphine, also known as 6-MAM, and then into morphine, coroners may exercise discretion and consider drug paraphernalia and history of drug use when deciding what to list as the substance on the death certificate.
Additionally, toxicology testing varies by jurisdiction and even when full toxicology panels are performed, some coroners may not include the specific substances involved in the overdose on the death certificate. Toxicology testing can be expensive and in counties that lack available funds, it is possible that their decision whether to do specific toxicology tests may be affected by finances.
The receipt of detailed death records by IDPH necessarily takes time; while deaths are required to be reported promptly, death investigations and toxicology tests may take months. Even when a coroner may be able to determine that an overdose death involves an opioid early in the investigation, the death certificate may not be finalized for four months or more.
These death statistics are created for Illinois residents and may not capture nonresidents fatally overdosing in Illinois. However, these data do capture Illinois residents who travel out-of-state and die of overdoses. This

Illinois Morbidity and Mortality Bulletin August 2017 Vol. 3, Issue 1 Page 6
decision was made for two reasons: first, rates may be calculated using the Illinois population. Second, the county-level data can give a picture of where the opioid problem manifests across the state instead of showing simply where people overdose and die. Both have their merits, but for the purposes of this article, we chose residence data.
Because of the strength of synthetic opioids relative to heroin, the increase in opioid-related deaths may not be attributed completely to an increase in substance users. It is possible that due to the strength of the drugs, more people overdose on the synthetic drugs than heroin or natural and semi-synthetic opioids. In order to learn the exact cause of this increase, it will be necessary to examine datasets from a variety of sources: hospital discharge data for nonfatal opioid overdoses, drug seizure data from law enforcement to determine which drugs are seized during arrests, and any other data that may shed light on the trafficking, use, and overdose related to opioids.
Author Affiliation
1 Illinois Department of Public Health, Office of Policy, Planning & Statistics, Division of Health Data and Policy. [email protected], 217-782-0667.
2 Illinois Department of Public Health, Office of Policy, Planning & Statistics, Division of Health Data and Policy. [email protected], 217-524-0797.
References
Gladden RM, Martinez P, and Seth P. Fentanyl Law Enforcement Submissions and Increases in Synthetic Opioid–Involved Overdose Deaths — 27 States, 2013–2014. MMWR Morbidity and Mortality Weekly Report. 2016;65(33):837-843.
Warner M, Trinidad JP, Bastian BA, Minino AM, and Hedegaard H. Drugs Most Frequently Involved in Drug Overdose Deaths: United States, 2010-2014. National Vital Statistics Reports. 2016 December 20;65(10):1-15. Hyattsville, MD.: National Center for Health Statistics. 2016.
Rudd RA, Seth P, David F, Scholl L. Increases in Drug and Opioid-Involved Overdose Deaths - United States, 2010-2015. MMWR Morbidity and Mortality Weekly Report. 2016;65(5051):1445-1452.
Illinois Morbidity and Mortality Bulletin August 2017 Vol. 3, Issue 1 Page 7
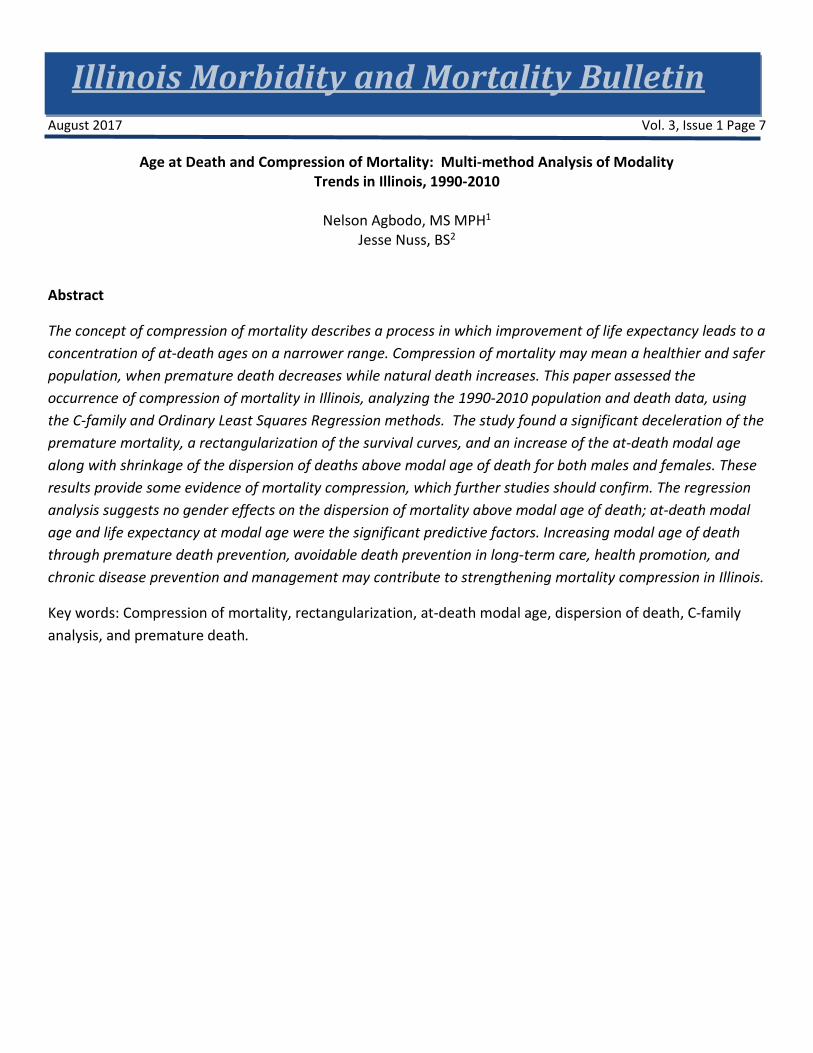
Age at Death and Compression of Mortality: Multi-method Analysis of Modality Trends in Illinois, 1990-2010
Nelson Agbodo, MS MPH1
Jesse Nuss, BS2
Abstract
The concept of compression of mortality describes a process in which improvement of life expectancy leads to a concentration of at-death ages on a narrower range. Compression of mortality may mean a healthier and safer population, when premature death decreases while natural death increases. This paper assessed the occurrence of compression of mortality in Illinois, analyzing the 1990-2010 population and death data, using the C-family and Ordinary Least Squares Regression methods. The study found a significant deceleration of the premature mortality, a rectangularization of the survival curves, and an increase of the at-death modal age along with shrinkage of the dispersion of deaths above modal age of death for both males and females. These results provide some evidence of mortality compression, which further studies should confirm. The regression analysis suggests no gender effects on the dispersion of mortality above modal age of death; at-death modal age and life expectancy at modal age were the significant predictive factors. Increasing modal age of death through premature death prevention, avoidable death prevention in long-term care, health promotion, and chronic disease prevention and management may contribute to strengthening mortality compression in Illinois.
Key words: Compression of mortality, rectangularization, at-death modal age, dispersion of death, C-family analysis, and premature death.
Illinois Morbidity and Mortality Bulletin August 2017 Vol. 3, Issue 1 Page 8
Introduction
Studying mortality trends to evaluate the occurrence of premature deaths and elderly death provides important information about the general well-being of the population and the capacity of heath care systems to improve the quality of life and to prolong life. Besides life expectancy—which provides the average years of life an individual can expect to live—the concept of compression of mortality has been used to measure extension of life, especially for the elderly population. Mortality is “being compressed when a given proportion of deaths take place in a shorter age interval than before” (Kannisto, 2000, p. 1), i.e., ages at death concentrate on a narrower range (Yue, 2014). As mortality is being compressed, premature death decreases while natural death increase to a maximum. With the variance of the age of death decreases, a more “rectangular” survival curve with a steeper slope near the age of death occurs, resulting in rectangularization. Rectangularization implies a maximal reduction in premature deaths due to important improvement in quality of life near the modal age of death (Fries, 1980; Kannisto, 2000).
Research efforts seeking evidence for both compression of mortality and rectangularization have reached mixed conclusions. Some researchers have not found evidence to confirm mortality compression (Li, Hardy & Tan, 2008; Yue, 2012 & 2014) while others have been able to detect such phenomena in some cohorts (Brown et al., 2012; Cheung et al., 2005; Cheung and Robine 2007; Eakin & Witten, 1995; Nusselder & Mackenbach, 1996; Go et al., 1995; Paccaud et al., 1998). Mortality compression studies have been rare—perhaps due to methodological and data availability issues. Further, few studies examined the gender differences in compression of mortality (Lynch & Brown, 2001).
This paper focuses on the specific case of the state of Illinois to analyze premature death, detect any sign of compression of mortality, and evaluate gender differences in mortality compression. In Illinois, life expectancy has significantly improved for both males and females from 1990 to 2010 (Shahidullah & Agbodo, 2015). Over this period, males’ life expectancy at birth increased from 71.37 years to 76.64 years and that of females increased from 78.37 years to 81.64 years (Shahidullah & Agbodo, 2015). These statistics show that years gained was higher for males (5.27 years) than females (3.22 years). Over the same period, the rates of mortality have declined. Our study includes trend analysis of life-table-derived standardized mortality and measures of mortality compression over 1990-2010 time periods, using the C-family indicators (Kannisto, 2000) and Ordinary Least Squares (OLS) Regression methods.
Theoretical Backgrounds and Survey of Methodologies
The Compression of mortality concept is well understood in the purview of James Fries’ (1980) compression of morbidity theory, even though the concept did not come from Fries but traced back to the work of Raymond Pearl in 1923 (Myers and Manton, 1984). Fries (1980) observed that “most illness was chronic and occurred in later life” and postulated that “the lifetime burden of illness could be reduced if the onset of chronic illness could be postponed and if this postponement could be greater than increases in life expectancy.” Postponement of disease to later life could also mean postponement of death to later life. Compressions of morbidity and mortality are therefore closely associated. Postponement of death increases life expectancy but
Illinois Morbidity and Mortality Bulletin August 2017 Vol. 3, Issue 1 Page 9 to an unknown upper limit (Eakin and Witten 1995; Cheung and Robine 2007), as no absolute limit to human life has yet been proven.
Studying mortality compression has been a complex endeavor with mixed results due to a lack of a systematic or consensual methodology. In early research, while Fries and other researchers relied essentially on visual analysis (Wilmoth & Horiuchi, 1999), other researchers developed more mathematical approaches. For instance, Lexis used the mode in the age-at-death distribution as “an expression of the natural life span” and suggested that small values of the at-death modal age—further left on the Gaussian curve—represent premature deaths ascribable to “abnormal conditions or external influence” (Lexis, 1877 as cited in Kannisto, 2000). So higher values of the modal age at death—further right on the Gaussian curve—reflect natural death conditions. The mode, therefore, becomes the best unique indicator of life length when perfect rectangularization occurs; any years of life lived beyond the mode is the counterpart of compression of mortality.
More recent methods (Eakin & Witten 1995; Kannisto, 2000; Lynch & Brown, 2001; Myers & Manton, 1984; Nusselder & Mackenbach, 1996) include measurement of standard deviation of the age-at-death above the mode, standard deviation of the at-death age in the highest quartile, the inter-quartile range, the shorted age interval of deaths (or C-family method) (Kannisto, 2000), and regression models. For instance Myers and Manton (1984) analyzed change in the standard deviation of the age-at-death distribution. Nusselder and Mackenbach (1996) used the standard deviation (the dispersion of the years lived above the mode), coefficient of variance of the mean age at death, and a measure of mortality entropy called the “Keyfitz H” to evaluate the rectangularization of the survival curve for males and females in the Netherlands. Lynch and Brown (2001) used a regression method modeling mortality rates as an arctangent function of age and year to assess mortality compression differences between U.S. white males and females over the period 1968-1992. Their model suggested that mortality deceleration occurred around age 93 in 1968 and above age 95 in 1992; among women the deceleration occurred at older age right under age 96 in 1968 and at age 96.65 in 1992. However, the observed gap closed over time. They concluded that mortality did not compress, instead it may have decompressed. Yue (2014) applied optimization methods (nonlinear maximization (NM)) to data from the Human Mortality Database (HMD) to estimate the standard deviation of age-at-death distribution. He concluded that “there is not enough evidence to conclude if there is mortality compression based on the proposed NM method.” Kannisto (2000) studies some of the abovementioned methods of evaluating mortality compression and recommended the C50 of the C-family (shortest age interval of deaths) method out of all indicators measuring compression of mortality. C50 is the narrowest age interval of the 50 percent of all deaths that occurred around the at-death-modal age. His study found that the C50 indicator is more stable, age-neutral, and sensitive to mortality compression. The modal age at death is used as a focus in mortality research, and dispersion is often measured with the standard deviation of life lived above the mode.
In summary, the reviewed compression-of-mortality studies shows that the modal age and above-mode data hold important information for evaluating mortality compression in a population; compression of mortality seems to be associated with an increase in life expectancy and a decrease in mortality rate in the younger
Illinois Morbidity and Mortality Bulletin August 2017 Vol. 3, Issue 1 Page 10 population, at a pace higher than the increase of life expectancy (Lynch & Brown, 2001). Further, previous studies reached mixed results; some studies found compression occurring (e.g., Nusselder & Mackenbach, 1996; Wilmoth, 1997) whereas others found no compression (e.g., Myers & Manton, 1984; Yue, 2014) or decompression (e.g., Lynch & Brown, 2001; Rothenberg et al., 1991).
Methods and Data
Methods
Several methods were used in the present study. We first explored the mortality trends and the survival curves, using a graphical method, and then analyzed the above-mode death data to evaluate the potential for compression of mortality and its gender differences in Illinois. The graphical analysis helps visualize the trend of premature death, the movement of the modal death, and the rectangularization of the survival curve. We used the Kannisto’s (2000) C-family in analyzing the death data around the at-death modal age and calculated the C50, C25, and C10 for the census years 1990, 2000, and 2010 to describe the shorted age of death and infer the possible compression of mortality. C-family analysis involved finding the modal age of death for each year from 1990-2010 from the standard death data. Mortality data immediately before and after the mode were taken and sorted in descending order. For instance, as the C50 represents the year interval in which 50% of all deaths occurred around the at-death modal age, it’s computed by cumulating the ordered standard deaths around the modal age; when reaching the first number higher than 50,000 deaths, we take the number of years corresponding to that number and subtract the portion of years corresponding to the excess of deaths to the 50,000 deaths limit. The result is the shortest interval of years in which 50% of deaths occurred.
We further our analysis using the OLS regression method to test the gender differences about the observed mortality trend. For these analyses, we hypothesize mortality compression to be a movement of the at-death modal age toward higher values on the normal curve and shrinkage of the dispersion (standard deviation) of deaths that occur beyond the at-death modal age; we test the effect of gender on the variation of the standard deviation of death above modal age. This hypothesis is best tested using life table data (Kannisto, 2000). We, therefore, computed and used a single-year life table for this analysis. Infant and childhood mortality were excluded from the analysis as compression of mortality exclusively concerns later life (Kannisto, 2000).
Data
Data were collected from the U.S. Census Bureau website and IDPH. Full population data were procured from the U.S. Census Bureau website for years 1990, 2000, and 2010. Intercensal estimates for single age years with the final age being 85+ were taken from the same source. A forward-backward extrapolation method was used to estimate the ages from 85 to 100+ for these intercensal estimates. In this method the proportions of ages 85-100+ from the census year before and after each year were taken and applied to the 85+ estimate for each intercensal year. An average of the population estimates with the previous census proportions applied and those with the succeeding census proportions applied were taken as a rough estimate of the populations
Illinois Morbidity and Mortality Bulletin August 2017 Vol. 3, Issue 1 Page 11 aged 85+ for intercensal years. The death data were obtained from the Illinois Department of Public Health’s Vital Records System (IVRS). Death data were total deaths for single age for each year from 1989 to 2011. The data were used to compute single-year life tables up to 100-years old. The measures of the dependent variable were derived from the life tables to remove population-size effect and allow for annual trend comparisons.
Study Variables
The dependent variable relates to mortality, particularly the distribution of death beyond the at-death modal age. This variable is measured by standard deaths, derived from the life tables. As previous studies (e.g., Shahidullah & Agbodo, 2015) found that life expectancy has been increasing in Illinois from 1990 to 2010, we expect to see a decrease in premature death, a rectangularization of the survival curve, and a deceleration of the dispersion or the velocity of deaths above the at-death modal age. We measure this dispersion with the standard deviation of death above modal age (SD_AbM).
The independent variables include At-Death-Modal Age (Mo_Age), Gender, and Age Life Expectancy. Mo_Age is the age at which most of the deaths occurred. This variable was derived using the standardized deaths from the life tables. We should expect an upward movement of the Mo_Age with a reductive effect on the dispersion of deaths after modal age. At-Modal-Age Life Expectancy is life expectancy calculated from the Mo_Age. This variable should have varying trends as no absolute limit to human life has yet been proven. For practical purposes we limit life to 100 years so we could compute life tables and observe decreasing life expectancy at the modal age with a reductive effect on the dispersion of deaths after modal age.
In the regression models, where SD_AbM is the dependent variable, we expect to observe a higher effect in the female gender, as compared to male gender, on the decreasing trend of the SD_AbM. We control for the effects of possible confounding variables, such as Year (coded as period 1, 2, 3, …n), At-Death-Modal Age (Mo-Age), and the At-Death-Modal-Age Life Expectancy (Mo_LE), on the relationship between the dependent and independent variables. We used the hierarchical regression techniques to monitor the effect of each variable through three models:
- Model 1: SD_AbM = a0 + a1Gender - Model 2: SD_AbM = a0 + a1Gender + a2Mo_Age - Model 3 : SD_AbM =a0 + a1Gender + a2Mo_Age + a3Mo_LE
All statistical differences were accepted at the 95% confidence level (p-value less than 0.05).
Illinois Morbidity and Mortality Bulletin August 2017 Vol. 3, Issue 1 Page 12 Results
Mortality Trends
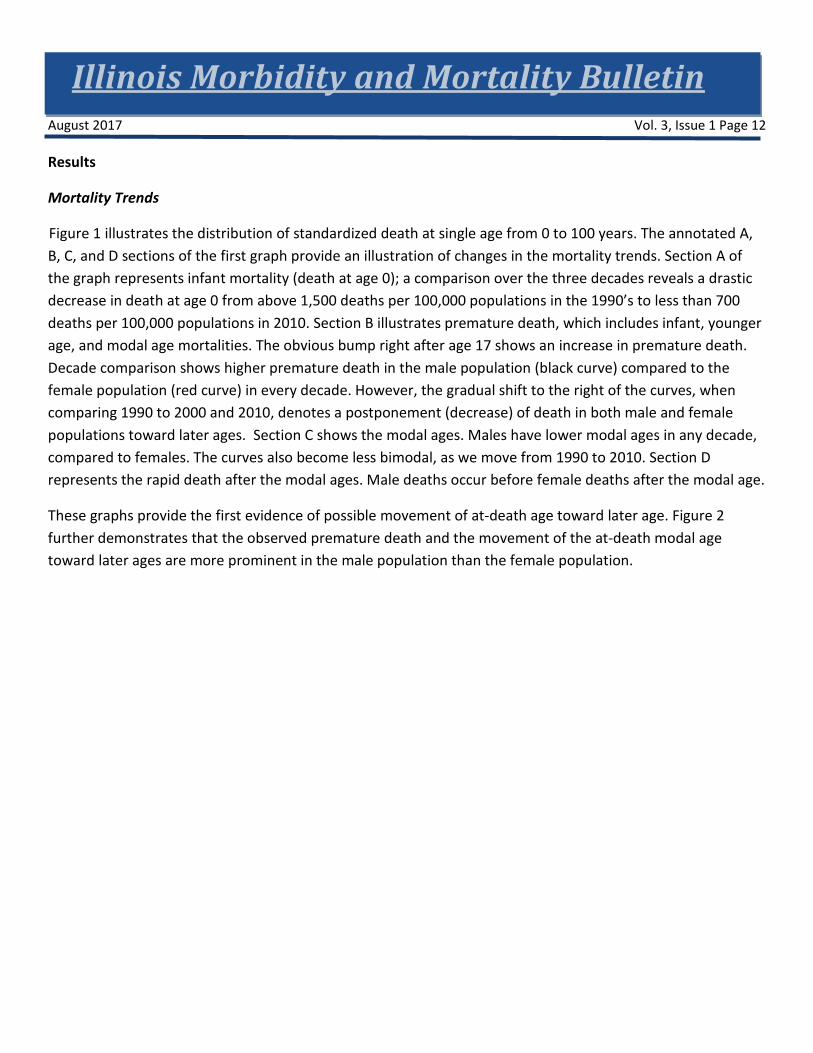
Figure 1 illustrates the distribution of standardized death at single age from 0 to 100 years. The annotated A, B, C, and D sections of the first graph provide an illustration of changes in the mortality trends. Section A of the graph represents infant mortality (death at age 0); a comparison over the three decades reveals a drastic decrease in death at age 0 from above 1,500 deaths per 100,000 populations in the 1990’s to less than 700 deaths per 100,000 populations in 2010. Section B illustrates premature death, which includes infant, younger age, and modal age mortalities. The obvious bump right after age 17 shows an increase in premature death. Decade comparison shows higher premature death in the male population (black curve) compared to the female population (red curve) in every decade. However, the gradual shift to the right of the curves, when comparing 1990 to 2000 and 2010, denotes a postponement (decrease) of death in both male and female populations toward later ages. Section C shows the modal ages. Males have lower modal ages in any decade, compared to females. The curves also become less bimodal, as we move from 1990 to 2010. Section D represents the rapid death after the modal ages. Male deaths occur before female deaths after the modal age.
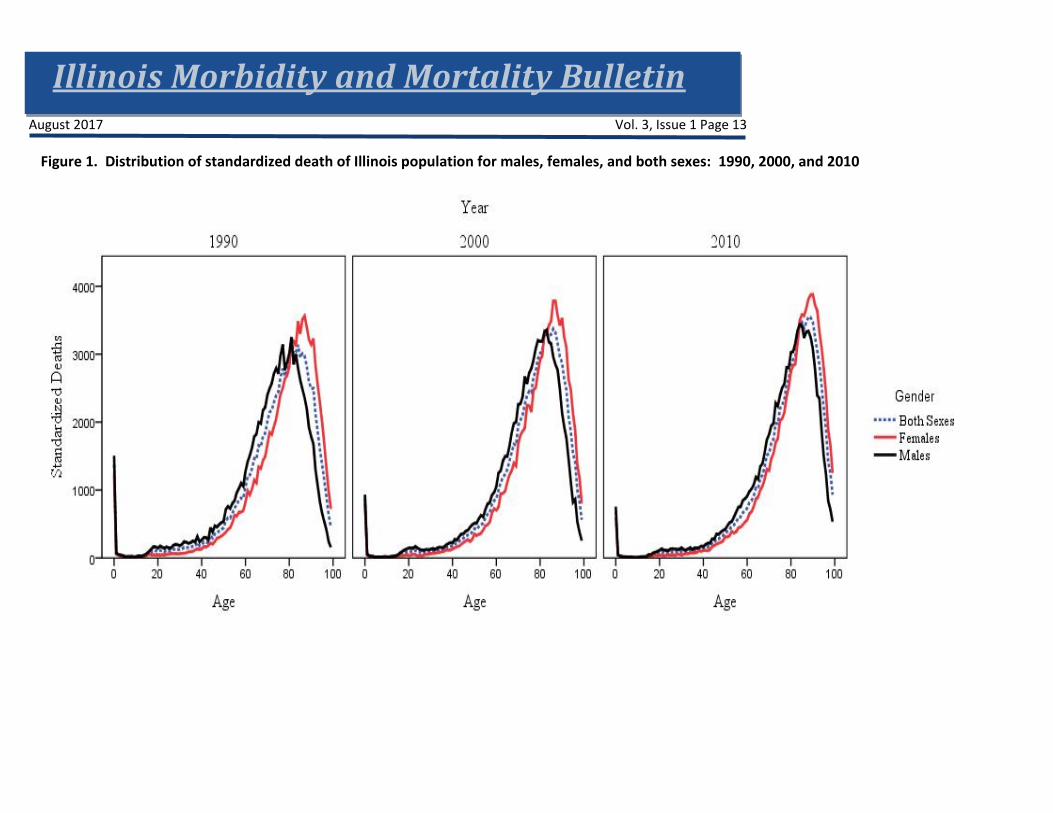
These graphs provide the first evidence of possible movement of at-death age toward later age. Figure 2 further demonstrates that the observed premature death and the movement of the at-death modal age toward later ages are more prominent in the male population than the female population.
Illinois Morbidity and Mortality Bulletin August 2017 Vol. 3, Issue 1 Page 13
Figure 1. Distribution of standardized death of Illinois population for males, females, and both sexes: 1990, 2000, and 2010
Illinois Morbidity and Mortality Bulletin August 2017 Vol. 3, Issue 1 Page 14
Figure 2. Distribution of standardized death of Illinois population for males, females, and both sexes: 1990, 2000, and 2010
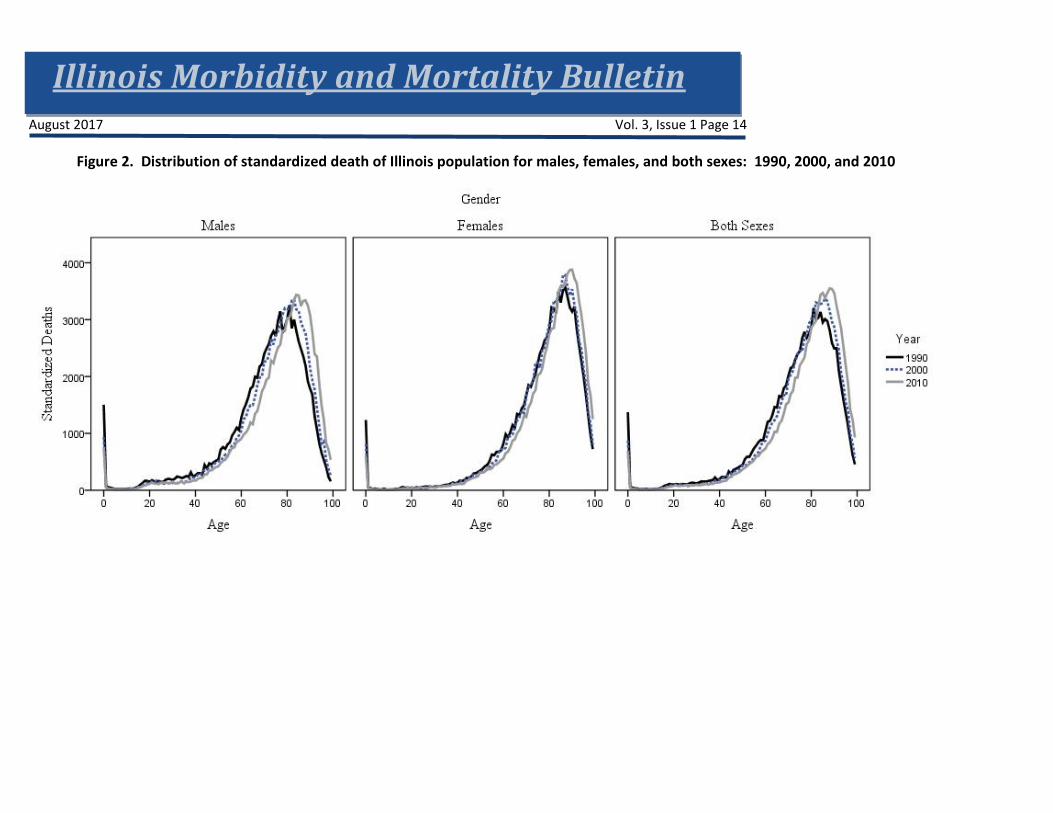
Illinois Morbidity and Mortality Bulletin August 2017 Vol. 3, Issue 1 Page 15 Figure 3 provides a close look at premature death in the Illinois population. The line graphs depict a decrease in premature death from 1989 to 2011 for both males and females and in the general population. Even though a drastic decrease is observed from 1994 for the male population, premature death remains higher among this population at all times, compared to the female population.
Figure 3. Percentage of deaths before age 50 in total deaths by year and gender
Figure 4 provides the change in modal age at death overtime for each gender and the general population. We
observe that the at-death modal age increases for both males and females; however, the increase is larger for
males, compared to females. We tested the mean differences between the time-periods 1990-2000 and 2001-
2010, using the Mann-Whitney test, and found that although the female population shows no statistically
significant difference between the two time periods’ mean at-death modal age (p = 0.822), at-mode life
expectancy (p = 0.526), and above-mode standard deviation death (p = 0.438), the males were significant on
all three variables (p ≤ 0.001). This caused the general population (both sexes) to also be significant on all
three variables, with Mo_Age (p=0.002), Mo_LE (p=0.009), and SDM+ (p=0.002). This analysis hints to possible
statistically significant differences between males and females, which will be investigated further in our
regression models.
0.000
2.000
4.000
6.000
8.000
10.000
12.000
14.000
16.000
18.000
20.000
1989 1991 1993 1995 1997 1999 2001 2003 2005 2007 2009 2011Perc
enta
ge o
f Dea
ths B
efor
e A
ge 5
0 in
tota
l dea
ths
Year
Males Total Females

Illinois Morbidity and Mortality Bulletin August 2017 Vol. 3, Issue 1 Page 16
Figure 4. At-death modal age by gender, 1990-2010
Rectangularization of the Survival Curves
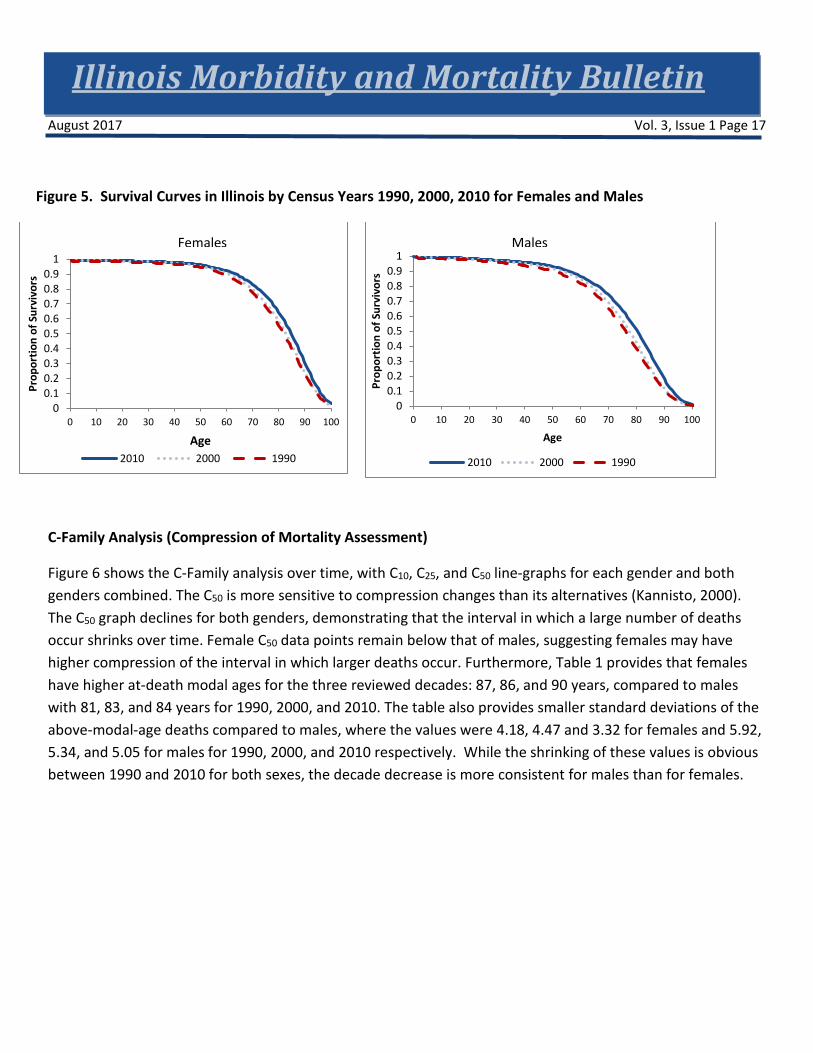
Rectangularization indicates that the shape of the survival curve is very close to a rectangle and almost all people die at around a specific age. Figure 5 illustrates that comparing the 1990 curve to the 2010 curve, the advancement in the rectangular shaping of the curves is obvious with the shift of the line graph to the right and its abrupt descending trend from the age of 80 years. This abrupt downward trend seems to be more pronounced in the case of females, suggesting a more advanced rectangularization.
Illinois Morbidity and Mortality Bulletin August 2017 Vol. 3, Issue 1 Page 17
Figure 5. Survival Curves in Illinois by Census Years 1990, 2000, 2010 for Females and Males
C-Family Analysis (Compression of Mortality Assessment)
Figure 6 shows the C-Family analysis over time, with C10, C25, and C50 line-graphs for each gender and both genders combined. The C50 is more sensitive to compression changes than its alternatives (Kannisto, 2000). The C50 graph declines for both genders, demonstrating that the interval in which a large number of deaths occur shrinks over time. Female C50 data points remain below that of males, suggesting females may have higher compression of the interval in which larger deaths occur. Furthermore, Table 1 provides that females have higher at-death modal ages for the three reviewed decades: 87, 86, and 90 years, compared to males with 81, 83, and 84 years for 1990, 2000, and 2010. The table also provides smaller standard deviations of the above-modal-age deaths compared to males, where the values were 4.18, 4.47 and 3.32 for females and 5.92, 5.34, and 5.05 for males for 1990, 2000, and 2010 respectively. While the shrinking of these values is obvious between 1990 and 2010 for both sexes, the decade decrease is more consistent for males than for females.
00.10.20.30.40.50.60.70.80.9
1
0 10 20 30 40 50 60 70 80 90 100
Prop
ortio
n of
Sur
vivo
rs
Age2010 2000 1990
00.10.20.30.40.50.60.70.80.9
1
0 10 20 30 40 50 60 70 80 90 100
Prop
ortio
n of
Sur
vivo
rs
Age
2010 2000 1990
Females Males

Illinois Morbidity and Mortality Bulletin August 2017 Vol. 3, Issue 1 Page 18 Figure 6. C50, C25, and C10 trends: 1990 - 2010
Table 1. Descriptive Statistics and C50
Year LE Mo_Age SD (M+) C50
Both M F Both M F Both M F Both M F
1990 7.85 6.58 5.79 81 81 87 5.92 5.92 4.18 17.88 18.07 16.04
2000 5.79 6.10 6.11 86 83 86 4.47 5.34 4.47 16.66 16.83 15.30
2010 5.46 6.42 4.95 88 84 90 3.89 5.05 3.32 15.75 16.36 14.44
Both = Both Sexes, M = Male, and F = Females, LE = Life Expectancy, Mo_Age = at-death Modal Age, and SD (M+) = Standard Deviation of death above at-death modal age
The graphical and C-family analyses suggest a decrease of the premature death in the general population, which is more prominent in the male population, a rectangularization of the survival curve, more pronounced for the female population, and an increase of the at-death modal age along with a shrinkage of the above-mode standard deviation of deaths, which are more evident for the female population. This shift of the mortality curve to later ages has produced an outward shift of the survival curves. We find that this pattern
0
2
4
6
8
10
12
14
16
18
20
1990 1992 1994 1996 1998 2000 2002 2004 2006 2008 2010
Cx
Valu
es
Year
C25
C10
Both Sexes
Male
Female C50
Illinois Morbidity and Mortality Bulletin August 2017 Vol. 3, Issue 1 Page 19 holds for both males and females. In all cases, the curve becomes visibly more rectangular as more individuals avoid premature death and die in a shorter year range in old ages.
The C50 analysis supports well these results with the reduction in the variability of the age of death through lower standard deviations. In the survival curves for men and women, the area under the curve is obviously larger over time, equating to an increase in longevity overall. In Kannisto’s (2000) purview, these results provide some evidence for compression of mortality, which may be higher for females than males. The next step in our analysis consisted of evaluating the gender effect on the hypothetical compression of mortality in Illinois.
Effects of Gender on Mortality Compression
Standard deviation of death above modal age (SD_AbM) is negatively correlated with the at-death modal age (r=-0.988, p<0.0001), positively correlated with the at-modal age life expectancy (r=0.979, p<0.0001), and negatively correlated with Year (r=-0.248, p=0.114). However, the correlation between SD_AbM with Year is not statistically significant. These correlation results indicate possible influence of the modal age of death and at-mode life expectancy on the relationships between gender and the dependent variables. We control for such influences in our regression models.
We run three regression models to evaluate the effect of gender on the shortening of the age interval in which people die after the at-death modal age (our definition of compression of mortality). Table 2 provides the results for all 3 models. In model 1, gender seems to explain 72% of the variation of the standard deviation of adjusted mortality above the at-death modal age (the dependent variable). Being a female seems to reduce the standard deviation by 1.143 additional points compared to being a male. This differential between male and female is statistically significant (p<0.0001) and corroborates the C50 analysis previously conducted which showed higher compression for females than males.
Model 2 adds the Life Expectancy At-Death Modal Age variable to the previous model and explains 98% of the variability of the standard deviation. However, controlling for the life expectancy reduces the effect of gender on the mortality compression: the effect of being female decreases to 0.315 (p<0.0001) additional points of reduction in the standard deviation. One point increase in life expectancy increases the standard deviation by 0.574 points.
The final model, Model 3, adds a third variable, the At-death Modal Age, which improves the explanation of the variability of the standard deviation to 99%. Controlling for the modal age inhibits the seeming effect of gender on mortality compression: the effect of being female nears zero with a value of 0.074 (p=0.174) additional points of reduction in the standard deviation. The p-value of 0.174 indicates that this differential between male and female is not significantly different from zero. Life expectancy and modal age remain the significant factors that explain the variability of the standard deviation. A one year increase in life expectancy increases the standard deviation (or decompressing mortality) by 0.311points (p<0.000) whereas a 1 year increase in modal age reduces the standard deviation (or compressing mortality) by 0.1 points (p<0.0001).
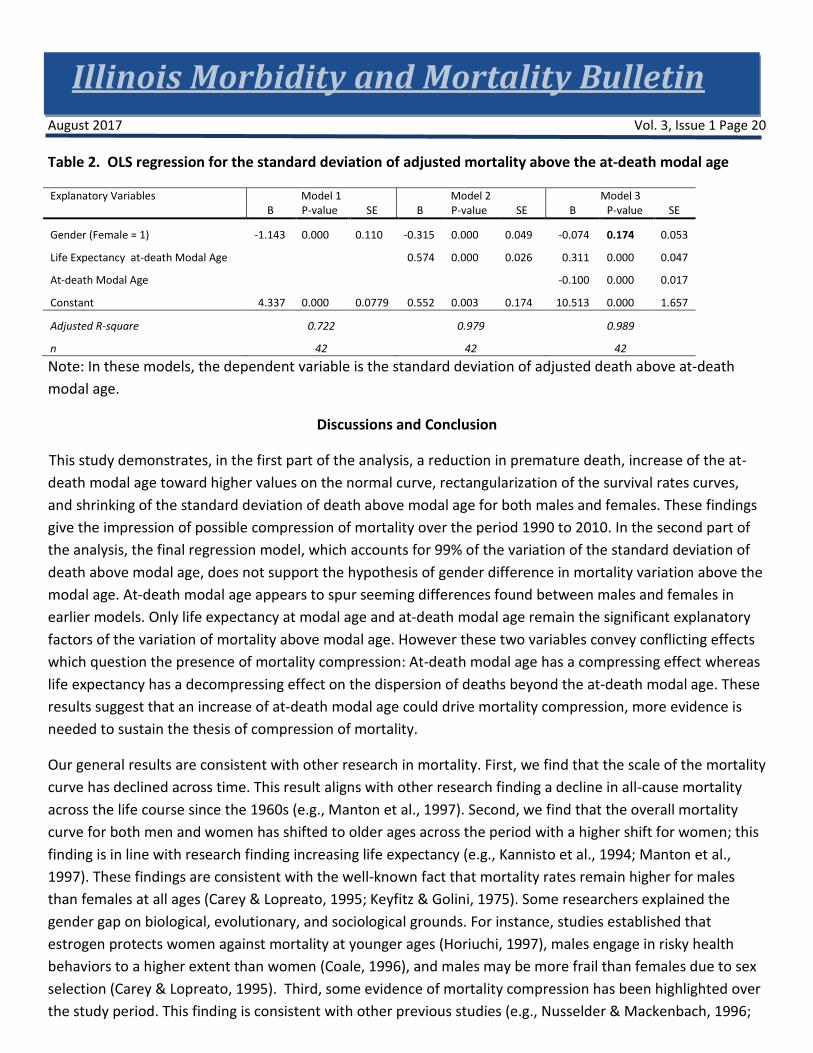
Illinois Morbidity and Mortality Bulletin August 2017 Vol. 3, Issue 1 Page 20 Table 2. OLS regression for the standard deviation of adjusted mortality above the at-death modal age
Explanatory Variables Model 1 Model 2 Model 3 B P-value SE B P-value SE B P-value SE
Gender (Female = 1) -1.143 0.000 0.110 -0.315 0.000 0.049 -0.074 0.174 0.053
Life Expectancy at-death Modal Age 0.574 0.000 0.026 0.311 0.000 0.047
At-death Modal Age -0.100 0.000 0.017
Constant 4.337 0.000 0.0779 0.552 0.003 0.174 10.513 0.000 1.657
Adjusted R-square 0.722 0.979 0.989
n 42 42 42
Note: In these models, the dependent variable is the standard deviation of adjusted death above at-death modal age.
Discussions and Conclusion
This study demonstrates, in the first part of the analysis, a reduction in premature death, increase of the at-death modal age toward higher values on the normal curve, rectangularization of the survival rates curves, and shrinking of the standard deviation of death above modal age for both males and females. These findings give the impression of possible compression of mortality over the period 1990 to 2010. In the second part of the analysis, the final regression model, which accounts for 99% of the variation of the standard deviation of death above modal age, does not support the hypothesis of gender difference in mortality variation above the modal age. At-death modal age appears to spur seeming differences found between males and females in earlier models. Only life expectancy at modal age and at-death modal age remain the significant explanatory factors of the variation of mortality above modal age. However these two variables convey conflicting effects which question the presence of mortality compression: At-death modal age has a compressing effect whereas life expectancy has a decompressing effect on the dispersion of deaths beyond the at-death modal age. These results suggest that an increase of at-death modal age could drive mortality compression, more evidence is needed to sustain the thesis of compression of mortality.
Our general results are consistent with other research in mortality. First, we find that the scale of the mortality curve has declined across time. This result aligns with other research finding a decline in all-cause mortality across the life course since the 1960s (e.g., Manton et al., 1997). Second, we find that the overall mortality curve for both men and women has shifted to older ages across the period with a higher shift for women; this finding is in line with research finding increasing life expectancy (e.g., Kannisto et al., 1994; Manton et al., 1997). These findings are consistent with the well-known fact that mortality rates remain higher for males than females at all ages (Carey & Lopreato, 1995; Keyfitz & Golini, 1975). Some researchers explained the gender gap on biological, evolutionary, and sociological grounds. For instance, studies established that estrogen protects women against mortality at younger ages (Horiuchi, 1997), males engage in risky health behaviors to a higher extent than women (Coale, 1996), and males may be more frail than females due to sex selection (Carey & Lopreato, 1995). Third, some evidence of mortality compression has been highlighted over the study period. This finding is consistent with other previous studies (e.g., Nusselder & Mackenbach, 1996;
Illinois Morbidity and Mortality Bulletin August 2017 Vol. 3, Issue 1 Page 21 Wilmoth, 1997; Kannisto, 2000) that concluded compression of mortality in different populations. Fourth, our study found no evidence for gender influence on the dispersion of mortality above modal age. Our result is similar to Lynch and Brown’s (2001) findings who also used a regression method to reach the conclusion of non-significance of gender difference in mortality compression. They explained that mortality deceleration occurred at higher pace for women compared to men; however, the observed gap closed over time.
The conclusion of this study suggests that the increase of the at-death modal age must be the goal to reinforce compression of mortality in Illinois. Use of health policy in New Zealand to achieve such a goal is a good example for this purpose. The New Zealand health policy targeted premature mortality prevention focused on multi-level interventions, policy improving primary level prevention and diagnosis, and secondary and tertiary referral systems (Pool, 2009). Fries also suggested primary, secondary, and tertiary prevention, the latter of which would target populations whose development or progression of chronic conditions can be delayed or treated. Tertiary interventions could be expensive, experiencing diminishing returns, but any interventions that reduce “premature” morbidity and mortality, reduce accidental death, improve interventions for healthy living with regard to diet and physical activity, treat and manage chronic conditions (Fries, 2006), prevent avoidable elderly death through quality long-term care can contribute to increase the modal age of death and enable mortality compression in Illinois. Decompression of mortality has significant implications for long-term care. This finding implies that there is room for improving the ages at which most of the elderly population dies. In long-term care, this improvement can be done through careful redesign of levels of care, improvement of the quality and safety of care, and extension of care to the populations in most need.
This study has some important limitations. The fact that we limited the survival age to 100 years may have influenced the level and direction of the predictive power of the life expectancy at modal age in the variation of the standard deviation of deaths. Compression or decompression of mortality may depend critically on the age range and time frame of the analysis (Myers & Manton, 1984). For instance, the statistical fact that Illinois has been losing population in recent years may influence the results of this study in some way if we include the after-2010 period in our analysis. Also, there is no scientific evidence that a process of mortality compression or decompression will continue indefinitely, and, as such, we may not extend our findings beyond the studied timeframe. Future studies are needed to investigate the conflicting role of life expectancy and the at-death modal age in assessing mortality compression.

Illinois Morbidity and Mortality Bulletin August 2017 Vol. 3, Issue 1 Page 22 Author Affiliations
1 Illinois Department of Public Health, Office of Policy, Planning and Statistics, Illinois Health Facilities and Services Review Board. [email protected], 217-782-3985
2 Illinois Department of Public Health, Office of Policy, Planning and Statistics, Illinois Health Facilities and Services Review Board. [email protected], 217-785-2534
Acknowledgments
Courtney Avery, Health Facilities and Services Review Board; Tom Szpyrka, John Tharp and Mohammed Shahidullah, Division of Health Data and Policy, Tiefu Shen, Division of Epidemiologic Studies

Illinois Morbidity and Mortality Bulletin August 2017 Vol. 3, Issue 1 Page 23 References
Brown DC, Hayward MD, Montez JK, Hummer RA, Chiu C, and Hidajat MM. The significance of education for mortality compression in the United States. Demography. 2012;49(3), 819-840. doi:10.1007/s13524-012-0104-1.
Carey AD and Lopreato J. The biocultural evolution of the male-female mortality differential. Mankind Quarterly. 1995;36:3-28.
Cheung SL and Robine J. Increase in common longevity and the compression of mortality: The case of Japan. Population Studies. 2007;61(1), 85-97. doi:10.1080/00324720601103833.
Cheung SL, Robine J, Tu EJ, and Caselli G. Three dimensions of the survival curve: Horizontalization, verticalization, and longevity extension. Demography. 2005;42(2), 243-258. doi:10.1353/dem.2005.0012.
Coale AJ. Age patterns and time sequence of mortality in national populations with the highest expectation of life at birth. Population and Development Review. 1996;22:127-36.
Eakin T and Witten M. How square is the survival curve of a given species? Experimental Gerontology. 1995;30(1), 33-64. doi:10.1016/0531-5565(94)00042-2.
Fries JF. Frailty, heart disease, and stroke: the compression of morbidity paradigm. American Journal of Preventative Medicine. 2006;29(5 Suppl 1), 164-168. doi:10.1016/j.amepre.2005.07.004.
Fries JF. Aging, natural death, and the compression of morbidity. New England Journal of Medicine. 1980;303(23), 1369-1370. doi:10.1056/nejm198012043032317.
Go CG, Brustrom JE, Lynch MF, and Aldwin CM. Ethnic trends in survival curves and mortality. The Gerontologist. 1995;35(3), 318-326. doi:10.1093/geront/35.3.318
Gruenberg EG. The failure of success. The Milbank Quarterly. 1977;83( 4): 779–800
Horiuchi S. Postmenopausal acceleration of age-related morality increase. Journal of Gerontology: Biological Sciences. 1997;52A:B78-92.
Kannisto V. Measuring the compression of mortality. Demographic Research. 2000;3. doi:10.4054/demres.2000.3.6.
Keyfitz N and Golini A. Mortality comparisons: The male-female ratio. Genus. 1975;31:1-34.
Li JSH, Hardy MR, and Tan KS.Threshold life tables and their applications. North American Actuarial Journal. 2008;12(2):99–115.
Lynch SMJ and Brown S. Reconsidering mortality compression and deceleration: An alternative model of mortality rates. Demography. 2001;38(1), 79-95.

Illinois Morbidity and Mortality Bulletin August 2017 Vol. 3, Issue 1 Page 24 Manton KG, Stallard E, and Corder L. Changes in the age dependence of mortality and disability: Cohort and other determinants. Demography. 1997;34:135-57.
Myers GC and Manton KG. Compression of mortality: myth or reality? The Gerontologist. 1984;24:346-53.
Nusselder WJ and Mackenbach JP. Rectangularization of the Survival Curve in the Netherlands, 1950-1992. The Gerontologist. 1996;36(6), 773-782. doi:10.1093/geront/36.6.773.
Paccaud F, Pinto C S, Marazzi A, and Mili J. Age at death and rectangularisation of the survival curve: trends in Switzerland, 1969-1994. Journal of Epidemiology & Community Health. 1998;52(7), 412-415. doi:10.1136/jech.52.7.412.
Pool I, Boddington B, Cheung J, Didham R, and Amey B. Differential trends in the compression of mortality: Assessing the antecedents to current gaps in health expectancy in New Zealand. New Zealand Population Review. 2009;35, 23-53. Retrieved April 10, 2017.
Rosenbaum S, Frankford DM, Law SA and Rosenblatt RE (2013). Law and the American health care system, 2nd ed. Foundation Press. 2013;ISBN 978-1-60930-088-3.
Rothenberg R, Lentzner HR, and Parker RA. Population aging patterns: The expansion of mortality. Journal of Gerontology, Social Sciences. 1991;46:S66-70.
Shahidullah M and Agbodo N. Life expectancies for Illinois, Chicago and Illinois counties for 1989-1991 and 2009-2011. Illinois Morbidity and Mortality Bulletin. 2015;1:1. retrieved from http://www.idph.state.il.us/pdf/Jan2015-Vol1-Issue1_Multi-Chronic-Rabies-Life-Expect.pdf.
Wilmoth JR and Horiuchi S. Rectangularization revisited: Variability of age at death within human populations. Demography. 1999;36: 475-96.
Yue JC. Mortality compression and longevity risk. North American Actuarial Journal. 2012;16(4), 434-48. Retrieved June 6, 2017 from http://csyue.nccu.edu.tw/ ch/2012Mortality%20Compression(NAAJ).pdf.
Yue JC. A study of measuring the mortality compression. Presented at the Living to 100 Symposium. 2014. Retrieved June 6, 2017 from https://www.soa.org/Library/Monographs/ Life/Living-To-100/2014/mono-li14-4a-yue.pdf.