Embed Size (px)
Citation preview
2016
ANNUAL REPORT
Tony Smith, Ph.D.
State Superintendent of Education
James T. Meeks
State Board of Education Chairman

STATE BOARD OF EDUCATION
The State Board of Education consists of nine members who are appointed by the Governor with the consent of the Senate.
Board members serve four-year terms, with membership limited to two consecutive terms.
The Board appoints the State Superintendent of Education, who may be recommended by the Governor.
Lula FordChicago
James T. Meeks Chairman
Chicago
Melinda A. LaBarre SecretarySpringfield
Tony Smith, P.h.D. State Superintendent
of Education
Curt Bradshaw Naperville
John W. Sanders Marion
Mar. 2015-Nov. 2016
Steven R. GilfordVice ChairEvanston
Craig Lindvahl Effingham
Eligio Cerda Pimentel Oak Park
Cesilie Price Lake Forest
Sept. 2016
Collin Hitt Springfield
Dec. 2016
2016 ANNUAL REPORT
Illinois State Board of Education
ISBE Office of Communications, January 2017

January 2017
To the Citizens of Illinois:
In the face of financial uncertainty, school districts across the state are working hard to provide all students with equitable access to a high-quality education. Some of our students are achieving at remarkable levels. However, too many of the students entrusted to us are unprepared for the world of work and for meaningful participation in our communities. Reversing that tide requires all stakeholders to engage in dialogue, build open and trusting relationships, and invest together in creating the quality schools our students deserve.
The 2016 calendar year saw the Illinois State Board of Education (ISBE) undertake preparations to implement the Every Student Succeeds Act (ESSA), the new federal education law that returns greater autonomy and flexibility to the states. ISBE welcomes the opportunity to initiate a new era of support and collaboration within the agency and with Illinois school districts.
To chart our collective path forward, ISBE actively sought the input of educators, administrators, families, students, and community and business leaders in developing the draft Illinois ESSA State Plan. ISBE hosted 33 community meetings during three statewide listening tours, held more than 100 ESSA-related meetings overall, and received hundreds of additional comments online. By considering what educating “the whole child” means and taking into account every student’s unique strengths and needs, Illinois’ ESSA State Plan aims to equip all students to succeed in college, career, and beyond.
The draft plan includes a redesigned accountability system that will utilize multiple academic and non-academic indicators of school quality, more flexibility for school districts to use Title I funds to address local needs, multiple pathways for students to demonstrate readiness for college and career, a stronger focus on homeless students, and latitude to assess English Learners in their native language to appropriately gauge growth and achievement.
ISBE remains committed to the mission and vision adopted in 2015:
• Vision: Illinois is a state of whole, healthy children nested in whole, healthy systemssupporting communities wherein all citizens are socially and economically secure.
• Mission: To provide leadership and resources to achieve excellence across all Illinoisdistricts through engaging legislators, school administrators, teachers, students, parents,and other stakeholders in formulating and advocating for policies that enhance education,empower districts, and ensure equitable outcomes for all students.
Reflecting that spirit of collaboration, ISBE forged new partnerships in 2016 with other governmental agencies, with philanthropic entities, and with the private sector in order to harness all available resources in the service of amplifying all students’ potential.
New ISBE partnerships in 2016 include:
• Illinois Department of Juvenile Justice (IDJJ): To better serve IDJJ’s specialeducation population by providing training for IDJJ staff and updating IndividualizedEducation Programs, to expand educational offerings for youth in IDJJ custody, and toexplore the creation of transition schools to ease youth back into their home communitiesupon release.
• Governor’s Cabinet on Children and Youth (Children’s Cabinet): To move theneedle on cross-agency projects impacting Illinois children and youth, in collaborationwith 15 other state agencies. In its first year, the Children’s Cabinet will focus ondecreasing childhood exposure to lead, increasing the number of youth earning industry-recognized credentials, and strengthening the pipeline of diverse and well-qualified earlychildhood caregivers and educators.
• Illinois Department of Children and Family Services (DCFS): To create a secure linkand matching process between DCFS foster care data and the ISBE Student InformationSystem, in order to monitor and measure the well-being of youth in state care.
• McCormick Foundation and WestEd: To revamp communications around theKindergarten Individual Development Survey, a research-based tool available to allIllinois school districts for collecting and reporting the developmental progress ofkindergartners.
• Illinois Math and Science Academy: To provide 80 hours of evidenced-based math andscience professional development to more than 800 educators throughout the state,supported by a federal Mathematics and Science Partnerships grant.
• Lead Higher Initiative: To close equity gaps for low-income students and students ofcolor in our high schools’ most rigorous courses by identifying and enrolling 100,000low-income students and students of color in Advanced Placement, InternationalBaccalaureate, and dual-credit courses over the next three years.
• Future Ready Schools: To connect educators with a robust framework of free research-based resources promoting personalized student learning, enhanced by digital tools.
• Illinois Classroom Connectivity Initiative: To enable high-speed internet in everyclassroom in Illinois, in collaboration with EducationSuperHighway, the NationalGovernors Association, the Illinois Office of the Governor, and the Illinois Department ofInnovation & Technology.
• New Skills for Youth: To increase economic opportunity for young people bystrengthening career-focused education, starting in high school and ending withpostsecondary degrees or credentials aligned with business needs, supported by a $75
million, five-year initiative developed by JPMorgan Chase in partnership with the Council of Chief State School Officers and Advance CTE.
• Charter Schools Program: To increase the number of high-quality charter schools inIllinois and evaluate the effects of charter schools on student academic achievement,supported by a $42 million federal grant.
ISBE has infused new creativity into one of our core critical services: the collection and presentation of statewide education-related data. ISBE strives to collect and deliver actionable data into the hands of our stakeholders, so all students get the support they need. New and ongoing data and information technology projects allow ISBE to maximize the impact of effective programs and partnerships.
Impactful data and information technology projects initiated in 2016 include:
• Illinois Report Card: ISBE’s online Illinois Report Card continues to draw praise forbeing transparent, comprehensive, and user-friendly. The Illinois Report Card providesschools, districts, families, and stakeholders with an annual snapshot of public educationacross the state. The Report Card allows schools and districts to look at their ownperformance from year to year and to identify collaboration opportunities with otherschools and districts across multiple measures.
• New ISBE Website: ISBE redesigned our website to feature content organized andprioritized by user interest. The new website includes enhancements such as easierreadability on mobile devices and greatly improved search functionality. The websiteupdate will allow ISBE to improve the accessibility and transparency of data,information, and resources.
• Ed360: ISBE has begun building a state-of-the-art, student-focused StatewideLongitudinal Data System, including a custom Ed360 educator portal. Ed360 will presenteducators with a comprehensive and high-quality dashboard suite that includes district-,school-, teacher-, and student-level details to support data-informed administrative andinstructional decisions.
• Partnership for Educator Preparation: ISBE launched a stakeholder steeringcommittee to provide guidance in the design of ISBE’s new accountability andimprovement system for teacher preparation. The system aims to strengthen thecollection, sharing, and reporting of data across teacher preparation programs statewideand ensure every novice teacher enters the classroom ready to support student learning.
In 2016, ISBE also worked to improve how we meaningfully assess what students know and are able to do. ISBE announced that the Partnership for Assessment of Readiness for College and Careers exam will be discontinued at the high school level. Instead, the SAT, including a writing component, will be administered free of charge to all high school juniors in Illinois. ISBE designed a new and more cost-effective method of creating and implementing assessments on a
large scale, resulting in a new platform to deliver a summative science assessment to more than 400,000 students. At the direction of the General Assembly and the Governor, ISBE launched the Competency-Based High School Graduation Requirements Pilot Program in an effort to support innovative school districts that desire to move beyond the traditional assessment model. The pilot will allow up to 12 school districts to replace high school graduation requirements with a credit-and-learning system based on students’ demonstrated mastery of specific skills, abilities, and knowledge, rather than on time in the classroom.
In closing, ISBE extends our deepest gratitude to Illinois’ educators, students, and families for remaining committed to our collective work and our role in shaping Illinois’ future, despite trying times. Together, we can transform those practices that have left far too many of our most vulnerable students behind. We can write the next chapter about schools in which all students feel safe and supported and where all students are expected to do their very best as they become their best selves. We believe this is the best way to ensure the economic and civic well-being of Illinois.
Sincerely,
James T. Meeks Tony Smith, Ph.D. Chairman State Superintendent
Table of Contents Illinois Teacher of the Year ................................................................................... 1
2016 Condition of Education ................................................................................. 2
State, Local and Federal Resources ...................................................................... 7 State, Local and Federal Resources for Elementary and Secondary Education .............................................. 7 Elementary and Secondary School Income From Local Sources .................................................................... 8 Net Lottery Proceeds Compared to Total Appropriations to ISBE ................................................................. 9 State Revenues by Source .............................................................................................................................. 10 Appropriations by Major Purpose .................................................................................................................. 11 Expenditures by Major Purpose .................................................................................................................... 12 State Mandated Categorical Grant Programs ................................................................................................ 13
Receipts and Expenditures for Illinois Public School Districts .................................................................... 14
Public Schools Finance Statistics .................................................................................................................. 15 Total Appropriations Per Pupil Enrolled ....................................................................................................... 16
State Average Operating Expense Per Pupil ................................................................................................. 17
Average Operating Expense Per Pupil by Type of District ........................................................................... 17
Total Funding ............................................................................................................................................... 18
State Funding ............................................................................................................................................... 18
Local Funding .............................................................................................................................................. 18 Federal Funding ............................................................................................................................................ 18 Percentages of State, Local and Federal Funding ......................................................................................... 18 Foundation Level Funding ............................................................................................................................ 19
Schools and Districts ........................................................................................... 20 A Profile of Illinois Public Schools in 2015-16 ................................................................................................ 20 Illinois Public School Districts by Type ........................................................................................................ 22 Comparison of Public School Districts by Type and Enrollment 2005-06 and 2015-16 ................................. 23 Comparison of Public and Nonpublic Attendance Centers 2005-06 and 2015-16 .......................................... 23
Public School Recognition Committee Act or Omissions Status Report for the 2015-16 School Year .......... 24
Interim Superintendents for the 2015-16 School Year .................................................................................... 27
Students ............................................................................................................... 28 Public and Nonpublic Prekindergarten Through Postgraduate Fall Pupil Enrollment ............................... 28 Comparison of Public Enrollment 2005-06 and 2015-16 ................................................................................. 29 Comparison of Public School Enrollment by Racial/Ethnic Distribution 2005-06 and 2015-16.................... 30
Comparison of Nonpublic School Enrollment 2005-06 and 2015-16 .............................................................. 30 Limited English Proficient Enrollment by Native Language 2015-16 ........................................................... 31 English Learner Students by Transition Status and School Year Outcome 2015-16 ...................................... 32 School Districts That Served More Than 1,000 Limited English Proficient Students 2015-16....................... 33 Limited English Proficient Enrollment ......................................................................................................... 33
Number of Children Served by Preschool for All (PFA) State-Funded Programs ......................................... 34
High School Graduates ................................................................................................................................. 34 2015-16 High School Dropout Rate by Grade Level, Gender, and Race/Ethnicity ....................................... 35 Selected School Report Card Variables Statewide Trend Data ..................................................................... 36
Student Performance ........................................................................................... 37 Partnership for Assessment of Readiness for College and Careers (PARCC) ............................................... 37
Dynamic Learning Maps (DLM) .................................................................................................................. 38
ACT Composite Scores .................................................................................................................................. 39 2016 Advanced Placement Performance ........................................................................................................ 39 National Assessment of Educational Progress (NAEP)"The Nation's Report Card" Average Student Scores for Illinois and U.S. Public Schools ....................................................................................... 40 National Assessment of Educational Progress (NAEP)"The Nation's Report Card" Comparison of Illinois and U.S. Achievement Gaps .......................................................................................................... 41
Educators ............................................................................................................. 42 Number of Selected Full-Time Public School Personnel by Gender 2015-16 ................................................ 42
Nonpublic School Personnel (FTE) 2015-16.................................................................................................. 42 Salaries for Selected Full-Time Public School Personnel 2015-16 .................................................................. 43 Public School Pupil-to-Teacher Ratios ......................................................................................................... 43 Educator Certificates Issued by Type ........................................................................................................... 44 Educator Certificates Issued by Evaluation, Entitlement and Exchange .................................................... 44 Educator Licenses Issued by Evaluation, Entitlement and Exchange ......................................................... 44
Educator Licenses Issued by Type................................................................................................................ 45
Educator Endorsements Issued by Type ...................................................................................................... 45
Educator Certification/Licensure Tests Administered by Test Fields ......................................................... 46
National Board-Certified Teachers Certification Earned in Illinois ............................................................. 47
Expenditures to National Board-Certified Teachers ..................................................................................... 47
Special Education Services ................................................................................. 48 Students With Disabilities Receiving Special Education Services ................................................................ 48 Students With Disabilities by Gender ............................................................................................................ 48 Students With Disabilities by Race/Ethnic Group ....................................................................................... 49 Students With Disabilities by Age ................................................................................................................. 49 Students With Disabilities Exiting School..................................................................................................... 50
Students With Disabilities by Primary Language .......................................................................................... 50 Students With Disabilities Receiving Related and Other Special Education Services .................................. 51 Educational Placement of Children With Disabilities ................................................................................... 52 Teachers Employed to Provide Special Education Services (FTE) .............................................................. 53
Paraprofessionals Employed to Provide Special Education Services (FTE) ................................................. 54
Special Education and Related Services Personnel (FTE) ............................................................................ 54
Mandated Categorical Grants Rate Analysis ................................................................................................. 55 Teachers' Retirement Systems ...................................................................................................................... 56

Illinois Teacher of the Year Kimberly Thomas, a math teacher at Woodruff Career and Technical Center in Peoria, is the 2016 Illinois Teacher of the Year. One of 10 finalists, Thomas was announced as this year’s top educator during the 41st annual Those Who Excel/Illinois Teacher of the Year
banquet in Normal on Oct. 17, 2015.
Kim was Illinois’ nominee for the National Teacher of the Year and she represented Illinois teachers at a variety of events, including a trip to the White House and a trip to NASA Space Camp in Huntsville, Alabama. This past August, Kim and two of her students from Peoria demonstrated several of the math games she has created to help students learn to love -- and understand -- math. Her classes are high-energy and her students are successfully learning math skills by making Mathentines or playing a quick game of
DynaMATHic Dice Dilemma or Math Muscles. Kim uses projects and activities that encourage students to be engaged and have fun while learning.
Thomas believes she has a duty to her students to continually develop herself professionally so she can provide them with the best learning experience possible. Kim prepares students so they can -- and they will -- succeed. She believes in the transformative power of education and that belief is evident in every lesson she teaches, every speech she gives, and every activity she creates. Kim says that she became a teacher so that kids would have an awesome experience going to school, and she never loses sight of that goal.
Several excellent teachers during Kim’s own education helped her make the decision to become a teacher. After 24 years in the classroom, Thomas says she has never had a bad day, because she knows that at least one of “her” kids will say something or do something positive that makes her day. She earned a Bachelor of Science in Education at Illinois State University and a Master of Arts in Education and Teacher Leadership from St. Xavier University.
On Oct. 22, 2016, Kim joined educators from across the state at the 42nd Those Who Excel/Illinois Teacher of the Year banquet as Ricardo Castro was named the 2017 Illinois Teacher of the Year. Ricky is an English as a Second Language, language arts, and Spanish heritage teacher at Elk Grove High School in Elk Grove Village.
1
2016 Condition of Education
Budget
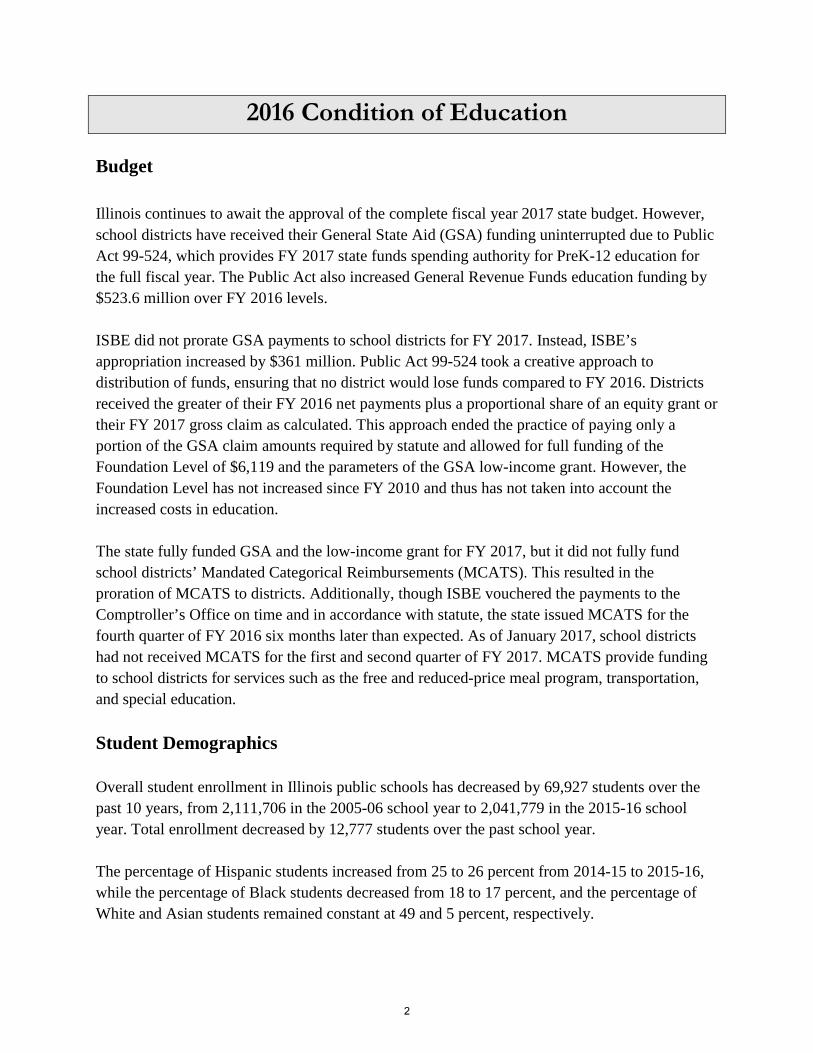
Illinois continues to await the approval of the complete fiscal year 2017 state budget. However, school districts have received their General State Aid (GSA) funding uninterrupted due to Public Act 99-524, which provides FY 2017 state funds spending authority for PreK-12 education for the full fiscal year. The Public Act also increased General Revenue Funds education funding by $523.6 million over FY 2016 levels.
ISBE did not prorate GSA payments to school districts for FY 2017. Instead, ISBE’sappropriation increased by $361 million. Public Act 99-524 took a creative approach todistribution of funds, ensuring that no district would lose funds compared to FY 2016. Districtsreceived the greater of their FY 2016 net payments plus a proportional share of an equity grant ortheir FY 2017 gross claim as calculated. This approach ended the practice of paying only aportion of the GSA claim amounts required by statute and allowed for full funding of the Foundation Level of $6,119 and the parameters of the GSA low-income grant. However, the Foundation Level has not increased since FY 2010 and thus has not taken into account the increased costs in education.
The state fully funded GSA and the low-income grant for FY 2017, but it did not fully fund school districts’ Mandated Categorical Reimbursements (MCATS). This resulted in the proration of MCATS to districts. Additionally, though ISBE vouchered the payments to the Comptroller’s Office on time and in accordance with statute, the state issued MCATS for the fourth quarter of FY 2016 six months later than expected. As of January 2017, school districts had not received MCATS for the first and second quarter of FY 2017. MCATS provide funding to school districts for services such as the free and reduced-price meal program, transportation, and special education.
Student Demographics
Overall student enrollment in Illinois public schools has decreased by 69,927 students over the past 10 years, from 2,111,706 in the 2005-06 school year to 2,041,779 in the 2015-16 school year. Total enrollment decreased by 12,777 students over the past school year.
The percentage of Hispanic students increased from 25 to 26 percent from 2014-15 to 2015-16, while the percentage of Black students decreased from 18 to 17 percent, and the percentage of White and Asian students remained constant at 49 and 5 percent, respectively.
2
Illinois continues to experience a significant increase in low-income students. Low-income students increased from 40 percent of the enrollment in the 2005-06 school year to 50 percent of the enrollment in the 2015-16 school year. Students qualify as low-income if they are in families receiving public aid, live in substitute care, or are eligible for free or reduced-price lunches.
The average class size remains constant at 21 students per class.
Learning Outcomes
The State Board of Education stands committed to its strategic plan to improve student success in Illinois by focusing on specific, high-reaching, and measurable goals. Every child in each public school district in the State of Illinois deserves to attend a system wherein:
• All kindergartners are assessed for readiness.• 90 percent or more of third-grade students are reading at or above grade level.• 90 percent or more of fifth-grade students meet or exceed expectations in mathematics.• 90 percent or more of ninth-grade students are on track to graduate with their cohort.• 90 percent or more of students graduate from high school ready for college and career.• All students are supported by highly prepared and effective teachers and school leaders.• Every school offers a safe and healthy learning environment for all students.
The Every Student Succeeds Act (ESSA), which replaces No Child Left Behind as the new federal education law, presents Illinois with an extraordinary opportunity to redesign how we support districts in bringing these goals to life.
ISBE acknowledges that our goals are ambitious. We believe we share a moral imperative with all Illinoisans to ensure all students meet these goals. Some school districts are closer than others to achieving these high levels of academic performance, and every school district has room to improve and to participate in the work of helping others improve.
ISBE has five key areas of focus to guide the agency’s initiatives. These areas are outlined in ISBE’s Comprehensive Strategic Plan for Elementary and Secondary Education in Illinois:
● Funding: Establish an adequate and equitable education finance system.● Quality: Common definition of, and fair access to, quality education.● Autonomy: Maximize district autonomy to provide quality education to all families.● Competency: Encourage competency-based learning.● Community: Districts and schools as centers of healthy communities.
3
The draft Illinois ESSA State Plan reinforces our agency initiatives. Together, we are building a state plan responsive to ESSA’s call for high academic standards for all students, enhanced professional development for educators, and support for innovation at the local district level.
Student Performance and Achievement
Statewide indicators of academic achievement mostly held steady during the 2015-16 school year – a testament to the commitment and resourcefulness of educators and administrators, who felt our state’s education funding challenges in major ways.
However, testing results tell us that two out of every three students are not fully ready to move on to their next learning opportunity, whether that is the next grade level in school, graduation, college, or a career. Illinois’ statewide graduation rate of 85.5 percent is higher than the national average of 83.2 percent, and our high school dropout rate decreased over the past year. Still, we send too many students on to college and career not fully prepared for the work they will encounter. More than 70 percent of Illinois students enroll in two- and four-year colleges and universities within 16 months of high school graduation, but we have much more work to do to ensure that all students across the state are equipped with the knowledge and skills they need to thrive after graduation.
Some notable statewide data points are listed below. All comparisons, unless otherwise noted, show changes from the 2014-15 school year to the 2015-16 school year.
• Statewide student attendance – increased from 94.2 percent to 94.4 percent• Percentage of students meeting or exceeding math proficiency on the Partnership
for Assessment of Readiness for College and Careers (PARCC) exam – increasedfrom 28.2 percent to 30.5 percent
• High school dropout rate – decreased from 2.3 percent to 2.0 percent; metric showspercentage of students in grades 9-12 who dropped out of high school during the schoolyear
• Percentage of students who took the PARCC exam – increased from 95.6 percent to97.5 percent
• Percentage of students earning a 21 or higher ACT composite score – increased from45.6 percent to 46.4 percent
• Teacher retention rate – increased from 85.0 percent to 85.8 percent
4
Illinois State Board of Education
2016 Annual Report
Demographic, Financial and Statistical Data
5

6
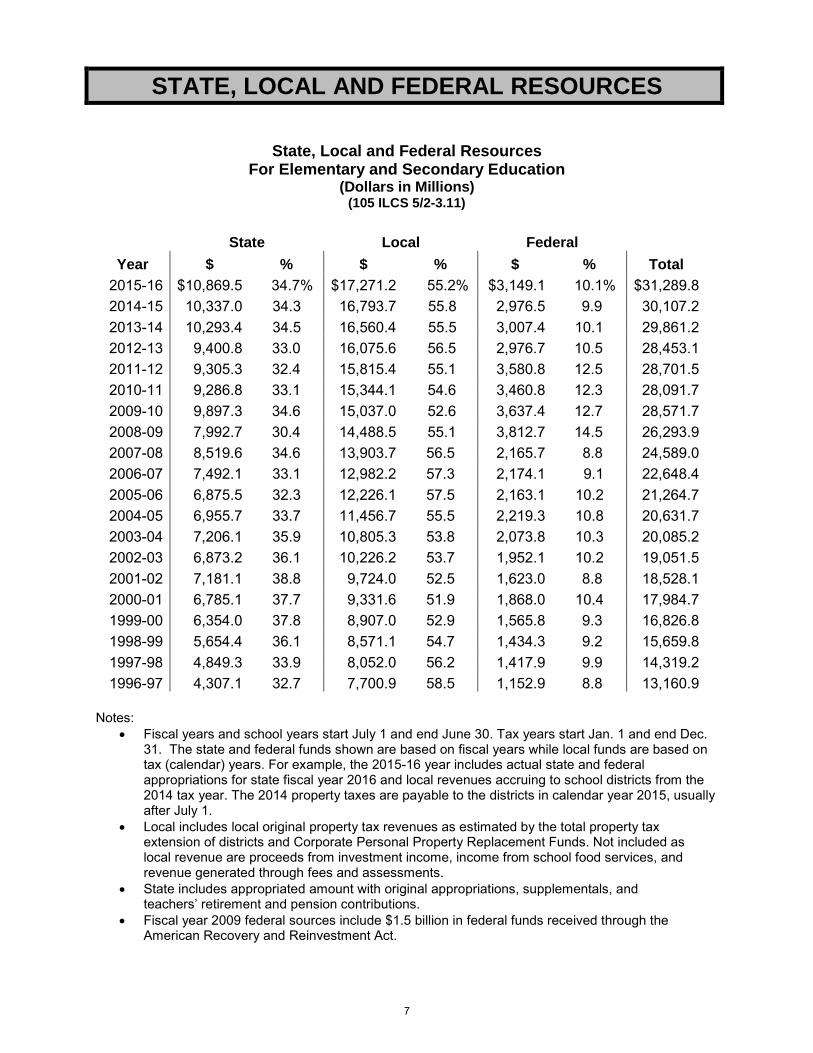
STATE, LOCAL AND FEDERAL RESOURCES
State, Local and Federal Resources For Elementary and Secondary Education
(Dollars in Millions) (105 ILCS 5/2-3.11)
State Local Federal
Year $ % $ % $ % Total 2015-16 $10,869.5 34.7% $17,271.2 55.2% $3,149.1 10.1% $31,289.8 2014-15 10,337.0 34.3 16,793.7 55.8 2,976.5 9.9 30,107.2 2013-14 10,293.4 34.5 16,560.4 55.5 3,007.4 10.1 29,861.2 2012-13 9,400.8 33.0 16,075.6 56.5 2,976.7 10.5 28,453.1 2011-12 9,305.3 32.4 15,815.4 55.1 3,580.8 12.5 28,701.5 2010-11 9,286.8 33.1 15,344.1 54.6 3,460.8 12.3 28,091.7 2009-10 9,897.3 34.6 15,037.0 52.6 3,637.4 12.7 28,571.7 2008-09 7,992.7 30.4 14,488.5 55.1 3,812.7 14.5 26,293.9 2007-08 8,519.6 34.6 13,903.7 56.5 2,165.7 8.8 24,589.0 2006-07 7,492.1 33.1 12,982.2 57.3 2,174.1 9.1 22,648.4 2005-06 6,875.5 32.3 12,226.1 57.5 2,163.1 10.2 21,264.7 2004-05 6,955.7 33.7 11,456.7 55.5 2,219.3 10.8 20,631.7 2003-04 7,206.1 35.9 10,805.3 53.8 2,073.8 10.3 20,085.2 2002-03 6,873.2 36.1 10,226.2 53.7 1,952.1 10.2 19,051.5 2001-02 7,181.1 38.8 9,724.0 52.5 1,623.0 8.8 18,528.1 2000-01 6,785.1 37.7 9,331.6 51.9 1,868.0 10.4 17,984.7 1999-00 6,354.0 37.8 8,907.0 52.9 1,565.8 9.3 16,826.8 1998-99 5,654.4 36.1 8,571.1 54.7 1,434.3 9.2 15,659.8 1997-98 4,849.3 33.9 8,052.0 56.2 1,417.9 9.9 14,319.2 1996-97 4,307.1 32.7 7,700.9 58.5 1,152.9 8.8 13,160.9
Notes:
• Fiscal years and school years start July 1 and end June 30. Tax years start Jan. 1 and end Dec. 31. The state and federal funds shown are based on fiscal years while local funds are based on tax (calendar) years. For example, the 2015-16 year includes actual state and federal appropriations for state fiscal year 2016 and local revenues accruing to school districts from the 2014 tax year. The 2014 property taxes are payable to the districts in calendar year 2015, usually after July 1.
• Local includes local original property tax revenues as estimated by the total property tax extension of districts and Corporate Personal Property Replacement Funds. Not included as local revenue are proceeds from investment income, income from school food services, and revenue generated through fees and assessments.
• State includes appropriated amount with original appropriations, supplementals, and teachers’ retirement and pension contributions.
• Fiscal year 2009 federal sources include $1.5 billion in federal funds received through the American Recovery and Reinvestment Act.
7
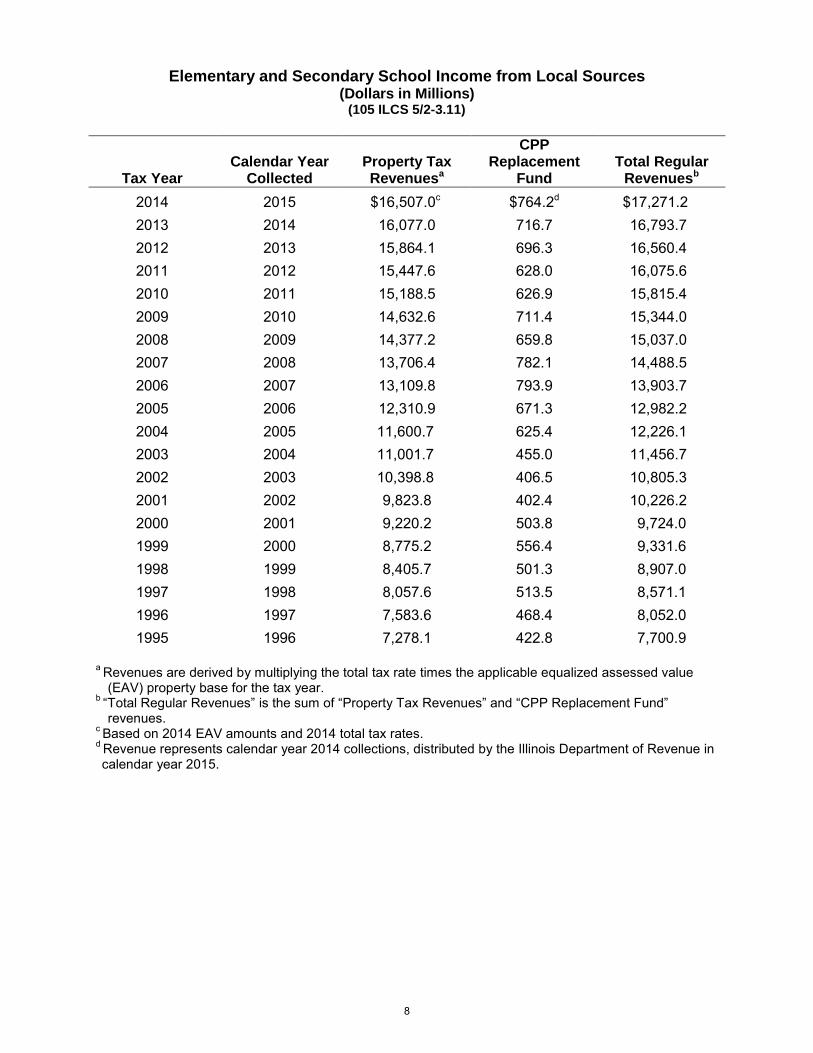
Elementary and Secondary School Income from Local Sources (Dollars in Millions)
(105 ILCS 5/2-3.11)
Tax Year Calendar Year
Collected Property Tax Revenuesa
CPP Replacement
Fund Total Regular
Revenuesb
2014 2015 $16,507.0c $764.2d $17,271.2 2013 2014 16,077.0 716.7 16,793.7 2012 2013 15,864.1 696.3 16,560.4 2011 2012 15,447.6 628.0 16,075.6 2010 2011 15,188.5 626.9 15,815.4 2009 2010 14,632.6 711.4 15,344.0 2008 2009 14,377.2 659.8 15,037.0 2007 2008 13,706.4 782.1 14,488.5 2006 2007 13,109.8 793.9 13,903.7 2005 2006 12,310.9 671.3 12,982.2 2004 2005 11,600.7 625.4 12,226.1 2003 2004 11,001.7 455.0 11,456.7 2002 2003 10,398.8 406.5 10,805.3 2001 2002 9,823.8 402.4 10,226.2 2000 2001 9,220.2 503.8 9,724.0 1999 2000 8,775.2 556.4 9,331.6 1998 1999 8,405.7 501.3 8,907.0 1997 1998 8,057.6 513.5 8,571.1 1996 1997 7,583.6 468.4 8,052.0 1995 1996 7,278.1 422.8 7,700.9
a Revenues are derived by multiplying the total tax rate times the applicable equalized assessed value (EAV) property base for the tax year.
b “Total Regular Revenues” is the sum of “Property Tax Revenues” and “CPP Replacement Fund” revenues.
c Based on 2014 EAV amounts and 2014 total tax rates. d Revenue represents calendar year 2014 collections, distributed by the Illinois Department of Revenue in calendar year 2015.
8

Net Lottery Proceeds Compared to Total Appropriations to ISBE
(Dollars in Millions) (105 ILCS 5/2-3.11)
Fiscal Year Total
Appropriationsa Net Lottery Proceedsb
Amount % of Total 2016 $10,869.5 $681.9 6.3% 2015 10,337.0 678.6 6.6 2014 10,293.4 668.1 6.5 2013 9,400.8 655.6 7.0 2012 9,305.3 639.9 6.9 2011 9,286.8 631.8 6.8 2010 9,897.3 625.0 6.3 2009 7,992.7 625.0 7.8 2008 8,519.6 657.0 7.7 2007 7,492.1 622.4 8.3 2006 6,875.5 670.5 9.8 2005 6,955.7 614.0 8.8 2004 7,206.1 570.1 7.9 2003 6,873.2 540.0 7.9 2002 7,181.1 555.0 7.7 2001 6,785.1 490.0 7.2 2000 6,354.0 515.0 8.1 1999 5,654.4 540.0 9.6 1998 4,849.3 565.0 11.7 1997 4,307.1 590.2 13.7
a General Revenue Funds include retirement contributions and supplemental appropriations. b Net Lottery Proceeds provided by the Illinois Department of Revenue.
Notes: • Since FY 1985, Net Lottery Proceeds have been deposited into the Common School Fund. • Starting March 1, 2010, annual transfers to the Common School Fund are equal to the amount
transferred in FY 2009, adjusted for inflation. Any additional net revenue is deposited in the Capital Projects Fund.
9
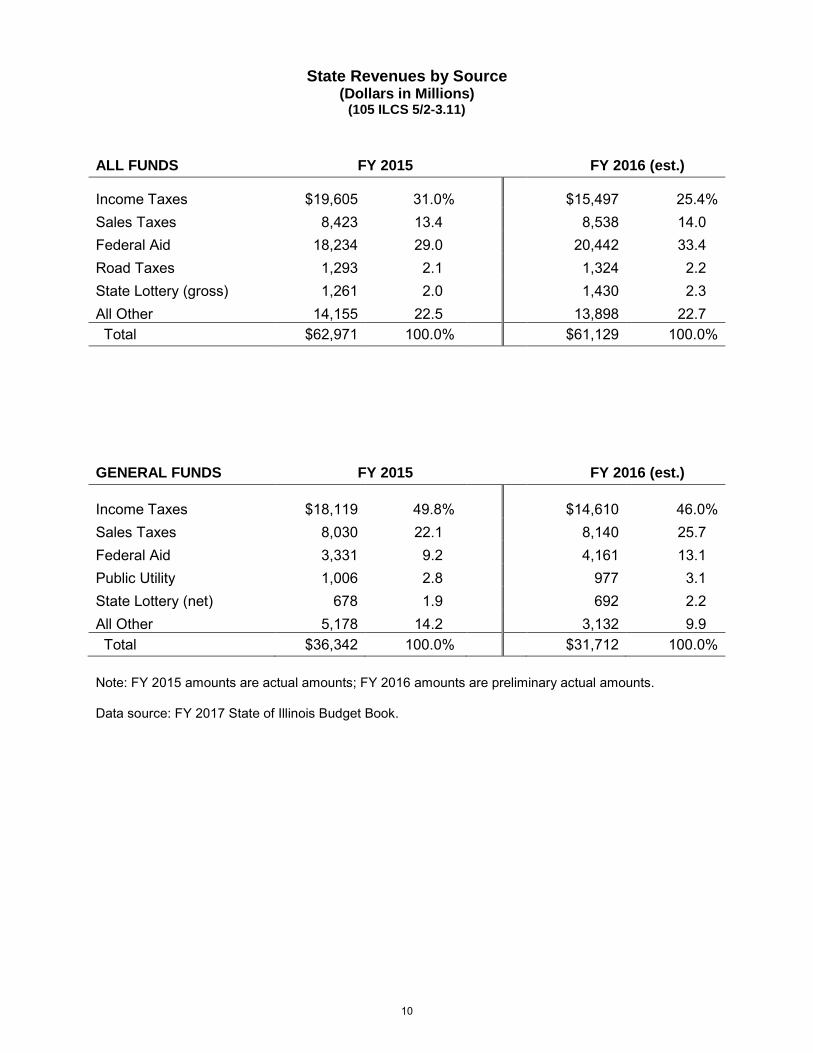
State Revenues by Source (Dollars in Millions)
(105 ILCS 5/2-3.11) ALL FUNDS FY 2015 FY 2016 (est.)
Income Taxes $19,605 31.0% $15,497 25.4% Sales Taxes 8,423 13.4 8,538 14.0 Federal Aid 18,234 29.0 20,442 33.4 Road Taxes 1,293 2.1 1,324 2.2 State Lottery (gross) 1,261 2.0 1,430 2.3 All Other 14,155 22.5 13,898 22.7 Total $62,971 100.0% $61,129 100.0%
GENERAL FUNDS FY 2015 FY 2016 (est.)
Income Taxes $18,119 49.8% $14,610 46.0% Sales Taxes 8,030 22.1 8,140 25.7 Federal Aid 3,331 9.2 4,161 13.1 Public Utility 1,006 2.8 977 3.1 State Lottery (net) 678 1.9 692 2.2 All Other 5,178 14.2 3,132 9.9 Total $36,342 100.0% $31,712 100.0% Note: FY 2015 amounts are actual amounts; FY 2016 amounts are preliminary actual amounts. Data source: FY 2017 State of Illinois Budget Book.
10
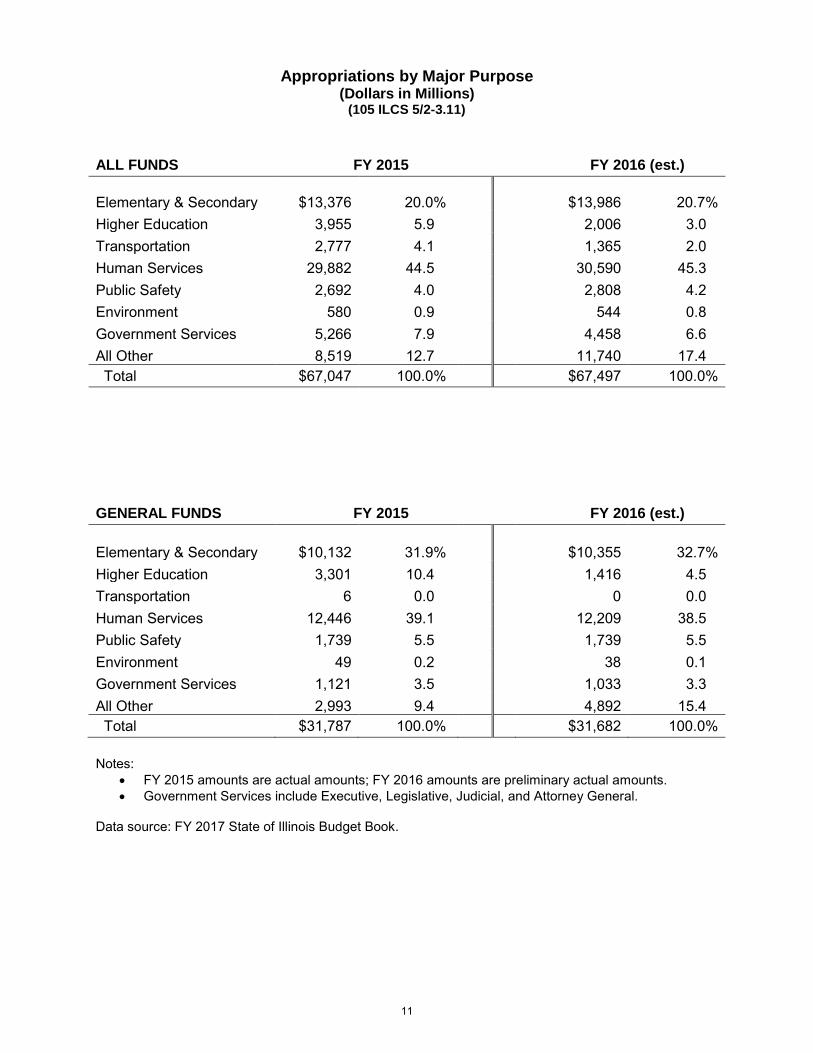
Appropriations by Major Purpose (Dollars in Millions)
(105 ILCS 5/2-3.11) ALL FUNDS FY 2015 FY 2016 (est.)
Elementary & Secondary $13,376 20.0% $13,986 20.7% Higher Education 3,955 5.9 2,006 3.0 Transportation 2,777 4.1 1,365 2.0 Human Services 29,882 44.5 30,590 45.3 Public Safety 2,692 4.0 2,808 4.2 Environment 580 0.9 544 0.8 Government Services 5,266 7.9 4,458 6.6 All Other 8,519 12.7 11,740 17.4 Total $67,047 100.0% $67,497 100.0%
GENERAL FUNDS FY 2015 FY 2016 (est.)
Elementary & Secondary $10,132 31.9% $10,355 32.7% Higher Education 3,301 10.4 1,416 4.5 Transportation 6 0.0 0 0.0 Human Services 12,446 39.1 12,209 38.5 Public Safety 1,739 5.5 1,739 5.5 Environment 49 0.2 38 0.1 Government Services 1,121 3.5 1,033 3.3 All Other 2,993 9.4 4,892 15.4 Total $31,787 100.0% $31,682 100.0% Notes:
• FY 2015 amounts are actual amounts; FY 2016 amounts are preliminary actual amounts. • Government Services include Executive, Legislative, Judicial, and Attorney General.
Data source: FY 2017 State of Illinois Budget Book.
11
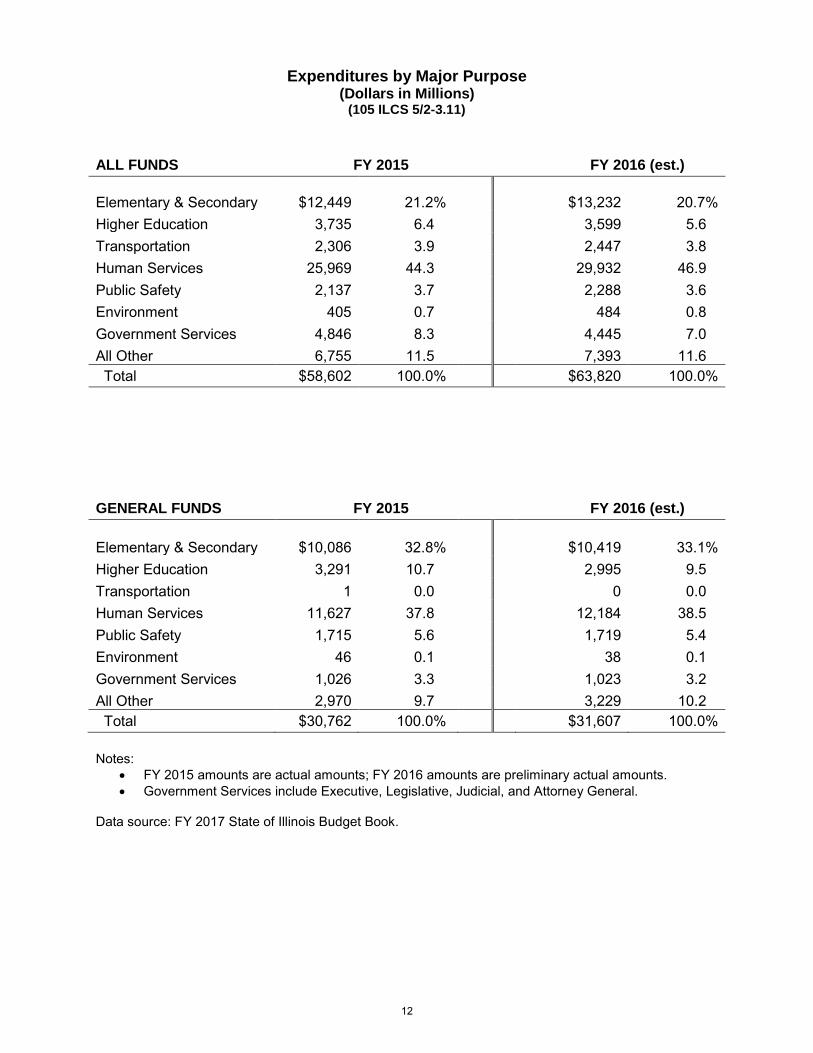
Expenditures by Major Purpose (Dollars in Millions)
(105 ILCS 5/2-3.11) ALL FUNDS FY 2015 FY 2016 (est.)
Elementary & Secondary $12,449 21.2% $13,232 20.7% Higher Education 3,735 6.4 3,599 5.6 Transportation 2,306 3.9 2,447 3.8 Human Services 25,969 44.3 29,932 46.9 Public Safety 2,137 3.7 2,288 3.6 Environment 405 0.7 484 0.8 Government Services 4,846 8.3 4,445 7.0 All Other 6,755 11.5 7,393 11.6 Total $58,602 100.0% $63,820 100.0% GENERAL FUNDS FY 2015 FY 2016 (est.)
Elementary & Secondary $10,086 32.8% $10,419 33.1% Higher Education 3,291 10.7 2,995 9.5 Transportation 1 0.0 0 0.0 Human Services 11,627 37.8 12,184 38.5 Public Safety 1,715 5.6 1,719 5.4 Environment 46 0.1 38 0.1 Government Services 1,026 3.3 1,023 3.2 All Other 2,970 9.7 3,229 10.2 Total $30,762 100.0% $31,607 100.0% Notes:
• FY 2015 amounts are actual amounts; FY 2016 amounts are preliminary actual amounts. • Government Services include Executive, Legislative, Judicial, and Attorney General.
Data source: FY 2017 State of Illinois Budget Book.
12
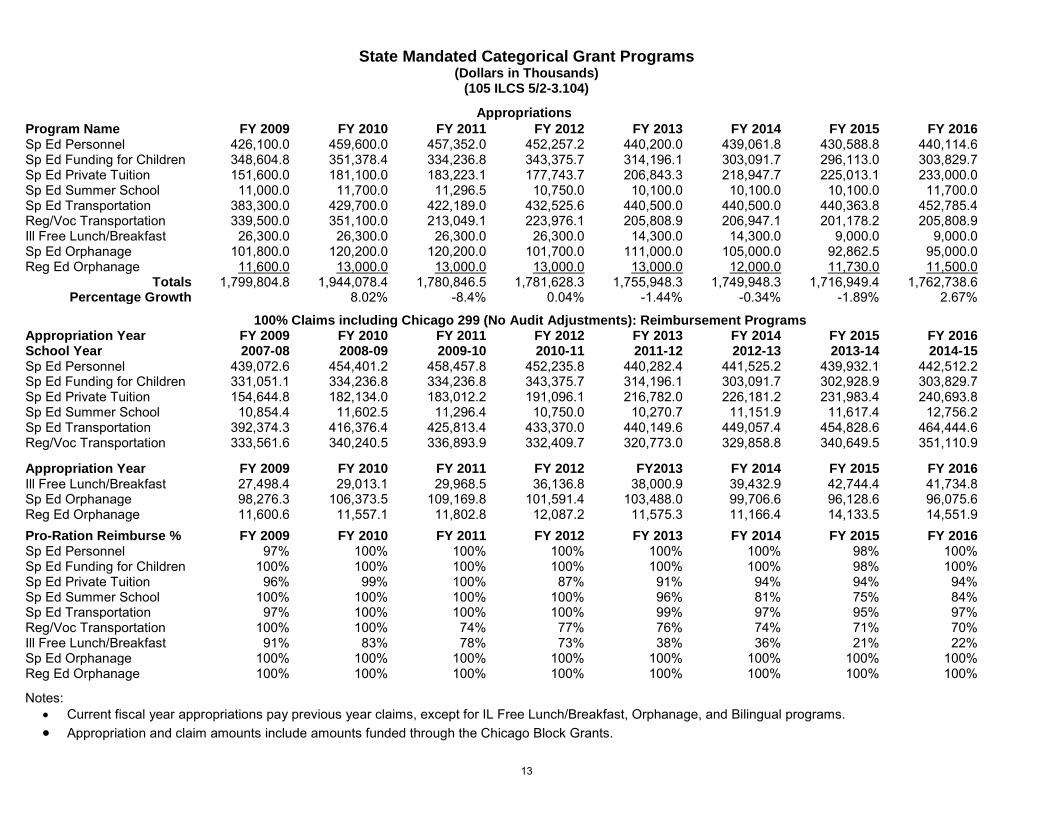
State Mandated Categorical Grant Programs (Dollars in Thousands)
(105 ILCS 5/2-3.104)
Appropriations Program Name FY 2009 FY 2010 FY 2011 FY 2012 FY 2013 FY 2014 FY 2015 FY 2016 Sp Ed Personnel 426,100.0 459,600.0 457,352.0 452,257.2 440,200.0 439,061.8 430,588.8 440,114.6 Sp Ed Funding for Children 348,604.8 351,378.4 334,236.8 343,375.7 314,196.1 303,091.7 296,113.0 303,829.7 Sp Ed Private Tuition 151,600.0 181,100.0 183,223.1 177,743.7 206,843.3 218,947.7 225,013.1 233,000.0 Sp Ed Summer School 11,000.0 11,700.0 11,296.5 10,750.0 10,100.0 10,100.0 10,100.0 11,700.0 Sp Ed Transportation 383,300.0 429,700.0 422,189.0 432,525.6 440,500.0 440,500.0 440,363.8 452,785.4 Reg/Voc Transportation 339,500.0 351,100.0 213,049.1 223,976.1 205,808.9 206,947.1 201,178.2 205,808.9 Ill Free Lunch/Breakfast 26,300.0 26,300.0 26,300.0 26,300.0 14,300.0 14,300.0 9,000.0 9,000.0 Sp Ed Orphanage 101,800.0 120,200.0 120,200.0 101,700.0 111,000.0 105,000.0 92,862.5 95,000.0 Reg Ed Orphanage 11,600.0 13,000.0 13,000.0 13,000.0 13,000.0 12,000.0 11,730.0 11,500.0
Totals 1,799,804.8 1,944,078.4 1,780,846.5 1,781,628.3 1,755,948.3 1,749,948.3 1,716,949.4 1,762,738.6 Percentage Growth 8.02% -8.4% 0.04% -1.44% -0.34% -1.89% 2.67%
100% Claims including Chicago 299 (No Audit Adjustments): Reimbursement Programs Appropriation Year FY 2009 FY 2010 FY 2011 FY 2012 FY 2013 FY 2014 FY 2015 FY 2016 School Year 2007-08 2008-09 2009-10 2010-11 2011-12 2012-13 2013-14 2014-15 Sp Ed Personnel 439,072.6 454,401.2 458,457.8 452,235.8 440,282.4 441,525.2 439,932.1 442,512.2 Sp Ed Funding for Children 331,051.1 334,236.8 334,236.8 343,375.7 314,196.1 303,091.7 302,928.9 303,829.7 Sp Ed Private Tuition 154,644.8 182,134.0 183,012.2 191,096.1 216,782.0 226,181.2 231,983.4 240,693.8 Sp Ed Summer School 10,854.4 11,602.5 11,296.4 10,750.0 10,270.7 11,151.9 11,617.4 12,756.2 Sp Ed Transportation 392,374.3 416,376.4 425,813.4 433,370.0 440,149.6 449,057.4 454,828.6 464,444.6 Reg/Voc Transportation 333,561.6 340,240.5 336,893.9 332,409.7 320,773.0 329,858.8 340,649.5 351,110.9
Appropriation Year FY 2009 FY 2010 FY 2011 FY 2012 FY2013 FY 2014 FY 2015 FY 2016 Ill Free Lunch/Breakfast 27,498.4 29,013.1 29,968.5 36,136.8 38,000.9 39,432.9 42,744.4 41,734.8 Sp Ed Orphanage 98,276.3 106,373.5 109,169.8 101,591.4 103,488.0 99,706.6 96,128.6 96,075.6 Reg Ed Orphanage 11,600.6 11,557.1 11,802.8 12,087.2 11,575.3 11,166.4 14,133.5 14,551.9 Pro-Ration Reimburse % FY 2009 FY 2010 FY 2011 FY 2012 FY 2013 FY 2014 FY 2015 FY 2016 Sp Ed Personnel 97% 100% 100% 100% 100% 100% 98% 100% Sp Ed Funding for Children 100% 100% 100% 100% 100% 100% 98% 100% Sp Ed Private Tuition 96% 99% 100% 87% 91% 94% 94% 94% Sp Ed Summer School 100% 100% 100% 100% 96% 81% 75% 84% Sp Ed Transportation 97% 100% 100% 100% 99% 97% 95% 97% Reg/Voc Transportation 100% 100% 74% 77% 76% 74% 71% 70% Ill Free Lunch/Breakfast 91% 83% 78% 73% 38% 36% 21% 22% Sp Ed Orphanage 100% 100% 100% 100% 100% 100% 100% 100% Reg Ed Orphanage 100% 100% 100% 100% 100% 100% 100% 100%
Notes: • Current fiscal year appropriations pay previous year claims, except for IL Free Lunch/Breakfast, Orphanage, and Bilingual programs.• Appropriation and claim amounts include amounts funded through the Chicago Block Grants.
13
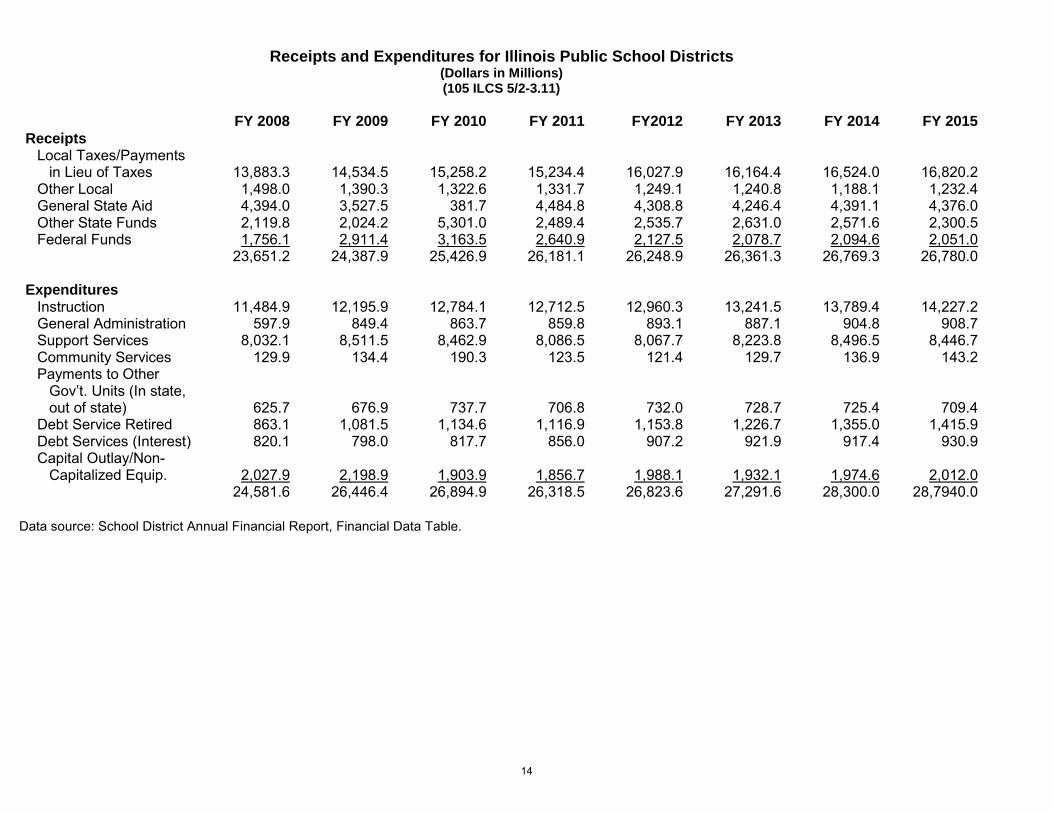
Receipts and Expenditures for Illinois Public School Districts (Dollars in Millions) (105 ILCS 5/2-3.11)
FY 2008 FY 2009 FY 2010 FY 2011 FY2012 FY 2013 FY 2014 FY 2015 Receipts
Local Taxes/Payments in Lieu of Taxes 13,883.3 14,534.5 15,258.2 15,234.4 16,027.9 16,164.4 16,524.0 16,820.2
Other Local 1,498.0 1,390.3 1,322.6 1,331.7 1,249.1 1,240.8 1,188.1 1,232.4 General State Aid 4,394.0 3,527.5 381.7 4,484.8 4,308.8 4,246.4 4,391.1 4,376.0 Other State Funds 2,119.8 2,024.2 5,301.0 2,489.4 2,535.7 2,631.0 2,571.6 2,300.5 Federal Funds 1,756.1 2,911.4 3,163.5 2,640.9 2,127.5 2,078.7 2,094.6 2,051.0
23,651.2 24,387.9 25,426.9 26,181.1 26,248.9 26,361.3 26,769.3 26,780.0 Expenditures
Instruction 11,484.9 12,195.9 12,784.1 12,712.5 12,960.3 13,241.5 13,789.4 14,227.2 General Administration 597.9 849.4 863.7 859.8 893.1 887.1 904.8 908.7 Support Services 8,032.1 8,511.5 8,462.9 8,086.5 8,067.7 8,223.8 8,496.5 8,446.7 Community Services 129.9 134.4 190.3 123.5 121.4 129.7 136.9 143.2 Payments to Other
Gov’t. Units (In state, out of state) 625.7 676.9 737.7 706.8 732.0 728.7 725.4 709.4
Debt Service Retired 863.1 1,081.5 1,134.6 1,116.9 1,153.8 1,226.7 1,355.0 1,415.9 Debt Services (Interest) 820.1 798.0 817.7 856.0 907.2 921.9 917.4 930.9 Capital Outlay/Non-
Capitalized Equip. 2,027.9 2,198.9 1,903.9 1,856.7 1,988.1 1,932.1 1,974.6 2,012.0 24,581.6 26,446.4 26,894.9 26,318.5 26,823.6 27,291.6 28,300.0 28,7940.0
Data source: School District Annual Financial Report, Financial Data Table.
14

Public Schools Finance Statistics (105 ILCS 5/2-3.11)
District Type
Per Capita Tuition Charge
Operating Expense per Pupil
FY 2015 Elementary $10,925 $12,173
Secondary 15,398 16,494 Unit 10,382 12,354 ALL DISTRICTS 11,133 12,808 Chicago SD 299 (10 mos.) 12,229 15,310
FY 2014 Elementary $10,450 $11,846 Secondary 14,900 16,165 Unit 9,947 12,096 ALL DISTRICTS 10,677 12,521 Chicago SD 299 (10 mos.) 11,707 15,120
FY 2013 Elementary $10,161 $11,594 Secondary 14,259 15,621 Unit 9,363 11,532 ALL DISTRICTS 10,167 12,045 Chicago SD 299 (10 mos.) 10,412 13,791
FY 2012 Elementary $10,105 $11,457 Secondary 13,891 15,138 Unit 9,026 11,338 ALL DISTRICTS 9,911 11,842 Chicago SD 299 (10 mos.) 9,462 13,433
FY 2011 Elementary $9,560 $11,190 Secondary 13,241 14,681 Unit 8,633 11,262 ALL DISTRICTS 9,440 11,664 Chicago SD 299 (10 mos.) 9,127 13,616
District types:
Elementary School Districts: PreK-8 Secondary (High) School Districts: 9-12 Unit School Districts: PreK-12
Data source: School Business Services OEPP/PCTC/ADA State Totals Historical File.
15
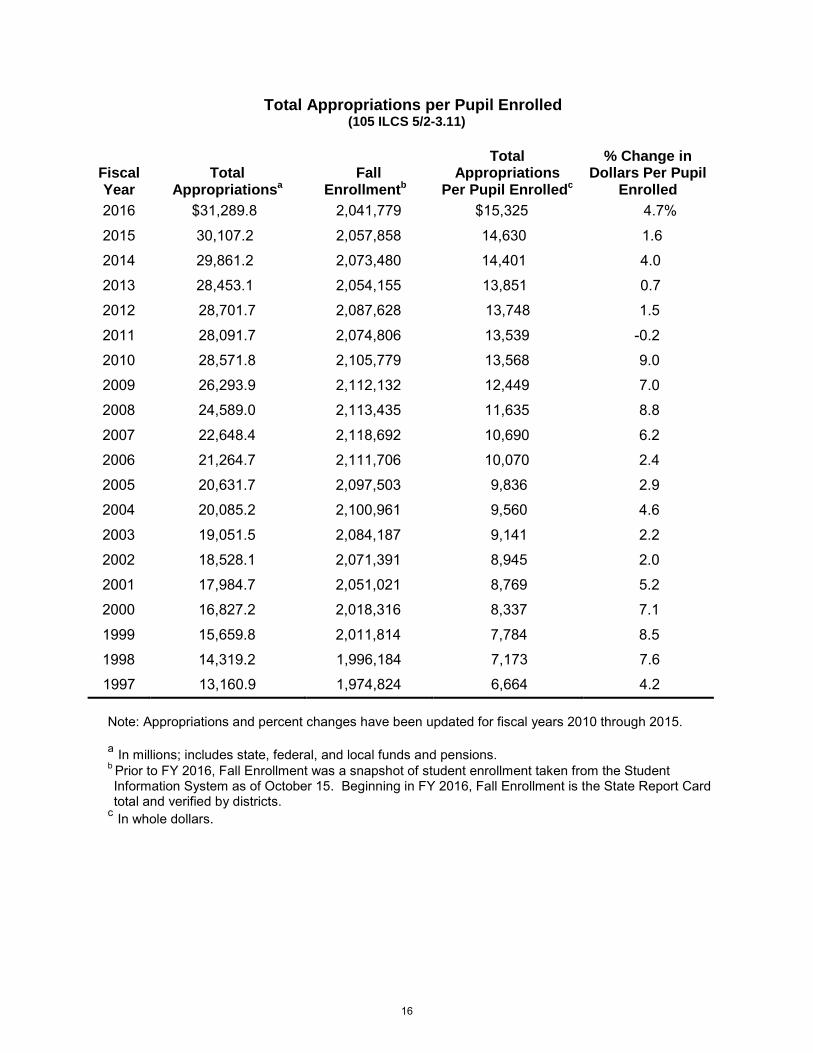
Total Appropriations per Pupil Enrolled (105 ILCS 5/2-3.11)
Fiscal Year
Total Appropriationsa
Fall Enrollmentb
Total Appropriations
Per Pupil Enrolledc
% Change in Dollars Per Pupil
Enrolled 2016 $31,289.8 2,041,779 $15,325 4.7%
2015 30,107.2 2,057,858 14,630 1.6
2014 29,861.2 2,073,480 14,401 4.0
2013 28,453.1 2,054,155 13,851 0.7
2012 28,701.7 2,087,628 13,748 1.5
2011 28,091.7 2,074,806 13,539 -0.2
2010 28,571.8 2,105,779 13,568 9.0
2009 26,293.9 2,112,132 12,449 7.0
2008 24,589.0 2,113,435 11,635 8.8
2007 22,648.4 2,118,692 10,690 6.2
2006 21,264.7 2,111,706 10,070 2.4
2005 20,631.7 2,097,503 9,836 2.9
2004 20,085.2 2,100,961 9,560 4.6
2003 19,051.5 2,084,187 9,141 2.2
2002 18,528.1 2,071,391 8,945 2.0
2001 17,984.7 2,051,021 8,769 5.2
2000 16,827.2 2,018,316 8,337 7.1
1999 15,659.8 2,011,814 7,784 8.5
1998 14,319.2 1,996,184 7,173 7.6
1997 13,160.9 1,974,824 6,664 4.2 Note: Appropriations and percent changes have been updated for fiscal years 2010 through 2015. a In millions; includes state, federal, and local funds and pensions. b Prior to FY 2016, Fall Enrollment was a snapshot of student enrollment taken from the Student Information System as of October 15. Beginning in FY 2016, Fall Enrollment is the State Report Card total and verified by districts.
c In whole dollars.
16
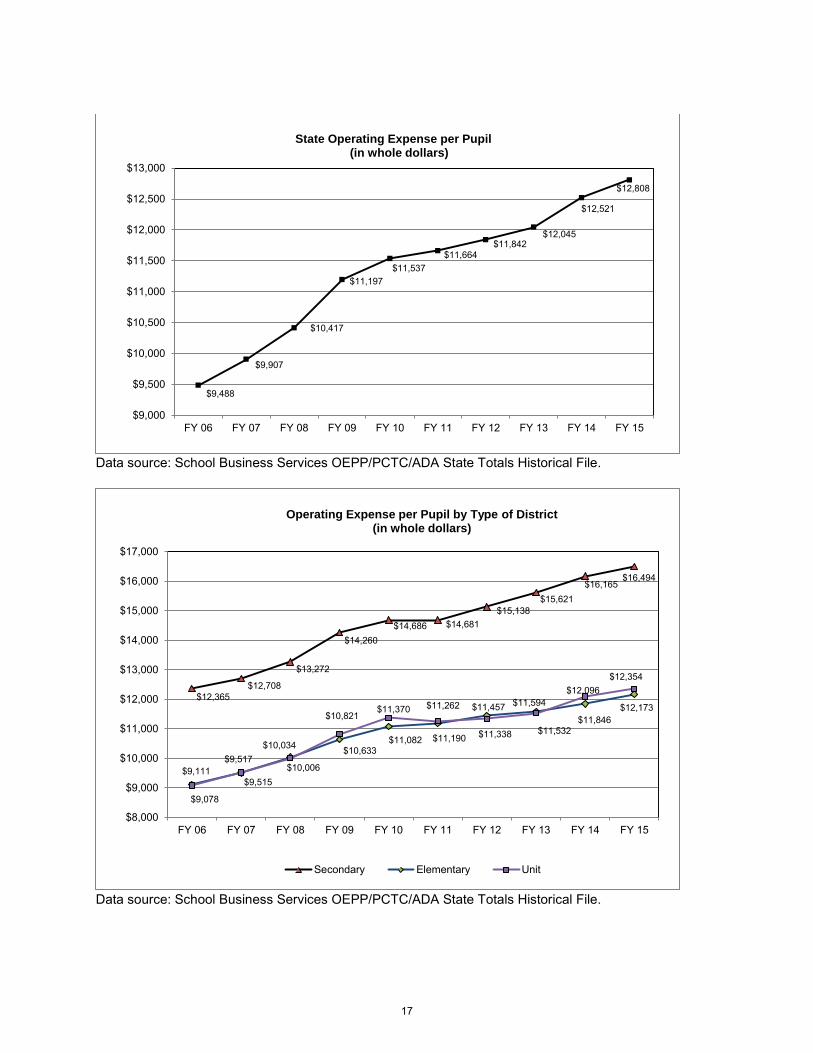
Data source: School Business Services OEPP/PCTC/ADA State Totals Historical File.
Data source: School Business Services OEPP/PCTC/ADA State Totals Historical File.
$9,488
$9,907
$10,417
$11,197 $11,537
$11,664 $11,842
$12,045
$12,521
$12,808
$9,000
$9,500
$10,000
$10,500
$11,000
$11,500
$12,000
$12,500
$13,000
FY 06 FY 07 FY 08 FY 09 FY 10 FY 11 FY 12 FY 13 FY 14 FY 15
State Operating Expense per Pupil (in whole dollars)
$12,365 $12,708
$13,272
$14,260 $14,686 $14,681
$15,138 $15,621
$16,165 $16,494
$9,111 $9,517
$10,034 $10,633 $11,082 $11,190
$11,457 $11,594
$11,846 $12,173
$9,078
$9,515 $10,006
$10,821 $11,370 $11,262
$11,338 $11,532
$12,096 $12,354
$8,000
$9,000
$10,000
$11,000
$12,000
$13,000
$14,000
$15,000
$16,000
$17,000
FY 06 FY 07 FY 08 FY 09 FY 10 FY 11 FY 12 FY 13 FY 14 FY 15
Secondary Elementary Unit
Operating Expense per Pupil by Type of District (in whole dollars)
17

$31,289.8
$30,107.2 $29,861.2
$28,453.1 $28,701.5 $28,091.7 $28,571.8
$26,293.9
$24,589.0
$22,648.4
$20,000.0
$22,000.0
$24,000.0
$26,000.0
$28,000.0
$30,000.0
$32,000.0
FY16FY15FY14FY13FY12FY11FY10FY09FY08FY07
Total Funding Elementary and Secondary Education
Dol
lars
in M
illio
ns
$3,149.1 $2,976.5 $3,007.4 $2,976.7 $3,580.8 $3,460.8 $3,637.4 $3,812.7
$2,165.7 $2,174.1
$10,869.5 $10,337.0 $10,293.4
$9,400.8 $9,305.3 $9,286.8 $9,897.3
$7,992.7 $8,519.6 $7,492.1
$17,271.2 $16,793.7 $16,560.4
$16,075.6 $15,815.4 $15,344.1 $15,037.0 $14,488.5
$13,903.7 $12,982.2
$0.0
$2,000.0
$4,000.0
$6,000.0
$8,000.0
$10,000.0
$12,000.0
$14,000.0
$16,000.0
$18,000.0
$20,000.0
FY16FY15FY14FY13FY12FY11FY10FY09FY08FY07Federal State Local
State, Local and Federal Funding Elementary and Secondary Education
Dol
lars
in M
illio
ns
18
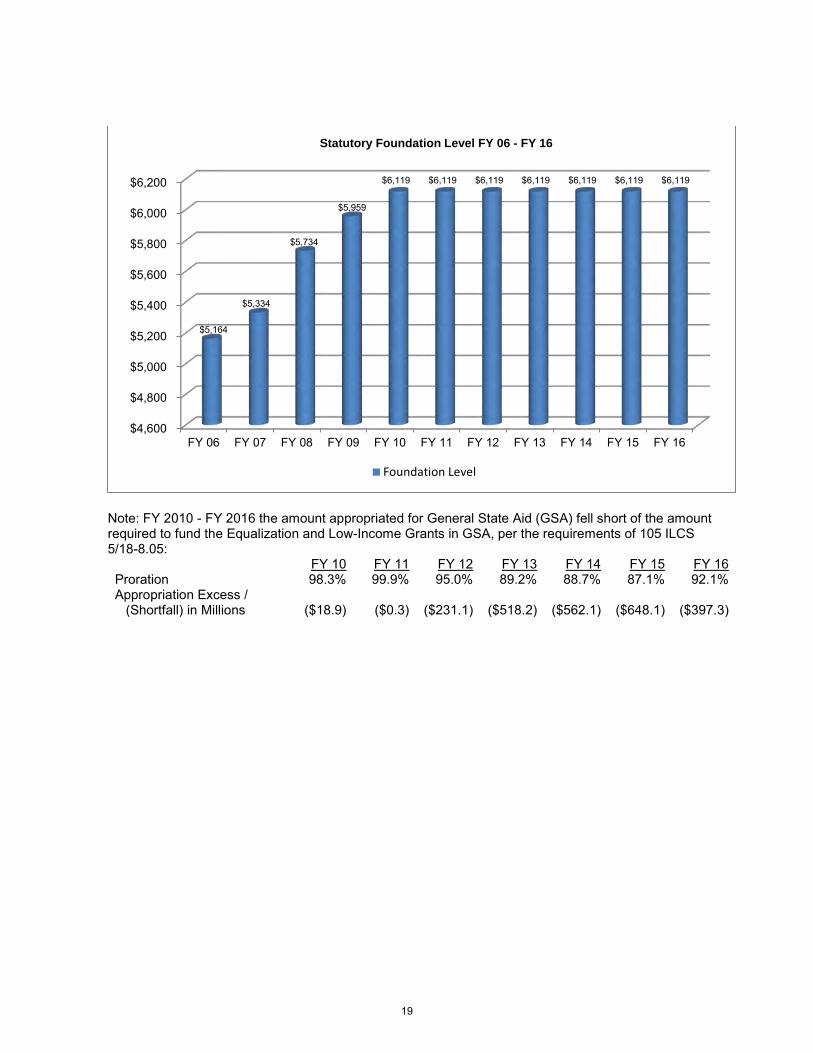
Note: FY 2010 - FY 2016 the amount appropriated for General State Aid (GSA) fell short of the amount required to fund the Equalization and Low-Income Grants in GSA, per the requirements of 105 ILCS 5/18-8.05: FY 10 FY 11 FY 12 FY 13 FY 14 FY 15 FY 16 Proration 98.3% 99.9% 95.0% 89.2% 88.7% 87.1% 92.1% Appropriation Excess /
(Shortfall) in Millions ($18.9) ($0.3) ($231.1) ($518.2) ($562.1) ($648.1) ($397.3)
$4,600
$4,800
$5,000
$5,200
$5,400
$5,600
$5,800
$6,000
$6,200
FY 06 FY 07 FY 08 FY 09 FY 10 FY 11 FY 12 FY 13 FY 14 FY 15 FY 16
$5,164
$5,334
$5,734
$5,959
$6,119 $6,119 $6,119 $6,119 $6,119 $6,119 $6,119
Statutory Foundation Level FY 06 - FY 16
Foundation Level
19
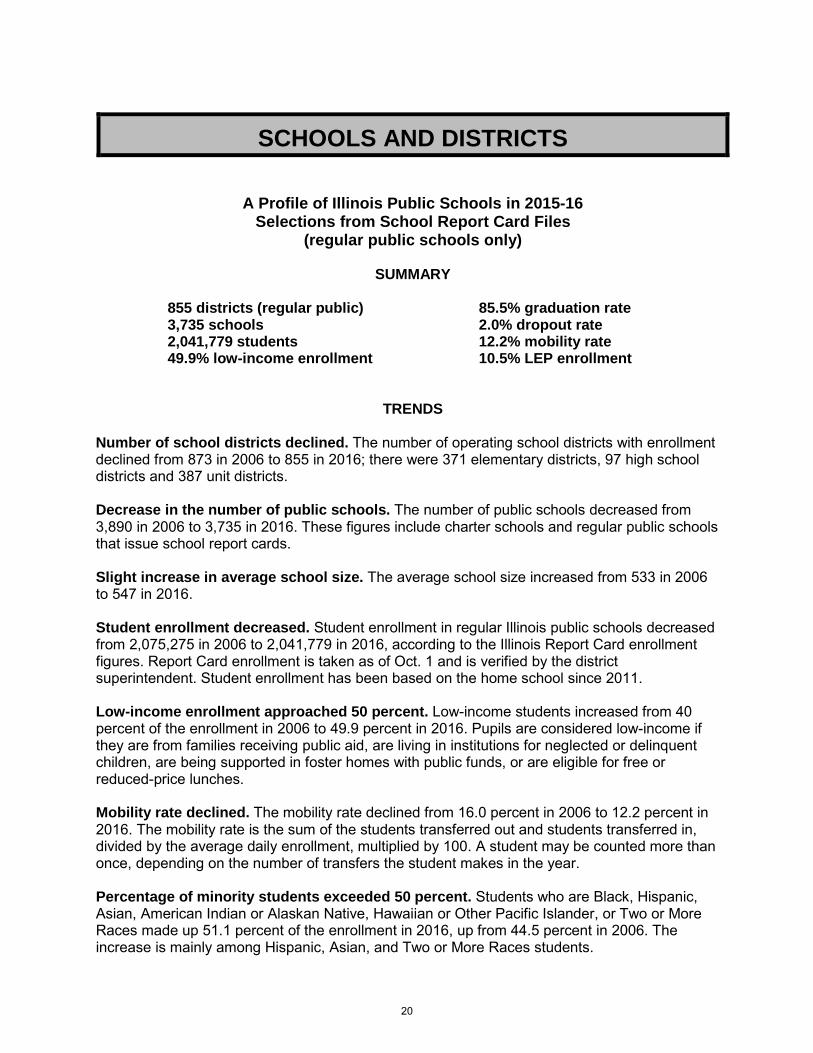
SCHOOLS AND DISTRICTS
A Profile of Illinois Public Schools in 2015-16 Selections from School Report Card Files
(regular public schools only)
SUMMARY
855 districts (regular public) 85.5% graduation rate 3,735 schools 2.0% dropout rate 2,041,779 students 12.2% mobility rate 49.9% low-income enrollment 10.5% LEP enrollment
TRENDS
Number of school districts declined. The number of operating school districts with enrollment declined from 873 in 2006 to 855 in 2016; there were 371 elementary districts, 97 high school districts and 387 unit districts.
Decrease in the number of public schools. The number of public schools decreased from 3,890 in 2006 to 3,735 in 2016. These figures include charter schools and regular public schools that issue school report cards.
Slight increase in average school size. The average school size increased from 533 in 2006 to 547 in 2016.
Student enrollment decreased. Student enrollment in regular Illinois public schools decreased from 2,075,275 in 2006 to 2,041,779 in 2016, according to the Illinois Report Card enrollment figures. Report Card enrollment is taken as of Oct. 1 and is verified by the district superintendent. Student enrollment has been based on the home school since 2011.
Low-income enrollment approached 50 percent. Low-income students increased from 40 percent of the enrollment in 2006 to 49.9 percent in 2016. Pupils are considered low-income if they are from families receiving public aid, are living in institutions for neglected or delinquent children, are being supported in foster homes with public funds, or are eligible for free or reduced-price lunches.
Mobility rate declined. The mobility rate declined from 16.0 percent in 2006 to 12.2 percent in 2016. The mobility rate is the sum of the students transferred out and students transferred in, divided by the average daily enrollment, multiplied by 100. A student may be counted more than once, depending on the number of transfers the student makes in the year.
Percentage of minority students exceeded 50 percent. Students who are Black, Hispanic, Asian, American Indian or Alaskan Native, Hawaiian or Other Pacific Islander, or Two or More Races made up 51.1 percent of the enrollment in 2016, up from 44.5 percent in 2006. The increase is mainly among Hispanic, Asian, and Two or More Races students.
20
LEP students increased in last decade. The percentage of Limited English Proficient (LEP) students increased from 6.6 percent in 2006 to 10.5 percent in 2016. LEP students include those who are eligible for bilingual education.
Dropout rate declined. The dropout rate declined from 3.5 percent in 2006 to 2.0 percent in 2016. Dropouts include students in grades 9-12 whose names have been removed from the district roster for any reason other than death, extended illness, graduation/completion of a program of studies, transfer to another school, or expulsion.
Increase in chronic truancy rate. The chronic truancy rate was 9.8 percent in 2016, compared to 2.2 percent reported for 2006. Chronic truants include students subject to compulsory attendance who have been absent without valid cause for 5 percent (nine or more) of the past 180 school days. The definition of chronic truants was changed in 2011. Prior to 2011, chronic truants were defined as missing 10 percent of the previous 180 days.
Average class size declined at most levels. Between 2006 and 2016, the average class sizes for:
Kindergarten decreased from 20.9 to 20.4 Grade 1 decreased from 21.5 to 21.4 Grade 3 increased from 22.1 to 22.5 Grade 6 decreased from 23.4 to 22.7 Grade 8 decreased from 22.7 to 21.8 High School (grades 9-12) decreased from 19.7 to 19.0
Percentage of Non-White teachers increased the last decade. Non-White accounted for 16.7 percent of the classroom teachers in 2016 compared to 15 percent in 2006. Non-White teachers include those who are Black, Hispanic, Asian, American Indian or Alaskan Native, Hawaiian or Other Pacific Islander, Two or More Races, or unknown.
Slight increase in the percentage of male classroom teachers. There is an upward trend in the percentage of male teachers, increasing from 23.1 percent of the teaching force in 2006 to 23.3 percent in 2016.
Percentage of teachers with graduate degrees increased. In 2016, teachers who had a master’s degree or higher accounted for 61.4 percent of the classroom teachers in Illinois public schools, up from 50.6 percent in 2006.
Pupil-teacher ratio declined at the elementary level and was static at the secondary level. Between 2006 and 2016, the elementary pupil-teacher ratio declined from 19.1:1 to 18.7:1 while the secondary pupil-teacher ratio was unchanged at 18.9:1.
Graduation rate decreased. The four-year graduation rate in 2016 was 85.5 percent, down from 87.8 percent in 2006.
21
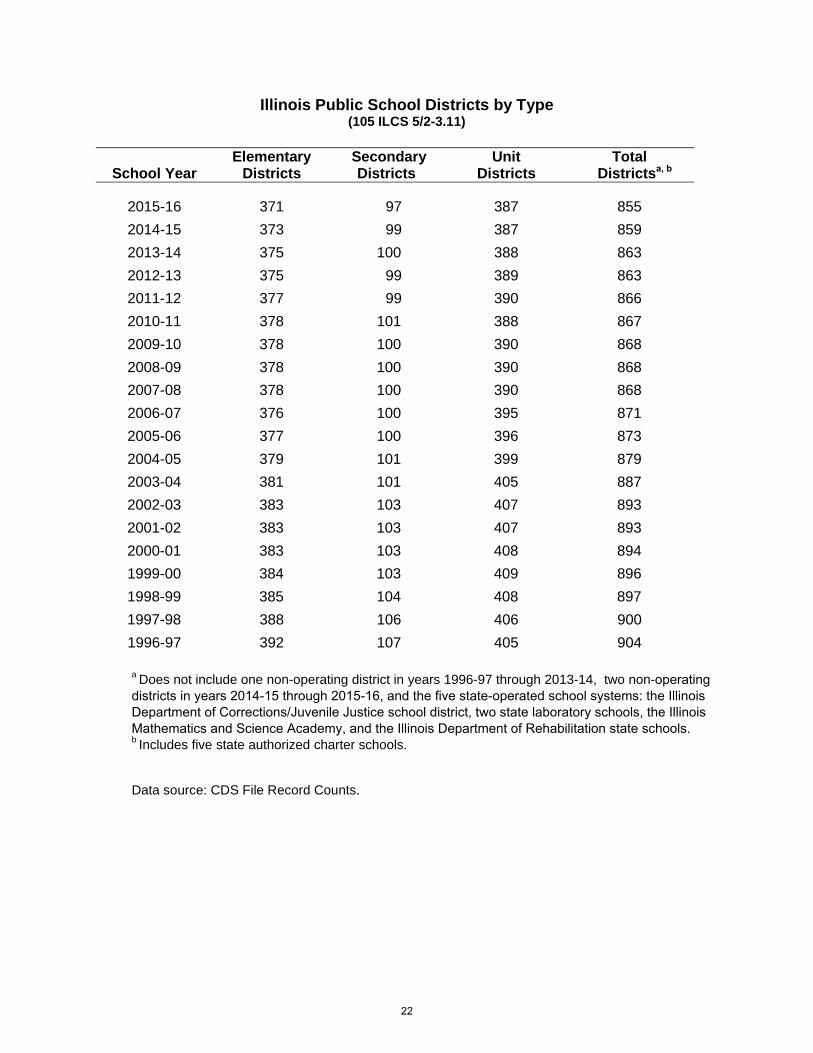
Illinois Public School Districts by Type (105 ILCS 5/2-3.11)
School Year Elementary
Districts Secondary Districts
Unit Districts
Total Districtsa, b
2015-16 371 97 387 855 2014-15 373 99 387 859 2013-14 375 100 388 863 2012-13 375 99 389 863 2011-12 377 99 390 866 2010-11 378 101 388 867 2009-10 378 100 390 868 2008-09 378 100 390 868 2007-08 378 100 390 868 2006-07 376 100 395 871 2005-06 377 100 396 873 2004-05 379 101 399 879 2003-04 381 101 405 887 2002-03 383 103 407 893 2001-02 383 103 407 893 2000-01 383 103 408 894 1999-00 384 103 409 896 1998-99 385 104 408 897 1997-98 388 106 406 900 1996-97 392 107 405 904
a Does not include one non-operating district in years 1996-97 through 2013-14, two non-operating districts in years 2014-15 through 2015-16, and the five state-operated school systems: the Illinois Department of Corrections/Juvenile Justice school district, two state laboratory schools, the Illinois Mathematics and Science Academy, and the Illinois Department of Rehabilitation state schools. b Includes five state authorized charter schools.
Data source: CDS File Record Counts.
22

Comparison of Public School Districts by Type and Enrollment 2005-06 and 2015-16
(105 ILCS 5/2-3.11)
District Elementary
Districts Secondary Districts
Unit Districts Total Districts*
Enrollment 05-06 15-16 05-06 15-16 05-06 15-16 05-06 15-16
25,000 or more 0 0 0 0 4 5 4 5 10,000 to 24,999 4 4 2 2 13 12 19 18 5,000 to 9,999 9 10 12 11 25 25 46 46 2,500 to 4,999 55 50 22 25 33 33 110 108 1,000 to 2,499 99 100 28 23 117 107 244 230 600 to 999 56 58 17 15 89 83 162 156 300 to 599 55 53 10 15 93 95 158 163 Fewer than 300 99 94 9 6 22 26 130 129 Total 377 369 100 97 396 386 873 852
* Does not include one non-operating district, Department of Corrections/Juvenile Justice school district, state-operated districts, special education districts, and state charter districts. Data sources: Fall Housing Enrollment from School Report Card, CDS File Record Counts.
Comparison of Public and Nonpublic Attendance Centers 2005-06 and 2015-16
(105 ILCS 5/2-3.11)
Public Attendance Centers Nonpublic Attendance Centers 05-06 15-16 05-06 15-16 Elementary 2,609 2,465 Elementary* 898 704 Junior High 613 604 Secondary 117 117 Secondary 665 668 Unit 138 99 Special Education and Others 393 426 Special Education 106 13 Total 4,280 4,163 Total 1,380 933 * Includes Junior High. Data sources: Fall Housing Enrollment from School Report Card, CDS File Record Counts.
23

Public School Recognition Committee Act or Omissions Status Report for the 2015-16 School Year
(105 ILCS 5/1A-4) Region Facility Final
Assignment Violation Date of
District Notification
Boone/Winnebago (04) Rockford SD 205
Recognized Pending Further Review
Teacher licensure
June 20, 2016, via U.S. Mail, certified, return-receipt
DuPage (19) Addison SD 4 Recognized Pending Further Review
Various (refer to ROE evaluation)
June 20, 2016, via U.S. Mail, certified, return-receipt
DuPage (19) SD 45 DuPage County
Recognized Pending Further Review
Various (refer to ROE evaluation)
June 20, 2016, via U.S. Mail, certified, return-receipt
DuPage (19) Cass SD 63 Recognized Pending Further Review
Various (refer to ROE evaluation)
June 20, 2016, via U.S. Mail, certified, return-receipt
DuPage (19) CHSD 99 Recognized Pending Further Review
Various (refer to ROE evaluation)
June 20, 2016, via U.S. Mail, certified, return-receipt
Franklin/Johnson/Massac/ Williamson (21)
Frankfort CUSD 168
Recognized Pending Further Review
Staff background check(s)
June 30, 2016, via U.S. Mail, certified, return-receipt
Bureau/Henry/Stark (28) Cherry SD 92 Recognized Pending Further Review
Various (refer to ROE evaluation)
June 20, 2016, via U.S. Mail, certified, return-receipt
Bureau/Henry/Stark (28) Dalzell SD 98 Recognized Pending Further Review
Various (refer to ROE evaluation)
June 20, 2016, via U.S. Mail, certified, return-receipt
24
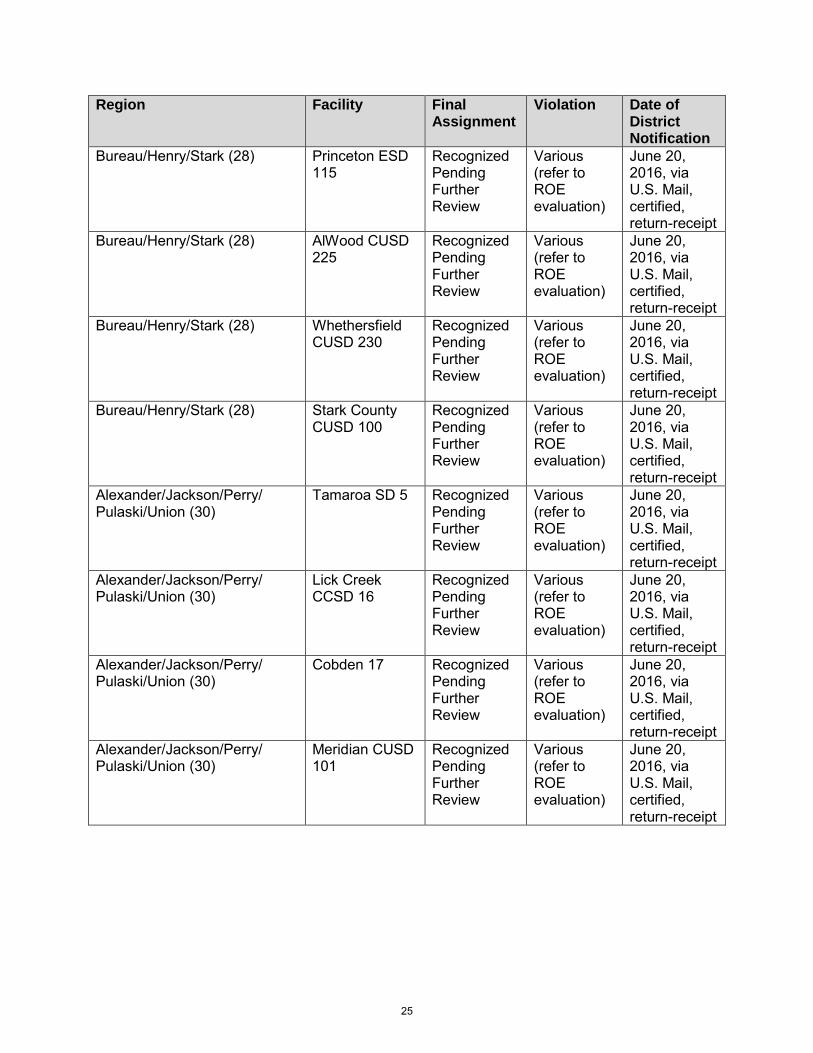
Region Facility Final Assignment
Violation Date of District Notification
Bureau/Henry/Stark (28) Princeton ESD 115
Recognized Pending Further Review
Various (refer to ROE evaluation)
June 20, 2016, via U.S. Mail, certified, return-receipt
Bureau/Henry/Stark (28) AlWood CUSD 225
Recognized Pending Further Review
Various (refer to ROE evaluation)
June 20, 2016, via U.S. Mail, certified, return-receipt
Bureau/Henry/Stark (28) Whethersfield CUSD 230
Recognized Pending Further Review
Various (refer to ROE evaluation)
June 20, 2016, via U.S. Mail, certified, return-receipt
Bureau/Henry/Stark (28) Stark County CUSD 100
Recognized Pending Further Review
Various (refer to ROE evaluation)
June 20, 2016, via U.S. Mail, certified, return-receipt
Alexander/Jackson/Perry/ Pulaski/Union (30)
Tamaroa SD 5 Recognized Pending Further Review
Various (refer to ROE evaluation)
June 20, 2016, via U.S. Mail, certified, return-receipt
Alexander/Jackson/Perry/ Pulaski/Union (30)
Lick Creek CCSD 16
Recognized Pending Further Review
Various (refer to ROE evaluation)
June 20, 2016, via U.S. Mail, certified, return-receipt
Alexander/Jackson/Perry/ Pulaski/Union (30)
Cobden 17 Recognized Pending Further Review
Various (refer to ROE evaluation)
June 20, 2016, via U.S. Mail, certified, return-receipt
Alexander/Jackson/Perry/ Pulaski/Union (30)
Meridian CUSD 101
Recognized Pending Further Review
Various (refer to ROE evaluation)
June 20, 2016, via U.S. Mail, certified, return-receipt
25
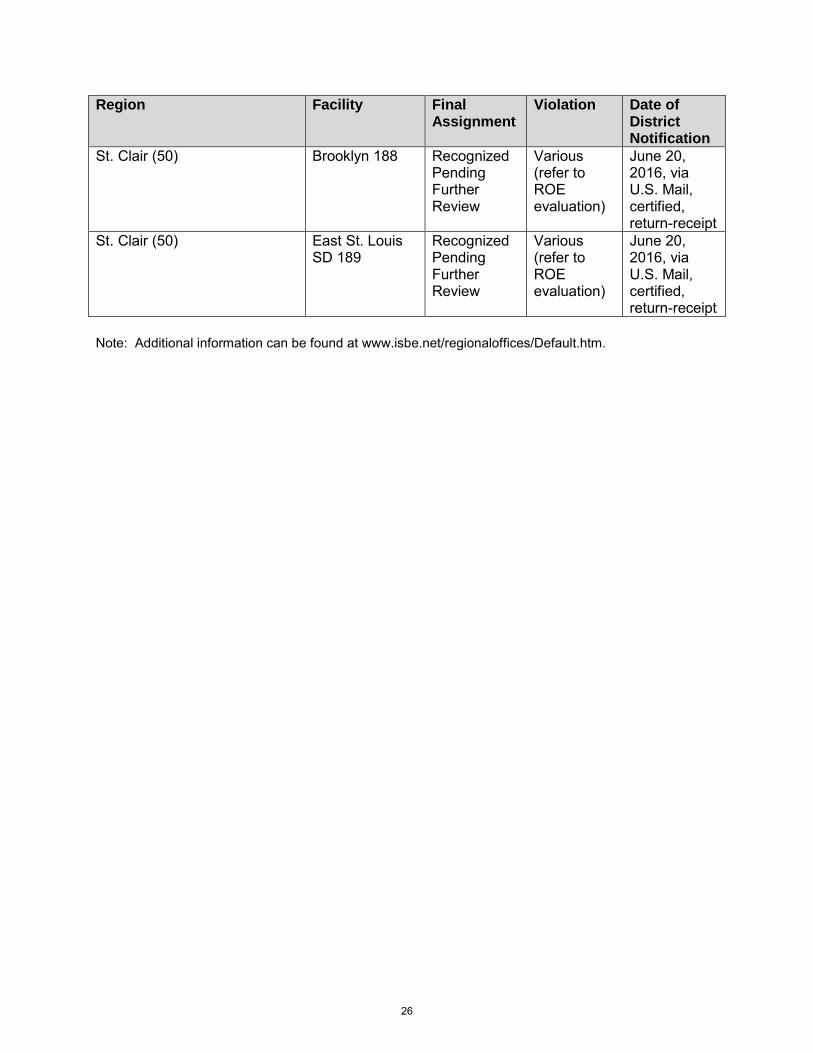
Region Facility Final Assignment
Violation Date of District Notification
St. Clair (50) Brooklyn 188 Recognized Pending Further Review
Various (refer to ROE evaluation)
June 20, 2016, via U.S. Mail, certified, return-receipt
St. Clair (50) East St. Louis SD 189
Recognized Pending Further Review
Various (refer to ROE evaluation)
June 20, 2016, via U.S. Mail, certified, return-receipt
Note: Additional information can be found at www.isbe.net/regionaloffices/Default.htm.
26
Interim Superintendents for the 2015-16 School Year (105 ILCS 5/10-21.4)
The School Code requires all school districts “to employ a superintendent who shall have charge of the administration of the schools under the direction of the board of education” (105 ILCS 5/10-21.4). The School Code does not, however, further define the ways in which school districts are permitted to employ a superintendent. For example, the School Code does not require, on its face, that a school district superintendent be hired “full-time,” nor does the School Code, on its face, prohibit a school district from retaining a retired district superintendent to work in that school district for less than 120 days in a school year.
ISBE has, despite the lack of clarity in the law, determined what is and what is not an acceptable employment practice and has historically taken action pursuant to Section 1.20 of its administrative rules (23 Ill. Admin. Code 1.20) to reduce the recognition status of school districts that have not shown a commitment to employing a full-time district superintendent. Regional superintendents have ensured compliance consistency.
In order to clarify the responsibilities of school districts for employing a full-time district superintendent, ISBE conducted a rulemaking in fall 2010 to define the circumstances under which a superintendent must be employed. The Joint Committee on Administrative Rules subsequently objected to the proposed modifications, citing ISBE’s lack of statutory authority to limit employment. ISBE subsequently agreed to withdraw the rulemaking. Therefore, until the issue is clarified in statute, ISBE will not take compliance action against a school district that chooses to employ either an interim superintendent or a superintendent on less than a full-time basis.
27
STUDENTS
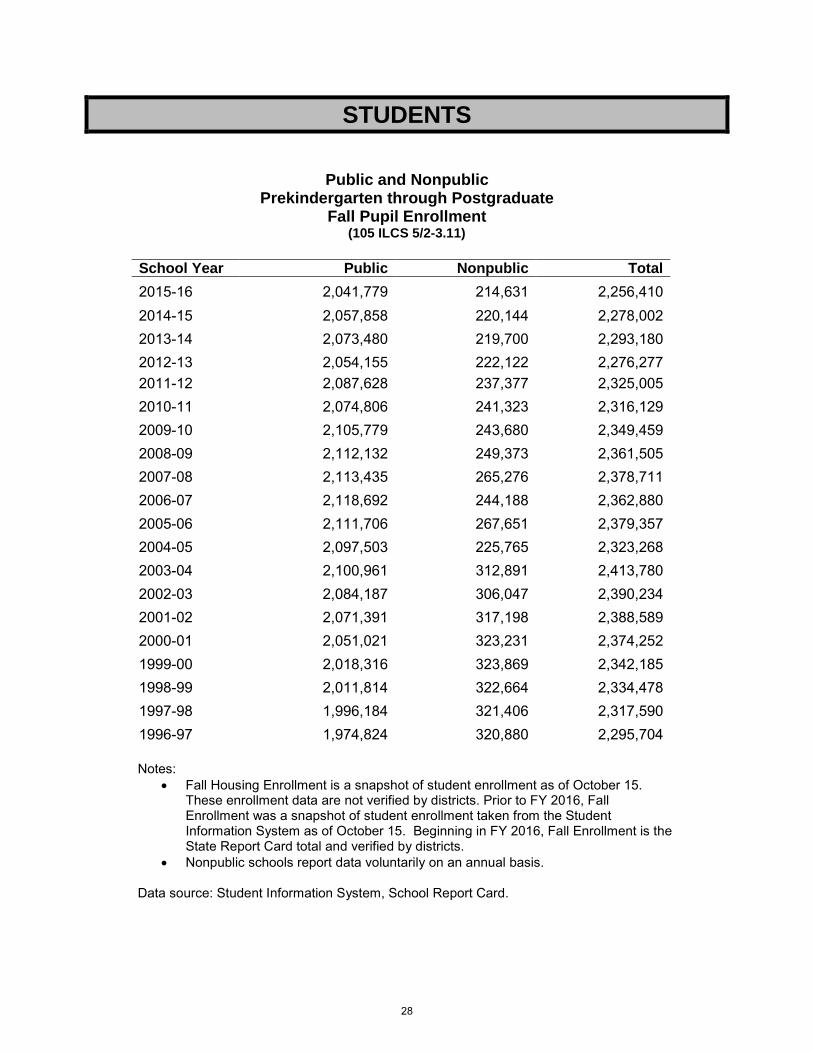
Public and Nonpublic Prekindergarten through Postgraduate
Fall Pupil Enrollment (105 ILCS 5/2-3.11)
School Year Public Nonpublic Total 2015-16 2,041,779 214,631 2,256,410 2014-15 2,057,858 220,144 2,278,002 2013-14 2,073,480 219,700 2,293,180 2012-13 2,054,155 222,122 2,276,277 2011-12 2,087,628 237,377 2,325,005 2010-11 2,074,806 241,323 2,316,129 2009-10 2,105,779 243,680 2,349,459 2008-09 2,112,132 249,373 2,361,505 2007-08 2,113,435 265,276 2,378,711 2006-07 2,118,692 244,188 2,362,880 2005-06 2,111,706 267,651 2,379,357 2004-05 2,097,503 225,765 2,323,268 2003-04 2,100,961 312,891 2,413,780 2002-03 2,084,187 306,047 2,390,234 2001-02 2,071,391 317,198 2,388,589 2000-01 2,051,021 323,231 2,374,252 1999-00 2,018,316 323,869 2,342,185 1998-99 2,011,814 322,664 2,334,478 1997-98 1,996,184 321,406 2,317,590 1996-97 1,974,824 320,880 2,295,704
Notes: • Fall Housing Enrollment is a snapshot of student enrollment as of October 15.
These enrollment data are not verified by districts. Prior to FY 2016, FallEnrollment was a snapshot of student enrollment taken from the StudentInformation System as of October 15. Beginning in FY 2016, Fall Enrollment is theState Report Card total and verified by districts.
• Nonpublic schools report data voluntarily on an annual basis.
Data source: Student Information System, School Report Card.
28

Comparison of Public School Enrollment 2005-06 and 2015-16
(105 ILCS 5/2-3.11)
Grade Level 2005-06 2015-16 Percent Change
Pre-K 56,525 48,785 -13.7 Pre-K Bilingual 1,345 15,854 1,078.7 Pre-K Special Ed. 14,261 22,950 60.9 Kindergarten 147,726 135,924 -8.0 1st Grade 154,061 144,616 -6.1 2nd Grade 153,558 149,112 -2.9 3rd Grade 155,155 153,015 -1.4 4th Grade 154,372 149,373 -3.2 5th Grade 158,822 149,167 -6.1 6th Grade 162,949 152,526 -6.4 7th Grade 160,362 150,968 -5.9 8th Grade 160,911 150,193 -6.7 Elementary Total 1,480,047 1,422,483 -3.9
9th Grade 179,703 163,669 -8.9 10th Grade 165,477 159,268 -3.8 11th Grade 147,500 148,362 0.6 12th Grade 138,518 147,993 6.8 Post Graduates* 461 * * Ungraded n/a 4 0.0 Secondary Total 631,659 619,292 -2.0 Total Elementary & Secondary 2,111,706 2,041,779 -3.3
* Reporting of postgraduates ended in FY 2009.
Notes:• Public schools include Regional Office of Education, Department of Corrections/ Juvenile
Justice, special education, and regular education schools.• Prior to FY 2016, Fall Enrollment was a snapshot of student enrollment taken from the
Student Information System as of October 15. Beginning in FY 2016, Fall Enrollment is theState Report Card total and verified by districts.
• 2016 includes students in other sites.
Data sources: Student Information System, School Report Card.
29
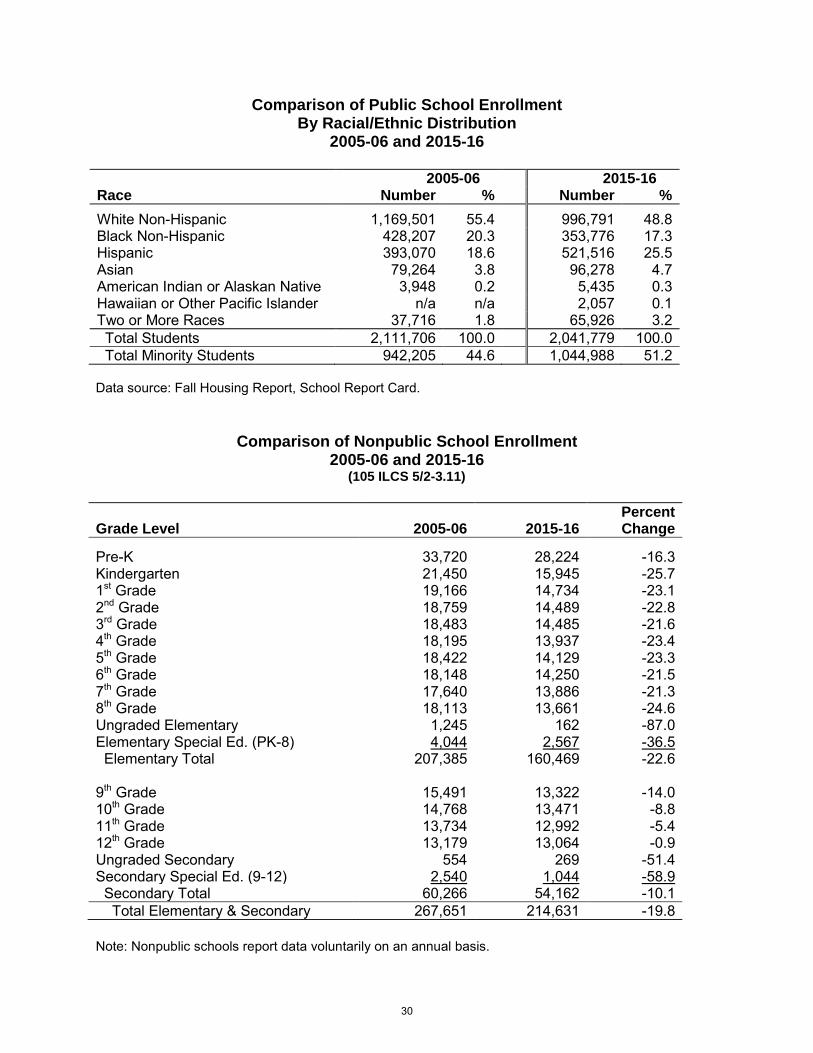
Comparison of Public School Enrollment By Racial/Ethnic Distribution
2005-06 and 2015-16
2005-06 2015-16 Race Number % Number % White Non-Hispanic 1,169,501 55.4 996,791 48.8 Black Non-Hispanic 428,207 20.3 353,776 17.3 Hispanic 393,070 18.6 521,516 25.5 Asian 79,264 3.8 96,278 4.7 American Indian or Alaskan Native 3,948 0.2 5,435 0.3 Hawaiian or Other Pacific Islander n/a n/a 2,057 0.1 Two or More Races 37,716 1.8 65,926 3.2 Total Students 2,111,706 100.0 2,041,779 100.0 Total Minority Students 942,205 44.6 1,044,988 51.2
Data source: Fall Housing Report, School Report Card.
Comparison of Nonpublic School Enrollment 2005-06 and 2015-16
(105 ILCS 5/2-3.11)
Grade Level 2005-06 2015-16 Percent Change
Pre-K 33,720 28,224 -16.3 Kindergarten 21,450 15,945 -25.7 1st Grade 19,166 14,734 -23.1 2nd Grade 18,759 14,489 -22.8 3rd Grade 18,483 14,485 -21.6 4th Grade 18,195 13,937 -23.4 5th Grade 18,422 14,129 -23.3 6th Grade 18,148 14,250 -21.5 7th Grade 17,640 13,886 -21.3 8th Grade 18,113 13,661 -24.6 Ungraded Elementary 1,245 162 -87.0 Elementary Special Ed. (PK-8) 4,044 2,567 -36.5 Elementary Total 207,385 160,469 -22.6
9th Grade 15,491 13,322 -14.0 10th Grade 14,768 13,471 -8.8 11th Grade 13,734 12,992 -5.4 12th Grade 13,179 13,064 -0.9 Ungraded Secondary 554 269 -51.4 Secondary Special Ed. (9-12) 2,540 1,044 -58.9 Secondary Total 60,266 54,162 -10.1 Total Elementary & Secondary 267,651 214,631 -19.8
Note: Nonpublic schools report data voluntarily on an annual basis.
30

Limited English Proficient Enrollments By Native Language 2015-16
Native Language Chicago SD 299 Non-Chicago Statewide Total
Number Number Number Spanish 52,712 103,352 156,064 Arabic 1,339 5,440 6,779 Polish 893 5,205 6,098 Urdu 804 2,253 3,057 Pilipino (Tagalog) 376 1,525 1,901 Gujarati 196 1,531 1,727 Mandarin (Chinese) 413 1,219 1,632 Russian 120 1,349 1,469 Vietnamese 362 891 1,253 French 245 995 1,240 Cantonese (Chinese) 841 341 1,182 Korean 40 968 1,008 Hindi 91 912 1,003 Telugu (Telegu) 52 935 987 Ukrainian 272 562 834 Assyrian (Syriac, Aramaic) 204 623 827 Japanese 47 681 728 Tamil 36 574 610 Bulgarian 47 558 605 Romanian 117 482 599 Other 3,376 8,995 12,371 Total Enrollment 62,583 139,391 201,974
Data Source: Student Information System.
31
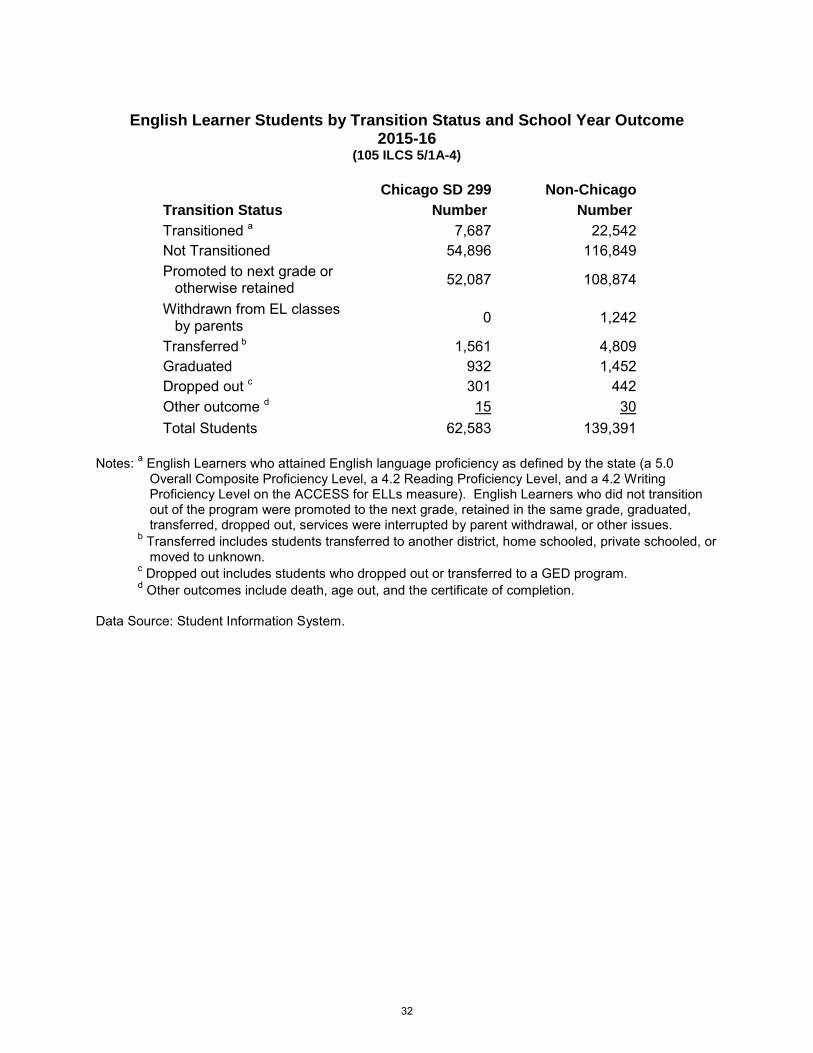
English Learner Students by Transition Status and School Year Outcome
2015-16 (105 ILCS 5/1A-4)
Chicago SD 299 Non-Chicago Transition Status Number Number Transitioned a 7,687 22,542 Not Transitioned 54,896 116,849 Promoted to next grade or
otherwise retained 52,087 108,874
Withdrawn from EL classes by parents 0 1,242
Transferred b 1,561 4,809 Graduated 932 1,452 Dropped out c 301 442 Other outcome d 15 30 Total Students 62,583 139,391
Notes: a English Learners who attained English language proficiency as defined by the state (a 5.0
Overall Composite Proficiency Level, a 4.2 Reading Proficiency Level, and a 4.2 Writing Proficiency Level on the ACCESS for ELLs measure). English Learners who did not transition out of the program were promoted to the next grade, retained in the same grade, graduated, transferred, dropped out, services were interrupted by parent withdrawal, or other issues.
b Transferred includes students transferred to another district, home schooled, private schooled, or moved to unknown.
c Dropped out includes students who dropped out or transferred to a GED program. d Other outcomes include death, age out, and the certificate of completion.
Data Source: Student Information System.
32
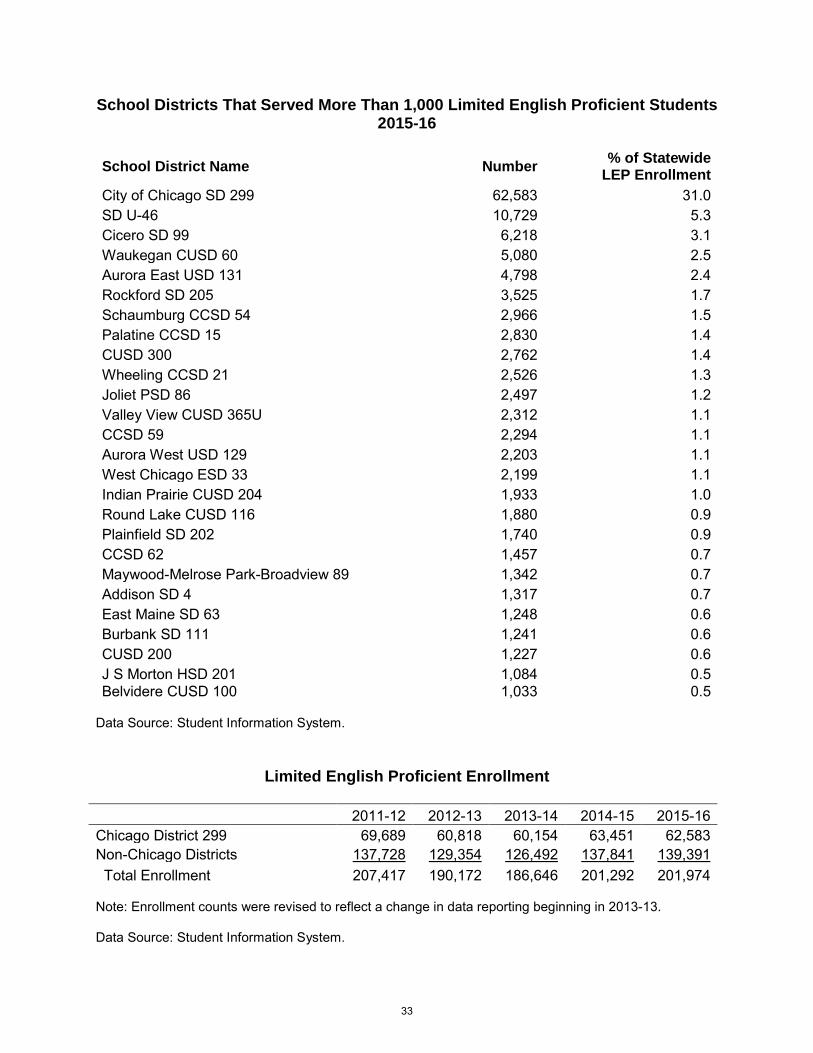
School Districts That Served More Than 1,000 Limited English Proficient Students 2015-16
School District Name Number % of Statewide LEP Enrollment
City of Chicago SD 299 62,583 31.0 SD U-46 10,729 5.3 Cicero SD 99 6,218 3.1 Waukegan CUSD 60 5,080 2.5 Aurora East USD 131 4,798 2.4 Rockford SD 205 3,525 1.7 Schaumburg CCSD 54 2,966 1.5 Palatine CCSD 15 2,830 1.4 CUSD 300 2,762 1.4 Wheeling CCSD 21 2,526 1.3 Joliet PSD 86 2,497 1.2 Valley View CUSD 365U 2,312 1.1 CCSD 59 2,294 1.1 Aurora West USD 129 2,203 1.1 West Chicago ESD 33 2,199 1.1 Indian Prairie CUSD 204 1,933 1.0 Round Lake CUSD 116 1,880 0.9 Plainfield SD 202 1,740 0.9 CCSD 62 1,457 0.7 Maywood-Melrose Park-Broadview 89 1,342 0.7 Addison SD 4 1,317 0.7 East Maine SD 63 1,248 0.6 Burbank SD 111 1,241 0.6 CUSD 200 1,227 0.6 J S Morton HSD 201 1,084 0.5 Belvidere CUSD 100 1,033 0.5
Data Source: Student Information System.
Limited English Proficient Enrollment
2011-12 2012-13 2013-14 2014-15 2015-16 Chicago District 299 69,689 60,818 60,154 63,451 62,583 Non-Chicago Districts 137,728 129,354 126,492 137,841 139,391 Total Enrollment 207,417 190,172 186,646 201,292 201,974
Note: Enrollment counts were revised to reflect a change in data reporting beginning in 2013-13.
Data Source: Student Information System.
33

Data Sources: Student Information System, Early Childhood Electronic Grant Management System.
High School Graduates (105 ILCS 5/2-3.11)
Note: Nonpublic schools report data voluntarily on an annual basis.
Data sources: Student Information System; Nonpublic Registration, Enrollment and Staff Report.
85,185
91,808 95,123
91,910
83,696 80,995 78,580
75,231 75,154 73,118
50,000
60,000
70,000
80,000
90,000
100,000
FY 07 FY 08 FY 09 FY 10 FY 11 FY 12 FY 13 FY 14 FY 15 FY 16
Number of Children Served by Preschool For All (PFA) State Funded Programs
School Year Public Nonpublic Total
2015-16 137,296 12,541 149,837 2014-15 137,290 15,633 152,923 2013-14 139,056 15,598 154,654 2012-13 139,187 14,230 153,417 2011-12 134,260 17,514 151,774 2010-11 132,648 17,038 149,686 2009-10 139,870 17,038 156,908 2008-09 132,123 15,970 148,093 2007-08 135,143 16,271 151,414 2006-07 130,220 16,706 146,926
34
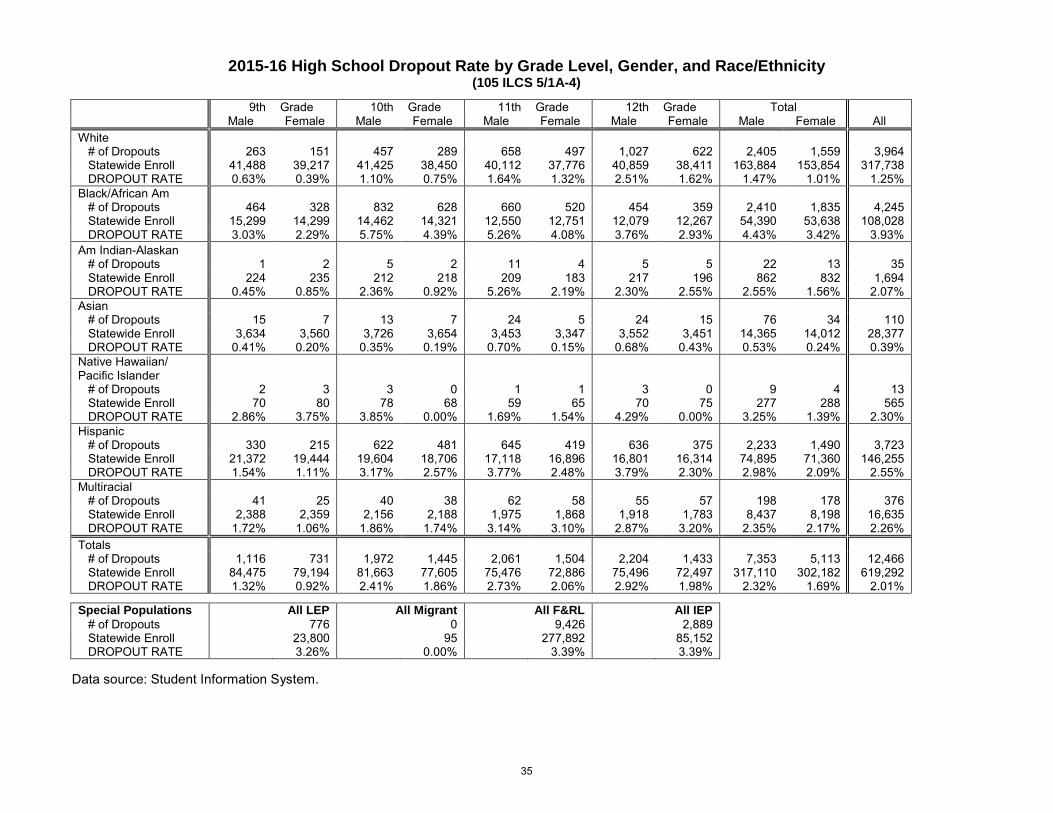
2015-16 High School Dropout Rate by Grade Level, Gender, and Race/Ethnicity (105 ILCS 5/1A-4)
9th Grade 10th Grade 11th Grade 12th Grade Total Male Female Male Female Male Female Male Female Male Female All
White # of Dropouts 263 151 457 289 658 497 1,027 622 2,405 1,559 3,964 Statewide Enroll 41,488 39,217 41,425 38,450 40,112 37,776 40,859 38,411 163,884 153,854 317,738 DROPOUT RATE 0.63% 0.39% 1.10% 0.75% 1.64% 1.32% 2.51% 1.62% 1.47% 1.01% 1.25% Black/African Am # of Dropouts 464 328 832 628 660 520 454 359 2,410 1,835 4,245 Statewide Enroll 15,299 14,299 14,462 14,321 12,550 12,751 12,079 12,267 54,390 53,638 108,028 DROPOUT RATE 3.03% 2.29% 5.75% 4.39% 5.26% 4.08% 3.76% 2.93% 4.43% 3.42% 3.93% Am Indian-Alaskan # of Dropouts 1 2 5 2 11 4 5 5 22 13 35 Statewide Enroll 224 235 212 218 209 183 217 196 862 832 1,694 DROPOUT RATE 0.45% 0.85% 2.36% 0.92% 5.26% 2.19% 2.30% 2.55% 2.55% 1.56% 2.07% Asian # of Dropouts 15 7 13 7 24 5 24 15 76 34 110 Statewide Enroll 3,634 3,560 3,726 3,654 3,453 3,347 3,552 3,451 14,365 14,012 28,377 DROPOUT RATE 0.41% 0.20% 0.35% 0.19% 0.70% 0.15% 0.68% 0.43% 0.53% 0.24% 0.39% Native Hawaiian/ Pacific Islander # of Dropouts 2 3 3 0 1 1 3 0 9 4 13 Statewide Enroll 70 80 78 68 59 65 70 75 277 288 565 DROPOUT RATE 2.86% 3.75% 3.85% 0.00% 1.69% 1.54% 4.29% 0.00% 3.25% 1.39% 2.30% Hispanic # of Dropouts 330 215 622 481 645 419 636 375 2,233 1,490 3,723 Statewide Enroll 21,372 19,444 19,604 18,706 17,118 16,896 16,801 16,314 74,895 71,360 146,255 DROPOUT RATE 1.54% 1.11% 3.17% 2.57% 3.77% 2.48% 3.79% 2.30% 2.98% 2.09% 2.55% Multiracial # of Dropouts 41 25 40 38 62 58 55 57 198 178 376 Statewide Enroll 2,388 2,359 2,156 2,188 1,975 1,868 1,918 1,783 8,437 8,198 16,635 DROPOUT RATE 1.72% 1.06% 1.86% 1.74% 3.14% 3.10% 2.87% 3.20% 2.35% 2.17% 2.26% Totals # of Dropouts 1,116 731 1,972 1,445 2,061 1,504 2,204 1,433 7,353 5,113 12,466 Statewide Enroll 84,475 79,194 81,663 77,605 75,476 72,886 75,496 72,497 317,110 302,182 619,292 DROPOUT RATE 1.32% 0.92% 2.41% 1.86% 2.73% 2.06% 2.92% 1.98% 2.32% 1.69% 2.01%
Special Populations All LEP All Migrant All F&RL All IEP # of Dropouts 776 0 9,426 2,889 Statewide Enroll 23,800 95 277,892 85,152 DROPOUT RATE 3.26% 0.00% 3.39% 3.39%
Data source: Student Information System.
35
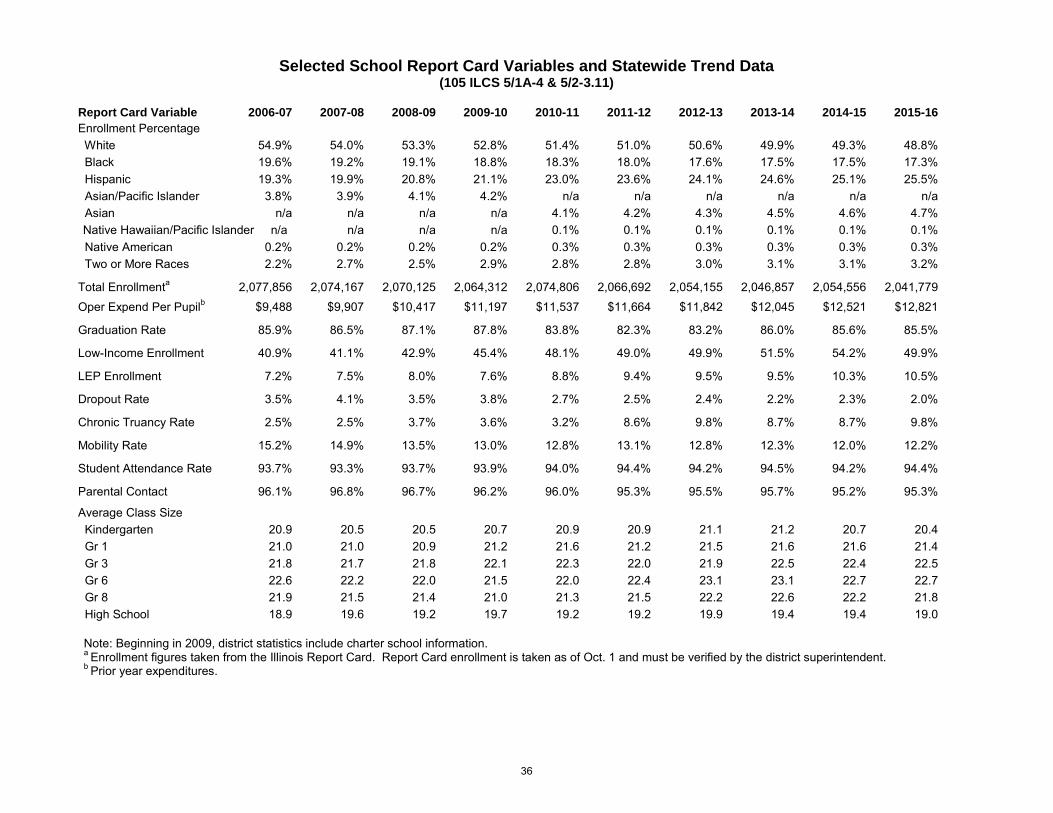
Selected School Report Card Variables and Statewide Trend Data (105 ILCS 5/1A-4 & 5/2-3.11)
Report Card Variable 2006-07 2007-08 2008-09 2009-10 2010-11 2011-12 2012-13 2013-14 2014-15 2015-16 Enrollment Percentage White 54.9% 54.0% 53.3% 52.8% 51.4% 51.0% 50.6% 49.9% 49.3% 48.8% Black 19.6% 19.2% 19.1% 18.8% 18.3% 18.0% 17.6% 17.5% 17.5% 17.3% Hispanic 19.3% 19.9% 20.8% 21.1% 23.0% 23.6% 24.1% 24.6% 25.1% 25.5% Asian/Pacific Islander 3.8% 3.9% 4.1% 4.2% n/a n/a n/a n/a n/a n/a Asian n/a n/a n/a n/a 4.1% 4.2% 4.3% 4.5% 4.6% 4.7% Native Hawaiian/Pacific Islander n/a n/a n/a n/a 0.1% 0.1% 0.1% 0.1% 0.1% 0.1%
Native American 0.2% 0.2% 0.2% 0.2% 0.3% 0.3% 0.3% 0.3% 0.3% 0.3% Two or More Races 2.2% 2.7% 2.5% 2.9% 2.8% 2.8% 3.0% 3.1% 3.1% 3.2%
Total Enrollmenta 2,077,856 2,074,167 2,070,125 2,064,312 2,074,806 2,066,692 2,054,155 2,046,857 2,054,556 2,041,779
Oper Expend Per Pupilb $9,488 $9,907 $10,417 $11,197 $11,537 $11,664 $11,842 $12,045 $12,521 $12,821
Graduation Rate 85.9% 86.5% 87.1% 87.8% 83.8% 82.3% 83.2% 86.0% 85.6% 85.5%
Low-Income Enrollment 40.9% 41.1% 42.9% 45.4% 48.1% 49.0% 49.9% 51.5% 54.2% 49.9%
LEP Enrollment 7.2% 7.5% 8.0% 7.6% 8.8% 9.4% 9.5% 9.5% 10.3% 10.5%
Dropout Rate 3.5% 4.1% 3.5% 3.8% 2.7% 2.5% 2.4% 2.2% 2.3% 2.0%
Chronic Truancy Rate 2.5% 2.5% 3.7% 3.6% 3.2% 8.6% 9.8% 8.7% 8.7% 9.8%
Mobility Rate 15.2% 14.9% 13.5% 13.0% 12.8% 13.1% 12.8% 12.3% 12.0% 12.2%
Student Attendance Rate 93.7% 93.3% 93.7% 93.9% 94.0% 94.4% 94.2% 94.5% 94.2% 94.4%
Parental Contact 96.1% 96.8% 96.7% 96.2% 96.0% 95.3% 95.5% 95.7% 95.2% 95.3%
Average Class Size Kindergarten 20.9 20.5 20.5 20.7 20.9 20.9 21.1 21.2 20.7 20.4 Gr 1 21.0 21.0 20.9 21.2 21.6 21.2 21.5 21.6 21.6 21.4 Gr 3 21.8 21.7 21.8 22.1 22.3 22.0 21.9 22.5 22.4 22.5 Gr 6 22.6 22.2 22.0 21.5 22.0 22.4 23.1 23.1 22.7 22.7 Gr 8 21.9 21.5 21.4 21.0 21.3 21.5 22.2 22.6 22.2 21.8 High School 18.9 19.6 19.2 19.7 19.2 19.2 19.9 19.4 19.4 19.0
Note: Beginning in 2009, district statistics include charter school information. a Enrollment figures taken from the Illinois Report Card. Report Card enrollment is taken as of Oct. 1 and must be verified by the district superintendent. b Prior year expenditures.
36

STUDENT PERFORMANCE
Partnership for Assessment of Readiness for College and Careers (PARCC)
Students in grades 3-8 and some high school students take the Partnership for Assessment of Readiness for College and Careers (PARCC) consortium test. The PARCC consortium test replaced the Illinois Standards Achievement Test (ISAT) and the Prairie State Achievement Exam (PSAE). Statewide results provide a new baseline for measuring student progress and therefore cannot be compared to ISAT and PSAE scores. Final district- and school-level results indicate student performance at each of the five performance levels in English language arts and mathematics by grade level in elementary school and by course level in high school. The table below displays the statewide average percentage of students who meet or exceed standards.
English Language Arts 2015 2016 Grade 3 35.3 35.5 Grade 4 39.4 36.9 Grade 5 38.3 35.3 Grade 6 35.4 34.9 Grade 7 39.9 37.3 Grade 8 40.4 39.1 High School 34.7 34.1 Mathematics 2015 2016 Grade 3 34.5 39.6 Grade 4 27.9 30.5 Grade 5 26.9 31.7 Grade 6 27.2 28.7 Grade 7 27.5 27.3 Grade 8 32.1 31.8 High School 18.7 21.8
37

Dynamic Learning Maps (DLM) The Dynamic Learning Maps (DLM) assessment measures student performance on alternate content standards for students with the most significant cognitive disabilities – DLM Essential Elements. Essential Elements detail what children should know and be able to do at a particular grade level. The Dynamic Learning Maps assessment replaced the Illinois Alternate Assessment (IAA) in 2016. Statewide results provide a new baseline for measuring student progress and therefore cannot be compared to IAA scores. Final district- and school-level results indicate student performance at each of the five performance levels in English language arts and mathematics by grade level in elementary and high school. The table below displays the statewide average percentage of students who meet or exceed standards.
English Language Arts 2016 Grade 3 15.9 Grade 4 20.1 Grade 5 23.2 Grade 6 20.6 Grade 7 25.4 Grade 8 27.1 Grade 11 24.6 Mathematics 2016 Grade 3 15.6 Grade 4 18.4 Grade 5 13.1 Grade 6 11.7 Grade 7 6.2 Grade 8 10.7 Grade 11 4.0
38
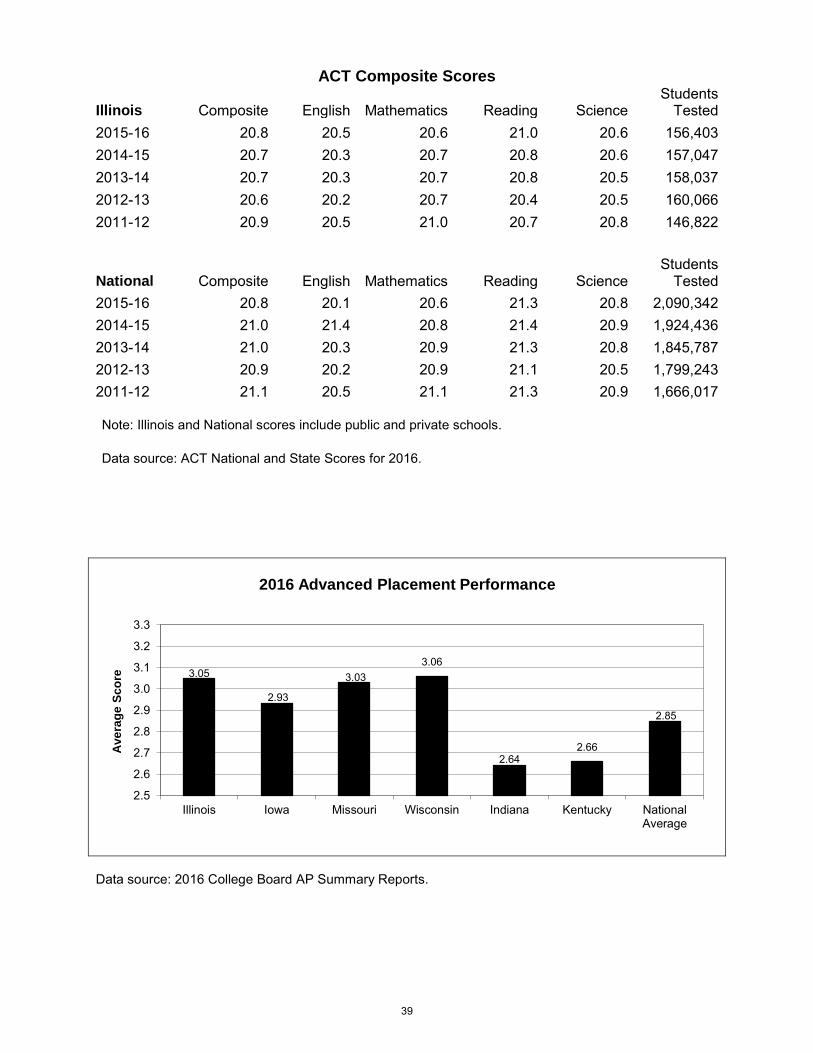
ACT Composite Scores
Illinois Composite English Mathematics Reading Science Students
Tested 2015-16 20.8 20.5 20.6 21.0 20.6 156,403 2014-15 20.7 20.3 20.7 20.8 20.6 157,047 2013-14 20.7 20.3 20.7 20.8 20.5 158,037 2012-13 20.6 20.2 20.7 20.4 20.5 160,066 2011-12 20.9 20.5 21.0 20.7 20.8 146,822
National Composite English Mathematics Reading Science Students
Tested 2015-16 20.8 20.1 20.6 21.3 20.8 2,090,342 2014-15 21.0 21.4 20.8 21.4 20.9 1,924,436 2013-14 21.0 20.3 20.9 21.3 20.8 1,845,787 2012-13 20.9 20.2 20.9 21.1 20.5 1,799,243 2011-12 21.1 20.5 21.1 21.3 20.9 1,666,017
Note: Illinois and National scores include public and private schools. Data source: ACT National and State Scores for 2016.
Data source: 2016 College Board AP Summary Reports.
3.05
2.93
3.03 3.06
2.64 2.66
2.85
2.5
2.6
2.7
2.8
2.9
3.0
3.1
3.2
3.3
Illinois Iowa Missouri Wisconsin Indiana Kentucky NationalAverage
Ave
rage
Sco
re
2016 Advanced Placement Performance
39
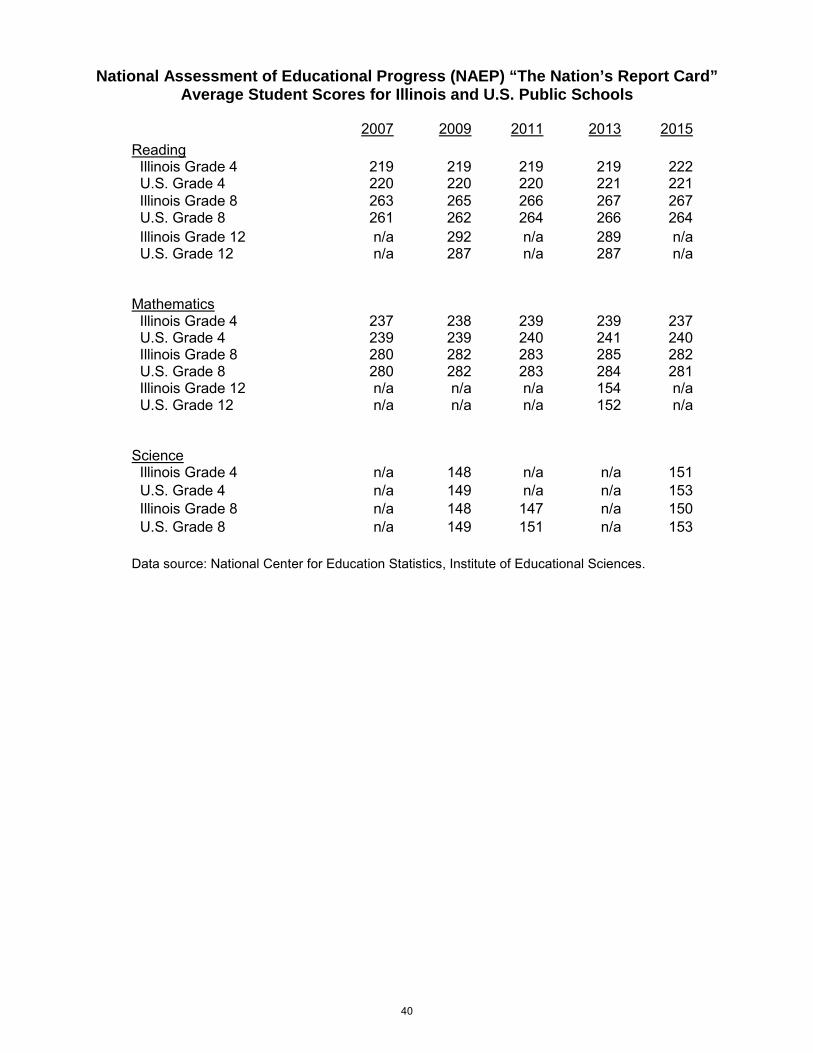
National Assessment of Educational Progress (NAEP) “The Nation’s Report Card” Average Student Scores for Illinois and U.S. Public Schools
2007 2009 2011 2013 2015 Reading Illinois Grade 4 219 219 219 219 222 U.S. Grade 4 220 220 220 221 221 Illinois Grade 8 263 265 266 267 267 U.S. Grade 8 261 262 264 266 264 Illinois Grade 12 n/a 292 n/a 289 n/a U.S. Grade 12 n/a 287 n/a 287 n/a Mathematics Illinois Grade 4 237 238 239 239 237 U.S. Grade 4 239 239 240 241 240 Illinois Grade 8 280 282 283 285 282 U.S. Grade 8 280 282 283 284 281 Illinois Grade 12 n/a n/a n/a 154 n/a U.S. Grade 12 n/a n/a n/a 152 n/a Science Illinois Grade 4 n/a 148 n/a n/a 151 U.S. Grade 4 n/a 149 n/a n/a 153 Illinois Grade 8 n/a 148 147 n/a 150 U.S. Grade 8 n/a 149 151 n/a 153 Data source: National Center for Education Statistics, Institute of Educational Sciences.
40

National Assessment of Educational Progress (NAEP) “The Nation’s Report Card”
Comparison of Illinois and U.S. Achievement Gaps
2015 Reading 2015 Math 2015 Science Grade 4 Illinois U.S. Illinois U.S. Illinois U.S.
White 233 232 248 248 166 166 Black 202 206 215 224 125 133 Hispanic 211 208 228 230 137 139 Asian 248 240 262 259 173 169 American Indian/Alaska Native * 206 * 228 * 139 Native Hawaiian/Other Pacific Islander
* 212 * 226 * 143
Two or More Races 224 226 244 244 152 158 2015 Reading 2015 Math 2015 Science Grade 8 Illinois U.S. Illinois U.S. Illinois U.S.
White 276 273 290 291 162 166 Black 247 247 261 260 126 132 Hispanic 257 253 273 269 139 140 Asian 290 280 309 307 163 166 American Indian/Alaska Native * 253 * 267 * 139 Native Hawaiian/Other Pacific Islander
* 254 * 277 * 138
Two or More Races * 267 * 283 * 159 2013 Reading 2013 Math Grade 12 Illinois U.S. Illinois U.S.
White 299 297 165 162 Black 267 268 123 132 Hispanic 278 276 143 141 Asian 303 296 181 174 American Indian/Alaska Native * 277 * 142 Native Hawaiian/Other Pacific Islander
* 289 * 151
Two or More Races * 291 * 155
* Reporting standards not met as the sample n-size was insufficient to permit a reliable estimate. Data source: National Center for Education Statistics, Institute of Educational Sciences.
41
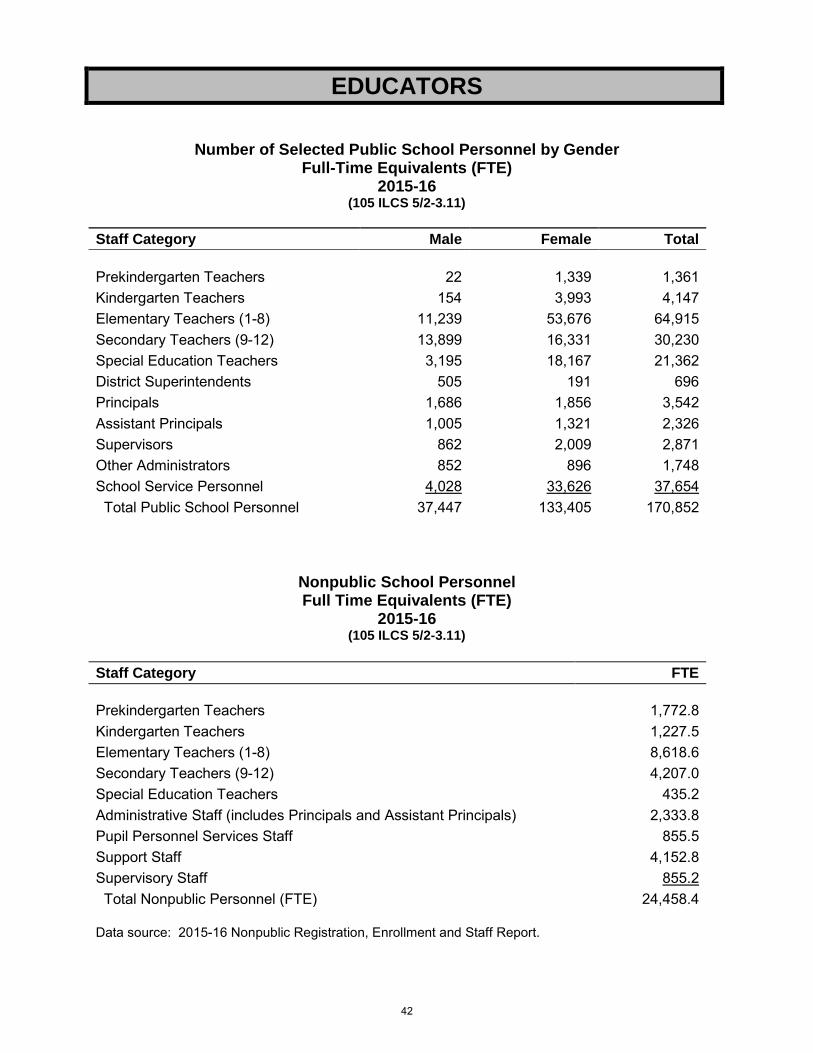
EDUCATORS
Number of Selected Public School Personnel by Gender Full-Time Equivalents (FTE)
2015-16 (105 ILCS 5/2-3.11)
Staff Category Male Female Total
Prekindergarten Teachers 22 1,339 1,361 Kindergarten Teachers 154 3,993 4,147 Elementary Teachers (1-8) 11,239 53,676 64,915 Secondary Teachers (9-12) 13,899 16,331 30,230 Special Education Teachers 3,195 18,167 21,362 District Superintendents 505 191 696 Principals 1,686 1,856 3,542 Assistant Principals 1,005 1,321 2,326 Supervisors 862 2,009 2,871 Other Administrators 852 896 1,748 School Service Personnel 4,028 33,626 37,654 Total Public School Personnel 37,447 133,405 170,852
Nonpublic School Personnel Full Time Equivalents (FTE)
2015-16 (105 ILCS 5/2-3.11)
Staff Category FTE
Prekindergarten Teachers 1,772.8 Kindergarten Teachers 1,227.5 Elementary Teachers (1-8) 8,618.6 Secondary Teachers (9-12) 4,207.0 Special Education Teachers 435.2 Administrative Staff (includes Principals and Assistant Principals) 2,333.8 Pupil Personnel Services Staff 855.5 Support Staff 4,152.8 Supervisory Staff 855.2 Total Nonpublic Personnel (FTE) 24,458.4 Data source: 2015-16 Nonpublic Registration, Enrollment and Staff Report.
42
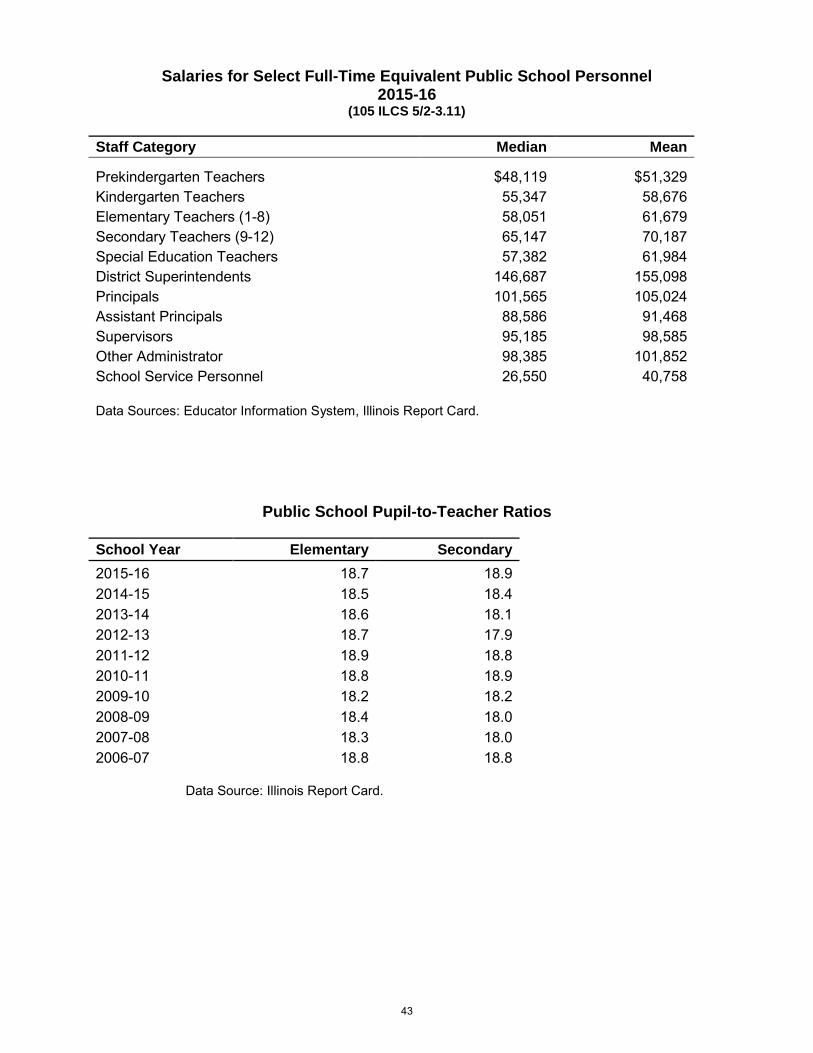
Salaries for Select Full-Time Equivalent Public School Personnel 2015-16
(105 ILCS 5/2-3.11) Staff Category Median Mean
Prekindergarten Teachers $48,119 $51,329 Kindergarten Teachers 55,347 58,676 Elementary Teachers (1-8) 58,051 61,679 Secondary Teachers (9-12) 65,147 70,187 Special Education Teachers 57,382 61,984 District Superintendents 146,687 155,098 Principals 101,565 105,024 Assistant Principals 88,586 91,468 Supervisors 95,185 98,585 Other Administrator 98,385 101,852 School Service Personnel 26,550 40,758 Data Sources: Educator Information System, Illinois Report Card.
Public School Pupil-to-Teacher Ratios
Data Source: Illinois Report Card.
School Year Elementary Secondary 2015-16 18.7 18.9 2014-15 18.5 18.4 2013-14 18.6 18.1 2012-13 18.7 17.9 2011-12 18.9 18.8 2010-11 18.8 18.9 2009-10 18.2 18.2 2008-09 18.4 18.0 2007-08 18.3 18.0 2006-07 18.8 18.8
43

Educator Certificates Issued By Type (105 ILCS 5/2-3.11)
Certificates 2011-12 2012-13 2013-14 2014-15 2015-16 Elementary 6,367 6,416 n/a n/a n/a Secondary 4,176 4,222 n/a n/a n/a Early Childhood 1,116 1,132 n/a n/a n/a Special 4,856 5,649 n/a n/a n/a School Service 1,658 1,866 n/a n/a n/a Administrative 3,006 3,560 n/a n/a n/a Transitional Bilingual 536 529 n/a n/a n/a Substitute 10,478 10,515 n/a n/a n/a Other 211 206 n/a n/a n/a Total 32,404 34,095 n/a n/a n/a Note: Prior to FY 2014, educators were issued certificates. An educator licensure system began in FY
2014, at which time all certificates were converted to licenses.
Educator Certificates Issued By Evaluation, Entitlement & Exchange (105 ILCS 5/2-3.11)
Certificates 2011-12 2012-13 2013-14 2014-15 2015-16 Evaluation 16,692 17,436 n/a n/a n/a Entitlement 15,397 15,811 n/a n/a n/a Exchange 315 848 n/a n/a n/a Total 32,404 34,095 n/a n/a n/a
Note: Prior to FY 2014, educators were issued certificates. An educator licensure system began in FY
2014, at which time all certificates were converted to licenses.
Educator Licenses Issued By Evaluation, Entitlement & Exchange (105 ILCS 5/2-3.11)
Licenses 2011-12 2012-13 2013-14 2014-15 2015-16 Evaluation n/a n/a 5,275 10,664 21,059 Entitlement n/a n/a 5,657 4,749 6,011 Exchange n/a n/a 112,380 206 895 Total n/a n/a 123,312 15,619 27,965 Note: Prior to FY 2014, educators were issued certificates. An educator licensure system began in FY
2014, at which time all certificates were converted to licenses.
44
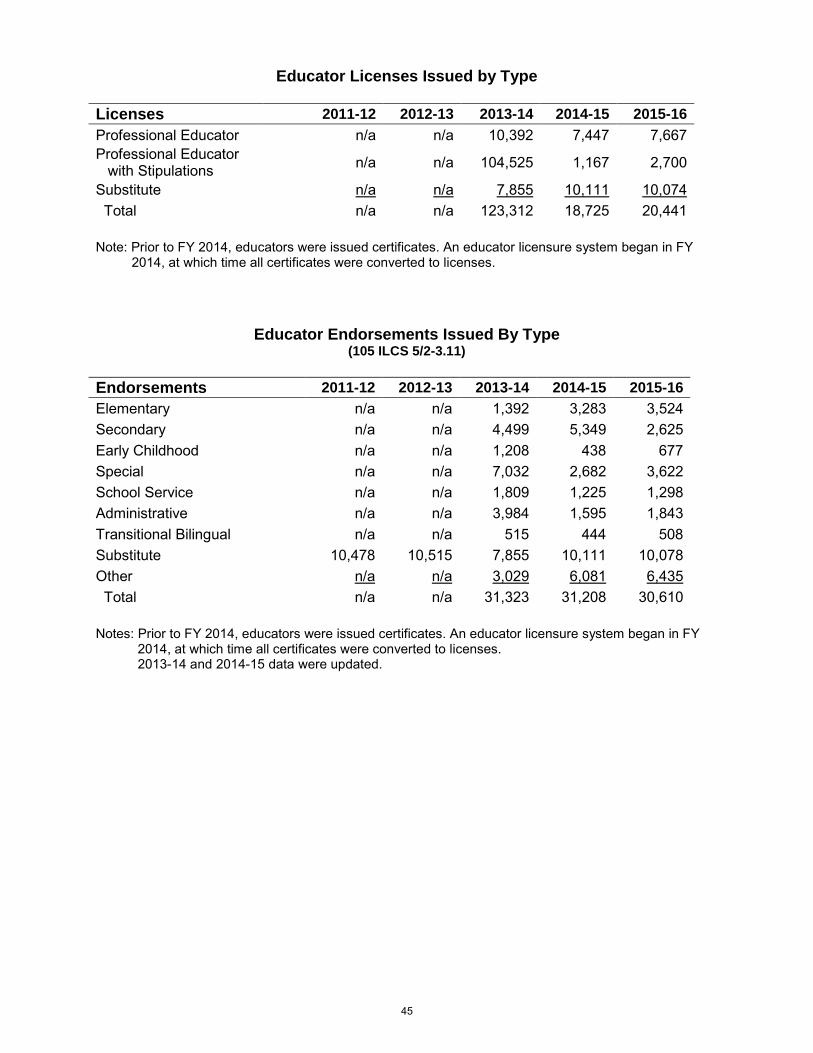
Educator Licenses Issued by Type
Licenses 2011-12 2012-13 2013-14 2014-15 2015-16 Professional Educator n/a n/a 10,392 7,447 7,667 Professional Educator
with Stipulations n/a n/a 104,525 1,167 2,700
Substitute n/a n/a 7,855 10,111 10,074 Total n/a n/a 123,312 18,725 20,441
Note: Prior to FY 2014, educators were issued certificates. An educator licensure system began in FY
2014, at which time all certificates were converted to licenses.
Educator Endorsements Issued By Type (105 ILCS 5/2-3.11)
Endorsements 2011-12 2012-13 2013-14 2014-15 2015-16 Elementary n/a n/a 1,392 3,283 3,524 Secondary n/a n/a 4,499 5,349 2,625 Early Childhood n/a n/a 1,208 438 677 Special n/a n/a 7,032 2,682 3,622 School Service n/a n/a 1,809 1,225 1,298 Administrative n/a n/a 3,984 1,595 1,843 Transitional Bilingual n/a n/a 515 444 508 Substitute 10,478 10,515 7,855 10,111 10,078 Other n/a n/a 3,029 6,081 6,435 Total n/a n/a 31,323 31,208 30,610 Notes: Prior to FY 2014, educators were issued certificates. An educator licensure system began in FY
2014, at which time all certificates were converted to licenses. 2013-14 and 2014-15 data were updated.
45
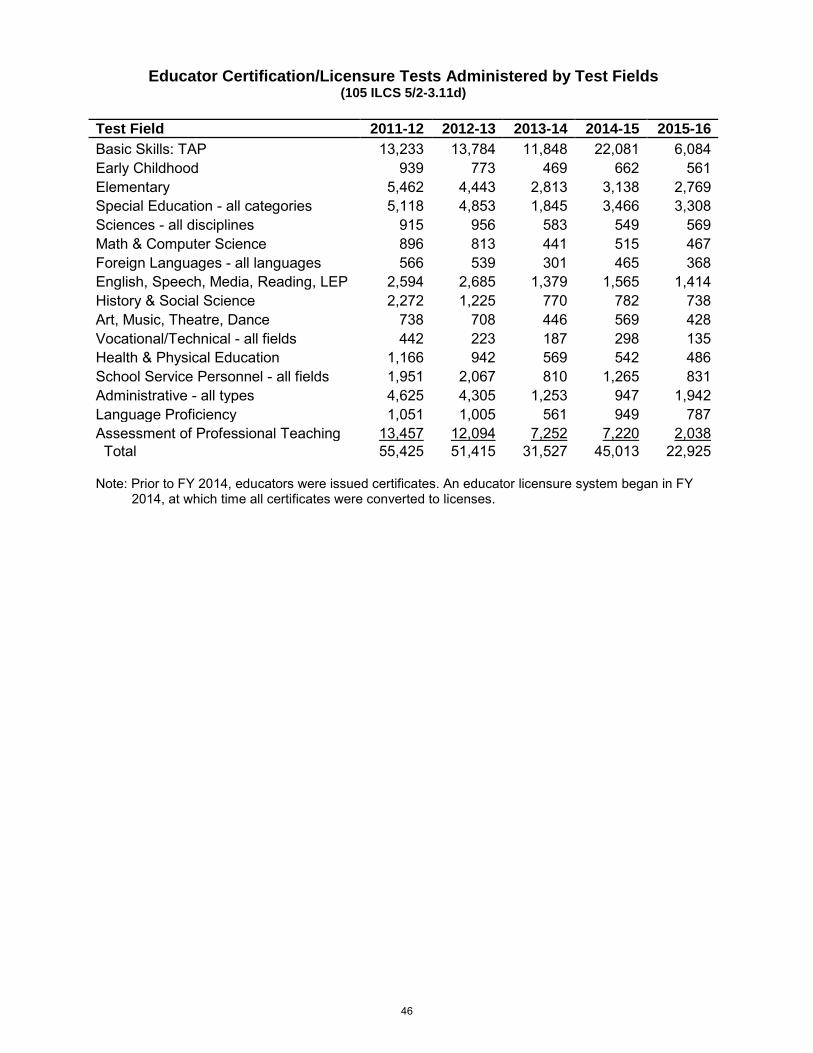
Educator Certification/Licensure Tests Administered by Test Fields (105 ILCS 5/2-3.11d)
Test Field 2011-12 2012-13 2013-14 2014-15 2015-16 Basic Skills: TAP 13,233 13,784 11,848 22,081 6,084 Early Childhood 939 773 469 662 561 Elementary 5,462 4,443 2,813 3,138 2,769 Special Education - all categories 5,118 4,853 1,845 3,466 3,308 Sciences - all disciplines 915 956 583 549 569 Math & Computer Science 896 813 441 515 467 Foreign Languages - all languages 566 539 301 465 368 English, Speech, Media, Reading, LEP 2,594 2,685 1,379 1,565 1,414 History & Social Science 2,272 1,225 770 782 738 Art, Music, Theatre, Dance 738 708 446 569 428 Vocational/Technical - all fields 442 223 187 298 135 Health & Physical Education 1,166 942 569 542 486 School Service Personnel - all fields 1,951 2,067 810 1,265 831 Administrative - all types 4,625 4,305 1,253 947 1,942 Language Proficiency 1,051 1,005 561 949 787 Assessment of Professional Teaching 13,457 12,094 7,252 7,220 2,038 Total 55,425 51,415 31,527 45,013 22,925 Note: Prior to FY 2014, educators were issued certificates. An educator licensure system began in FY
2014, at which time all certificates were converted to licenses.
46
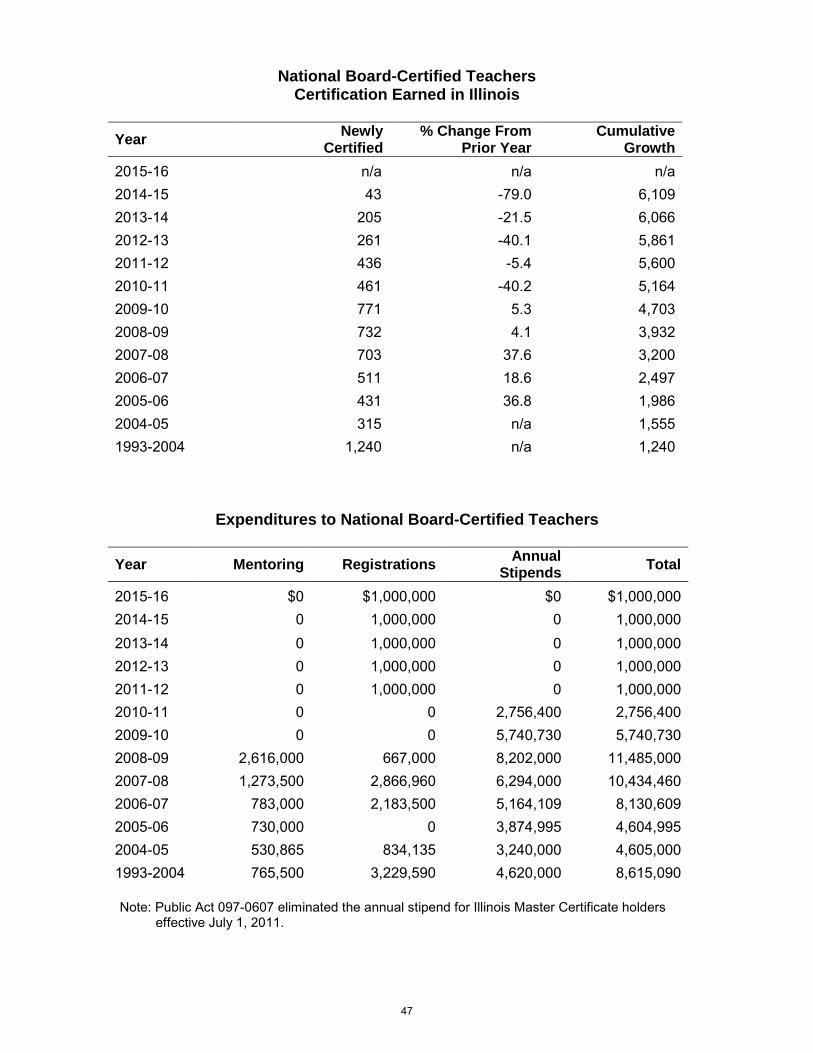
National Board-Certified Teachers Certification Earned in Illinois
Year Newly
Certified % Change From
Prior Year Cumulative
Growth 2015-16 n/a n/a n/a 2014-15 43 -79.0 6,109 2013-14 205 -21.5 6,066 2012-13 261 -40.1 5,861 2011-12 436 -5.4 5,600 2010-11 461 -40.2 5,164 2009-10 771 5.3 4,703 2008-09 732 4.1 3,932 2007-08 703 37.6 3,200 2006-07 511 18.6 2,497 2005-06 431 36.8 1,986 2004-05 315 n/a 1,555 1993-2004 1,240 n/a 1,240
Expenditures to National Board-Certified Teachers
Year Mentoring Registrations Annual Stipends Total
2015-16 $0 $1,000,000 $0 $1,000,000 2014-15 0 1,000,000 0 1,000,000 2013-14 0 1,000,000 0 1,000,000 2012-13 0 1,000,000 0 1,000,000 2011-12 0 1,000,000 0 1,000,000 2010-11 0 0 2,756,400 2,756,400 2009-10 0 0 5,740,730 5,740,730 2008-09 2,616,000 667,000 8,202,000 11,485,000 2007-08 1,273,500 2,866,960 6,294,000 10,434,460 2006-07 783,000 2,183,500 5,164,109 8,130,609 2005-06 730,000 0 3,874,995 4,604,995 2004-05 530,865 834,135 3,240,000 4,605,000 1993-2004 765,500 3,229,590 4,620,000 8,615,090
Note: Public Act 097-0607 eliminated the annual stipend for Illinois Master Certificate holders
effective July 1, 2011.
47
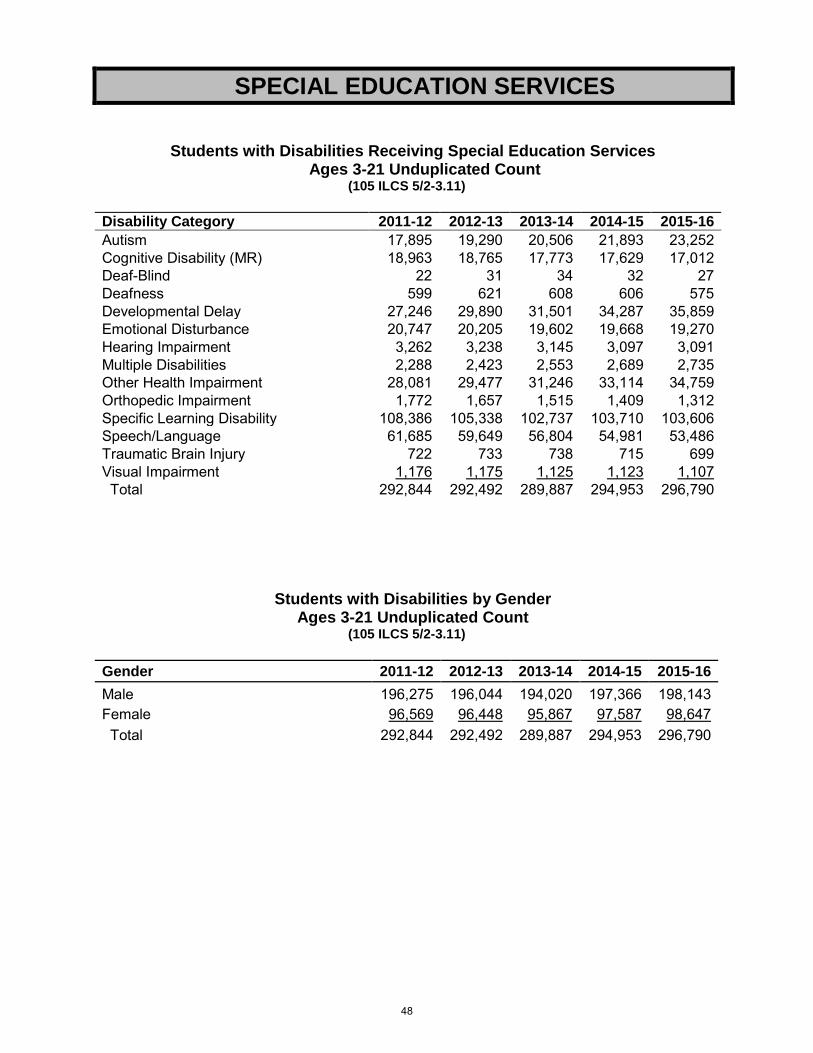
SPECIAL EDUCATION SERVICES
Students with Disabilities Receiving Special Education Services Ages 3-21 Unduplicated Count
(105 ILCS 5/2-3.11)
Disability Category 2011-12 2012-13 2013-14 2014-15 2015-16 Autism 17,895 19,290 20,506 21,893 23,252 Cognitive Disability (MR) 18,963 18,765 17,773 17,629 17,012 Deaf-Blind 22 31 34 32 27 Deafness 599 621 608 606 575 Developmental Delay 27,246 29,890 31,501 34,287 35,859 Emotional Disturbance 20,747 20,205 19,602 19,668 19,270 Hearing Impairment 3,262 3,238 3,145 3,097 3,091 Multiple Disabilities 2,288 2,423 2,553 2,689 2,735 Other Health Impairment 28,081 29,477 31,246 33,114 34,759 Orthopedic Impairment 1,772 1,657 1,515 1,409 1,312 Specific Learning Disability 108,386 105,338 102,737 103,710 103,606 Speech/Language 61,685 59,649 56,804 54,981 53,486 Traumatic Brain Injury 722 733 738 715 699 Visual Impairment 1,176 1,175 1,125 1,123 1,107 Total 292,844 292,492 289,887 294,953 296,790
Students with Disabilities by Gender Ages 3-21 Unduplicated Count
(105 ILCS 5/2-3.11) Gender 2011-12 2012-13 2013-14 2014-15 2015-16 Male 196,275 196,044 194,020 197,366 198,143 Female 96,569 96,448 95,867 97,587 98,647 Total 292,844 292,492 289,887 294,953 296,790
48
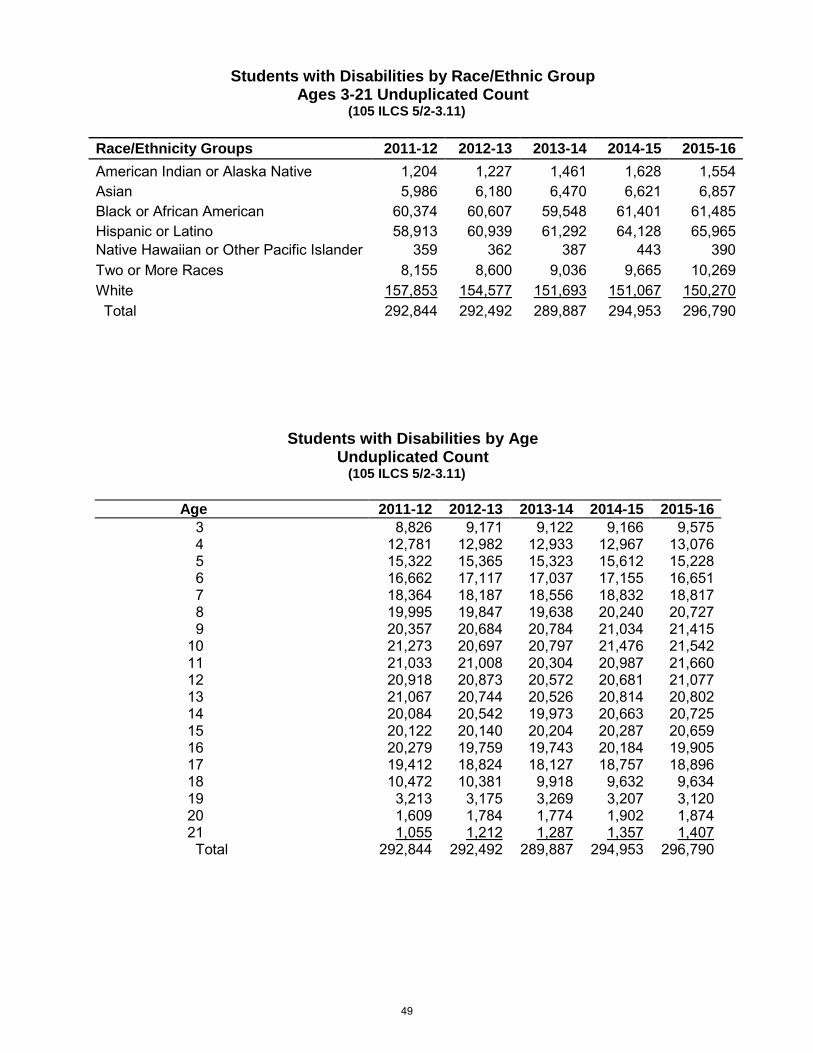
Students with Disabilities by Race/Ethnic Group Ages 3-21 Unduplicated Count
(105 ILCS 5/2-3.11)
Race/Ethnicity Groups 2011-12 2012-13 2013-14 2014-15 2015-16 American Indian or Alaska Native 1,204 1,227 1,461 1,628 1,554 Asian 5,986 6,180 6,470 6,621 6,857 Black or African American 60,374 60,607 59,548 61,401 61,485 Hispanic or Latino 58,913 60,939 61,292 64,128 65,965 Native Hawaiian or Other Pacific Islander 359 362 387 443 390 Two or More Races 8,155 8,600 9,036 9,665 10,269 White 157,853 154,577 151,693 151,067 150,270 Total 292,844 292,492 289,887 294,953 296,790
Students with Disabilities by Age Unduplicated Count
(105 ILCS 5/2-3.11)
Age 2011-12 2012-13 2013-14 2014-15 2015-16 3 8,826 9,171 9,122 9,166 9,575 4 12,781 12,982 12,933 12,967 13,076 5 15,322 15,365 15,323 15,612 15,228 6 16,662 17,117 17,037 17,155 16,651 7 18,364 18,187 18,556 18,832 18,817 8 19,995 19,847 19,638 20,240 20,727 9 20,357 20,684 20,784 21,034 21,415
10 21,273 20,697 20,797 21,476 21,542 11 21,033 21,008 20,304 20,987 21,660 12 20,918 20,873 20,572 20,681 21,077 13 21,067 20,744 20,526 20,814 20,802 14 20,084 20,542 19,973 20,663 20,725 15 20,122 20,140 20,204 20,287 20,659 16 20,279 19,759 19,743 20,184 19,905 17 19,412 18,824 18,127 18,757 18,896 18 10,472 10,381 9,918 9,632 9,634 19 3,213 3,175 3,269 3,207 3,120 20 1,609 1,784 1,774 1,902 1,874 21 1,055 1,212 1,287 1,357 1,407 Total 292,844 292,492 289,887 294,953 296,790
49
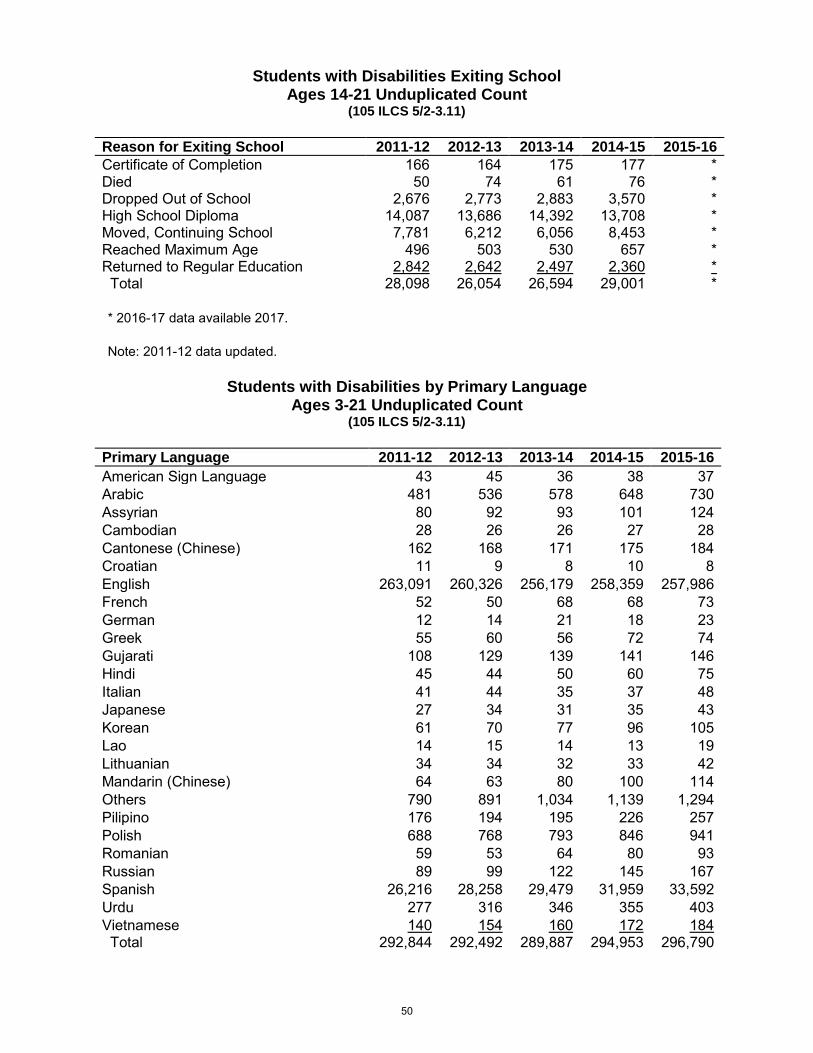
Students with Disabilities Exiting School Ages 14-21 Unduplicated Count
(105 ILCS 5/2-3.11)
Reason for Exiting School 2011-12 2012-13 2013-14 2014-15 2015-16
Certificate of Completion 166 164 175 177 * Died 50 74 61 76 * Dropped Out of School 2,676 2,773 2,883 3,570 * High School Diploma 14,087 13,686 14,392 13,708 * Moved, Continuing School 7,781 6,212 6,056 8,453 * Reached Maximum Age 496 503 530 657 * Returned to Regular Education 2,842 2,642 2,497 2,360 * Total 28,098 26,054 26,594 29,001 *
* 2016-17 data available 2017.
Note: 2011-12 data updated.
Students with Disabilities by Primary Language Ages 3-21 Unduplicated Count
(105 ILCS 5/2-3.11)
Primary Language 2011-12 2012-13 2013-14 2014-15 2015-16 American Sign Language 43 45 36 38 37 Arabic 481 536 578 648 730 Assyrian 80 92 93 101 124 Cambodian 28 26 26 27 28 Cantonese (Chinese) 162 168 171 175 184 Croatian 11 9 8 10 8 English 263,091 260,326 256,179 258,359 257,986 French 52 50 68 68 73 German 12 14 21 18 23 Greek 55 60 56 72 74 Gujarati 108 129 139 141 146 Hindi 45 44 50 60 75 Italian 41 44 35 37 48 Japanese 27 34 31 35 43 Korean 61 70 77 96 105 Lao 14 15 14 13 19 Lithuanian 34 34 32 33 42 Mandarin (Chinese) 64 63 80 100 114 Others 790 891 1,034 1,139 1,294 Pilipino 176 194 195 226 257 Polish 688 768 793 846 941 Romanian 59 53 64 80 93 Russian 89 99 122 145 167 Spanish 26,216 28,258 29,479 31,959 33,592 Urdu 277 316 346 355 403 Vietnamese 140 154 160 172 184 Total 292,844 292,492 289,887 294,953 296,790
50
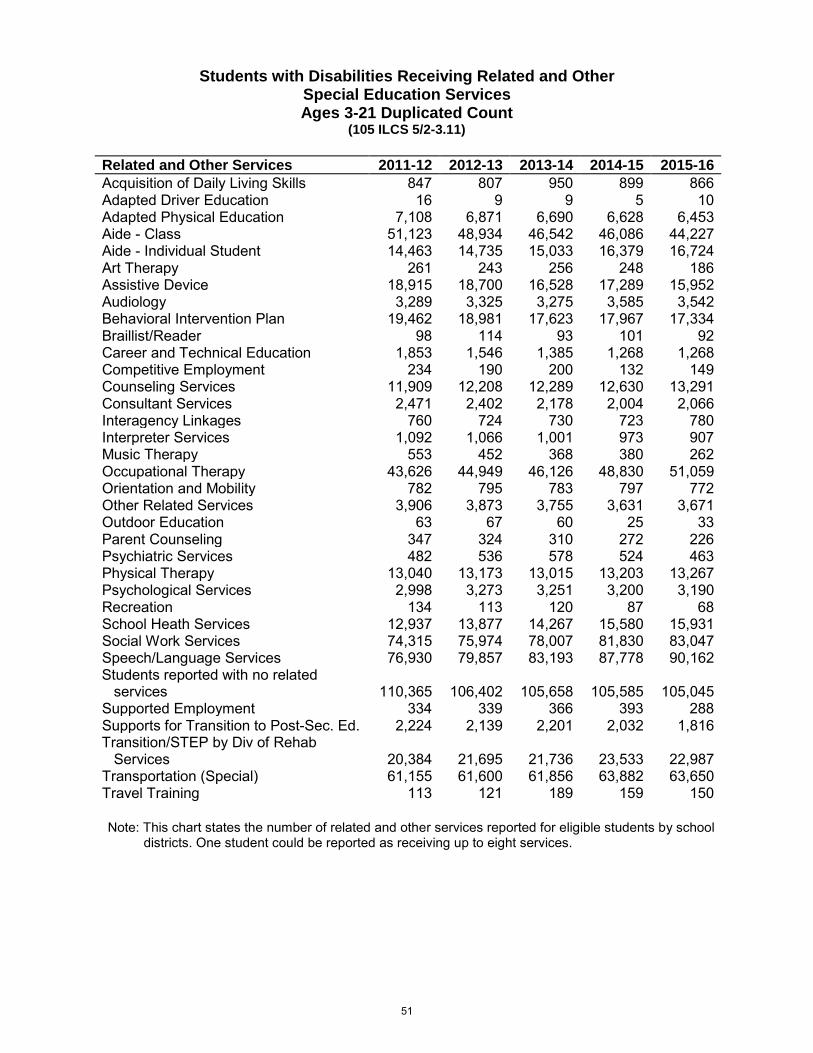
Students with Disabilities Receiving Related and Other Special Education Services Ages 3-21 Duplicated Count
(105 ILCS 5/2-3.11)
Related and Other Services 2011-12 2012-13 2013-14 2014-15 2015-16 Acquisition of Daily Living Skills 847 807 950 899 866 Adapted Driver Education 16 9 9 5 10 Adapted Physical Education 7,108 6,871 6,690 6,628 6,453 Aide - Class 51,123 48,934 46,542 46,086 44,227 Aide - Individual Student 14,463 14,735 15,033 16,379 16,724 Art Therapy 261 243 256 248 186 Assistive Device 18,915 18,700 16,528 17,289 15,952 Audiology 3,289 3,325 3,275 3,585 3,542 Behavioral Intervention Plan 19,462 18,981 17,623 17,967 17,334 Braillist/Reader 98 114 93 101 92 Career and Technical Education 1,853 1,546 1,385 1,268 1,268 Competitive Employment 234 190 200 132 149 Counseling Services 11,909 12,208 12,289 12,630 13,291 Consultant Services 2,471 2,402 2,178 2,004 2,066 Interagency Linkages 760 724 730 723 780 Interpreter Services 1,092 1,066 1,001 973 907 Music Therapy 553 452 368 380 262 Occupational Therapy 43,626 44,949 46,126 48,830 51,059 Orientation and Mobility 782 795 783 797 772 Other Related Services 3,906 3,873 3,755 3,631 3,671 Outdoor Education 63 67 60 25 33 Parent Counseling 347 324 310 272 226 Psychiatric Services 482 536 578 524 463 Physical Therapy 13,040 13,173 13,015 13,203 13,267 Psychological Services 2,998 3,273 3,251 3,200 3,190 Recreation 134 113 120 87 68 School Heath Services 12,937 13,877 14,267 15,580 15,931 Social Work Services 74,315 75,974 78,007 81,830 83,047 Speech/Language Services 76,930 79,857 83,193 87,778 90,162 Students reported with no related
services 110,365 106,402 105,658 105,585 105,045 Supported Employment 334 339 366 393 288 Supports for Transition to Post-Sec. Ed. 2,224 2,139 2,201 2,032 1,816 Transition/STEP by Div of Rehab
Services 20,384 21,695 21,736 23,533 22,987 Transportation (Special) 61,155 61,600 61,856 63,882 63,650 Travel Training 113 121 189 159 150
Note: This chart states the number of related and other services reported for eligible students by school districts. One student could be reported as receiving up to eight services.
51
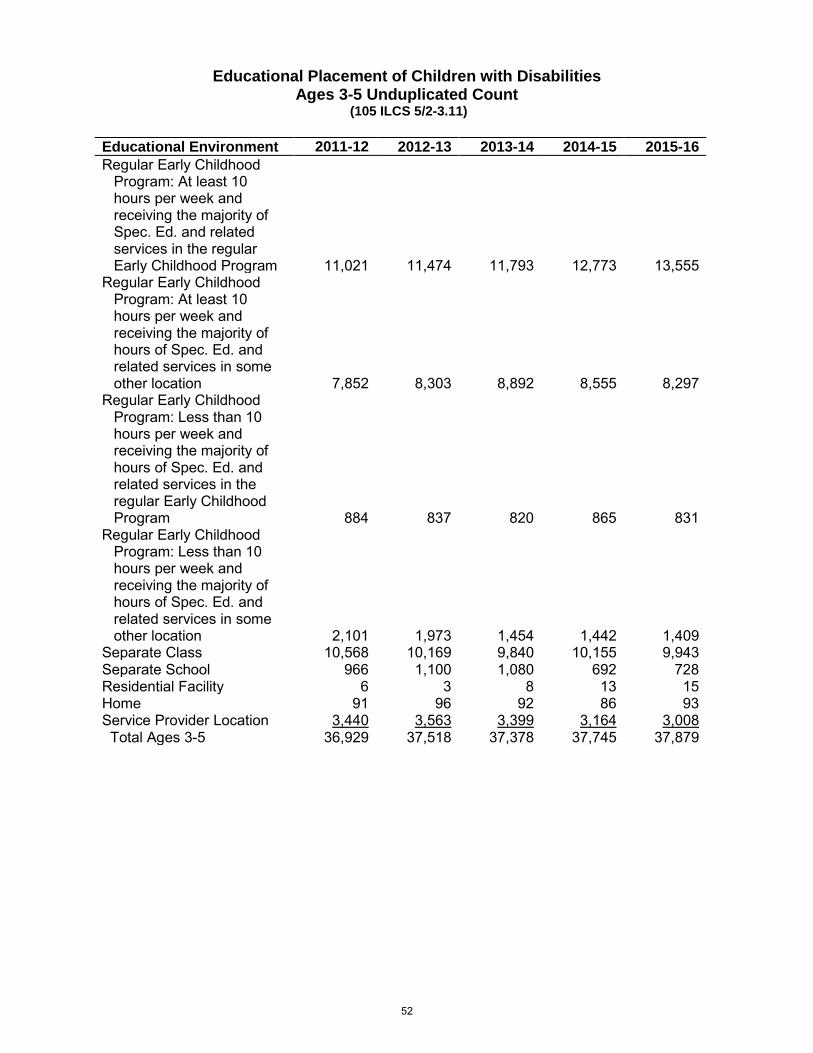
Educational Placement of Children with Disabilities Ages 3-5 Unduplicated Count
(105 ILCS 5/2-3.11)
Educational Environment 2011-12 2012-13 2013-14 2014-15 2015-16 Regular Early Childhood
Program: At least 10 hours per week and receiving the majority of Spec. Ed. and related services in the regular Early Childhood Program 11,021 11,474 11,793 12,773 13,555
Regular Early Childhood Program: At least 10 hours per week and receiving the majority of hours of Spec. Ed. and related services in some other location 7,852 8,303 8,892 8,555 8,297
Regular Early Childhood Program: Less than 10 hours per week and receiving the majority of hours of Spec. Ed. and related services in the regular Early Childhood Program 884 837 820 865 831
Regular Early Childhood Program: Less than 10 hours per week and receiving the majority of hours of Spec. Ed. and related services in some other location 2,101 1,973 1,454 1,442 1,409
Separate Class 10,568 10,169 9,840 10,155 9,943 Separate School 966 1,100 1,080 692 728 Residential Facility 6 3 8 13 15 Home 91 96 92 86 93 Service Provider Location 3,440 3,563 3,399 3,164 3,008 Total Ages 3-5 36,929 37,518 37,378 37,745 37,879
52
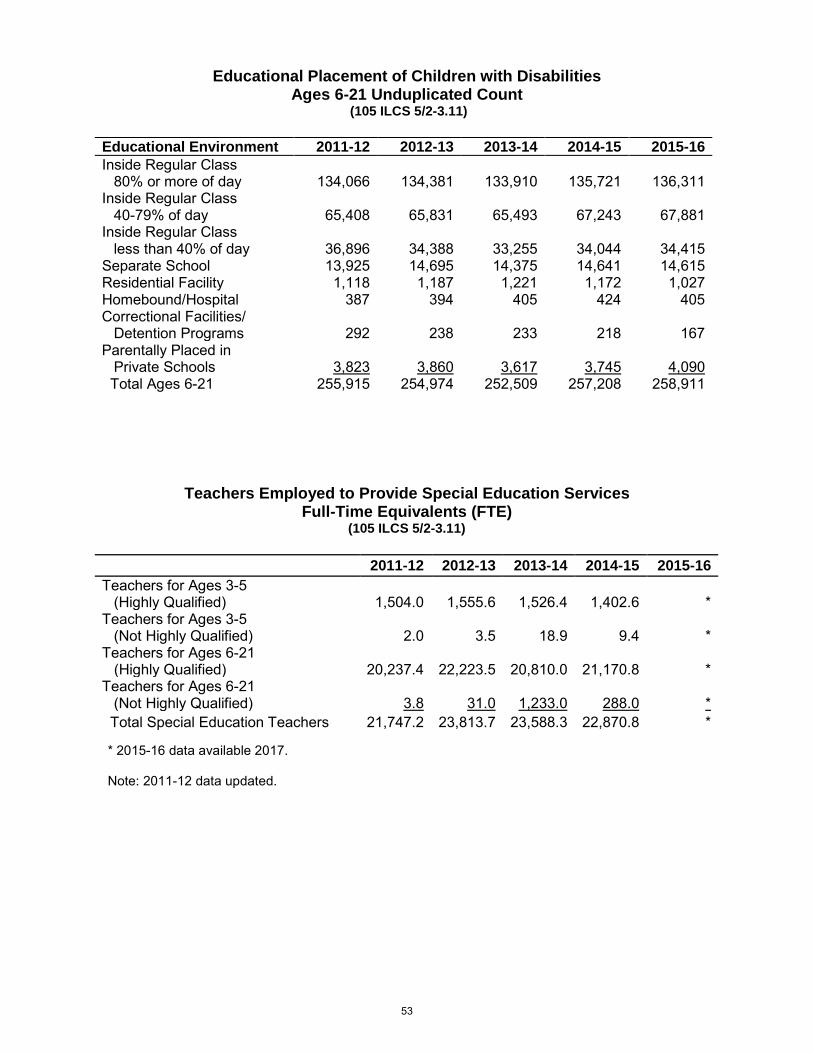
Educational Placement of Children with Disabilities Ages 6-21 Unduplicated Count
(105 ILCS 5/2-3.11)
Educational Environment 2011-12 2012-13 2013-14 2014-15 2015-16 Inside Regular Class
80% or more of day 134,066 134,381 133,910 135,721 136,311 Inside Regular Class
40-79% of day 65,408 65,831 65,493 67,243 67,881 Inside Regular Class
less than 40% of day 36,896 34,388 33,255 34,044 34,415 Separate School 13,925 14,695 14,375 14,641 14,615 Residential Facility 1,118 1,187 1,221 1,172 1,027 Homebound/Hospital 387 394 405 424 405 Correctional Facilities/
Detention Programs 292 238 233 218 167 Parentally Placed in
Private Schools 3,823 3,860 3,617 3,745 4,090 Total Ages 6-21 255,915 254,974 252,509 257,208 258,911
Teachers Employed to Provide Special Education Services Full-Time Equivalents (FTE)
(105 ILCS 5/2-3.11)
2011-12 2012-13 2013-14 2014-15 2015-16 Teachers for Ages 3-5
(Highly Qualified) 1,504.0 1,555.6 1,526.4 1,402.6 * Teachers for Ages 3-5
(Not Highly Qualified) 2.0 3.5 18.9 9.4 * Teachers for Ages 6-21
(Highly Qualified) 20,237.4 22,223.5 20,810.0 21,170.8 * Teachers for Ages 6-21
(Not Highly Qualified) 3.8 31.0 1,233.0 288.0 * Total Special Education Teachers 21,747.2 23,813.7 23,588.3 22,870.8 *
* 2015-16 data available 2017.
Note: 2011-12 data updated.
53

Paraprofessionals Employed to Provide Special Education Services Full-Time Equivalents (FTE)
(105 ILCS 5/2-3.11)
2011-12 2012-13 2013-14 2014-15 2015-16 Paraprofessionals for Ages 3-5
(Highly Qualified) 3,409.3 3,652.4 3,659.0 5,044.9 * Paraprofessionals for Ages 3-5
(Not Highly Qualified) 0.0 0.0 0.0 678.8 * Paraprofessionals for Ages 6-21
(Highly Qualified) 32,515.9 35,206.7 32,655.9 23,449.6 * Paraprofessionals for Ages 6-21
(Not Highly Qualified) 0.0 0.0 0.0 4,518.8 * Total Special Education Paraprofessionals 35,925.2 38,859.1 36,314.9 33,692.1 *
* 2015-16 data available 2017.
Special Education and Related Services Personnel Full-Time Equivalents (FTE)
(105 ILCS 5/2-3.11)
2011-12 2012-13 2013-14 2014-15 2015-16 Audiologists 35.1 34.5 34.8 34.9 * Counselors & Rehabilitation
Counselors 501.8 637.1 780.6 972.0 * Interpreters 200.4 230.5 196.1 223.8 * Medical/Nursing Service Staff 661.5 685.9 630.6 571.7 * Occupational Therapists 979.8 982.2 1,007.1 996.3 * Orientation & Mobility Specialists 24.8 29.3 23.4 22.0 * Physical Education Teachers/
Therapeutic Recreation Specialists 206.6 212.2 214.2 217.8 *
Physical Therapists 364.7 365.5 372.1 374.4 * Psychologists 2,068.8 2,157.7 2,104.1 2,172.5 * Social Workers 3,365.7 3,394.6 3,251.1 3,287.5 * Speech-Language Pathologists 3,656.1 3,852.3 3,742.5 3,899.4 * Total Related Services Personnel 12,064.3 12,581.7 12,356.5 12,772.1 *
* 2015-16 data available 2017.
Note: 2011-12 data updated.
54
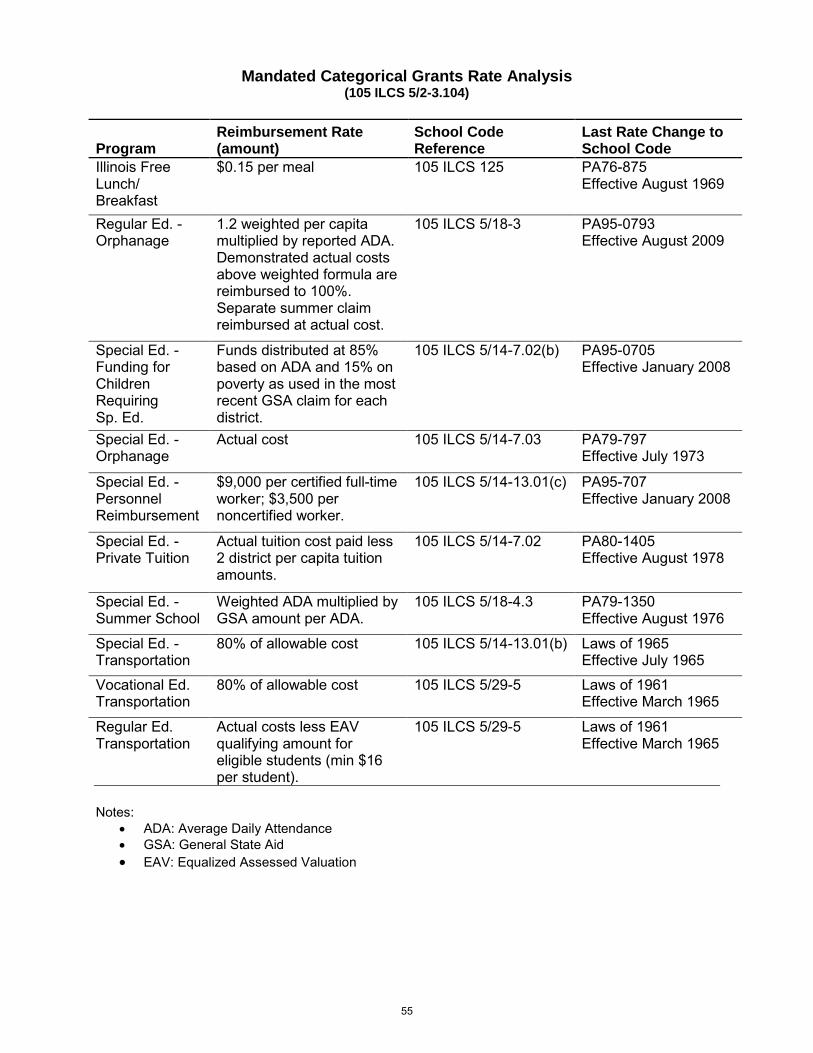
Mandated Categorical Grants Rate Analysis (105 ILCS 5/2-3.104)
Program Reimbursement Rate (amount)
School Code Reference
Last Rate Change to School Code
Illinois Free Lunch/ Breakfast
$0.15 per meal 105 ILCS 125 PA76-875 Effective August 1969
Regular Ed. - Orphanage
1.2 weighted per capita multiplied by reported ADA. Demonstrated actual costs above weighted formula are reimbursed to 100%. Separate summer claim reimbursed at actual cost.
105 ILCS 5/18-3 PA95-0793 Effective August 2009
Special Ed. - Funding for Children Requiring Sp. Ed.
Funds distributed at 85% based on ADA and 15% on poverty as used in the most recent GSA claim for each district.
105 ILCS 5/14-7.02(b) PA95-0705 Effective January 2008
Special Ed. - Orphanage
Actual cost 105 ILCS 5/14-7.03 PA79-797 Effective July 1973
Special Ed. - Personnel Reimbursement
$9,000 per certified full-time worker; $3,500 per noncertified worker.
105 ILCS 5/14-13.01(c) PA95-707 Effective January 2008
Special Ed. - Private Tuition
Actual tuition cost paid less 2 district per capita tuition amounts.
105 ILCS 5/14-7.02 PA80-1405 Effective August 1978
Special Ed. - Summer School
Weighted ADA multiplied by GSA amount per ADA.
105 ILCS 5/18-4.3 PA79-1350 Effective August 1976
Special Ed. - Transportation
80% of allowable cost 105 ILCS 5/14-13.01(b) Laws of 1965 Effective July 1965
Vocational Ed. Transportation
80% of allowable cost 105 ILCS 5/29-5 Laws of 1961 Effective March 1965
Regular Ed. Transportation
Actual costs less EAV qualifying amount for eligible students (min $16 per student).
105 ILCS 5/29-5 Laws of 1961 Effective March 1965
Notes: • ADA: Average Daily Attendance• GSA: General State Aid• EAV: Equalized Assessed Valuation
55

Teachers’ Retirement Systems
The purpose of these funds is to pay the statutorily required state share of the actuarial liability of the Teachers’ Retirement System, including the Teachers’ Retirement Insurance Program, and to subsidize the Chicago Teachers’ Pension Fund (Public Act 88-593).
These funds are appropriated directly to the Teachers’ Retirement System and the Chicago Teachers’ Pension Fund. The following represent historical appropriation amounts as shown in the Illinois State Budget Books:
Fiscal Year
Non-Chicago System*
Chicago System
Total Appropriations
Pension Fund
2016 $3,851,080,455 $0 $3,851,080,455 $12,105,000 2015 3,514,376,700 50,000,000 3,564,376,700 12,145,000 2014 3,529,128,000 0 3,529,128,000 11,903,000 2013 2,790,281,000 0 2,790,281,000 10,931,000 2012 2,494,094,000 0 2,494,094,000 10,449,000 2011 2,059,013,600 32,522,400 2,091,536,000 10,449,000 2010 913,988,700 32,522,400 946,511,100 5,029,000 2009 1,527,263,000 65,044,700 1,592,307,700 9,800,000 2008 1,109,891,000 65,044,700 1,174,935,700 10,218,000 2007 813,853,500 65,044,700 878,898,200 10,242,000
*Teachers’ Retirement Insurance Program (below) included in the above Non-ChicagoSystem totals for the following fiscal years:
2016 $108,258,261 2015 100,983,000 2014 90,430,000 2013 86,683,000 2012 87,622,000 2011 85,953,000 2010 79,007,000 2009 75,474,000 2008 68,596,000 2007 75,839,000
Note: Appropriations for FY 2005 through FY 2015 revised to reflect Illinois State Budget Books.
Data source: Illinois State Budget Books FY 2006 through FY 2017.
56

Illinois State Board of Education 2016 ANNUAL REPORT
Published by the Office of Communications, January 2017