Embed Size (px)
Citation preview
i
ii
Illinois Traffic and Pedestrian Stop Study
2020 ANNUAL REPORT: PEDESTRIAN STOP ANALYSIS
Part I Executive Summary and Appendices
Prepared for the Illinois Department of Transportation
By
The Mountain-Whisper-Light: Statistics & Data Science
In Cooperation with SC-B Consulting, Inc.
iii
Acknowledgements
The Mountain-Whisper-Light Statistics and SC-B Consulting, Inc. gratefully acknowledge the
contributions of Jessica Keldermans, Bureau Chief, Bureau of Data Collection, Illinois
Department of Transportation, and her associates at the Bureau of Data Collection. We are also
grateful to the law enforcement agencies and their staff for their diligence and patience in
collecting and processing the data used in this study.
2020 study team, Illinois Traffic and Pedestrian Stops Study
The Mountain-Whisper-Light: Statistics & Data Science
• Nayak L. Polissar, PhD, Principal Investigator
• Daniel S. Hippe, MS
• Nirnaya Miljacic, MS, PhD
• Rod Gullberg, MS
SC-B Consulting
• Sharie Carter-Bane, President
• Michele Shaffer, PhD
iv
Table of Contents
Executive Summary ........................................................................................................................ 1
I. Background ...................................................................................................................... 1
II. Introduction ...................................................................................................................... 2
III. Guide to Using Pedestrian Tables .................................................................................... 3
IV. Interpretation of Pedestrian Tables .................................................................................. 7
V. Benchmarks...................................................................................................................... 9
VI. Selected Findings ........................................................................................................... 10
VII. Some General Comments .............................................................................................. 14
VIII. Looking Ahead............................................................................................................... 15
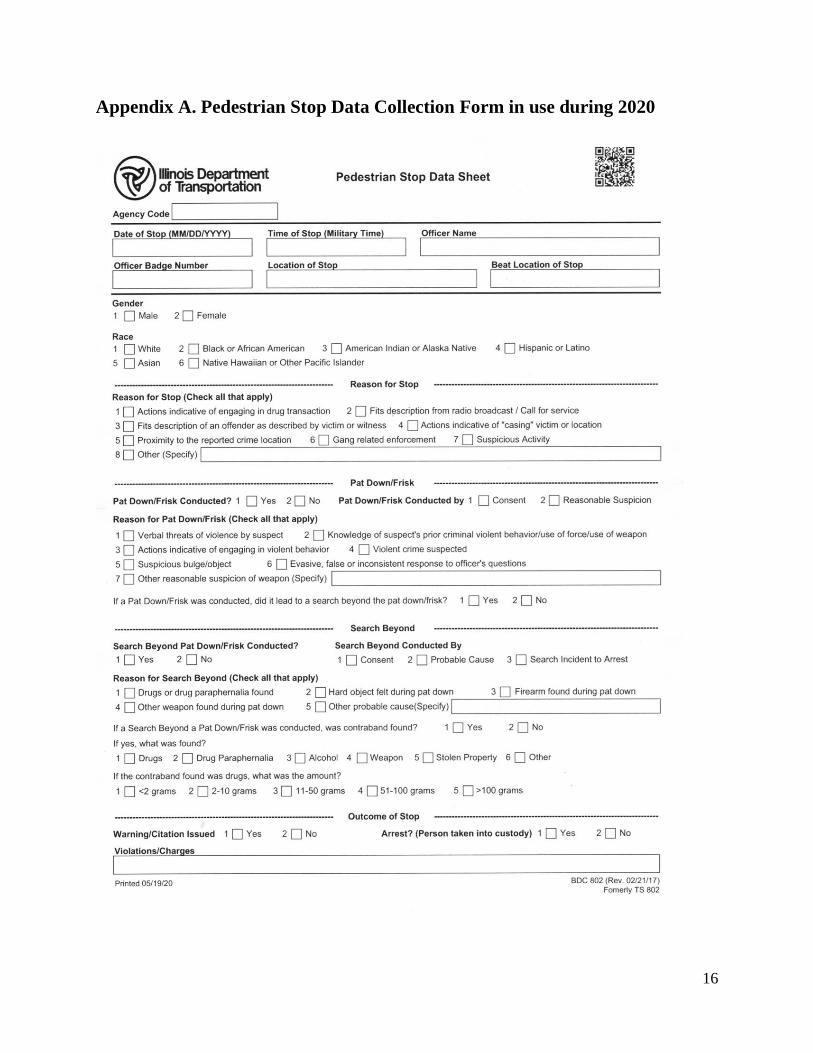
Appendix A. Pedestrian Stop Data Collection Form in use during 2020 ..................................... 16
Appendix B. Technical Notes on Rates, Percentages and Ratios ................................................. 17
Appendix C. Technical Notes on Benchmarks ............................................................................. 21
Appendix D. Additional Notes on the Law .................................................................................. 32
1
Executive Summary
I. Background
In October 2019, The Mountain-Whisper-Light, Inc. (aka the Mountain-Whisper-Light: Statistics
& Data Science, and hereafter, “TMWL”) was awarded a contract to conduct a statistical study of
the traffic and pedestrian stop data provided by law enforcement agencies to the Illinois Department
of Transportation (IDOT), pursuant to the Illinois Vehicle Code, 625 ILCS 5/11-212 Traffic and
Pedestrian Stop Statistical Study. TMWL is carrying out the project in cooperation with SC-B
Consulting Inc., an Illinois firm. A report has already been issued on 2019 traffic and pedestrian
stops in Illinois and is available online at https://www.idot.illinois.gov/transportation-system/local-
transportation-partners/law-enforcement/illinois-traffic-stop-study.
According to the IDOT website, “On July 18, 2003, Senate Bill 30 was signed into law to
establish a four-year statewide study of data from traffic stops to identify racial bias. The study
began on January 1, 2004, and was originally scheduled to end December 31, 2007. However, the
legislature extended the data collection several times, and also expanded the study to include data
on pedestrian stops. Public Act 101-0024, which took effect on June 21, 2019, eliminated the
study's scheduled end date of July 1, 2019, and extended the data collection.”
Under that provision of the Illinois Vehicle Code, the Agency is responsible for providing a
standardized law enforcement data compilation form (see Appendix A below) and analyzing the
data and submitting a report of the previous year's findings to the Governor, General Assembly,
the Racial Profiling Prevention and Data Oversight Board, and each law enforcement agency no
later than July 1 of each year. In May 2021, TMWL and SC-B, in cooperation with IDOT’s
Bureau of Data Collection (BDC), have provided copies of statistical tables to 852 law
enforcement agencies in the state of Illinois, based on data collection provided by the respective
agencies on traffic and pedestrian stops. These 852 agencies reported at least one traffic or
pedestrian stop.
We are pleased to submit this 2020 Annual Report for the Illinois Traffic and Pedestrian Stop
Study.
2
II. Introduction
How is this report structured?
The report is presented in two parts. Part I is this Executive Summary, which includes
appendices with detailed technical information on the statistical methodology and analysis. Part
II includes extensive tables (one set of tables for each law enforcement agency that collected data
for all stops conducted in 2020). The tables show stop rates for each racial group, along with
other statistics that cover activity during the stops, such as citations or warnings, searches and
contraband found.
To obtain the greatest benefit from this report, readers are encouraged to read the full Executive
Pedestrian Traffic Table and a Guide to Using Pedestrian Tables that includes definitions of
statistical terms used in this report and explanation of the data presented in each panel of the
tables. We also include an Interpretation section with additional details on the numeric results
presented in the tables and a plain-language description of how the analysis was implemented.
Finally, the section on Selected Findings highlights some statewide results. The Appendices
include technical material that describes the statistical methods and calculations in detail. The
information is provided for readers who wish to have a deeper understanding of the methodology.
What is the source of the data?
As noted above, per Illinois law, officers from law enforcement agencies are required to fill in a
report when they stop a driver or pedestrian. Separate templates are provided for traffic and
pedestrian stops.
To follow the convention of previous reporting on the Illinois Traffic and Pedestrian Stop Study,
we are submitting two separate reports, the Illinois Traffic Stop Study (ITSS) and the Illinois
Pedestrian Stop Study (IPSS). The above-mentioned data collection templates (known as Traffic
Stop or Pedestrian Stop Data Forms) are shown in Appendix A of the ITSS and IPSS. There is an
instruction manual that accompanies the traffic stops data collection form — available online at
http://www.idot.illinois.gov/Assets/uploads/files/Transportation-System/Pamphlets-&-
Brochures/Safety/2012TrafficStopDataSheetInstructions.pdf .
How were the data analyzed?
The results of the data collection are that 849 agencies generated data on 1,561,514 traffic stops
and 300 agencies generated data on 94,042 pedestrian stops in 2020. A total of 852 agencies
provided data on either traffic stops or pedestrian stops, with 552 agencies providing traffic stop
data only, 3 agencies providing pedestrian stop data only, and 297 agencies providing both traffic
and pedestrian stop data. Only 66 traffic stops (0.004% of stops) and zero pedestrian stops were
missing the race designation. Further statistical analysis was carried out to provide data that may
3
be helpful in determining if there is potential bias against minorities in initiating a stop or in the
activities that occur during a stop.
As specified by Illinois statute for this study, the tables report on the stops and subsequent
experience of individuals stopped. The stopped individuals are classified into one of six racial
groups. The law enforcement officer filling in the data collection form must use their judgment to
classify an individual into one of the following groups.
• Black or African American
• Hispanic or Latino
• Asian
• American Indian or Alaska Native
• Native Hawaiian or Other Pacific Islander
• White
The data collection forms are extensive. There are more than 60 data items listed for traffic stops
and more than 20 data items listed for pedestrian stops. Some items are left blank unless there are
further actions beyond a stop, such as a search.
Data collected by local agencies for pedestrian stops include:
• Information about the pedestrian (including race) and the officer
• The location of the stop
• Reason for the stop
• Outcome of the stop
• Pat down/frisk or search activity and findings of contraband.
III. Guide to Using Pedestrian Tables
While many readers of this report previously reviewed traffic and pedestrian stop tables for their
respective jurisdictions, here are some brief explanations of the statistical data.
Table 1 is included as an example to show stop rates, percentages and ratios. A ratio compares
either a rate or a percentage for a minority to the corresponding rate or percentage for Whites.
The ratios are intended to make it easier to determine the possibility of racial profiling. The word
“possibility” is very important, because racial profiling cannot be proved by the numeric results
in this report. Some of the inherent uncertainties and limitations of the statistics are explained
later.
The following section includes an example of pedestrian tables and offers a guide to the numbers
in the tables, explained panel by panel. The table reproduced here (Table 1) refers to all
pedestrian stops reported in 2020 for the state of Illinois. The counts, rates, percentages and ratios
are for purposes of illustration only and are not tied to any individual agency.
4
Before using the tables: Following the tables there is an important section on interpretation of
the rates, ratios, percentages and 95% confidence intervals. Reading that section is important to
enable users of this report to make a proper assessment of what the numbers represent.
Rates, percentages and ratios: The terms “rate,” “percentage” and “ratio” are used throughout
this report. A brief explanation of the terms is provided here.
A rate in this context is the number of individuals (such as the number of individuals stopped)
divided by the population the individuals came from, also known in this report as the
“benchmark,” a term that will be used repeatedly. For example, in Illinois in 2020 there were
21,046 stops of pedestrians whom the officer assigned to the category “Hispanic or Latino.” The
estimated benchmark population of Hispanic or Latinos aged 12-80 in Illinois in 2020 was
1,698,243. (As discussed later, individuals aged 12-80 in Illinois are considered to have a non-
negligible risk of being stopped.) Dividing the 21,046 by 1,698,243 yields the stop rate of 0.012.
That is, there was an average of 0.012 stops per member of the Hispanic or Latino population age
12-80. The decimal value 0.012 does not mean that 1.2% of Hispanic or Latinos in the age range
had a pedestrian stop. Some individuals may have been stopped more than once.
A percentage in this context has the usual meaning. For example, in Illinois in 2020 there were
12,483 stops of pedestrians whom the officer assigned to the category “White.” There were 3,946
of those stops with a pat down. The number of pat downs, 3,946, divided by the number of stops,
12,483, yields the decimal fraction 0.32. That fraction represented as a percentage is 32%. In
Illinois in 2020, 32% of stops of pedestrians assessed as being White resulted in a pat down.
The ratio used in this report is either the ratio of a minority rate to a White rate or the ratio of a
minority percentage to a White percentage. If the ratio is 2.0, for example, it means that the
minority rate (or percentage) is twice the White rate (or percentage).
Table 1 shows the Illinois statewide results for illustration of pedestrian stop reporting.
Following is a guide to each panel of the table.
Panel 1 (shaded rows) presents the pedestrian stops, benchmark, and stop rate by racial
group, and stop rate ratio for each minority group compared to White pedestrians. Ninety-five
percent confidence intervals are shown (in parentheses) for rates and rate ratios. The 95%
confidence interval is explained in a short section with that heading, below.
Panel 2 shows pat downs, searches beyond pat down, and outcomes of these searches for
each racial group. The number, percentage (in parentheses), and 95% confidence interval [in
brackets, like this] are shown for each outcome. The contraband-found percentage is
calculated based on all searches beyond pat down. The ratio and 95% confidence interval (in
parentheses) are shown, comparing each minority group to White pedestrians on percentage
with contraband found among all searches beyond pat down.
5
Panel 3 shows outcomes of the pedestrian stops including warning/citation (one combined
category) and custodial arrest for each racial group. The number, percentage (in parentheses),
and 95% confidence interval [in brackets] are shown for each outcome. The percentages are
based on all pedestrian stops for each minority group. The ratio of percentages and 95%
confidence interval (in parentheses) comparing each minority group to White pedestrians is
shown for custodial arrests.
A ratio of 1.0 for Whites: For all rows showing comparisons of minority groups to Whites, a
value of 1.0 is shown in the White racial group column, the reference group. In this column for
Whites, the Whites are being compared to themselves, so the ratio of rates must be 1.0. The
column is included to make it clear that the Whites are the reference group to which each
minority is compared.
Zero stops or zero benchmark: For some agencies, the number of stops or the benchmark value
or the number of outcomes may be zero for a racial group. When it is not possible to calculate a
rate or percentage or ratio and an associated 95% confidence interval because of zero stops or
zero benchmarks or zero outcomes, an “NA” is reported in the table. When reporting information
such as searches following stops, or contraband found, sometimes all racial groups have entries
of zero in the row. That is, there were no searches of any racial group, or no contraband found for
any racial group. In that case, the row is omitted. Similarly, when making comparisons to Whites,
if all minorities have counts of zero or the Whites have a count of zero, the ratios comparing each
minority to Whites cannot be computed and the row of ratios is omitted.
6
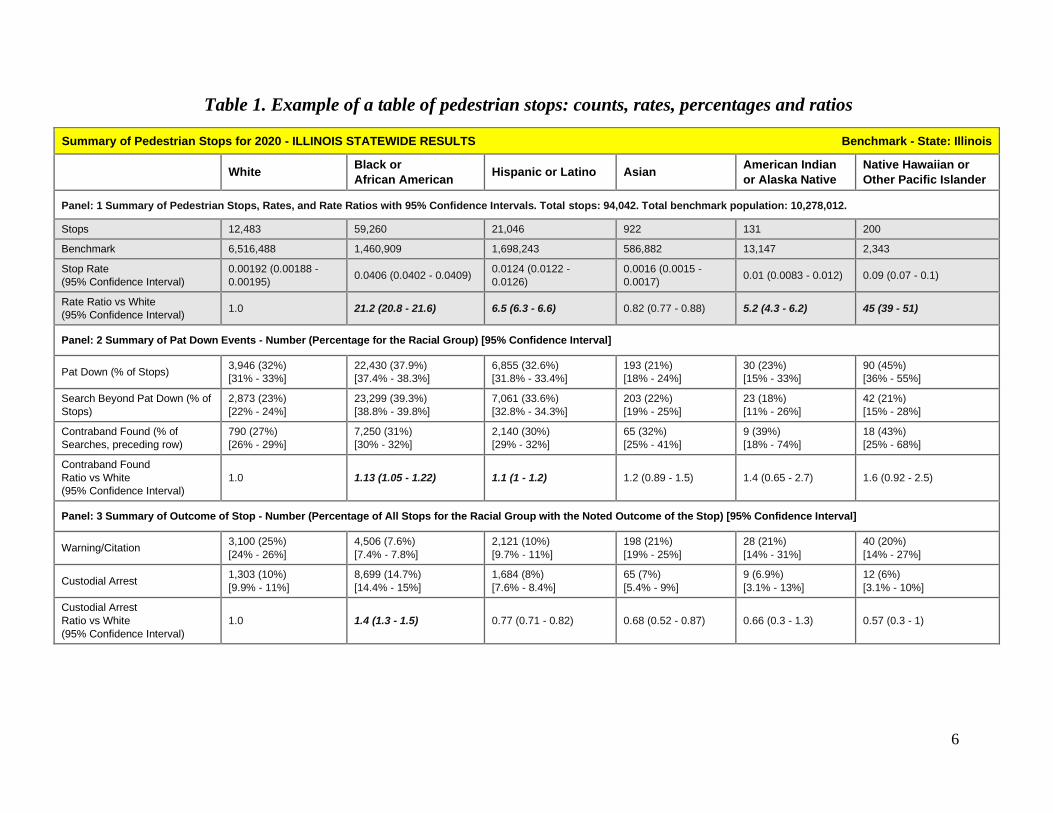
Table 1. Example of a table of pedestrian stops: counts, rates, percentages and ratios
Summary of Pedestrian Stops for 2020 - ILLINOIS STATEWIDE RESULTS Benchmark - State: Illinois
White Black or
African American Hispanic or Latino Asian
American Indian
or Alaska Native Native Hawaiian or
Other Pacific Islander
Panel: 1 Summary of Pedestrian Stops, Rates, and Rate Ratios with 95% Confidence Intervals. Total stops: 94,042. Total benchmark population: 10,278,012.
Stops 12,483 59,260 21,046 922 131 200
Benchmark 6,516,488 1,460,909 1,698,243 586,882 13,147 2,343
Stop Rate
(95% Confidence Interval) 0.00192 (0.00188 -
0.00195) 0.0406 (0.0402 - 0.0409) 0.0124 (0.0122 -
0.0126) 0.0016 (0.0015 -
0.0017) 0.01 (0.0083 - 0.012) 0.09 (0.07 - 0.1)
Rate Ratio vs White
(95% Confidence Interval) 1.0 21.2 (20.8 - 21.6) 6.5 (6.3 - 6.6) 0.82 (0.77 - 0.88) 5.2 (4.3 - 6.2) 45 (39 - 51)
Panel: 2 Summary of Pat Down Events - Number (Percentage for the Racial Group) [95% Confidence Interval]
Pat Down (% of Stops) 3,946 (32%)
[31% - 33%] 22,430 (37.9%)
[37.4% - 38.3%] 6,855 (32.6%)
[31.8% - 33.4%] 193 (21%)
[18% - 24%] 30 (23%)
[15% - 33%] 90 (45%)
[36% - 55%]
Search Beyond Pat Down (% of
Stops) 2,873 (23%)
[22% - 24%] 23,299 (39.3%)
[38.8% - 39.8%] 7,061 (33.6%)
[32.8% - 34.3%] 203 (22%)
[19% - 25%] 23 (18%)
[11% - 26%] 42 (21%)
[15% - 28%]
Contraband Found (% of
Searches, preceding row) 790 (27%)
[26% - 29%] 7,250 (31%)
[30% - 32%] 2,140 (30%)
[29% - 32%] 65 (32%)
[25% - 41%] 9 (39%)
[18% - 74%] 18 (43%)
[25% - 68%]
Contraband Found
Ratio vs White
(95% Confidence Interval) 1.0 1.13 (1.05 - 1.22) 1.1 (1 - 1.2) 1.2 (0.89 - 1.5) 1.4 (0.65 - 2.7) 1.6 (0.92 - 2.5)
Panel: 3 Summary of Outcome of Stop - Number (Percentage of All Stops for the Racial Group with the Noted Outcome of the Stop) [95% Confidence Interval]
Warning/Citation 3,100 (25%)
[24% - 26%] 4,506 (7.6%)
[7.4% - 7.8%] 2,121 (10%)
[9.7% - 11%] 198 (21%)
[19% - 25%] 28 (21%)
[14% - 31%] 40 (20%)
[14% - 27%]
Custodial Arrest 1,303 (10%)
[9.9% - 11%] 8,699 (14.7%)
[14.4% - 15%] 1,684 (8%)
[7.6% - 8.4%] 65 (7%)
[5.4% - 9%] 9 (6.9%)
[3.1% - 13%] 12 (6%)
[3.1% - 10%]
Custodial Arrest
Ratio vs White
(95% Confidence Interval) 1.0 1.4 (1.3 - 1.5) 0.77 (0.71 - 0.82) 0.68 (0.52 - 0.87) 0.66 (0.3 - 1.3) 0.57 (0.3 - 1)
7
IV. Interpretation of Pedestrian Tables
95% Confidence Interval
Table 1 presents a “95% confidence interval” for each rate, percentage or ratio. The 95%
confidence interval reflects uncertainty in estimating the rate, percentage or ratio due to sampling
variability. The 95% confidence interval provides a range of plausible values. The “95%” figure
means that when various studies include such an interval, 95% of the studies, on the average,
will include the true value in the interval. Because there is an element of chance involved in
being stopped, being searched, etc. the true value of a rate or percentage or ratio is not known.
The 95% confidence interval uses widely accepted methods and expresses some of the
uncertainty in the estimated rate, percentage, or ratio. The uncertainty is often due to small
numbers of stops or a small benchmark population in the geographic area used to calculate rates,
percentages, or ratios.
Ratios
A ratio of rates or percentages with a value of 1.0 (one) indicates that the rates or percentages are
equal between the minority group and Whites. Ratios above or below 1.0 show greater or lesser
stop activity with minorities, respectively. Comparisons of minority groups to White drivers or
White pedestrians where the 95% confidence interval lies above 1.0 (one) are bolded in the stops
tables. When the ratio is bolded, one can say that the value of 1.0 does not fall within the 95%
confidence interval of the estimated ratio. These bolded ratios are statistical deviations and may
be the basis for further consideration of potential racial disparities related to stops. A bolded ratio
does not prove that there is racial profiling. (See “Limitations,” below.) A bolded ratio may be
taken as the basis for further inquiry. In addition to whether or not a ratio is bolded, the absolute
magnitude of the ratio should be considered. For example, a bolded ratio of 5.0 is a higher
priority to investigate than a small bolded ratio of 1.2. A larger ratio implies the potential impact
on individuals is larger, and it is less likely that the elevated ratio is only due to limitations of the
chosen benchmark than when the ratio is closer to 1.0.
Limitations
There is a limitation in the use of ratios to determine potential racial disparities. The 95%
confidence intervals for stop rates and stop rate ratios do not consider the error in estimating the
driver and pedestrian benchmark populations. (The population of drivers or pedestrians who are
considered the source of the persons stopped by an agency’s officers are a population, and that
population is referred to as the “benchmark” for the agency.) Note that each law enforcement
agency has a “jurisdiction,” which is the geographic area that the agency is responsible for
policing. In this report “agency” and “jurisdiction” are sometimes used interchangeably.
The statistical issue with the benchmarks is that the drivers and pedestrians include persons who
reside in communities both inside and outside of the specific area of jurisdiction of an agency.
8
For this study, the benchmark populations have been estimated based on the population located
in cities and counties of Illinois. Those population counts are available from surveys carried out
by the U.S. Census Bureau. The boundaries of the cities and counties may not closely fit the
actual area of residence of drivers and pedestrians who might be encountered in a specific
community.
Thus, the benchmarks have some error, and the extent of the error is unknown. If it were possible
to estimate this error as it affects rates and rate ratios, the 95% confidence intervals would be
wider and, thus, some confidence intervals might then include 1.0 (no racial disparity) and would
not prompt bolding and the need for further inquiry. (The section labelled “Benchmarks”,
below, describes the methods used to estimate the population from which stopped individuals
originated.)
The census ACS surveys have been used to designate benchmark populations for this study
because they have readily available populations for cities and counties. The census city and
county populations are virtually the only option for building benchmarks within the resources
available to this study to annually choose benchmarks for more than 800 law enforcement
agencies. The city and county populations do have some validity as benchmarks because they
include the jurisdiction of interest, and it is expected that a substantial fraction of pedestrians in
the jurisdiction originate from the designated benchmark city (or cities) and county (or counties).
In the “Looking Ahead” section later in this report we introduce a potential approach to
benchmarking based on Zip codes. Zip codes are being investigated as potential building blocks
for benchmarks. Research continues on this alternative.
Another limitation that may affect the rates, percentages and ratios is the designation of race by
the law enforcement officer conducting the stop. That designation of race might not correspond
to the driver’s or pedestrian’s own racial identity. In addition, the stop rate for a racial group will
depend on a) the assignment of beats (geographic surveillance area) to officers in a jurisdiction
and b) the degree of overlap of those beats to the residential area of each racial group. If there is
higher (or lower) surveillance of an area with a high residential concentration of a racial group,
then that can lead to a higher (or lower) stop rate for the racial group, compared to areas where
surveillance is constant across all racial groups.
Statistics based on stops only
The percentages and ratios of percentages in the tables are based on stop counts and stop activity
only. The percentages and ratios of percentages do not depend on the estimated benchmark
population, and they do not have the potential benchmark error noted above. Percentages based
on stops will be a resource for any inquiry about potential racial profiling.
It is important to note that the percentages are calculated with reference to a specific activity. For
example, in the pedestrian tables, the percentage of searches beyond pat down for a racial group
is a percentage of stops leading to a search beyond pat down. The percentage of contraband
9
found is the percentage of pedestrian searches beyond pat down leading to contraband found.
For percentages, each row label (or the heading for the panel) indicates the basis for the
percentage.
Can stop rates be compared across years?
The methodology used for calculating stop rates in this study (and for 2019 stops) differs from
studies of stops in 2018 and earlier. While the new methodology provides more accurate stop
rates, the changes make it difficult to compare results from the 2020 stops analysis to the
analyses in years prior to 2019. (The 2020 stop statistics can be compared to 2019.) As explained
in other sections of this report, more recent population data have been used for benchmarks for
2019 and 2020 stops than for studies of stops in 2018 and earlier.
These and other changes have improved the estimate of the benchmark populations and the
accuracy of stop rates. Thus, any difference in rates between 2019 or 2020 stops reports and
earlier stops reports (2018 and earlier) may be at least partly due to a change in methods rather
than to a real change in stop rates. The new methods are intended to estimate the benchmark
population more accurately. Another factor making it difficult to compare 2019-2020 stop rates
to 2018 rates (and earlier) is that the 2019-2020 reports present rates, percentages and rate ratios
separately for each of the six individual races—rather than with all minorities combined into one
category, as used in the 2018 and earlier reports. Perusal of tables in Part II of this report will
show the reader that the five minority races do have different stop rates. The statewide rates in
Table 1, Panel 1, above, show a diversity of stop rates among the six races, and, also, among the
five minority races.
Certain percentages will be comparable across years, because the percentages are based on stops
data only, and percentages are calculated in the same manner as in previous years. However, to
compare a percentage based on 2020 stops data to a percentage reported in a year prior to 2019,
some additional calculations will be needed. This 2020 stops report and the 2019 stops report
present results for each racial group, whereas reports prior to 2019 combined five races into one
group: all minorities. In order to calculate a percentage for 2020 stops of all minorities, the user
will need to add together (across the five minority racial groups) all of the numerators and,
separately, all of the denominators and then divide the numerator sum by the denominator sum,
then multiply by 100% to get the all-minority percentages. As noted earlier, this report presents
results for each racial group separately, since the minority groups do have differing rates,
percentages and ratios in some jurisdictions.
V. Benchmarks
The number of stops for each racial group and each agency is compared to a “benchmark” in
order to calculate the agency’s stop rate for the racial group. The benchmark provides an
estimated population count of each of the six racial groups. These population counts are then
10
compared to the pedestrian stop counts of each racial group to assess and compare the stop rates
(stops per unit of population) of each racial group. See Appendix C of this report, Technical
Notes on Benchmarks, for a detailed discussion of benchmarks and associated calculations,
including important limitations.
The methods for calculating the benchmark for each agency for this report is the same as the
methods used for the report on 2019 stops, which rely primarily on local population statistics for
the associated cities or counties. However, the numeric values of the benchmarks for 2020 stops
are generally different than those for 2019 stops because the underlying population statistics are
updated annually. The primary source for population statistics in this report is the 2015-2019 5-
year American Community Survey (ACS), provided by the U.S. Census Bureau, the most recent
release available. The 2019 stops report used the prior year’s release, 2014-2018.
VI. Selected Findings
This section of the report shows some tables and figures that present results on the agencies and
their pedestrian stops from the entire state of Illinois for 2020. Some results are contrasted with
their corresponding 2019 values.
Coronavirus Disease 2019 (COVID-19)
The COVID-19 pandemic in the United States had a substantial impact on the number of stops
made in 2020, as is apparent from multiple figures shown below. The first confirmed case of
COVID-19 was detected in Illinois on January 23, 20201. On March 16th and 17, 2020, the
Illinois State government closed bars, restaurants, and schools2 and ultimately executed a
statewide state-at-home order starting March 21, 20203. Due to the impact of COVID-19, some
patterns observed this year may be one-time events and some year-to-year trends may be
obscured.
Agency reporting status
Among the 1006 agencies that could submit stops data to IDOT, nearly 30% of the agencies had
stops and provided complete data for 2020 stops to IDOT (Table 2, top numeric row). A total of
290 agencies had no pedestrian stops (28.8%) and 41.4% of agencies did not submit any stops
data (“Non-compliant”). The fraction of agencies non-compliant with pedestrian stops
1 Ghinai I, McPherson TD, Hunter JC, et al. First known person-to-person transmission of severe acute respiratory syndrome coronavirus 2 (SARS-CoV-2) in the USA. Lancet. 2020;395(10230):1137-1144. doi:10.1016/S0140-6736(20)30607-3
2 Chicago Tribune. Mar 13, 2020. Governor cancels Illinois schools statewide until March 30 to slow the spread of coronavirus.
3 Chicago Channel 5 website. Published March 20, 2020. Updated on March 20, 2020, at 10:42 pm. Illinois Governor Issues Stay-at-Home Order. Accessed on June 1, 2021, at https://www.nbcchicago.com/news/local/illinois-governor-expected-to-issue-stay-at-home-order-sources/2241118/
11
submission was approximately three time larger than the corresponding non-compliant
percentage (13.9%) for traffic stops submission.
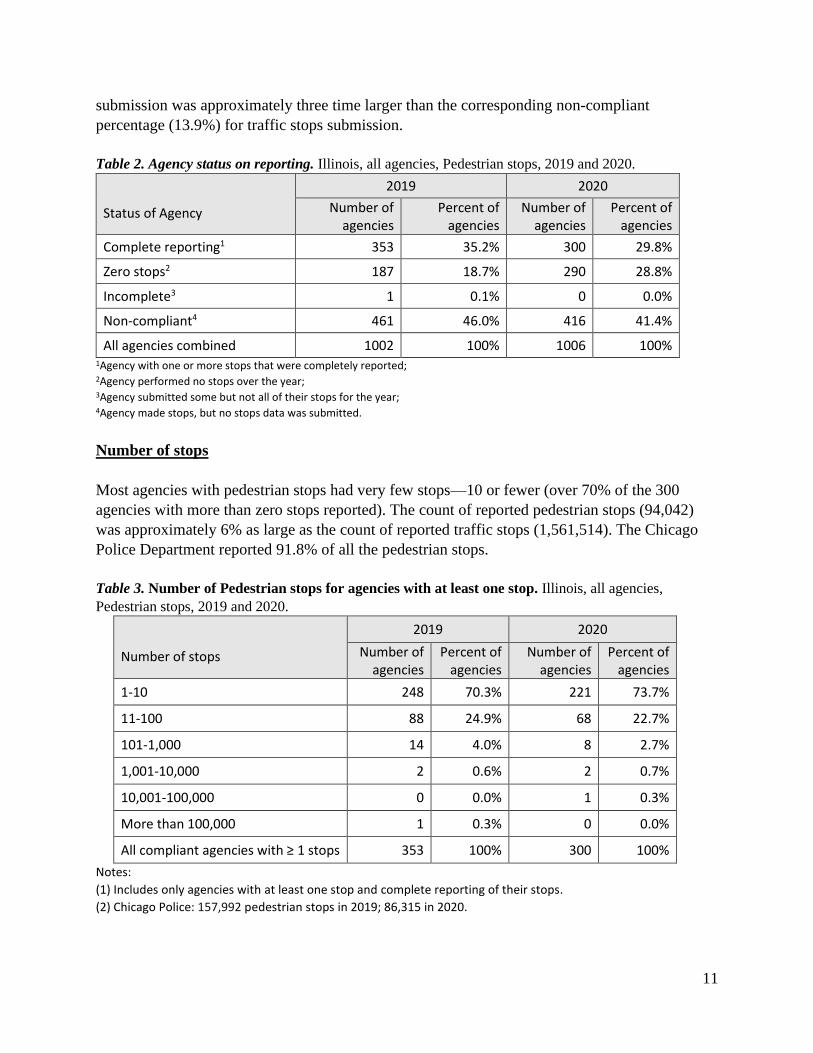
Table 2. Agency status on reporting. Illinois, all agencies, Pedestrian stops, 2019 and 2020.
Status of Agency
2019 2020
Number of agencies
Percent of agencies
Number of agencies
Percent of agencies
Complete reporting1 353 35.2% 300 29.8%
Zero stops2 187 18.7% 290 28.8%
Incomplete3 1 0.1% 0 0.0%
Non-compliant4 461 46.0% 416 41.4%
All agencies combined 1002 100% 1006 100% 1Agency with one or more stops that were completely reported; 2Agency performed no stops over the year; 3Agency submitted some but not all of their stops for the year; 4Agency made stops, but no stops data was submitted.
Number of stops
Most agencies with pedestrian stops had very few stops—10 or fewer (over 70% of the 300
agencies with more than zero stops reported). The count of reported pedestrian stops (94,042)
was approximately 6% as large as the count of reported traffic stops (1,561,514). The Chicago
Police Department reported 91.8% of all the pedestrian stops.
Table 3. Number of Pedestrian stops for agencies with at least one stop. Illinois, all agencies,
Pedestrian stops, 2019 and 2020.
Number of stops
2019 2020
Number of agencies
Percent of agencies
Number of agencies
Percent of agencies
1-10 248 70.3% 221 73.7%
11-100 88 24.9% 68 22.7%
101-1,000 14 4.0% 8 2.7%
1,001-10,000 2 0.6% 2 0.7%
10,001-100,000 0 0.0% 1 0.3%
More than 100,000 1 0.3% 0 0.0%
All compliant agencies with ≥ 1 stops 353 100% 300 100%
Notes:
(1) Includes only agencies with at least one stop and complete reporting of their stops.
(2) Chicago Police: 157,992 pedestrian stops in 2019; 86,315 in 2020.
12
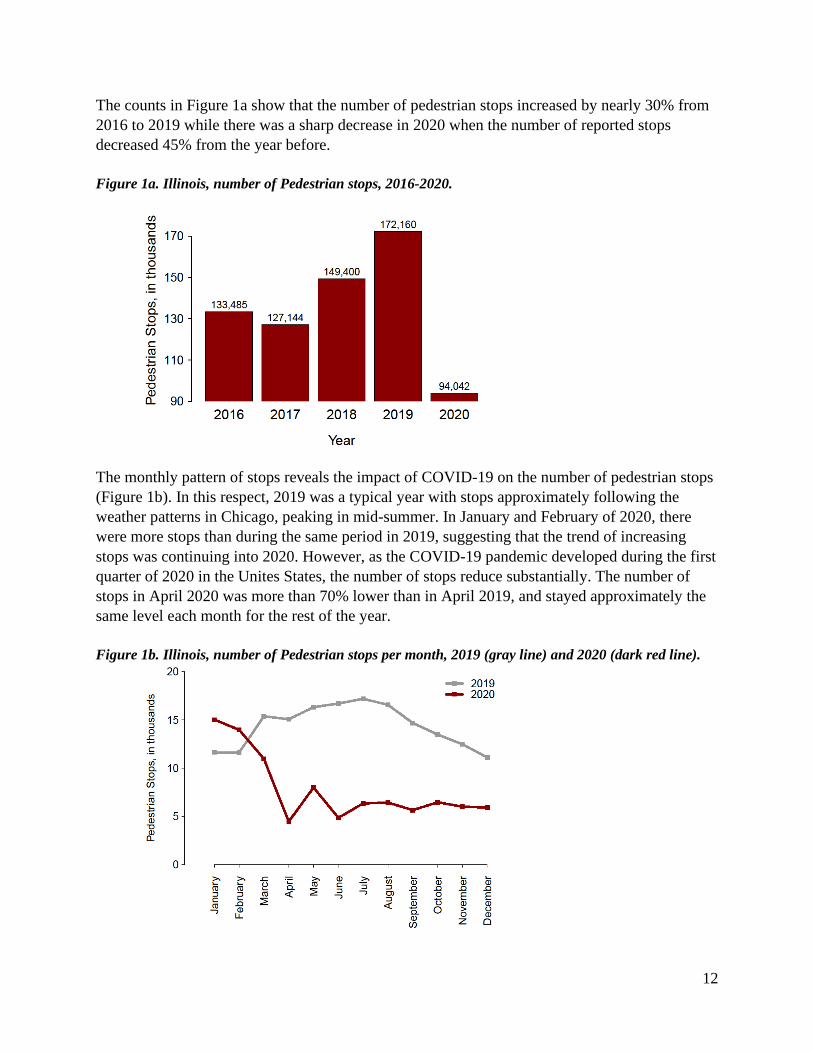
The counts in Figure 1a show that the number of pedestrian stops increased by nearly 30% from
2016 to 2019 while there was a sharp decrease in 2020 when the number of reported stops
decreased 45% from the year before.
Figure 1a. Illinois, number of Pedestrian stops, 2016-2020.
The monthly pattern of stops reveals the impact of COVID-19 on the number of pedestrian stops
(Figure 1b). In this respect, 2019 was a typical year with stops approximately following the
weather patterns in Chicago, peaking in mid-summer. In January and February of 2020, there
were more stops than during the same period in 2019, suggesting that the trend of increasing
stops was continuing into 2020. However, as the COVID-19 pandemic developed during the first
quarter of 2020 in the Unites States, the number of stops reduce substantially. The number of
stops in April 2020 was more than 70% lower than in April 2019, and stayed approximately the
same level each month for the rest of the year.
Figure 1b. Illinois, number of Pedestrian stops per month, 2019 (gray line) and 2020 (dark red line).
13
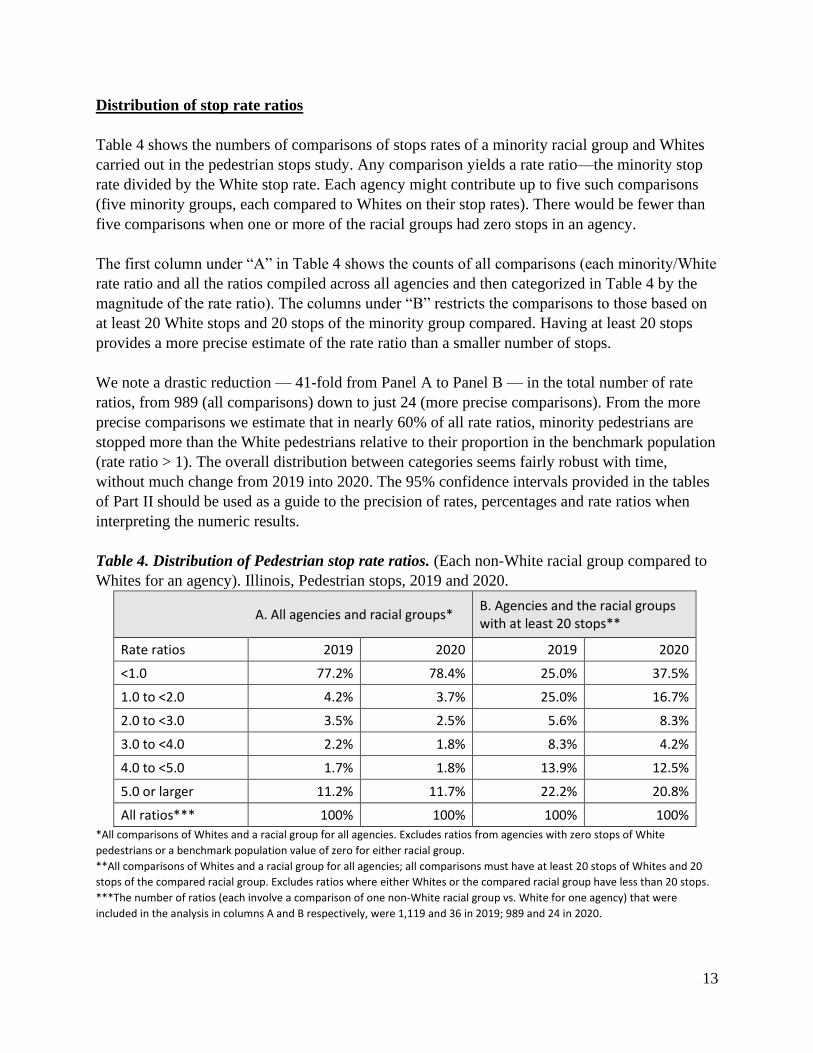
Distribution of stop rate ratios
Table 4 shows the numbers of comparisons of stops rates of a minority racial group and Whites
carried out in the pedestrian stops study. Any comparison yields a rate ratio—the minority stop
rate divided by the White stop rate. Each agency might contribute up to five such comparisons
(five minority groups, each compared to Whites on their stop rates). There would be fewer than
five comparisons when one or more of the racial groups had zero stops in an agency.
The first column under “A” in Table 4 shows the counts of all comparisons (each minority/White
rate ratio and all the ratios compiled across all agencies and then categorized in Table 4 by the
magnitude of the rate ratio). The columns under “B” restricts the comparisons to those based on
at least 20 White stops and 20 stops of the minority group compared. Having at least 20 stops
provides a more precise estimate of the rate ratio than a smaller number of stops.
We note a drastic reduction — 41-fold from Panel A to Panel B — in the total number of rate
ratios, from 989 (all comparisons) down to just 24 (more precise comparisons). From the more
precise comparisons we estimate that in nearly 60% of all rate ratios, minority pedestrians are
stopped more than the White pedestrians relative to their proportion in the benchmark population
(rate ratio > 1). The overall distribution between categories seems fairly robust with time,
without much change from 2019 into 2020. The 95% confidence intervals provided in the tables
of Part II should be used as a guide to the precision of rates, percentages and rate ratios when
interpreting the numeric results.
Table 4. Distribution of Pedestrian stop rate ratios. (Each non-White racial group compared to
Whites for an agency). Illinois, Pedestrian stops, 2019 and 2020.
A. All agencies and racial groups* B. Agencies and the racial groups with at least 20 stops**
Rate ratios 2019 2020 2019 2020
<1.0 77.2% 78.4% 25.0% 37.5%
1.0 to <2.0 4.2% 3.7% 25.0% 16.7%
2.0 to <3.0 3.5% 2.5% 5.6% 8.3%
3.0 to <4.0 2.2% 1.8% 8.3% 4.2%
4.0 to <5.0 1.7% 1.8% 13.9% 12.5%
5.0 or larger 11.2% 11.7% 22.2% 20.8%
All ratios*** 100% 100% 100% 100%
*All comparisons of Whites and a racial group for all agencies. Excludes ratios from agencies with zero stops of White
pedestrians or a benchmark population value of zero for either racial group.
**All comparisons of Whites and a racial group for all agencies; all comparisons must have at least 20 stops of Whites and 20
stops of the compared racial group. Excludes ratios where either Whites or the compared racial group have less than 20 stops.
***The number of ratios (each involve a comparison of one non-White racial group vs. White for one agency) that were
included in the analysis in columns A and B respectively, were 1,119 and 36 in 2019; 989 and 24 in 2020.
14
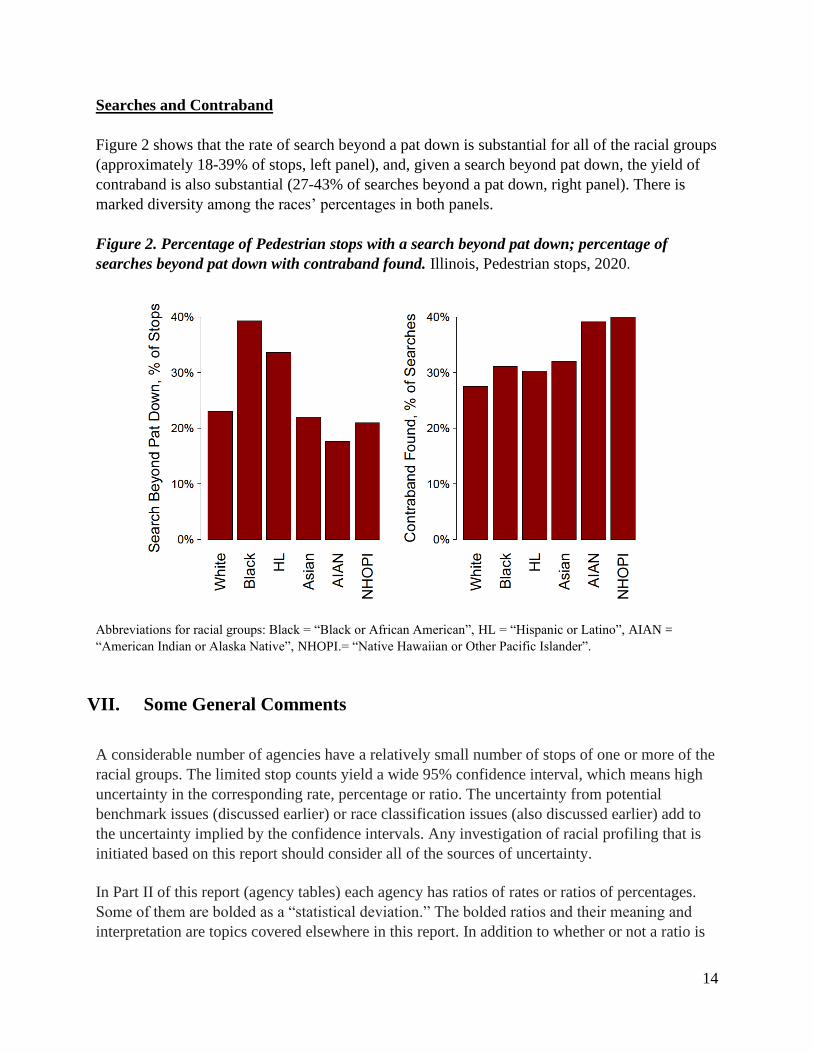
Searches and Contraband
Figure 2 shows that the rate of search beyond a pat down is substantial for all of the racial groups
(approximately 18-39% of stops, left panel), and, given a search beyond pat down, the yield of
contraband is also substantial (27-43% of searches beyond a pat down, right panel). There is
marked diversity among the races’ percentages in both panels.
Figure 2. Percentage of Pedestrian stops with a search beyond pat down; percentage of
searches beyond pat down with contraband found. Illinois, Pedestrian stops, 2020.
Abbreviations for racial groups: Black = “Black or African American”, HL = “Hispanic or Latino”, AIAN =
“American Indian or Alaska Native”, NHOPI.= “Native Hawaiian or Other Pacific Islander”.
VII. Some General Comments
A considerable number of agencies have a relatively small number of stops of one or more of the
racial groups. The limited stop counts yield a wide 95% confidence interval, which means high
uncertainty in the corresponding rate, percentage or ratio. The uncertainty from potential
benchmark issues (discussed earlier) or race classification issues (also discussed earlier) add to
the uncertainty implied by the confidence intervals. Any investigation of racial profiling that is
initiated based on this report should consider all of the sources of uncertainty.
In Part II of this report (agency tables) each agency has ratios of rates or ratios of percentages.
Some of them are bolded as a “statistical deviation.” The bolded ratios and their meaning and
interpretation are topics covered elsewhere in this report. In addition to whether or not a ratio is
15
bolded, the absolute magnitude of the ratio should be considered when interpreting the results, as
discussed earlier.
If a ratio is not bolded, it usually does not prove that there is no racial profiling in the agency. It
is worth looking at the upper and lower bound of the 95% confidence interval to see what the
uncertainty is. That interval quantifies the uncertainty and shows the largest ratio and the
smallest ratio that are reasonably plausible, given the data.
For example, consider a ratio of 1.0 for a specific minority percentage of stops with a search,
compared to the corresponding White percentage of stops with a search—in a particular agency.
The ratio of 1.0 indicates that the percentage of stops with a search was the same for both the
Whites and for the specific minority group. However, the counts of searches are very small in
this example, and the 95% confidence interval for the ratio is 0.025 up to 5.8. (This is similar to
an actual agency result.) That is, it is plausible that the true search percentage of the minority
group is anywhere from one-fortieth of the White percentage up to almost six times the White
percentage.
Clearly, in a case like the one described above, we do not know enough about the ratio to draw
any conclusion except that we are uncertain. Thus, a confidence interval for a ratio that includes
1.0 and is very wide (encompassing values well above the calculated ratio and also well below
the ratio) usually means that presence or absence of potential racial profiling cannot be
determined from the data in hand.
Lastly, while there is a considerable focus on the stop rate ratios reported in Panel 1 of the tables
in Part II of this report (detailed tables), the other panels provide valuable complementary
information on the outcomes of stops and how the outcome statistics compare between racial
groups. As noted earlier, the stop outcome results are compared among individuals that were
stopped and do not rely on any external population benchmark. This avoids some limitations of
benchmarks. Ultimately, stop results for an agency should be interpreted holistically, considering
all panels together; different panels may suggest different interpretations when viewed
individually.
VIII. Looking Ahead
TMWL is continuing to review the current statistical methodology and consider refinements and
improvements. The Executive Summary of the Traffic Stop Analysis, 2020 Annual Report,
describes two potential improvements that are being investigated for future stop reports. See the
“Looking Ahead” section of Part I (Executive Summary) of the traffic report.
16
Appendix A. Pedestrian Stop Data Collection Form in use during 2020
17
Appendix B. Technical Notes on Rates, Percentages and Ratios
B.1. Overview
This technical appendix includes a detailed explanation of the rate, post-stop outcomes, and ratio
calculations used in constructing the statewide and agency tables that appear in Part II of this
report. We explain how comparisons of each minority group to White drivers or pedestrians are
carried out. We also explain how the confidence interval is calculated based on known sources of
uncertainty in the data4. Further, this section describes how an agency may be designated (by a
bold font in the tables) as potentially standing out beyond an assumption of no racial profiling.
An agency that is designated as standing out might use this report as a basis for further inquiry.
As stated elsewhere and repeated here, there is nothing in this report which proves an agency is
practicing racial profiling. We provide some limitations for interpreting the findings based on the
available data and methods.
B.2. Stop rates, post-stop outcomes, and ratio calculations
We performed all calculations for the entire state of Illinois and for each agency.
B.2.1 Stop rates and rate ratios
We calculated stop rates separately for each racial group by dividing the number of stops
in the racial group by the benchmark estimate of the pedestrian population in the racial
group. (A description of the methods used to estimate the benchmark populations is
included in Appendix C.)
We assumed the number of stops followed a Poisson distribution, used in previous
examination of racial disparities in traffic stops (Gelman et al. 2007, Ridgeway 2007) and
calculated 95% confidence intervals for the rates using exact methods (Garwood 1936).
When the benchmark estimate of the population was zero, no rate or confidence interval
could be calculated. A benchmark population of zero for a specific minority group
happens when the census population estimate for the minority is zero.
We compared each minority group to White drivers or pedestrians using the ratio of the
minority group stop rate to the White group stop rate. We calculated a 95% confidence
interval for each rate ratio by conditioning on the sum of the numbers of stops in the two
racial groups being compared. Assuming the number of stops in each group followed a
Poisson distribution, conditioning on the sum of the number of stops creates a binomial
variable and an exact confidence was calculated using binomial methods (Lehmann and
Romano 2005). If it was impossible to calculate a rate because of a zero benchmark, or if
4 The estimated benchmark population is an example of a component of the methodology that has uncertainty that could not be quantified for this study.
18
the number of stops in the White group was zero, no rate ratio or confidence interval was
reported.
A rate ratio of 1.0 indicates the minority group and White drivers or pedestrians had
equal rates of stops. If the 95% confidence interval lies entirely above 1.0, the rate ratio is
statistically significantly greater than 1.0 and may require agency inquiry. These
statistically significant rate ratios are bolded in the summary tables. These bolded ratios
are statistical deviations, and the basis for further consideration of potential racial
disparities. Comparisons of minority groups to White drivers or pedestrians where the
95% confidence lies below 1.0 (one) are not bolded because the intent of this study is to
identify potential racial profiling that discriminates against minority drivers or
pedestrians.
For all calculations, we assumed the benchmark accurately captured the population of
drivers or pedestrians. The benchmark used to calculate each rate is itself an estimate of
the population of drivers or pedestrians for a racial group. Confidence intervals of rates
and rate ratios assumed only sampling error and thus do not account for this additional
source of error in benchmark estimates. Accounting for benchmark error would increase
the width of the confidence intervals reported for rates and rate ratios and would likely
reduce the number of agencies that appear to stand out as needing further inquiry.
B. 2.2 Post-stop outcomes
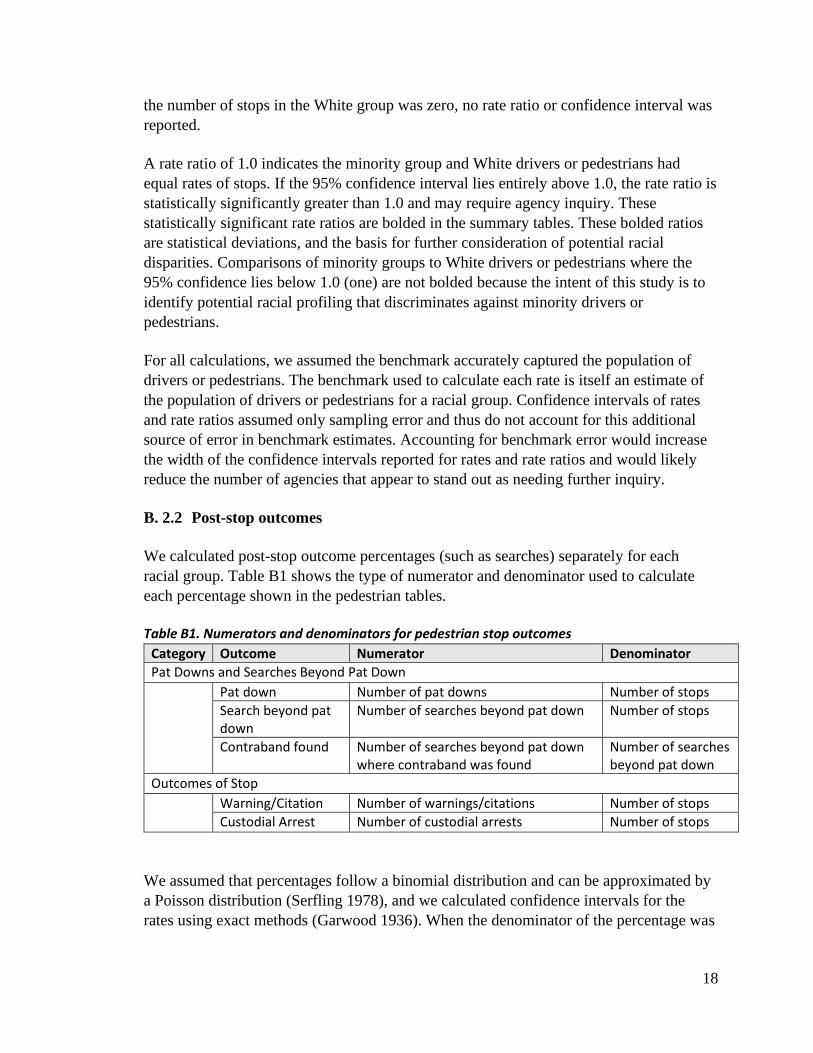
We calculated post-stop outcome percentages (such as searches) separately for each
racial group. Table B1 shows the type of numerator and denominator used to calculate
each percentage shown in the pedestrian tables.
Table B1. Numerators and denominators for pedestrian stop outcomes
Category Outcome Numerator Denominator
Pat Downs and Searches Beyond Pat Down
Pat down Number of pat downs Number of stops
Search beyond pat down
Number of searches beyond pat down Number of stops
Contraband found Number of searches beyond pat down where contraband was found
Number of searches beyond pat down
Outcomes of Stop
Warning/Citation Number of warnings/citations Number of stops
Custodial Arrest Number of custodial arrests Number of stops
We assumed that percentages follow a binomial distribution and can be approximated by
a Poisson distribution (Serfling 1978), and we calculated confidence intervals for the
rates using exact methods (Garwood 1936). When the denominator of the percentage was
19
zero (for example, an agency had a benchmark of zero for a specific racial group), no
percentage or confidence interval could be calculated.
For selected outcomes we compared each minority group to White pedestrians using the
ratio of the minority group percentage to the White group percentage. We calculated a
95% confidence interval for each ratio using exact methods (Lehmann and Romano
2005). If it was impossible to calculate a percentage because of a zero denominator, or if
the numerator of the White group percentage was zero, no ratio or confidence interval
was reported.
B.3 Durations
We calculated the median durations of stops separately for each racial group. The median
represents the value such that about half of stops have a shorter duration than the median and
half of stops have a longer duration than the median.
B.4 Limitations
For all calculations, we assumed that the driver or pedestrian was assigned to the correct racial
group. However, an officer’s assessment of the race of a driver may be in error. Because police
officers made the racial group assignment, there is a potential misclassification bias of drivers or
pedestrians. If misclassification resulted in a minority driver or pedestrian frequently being
categorized in a different minority group, the stop rates of some minority groups may be
underestimated, while others are overestimated. Consequently, the rate ratios of some minority
groups may be underestimated, while others are overestimated. This is a limitation that would be
difficult to correct based on the available information.
Some of the alerts to rate ratios (bolded font in the tables) may be “false positives.” This can
happen as follows. Within the statewide or individual agency tables for traffic and pedestrian
stops, we calculated five minority group comparisons with the White group. There were five of
these comparisons for each ratio analysis. For example, there are five ratios comparing the stop
rate for each of the five minorities to the stop rate for Whites5. Thus, we constructed five 95%
confidence intervals—one each for the five stop-rate ratios. That is, each agency was checked for
profiling in each of five minority groups. For each minority comparison with White drivers or
pedestrians there was the potential to make a type I error. That is, we may have, by chance,
incorrectly indicated the potential need for inquiry for profiling. While we set a 5% type I error
rate for each minority comparison, the multiple comparisons inflate the possibility of making
such an error overall to more than 5%. We chose not to correct for these multiple comparisons,
viewing each minority comparison to Whites as an independent examination of profiling.
5 There may be fewer than five ratios depending on the occurrence of zero stops for Whites or zero benchmark for a minority. These are cases where a ratio cannot be calculated.
20
References (for Appendix B)
Garwood, F (1936). Fiducial limits for the Poisson distribution. Biometrika, Vol. 28, No. 3/4: 437-442.
Gelman, A, Fagan, J, and Kiss, A (2007). An analysis of the New York City Police Department’s ‘stop-and-frisk’
policy in the context of claims of racial bias. Journal of the American Statistical Association, Vol. 102, No. 479,
813–823.
Lehmann, EL, and Romano, JP (2005). Testing Statistical Hypotheses, Third edition. Springer: New York.
Ridgeway, G. (2007). Analysis of Racial Disparities in the New York Police Department's Stop, Question, and Frisk
Practices. Santa Monica, CA: RAND Corporation. https://www.rand.org/pubs/technical_reports/TR534.html.
Serfling, RJ (1978). Some elementary results on Poisson approximation in a sequence of Bernoulli trials. SIAM
Review, Vol. 20, No. 3, 567-579.
21
Appendix C. Technical Notes on Benchmarks
C.1. Overview
In the analysis to detect racial profiling, the number of stops by each agency of each racial group
is compared to a “benchmark” population of the racial group. The rate of stops per benchmark
population for the racial group can be compared to the same rate for Whites. The benchmark
provides an expected racial distribution of the population and would be an expected racial
distribution of the stops, if the stops were conducted in a uniform way across races. That is, the
stop rates calculated using an ideal benchmark would be approximately constant across all racial
groups if there were no profiling.
Similar to past years, the benchmark for each agency is based on local population statistics of
each racial group in associated cities or counties. However, starting the report for 2019 stops,
there are a number of important changes compared to the reports of 2016-2018 stops, as
described in the sections below and summarized in Section C.7. While this methodology has
some limitations (described further in Section C.8.), it provides a transparent, standardized
approach to developing benchmarks for the nearly 1,000 law enforcement agencies in Illinois.
C.2. Data Sources
Multiple data sources were combined to calculate benchmarks, including multiple datasets
provided by the American Community Survey (ACS).
The ACS is an ongoing survey conducted by the U.S. Census Bureau that collects information on
the U.S. population in all 50 states, the District of Columbia and Puerto Rico6. The information
collected is similar to that collected by the U.S. decennial census, but the ACS results are
released on an annual basis rather than every 10 years. Another difference between the ACS and
census is that the ACS is based on a random sample of about 3.5 million individuals while the
census attempts to reach every person living in the U.S. and its territories.
Besides the 1-year (1Y) ACS releases, there are also 5-year (5Y) releases. These 5Y releases
combine 5 consecutive years, primarily to increase the sample size of relatively small areas or
groups of individuals. It would be challenging to estimate the population of small communities
reliably with only one survey-year of data. In addition to standard tabulations, the ACS also
provides individual level data, referred to as the public use microdata sample (PUMS). The
PUMS data allows more detailed and complex analyses involving multiple variables. Due to
privacy concerns, there are restrictions on the level of geographic identification provided with
each type of release of ACS data.
6 https://www.census.gov/programs-surveys/acs. Last accessed 5/25/21.
22
For this report, five years of ACS releases were used, all corresponding to 2019 as the most
recent year of data available. The first was the 2019 1Y PUMS7, which was used to estimate the
age distribution of the entire population of Illinois in 2018. The second release used was the
2015-2019 5Y PUMS8, which was used to estimate the state-level age distribution for each racial
group. The 5Y release was used instead of the 1Y release to achieve a larger sample size for
those racial groups that had fewer individuals in Illinois. The third release used was the 2015-
2019 5Y detailed table of race and ethnicity for each Illinois county9. This table provided an
estimated population count of each ACS racial group and ethnicity combination, separately for
each Illinois county. The PUMS dataset could not be used for this purpose because — due to
privacy concerns — geographic localization in the PUMS is limited to public use microdata
areas (PUMAs), which have a minimum of 100,000 individuals, greater than most counties in
Illinois. The fourth release used was the 2015-2019 5Y detailed table of race and ethnicity by
Illinois place (city, town or village, referred to simply as city hereafter)10. Lastly, the 2015-2019
5Y detailed table of race and ethnicity for the whole state of Illinois11 was used for some
statewide jurisdictions.
As a final note, comparing the U.S. 2010 census to the ACS as a source of population data, the
U.S. census has the advantage of virtually complete coverage of Illinois, while the ACS has the
advantage of recency. Because the U.S. population is quite mobile, recency was the more
important factor. Relative to 2020, the 2010 census was ten years old, while the ACS data from
2015-2019 was an average of three years old.
C.3. Racial Categories
The ACS collects self-identified race and ethnicity information based on the U.S. Census
Bureau’s definitions. The primary racial categories provided by the census are White alone,
Black or African American alone, American Indian and Alaska Native alone, Asian alone,
Native Hawaiian and Other Pacific Islander alone, some other race alone, and two or more races.
The primary ethnicity categories provided by the census are “Hispanic or Latino” and “Not
Hispanic or Latino.” Race and ethnicity are collected using two separate questions and the
respondent can select any racial group along with any ethnicity.
From Illinois Public Act 101-0024, the law enabling this study, the following racial categories
are collected based on the police officer’s subjective determination of the race of the person
7 https://www2.census.gov/programs-surveys/acs/data/pums/2019/1-Year/csv_pil.zip. Last accessed 5/25/21.
8 https://www2.census.gov/programs-surveys/acs/data/pums/2019/5-Year/csv_pil.zip. Last accessed 5/25/21.
9https://data.census.gov/cedsci/table?q=&table=B03002&tid=ACSDT5Y2019.B03002&lastDisplayedRow=20&vintage=2019&hidePreview=true&g=0400000US17.050000. Last accessed 5/25/21.
10https://data.census.gov/cedsci/table?q=&table=B03002&tid=ACSDT5Y2019.B03002&lastDisplayedRow=20&vintage=2019&hidePreview=true&g=0400000US17.160000. Last accessed 5/25/21.
11https://data.census.gov/cedsci/table?table=B03002&tid=ACSDT5Y2019.B03002&lastDisplayedRow=20&vintage=2019&hidePr
eview=true&g=0400000US17. Last accessed 5/25/21.
23
being stopped. These include American Indian and Alaska Native, Asian, Black or African
American, Hispanic or Latino, Native Hawaiian or Other Pacific Islander, or White. Only a
single race may be selected.
Besides the difference between the ACS’s self-identified race and the Illinois law’s officer-
identified race, there are other differences the between the ACS and Illinois law’s categories. The
primary differences are 1) in the ACS, Hispanic or Latino is an ethnicity instead of the Illinois
law’s designation of Hispanic or Latino as a race; 2) the ACS allows for multiple races to be
selected while the Illinois law does not; and 3) the ACS allows the “some other race” option
while the Illinois law does not.
To make the different racial categories compatible between the ACS data used for benchmarks
and the stops data using the Illinois racial categories, we took the same approach employed in
previous IPSS reports12. This involved two major adjustments. The first adjustment was to use
Hispanic or Latino as the assigned race for benchmarking if the ACS ethnicity was listed as
Hispanic or Latino. The second adjustment was that those individuals listing some other race
alone or multiple races in the ACS data were excluded from the process of defining a benchmark
population. In the 2015-2019 5Y ACS sample, this impact involved only 2% of individuals.
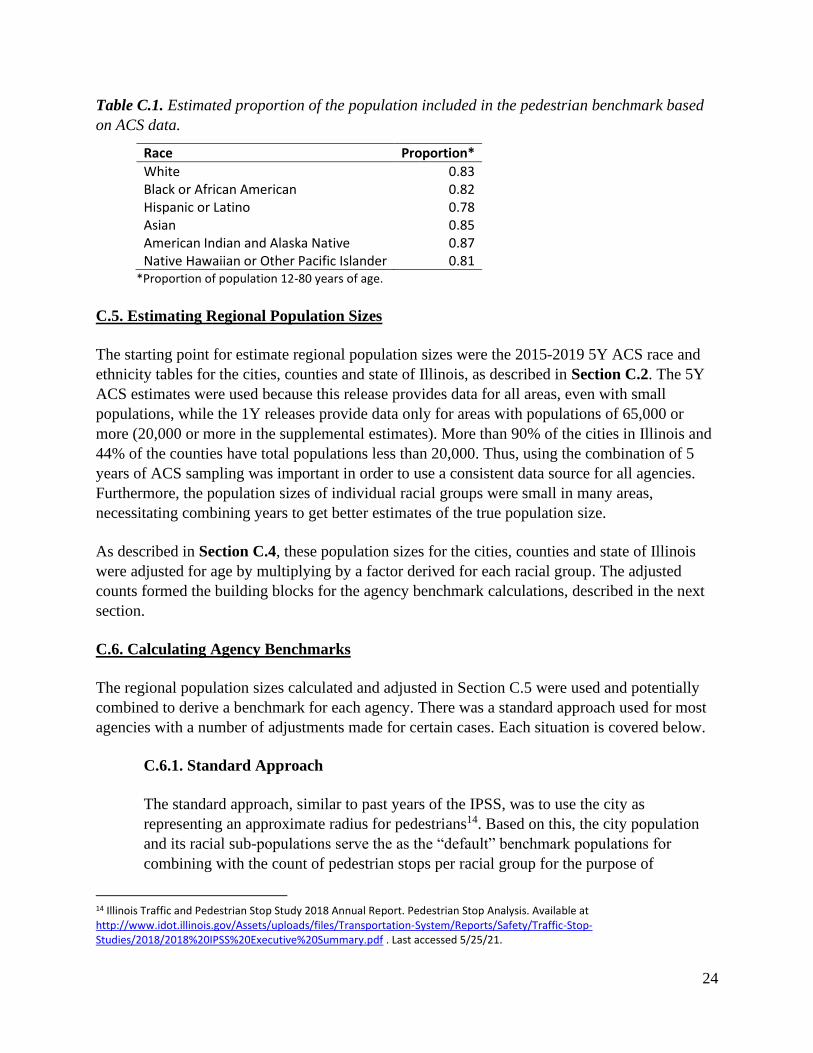
C.4. Adjusting for Age
Population counts by race from the ACS were adjusted to reflect the number of potential
pedestrians with at least some real risk of being stopped. This was done by estimating the
proportion of the Illinois state population of each race who were 12-80 years of age using the
2015-2019 5Y ACS PUMS. While those younger than age 12 or older than 80 are technically at
risk of being stopped, the risk is expected to be very low, so they were excluded from the
benchmark estimates. Illinois pedestrian stop records do not contain age information, so we
examined data from the New York City “Stop, Question and Frisk” program13. Between 2016-
2019, when the number of stops per year were relatively stable, stops of suspect-reported ages
outside of the 12-80 year ranged represented <0.2% of stops performed. Note that the New York
City data were used only to determine that age 12 is a reasonable minimum age to define a
population of persons with non-trivial risk of being stopped. There is no implication that the stop
rates are similar between Illinois and New York City. Table C.1 shows the estimated proportion
of population included in the pedestrian benchmark counts.
12 Illinois Traffic Stop Statistics Act Report for the Year 2004. July 1, 2005. Available at http://www.idot.illinois.gov/Assets/uploads/files/Transportation-System/Reports/Safety/Traffic-Stop-Studies/2004/2004%20Illinois%20Traffic%20Stop%20Summary.pdf . Last accessed 5/25/21.
13 https://www1.nyc.gov/site/nypd/stats/reports-analysis/stopfrisk.page. Last accessed 5/25/21.
24
Table C.1. Estimated proportion of the population included in the pedestrian benchmark based
on ACS data.
Race Proportion*
White 0.83 Black or African American 0.82 Hispanic or Latino 0.78 Asian 0.85 American Indian and Alaska Native 0.87 Native Hawaiian or Other Pacific Islander 0.81
*Proportion of population 12-80 years of age.
C.5. Estimating Regional Population Sizes
The starting point for estimate regional population sizes were the 2015-2019 5Y ACS race and
ethnicity tables for the cities, counties and state of Illinois, as described in Section C.2. The 5Y
ACS estimates were used because this release provides data for all areas, even with small
populations, while the 1Y releases provide data only for areas with populations of 65,000 or
more (20,000 or more in the supplemental estimates). More than 90% of the cities in Illinois and
44% of the counties have total populations less than 20,000. Thus, using the combination of 5
years of ACS sampling was important in order to use a consistent data source for all agencies.
Furthermore, the population sizes of individual racial groups were small in many areas,
necessitating combining years to get better estimates of the true population size.
As described in Section C.4, these population sizes for the cities, counties and state of Illinois
were adjusted for age by multiplying by a factor derived for each racial group. The adjusted
counts formed the building blocks for the agency benchmark calculations, described in the next
section.
C.6. Calculating Agency Benchmarks
The regional population sizes calculated and adjusted in Section C.5 were used and potentially
combined to derive a benchmark for each agency. There was a standard approach used for most
agencies with a number of adjustments made for certain cases. Each situation is covered below.
C.6.1. Standard Approach
The standard approach, similar to past years of the IPSS, was to use the city as
representing an approximate radius for pedestrians14. Based on this, the city population
and its racial sub-populations serve the as the “default” benchmark populations for
combining with the count of pedestrian stops per racial group for the purpose of
14 Illinois Traffic and Pedestrian Stop Study 2018 Annual Report. Pedestrian Stop Analysis. Available at http://www.idot.illinois.gov/Assets/uploads/files/Transportation-System/Reports/Safety/Traffic-Stop-Studies/2018/2018%20IPSS%20Executive%20Summary.pdf . Last accessed 5/25/21.
25
calculating stops rates. As described later, this approach has a number of weaknesses,
though the approach also has some practical advantages.
C.6.2. Agencies Covering Multiple Cities or Counties
When an agency covered multiple cities or counties or was situated near the county
border, the populations of these areas were combined. The law enforcement officers may
have frequent contact with residents from each of the nearby areas. The step of
combining adjacent regions was performed manually on a case-by-case, so not all
otherwise applicable situations may currently be addressed in this way.
C.6.3. Cook County
Similar to past years of the IPSS15, we subdivided Cook County into regions due to its
substantial population and spatially heterogeneous racial distribution. The subdivisions
corresponded to the six districts of the Circuit Court of Cook County16. These districts
correspond to the City of Chicago (First Municipal District) and the northern (Second
Municipal District; Skokie), northwestern (Third Municipal District; Rolling Meadows),
western (Fourth Municipal District; Maywood), southwestern (Fifth Municipal District;
Bridgeview), and southern (Sixth Municipal District; Markham) suburbs of Cook County.
For computational purposes, these districts were treated as analogous to counties.
C.6.4. Other Situations
There were several other types of agencies which were handled somewhat differently
than the standard cases. City benchmarks were used whenever possible for agencies
associated with a park district, college, or university, to better correspond to the local
population. County benchmarks were used for county sheriffs and other agencies, with
the entire county as the nominal jurisdiction. Similarly, state benchmarks were used for
the Illinois State Police and other agencies with statewide jurisdiction. For airport,
railroad and other transit agencies, the associated county or counties were used for
benchmarks. These adjustments are similar to the method used in previous reports.
C.6.5. Example of Detailed Calculation
To help illustrate the benchmark method, the calculations for one agency, Oak Park
Police, will be worked out in detail for the White and Black/African American
15 Illinois Traffic Stop Statistics Act Report for the Year 2004. July 1, 2005. Available at http://www.idot.illinois.gov/Assets/uploads/files/Transportation-System/Reports/Safety/Traffic-Stop-Studies/2004/2004%20Illinois%20Traffic%20Stop%20Summary.pdf . Last accessed 5/25/21.
16 State of Illinois Circuit Court of Cook County. http://www.cookcountycourt.org/ABOUTTHECOURT/OrganizationoftheCircuitCourt.aspx. Last accessed 5/25/21.
26
benchmarks. This example was generated for the report on 2019 stops, so utilizes ACS
statistics from 2014-2018.
Based on the 2014-2018 5Y ACS, the city of Oak Park district has 33,206 White
residents and 9,356 Black/African American residents after applying the racial categories
explained in Section C.3. The two population counts were adjusted for age using the
factors in Table C.1, namely 0.83224 and 0.8167, respectively (the values in the Table
C.1 are rounded, so they differ slightly from the values stated here). This produced
adjusted populations for White and Black/African American residents of 27,635 and
7,641, respectively, corresponding to potential pedestrians at risk of being stopped, which
were used for the benchmark.
The geographic regions chosen for each agency are listed at the end of this appendix in
Table C.2.
C.7. Methodological Differences with Past Reports for Stops in 2016-2018
While the methodology used for this report, originally updated for the report of 2019 stops, has
some similarities with past reports (2016-2018), including using adjusted population counts of
associated cities and counties to define the benchmark population, there are a number of
important differences. These must be considered when comparing this report to past reports for
stops from 2016-2018.
One important difference is that past reports used the most recent U.S. census estimates for
population counts while this report used more recent estimates from the ACS, which is
conducted annually by the U.S. Census Bureau. We primarily used the most recent 5Y estimates.
The principal advantage of this approach is that the demographic information is more current
than the census, which is conducted decennially. The decennial census may not reflect current
demographic composition in some areas, given the mobility of the U.S. population and
population growth. One disadvantage of the ACS compared to the census is that the ACS is
based on a random sample while the census attempts to enumerate the entire population; the
ACS estimates are subject to more sampling variability than the census. The recency of the ACS
data compared to the census was the deciding factor in favor of the ACS.
Another notable difference from previous reports for 2004-2018 stops is that in this report, rates
and other statistics are provided for each minority group separately instead of for all minorities
combined into a single all-minority group.
27
C.8. Limitations
The use of the census or ACS to compute benchmarks has a number of known limitations17,18.
The benchmarks are constructed to correspond to the racial distribution of a city or county, but
people from outside the designated benchmark area travel through and may be stopped. This
discrepancy may be particularly pronounced in areas with major freeways, along major
commuting routes between large cities, or with popular attractions that draws people from a wide
area. On the average, different groups may spend different amounts of time on the road or on the
street, and the time of day of their activities may vary, potentially leading to different levels of
exposure to being stopped than reflected by local population estimates. There may also be
seasonal variation in the population, due to festivals, holidays, etc. which cannot be captured in
static population estimates.
In order to address some of the limitations several alternative benchmarking methods have been
proposed. One benchmark method is to carry out observational studies where people and their
race are counted by sight at different times and places to estimate the population composition.
Another benchmark method is to analyze traffic accident data (crashes) and use the race of the
not-at-fault driver to estimate the relevant racial composition of drivers. Yet another method is to
mathematically model traffic flows between different cities and regions to merge their racial
distributions to better reflect the racial distribution encountered by law enforcement officers.
Despite these limitations, the benchmarking method we have used has a number of strengths,
primarily feasibility and transparency. There are close to 1,000 law enforcement agencies in
Illinois, many with small jurisdictions. The ACS provides relatively contemporary data in a
uniform fashion across the state, while alternative methods would require a tremendous amount
of resources to acquire specialized data to construct a customized benchmark for each agency.
The method used for this report is also transparent in that the concept of using local population
data is easy to understand, and all of our adjustments are relatively straightforward and can be
itemized. The ACS is conducted annually, so the underlying data for all agencies are able to
remain relatively current and reflect demographic composition.
Besides the general limitations of the methodology described above, there are some other
important limitations to consider when interpreting the benchmarks and stop rate ratios. Most
importantly, the benchmarks are based on ACS tabulations of race, which are provided by the
respondent. Illinois stop data used race as recorded by the police officer, which may differ from
what the individual being stopped would report. Therefore, some differences between the racial
17 Fridell, L. A. (2004). By the numbers: A guide for analyzing race data from vehicle stops. Washington, DC: Police Executive
Research Forum. https://www.ncjrs.gov/App/Publications/abstract.aspx?ID=209827 . Last accessed 5/25/21.
18 Alpert G.P., Dunham R.G., Smith M.R. (2007). Investigating Racial Profiling by the Miami-Dade Police Department: A
Multimethod Approach. Criminology & Public Policy;6(1):25-56.
https://www.ncjrs.gov/App/Publications/abstract.aspx?ID=239772 . Last accessed 5/25/21.
28
distribution of the stop data and the corresponding benchmark racial distribution may be due to
racial misclassification.
Another challenge is that the ACS collects race in a different way than defined by the Illinois
state law for the stops study, so some adjustments had to be made for compatibility, as described
in Section C.3, above. This approach may have induced some differences in racial distributions
between the stops (with race assigned by the officer) and corresponding benchmarks (based on
self-assigned race). Lastly, the ACS data is based on a survey that takes a random sample of the
population. There is some error in survey estimates due simply to sampling variability. In
particular, this can impact estimates of population counts of smaller groups. For example, the
number of American Indian or Alaska Native and Native Hawaiian or Other Pacific Islanders
were relatively small in a number of regions, so these counts may be more uncertain for some
jurisdictions. Thus, while the study has strengths, there are some limitations as well. That is why
the narrative in this report emphasizes that if a ratio comparing a racial group to Whites differs
substantially from 1.0 (that is, differs from racial equality), that may be the basis for further
inquiry but does not prove that there is racial profiling.
29
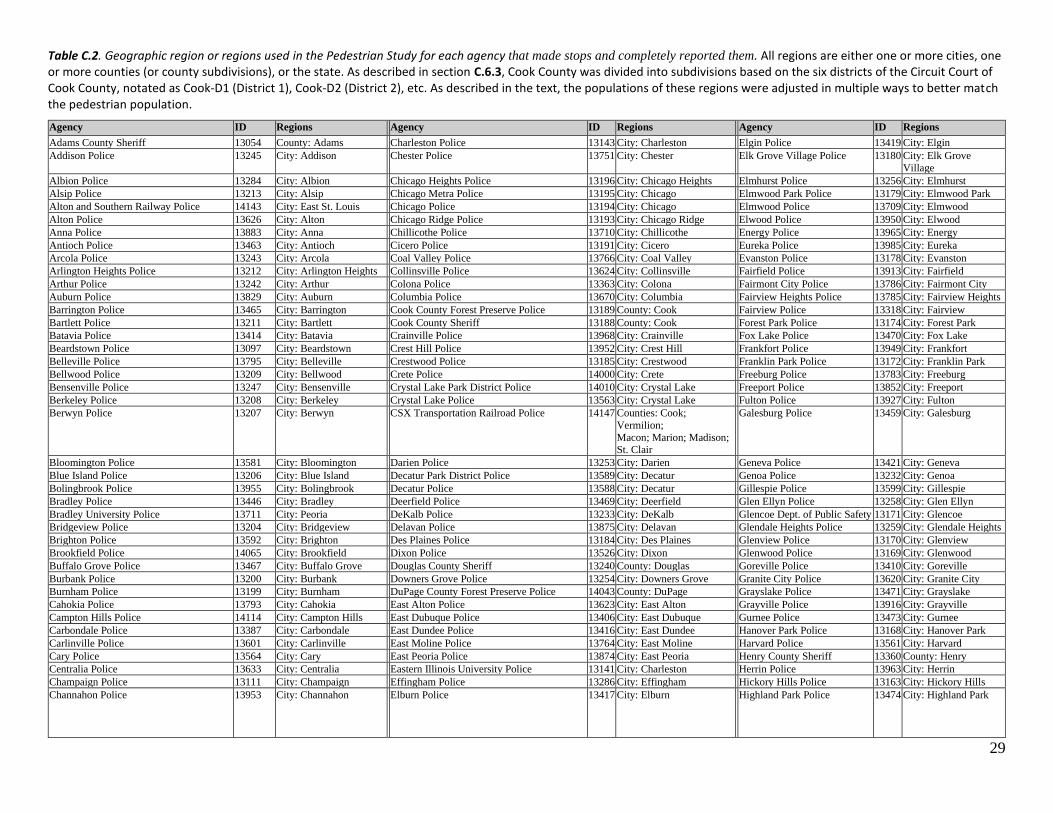
Table C.2. Geographic region or regions used in the Pedestrian Study for each agency that made stops and completely reported them. All regions are either one or more cities, one or more counties (or county subdivisions), or the state. As described in section C.6.3, Cook County was divided into subdivisions based on the six districts of the Circuit Court of Cook County, notated as Cook-D1 (District 1), Cook-D2 (District 2), etc. As described in the text, the populations of these regions were adjusted in multiple ways to better match the pedestrian population.
Agency ID Regions Agency ID Regions Agency ID Regions
Adams County Sheriff 13054 County: Adams Charleston Police 13143 City: Charleston Elgin Police 13419 City: Elgin
Addison Police 13245 City: Addison Chester Police 13751 City: Chester Elk Grove Village Police 13180 City: Elk Grove
Village
Albion Police 13284 City: Albion Chicago Heights Police 13196 City: Chicago Heights Elmhurst Police 13256 City: Elmhurst
Alsip Police 13213 City: Alsip Chicago Metra Police 13195 City: Chicago Elmwood Park Police 13179 City: Elmwood Park
Alton and Southern Railway Police 14143 City: East St. Louis Chicago Police 13194 City: Chicago Elmwood Police 13709 City: Elmwood
Alton Police 13626 City: Alton Chicago Ridge Police 13193 City: Chicago Ridge Elwood Police 13950 City: Elwood
Anna Police 13883 City: Anna Chillicothe Police 13710 City: Chillicothe Energy Police 13965 City: Energy
Antioch Police 13463 City: Antioch Cicero Police 13191 City: Cicero Eureka Police 13985 City: Eureka
Arcola Police 13243 City: Arcola Coal Valley Police 13766 City: Coal Valley Evanston Police 13178 City: Evanston
Arlington Heights Police 13212 City: Arlington Heights Collinsville Police 13624 City: Collinsville Fairfield Police 13913 City: Fairfield
Arthur Police 13242 City: Arthur Colona Police 13363 City: Colona Fairmont City Police 13786 City: Fairmont City
Auburn Police 13829 City: Auburn Columbia Police 13670 City: Columbia Fairview Heights Police 13785 City: Fairview Heights
Barrington Police 13465 City: Barrington Cook County Forest Preserve Police 13189 County: Cook Fairview Police 13318 City: Fairview
Bartlett Police 13211 City: Bartlett Cook County Sheriff 13188 County: Cook Forest Park Police 13174 City: Forest Park
Batavia Police 13414 City: Batavia Crainville Police 13968 City: Crainville Fox Lake Police 13470 City: Fox Lake
Beardstown Police 13097 City: Beardstown Crest Hill Police 13952 City: Crest Hill Frankfort Police 13949 City: Frankfort
Belleville Police 13795 City: Belleville Crestwood Police 13185 City: Crestwood Franklin Park Police 13172 City: Franklin Park
Bellwood Police 13209 City: Bellwood Crete Police 14000 City: Crete Freeburg Police 13783 City: Freeburg
Bensenville Police 13247 City: Bensenville Crystal Lake Park District Police 14010 City: Crystal Lake Freeport Police 13852 City: Freeport
Berkeley Police 13208 City: Berkeley Crystal Lake Police 13563 City: Crystal Lake Fulton Police 13927 City: Fulton
Berwyn Police 13207 City: Berwyn CSX Transportation Railroad Police 14147 Counties: Cook;
Vermilion;
Macon; Marion; Madison; St. Clair
Galesburg Police 13459 City: Galesburg
Bloomington Police 13581 City: Bloomington Darien Police 13253 City: Darien Geneva Police 13421 City: Geneva
Blue Island Police 13206 City: Blue Island Decatur Park District Police 13589 City: Decatur Genoa Police 13232 City: Genoa
Bolingbrook Police 13955 City: Bolingbrook Decatur Police 13588 City: Decatur Gillespie Police 13599 City: Gillespie
Bradley Police 13446 City: Bradley Deerfield Police 13469 City: Deerfield Glen Ellyn Police 13258 City: Glen Ellyn
Bradley University Police 13711 City: Peoria DeKalb Police 13233 City: DeKalb Glencoe Dept. of Public Safety 13171 City: Glencoe
Bridgeview Police 13204 City: Bridgeview Delavan Police 13875 City: Delavan Glendale Heights Police 13259 City: Glendale Heights
Brighton Police 13592 City: Brighton Des Plaines Police 13184 City: Des Plaines Glenview Police 13170 City: Glenview
Brookfield Police 14065 City: Brookfield Dixon Police 13526 City: Dixon Glenwood Police 13169 City: Glenwood
Buffalo Grove Police 13467 City: Buffalo Grove Douglas County Sheriff 13240 County: Douglas Goreville Police 13410 City: Goreville
Burbank Police 13200 City: Burbank Downers Grove Police 13254 City: Downers Grove Granite City Police 13620 City: Granite City
Burnham Police 13199 City: Burnham DuPage County Forest Preserve Police 14043 County: DuPage Grayslake Police 13471 City: Grayslake
Cahokia Police 13793 City: Cahokia East Alton Police 13623 City: East Alton Grayville Police 13916 City: Grayville
Campton Hills Police 14114 City: Campton Hills East Dubuque Police 13406 City: East Dubuque Gurnee Police 13473 City: Gurnee
Carbondale Police 13387 City: Carbondale East Dundee Police 13416 City: East Dundee Hanover Park Police 13168 City: Hanover Park
Carlinville Police 13601 City: Carlinville East Moline Police 13764 City: East Moline Harvard Police 13561 City: Harvard
Cary Police 13564 City: Cary East Peoria Police 13874 City: East Peoria Henry County Sheriff 13360 County: Henry
Centralia Police 13633 City: Centralia Eastern Illinois University Police 13141 City: Charleston Herrin Police 13963 City: Herrin
Champaign Police 13111 City: Champaign Effingham Police 13286 City: Effingham Hickory Hills Police 13163 City: Hickory Hills
Channahon Police 13953 City: Channahon Elburn Police 13417 City: Elburn Highland Park Police 13474 City: Highland Park
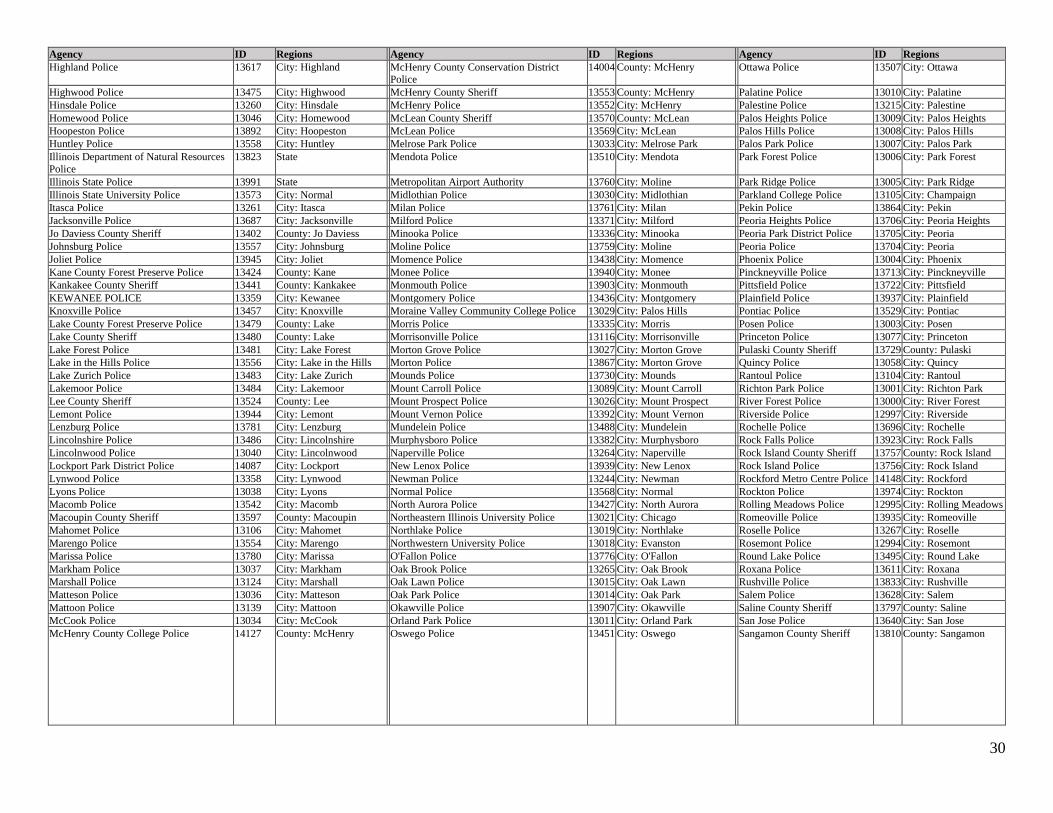
30
Agency ID Regions Agency ID Regions Agency ID Regions
Highland Police 13617 City: Highland McHenry County Conservation District
Police
14004 County: McHenry Ottawa Police 13507 City: Ottawa
Highwood Police 13475 City: Highwood McHenry County Sheriff 13553 County: McHenry Palatine Police 13010 City: Palatine
Hinsdale Police 13260 City: Hinsdale McHenry Police 13552 City: McHenry Palestine Police 13215 City: Palestine
Homewood Police 13046 City: Homewood McLean County Sheriff 13570 County: McLean Palos Heights Police 13009 City: Palos Heights
Hoopeston Police 13892 City: Hoopeston McLean Police 13569 City: McLean Palos Hills Police 13008 City: Palos Hills
Huntley Police 13558 City: Huntley Melrose Park Police 13033 City: Melrose Park Palos Park Police 13007 City: Palos Park
Illinois Department of Natural Resources
Police
13823 State Mendota Police 13510 City: Mendota Park Forest Police 13006 City: Park Forest
Illinois State Police 13991 State Metropolitan Airport Authority 13760 City: Moline Park Ridge Police 13005 City: Park Ridge
Illinois State University Police 13573 City: Normal Midlothian Police 13030 City: Midlothian Parkland College Police 13105 City: Champaign
Itasca Police 13261 City: Itasca Milan Police 13761 City: Milan Pekin Police 13864 City: Pekin
Jacksonville Police 13687 City: Jacksonville Milford Police 13371 City: Milford Peoria Heights Police 13706 City: Peoria Heights
Jo Daviess County Sheriff 13402 County: Jo Daviess Minooka Police 13336 City: Minooka Peoria Park District Police 13705 City: Peoria
Johnsburg Police 13557 City: Johnsburg Moline Police 13759 City: Moline Peoria Police 13704 City: Peoria
Joliet Police 13945 City: Joliet Momence Police 13438 City: Momence Phoenix Police 13004 City: Phoenix
Kane County Forest Preserve Police 13424 County: Kane Monee Police 13940 City: Monee Pinckneyville Police 13713 City: Pinckneyville
Kankakee County Sheriff 13441 County: Kankakee Monmouth Police 13903 City: Monmouth Pittsfield Police 13722 City: Pittsfield
KEWANEE POLICE 13359 City: Kewanee Montgomery Police 13436 City: Montgomery Plainfield Police 13937 City: Plainfield
Knoxville Police 13457 City: Knoxville Moraine Valley Community College Police 13029 City: Palos Hills Pontiac Police 13529 City: Pontiac
Lake County Forest Preserve Police 13479 County: Lake Morris Police 13335 City: Morris Posen Police 13003 City: Posen
Lake County Sheriff 13480 County: Lake Morrisonville Police 13116 City: Morrisonville Princeton Police 13077 City: Princeton
Lake Forest Police 13481 City: Lake Forest Morton Grove Police 13027 City: Morton Grove Pulaski County Sheriff 13729 County: Pulaski
Lake in the Hills Police 13556 City: Lake in the Hills Morton Police 13867 City: Morton Grove Quincy Police 13058 City: Quincy
Lake Zurich Police 13483 City: Lake Zurich Mounds Police 13730 City: Mounds Rantoul Police 13104 City: Rantoul
Lakemoor Police 13484 City: Lakemoor Mount Carroll Police 13089 City: Mount Carroll Richton Park Police 13001 City: Richton Park
Lee County Sheriff 13524 County: Lee Mount Prospect Police 13026 City: Mount Prospect River Forest Police 13000 City: River Forest
Lemont Police 13944 City: Lemont Mount Vernon Police 13392 City: Mount Vernon Riverside Police 12997 City: Riverside
Lenzburg Police 13781 City: Lenzburg Mundelein Police 13488 City: Mundelein Rochelle Police 13696 City: Rochelle
Lincolnshire Police 13486 City: Lincolnshire Murphysboro Police 13382 City: Murphysboro Rock Falls Police 13923 City: Rock Falls
Lincolnwood Police 13040 City: Lincolnwood Naperville Police 13264 City: Naperville Rock Island County Sheriff 13757 County: Rock Island
Lockport Park District Police 14087 City: Lockport New Lenox Police 13939 City: New Lenox Rock Island Police 13756 City: Rock Island
Lynwood Police 13358 City: Lynwood Newman Police 13244 City: Newman Rockford Metro Centre Police 14148 City: Rockford
Lyons Police 13038 City: Lyons Normal Police 13568 City: Normal Rockton Police 13974 City: Rockton
Macomb Police 13542 City: Macomb North Aurora Police 13427 City: North Aurora Rolling Meadows Police 12995 City: Rolling Meadows
Macoupin County Sheriff 13597 County: Macoupin Northeastern Illinois University Police 13021 City: Chicago Romeoville Police 13935 City: Romeoville
Mahomet Police 13106 City: Mahomet Northlake Police 13019 City: Northlake Roselle Police 13267 City: Roselle
Marengo Police 13554 City: Marengo Northwestern University Police 13018 City: Evanston Rosemont Police 12994 City: Rosemont
Marissa Police 13780 City: Marissa O'Fallon Police 13776 City: O'Fallon Round Lake Police 13495 City: Round Lake
Markham Police 13037 City: Markham Oak Brook Police 13265 City: Oak Brook Roxana Police 13611 City: Roxana
Marshall Police 13124 City: Marshall Oak Lawn Police 13015 City: Oak Lawn Rushville Police 13833 City: Rushville
Matteson Police 13036 City: Matteson Oak Park Police 13014 City: Oak Park Salem Police 13628 City: Salem
Mattoon Police 13139 City: Mattoon Okawville Police 13907 City: Okawville Saline County Sheriff 13797 County: Saline
McCook Police 13034 City: McCook Orland Park Police 13011 City: Orland Park San Jose Police 13640 City: San Jose
McHenry County College Police 14127 County: McHenry Oswego Police 13451 City: Oswego Sangamon County Sheriff 13810 County: Sangamon
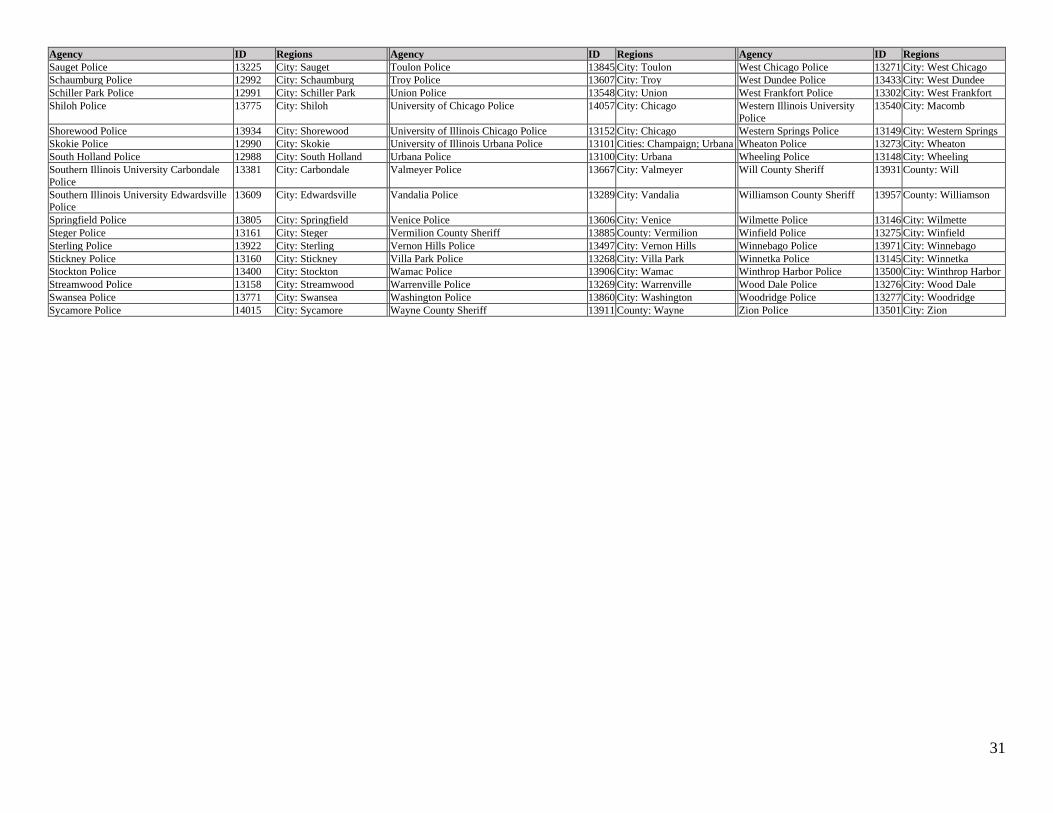
31
Agency ID Regions Agency ID Regions Agency ID Regions
Sauget Police 13225 City: Sauget Toulon Police 13845 City: Toulon West Chicago Police 13271 City: West Chicago
Schaumburg Police 12992 City: Schaumburg Troy Police 13607 City: Troy West Dundee Police 13433 City: West Dundee
Schiller Park Police 12991 City: Schiller Park Union Police 13548 City: Union West Frankfort Police 13302 City: West Frankfort
Shiloh Police 13775 City: Shiloh University of Chicago Police 14057 City: Chicago Western Illinois University
Police
13540 City: Macomb
Shorewood Police 13934 City: Shorewood University of Illinois Chicago Police 13152 City: Chicago Western Springs Police 13149 City: Western Springs
Skokie Police 12990 City: Skokie University of Illinois Urbana Police 13101 Cities: Champaign; Urbana Wheaton Police 13273 City: Wheaton
South Holland Police 12988 City: South Holland Urbana Police 13100 City: Urbana Wheeling Police 13148 City: Wheeling
Southern Illinois University Carbondale
Police
13381 City: Carbondale Valmeyer Police 13667 City: Valmeyer Will County Sheriff 13931 County: Will
Southern Illinois University Edwardsville Police
13609 City: Edwardsville Vandalia Police 13289 City: Vandalia Williamson County Sheriff 13957 County: Williamson
Springfield Police 13805 City: Springfield Venice Police 13606 City: Venice Wilmette Police 13146 City: Wilmette
Steger Police 13161 City: Steger Vermilion County Sheriff 13885 County: Vermilion Winfield Police 13275 City: Winfield
Sterling Police 13922 City: Sterling Vernon Hills Police 13497 City: Vernon Hills Winnebago Police 13971 City: Winnebago
Stickney Police 13160 City: Stickney Villa Park Police 13268 City: Villa Park Winnetka Police 13145 City: Winnetka
Stockton Police 13400 City: Stockton Wamac Police 13906 City: Wamac Winthrop Harbor Police 13500 City: Winthrop Harbor
Streamwood Police 13158 City: Streamwood Warrenville Police 13269 City: Warrenville Wood Dale Police 13276 City: Wood Dale
Swansea Police 13771 City: Swansea Washington Police 13860 City: Washington Woodridge Police 13277 City: Woodridge
Sycamore Police 14015 City: Sycamore Wayne County Sheriff 13911 County: Wayne Zion Police 13501 City: Zion
32
Appendix D. Additional Notes on the Law
The Illinois General Assembly has promulgated laws that require the collection and analysis of
data on traffic stops by law enforcement agencies in the state. The statutes relating to the
statistical analysis of traffic and pedestrian stops are found in the Compiled Statutes of the
Illinois General Assembly, 625 ILCS 5/11-212, effective 6/21/2019. See also Public Act 101-
0024.
Section 11-212 of the Illinois statute authorizes the “Traffic and pedestrian stop statistical study”.
This section also requires that when a police officer stops an individual, a specific set of
information is to be recorded. This information includes: name, address, gender, race (six
specific categories: White, Black or African American, Hispanic or Latino, Asian, American
Indian or Alaska Native and Native Hawaiian or Other Pacific Islander), the violation, vehicle
information, date, time, location, search information, whether contraband was found, disposition
of the stop (warning, citation or arrest—arrest recorded only for pedestrian stops19) and the name
and badge number of the officer. This information is to be obtained whether the police officer
makes a traffic stop or a pedestrian stop and either issues a citation or a warning (or arrest for a
pedestrian stop). In addition, the length of the contact in minutes is to be recorded for traffic
stops. These data items are recorded using the data collection form included in Appendix A. The
law further specifies that the collected data are to be sent to the Illinois Department of
Transportation by a specific date each year for the stops data collected in the preceding year.
The Illinois Department of Transportation is further directed by statute to analyze the data and
submit summary reports to the Governor, the General Assembly and the Racial Profiling
Agency. The Illinois Department of Transportation is authorized to contract with an outside
entity for the analysis of the data. That analysis is the purpose of this report. Moreover, the
reporting entity is directed to scrutinize the data for evidence of “statistically significant
aberrations.” An illustrative list of possible aberrations recorded in the statute include: (1) a
higher-than-expected number of minorities stopped, (2) a higher-than-expected number of
citations issued to minorities, (3) a higher-than-expected number of minorities stopped by a
specific police agency, and (4) a higher-than-expected number of searches conducted on
minority drivers or pedestrians.
The relevant statute, 625 ILCS 5/11-212 and subsection (a) provides that the law enforcement
officer “…shall record at least the following…”. The statue seems to suggest the current data
collection form includes a minimum level of information, and leaves open the possibility of
gathering additional information in the future.
19 The pedestrian stop data collection form in use during 2020 has provision for recording an arrest. The traffic stop data collection form in use during 2020 does not provide a means of recording an arrest.


![Esercitazione2 [modalit compatibilit ] - infoPLC · PLC Example 2 Francesca Fanfoni ... GREEN LIGHT Wait pedestrian request to stop the traffic ... pedestrian crossing to stop the](https://img.pdfslide.net/doc/110x75/5b1e53ed7f8b9a8a3a8b64d1/esercitazione2-modalit-compatibilit-plc-example-2-francesca-fanfoni-.jpg)