Embed Size (px)
Citation preview

ILSP-WMD Annual Outcome Survey Report-2015
1 | P a g e
ANNUAL OUTCOME SURVEY
REPORT, 2015
INTEGRATED LIVELIHOOD SUPPORT PROJECT- WATERSHED
MANAGEMENT DIRECTORATE (ILSP-WMD), UTTARAKHAND
International Fund for Agricultural Development (IFAD) Supported
Compilation and Presentation by: Dr. Suresh Mathpal, Consultant
Submitted to: Watershed Management Directorate (WMD), Uttarakhand
Indira Nagar Forest Colony, Dehradun www.wmduk.gov.in
APRIL 2016

ILSP-WMD Annual Outcome Survey Report-2015
2 | P a g e
TABLE OF CONTENTS
ACKNOWLEDGEMENTS 3
LIST OF ABBREVIATION 4
EXECUTIVE SUMMARY 5
MAIN REPORT 8 - 36
A. INTRODUCTION 8
B. OBJECTIVES 14
C. METHODOLOGY 14
D. FINDINGS 16
E. LESSONS LEARNT AND RECOMMENDATIONS 33
F. CONCLUSION 35
ANNEXURES 37 - 64
I. LIST OF VILLAGE SURVEYED UNDER ANNUAL OUTCOME SURVEY- 2015 37
II. QUESTIONNAIRE FOR ANNUAL OUTCOME SURVEY- 2015 38

ILSP-WMD Annual Outcome Survey Report-2015
3 | P a g e
ACKNOWLEDGEMENTS
I greatly acknowledge the support and contribution of the following in conducting the Annual
Outcome Survey, 2015 for Integrated Livelihood Support Project-Watershed Management
Directorate (ILSP-WMD), Uttarakhand and preparation of this report.
Chief Functionary of Prerna Gram Vikas Samiti (NGO), Haldwani and its team members mainly enumerators for carrying out the field survey and data entry work.
The Project Coordinators of HIFEED FNGO based at Nainital, Champawat and Pauri divisions and their team members for providing logistic support to enumerators during field survey and help in data collection and compilation.
The Deputy Project Director of Nainital, Champawat and Pauri and their team members for providing important information and photographs for the study.
Project Director, Kumaon Mr. P. K. Singh, IFS and their team at Project Director (Kumaon) Office, Haldwani for providing of logistics support during training, valuable feedback on report preparation and project related information.
Project Director, Mr. Kapil Lall, IFS and their team at Watershed Management Directorate, Dehradun for providing me an opportunity to undertake the assignment of carrying out Annual Outcome Survey, 2015 for the ILSP-WMD project.
28 April 2016 Bhimtal (Nainital)
Dr. Suresh Mathpal Consultant

ILSP-WMD Annual Outcome Survey Report-2015
4 | P a g e
LIST OF ABBREVIATIONS
AOS : Annual Outcome Survey
AWPB : Annual Work Plan and Budget
CBO : Community Based Organization
CPCU : Central Project Coordination Unit
CPD : Chief Project Director
CPR : Common Property Resource
FNGO : Field Non Governmental Organization
GOI : Government of India
Ha. : Hactare
IFAD : International Fund for Agriculture Development
IFS : Indian Forest Service
ILSP : Integrated Livelihoods Support Project
LC : Livelihood Collective
MIDH : Mission for Integrated Development of Horticulture
MIS : Management Information System
MNREGS: Mahatma Gandhi Rural Employment Guarantee Scheme
MWS : Micro Watershed
NGO : Non Governmental Organization
NRLM : National Rural Livelihood Mission
PG : Producer Group
PIA : Project Implementing Agency
PME : Planning, Monitoring and Evaluation
PMU : Project Management Unit
PSWMD: Project Society Watershed Management Directorate
RDD ; Rural Development Directorate
SHG : Self Help Group
UGVS : Uttarakhand Gramya Vikas Samiti
ULIPH : Uttarakhand Livelihood Improvement Support Project
UPASaC: Uttarakhand Parvatiya Aajeevika Samvardhan Company
UWDU: Uttarakhand Watershed Development Unit
VPG : Vulnerable Producer Group
VP : Van Panchayat
WMD : Watershed Management Directorate
WWMC: Water and Watershed Management Committee

ILSP-WMD Annual Outcome Survey Report-2015
5 | P a g e
EXECUTIVE SUMMARY
1. This assessment is a part of IFAD’s evaluation policy, where the IFAD assisted project requires conducting an outcome survey each year to assess the status of implementation of the program and achievement of key outputs and outcome parameters. The evaluation was done with the overall framework of the IFAD’s Annual Outcome Survey design. The present report encompasses the findings of the first annual outcome survey of ILSP-WMD.
2. The Integrated Livelihoods Support Project or ILSP followed the ULIPH which got completed
by the end of 2012. In ILSP, the main focus is on supporting producer organizations with technology and access to markets to improve food security and livelihoods. The project is being implemented by three Project Implementing Agencies (PIAs) which are the Uttarakhand Gramya Vikas Samiti (UGVS), Watershed Management Directorate (WMD) & Uttarakhand Parvatiya Aajeevika Samvardhan Company (UPASaC).
3. The ILSP-WMD project is being implemented in 187 Gram Panchayats covering 378 revenue
villages of three project divisions (Nainital, Champawat & Pauri). The field level implementation activities of ILSP-WMD were initiated from March 2014. During last one year (2015-16), important accomplishments of the project includes the formulation of 82 GPWDP, formation of 509 PGs with membership of 4571 households, formation of 171 VGs with 215 individuals,1412 hac of vegetable, cereal and pulse crops cultivation, 176 hac of fruit crops planting, 330 hac of forest plantations, 276 hac of fodder development, construction of 21632 cum dry stone check dam, construction of 5863 cum crate wire check dam, construction of 7216 m irrigation channel, construction of 135 irrigation tank, construction of 1026 roof water harvesting tank, construction of 119 small bridges for rural access and numerous capacity building programs for the project community.
4. The main objectives of carrying out Annual Outcome Survey were to measure changes
happening at the household level in terms of livelihoods and food security during the project life; to assess targeting efficiency; to provide evidence of project success or failure; and to provide timely performance information necessary to undertake corrective actions.
5. The survey is a holistic attempt to provide vital information on the outcome of project
interventions in areas of participation in project activities, livelihoods, food security, land tenure, agricultural production, access to market, enterprise development and employment, innovative linkages etc of the surveyed households. The survey was conducted using random sampling method on IFAD prescribed format.
6. The Annual Outcome Survey 2015 was conducted by ILSP-WMD covering all three project
divisions. A total of 300 project beneficiaries and 100 non project beneficiaries were covered from 40 villages (30 project and 10 non project). Prior to survey, the consultant imparted training to enumerators and coordinators for carrying out the survey in their project divisions.
7. The main findings of the Annual Outcome Survey-2015 in the form of key performance
indicators, on which future action planning will be based are summarized below. i. 19 % project households were headed by women. ii. 25 % project households belong to SC, ST and OBC categories. iii. 72 % of project households belong to Antyodaya (ultra poor) and BPL category. iv. 100 % project households have heard about project. v. 96 % of project households are members of PGs/VGs. vi. 99 % project households satisfied with project interventions. vii. 73 % of project households are frequently visited by project staff. viii. 100 % project households have one or more income source.
ILSP-WMD Annual Outcome Survey Report-2015
6 | P a g e
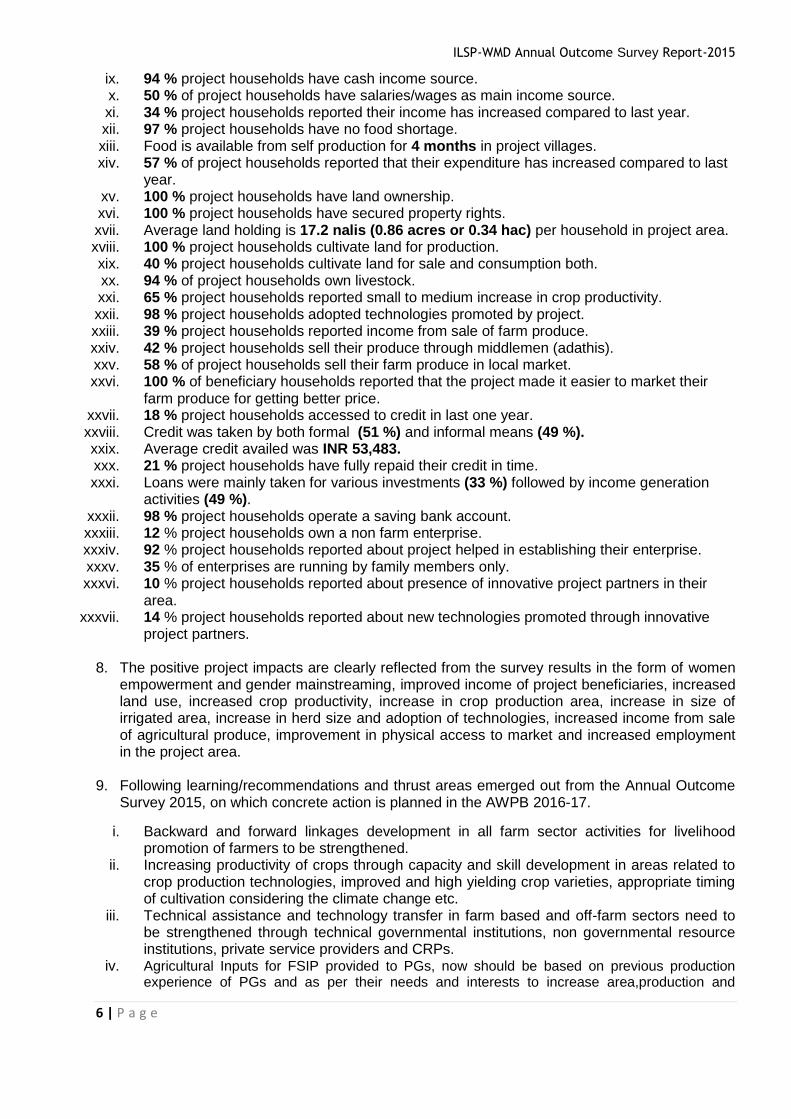
ix. 94 % project households have cash income source. x. 50 % of project households have salaries/wages as main income source. xi. 34 % project households reported their income has increased compared to last year. xii. 97 % project households have no food shortage. xiii. Food is available from self production for 4 months in project villages. xiv. 57 % of project households reported that their expenditure has increased compared to last
year. xv. 100 % project households have land ownership. xvi. 100 % project households have secured property rights. xvii. Average land holding is 17.2 nalis (0.86 acres or 0.34 hac) per household in project area. xviii. 100 % project households cultivate land for production. xix. 40 % project households cultivate land for sale and consumption both. xx. 94 % of project households own livestock. xxi. 65 % project households reported small to medium increase in crop productivity. xxii. 98 % project households adopted technologies promoted by project. xxiii. 39 % project households reported income from sale of farm produce. xxiv. 42 % project households sell their produce through middlemen (adathis). xxv. 58 % of project households sell their farm produce in local market. xxvi. 100 % of beneficiary households reported that the project made it easier to market their
farm produce for getting better price. xxvii. 18 % project households accessed to credit in last one year. xxviii. Credit was taken by both formal (51 %) and informal means (49 %). xxix. Average credit availed was INR 53,483. xxx. 21 % project households have fully repaid their credit in time. xxxi. Loans were mainly taken for various investments (33 %) followed by income generation
activities (49 %). xxxii. 98 % project households operate a saving bank account. xxxiii. 12 % project households own a non farm enterprise. xxxiv. 92 % project households reported about project helped in establishing their enterprise. xxxv. 35 % of enterprises are running by family members only. xxxvi. 10 % project households reported about presence of innovative project partners in their
area. xxxvii. 14 % project households reported about new technologies promoted through innovative
project partners.
8. The positive project impacts are clearly reflected from the survey results in the form of women empowerment and gender mainstreaming, improved income of project beneficiaries, increased land use, increased crop productivity, increase in crop production area, increase in size of irrigated area, increase in herd size and adoption of technologies, increased income from sale of agricultural produce, improvement in physical access to market and increased employment in the project area.
9. Following learning/recommendations and thrust areas emerged out from the Annual Outcome Survey 2015, on which concrete action is planned in the AWPB 2016-17.
i. Backward and forward linkages development in all farm sector activities for livelihood promotion of farmers to be strengthened.
ii. Increasing productivity of crops through capacity and skill development in areas related to crop production technologies, improved and high yielding crop varieties, appropriate timing of cultivation considering the climate change etc.
iii. Technical assistance and technology transfer in farm based and off-farm sectors need to be strengthened through technical governmental institutions, non governmental resource institutions, private service providers and CRPs.
iv. Agricultural Inputs for FSIP provided to PGs, now should be based on previous production experience of PGs and as per their needs and interests to increase area,production and

ILSP-WMD Annual Outcome Survey Report-2015
7 | P a g e
diversification of different crops, so that more marketable surplus can be generated through PG
activities. v. Some activities like irrigation tanks, irrigation guhls, fencing net etc are more preferred by
community and there is always a heavy demand for these type of interventions. These activities should be linked with respective line agencies through convergence.
vi. Planned interventions required for livestock promotion as an allied activity as dairy has emerged as the most preferred livelihood activity especially among the women.
vii. Livelihood Collectives to be developed as the focal point of its intervention in the project. These LCs will play an integral role in decision making, developing vision for future activity, making purchases of inputs and marketing in their respective clusters.
viii. Advocacy and fruitful linkage development with formal financial institutions through UPASaC to be strengthened in project area.
ix. Capacity enhancement of PGs/VGs and LCs during the year in areas related to institutional and business/enterprise development.
x. Development of specific value chain clusters for volume creation and effective marketing using platform of LCs.
xi. Involvement of innovative partners and research institutions in the project to upscale and value addition of project activities.
xii. Customized IEC material to be devised to cater the needs of the community. xiii. Experience and knowledge sharing events and exposure tours of PGs should be planned
at divisional and state level. xiv. Social audit of the watershed related works to be done annually through community
institutions involving PRI members.

ILSP-WMD Annual Outcome Survey Report-2015
8 | P a g e
ANNUAL OUTCOME SURVEY REPORT, 2015 FOR
INTEGRATED LIVELIHOODS SUPPORT PROJECT (ILSP) - WATERSHED
MANAGEMENT DIRECTORATE (WMD), UTTARAKHAND
A. INTRODUCTION
The Uttarakhand Watershed Development Unit (UWDU) through Govt. of Uttarakhand has
received a credit from IFAD (International Fund for Agriculture Development) for
implementation of Integrated Livelihoods Support Project, (ILSP). The UWDU is PIA for Project
Component -2: Participatory Watershed Development. The overall objective (goal) of ILSP is to
reduce poverty in hill districts of Uttarakhand. This would be achieved via the more immediate
development objective of “enable rural households to take up sustainable livelihood
opportunities integrated with the wider economy”.
Uttarakhand is a hill state in the north-west of India, covering 53,483 sq km with a population of
about 10 million (2011 census). Nine of its 13 districts are classed as hill districts, covering
77% of the area of the state, but with only 44% of the population. Livelihoods are still
predominantly rural, but most economic and population growth has also been in the plains,
which are becoming industrialised. Uttarakhand is one of the poorest states in India having
abundant natural resources. The major driver of rural poverty is the difficult mountain
environment. Land holdings are very small (average 0.8 ha) and fragmented into 6 or 7
different locations. Tiny terraced plots on steep hillsides makes mechanisation virtually
impossible. Shallow and immature soils require high levels of organic matter, but yields are
very low. Agriculture is very largely for subsistence, but very few households are able to
produce enough food to last for more than three or four months. People rely on non-farm
earnings and safety net programmes. With few rural employment opportunities, more and more
people are migrating to jobs outside of hill districts. Between one third and one half of
households send migrants and, as it is mainly men who migrate, this places more and more of
the burden of farm labour, as well as domestic work, on women. Lack of labour, low
productivity and wild animal damage are all contributing to land being abandoned, and it is said
that as much as 30% of land in the hills that was once used to grow crops is no longer in
production.
The justification for ILSP is the need to stop the deterioration of the productive infrastructure,
make farm labour more productive and farming more remunerative, and hence provide
ILSP-WMD Annual Outcome Survey Report-2015
9 | P a g e
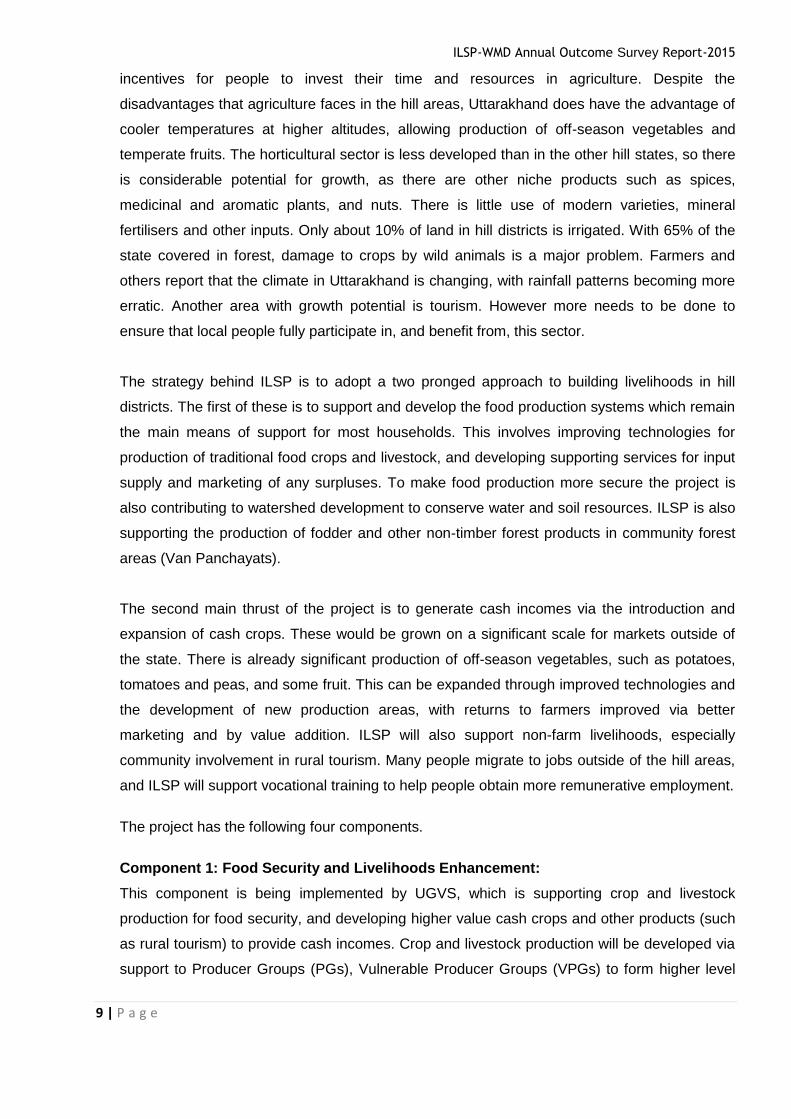
incentives for people to invest their time and resources in agriculture. Despite the
disadvantages that agriculture faces in the hill areas, Uttarakhand does have the advantage of
cooler temperatures at higher altitudes, allowing production of off-season vegetables and
temperate fruits. The horticultural sector is less developed than in the other hill states, so there
is considerable potential for growth, as there are other niche products such as spices,
medicinal and aromatic plants, and nuts. There is little use of modern varieties, mineral
fertilisers and other inputs. Only about 10% of land in hill districts is irrigated. With 65% of the
state covered in forest, damage to crops by wild animals is a major problem. Farmers and
others report that the climate in Uttarakhand is changing, with rainfall patterns becoming more
erratic. Another area with growth potential is tourism. However more needs to be done to
ensure that local people fully participate in, and benefit from, this sector.
The strategy behind ILSP is to adopt a two pronged approach to building livelihoods in hill
districts. The first of these is to support and develop the food production systems which remain
the main means of support for most households. This involves improving technologies for
production of traditional food crops and livestock, and developing supporting services for input
supply and marketing of any surpluses. To make food production more secure the project is
also contributing to watershed development to conserve water and soil resources. ILSP is also
supporting the production of fodder and other non-timber forest products in community forest
areas (Van Panchayats).
The second main thrust of the project is to generate cash incomes via the introduction and
expansion of cash crops. These would be grown on a significant scale for markets outside of
the state. There is already significant production of off-season vegetables, such as potatoes,
tomatoes and peas, and some fruit. This can be expanded through improved technologies and
the development of new production areas, with returns to farmers improved via better
marketing and by value addition. ILSP will also support non-farm livelihoods, especially
community involvement in rural tourism. Many people migrate to jobs outside of the hill areas,
and ILSP will support vocational training to help people obtain more remunerative employment.
The project has the following four components.
Component 1: Food Security and Livelihoods Enhancement:
This component is being implemented by UGVS, which is supporting crop and livestock
production for food security, and developing higher value cash crops and other products (such
as rural tourism) to provide cash incomes. Crop and livestock production will be developed via
support to Producer Groups (PGs), Vulnerable Producer Groups (VPGs) to form higher level
ILSP-WMD Annual Outcome Survey Report-2015
10 | P a g e
organisations i.e. Livelihood Collectives (LCs). To up-scale enterprises generating cash
incomes, and to introduce new income sources, ILSP is also improving access to markets
through a value chain approach and the provision of physical infrastructure for market access.
The value chain approach involves market/sub-sector studies, introduction of new
technologies, market linkage, skill development, product development and promotion, physical
infrastructure for market access. The project is also improving access to employment in the
non-farm sector by supporting vocational training linked to job placement. A total of 15000
youths will be trained with 80% placement covering around 60% women. These activities will
cover around 90000 households in selected 33 blocks of the eight districts i.e. Almora (8),
Bageshwar (3), Chamoli (5), Tehri (5), Uttarkashi (5), Rudraprayag (2), Pithoragarh (3), and
Dehradun (2).
Component 2: Participatory Watershed Development:
This component is being implemented by the Project Society Watershed Management
Directorate (PSWMD), which is using processes that have been established through a series of
watershed development projects in the state, but with an increased focus on food security,
livelihoods and market linkages. It is protecting and improving the productive potential of the
natural resources in selected watersheds, alongside the promotion of sustainable agriculture
with formation of PGs, VPGs and LCs, and with improved access to markets. It is
complementing the ongoing watershed development programme funded by the World Bank
and Government of India, and takes into account availability of required WMD institutional
capacity in the selected project districts. The component is targeted to cover a total of around
21,101 HHs in 7 development blocks of Pauri, Champawat and Nainital districts as given in
following table and map.
S.N. District Development Block Name (ILSP-WMD)
1 Pauri Pabo, Ekeshwar
2 Champawat Pati, Champawat, Barakot
3 Nainital Betalghat, Ramgarh

ILSP-WMD Annual Outcome Survey Report-2015
11 | P a g e
Under Component-2 of the Project a total of 22 Micro-watersheds (MWS) covering an area of
about 70,194 ha in 3 clusters in the districts of Pauri, Champawat and Nainital are being
developed. These MWS include about 378 Revenue Villages spread over 7 Development
Blocks (partially covered), with a population of 1,03,321 and 21,101 households (based on
census 2001). These watersheds have been shortlisted as they have been identified as priority
MWS in the State Perspective and Strategic Plan for Watershed Development.
Sub-components and activities to be implemented under Component-2 are as follows:
(a) Participatory Watershed Management
(i) Social mobilization and participatory planning: The involvement of stakeholders at grass
root level is a vital element of watershed management. It is of utmost importance that they feel
ownership towards the project. Village level local government, the Gram Panchayat, along with
its Water and Watershed Management Committee (WWMC), RVC and Van Panchayats,
Producer Groups, Vulnerable Groups and Womens’ Forums, will be the vehicles for planning
and implementation at the village level.
(ii) Village and watershed development: Watershed Development activities will be
implemented on the basis of a budget allocation provided at the GP level calculated based on
ILSP-WMD Annual Outcome Survey Report-2015
12 | P a g e
watershed area and total population. Within this allocation the communities will have to
prioritize, implement, operate and maintain watershed and other priority investments of the
village. The various activities will be Soil and Moisture Conservation Measures, water
harvesting structures, plantations, pasture development, livestock support and encourage use
of alternate energy sources.
(b) Food security enhancement support
(i) Rainfed agriculture and agribusiness systems improvement: Producer Groups (PG)
would be formed to introduce, promote and disseminate improved technologies and farming
practices. A total of 12,000 members will be organized under PGs, with an average of 10
members in each PG. Training and demonstrations on new technologies may also be
provided. Linkages may be made to research agencies and other technology providers.
(ii) Value addition and marketing support: Under this sub-component, the project will
identify the market potential for the agricultural produce; develop collection centres and good
storage facilities; create centres for value addition of the raw produce; and identify market
linkages, develop market information and logistic services. The private sector (NGOs and
private firms) will be encouraged to play a major role in supporting agribusiness development.
To up-scale production, develop markets for high value crops, and to leverage producers’
access to production and marketing services, the project would support farmers to organise
their PG and VPG into Livelihood Collectives(LCs). The project would provide input support to
LCs. For financial support, PG/LC would be linked with banks and other financial institutions.
(c) Livelihood up-scaling support
(i) Promotion of income generation activities (IGAs) and support to VGs: Vulnerable
Groups (VG) will be formed comprising of scheduled castes, landless and very poor
households. A total of 3,000 members will be organized under VGs. VGs will be self managed
institutions of the poor, and will be federated at the village and block level. These VGs will be
given sustained capacity building, orientation and training to encourage their entrepreneurial
development. Each VG will draw up a livelihood improvement plan which, after approval by the
Gram Panchayat, will be implemented with funding from the project.
(ii) Support to livelihood collectives for up-scaling IGA activities: LCs are a group of PGs
and VGs which come together with a common enterprise and to facilitate backward and
forward linkages for input supply and output marketing, and for access to information, credit,
technology, markets etc. LCs will engage in co-production (particularly value-addition activities)
and delivery of livelihood services to their group members. A total of 30 LCs will be formed with
project support. Individual and collective enterprises may be supported by bank loans and
investment funds from the Livelihood Finance component.

ILSP-WMD Annual Outcome Survey Report-2015
13 | P a g e
(d) Institutional Strengthening:
(i) Capacity Building of Watershed Committees, CBOs and all level of stakeholders.
(ii) Information, Education and Communication for targetting messages to increase general
awareness about the project, terms of participation and transparency.
(iii) Project Management, Coordination , Monitoring and Evaluation.
Component 3: Livelihood Financing:
This component is being implemented by Uttarakhand Parvatiya Aajeevika Samvardhan
Company or UPASaC. The activities under this component include Banking support through
capacity building, support to banks and local financial institutions to opening new branches in
the project area; Loan at reasonable rates/ Venture financing with banks to the business
enterprises emerging under the project area as per the business plan of the ventures; Risk
management by piloting and scaling up of insurance services such as weather, cattle, health
insurance etc; Financial inclusion initiatives through training to LCs to become bank agents as
Business Correspondent/Business Facilitator, product literacy training etc.; Provision of
development finance to ULIPH federations as viability gap funding to promote the agribusiness
activities. The component is targeted to cover complete ILSP area.
Component 4: Project Coordination and Monitoring:
To provide overall coordination, the state nodal agency, Rural Development Directorate (RDD),
has set up a Central Project Coordination Unit (CPCU) within the RDD, headed by a Chief
Project Director (CPD). Each executing agency, UGVS, PSWMD and UPASAC, had their own
project management units headed by a Project Director. The CPCU has two Units: (i) Finance
Unit; and (ii) Planning and M&E Unit. A State level Project Steering Committee (PSC) has
been setup under the chairmanship of Chief Secretary and the PSC has established a Project
Management Committee (PMC) chaired by Additional Chief Secretary (ACS) and Forest and
Rural Development Commissioner (FRDC).
To access the status of impact at various stages of implementation, ILSP is provisioned and
designed to have periodic surveys based on project indicators for Logical framework, Result &
Impact Monitoring System (RIMS), Annual Outcome Survey (AOS), Knowledge Attitude
Practice (KAP) etc. Monitoring and Evaluation (M&E) System under ILSP generates
management information and provides the State Government and IFAD with evidence of result
and impact against logframe indicators. This involves activity/output, process, outcome and
impact monitoring. This includes various surveys i.e. Baseline, Mid-term, End-term, RIMS,
KAPs, AOS etc. In addition, project also conducts IIIrd party assessment for specific activities.

ILSP-WMD Annual Outcome Survey Report-2015
14 | P a g e
As part of the project monitoring and evaluation, annual outcome surveys are to be undertaken
in all the IFAD funded projects to measure the immediate results of project interventions. This
assessment is a part of IFAD’s evaluation policy, where the IFAD assisted project requires
conducting an outcome survey each year to assess the status of implementation of the
program and achievement of key outputs and outcome parameters. The evaluation was done
with the overall framework of the IFAD’s Annual Outcome Survey design. The present report
encompasses the findings of the first annual outcome survey in ILSP-WMD.
B. OBJECTIVES:
The Annual Outcome Survey was carried out with the following objectives.
1. To measure changes happening at the household level in terms of livelihoods and food
security during the project life;
2. To assess targeting efficiency;
3. To compare and measure the targeted group (beneficiaries) and control group (non
beneficiaries) for positive and negative changes;
4. To provide evidence of project success or failure; and
5. To provide timely performance information necessary to undertake corrective actions.
The survey is a holistic attempt to provide vital information on the outcome of project
interventions in areas of participation in project activities, participation in PGs and LCs,
livelihoods, food security, land tenure, agricultural production and irrigation, access to market
etc of the surveyed households. The survey was conducted using random sampling method on
IFAD prescribed format.
C. METHODOLOGY:
The annual outcome survey is conducted annually in target villages of the project and includes
both project beneficiaries and non beneficiaries (control group). The Annual Outcome Survey
2015 was conducted by ILSP-WMD covering all three project divisions. A total of 300 project
beneficiaries and 100 non project beneficiaries were covered from 40 villages covering 30
project and 10 non project villages. The whole process of AOS involved the following steps.
I. Team Formation and Training: The survey was conducted by using the in-house
capacity of ILSP-WMD team along with a team of enumerators from Prerna Gram Vikas
Samiti (An NGO based at Haldwani). The divisional project team identified 12 project
staff members (facilitators) having grassroot level field experience of working in the
development sector for conduction of AOS, 2015. These include 12 enumerators and 3

ILSP-WMD Annual Outcome Survey Report-2015
15 | P a g e
coordinators (4 enumerators and one coordinator from each of the three project
divisions). Thus 6 teams (two for each division) were formed. To train the enumerators,
facilitators and coordinators for carrying out AOS in their respective divisions, a three
days training cum field survey exercise was organized at centralised level at Haldwani.
The AOS team were shared the guidelines and questionnaires for conducting of AOS.
Various issues and methodology was also discussed in the training. On the third day of
the training, a field testing survey exercise was organised in village Jakh of Betalghat
block (Nainital). The training ended with the preparation of division wise action plan for
the AOS-2015.
II. Selecting sample villages and households: A total of 30 project villages and 10 non
project villages were identified from three project divisions. The villages were chosen
randomly so as to represent villages from all micro-watersheds, project blocks, project
year and altitude (high hills, mid hills and valleys) from the project area. Similarly, 300
households from project area and 100 households from non project area were identified
randomly to represent the whole village community. During the sampling, the villagers
were briefed about the purpose, objectives and outputs of the survey. The division wise
list of project and control villages selected for the study is enclosed in Annexure I.
III. Household Survey: The standard questionnaire was provided by IFAD for the survey.
The questionnaire was revised as per the scope of project taking inputs from PMU and
divisional teams. The team of enumerators visited the identified villages as per the
action plan and conducted the survey of identified households. After questionnaire
survey of 10 households, a focussed group discussion and 1-2 key informant interviews
were also conducted. Thus a total of 400 household survey, 40 focussed group
discussion and 50 key informant interviews were carried out during the survey. A
sample questionnaire is enclosed as Annexure II.
IV. Data Entry: After household survey at village level, all the questionnaires were
checked at divisional office level by the coordinators. The data was compiled at the
divisional office in the IFAD provided automated excel based software and the analysis
was done with the help of generated reports.
V. Analysis of Data and Reporting: The analysis of data and report writing work was
done by the consultant by using qualitative findings of the survey showcased in the
reports generated by the system. The final report was prepared comparing the data of
project beneficiaries and non project beneficiaries. Besides, findings of the focussed
ILSP-WMD Annual Outcome Survey Report-2015
16 | P a g e
group discussions and key informants interviews were also used in final report writing
and knowledge sharing workshops.
The following indicators were measured as part of the survey:
1. Beneficiary Profile
2. Participation in Project activities
3. Livelihoods
4. Food Security
5. Land Tenure
6. Agricultural Production
7. Assess to Market
8. Access to Rural Financial Services
9. Enterprise Development and Employment
10. Innovative Linkages
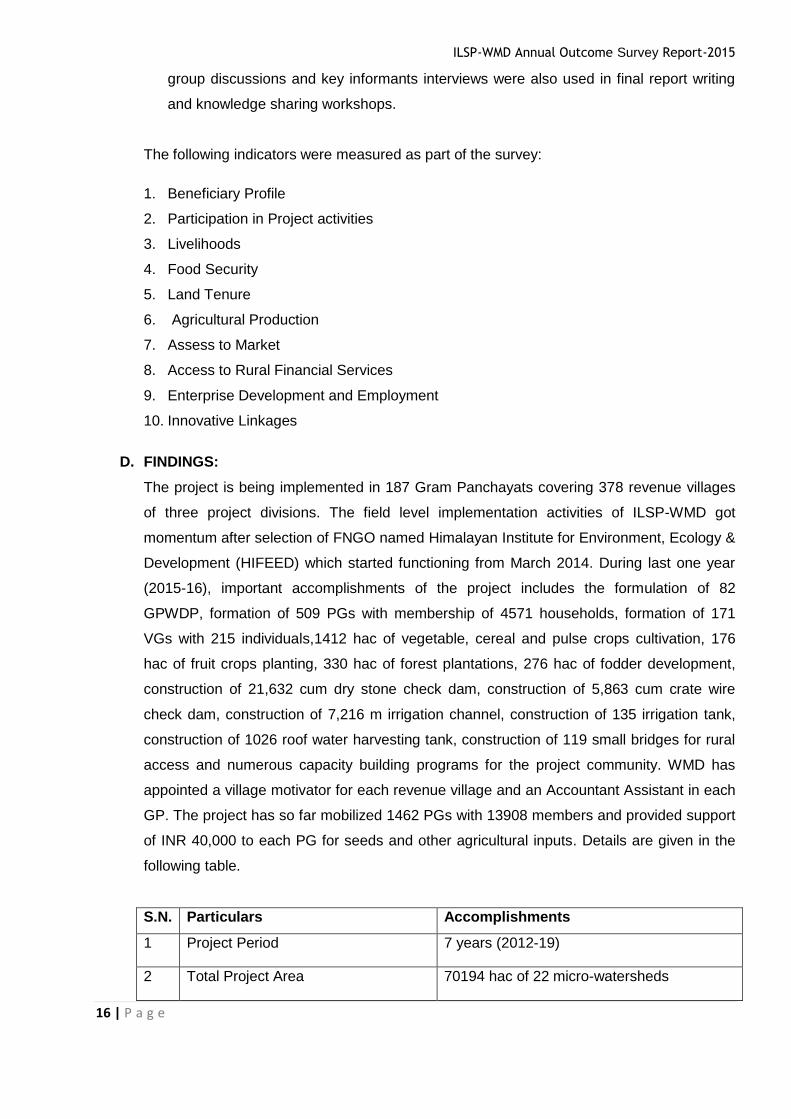
D. FINDINGS:
The project is being implemented in 187 Gram Panchayats covering 378 revenue villages
of three project divisions. The field level implementation activities of ILSP-WMD got
momentum after selection of FNGO named Himalayan Institute for Environment, Ecology &
Development (HIFEED) which started functioning from March 2014. During last one year
(2015-16), important accomplishments of the project includes the formulation of 82
GPWDP, formation of 509 PGs with membership of 4571 households, formation of 171
VGs with 215 individuals,1412 hac of vegetable, cereal and pulse crops cultivation, 176
hac of fruit crops planting, 330 hac of forest plantations, 276 hac of fodder development,
construction of 21,632 cum dry stone check dam, construction of 5,863 cum crate wire
check dam, construction of 7,216 m irrigation channel, construction of 135 irrigation tank,
construction of 1026 roof water harvesting tank, construction of 119 small bridges for rural
access and numerous capacity building programs for the project community. WMD has
appointed a village motivator for each revenue village and an Accountant Assistant in each
GP. The project has so far mobilized 1462 PGs with 13908 members and provided support
of INR 40,000 to each PG for seeds and other agricultural inputs. Details are given in the
following table.
S.N. Particulars Accomplishments
1 Project Period 7 years (2012-19)
2 Total Project Area 70194 hac of 22 micro-watersheds
ILSP-WMD Annual Outcome Survey Report-2015
17 | P a g e
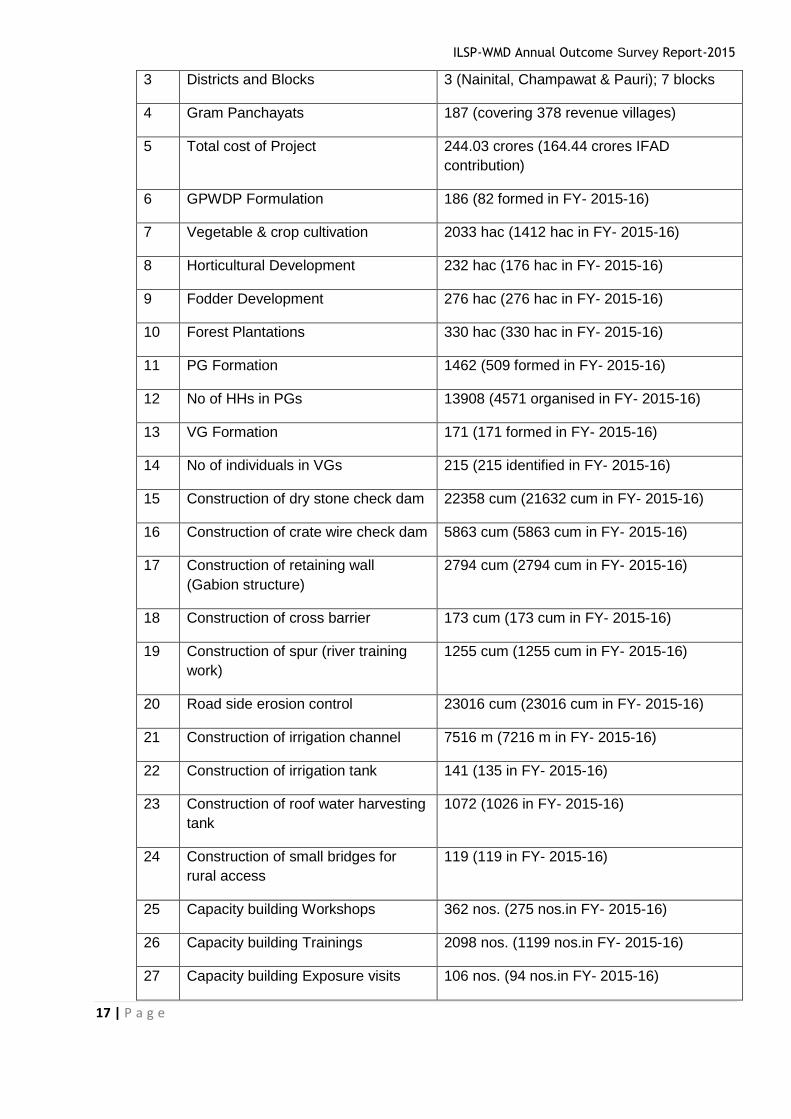
3 Districts and Blocks 3 (Nainital, Champawat & Pauri); 7 blocks
4 Gram Panchayats 187 (covering 378 revenue villages)
5 Total cost of Project 244.03 crores (164.44 crores IFAD
contribution)
6 GPWDP Formulation 186 (82 formed in FY- 2015-16)
7 Vegetable & crop cultivation 2033 hac (1412 hac in FY- 2015-16)
8 Horticultural Development 232 hac (176 hac in FY- 2015-16)
9 Fodder Development 276 hac (276 hac in FY- 2015-16)
10 Forest Plantations 330 hac (330 hac in FY- 2015-16)
11 PG Formation 1462 (509 formed in FY- 2015-16)
12 No of HHs in PGs 13908 (4571 organised in FY- 2015-16)
13 VG Formation 171 (171 formed in FY- 2015-16)
14 No of individuals in VGs 215 (215 identified in FY- 2015-16)
15 Construction of dry stone check dam 22358 cum (21632 cum in FY- 2015-16)
16 Construction of crate wire check dam 5863 cum (5863 cum in FY- 2015-16)
17 Construction of retaining wall
(Gabion structure)
2794 cum (2794 cum in FY- 2015-16)
18 Construction of cross barrier 173 cum (173 cum in FY- 2015-16)
19 Construction of spur (river training
work)
1255 cum (1255 cum in FY- 2015-16)
20 Road side erosion control 23016 cum (23016 cum in FY- 2015-16)
21 Construction of irrigation channel 7516 m (7216 m in FY- 2015-16)
22 Construction of irrigation tank 141 (135 in FY- 2015-16)
23 Construction of roof water harvesting
tank
1072 (1026 in FY- 2015-16)
24 Construction of small bridges for
rural access
119 (119 in FY- 2015-16)
25 Capacity building Workshops 362 nos. (275 nos.in FY- 2015-16)
26 Capacity building Trainings 2098 nos. (1199 nos.in FY- 2015-16)
27 Capacity building Exposure visits 106 nos. (94 nos.in FY- 2015-16)

ILSP-WMD Annual Outcome Survey Report-2015
18 | P a g e
Rain water harvesting tank LDPE lined farm pond
Irrigation Tank Retaining walls/check dam
Community plantation Small bridge for rural access
Vegetable and spice cultivation Capacity building program

ILSP-WMD Annual Outcome Survey Report-2015
19 | P a g e
The key findings of the Annual Outcome Survey 2015 based on the identified parameters
are summarized in the following paragraphs.
1. Beneficiary Profile:
The project is being implemented in the rural hill areas of Uttarakhand with mostly poor
population. In general the male population has migrated in search of jobs and female
population is restricted in the villages looking after children and elders besides performing
household chores and subsistence agriculture. In both the cases (project beneficiary and
non project households surveyed) it was found that only 19 % households were headed by
women and rest 81% households are headed by men.
The society in the hilly regions where the project is operating is patri-lineal society where
elder male is mostly treated as the head of the family. In cases where female headed
households are reported are mostly single women or widow. One main reason of women
headed household may be due to migration of male population in search of jobs and in
defence services. In several cases the new generation has been migrated to towns like
Champawat, Pauri, Haldwani and Dehradun for giving good education and other facilities to
children and family, leaving old aged population left behind in villages to look after the
homes and fields.
As per caste composition of surveyed beneficiary households, 22 % belongs to SC, 2 %
ST, 2 % OBC and 75 % general (Brahmins and Rajputs). Similarly, in surveyed non
beneficiary households, 24 % belongs to SC, 3 % belongs to ST, OBC - nil and 73 %
general category.
In terms of wellbeing status (poverty category) of surveyed beneficiary households, 8%
belongs to Antyodaya or ultra poor category, 64% BPL and 28% APL, as per the
governmental categorization of poverty. Similarly, in surveyed non beneficiary households,
9 % belongs to Antyodaya or ultra poor category, 58 % BPL and 33 % APL category. The
project is mainly focusing on Antyodaya and BPL households.
The survey result also reflects the impact of women empowerment and gender
mainstreaming in the project area. The status of beneficiary profile of the household in
project and non project villages is summarized in the following diagrams.

ILSP-WMD Annual Outcome Survey Report-2015
20 | P a g e
AOS-2015
Project Non Project
Key Findings
i. 19 % project households were
headed by women.
ii. 25 % project households belongs
to SC, ST and OBC categories.
iii. 72 % of project households
belongs to Antyodaya (ultra poor)
and BPL category.

ILSP-WMD Annual Outcome Survey Report-2015
21 | P a g e
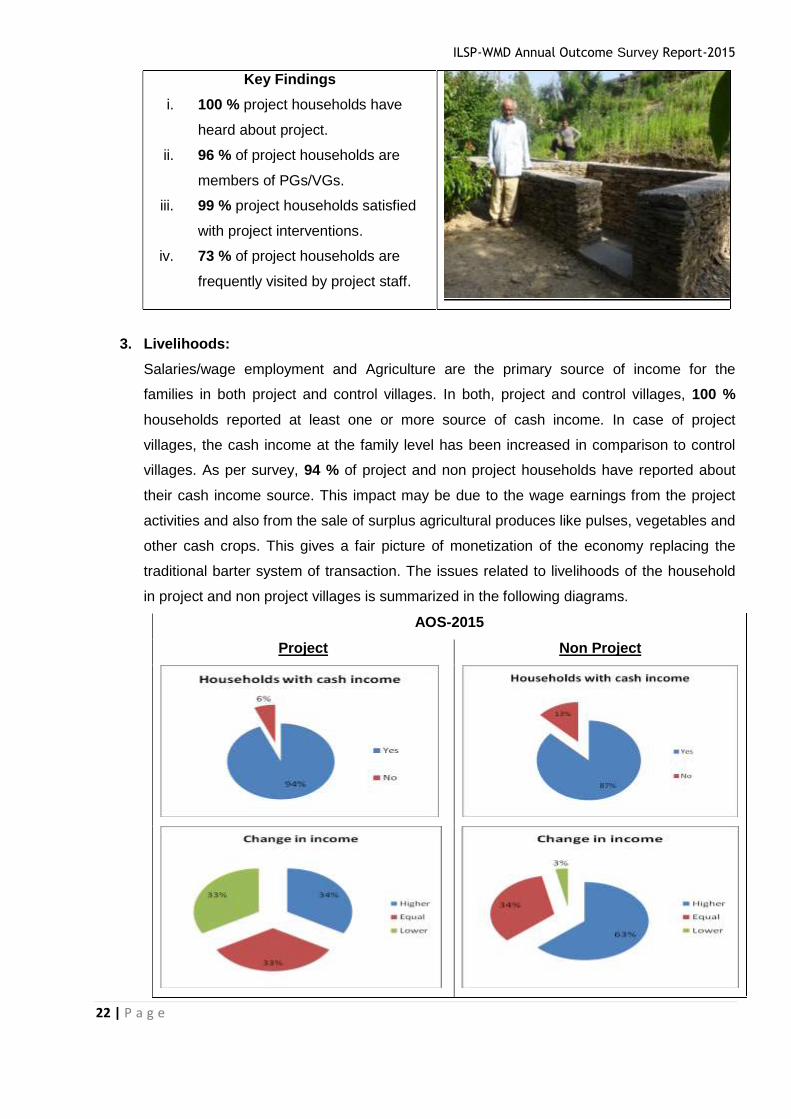
2. Participation in Project Activities:
The ILSP-WMD project was initiated in the project area from August 2014 and is being
implemented in a phased manner. All the beneficiary households reported that they have
knowledge about the project and are participating in various project activities. As the
program is focussed on the development of livelihoods through improved management of
natural resources, 96 % of the respondents reported that they are members of PGs/VGs
and involved in activities related to Producer Groups promoted by the project. As per the
survey results, 100 % of project beneficiary households have heard about of project and
are involved in at least one or more project activities related to land and water management
and earned wage income from program activities. These interventions under land and
water management have resulted in improving the agricultural land and its productivity. The
training and exposure programs for increasing land productivity and sustainable
management of natural resources has opened up new income generating opportunities for
poor families. The capacity building program has resulted in improved knowhow and
practices in their existing livelihoods system. The most preffered project activity was found
to be the irrigation tanks and irrigation channels developed by the project with community
participation.
Out of total respondent surveyed 99 % households were very moderately or very satisfied
with project intervention while only 1 % households were not satisfied with project outputs.
To improve the quality of works and interventions promoted under the project, the
management ensures timely and quality visits to the community through its divisional and
micro-watershed level project team. Responding regarding contact with project staff, 73 %
of surveyed households reported that project staff frequently visits to them.
The satisfaction level of beneficiary community is high and the processes and practices
have replicated in other non project areas also. This shows dissemination of project
message/learning to grassroots level and to non project areas. The issues related to
community participation in project are shown in the following figures.
AOS-2015 (Project Beneficiaries)
ILSP-WMD Annual Outcome Survey Report-2015
22 | P a g e
Key Findings
i. 100 % project households have
heard about project.
ii. 96 % of project households are
members of PGs/VGs.
iii. 99 % project households satisfied
with project interventions.
iv. 73 % of project households are
frequently visited by project staff.
3. Livelihoods:
Salaries/wage employment and Agriculture are the primary source of income for the
families in both project and control villages. In both, project and control villages, 100 %
households reported at least one or more source of cash income. In case of project
villages, the cash income at the family level has been increased in comparison to control
villages. As per survey, 94 % of project and non project households have reported about
their cash income source. This impact may be due to the wage earnings from the project
activities and also from the sale of surplus agricultural produces like pulses, vegetables and
other cash crops. This gives a fair picture of monetization of the economy replacing the
traditional barter system of transaction. The issues related to livelihoods of the household
in project and non project villages is summarized in the following diagrams.
AOS-2015
Project Non Project

ILSP-WMD Annual Outcome Survey Report-2015
23 | P a g e
In both the cases main source of income was salaries/wages, as reported by 50 % for
beneficiary households & 41 % non beneficiary households followed by agriculture (as
reported by 25 % beneficiary and 8 % non beneficiary households). The other sources of
livelihoods as found from the study are livestock rearing, petty trading, remittances,
handicraft making etc. However, the poor families are primarily dependent upon multiple
sources of income to meet annual demand of food and other expenditure. This dependency
of multiple sources of income also adopted as a coping mechanism by the poor to reduce
the risk of loss of income from any one of the sources. There were no cases of begging
assistance in both categories of surveyed households.
On asking about the issue of change in income over the last one year, 34 % project
household reported that their income has increased while 33 % reported that their was no
change in income level. Responding on the same issue, 63 % non project beneficiaries
reported that their income has improved while 34 % reported that there was no change in
income level. It clearly shows that there was a great impact of project interventions in the
project area which has improved their income level. It is also reflected that due to project
interventions in primary sectors like agriculture, horticulture, livestock etc, short term
employment in allied sectors have been improved and the cash flow at the family level from
the primary activities have been increased. In both project as well as non project villages,
though families are depending upon multiple sources of income, the percentage of families
depending upon two, three or four or more sources in case of project villages are quite
encouraging and indication on adoption of interventions made by the project.
Key Findings
i. 100 % project households
have one or more income
source.
ii. 94 % project households have
cash income source.
iii. 50 % of project households
have salaries/wages as main
income source.
iv. 34 % project households
reported their income has
increased compared to last
year.
ILSP-WMD Annual Outcome Survey Report-2015
24 | P a g e
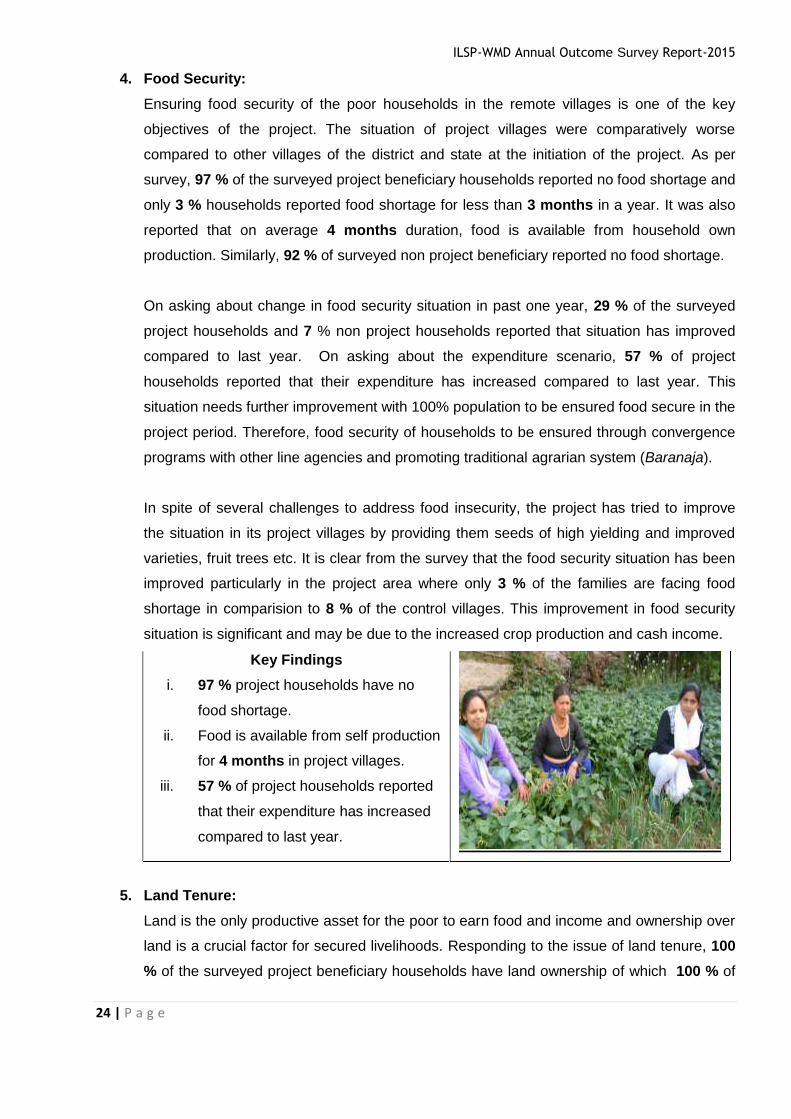
4. Food Security:
Ensuring food security of the poor households in the remote villages is one of the key
objectives of the project. The situation of project villages were comparatively worse
compared to other villages of the district and state at the initiation of the project. As per
survey, 97 % of the surveyed project beneficiary households reported no food shortage and
only 3 % households reported food shortage for less than 3 months in a year. It was also
reported that on average 4 months duration, food is available from household own
production. Similarly, 92 % of surveyed non project beneficiary reported no food shortage.
On asking about change in food security situation in past one year, 29 % of the surveyed
project households and 7 % non project households reported that situation has improved
compared to last year. On asking about the expenditure scenario, 57 % of project
households reported that their expenditure has increased compared to last year. This
situation needs further improvement with 100% population to be ensured food secure in the
project period. Therefore, food security of households to be ensured through convergence
programs with other line agencies and promoting traditional agrarian system (Baranaja).
In spite of several challenges to address food insecurity, the project has tried to improve
the situation in its project villages by providing them seeds of high yielding and improved
varieties, fruit trees etc. It is clear from the survey that the food security situation has been
improved particularly in the project area where only 3 % of the families are facing food
shortage in comparision to 8 % of the control villages. This improvement in food security
situation is significant and may be due to the increased crop production and cash income.
Key Findings
i. 97 % project households have no
food shortage.
ii. Food is available from self production
for 4 months in project villages.
iii. 57 % of project households reported
that their expenditure has increased
compared to last year.
5. Land Tenure:
Land is the only productive asset for the poor to earn food and income and ownership over
land is a crucial factor for secured livelihoods. Responding to the issue of land tenure, 100
% of the surveyed project beneficiary households have land ownership of which 100 % of

ILSP-WMD Annual Outcome Survey Report-2015
25 | P a g e
land owners have very secured property rights. In case of non project beneficiaries, 99 %
households have land ownership but 96 % of land owners have very secured property
rights. The land ownership status in project and control villages is shown in the following
figures.
AOS-2015
Project Non Project
The second issue over ownership over land is the size of land holding. It was observed that
in both the cases, average land holding size is almost similar, which is 17.2 nalis (0.86
acres) for project households and 14.8 nalis (0.74 acres) for non project households as
both type of villages share similar topography. In project area, the minimum and maximum
land holding ranges between 2 nalis (0.1 acres) and 90 nalis (4.5 acres). Due to migration,
several families have given their land to other families residing in the village. The project
impact is clearly reflected from the survey results in the form of increased land ownership
compared to last year survey results.
Key Findings
i. 100 % project households have
land ownership.
ii. 100 % project households have
secured property rights.
iii. Average land holding is 17.2 nalis
(0.86 acres or 0.34 hac) per
household in project area.

ILSP-WMD Annual Outcome Survey Report-2015
26 | P a g e
6. Agricultural Production:
Cereal and pulse cultivation in the hills is becoming unproductive due to high production
cost, shortage of farm labour and damage due to wild animals. As a result, there is shift
towards cultivation of vegetables, spices, fruits, nuts, medicinal and aromatic plants. These
are mostly cash crops and fetches better economic returns also. The traditional trend of
practicing of cultivating land for consumption purpose only is gradually shifting towards
both consumption and sales purposes in both project and non project villages. However the
percentage of farmers cultivating land for both consumption and sale are more in case of
project villages compared to control villages. The survey indicates that a total of 100% of
project households cultivate land for production of which 60 % households cultivate land for
consumption only and 40 % households for consumption & sale both. The survey results of
non project beneficiaries regarding agricultural production and irrigation depicts that a total
of 100 % households cultivate land of which 58 % households cultivate land for
consumption only and only 3 % households for consumption and sale both.
Rearing of livestock is the traditional practice of hill community to secure immediate and
unsecured expenses. Also it is the main source of sustaining the hill agricultural economy
by providing compost. As per the survey results, 94 % households in the project area
reported that they rear livestock while 90 % of the non project households rear livestock.
Total 65 % of surveyed households have reported small to medium increase in crop
productivity, increase in crop production area, increase in size of irrigated area and
increase in herd size but only 17 % gives the credit to project interventions.
From the study it was also observed that life saving irrigation, particularly in weather erratic
conditions helps a lot the farmer to secure his crops. Various water storage tanks and
irrigation channels created by the project have provided life saving irrigation during kharif
and rabi season. It has encouraged the farmers to adopt cash crops and cultivate three to
four crops in a year. This impact not only increases the crop production and productivity in
these remote villages rather saves the crop loss due to uneven weather conditions and
other environmental effects.
Just not crop production or productivity, the practice of growing cash/high value crops by
the farmers have been very encouraging in the project area. The preferred crops include
pea, tomato, chilly, capsicum, French bean etc and some medicinal crops. Similarly, 98 %
households reported that they have adopted one or more technologies promoted by
project. The most preferred/successful technology promoted by project is seed
replacement which almost doubled the production of the crop. The major findings of

ILSP-WMD Annual Outcome Survey Report-2015
27 | P a g e
agricultural production related parameter including the status of the farmers adopting
various technologies promoted by project in project villages is summarized in the following
figures.
AOS-2015 (Project Beneficiaries)
In an agriculture based economy, income is directly proportional to the productivity of
agricultural crops. The project through its various interventions under agricultural
production enhancement as well as creating irrigation potential has resulted in increase in
productivity and crop production area in the project villages. Not just crop productivity, the
practice of growing cash/high value crops and cultivation of land for consumption and sale
by the farmers have been very encouraging in the project area. The increase in livestock
productivity may be due to adoption of high yielding milch animals and fodder development
programs.

ILSP-WMD Annual Outcome Survey Report-2015
28 | P a g e
The project impact is clearly reflected from the survey results in the form of increased crop
productivity, increase in crop production area, increase in size of irrigated area, increase in
herd size and adoption of technology compared to last year survey results. It can be thus
concluded that the project households have started managing their assets more efficiently.
Key Findings
i. 100 % project households
cultivate land for production.
ii. 40 % project households
cultivate land for sale and
consumption both.
iii. 94 % of project households
owns livestock.
iv. 65 % project households
reported small to medium
increase in crop productivity.
v. 98 % project households
adopted technologies promoted
by project.
7. Access to Market:
Physical access to market for sale of produce is a key concern in the project location.
These are mostly remote villages where the traders or middle-men exploits the farmers.
Project interventions in market related information dissemination at village level is reducing
such exploitation and increasing access to the market. Not only the production, rather the
sale of the surplus agricultural produces and other horticultural produces have been
facilitated by the project to ensure increased income of the poor farmers. The income from
sales of agricultural production has been reported by 39 % of project beneficiary
households. At present there are no formal or organized contracts fully developed for
selling of agricultural produce and farmers are either direct selling their produce in the local
market or marketing their produce through middlemen mainly Adathis located at Haldwani.
100 % of beneficiary households reported that the project made it easier to market their
farm produce which resulted in getting better price thus give credit to project activities for
increased crop production. With regard to marketing of produce in various types of market,
58 % households market their produce to the nearby local market and only 13 % produce
go to district or regional market for selling. Similarly, on asking about the medium of selling
of produce, the 42 % beneficiary households reported that they sell their produce through

ILSP-WMD Annual Outcome Survey Report-2015
29 | P a g e
middlemen mainly Adathis and only 1 % is marketed through cooperatives or producer
organizations. Hence there is a great potential of selling the farm produce to regional and
national market for fetching good returns to the farmers. The findings regarding access to
market related parameter in project area is shown in the following figures.
AOS-2015 (Project Beneficiaries)
Collective marketing as a strategy should be facilitated by the project through Producer
Groups/Livelihood Collectives to promote the sale of surplus produce in a consolidated
manner to ensure volume which not only brings down the logistics expenditure but also
provides the farmers a better platform to bargain with the market. This will also motivate the
farmers to grow more particularly vegetables and other high value crops which in turn
increase the income at the household level.
Key Findings
i. 39 % project households reported
income from sale of farm produce.
ii. 42 % project households sells their
produce through middlemen
(adathis).
iii. 58 % of project households sells
their farm produce in local market.
iv. 100 % of beneficiary households
reported that the project made it
easier to market their farm produce
for getting better price.
8. Access to Rural Financial Services:
Rural financial services particularly micro-credit at the village level is quite crucial in the
scaling up of various livelihoods interventions. These small loans are used for both

ILSP-WMD Annual Outcome Survey Report-2015
30 | P a g e
consumption and/or productive purposes which has great impact over the income of the
families. The survey results regarding access to credit reveals that in project villages, only
18 % households have accessed to credit over the last 12 months, 34 % households
reported that access to credit improved over the last 12 months and 57 % households
gives the credit to project activities. On analysing the main use of credit, loans were mainly
taken for various investments (33 %) followed by income generation activities (49%).
Average amount of credit availed was INR 53,483 and were taken by both formal (51 %)
and informal means (49 %). The credit repayment scenario shows that 21 % households
have fully paid their loans, 77 % will pay the outstanding loan in a short time and rest 2 %
are unable or not willing to pay their loans. It is encouraging to know that 98% of project
households have a saving bank account and the families are also accessing the credit for
health and education purposes. It was encouraging to know that and
In non project villages, only 24 % households have accessed credit over the last 12 months
and 43 % households reported that access to credit improved over the last 12 months.
Average amount of credit availed was INR 18,000. 93% of control village households have
a saving bank account. The major findings of Access to rural financial services related
parameter is summarized in the following figures.
AOS-2015 (Project Beneficiaries)

ILSP-WMD Annual Outcome Survey Report-2015
31 | P a g e
As per survey results, the community is now aware enough to utilize the loan amount in
economic activities. However, access to formal financial institutions like banks need to be
improved for livelihood sustainability of poor people.
Key Findings
i. 18 % project households accessed
to credit in last one year.
ii. Credit was taken by both formal
(51 %) and informal means (49 %).
iii. Average credit availed was INR
53,483.
iv. 21 % project households have fully
repaid their credit in time.
v. Loans were mainly taken for
various investments (33 %)
followed by income generation
activities (49%).
i. 98% project households operate a
saving bank account.
9. Enterprise Development and Employment:
The project is in its primary implementation stage and is supporting the project community
in establishing and expanding small and medium scale enterprises through capacity
building and agri-business awareness. The survey results regarding owning non form
enterprises in project villages, only 12 % households reported to own a non form enterprise
which was mainly self supported. On asking about the project support, 92 % households
reported that project has helped in expanding their enterprise in the form of awareness
building, training, exposure etc. With regard to employees employed in the enterprises are

ILSP-WMD Annual Outcome Survey Report-2015
32 | P a g e
concerned, 35 % enterprise owner reported that it is run by themselves including their
family members and 65 % households have one or two employees. This sector is important
and project need to focus in this matter. Learning from the survey results, the project
should follow the enterprise development strategy and use of UPASaC to strengthen these
existing enterprises along with development of marketing linkages. The survey result
shows the positive impact of increased employment in the project area being facilitated by
the project. The major findings of Enterprise development and employment related
parameter is summarized in the following figures.
AOS-2015
Key Findings
i. 12 % project households own a
non farm enterprise.
ii. 92 % project households
reported about project helped in
establishing their enterprise.
iii. 35 % of enterprises are running
by family members only.
10. Innovative Linkages:
In the project, innovative linkages are being developed with various institutions for testing
and dissemination of innovative technologies and approaches for improving food security,
livelihoods and access to markets. The important project partners includes the G. B. Pant
University of Agriculture and Technology, Pantnagar, line departments (Animal husbandry,
Agriculture and Horticulture), Research Institutions like Vivekanand Parvatiya Krishi
Anusandhan Sansthan (VPKAS), Almora, Krishi Vigyan Kendras (KVKs) etc.

ILSP-WMD Annual Outcome Survey Report-2015
33 | P a g e
The project promoted important technologies like package and practices of important
crops, seed replacement, disease and insect management, organic cropping practices like
vermin composting, fodder promotion, mini seed kits, concentrate feed, cattle troughs, chaff
cutters, improved agricultural implements etc through them. On asking the questions
related to innovative linkages in the project area only 10 % beneficiary households reported
the presence of innovative project partners in the area. Similarly, 14 % of surveyed
households reported about technologies promoted through them. In case of non project
villages, 15 % of surveyed households reported the presence of innovative project partners
in the area and known to technologies promoted through them.
Key Findings
i. 10 % project households reported
about presence of innovative
project partners in their area.
ii. 14 % project households reported
about new technologies promoted
through innovative project
partners.
E. LESSONS LEARNT AND RECOMMENDATIONS:
As per the survey results of AOS-2015, the general socio-economic condition and
satisfaction level of project community has improved due to project intervention in the area
of food security, livelihoods improvement, agricultural production, access to market, access
to financial resources etc. The community is aware and united in PGs and working
collectively for their livelihoods improvement and village development. Livelihood portfolio
of project households has increased and they are adopting the yield increasing crops and
technologies to improve their livelihoods. The percentage of farmers cultivating land for
growing high value crops and for marketing purpose has improved. Collective cultivation of
cash crops mainly vegetables and its collective marketing is encouraging and should be
up-scaled in other areas.
Following learning/recommendations and thrust areas emerged out from the Annual
Outcome Survey, 2015 on which concrete action is planned in the AWPB 2016-17.
i. Backward and forward linkages development in all farm sector activities for
livelihood promotion of farmers to be strengthened.

ILSP-WMD Annual Outcome Survey Report-2015
34 | P a g e
ii. Increasing productivity of crops through capacity and skill development in areas
related to crop production technologies, improved and high yielding crop varieties,
appropriate timing of cultivation considering the climate change etc.
iii. Technical assistance and technology transfer in farm based and off-farm sectors
need to be strengthened through technical governmental institutions, non
governmental resource institutions, private service providers and CRPs.
iv. Agricultural Inputs for FSIP provided to PGs, now should be based on previous
production experience of PGs and as per their needs and interests to increase
area,production and diversification of different crops, so that more marketable surplus
can be generated through PG activities.
v. Some activities like irrigation tanks, irrigation guhls, fencing net etc are more
preferred by community and there is always a heavy demand for these type of
interventions. These activities should be linked with respective line agencies
through convergence.
vi. Planned interventions required for livestock promotion as an allied activity as dairy
has emerged as the most preferred livelihood activity specially among the women.
vii. Livelihood Collectives to be developed as the focal point of its intervention in the
project. These LCs will play an integral role in decision making, developing vision
for future activity, making purchases of inputs and marketing in their respective
clusters.
viii. Advocacy and fruitful linkage development with formal financial institutions through
UPASaC to be strengthened in project area.
ix. Capacity enhancement of PGs/VGs and LCs during the year in areas related to
institutional and business/enterprise development.
x. Development of specific value chain clusters for volume creation and effective
marketing using platform of LCs.
xi. Involvement of innovative partners and research institutions in the project to
upscale and value addition of project activities.
xii. Customized IEC material to be devised to cater the needs of the community.
xiii. Experience and knowledge sharing events and exposure tours of PGs should be
planned at divisional and state level.
xiv. Social audit of the watershed related works to be done annually through community
institutions involving PRI members.
The above recommendations and action points should be considered in the AWPB 2016-
17 involving PGs and LCs as major agents of change and development.
ILSP-WMD Annual Outcome Survey Report-2015
35 | P a g e
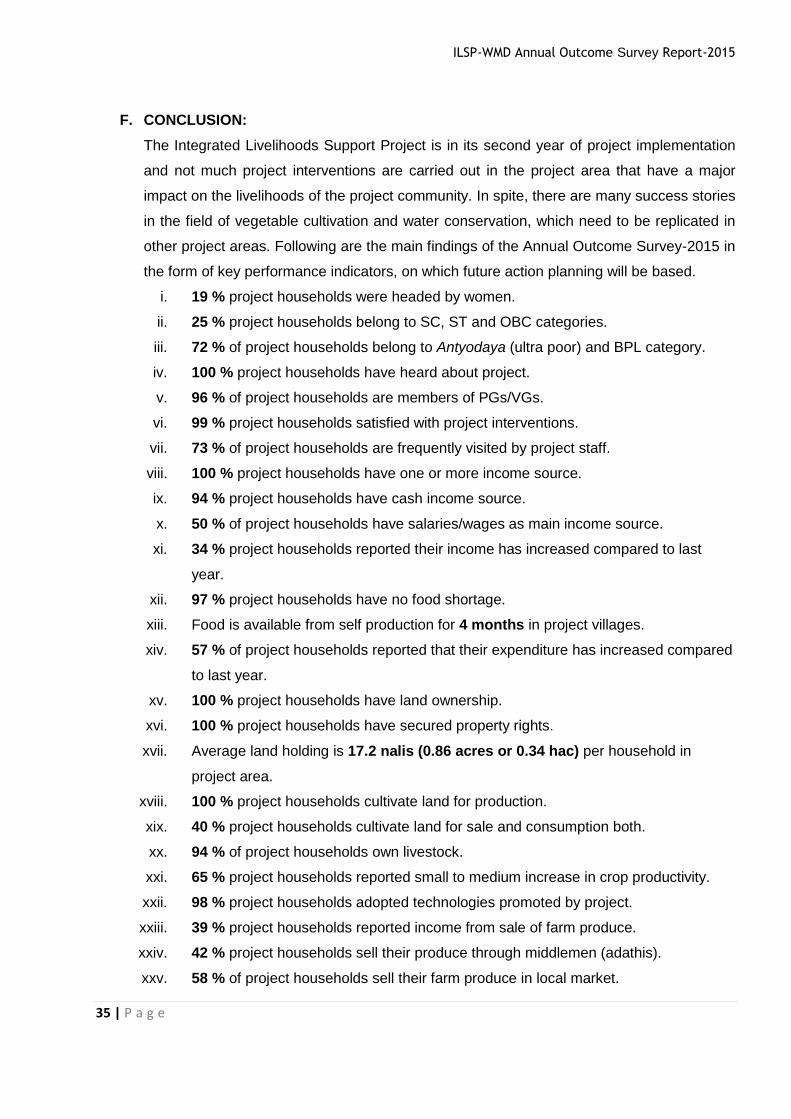
F. CONCLUSION:
The Integrated Livelihoods Support Project is in its second year of project implementation
and not much project interventions are carried out in the project area that have a major
impact on the livelihoods of the project community. In spite, there are many success stories
in the field of vegetable cultivation and water conservation, which need to be replicated in
other project areas. Following are the main findings of the Annual Outcome Survey-2015 in
the form of key performance indicators, on which future action planning will be based.
i. 19 % project households were headed by women.
ii. 25 % project households belong to SC, ST and OBC categories.
iii. 72 % of project households belong to Antyodaya (ultra poor) and BPL category.
iv. 100 % project households have heard about project.
v. 96 % of project households are members of PGs/VGs.
vi. 99 % project households satisfied with project interventions.
vii. 73 % of project households are frequently visited by project staff.
viii. 100 % project households have one or more income source.
ix. 94 % project households have cash income source.
x. 50 % of project households have salaries/wages as main income source.
xi. 34 % project households reported their income has increased compared to last
year.
xii. 97 % project households have no food shortage.
xiii. Food is available from self production for 4 months in project villages.
xiv. 57 % of project households reported that their expenditure has increased compared
to last year.
xv. 100 % project households have land ownership.
xvi. 100 % project households have secured property rights.
xvii. Average land holding is 17.2 nalis (0.86 acres or 0.34 hac) per household in
project area.
xviii. 100 % project households cultivate land for production.
xix. 40 % project households cultivate land for sale and consumption both.
xx. 94 % of project households own livestock.
xxi. 65 % project households reported small to medium increase in crop productivity.
xxii. 98 % project households adopted technologies promoted by project.
xxiii. 39 % project households reported income from sale of farm produce.
xxiv. 42 % project households sell their produce through middlemen (adathis).
xxv. 58 % of project households sell their farm produce in local market.

ILSP-WMD Annual Outcome Survey Report-2015
36 | P a g e
xxvi. 100 % of beneficiary households reported that the project made it easier to market
their farm produce for getting better price.
xxvii. 18 % project households accessed to credit in last one year.
xxviii. Credit was taken by both formal (51 %) and informal means (49 %).
xxix. Average credit availed was INR 53,483.
xxx. 21 % project households have fully repaid their credit in time.
xxxi. Loans were mainly taken for various investments (33 %) followed by income
generation activities (49%).
xxxii. 98% project households operate a saving bank account.
xxxiii. 12 % project households own a non farm enterprise.
xxxiv. 92 % project households reported about project helped in establishing their
enterprise.
xxxv. 35 % of enterprises are running by family members only.
xxxvi. 10 % project households reported about presence of innovative project partners in
their area.
xxxvii. 14 % project households reported about new technologies promoted through
innovative project partners.
To conclude, the positive project impacts are clearly reflected from the survey results in the
form of women empowerment and gender mainstreaming, improved income of project
beneficiaries, increased land use, increased crop productivity, increase in crop production
area, increase in size of irrigated area, increase in herd size and adoption of technologies,
increased income from sale of agricultural produce, improvement in physical access to
market etc. Still more efforts are needed to improve access to market and farm based
employment opportunities for achieving the desired goals and objectives of the project.
ILSP-WMD Annual Outcome Survey Report-2015
37 | P a g e
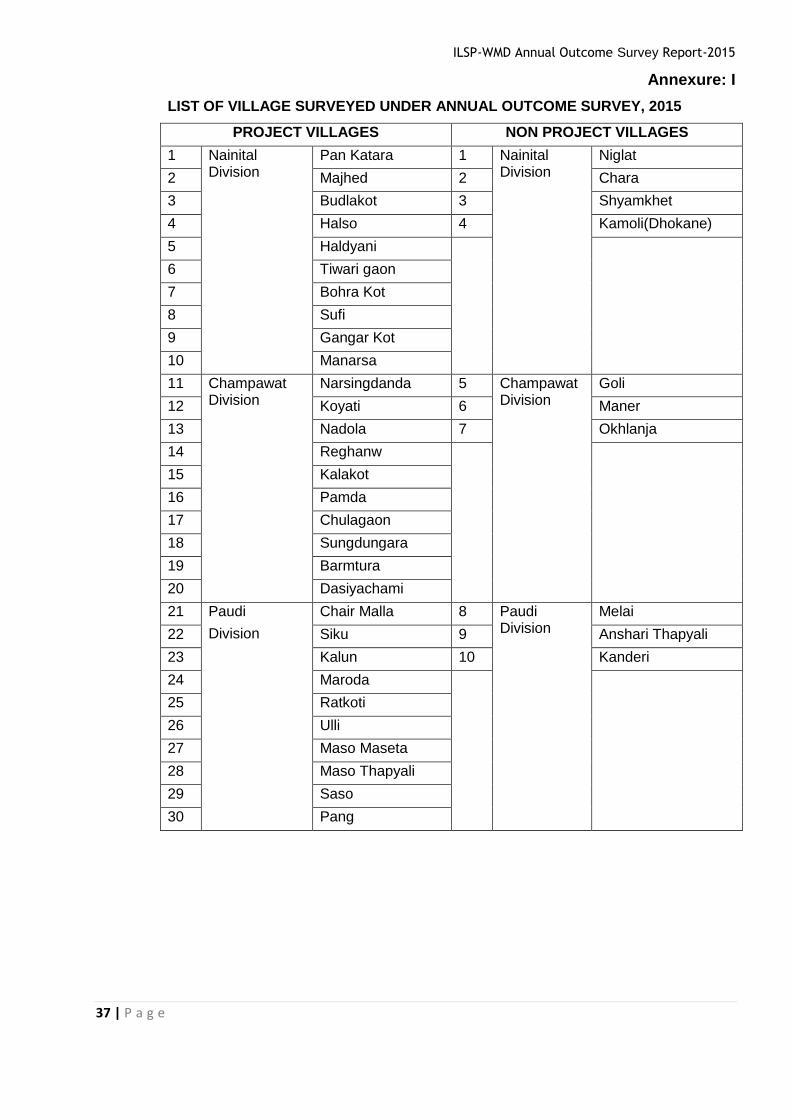
Annexure: I
LIST OF VILLAGE SURVEYED UNDER ANNUAL OUTCOME SURVEY, 2015
PROJECT VILLAGES NON PROJECT VILLAGES
1 Nainital Division
Pan Katara 1 Nainital Division
Niglat
2 Majhed 2 Chara
3 Budlakot 3 Shyamkhet
4 Halso 4 Kamoli(Dhokane)
5 Haldyani
6 Tiwari gaon
7 Bohra Kot
8 Sufi
9 Gangar Kot
10 Manarsa
11 Champawat Division
Narsingdanda 5 Champawat Division
Goli
12 Koyati 6 Maner
13 Nadola 7 Okhlanja
14 Reghanw
15 Kalakot
16 Pamda
17 Chulagaon
18 Sungdungara
19 Barmtura
20 Dasiyachami
21 Paudi
Division
Chair Malla 8 Paudi Division
Melai
22 Siku 9 Anshari Thapyali
23 Kalun 10 Kanderi
24 Maroda
25 Ratkoti
26 Ulli
27 Maso Maseta
28 Maso Thapyali
29 Saso
30 Pang

ILSP-WMD Annual Outcome Survey Report-2015
38 | P a g e
Annexure: II
ANNUAL OUTCOME SURVEY QUESTIONNAIRE 2015
ANNUAL OUTCOME SURVEY
[Integrated Livelihood Support Project, Uttarakhand (INDIA)]
I Date (D/D/M/M/Y/Y/Y/Y) : /___/___/___/___/___/___/___/___/
II Name of the enumerator: ___________________________________________________
Note for enumerator : Before starting the interview, introduce yourself, explain what are the objectives of the survey
and ask the person if he/she consents to respond to the questions. If not, go to the next household.
Circle codes corresponding to the answers in the right column.
Eksjk uke _________________ gSA ;g mRrjk[kaM ,dhÑr vkthfodk lg;ksx ifj;kstuk ds rgr vk/kkjHkwr losZ{k.k
gSA bl losZ{k.k ls çkIr vkadM+s o tkudkjh dk vkadyu fodkl ifj;kstukvksa ds csgrj fØ;kao;u esa enn djsxkA bl
vH;kl esa vkidh lgHkkfxrk dh ljkguk dh tk,xhA bl ç'ukoyh dks iw.kZ djus ds fy;s vke rkSj ij 30&45 feuV yxrs
gSaA gkykafd vkids fopkj egRoiw.kZ gSa vkSj ge vk'kk djrs gS fd vki iwjh rjg ls bl losZ{k.k eas Hkkx ysaxs] bl losZ{k.k esa
Hkkxhnkjh iwjh rjg ls LoSfNd gS vkSj vki fdlh Hkh ç'u ;k lHkh ç'uksa ds mRrj u nsuk pqu ldrs gSA eaS vkidks fo'okl
fnykrk gw¡ fd vkids }kjk nh xbZ tkudkjh xksiuh; j[kh tk,xhA bl ç'ukoyh esa vkids }kjk nh xbZ tkudkjh vuqla/kku
gsrq mi;ksx dh tk,xhA vkids }kjk nh xà çfrfØ;k dks lkewfgd v/;;u esa mi;ksx fd;k tk;sxk ftlls O;fDrxr
çfrfØ;kvksa dk vkadyu u fd;k tk ldsA
A – HOUSEHOLD IDENTIFICATION
A.1
izHkkx dk uke
Name of Division ______________________
A.2
fodkl [k.M dk uke
Development Block ______________________
ILSP/PSWMD
QUESTIONNAIRE ID: /___/___/___/

ILSP-WMD Annual Outcome Survey Report-2015
39 | P a g e
A.3
;wfuV dk uke
Name of Unit _____________________ A.4
xkzke iapk;r dk uke
Name of Gram Panchayat __________________
A.5
jktLo xk¡o dk uke
Name of Revenue Village_________________
A.6
okMZ la[;k
Ward No- _________________
A.7
mRrjnkrk dk uke
Name Of Respondent ___________________ A.8
mRrjnkrk dk eksckby uEcj
Mobile No.of Respondent _________________
A.9 D;k vki mRiknd lewg@fucZy oxZ mRiknd lewg ds
lnL; gSa\Are You a Member Of PG/VPG? Yes/No A.10
mRiknd lewg@fucZy oxZ mRiknd lewg dk uke
Name of PG/VPG___________________
A.10
mRrjnkrk dk fyax
Sex of Respondent--- A – Male Ikq#’k
B - Female efgyk
A-11
ifjokj ds eqf[k;k dk uke
Name of the head of household : ______________
A.12
ifjokj ds eqf[k;k dk fyax
What is the gender (sex) of the household head?
A – Ikq#’k Male
B - efgyk - Female
A.13
ifjokj dh tkfr
What is the category of household?
A. SC vuqlwfpr tkfr
B. ST vuqlwfpr tu tkfr
C. OBC vU; fiNM+k oxZ
D. General lkekU;
A.14
—i;k Li"V djas fd D;k vkidk ifjokj ch ih ,y@, ih ,y ds varxZr vkrk gS\
In terms of poverty category of Govt., in which of the following categories
would your household belongs?
A. Antyodaya vUrksn;
B. BPL ch0ih0,y0
C. APL,0ih0,y0
A.15
D;k vkids ikl ch ih ,y@ vUrksn; dkMZ gS\
Do you have BPL/Antodaya Card? A- Yes gkW
B - No ugh
A.16
dkMZ uEcj
Ration Card No. _______________________
ILSP-WMD Annual Outcome Survey Report-2015
40 | P a g e
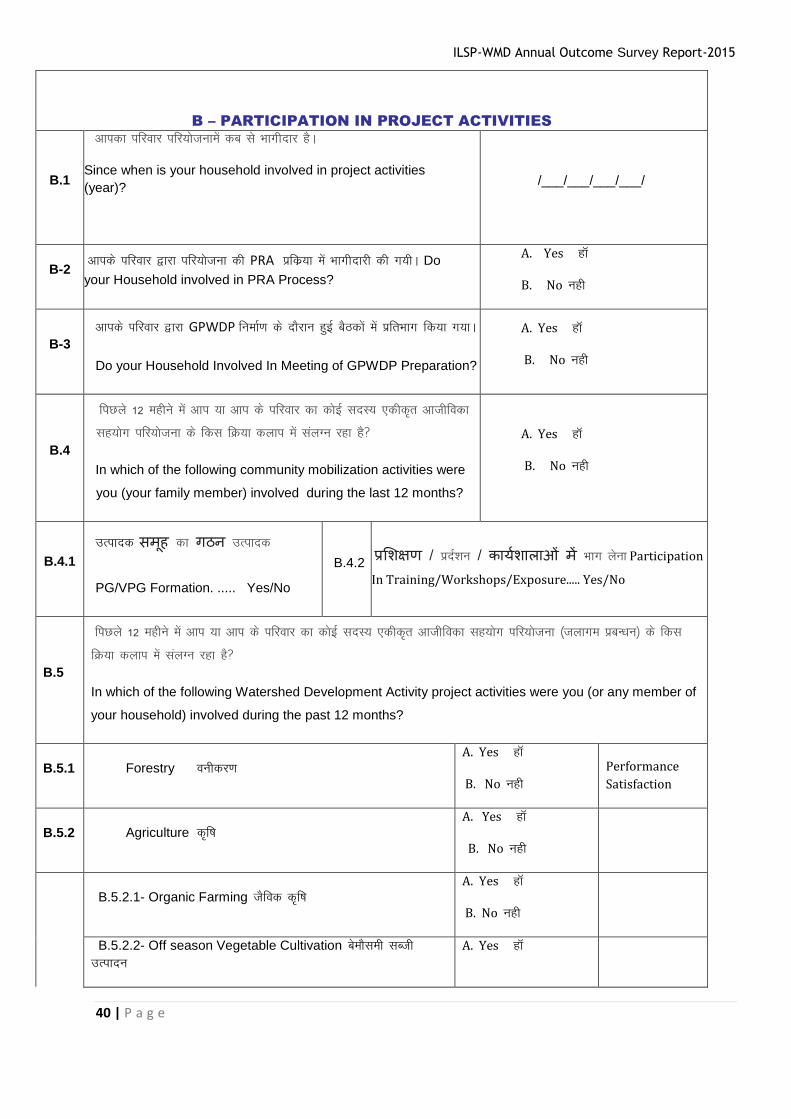
B – PARTICIPATION IN PROJECT ACTIVITIES
B.1
vkidk ifjokj ifj;kstukesa dc ls Hkkxhnkj gSA
Since when is your household involved in project activities
(year)?
/___/___/___/___/
B-2 vkids ifjokj }kjk ifj;kstuk dh PRA izfdz;k esa Hkkxhnkjh dh x;hA Do
your Household involved in PRA Process?
A. Yes gkW
B. No ugh
B-3
vkids ifjokj }kjk GPWDP fuekZ.k ds nkSjku gqbZ cSBdksa esa izfrHkkx fd;k x;kA
Do your Household Involved In Meeting of GPWDP Preparation?
A. Yes gkW
B. No ugh
B.4
fiNys 12 eghus esa vki ;k vki ds ifjokj dk dksbZ lnL; ,dhdr vkthfodk
lg;ksx ifj;kstuk ds fdl fØ;k dyki esa layXu jgk gS\
In which of the following community mobilization activities were
you (your family member) involved during the last 12 months?
A. Yes gkW
B. No ugh
B.4.1
mRiknd समह dk गठन mRiknd
PG/VPG Formation. ..... Yes/No
B.4.2 परशिकषण / iznZ'ku / कारयिालाओ म Hkkx ysuk Participation
In Training/Workshops/Exposure..... Yes/No
B.5
fiNys 12 eghus esa vki ;k vki ds ifjokj dk dksbZ lnL; ,dhdr vkthfodk lg;ksx ifj;kstuk ¼tykxe izcU/ku½ ds fdl
fØ;k dyki esa layXu jgk gS\
In which of the following Watershed Development Activity project activities were you (or any member of
your household) involved during the past 12 months?
B.5.1 Forestry ouhdj.k
A. Yes gkW
B. No ugh
Performance
Satisfaction
B.5.2 Agriculture df"k
A. Yes gkW
B. No ugh
B.5.2.1- Organic Farming tSfod df"k
A. Yes gkW
B. No ugh
B.5.2.2- Off season Vegetable Cultivation csekSleh lCth
mRiknu
A. Yes gkW

ILSP-WMD Annual Outcome Survey Report-2015
41 | P a g e
B. No ugh
B.5.2.3- ijEijkxr Qlyksa elkyksa o vkS"k/kh; Qlyksa dh [ksrh
Cultivation of Traditional Crops/Spices/Medicinal Crops
A. Yes gkW
B. No ugh
B.5.3 i'kqikyu Animal Husbandry/Livestock
A. Yes gkW
B. No ugh
B.5.3.1 – Ms;jh Dairy
A. Yes gkW
B. No ugh
B.5.3.2- eqxhZ ikyu Poultry
A. Yes gkW
B. No ugh
B.5.3.3 – cdjh ikyu Goatry
A. Yes gkW
B. No ugh
B.5.3.4 – vU; ¼fufnZ"V djsa½ Others (Specify)..... A. Yes gkW
B. No ugh
B.5.4 m|kuhdj.k Horticulture
A. Yes gkW
B. No ugh
B.5.5 y?kq flapkbZ @ ty laj{k.k Minor Irrigation / Water Harvesting
A. Yes gkW
B. No ugh
B.5.6 unh ukyk laj{k.k Drainage line Treatment
A. Yes gkW
B. No ugh
B.5.7 xzkeh.k lM+d lq/kkj Rural Road Access
A. Yes gkW
B. No ugh
B.5.8 mtkZ laj{k.k Energy Conservation A. Yes gkW
B. No ugh
*Codes: Highly Satisfactorycgqr larq"V = 6, Satisfactorylarq"V =5, Moderately satisfactory Bhd Bkd larq"V = 4, Moderately
unsatisfactory Bhd Bkd vlarq"V = 3, Unsatisfactory vlarq"V = 2, HighlyUnsatisfactory cgqrvlarq"V = 1
B.6
lkekU; :i ls bu fØ;k dykiksa esa vki dh lafyIrrk ls vki ds thou
Lrj ij D;k izHkko iM+k gS\
In general regarding how your participation in Project
Activities has impacted your living condition
A. बहत सतषट Very satisfied
B. dqN gn rd सतषट Moderately
satisfied
C. fcYdqy lUrq’V ugha Not satisfied at all
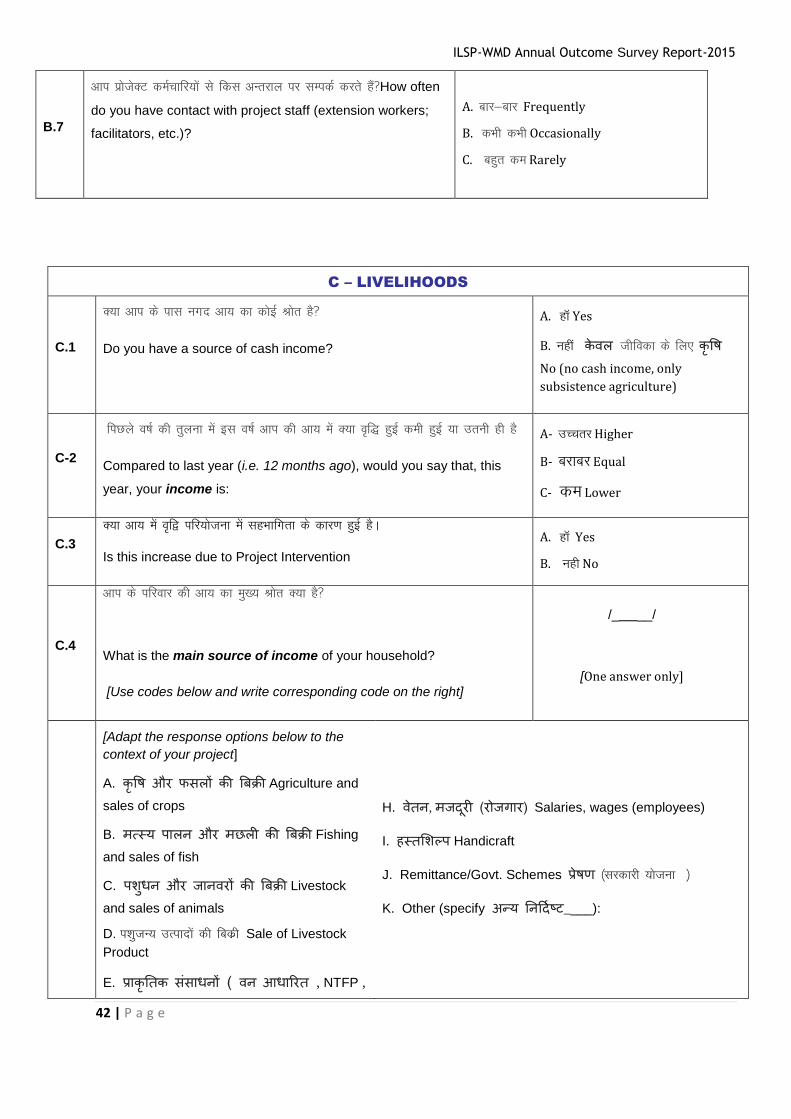
ILSP-WMD Annual Outcome Survey Report-2015
42 | P a g e
B.7
vki izkstsDV deZpkfj;ksa ls fdl vUrjky ij lEidZ djrs gSa\How often
do you have contact with project staff (extension workers;
facilitators, etc.)?
A. ckj&ckj Frequently
B. dHkh dHkh Occasionally
C. cgqr de Rarely
C – LIVELIHOODS
C.1
D;k vki ds ikl uxn vk; dk dksbZ Jksr gS\
Do you have a source of cash income?
A. gkW Yes
B. ugha कवल thfodk ds fy, कषि
No (no cash income, only
subsistence agriculture)
C-2
fiNys o’kZ dh rqyuk esa bl o’kZ vki dh vk; esa D;k of) gqbZ deh gqbZ ;k mruh gh gS
Compared to last year (i.e. 12 months ago), would you say that, this
year, your income is:
A- mPprj Higher
B- cjkcj Equal
C- de Lower
C.3
D;k vk; esa o`f} ifj;kstuk esa lgHkkfxrk ds dkj.k gqbZ gSA
Is this increase due to Project Intervention
A. gkW Yes
B. ugh No
C.4
vki ds ifjokj dh vk; dk eq[; Jksr D;k gS\
What is the main source of income of your household?
[Use codes below and write corresponding code on the right]
/_ __/
[One answer only]
[Adapt the response options below to the
context of your project]
A. कषि और फसलो की बबकरी Agriculture and
sales of crops
B. मतसर पालन और मछली की बबकरी Fishing
and sales of fish
C. पिधन और जानवरो की बबकरी Livestock
and sales of animals
D. i'kqtU; mRiknksa dh fcdzh Sale of Livestock
Product
E. पराकततक ससाधनो ( वन आधाररत , NTFP ,
H. वतन, मजदरी (रोजगार) Salaries, wages (employees)
I. हतशिलप Handicraft
J. Remittance/Govt. Schemes परिण ¼ljdkjh ;kstuk ½
K. Other (specify अनर तनरदयषट____):

ILSP-WMD Annual Outcome Survey Report-2015
43 | P a g e
लकडी क वरापार आरद)Natural resources
F. फटकर वरापार Petty trading
G. अकिल शरम Unskilled labour
C.5 fdl Jksr ls lc ls vf/kd vk; gksrh gS\
Which one of the above activity impacted your livelihood most? Use Code A to k
C.6 vki ds ifjokj esa 18 o"kZ vkSj vf/kd efgykvksa }kjk vkfFkZd fØ;k dykiksa ij
fdruk le; [kpZ gksrk gS In your family, how much time is spent by
women in economic activities?
/___/___/ hours/day
C.7 vkids ifjokj dk vkSlj [kpZ fdruk gS What is the Average Expenditure of
Household?
A. 2000 ls de Less than 2000
B. 2000 ls 5000 ds e/;
Between 2000-5000
C. 5000 ls vf/kd More than 5000
C.8
fiNys o’kZ dh rqyuk esa bl o’kZ vkids [kpZ dh fLFkfr dSlh gS
Compared to last year (i.e. 12 months ago), would you say that, this
year, your Expenditure is:
A- mPprj Higher
B- cjkcj Equal
C- de Lower
D – FOOD SECURITY
D.1
D;k fiNys 12 eghuksa esa dHkh ,slk le; vk;k gS tc vki vius ifjokj dks 3 le; Hkkstu
ugha ns ik;s\ Over the last 12 months, was there any period(s) during which
you were not able to provide 3 meals per day for your household (food
shortage period)?
A. Yes gk¡
B. No ugh
D.2 ;fn i;kZIr ek=k miyC/k ugha gS] deh dh vof/k Li"V djsa¼ekg@o’kZ½ If Enough quantity
is not available, Specify the period of shortage over 12 months?
D-3 fiNys o’kZ dh rqyuk esa dksbZ lq/kkj gS\ Was there any improvement as compared
to last year?
A. dqN csgrj Some improvement
B. igys tSlk Same
C. fLFkfr [kjkc gSa Situation is
worse

ILSP-WMD Annual Outcome Survey Report-2015
44 | P a g e
D-4 D;k ;s lq/kkj ifj;kstuk ds gLr{ksi ds dkj.k gS\ Was this improvement was due to
project interventions?
A. Yes gk¡
B. No ugh
D.5 o’kZ esa vkids ?kjsyw mRikn ls fdrus eghus Hkkstu miyC/k gks ikrk gS\In a year, for how
many months food available from their own production?
/___/___/ (write 00 if less than
one month)
E – LAND TENURE
E.1
D;k vkids ifjokj ds ikl Lo;a vFkok cVkbZ dh —f"k Hkwfe gS\ Does your household
own Agriculture Land/has leased land?
A. Lo;a dh Hkwfe Own land
B. yht dh Hkwfe Leased in
c- nkSuksa Both
E.1.1- What is the size of your land (in nails/acres)? /_ __/__ _/ nails/acres
E.2
D;k tehu ds efydkuk vf/kdkj vki ds ikl gS\ Do you have ownership rights
on a land? A. Yes gk¡ B. No ugh
E3
vki dk viuh lEifRr ij vf/kdkj fdruk lqjf{kr gS\ How secure do you consider
your property rights?
A. cgqr lqjf{kr Very secure
B. lk/kj.kr;k lqjf{kr Moderately
secure
C. vlqjf{kr Insecure
D. cgqr vlqjf{kr Very insecure
F - AGRICULTURAL PRODUCTION AND IRRIGATION
F.1 D;k vki [ksrh djrs gSa\? Do you cultivate land, and if so, for what
purpose?
A. viuh tehu____ Yes, own
consumption only
B. iV~Vs ij fy;k_________Yes, sales
only
C. Yes, consumption and sale
D. No
F-2 vkids ikl dqy fdruh Hkwfe gSa ? How much land do you have in total?
20 ukyh ls de Less than 20 nali
20 & 50 ukyh 20-50 nali
50 ukyh ls vf/kd More than 50
nali

ILSP-WMD Annual Outcome Survey Report-2015
45 | P a g e
F-3 vki dqy miyC/k Hkwfe esa ls fdruh % Hkwfe ij [ksrh djrs gSA What percent of
land do you cultivate?
10 izfr’kr ls de Less than 10%
10 ls 20 izfr’kr 10% to 20%
20 izfr’kr ls vf/kd More than 20%
F-4
miyC/k Hkwfe ds fdrus % esa ifjokj }kjk mPp ewY; okyh Qlyksa dh [ksrh dh x;h \
How much % of land do you manage to cultivate high value crops?
[provide definition of high value crop]
10 izfr’kr ls de Less than 10%
10 ls 20 izfr’kr 10% to 20%
20 izfr’kr ls vf/kd More than 20%
F-5
fiNys lky dh rqyuk esa bl lky Qlyksa ds mRiknu esa o`f} gqbZ gS \ Compared
to last year (i.e. 12 months ago), did the productivity of your crops
increase this year?
A. Yes gk¡ B. No ugha
F-6 bl o`f) dks vki dSls vk¡drs gSa\ How would you quantify this
increase?
A. छोट (<10%) Small (< 10%)
B. मधरम(10-20%)Medium (10-20%)
C. बड (>20%)Large (>20%)
F.7
D;k d`f"k vk/kkfjr rduhdksa ij ifj;kstuk ds lgk;ksx ls vki lUrq"V gSA
During the past 12 months, Are you satisfied with agricultural
technique promoted by the project?
A. Yes gk¡ B. No ugha
F-8 fiNys lky dh rqyuk esa bl lky Qlyksa ds cqvkbZ dh fLFkfr Compare to last
year ,what is the area of crop grown?
A. Increase mPprj
B- Remains same cjkcj
C. Decrease derj
F.9 fiNys lky dh rqyuk esa bl lky Qlyksa ds iSnkokj dh fLFfr Compare to last
year ,did the area of Yeild?
A. Increase mPprj
B- Remains same cjkcj
C. Decrease derj
F.10 Compare to last year ,did the Sales of crop ? fiNys lky dh rqyuk esa
Qlyksa dh fcdz; dh fLFfr
A. Increase mPprj
B- Remains same cjkcj
C. Decrease derj

ILSP-WMD Annual Outcome Survey Report-2015
46 | P a g e
Ukkyh esa
In Nali
fiNys ekg es
cnyko
Change in
last months
fiNys 12 ekg es cnyko
Change in last 12
months
ewY ; :0 esa
Value(in Rs)
fiNys 12 ekg
es cnyko
Change in
Last 12
months
1
ijEiikxr Qlys vukt
Traditional
Crops/Cereals
2
elkysSpices
3 vkyw Potato
4 lfCt;ka Vegetables
5 vU; Qly Other
Crops
6- All Crops and Overall Change
Code: 1=Increase from last 12 months fiNys 12 eghuksa ls c<+k
2=No change from last year fiNys 12 eghuksa esa dksbZ ifjoZru ugha
3=Decreased from last year fiNys lky ls de
F.11
fuEufyf[kr esa ls dkSu lh fodflr@mUur —f"krduhdksa dk ç;ksx vkids ifjokj
}kjk fd;k tkrk gS\Which of the following improved agriculture
techniques does your household use ?
gk¡ &1]ughaa &2]irk ugha / dg ugha ldrs
&3Yes-1,No-2,Dont Know-3
[Two answers maximum]
[Adapt the response options below to the context of your project]
A. mUur Qly iztkfr dk iz;ksx Use of Improved crop variety
B. mUur chtksa dk mi;ksx Use of Improved Seeds
C. tSfod moZjd dk mi;ksx ¼dEiksLV@[kknbR;kfn½Use of Organic Fertilizers
D. tSfod dhV&uk’kd] bR;kfn Use of Organic Pesticides
E. dSehdy moZjd dk mi;ksx Use of Chemical
fertilizers(minerals,chemicals)
F. df"k esa mi;ksx gkssus okys midj.k Use of improved farm techniques
G. ubZ mRiknu rduhd dk iz;ksx Use of new production techniques
H feV~Vh dVko fu;a=.k.Erosion control
1 2 3
1 2 3
1 2 3
1 2 3
1 2 3
1 2 3
1 2 3

ILSP-WMD Annual Outcome Survey Report-2015
47 | P a g e
I. Qly i)fr Cropping Techniques
J. lw{e {ks= flapkbZ Small area irrigation
K. enk ueh laj{k.k rduhd ¼eyfpax] 'ksM usV½
Soil moisture retaining techniques
L. mUur jksi.kh rduhd Improved nursery techniques
1 2 3
1 2 3
1 2 3
1 2 3
1 2 3
F.10 D;k vki flapkbZ iz.kkyh dk mi;ksx dj jgs gS\ Do you use irrigation
system(s)? A. Yes gk¡ B. No ughaa
F.10.1
D;k vki us fiNys lky dh rqyuk esaa bl lky vkius flafpar {ks= c<+kus dk izcU/ku
fd;k Fkk\ Did you manage to increase your irrigated area this year
compared to last year (i.e. 12 months ago)?
A. Yes gk¡ B. No ughaa
F.10.2 vkidk flapkbZ dk {ks= fdruk c<+k gSa\ How would you quantify this increase?
A. 10 izfr’kr ls de Small (< 10%)
B. 10 ls 20 izfr’kr Medium (10-20%)
C. 20 izfr’kr ls vf/kd Large (>20%)
F.10.3 D;k ;s c<+ksRrjh fdlh izkstsDV ds dkj.k gq;s Fks\ Is this increase related to any
project activity? A. Yes gk¡ B. No ughaa
F.10.4 D;k vki ifj;kstuk ds flapkbZ iz.kkyh lEcfU/kr dk;Z ls lUrq"V gSA Are You
satisfied with project irrigation system? A. Yes gk¡ B. No ughaa
F.11
D;k ifj;kstuk gLr{ksi ls df"k i)fr @rjhds esa dksbZ ifjoZru gqvk gS tSls& lkewfgd
[ksrh] dyLVj [ksrh Is there any change in Agriculture practices due to
project intervention-i.e.-Ex group farming,cluster farmings
A. Yes gk¡ B. No ughaa
G - Livestock
G.1 D;k vkids ifjokj ds ikl i'kq/ku gS\ Does your household own livestock? A. Yes gk¡ B. No ughaa
G.2 fiNys lky dh rqyuk esa bl o’kZ eosfl;ksa dh la[;k dh fLFkfr dSlh gSa Compare to last
year ,what is the number status the Animals?
A. Increase mPprj
B- Remains same Ckjkcj
C. Decrease derj
G.3 fiNys lky dh rqyuk esa bl o’kZ eosfl;ksa dh fodzh dh fLFkfr dSlh gSa Compare to last A. Increase mPprj

ILSP-WMD Annual Outcome Survey Report-2015
48 | P a g e
year , what is the Sales status of Animals? B- Remains same Ckjkcj
C. Decrease derj
For the type of livestock, how many do own and what is the value of sales
i'kq/ku ds izdkj vkids ikl fdrus gS vkSj mudk fczdh ewY; D;k gSa
Types of animals i'kq ds
izdkj
Total number owned for each type
izR;sd izdkj ds LokfeRo okyh dqy la[;k
Total sales in last 12 months
fiNys 12 efguksa esa dqy fodz;
Numbers *la[;k
fiNys 12 efguksa dksbZ ifjorZu
Change in last 12
months
ewY; :i; esa
Value(in Rs)
fiNys 12 efguksa dksbZ
ifjorZu
Change in last 12
months
1 ns”kh eos'kh Local Cattle
2
chM@mUur fdLe ds eos”kh
Cross Breed/ Improved
Breed of cattle
3 HkSl Buffalo
4 HksM Sheep
5 cdjh Goats
6 eqxhZ ikyu Poultry
7 vU; eos”kh Other animals
8 lHkh dks feyk dj fodz; ewY; crk;s Total value of all sales and overall
change
* enter "0" if the category of crops is not grown, or if no sales are made.
1=Increase from last 12 months fiNys 12 efgus esa c<+ksRrjh
2=No change from last year fiNys 12 efgus esa dksbZ cnyko ugha
3=Decreased from last year fiNys lky esa deh
G-4 fiNys 12 efgus esa c<+ksRrjh
Over the last 12 months, did you adopt any new livestock production A-Yes gk¡ B-No ughaa

ILSP-WMD Annual Outcome Survey Report-2015
49 | P a g e
technology promoted by the project?
G-5 ;fn gka rks fuEu esa ls dkSu lh i)fr viukbZ \ If Yes, Which of the following
were promoted? Yes-1, gk¡ No-2 ughaa
A bl rjg ds Vhdkdj.k vkSj LoPN :i esa csgrj LokLFk; ns[kHkky Improved health
care such as Vaccination and De-worming 1 2
B Hkj.k ds ek/;e ls Feeding Trough 1 2
C pkjk Qlys Fodder Crops 1 2
D ikSf"Vd vkgkj }kjk Use of Concrete feeds 1 2
E i'kq/ku vkokl esa lq/kkj Improved livestock housing 1 2
F mUur eqxhZ ikyu Improved poultry 1 2
G ukWn] LVkWy QhfMax Manger 1 2
H i'kq pjh Animal chari 1 2
I vU; (Specify Li"V djsa Others(specify) 1 2
H – ACCESS TO MARKETS
H.1 vki df’k mRiknu ;k xSj df’k mRiknksa dh fczdh ls vk; izkIr djrs gS\ Do you get an
income from sales of agricultural production/ Non farm products?
A. Yes gk¡ B. No ugha (->go to
G.2)
H.2
vki viuk mRiknu dgka csprs gS\
¼,d ls vf/kd mRrj ½ where do you market your product?(Multiple
Response)
A. ?kj ;k [ksr ls
Farm gate/from home
B. LFkkuh; xkao esa At local Village
C. Cykd eq[;ky; ij At block

ILSP-WMD Annual Outcome Survey Report-2015
50 | P a g e
D. ftys eq[;ky; ij At District
headquarter
H.3
fdldks viuk mRikn csprs gS\
To whom do you sell your product
A- vfrae miHkksxrk Final consumer
B- LFkkuh; ,stsV vkSj xkaao Lrj ij
laxzgdrkZ Local Agents and village
level collectors
C- Fkksd fodzsrk ;k O;kikjh
Wholesalers or traders
D- lgdkjhrk ;k fuekZrk laxBuksa
Cooperatives/producer
organization
E- df"k O;kikj QeZ@izkslslj
Agribusiness
concerns/processers
F- ljdkjh laLFkk Govt. Agencies
H.4
Is there an nw/k laxzg lfgr izlaLdj.k]HkaMkj.k] laxzg]foi.ku ds fy, dksbZ lkewfgd lqfo/kk dsUnz gS\ Is
there any common facility center (processing, storage, collection,
marketing, including milk collection) in your area?
A. Yes gka B. No ugha
H.5 ;fn gka] rks D;k vki vU; dqN mRikn lkewfgd lqfo/kk dsUnz ij csprs gS\If yes, do you
sell some of your production via common facility center?
A. Yes gka B. No ugha
H.6
D;k vkbZ ,y ,l ih ds }kjk mRikn cspus esa vklkuh gqbZ gS ;k vPNh dher feyus yxh gS\
Has ILSP made it easier to market your product or resulted getting
better price?
A. Yes gka B. No ugha
The following sections (I and J) are optional: they should be included in the questionnaire only if the
project is involved in activities related to the particular topic. For example, if the project has a natural
resources management component, include the section on NRM (section J). Remove the sections that
are not relevant to the project

ILSP-WMD Annual Outcome Survey Report-2015
51 | P a g e
I – FINANCIAL SERVICES
I.1
D;k fiNys 12 efgus esa vkius dtZ fy;k gS\ Did you (or any household
member) borrow money over the last 12 months? A. Yes gka B. No ughaa (-> go to
H.2)
I.2
dgka ls dtZ fy;k gS\ ¼,d ls vf/kd mRrj ½ What was the source of credit? ?
(Multiple response)
A. Formal (bank/micro-finance
institution)
B. Informal (friends, NGOs,
Cooperatives/credit group
I.3
How much did you borrow (total last 12 months)?
[Write the amount in the local currency]
/___/___/___/___/___/___/___/
[Currency]: _______________
I.4 D;k _.k okil fd;k x;k\ Has the laon been repaid?
A. Yes gk¡
B. Not yet, but soon rd ugha fdUrq
tYnh dj nsaxs
C. No, cannot repay ugha Hkqxrku ugha
dj ldrs
I.5 vkius /ku dk mi;ksx dgka fd;k ;k djsxsaas s ¼,d ls vf/kd mRrj ½
What did you - or will you - use the money for?
[One answer: only the main use should be reported]
A. खपत ( भोजन, कपड, आरद समारोहो) Consumption (food,
clothes, ceremonies, etc.)
B. आर सजन गततषवधधरो (उपकरण , उपकरणो आरद )Income
generating activities (tools;
equipment, etc.)
C. तनवि (घर म सधार, भशम अधधगरहण आरद) Other
investments (housing
improvement, land acquisition;
etc.)
D. शिकषा Education
E. वार Health
F. अनर Others
I.6
dqy feykdj] D;k fiNys lky dh rqyuk esa vki ds ifjokj ds fy, csgrj igqap vc
foRrh; lsokvksa rd gS\ Overall, do you consider that, your HH has now
better access to financial services compared to last year ?
A. Yes gk¡ B. No ugha
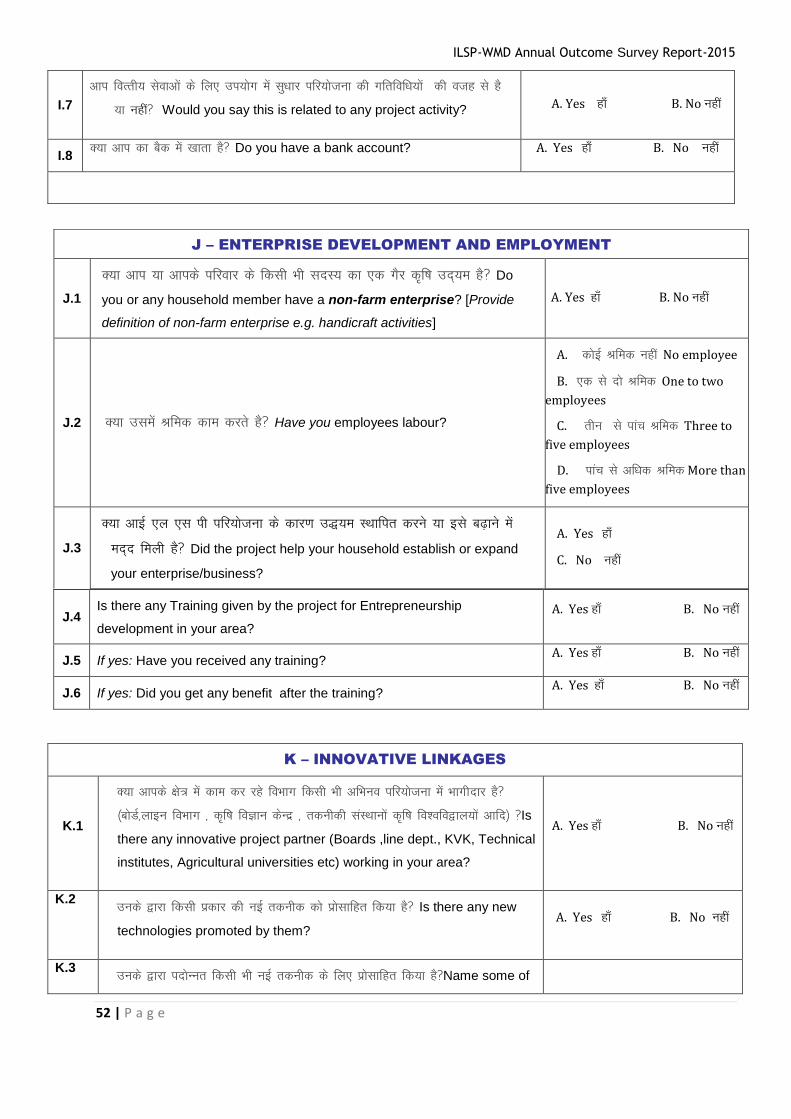
ILSP-WMD Annual Outcome Survey Report-2015
52 | P a g e
I.7
vki foRrh; lsokvksa ds fy, mi;ksx esa lq/kkj ifj;kstuk dh xfrfof/k;ksa dh otg ls gS
;k ugha\ Would you say this is related to any project activity? A. Yes gk¡ B. No ugha
I.8 D;k vki dk cSd esa [kkrk gS\ Do you have a bank account? A. Yes gk¡ B. No ugha
J.4 Is there any Training given by the project for Entrepreneurship
development in your area?
A. Yes gk¡ B. No ugha
J.5 If yes: Have you received any training? A. Yes gk¡ B. No ugha
J.6 If yes: Did you get any benefit after the training? A. Yes gk¡ B. No ugha
K – INNOVATIVE LINKAGES
K.1
D;k vkids {ks= esa dke dj jgs foHkkx fdlh Hkh vfHkuo ifj;kstuk esa Hkkxhnkj gS\
¼cksMZ]ykbu foHkkx ] df"k foKku dsUnz ] rduhdh laLFkkuksa df"k fo'ofo}ky;ksa vkfn½ \Is
there any innovative project partner (Boards ,line dept., KVK, Technical
institutes, Agricultural universities etc) working in your area?
A. Yes gk¡ B. No ugha
K.2 muds }kjk fdlh izdkj dh ubZ rduhd dks izkslkfgr fd;k gS\ Is there any new
technologies promoted by them? A. Yes gk¡ B. No ugha
K.3 muds }kjk inksUur fdlh Hkh ubZ rduhd ds fy, izkslkfgr fd;k gS\Name some of
J – ENTERPRISE DEVELOPMENT AND EMPLOYMENT
J.1
D;k vki ;k vkids ifjokj ds fdlh Hkh lnL; dk ,d xSj df’k mn~;e gS\ Do
you or any household member have a non-farm enterprise? [Provide
definition of non-farm enterprise e.g. handicraft activities]
A. Yes gk¡ B. No ugha
J.2 D;k mlesa Jfed dke djrs gS\ Have you employees labour?
A. dksbZ Jfed ugha No employee
B. ,d ls nks Jfed One to two
employees
C. rhu ls ikap Jfed Three to
five employees
D. ikap ls vf/kd Jfed More than
five employees
J.3
D;k vkbZ ,y ,l ih ifj;kstuk ds dkj.k m);e LFkkfir djus ;k bls c<+kus esa
en~n feyh gS\ Did the project help your household establish or expand
your enterprise/business?
A. Yes gk¡
C. No ugha
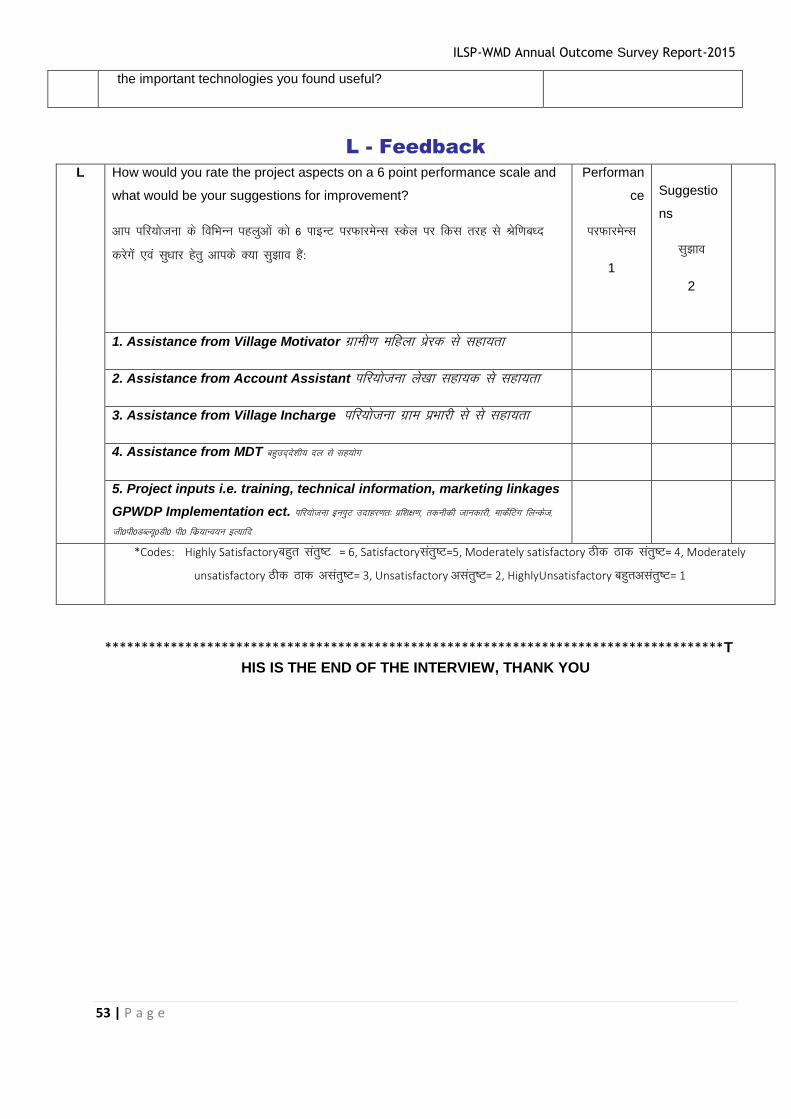
ILSP-WMD Annual Outcome Survey Report-2015
53 | P a g e
the important technologies you found useful?
L - Feedback
L How would you rate the project aspects on a 6 point performance scale and
what would be your suggestions for improvement?
vki ifj;kstuk ds fofHkUu igyqvksa dks 6 IkkbUV ijQkjesUl Ldsy ij fdl rjg ls Jsf.kc/n
djsxsa ,oa lq/kkj gsrq vkids D;k lq>ko gS a:
Performan
ce
ijQkjesUl
1
Suggestio
ns
lq>ko
2
1. Assistance from Village Motivator xzkeh.k efgyk izsjd ls lgk;rk
2. Assistance from Account Assistant ifj;kstuk ys[kk lgk;d ls lgk;rk
3. Assistance from Village Incharge ifj;kstuk xzke izHkkjh ls ls lgk;rk
4. Assistance from MDT cgqmn~ns'kh; ny ls lg;ksx
5. Project inputs i.e. training, technical information, marketing linkages
GPWDP Implementation ect. ifj;kstuk buiqV mnkgj.kr% izf'k{k.k] rduhdh tkudkjh] ekdsZfVax fyUdst]
th0ih0MCY;w0Mh0 ih0 fdz;kUo;u bR;kfn
*Codes: Highly Satisfactorycgqr larq"V = 6, Satisfactorylarq"V=5, Moderately satisfactory Bhd Bkd larq"V= 4, Moderately
unsatisfactory Bhd Bkd vlarq"V= 3, Unsatisfactory vlarq"V= 2, HighlyUnsatisfactory cgqrvlarq"V= 1
*************************************************************************************T
HIS IS THE END OF THE INTERVIEW, THANK YOU
ILSP-WMD Annual Outcome Survey Report-2015
54 | P a g e
QUESTIONNAIRE B
FOR NON BENEFICIARIES
ANNUAL OUTCOME SURVEY
[Integrated Livelihood Support Project, Uttarakhand (INDIA)]
I Date (D/D/M/M/Y/Y/Y/Y) : /___/___/___/___/___/___/___/___/
II Name of the enumerator: ___________________________________________________
This questionnaire is the same as questionnaire A except that it does not contain the questions related to project
activities. The numbering should not be changed, so that same questions have the same number in both
questionnaires
.
Eksjk uke _________________ gSA ;g mRrjk[kaM ,dhÑr vkthfodk lg;ksx ifj;kstuk ds rgr vk/kkjHkwr losZ{k.k
gSA bl losZ{k.k ls çkIr vkadM+s o tkudkjh dk vkadyu fodkl ifj;kstukvksa ds csgrj fØ;kao;u esa enn djsxkA bl
vH;kl esa vkidh lgHkkfxrk dh ljkguk dh tk,xhA bl ç'ukoyh dks iw.kZ djus ds fy;s vke rkSj ij 30&45 feuV yxrs
gSaA gkykafd vkids fopkj egRoiw.kZ gSa vkSj ge vk'kk djrs gS fd vki iwjh rjg ls bl losZ{k.k eas Hkkx ysaxs] bl losZ{k.k esa
Hkkxhnkjh iwjh rjg ls LoSfNd gS vkSj vki fdlh Hkh ç'u ;k lHkh ç'uksa ds mRrj u nsuk pqu ldrs gSA eaS vkidks fo'okl
fnykrk gw¡ fd vkids }kjk nh xbZ tkudkjh xksiuh; j[kh tk,xhA bl ç'ukoyh esa vkids }kjk nh xbZ tkudkjh vuqla/kku
gsrq mi;ksx dh tk,xhA vkids }kjk nh xà çfrfØ;k dks lkewfgd v/;;u esa mi;ksx fd;k tk;sxk ftlls O;fDrxr
çfrfØ;kvksa dk vkadyu u fd;k tk ldsA
A – HOUSEHOLD IDENTIFICATION
A.1 Tkuin dk uke Name of the
District____________________ A.2
fodkl [k.M dk uke Name of the Block
_______________________
A.3 xzke iapk;r dk uke Name of the Gram Panchayat
_____________ A.4
jktLo xk¡o dk uke Name of the Revenue village
_______________
ILSP/PSWMD
QUESTIONNAIRE ID: /___/___/___/
ILSP-WMD Annual Outcome Survey Report-2015
55 | P a g e
A.5 okMZ la[;k Ward
Number________________________ A.6
mRrjnkrk dk uke Name of the Respondent
_______________
A.7 mRrjnkrk dk eksckby uEcj Mobile No. of
Respondent_______________ A.8
mRrjnkrk dk fyax Sex of Respondent
_______________
A.9 ifjokj ds eqf[k;k dk uke Name of the head of household : ________________________________
A.10 ifjokj ds eqf[k;k dk fyax What is the gender (sex) of the household head? A - Ikq#’k male
B - efgyk Female
A.11 ifjokj dh tkfr What is the category of household?
A. lkekU;General
B. vuqlwfpr tkfr SC
C. vuqlwfpr tu tkfr ST
D. vU; fiNM+k oxZ OBC
A.12 —i;k viuh tkfr@vuqlwfpr tutkfr Li"V djsa Please Specify the Caste
/Tribe
A.13
—i;k Li"V djas fd D;k vkidk ifjokj ch ih ,y@, ih ,y ds varxZr vkrk gS\Please
specify whether your household belongs to APL / BPL?
D. vUrksn;k Antyodaya
E. ch ih ,y BPL
F. , ih ,y APL
A.14 D;k vkids ikl ch ih ,y @vR;ksn; dkMZ gS\Do you
have BP L/ Antodaya Card A.15
jk”ku dkMZ l[;k Ration Card No.
_______________________
B – LIVELIHOODS
B.1 D;k vki ds ikl uxn vk; dk dksbZ Jksr gS\Do you have a source of cash
income?
A. gk¡ Yes
B. ugha कवल कषि No (no cash
income, only subsistence
agriculture)
B.2 fiNys o’kZ dh rqyuk esa bl o’kZ vkidh vk; dh fLFkfr dSlh gSA Compared to last
year (i.e. 12 months ago), would you say that, this year, your income is:
A. 2000 ls de Less than 2000
B. 2000 ls 5000 ds chp Between
2000-5000
C . 5000 ls T;knk More than 5000

ILSP-WMD Annual Outcome Survey Report-2015
56 | P a g e
B.3
vki ds ifjokj dh vk; dk eq[; Jksr D;k gS\
What is the main source of income of your household?
[Use codes below and write corresponding code on the right]
[Adapt the response options below to the
context of your project]
A. कषि और फसलो की बबकरी Agriculture and
sales of crops
B. मतसर पालन और मछली की बबकरी Fishing
and sales of fish
C. पिधन और जानवरो की बबकरी Livestock
and sales of animals
D. i'kqtU; mRiknksa dh fcdzh Sale of Livestock
Product
E. पराकततक ससाधनो ( वन आधाररत , NTFP ,
लकडी क वरापार आरद) Natural resources
F. फटकर वरापार Petty trading
G. vdq’ky etnwj Unskilled labour
H. osru etnwjh@jkstxkj Salaries, wages (employees)
I. gLr f’kYi Handicraft
J. izs ‘k.k@ljdkjh lgk;rk Remittances/govt scheme
L vU ; ¼ fufnZ’V djsa½ Other (specify:
B.4 fdl Jksr ls lc ls vf/kd vk; gksrh gS Which of the above activities impacted
your livelihood the most Use code A-L
B.5 vki ds ifjokj esa efgykvksa }kjk vkfFkZd fØ;k dykiksa ij fdruk le; [kpZ gksrk gS\ In
your family, how much time is spent by women in economic activity ........... /hous/day
B.6 vki ds ifjokj dk vkS’kr [kpZ fdrkuk gS\ What is the Average Expenditure of
Household?
A. 2000 ls de Less than 2000
B. 2000 ls 5000 ds chp Between
2000-5000
C . 5000 ls T;knk More than
B.7 fiNys o’kZ dh rqyuk esa bl o’kZ vkids [kpZ dh fLFkfr dSlh gSA Compared to last year
(i.e. 12 months ago), would you say that, this year, your Expenditure is:
A-Higher T;knk
B-Equal बराबर
C- Lower कम
C – FOOD SECURITY
C.1
D;k fiNys 12 eghuksa esa dHkh ,slk le; vk;k gS tc vki vius ifjokj dks 3 le; Hkkstu
ugha ns ik;s\ Over the last 12 months, was there any period(s) during which
you were not able to provide 3 meals per day for your household (food
A. Yes gk¡ B. No ugha

ILSP-WMD Annual Outcome Survey Report-2015
57 | P a g e
shortage period)?
C.2
;fn i;kZIr ek=k miyC/k ugha gS] deh dh vof/k Li"V djsa¼ekg@o’kZ½
If enough quantity is not available, specify the shortage over 12 months
/___/___/
C.3 fiNys o’kZ dh rqyuk esa dksbZ lq/kkj gS\ Was there an improvement as compared
to previous year?
A. Some improvement
B. Same
C. Situation is worse
C.4 o’kZ esa vkids ?kjsyw mRikn ls fdrus eghus Hkkstu miyC/k gks ikrk gS\In a year, for
how many months food available from their own production?
/___/___/ (write 00 if less than
one month)
D – LAND TENURE
D..1
D;k vkids ifjokj ds ikl Lo;a vFkok cVkbZ dh —f"k Hkwfe gS\(Does your HH own
Agriculture land/has leased land?
A. viuh tehu own land
B. iV~Vs ij fy;k _leased land
C. nksuks_both
D.2
D;k tehu ds efydkuk vf/kdkj vki ds ikl gS\Do you have ownership rights on
a land? A. gk¡ Yes B. ugh No
D.3
vki dk viuh lEifRr ij vf/kdkj fdruk lqjf{kr gS\How secure do you consider
your property rights?
A. cgqr lqjf{kr Very secure
B. lk/kj.kr;k lqjf{kr Moderately
secure
C. vlqjf{kr Insecure
D. cgqr vlqjf{kr Very insecure
E - AGRICULTURAL PRODUCTION AND IRRIGATION
E.1 D;k vki [ksrh djrs gSa\ fdl mn~ns’ ; ls [ksrh djrs gSaa ?Do you cultivate land, and
if so, for what purpose?
A. gka Loa; ds miHkksx gsrq Yes, own
consumption only
B. D;k fodz; gsrq Yes, sales only
C. gka miHkksx o fodz; nskuksa Yes,
consumption and sale
D. ugha No
E.2 vkids ikl dqy fdruh Hkwfe gSA How much land do you have in Total A. Less than 20 nali

ILSP-WMD Annual Outcome Survey Report-2015
58 | P a g e
B. Between 20-50 nali
C . More than 50 nali
E.3 vkids ikl dqy miyC/k Hkwfe esa ls fdruh % Hkwfe ij [ksrh djrs gSA
What % of land do you cultivate
A. 10 % ls de Less than 10%
B. 10 % ls 20 % ds chp Between 10-
20 %
C . 20 % ls vf/kd More than 20%
E.4 D;k vki mPp ewY; okyh Qlyksa dh [ksrh djrs gS\ Do you cultivate high value
crops? [provide definition of high value crop] A. gka Yes B. ugha No
E.5 miyC/k Hkwfe esa ls fdruh % Hkwfe ij [ksrh djrs gSA What % of land do
you manage to cultivate high value crop
A. 10 % ls de Less than 10%
B. 10 % ls 20 % ds chp Between 10-
20 %
C . 20 % ls vf/kd More than 20%
E.6
fiNys lky dh rqyuk esa Qlyksa dh mRikndrk esa bl lky o`f) dh Fkh\Compared
to last year (i.e. 12 months ago), did the productivity of your crops
increase this year?
A. gka Yes B. ugha No
E.7 bl o`f) dks vki dSls vk¡drs gSa\How would you quantify this increase?
A. de Small
B. e/;e Medium
C. vf/kd Large
E.8 fiNys lky dh rqyuk esa Qlyksa ds {ks=Qy esa dh fLFkfr dSlh gS ? Compare to last
year , what is the status of area of crop grown?
A. vf/kd Increase
B- cjkcj Remains same
C. de Decrease
E.9 fiNys lky dh rqyuk esa Qlyksa ds iSnkoj dh fLFkfr dSlh gS Compare to last year
,what is the status of area of Yeild?
A. vf/kd Increase
B- cjkcj Remains same
C. de Decrease
E.10 fiNys lky dh rqyuk esa Qlyksa ds fodz; dh fLFkfr dSlh gS Compare to last year ,
what is the status of Sales of crop ?
A. vf/kd Increase
B- cjkcj Remains same
C. de Decrease
Category of crops {ks= Area izkfIr ij ukyh Yeild
(per Nali) Total Sales in last 12 months

ILSP-WMD Annual Outcome Survey Report-2015
59 | P a g e
In Nali Change in
last months
fiNys 12 efguksa esa cnyko
Change in last 12 months
ewY; :i;ksa esa
Value(in Rs)
fiNys 12 efguksa esa
cnyko
Change in Last
12 months
1
ijEiikxr Qlys
vukt Traditional
Crops/Cereals
2
elkys Spices
3 vkyw Potato
4 lfCt;ka
Vegetables
5 vU; Qlysa Other
Crops
6 lHkh Qlyksa vkSj lexz ifjoZru All Crops and Overall Change
Code: 1=Increase from last 12 months fiNys 12 eghuksa ls c<+k
2=No change from last year fiNys 12 eghuksa esa dksbZ ifjoZru ugha
3=Decreased from last year fiNys lky ls de
E.11
fuEufyf[kr esa ls dkSu lh fodflr@mUur —f"krduhdksa dk ç;ksx vkids ifjokj }kjk fd;k
tkrk gS\ Which of the following improved agriculture techniques does your
household use ?
Yes-1,No-2,Dont Know-3
[Two answers maximum]
[Adapt the response options below to the context of your project]
A. Qly dh mUur iztkrh dk mi;ksx Use of Improved crop variety
B. mUur chtksa dk mi;ksx Use of Improved Seeds
C. tSfod moZjd dk mi;ksx ¼dEiksLV@[kknbR;kfn½Use of Organic Fertilizers
D. tSfod dhV&uk’kd] bR;kfn Use of Organic Pesticides
E. dSehdy moZjd dk mi;ksx Use of Chemical fertilizers(minerals,chemicals)
F. df"k esa mi;ksx gkssus okys midj.k Use of improved farm techniques
G. ubZ mRiknu rduhd dk iz;ksx Use of new production techniques
1 2 3
1 2 3
1 2 3
1 2 3
1 2 3
1 2 3
ILSP-WMD Annual Outcome Survey Report-2015
60 | P a g e
H. feV~Vh dVko fu;a=.k Erosion control
I. Qly i)fr Cropping Techniques
J. lw{e {ks= flapkbZ Small area irrigation
K. enk ueh laj{k.k rduhd ¼eyfpax] 'ksM usV½ Soil moisture retaining techniques
L. mUur jksi.kh rduhd Improved nursery techniques
1 2 3
1 2 3
1 2 3
1 2 3
1 2 3
1 2 3
E.10 D;k vki flapkbZ iz.kkyh dk mi;ksx dj jgs gS\Do you use irrigation system(s)? A. gk¡ Yes B. ugha No
E.11
D;k vki us fiNys lky dh rqyuk esaa bl lky vkius flafpar {ks= c<+kus dk izcU/ku fd;k Fkk\
Did you manage to increase your irrigated area this year compared to last
year (i.e. 12 months ago)?
A. gk¡ Yes B. ugha No
E.12 vki dSls {ks= c<+k\ How would you quantify this increase?
A. छोट Small (< 10%)
B. मधरम Medium (10-20%)
C. बड Large (>20%)
F - Livestock
F.1 D;k vkids ifjokj ds ikl i'kq/ku gS\Does your household own livestock? A. gk¡ Yes B. Ukgh No
F.2 fiNys lky vkids ikl fdrus i’kq Fks Compare to last year ,did the Number of
Animals
A. vf/kd Increase
B- cjkcj Remains same
C. de Decrease
F.3 fiNys lky vkids ikl fdrus i’kq fodz; fd;s Compare to last year ,did the Sales
of Animals
A. vf/kd Increase
B- cjkcj Remains same
C. de Decrease
i'kq ds izdkj Types of
animals
izR;sd izdkj ds LokfeRo okyh dqy la[;k Total
number owned for each type
fiNys 12 efguksa esa dqy fodz; Total sales in
last 12 months
la[;k numbers efguksa dksbZ ifjorZu
Change in last 12
ewY; :i; esa
Value(in Rs)
fiNys 12 efguksa dksbZ
ifjorZu
Change in last 12
ILSP-WMD Annual Outcome Survey Report-2015
61 | P a g e
months months
1 ns”kh eos'kh Local Cattle
2
dkzl chM@mUur fdLe ds
eos”kh Cross Breed/
Improved Breed of
cattle
3 HkSl Buffalo
4 HksM Sheep
5 cdjh Goats
6 eqxhZ ikyu Poultry
7 vU; eos”kh Other animals
8 lHkh dks feyk dj fodz; ewY; crk;s Total value of all sales and overall
change
* enter "0" if the category of crops is not grown, or if no sales are made.
1=Increase from last 12 months fiNys 12 efgus esa c<+ksRrjh
2=No change from last year fiNys 12 efgus esa dksbZ cnyko ugha
3=Decreased from last year fiNys lky esa deh
G – ACCESS TO MARKETS
G.1 vki df’k mRiknu ;k xSj df’k mRiknksa dh fczdh ls vk; izkIr djrs gS\ Do you get an
income from sales of agricultural production/ Non farm products?
A. gk¡ Yes B. ugha No
G.2
vki viuk mRiknu dgka csprs gS\
¼,d ls vf/kd mRrj ½ Where do you market your product?(Multiple
Response)
A. ?kj ;k [ksr ls Farm gate/from
home
B. LFkkuh; xkao esa At local Village
C. Cykd eq[;ky; ij At block
D. ftys eq[;ky; ij At District
headquarter

ILSP-WMD Annual Outcome Survey Report-2015
62 | P a g e
G.3
fdldks viuk mRikn csprs gS\
To whom do you sell your product
A- vfrae miHkksxrk Final consumer
B- LFkkuh; ,stsV vkSj xkaao Lrj ij
laxzgdrkZ Local Agents and village
level collectors
C- traders Fkksd fodzsrk ;k O;kikjh
Wholesalers or traders
D- lgdkjhrk ;k fuekZrk laxBuksa
Cooperatives/producer
organization
E-;kikj QeZ @izkslslj Agribusiness
concerns/processers
F- ljdkjh laLFkk Govt. Agencies
G.4
Is there an nw/k laxzg lfgr izlaLdj.k]HkaMkj.k] laxzg]foi.ku ds fy, dksbZ lkewfgd lqfo/kk dsUnz gS\ Is
there any common facility centre (processing, storage, collection,
marketing. including milk collection) in your area?
A. gk¡ Yes B. ugha No
G.5 ;fn gka] rks D;k vki vU; dqN mRikn lkewfgd lqfo/kk dsUnz ij csprs gS\ If yes, do you
sell some of your production via common facility centre?
A. gk¡ Yes B. ugha No

ILSP-WMD Annual Outcome Survey Report-2015
63 | P a g e
H – FINANCIAL SERVICES foRrh; lsok,¡
H.1
D;k fiNys 12 efgus esa vkius dtZ fy;k gS\ Did you (or any household member)
borrow money over the last 12 months? A. gka Yes B. No
H.2 dgka ls dtZ fy;k gS\What was the source of credit?
A. Formal (bank/micro-finance
institution)
B. Informal (friends, NGOs,
Cooperatives/credit group
H.3
fiNys 10 eghuksa es fdruk dtkZ fy;k gS ¼ ewY; :0 esa½ How much did you borrow
(total last 12 months)?
[Write the amount in the local currency]
/___/___/___/___/___/___/___/
[Currency]: _______________
H.4 D;k _.k okil fd;k x;k\ Has the loan been repaid?
A. . gka Yes
B. vHkh rd ugha fdUrq tYnh dj nsaxs
Not yet, but soon
C. ugha Hkqxrku ugha dj ldrs No,
cannot repay
H.5
vkius /ku dk mi;ksx dgka fd;k ;k djsxsa
What did you - or will you - use the money for?
[One answer: only the main use should be reported]
A. खपत ( भोजन, कपड, आरद समारोहो) Consumption (food,
clothes, ceremonies, etc.)
B. आर सजन गततषवधधरो (उपकरण ,
उपकरणो आरद ) Income
generating activities (tools;
equipment, etc.)
C. तनवि (घर म सधार, भशम अधधगरहण आरद)Other
investments (housing
improvement, land acquisition; etc.)
D. शिकषा Education
E. वार Health
F. Others
H.6
dqy feykdj] fiNys lky dh rqyuk esa vkids ifjokj ds fy, csgrj igqap vc foRrh;
lsokvksa rd gS\ Overall, do you consider that, your HH has now better
access to financial services compared to last year ?
A. . gka Yes B. ugha No

ILSP-WMD Annual Outcome Survey Report-2015
64 | P a g e
H.7 D;k vki dk cSd esa [kkrk gS\ Do you have a bank account? A. gka Yes B. ugha No
I.4
vkids {ks= esa jkstxkj O;olkf;d izf'k{k.k iznku djus ds fy, ifj;kstuk ls yxh
gq;h dksbZ laLFkk gS\Is there any Training given by any department for
Entrepreneurship development in your area??
A. gka Yes B. ugha No
I.5 If yes: D;k vki dks dksbZ izf'k{k.k feyk gS\Have you received any training? A. gk¡ Yes B. ugha No
I.6 If yes: vki dks izf'k{k.k ls fdlh izdkj dk ykHk gqvkA Did you get any kind
benefit after the training?
A. gk¡ Yes B. ugha No
J – INNOVATIVE LINKAGES
J.1
D;k vkids {ks= esa dke dj jgs fdlh Hkh vfHkuo ifj;kstuk lkFkh gS\ ¼cksMZ]ykbu foHkkx
] df"k foKku dsUnz ] rduhdh laLFkkuksa df"k fo'ofo}ky;ksa vkfn½ Is there any
innovative Organization partner (Boards,line dept., KVK, Technical
institutes, Agricultural universities etc) working in your area?
A. gk¡ Yes B. ugha No
J.2 muds }kjk fdlh Hkh ubZ rduhd ds fy, izkslkfgr fd;k gS\ Is there any new
technologies promoted by them? A. gk¡ Yes B. ugha No
J.3 muds }kjk inksUur fdlh Hkh ubZ rduhd ds fy, izkslkfgr fd;k gS\Name some of
the important technologies you found useful?
THIS IS THE END OF THE INTERVIEW, THANK YOU
I – ENTERPRISE DEVELOPMENT, VOCATIONAL TRAINING AND EMPLOYMENT
I.1
D;k vki ;k vkids ifjokj ds fdlh Hkh lnL; dk ,d xSj df’k mn~;e gS\Do you
or any household member have a non-farm enterprise? [Provide
definition of non-farm enterprise e.g. handicraft activities]
A. Yes B. ugha No
I.2 D;k mlesa Jfed dke djrs gS\Have you employees labour?
A. No employee
B. One to two employees
C. Three to five employees
D. More than five employees
I.3
D;k izkstsDV ds dkj.k m);e LFkkfir djus ;k bls c<+kus esa en~n feyh gS\ Did
any agency help your household establish or expand your
enterprise/business?
A. gka Yes
C. ugha No