Embed Size (px)
Citation preview
January 1, 2010 / Vol. 35, No. 1 / OPTICS LETTERS 79
Image contrast enhancement in confocalultramicroscopy
Stefan Kalchmair,1,2 Nina Jährling,1,2 Klaus Becker,1,2 and Hans-Ulrich Dodt1,2,*1Vienna University of Technology, Institute of Solid State Electronics, Department of Bioelectronics, Floragasse 7,
1040 Vienna, Austria2Center for Brain Research, Medical University of Vienna, Spitalgasse 4, 1090 Vienna, Austria
*Corresponding author: [email protected]
Received September 14, 2009; revised November 20, 2009; accepted November 24, 2009;posted December 7, 2009 (Doc. ID 117019); published December 31, 2009
Ultramicroscopy allows for the 3D reconstruction of centimeter sized samples with a spatial resolution ofseveral micrometers. Nevertheless, in poorly cleared or very large specimens the images may suffer fromblurring and low contrast levels. To address these problems, ultramicroscopy was combined with the prin-ciple of confocal microscopy using a slowly rotating Nipkow disk. This configuration was tested by comparingimages from mouse hippocampal neurons and mouse liver blood vessels recorded in confocal and conven-tional mode. It was found that confocality minimizes the background noise and considerably improves thesignal-to-noise ratio when applied to ultramicroscopy. © 2009 Optical Society of America
OCIS codes: 180.2520, 100.3010, 330.6110, 180.6900, 170.6900, 180.1790.
Modern imaging techniques such as confocal micros-copy allow effective optical sectioning. In the courseof this development, computational 3D image recon-struction became a widely used tool in life sciences[1–3]. Unlike standard confocal microscopy, which re-quires high-numerical-aperture (NA) objectives andprovides only small fields of view, ultramicroscopy(UM) allows the acquisition of 3D images of samplesof the order of centimeters in size with micrometerresolution [4,5]. This is feasible, because in UM, illu-mination and observation pathways are spatiallyseparated by illuminating the specimens from theside using a thin laser light sheet that is formed byone or more optical elements. In UM only the focalplane of the objective is illuminated; areas above orbelow this plane generally do not contribute out-of-focus light to the microscopic image.
Since in UM light has to pass laterally through theentire specimen almost without absorption, it re-quires optically transparent specimens. Therefore, aspecial clearing procedure has to be applied to mostbiological specimens before they can be used for mi-croscopical inspection [4,6]. However, even after care-ful sample preparation, the excited fluorescence lightis still scattered to a certain degree, depending on thetype of the investigated tissue and the level of chemi-cal clearing. As a consequence, the illumination beamsuffers from continuous degradation while propagat-ing through the specimen, resulting in reduced reso-lution and additional background noise.
One promising method to solve this problem isstructured illumination (SI). SI was introduced in1963 by Lucosz and Marchand [7] and later adaptedto various kinds of optical microscopy, e.g., epifluores-cence microscopy [8,9], single plane illumination fluo-rescence microscopy [10], and saturated structuredillumination microscopy [11]. In SI-fluorescence mi-croscopy, the excitation beam is spatially filtered by amask consisting of alternating transparent and non-transparent stripes. This mask is shifted stepwise
relative to the sample, and an image is recorded at0146-9592/10/010079-3/$15.00 ©
each new position. From the resulting set of imagesan image with enhanced contrast and reduced back-ground noise is computed. It was shown that SI im-proves contrast and signal-to-noise ratio (SNR) alsoin UM [10]. However, the illumination scheme, de-scribed in [10], allows only moderate improvement ofthe SNR, while the applied arithmetic operationsgenerate additional noise. Therefore, another ap-proach was adopted that was reported for fluores-cence or transmission microscopy and is more relatedto standard confocal microscopy [12–14].
In our work fluorescence is excited with a laser of488 nm wavelength and 50 mW power (Excelsior,Spectra Physics, Germany). The Gaussian laserbeam is expanded by a Galilean beam expander con-sisting of a plano-concave and a plano-convex lens,passed through a circular aperture (diameter 5 mm),and then focused by a cylindrical lens to form a thinlight sheet (Fig. 1). For spatial modulation of thelight sheet a slowly rotating Nipkow disk is used,
Fig. 1. Optical setup of the confocal ultramicroscope. Thelaser beam is expanded by a 10� beam expander (BE),passed through an aperture (A), and focused by a cylindri-cal lens (CL, f=80 mm) onto a slowly rotating Nipkow disk(ND). The spatially modulated light sheet is then projectedinto the specimen 1:1 by two identical plano-convex lenses
(PCL).2010 Optical Society of America
80 OPTICS LETTERS / Vol. 35, No. 1 / January 1, 2010
placed in the focal plane of the cylindrical lens. Thehelical line pattern on the rotating Nipkow disk pro-duces a slowly moving lamellar illumination patternconsisting of 10-�m-wide bright stripes in a distanceof 100 �m. This equals a duty cycle of 1:10. The illu-minated areas in the specimen, where fluorescencelight is excited, mutually influence each other. All ex-cited fluorescence must pass through the layers ofcleared tissue above the light sheet, and is inevitablyscattered by protein or small particles. A larger sepa-ration between these areas promises low backgroundnoise by reducing the overlap of scattered fluores-cence light. The greater this separation, the higher isthe degree of background reduction. In contrast topreviously implemented illumination schemes with aduty cycle of 1:1 (e.g., [10]), the sparse illuminationpromises a significantly higher increase in SNR.Here a trade-off between recording speed and the de-gree of image improvement must be made. With aduty cycle of 1:10, at least ten images are needed forreconstruction. In practice more images (e.g., 15–40images) are recorded for more accurate results.
The spatio-temporal modulated light sheet is pro-jected into the specimen, exciting fluorescence withinparallel light-stripe-shaped regions of 10 �m width.The thickness of the stripes depends on the shape ofthe excitation beam. In our system, it ranges from10 �m in the center to 20 �m at the edges of the im-age. Rotation speed of the Nipkow disk is adjusted sothat the shifting line pattern covers the entire imagearea before the following confocal image is acquired.To block excitation light, an optical band pass filter(505–530 nm; Zeiss) is positioned between the objec-tive and the camera. Images are recorded with aCoolSnap K4 CCD Camera with 2048�2048 pixelsand a 12 bit AD converter.
Confocal UM images with enhanced contrast andreduced background are calculated by applying thefollowing algorithm to a set of N single images. Foreach pixel position, the maximum intensities of allspatially corresponding pixels of the images are de-termined. In practice this means that all images arecompared and for each pixel position only the highestvalue is retained. An analog calculation is performedfor the minimum intensities. The obtained minimumimage is scaled by a factor �M and subtracted fromthe maximum intensity image according to
Irec�x,y� = Maxn=0. . .N
In�x,y� − �M Minn=0. . .N
In�x,y�. �1�
This algorithm gives an optically sectioned imageand therefore further increases the SNR. The idea isvery similar to the principle of confocal microscopy:Light emitted from in-focus fluorescent regions isgenerally brighter than light from out-of-focus re-gions. Thus, by using only the brightest pixels for theimage, light from out-of-focus regions is effectivelyrejected. The maximum operation in the algorithmacts like a “virtual pinhole,” analogous to the pinholein a standard confocal microscope that separateslight from in-focus and out-of-focus regions [15]. Theminimum operation creates an image containing only
background noise, as the minimal values appear inthe regions between the light stripes. Hence, lightfound there is mainly scattered fluorescence light. Inan ideally transparent sample, these areas would beblack. Close to bright features, the background noiseis strongest. By subtracting the minimum from themaximum image, the haze around bright featurescan be reduced. Obviously, the signal is reduced bythe same amount, therefore the SNR remains un-changed. An additional advantage of the minimumsubtraction is that systematic errors such as CCDpixel-to-pixel variations are effectively canceled out[15]. In areas with a low signal the minimum sub-traction can cause the creation of unwanted artifacts.Therefore, a scaling factor � is introduced to controlthe amount of background subtraction. Here a trade-off has to be found (e.g., by visual comparison) thatalso may differ from sample to sample, even thoughthe effects are generally small [13,14].
Images were recorded from enhanced green fluo-rescent protein (EGFP) labeled mouse hippocampiand autofluorescent mouse livers. Organs were ob-tained according to the guidelines of the local animalcare committees. After fixation in 4% paraformalde-hyde, the organs were dehydrated in an ascendingethanol series and cleared by incubation in a mixtureconsisting of one part benzyl alcohol and two partsbenzyl benzoate (BABB), according to [4,5].
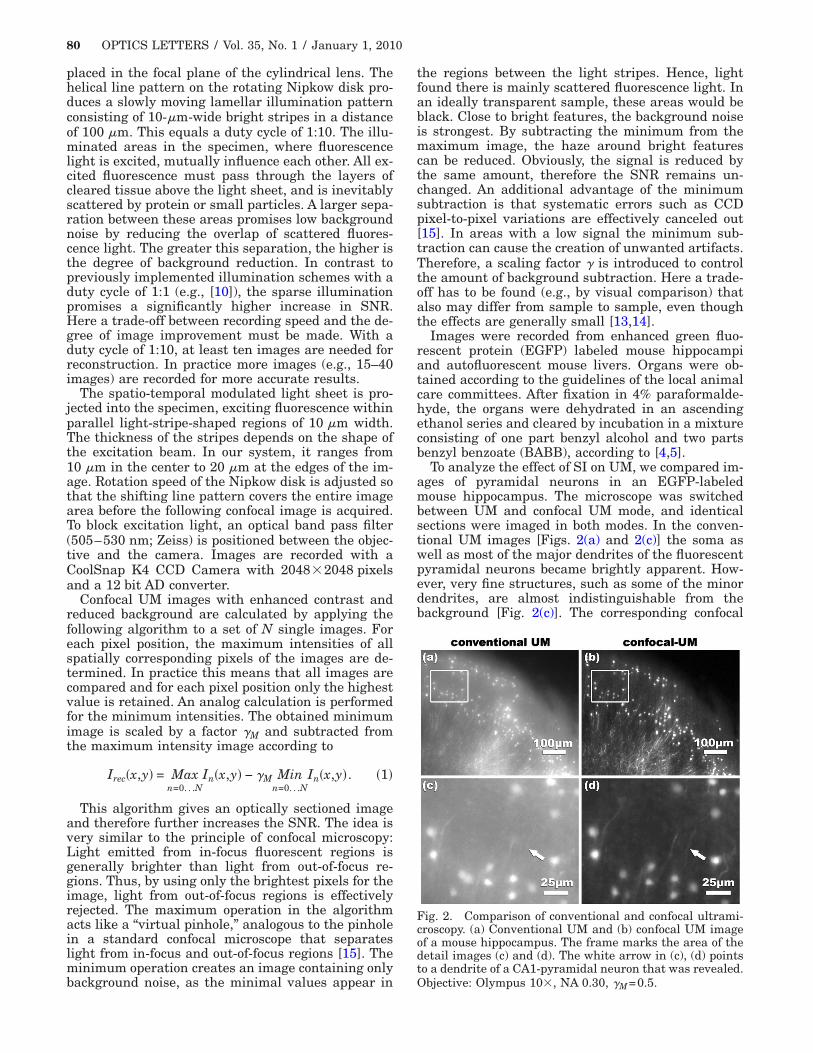
To analyze the effect of SI on UM, we compared im-ages of pyramidal neurons in an EGFP-labeledmouse hippocampus. The microscope was switchedbetween UM and confocal UM mode, and identicalsections were imaged in both modes. In the conven-tional UM images [Figs. 2(a) and 2(c)] the soma aswell as most of the major dendrites of the fluorescentpyramidal neurons became brightly apparent. How-ever, very fine structures, such as some of the minordendrites, are almost indistinguishable from thebackground [Fig. 2(c)]. The corresponding confocal
Fig. 2. Comparison of conventional and confocal ultrami-croscopy. (a) Conventional UM and (b) confocal UM imageof a mouse hippocampus. The frame marks the area of thedetail images (c) and (d). The white arrow in (c), (d) pointsto a dendrite of a CA1-pyramidal neuron that was revealed.
Objective: Olympus 10�, NA 0.30, �M=0.5.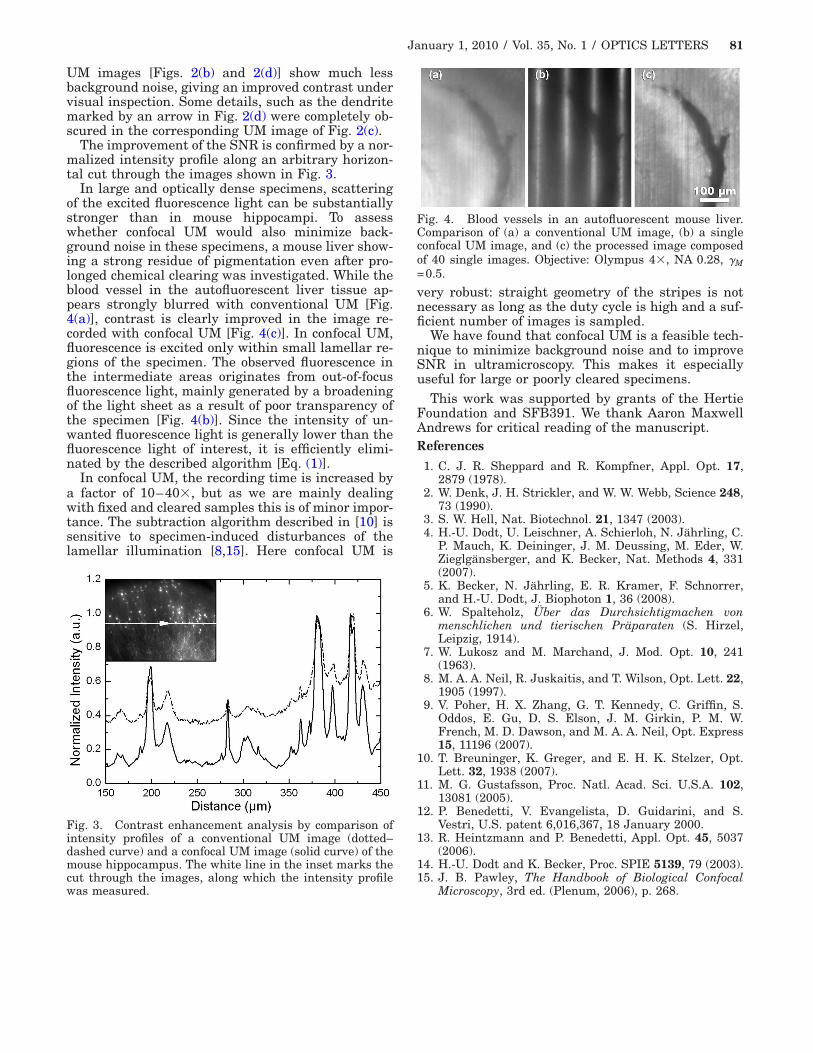
January 1, 2010 / Vol. 35, No. 1 / OPTICS LETTERS 81
UM images [Figs. 2(b) and 2(d)] show much lessbackground noise, giving an improved contrast undervisual inspection. Some details, such as the dendritemarked by an arrow in Fig. 2(d) were completely ob-scured in the corresponding UM image of Fig. 2(c).
The improvement of the SNR is confirmed by a nor-malized intensity profile along an arbitrary horizon-tal cut through the images shown in Fig. 3.
In large and optically dense specimens, scatteringof the excited fluorescence light can be substantiallystronger than in mouse hippocampi. To assesswhether confocal UM would also minimize back-ground noise in these specimens, a mouse liver show-ing a strong residue of pigmentation even after pro-longed chemical clearing was investigated. While theblood vessel in the autofluorescent liver tissue ap-pears strongly blurred with conventional UM [Fig.4(a)], contrast is clearly improved in the image re-corded with confocal UM [Fig. 4(c)]. In confocal UM,fluorescence is excited only within small lamellar re-gions of the specimen. The observed fluorescence inthe intermediate areas originates from out-of-focusfluorescence light, mainly generated by a broadeningof the light sheet as a result of poor transparency ofthe specimen [Fig. 4(b)]. Since the intensity of un-wanted fluorescence light is generally lower than thefluorescence light of interest, it is efficiently elimi-nated by the described algorithm [Eq. (1)].
In confocal UM, the recording time is increased bya factor of 10–40�, but as we are mainly dealingwith fixed and cleared samples this is of minor impor-tance. The subtraction algorithm described in [10] issensitive to specimen-induced disturbances of thelamellar illumination [8,15]. Here confocal UM is
Fig. 3. Contrast enhancement analysis by comparison ofintensity profiles of a conventional UM image (dotted–dashed curve) and a confocal UM image (solid curve) of themouse hippocampus. The white line in the inset marks thecut through the images, along which the intensity profilewas measured.
very robust: straight geometry of the stripes is notnecessary as long as the duty cycle is high and a suf-ficient number of images is sampled.
We have found that confocal UM is a feasible tech-nique to minimize background noise and to improveSNR in ultramicroscopy. This makes it especiallyuseful for large or poorly cleared specimens.
This work was supported by grants of the HertieFoundation and SFB391. We thank Aaron MaxwellAndrews for critical reading of the manuscript.References
1. C. J. R. Sheppard and R. Kompfner, Appl. Opt. 17,2879 (1978).
2. W. Denk, J. H. Strickler, and W. W. Webb, Science 248,73 (1990).
3. S. W. Hell, Nat. Biotechnol. 21, 1347 (2003).4. H.-U. Dodt, U. Leischner, A. Schierloh, N. Jährling, C.
P. Mauch, K. Deininger, J. M. Deussing, M. Eder, W.Zieglgänsberger, and K. Becker, Nat. Methods 4, 331(2007).
5. K. Becker, N. Jährling, E. R. Kramer, F. Schnorrer,and H.-U. Dodt, J. Biophoton 1, 36 (2008).
6. W. Spalteholz, Über das Durchsichtigmachen vonmenschlichen und tierischen Präparaten (S. Hirzel,Leipzig, 1914).
7. W. Lukosz and M. Marchand, J. Mod. Opt. 10, 241(1963).
8. M. A. A. Neil, R. Juskaitis, and T. Wilson, Opt. Lett. 22,1905 (1997).
9. V. Poher, H. X. Zhang, G. T. Kennedy, C. Griffin, S.Oddos, E. Gu, D. S. Elson, J. M. Girkin, P. M. W.French, M. D. Dawson, and M. A. A. Neil, Opt. Express15, 11196 (2007).
10. T. Breuninger, K. Greger, and E. H. K. Stelzer, Opt.Lett. 32, 1938 (2007).
11. M. G. Gustafsson, Proc. Natl. Acad. Sci. U.S.A. 102,13081 (2005).
12. P. Benedetti, V. Evangelista, D. Guidarini, and S.Vestri, U.S. patent 6,016,367, 18 January 2000.
13. R. Heintzmann and P. Benedetti, Appl. Opt. 45, 5037(2006).
14. H.-U. Dodt and K. Becker, Proc. SPIE 5139, 79 (2003).15. J. B. Pawley, The Handbook of Biological Confocal
Microscopy, 3rd ed. (Plenum, 2006), p. 268.
Fig. 4. Blood vessels in an autofluorescent mouse liver.Comparison of (a) a conventional UM image, (b) a singleconfocal UM image, and (c) the processed image composedof 40 single images. Objective: Olympus 4�, NA 0.28, �M=0.5.


![Direct Administration of Nerve-Specific Contrast to ... · invasive systems that are readily implemented into current surgical workflows [14-18]. Other technologies, such as confocal](https://img.pdfslide.net/doc/110x75/5fc772bc4f069340d72ac390/direct-administration-of-nerve-specific-contrast-to-invasive-systems-that-are.jpg)