Embed Size (px)
DESCRIPTION
Image page. Real Fed Funds Rate (r). Monetary Policy Response Schedule (MPR). Macro 101 Michael R. Rosenberg October 2010. r*. Financial Conditions Schedule. p *. FC*. Inflation Rate ( p ). Financial Conditions (FC). - PowerPoint PPT Presentation
Citation preview
1
Macro
101Michael R.
RosenbergOctober 2010The Role of Financial
Conditions in the
Transmission Mechanism of
Monetary Policy
Real Fed Funds Rate(r)
Economic Output (y)
Financial Conditions(FC)
Inflation Rate ()
Monetary Policy ResponseSchedule (MPR)
Philips Curve(Inflation/Output Schedule)
IS Curve (Investment/Savings Schedule)
Financial Conditions Schedule
r*
y*
FC* *
Change inPolicy Rate
Change in Economic
Activity
Financial Shock
Change in Financial
Conditions
Real (Output)
Shock
Relative Price Shock
Change in Inflation
2
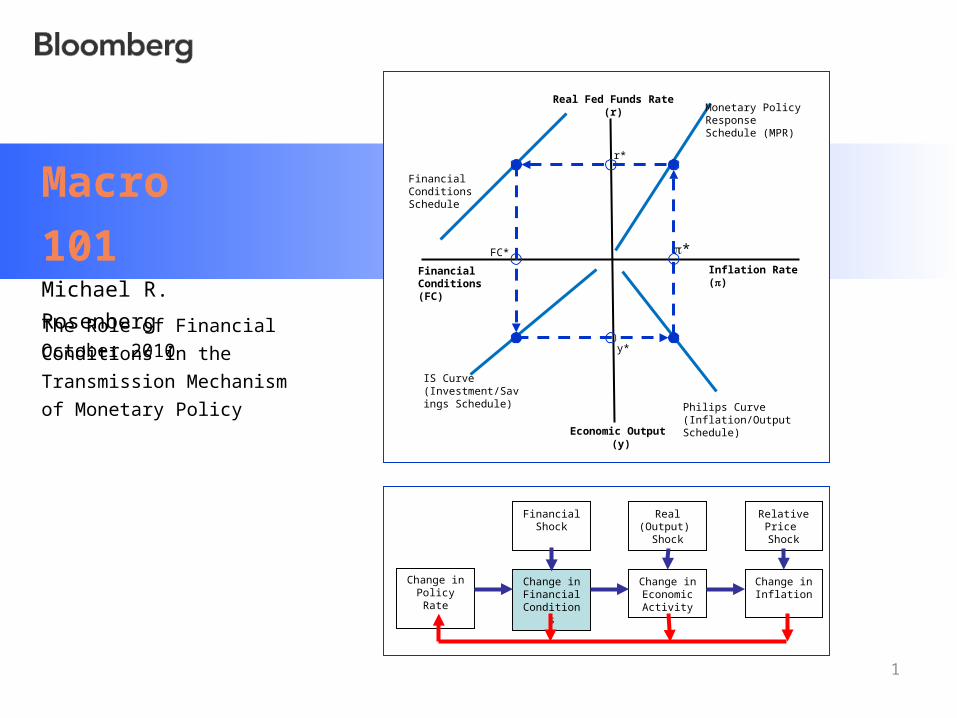
New Keynesian Model’s Perspective on the Transmission Mechanism of Monetary Policy
Change inPolicy Rate
Change in Economic Activity
Real (Output) Shock
Relative Price Shock
Change in Inflation
No Role for Changes in Financial Conditions in
the Transmission of Monetary Policy
3
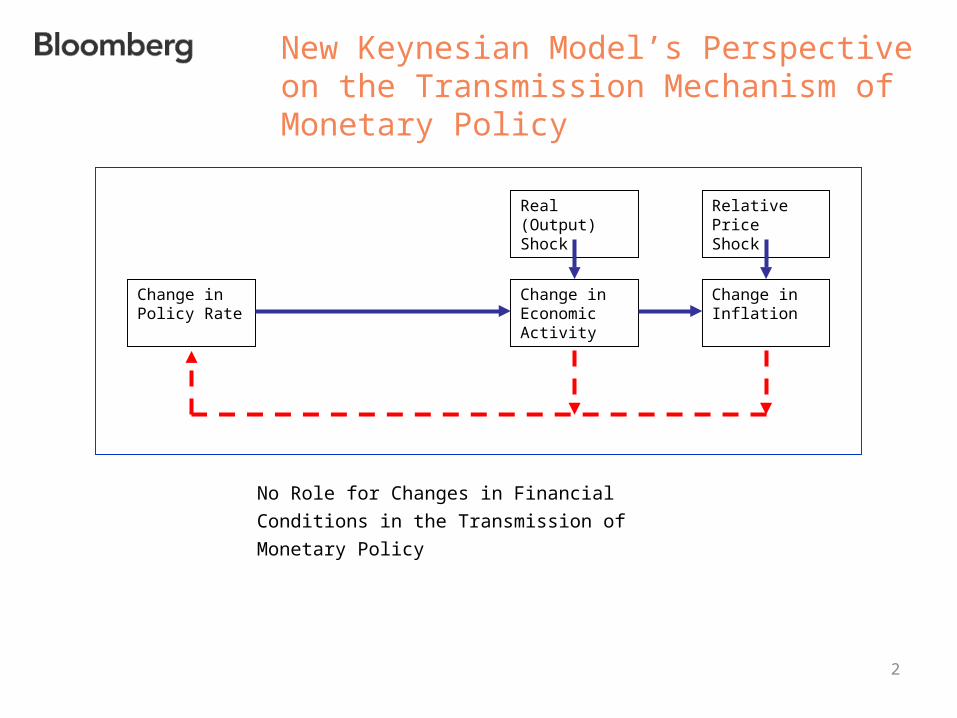
A New Focus on Financial Conditions
“Monetary policy works in the first instance by
affecting financial conditions, including the levels of
interest rates and asset prices. Changes in financial
conditions in turn influence a variety of decisions by
households and firms, including choices about how
much to consume, to produce and to invest.”
Federal Reserve Chairman Ben S. Bernanke, March
2, 2007
4
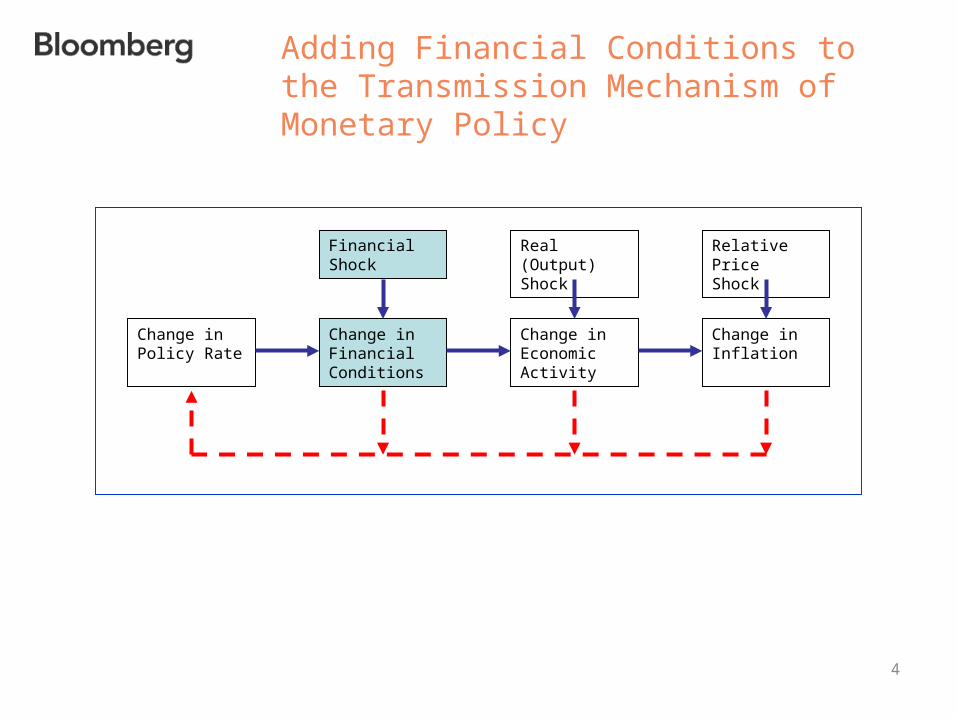
Adding Financial Conditions to the Transmission Mechanism of Monetary Policy
Change inPolicy Rate
Change in Economic Activity
Financial Shock
Change in Financial Conditions
Real (Output) Shock
Relative Price Shock
Change in Inflation
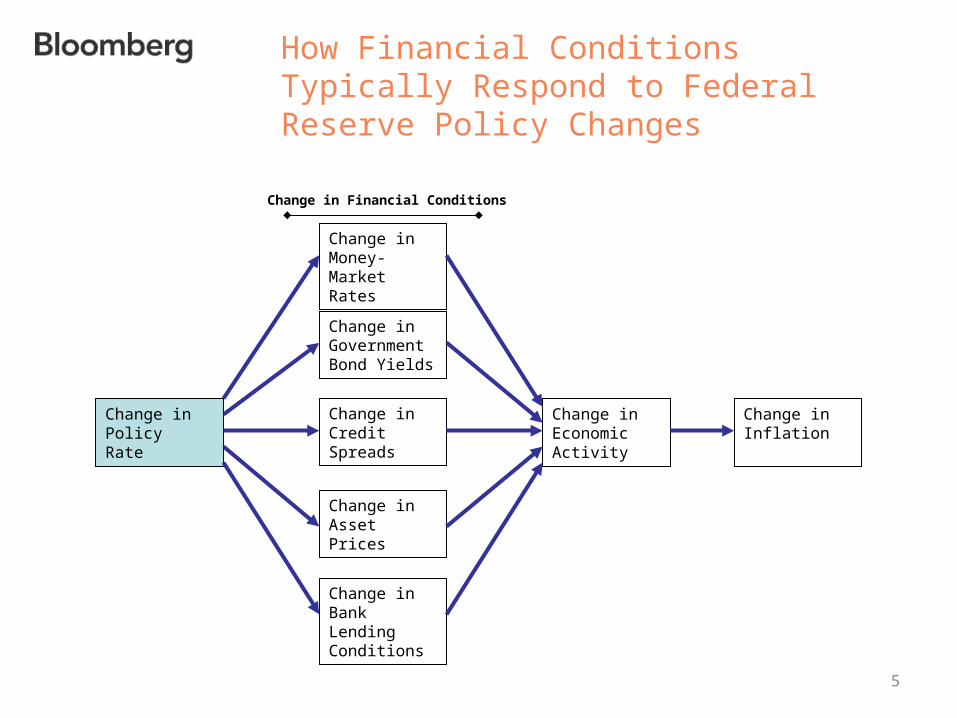
How Financial Conditions Typically Respond to Federal Reserve Policy Changes
Change inCredit Spreads
Change in Economic Activity
Change in Money-Market Rates
Change in PolicyRate
Change in Bank Lending Conditions
Change in Inflation
Change in Government Bond Yields
Change in Asset Prices
Change in Financial Conditions
5
6
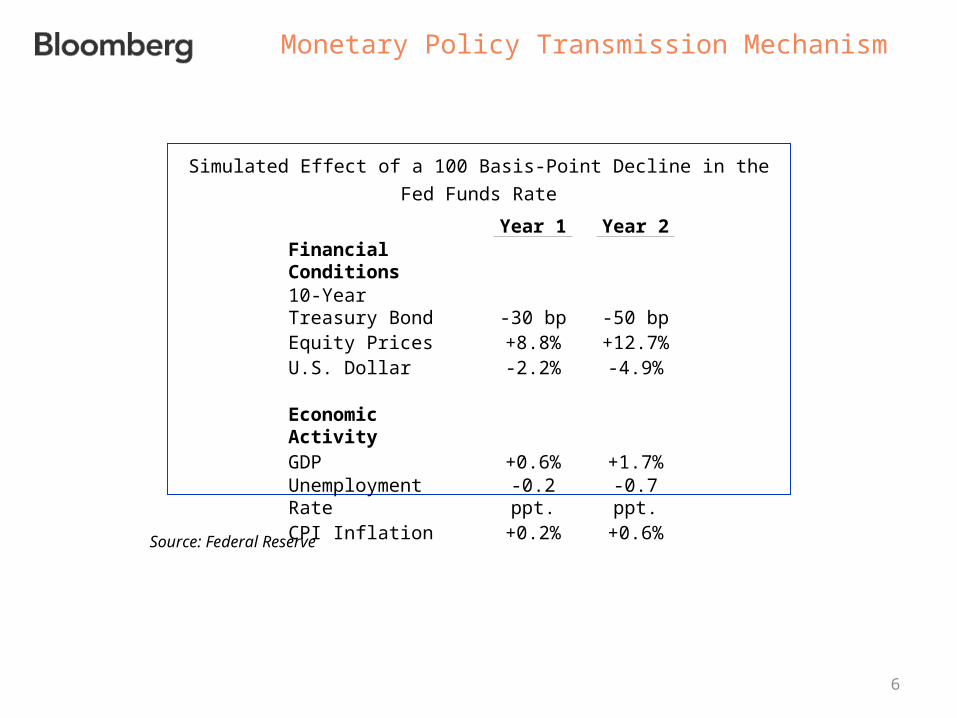
Monetary Policy Transmission Mechanism
Simulated Effect of a 100 Basis-Point Decline in the Fed Funds
Rate
Year 1 Year 2Financial Conditions10-Year Treasury Bond -30 bp -50 bpEquity Prices +8.8% +12.7%U.S. Dollar -2.2% -4.9%
Economic ActivityGDP +0.6% +1.7%Unemployment Rate -0.2 ppt. -0.7 ppt.CPI Inflation +0.2% +0.6%
Source: Federal Reserve
7
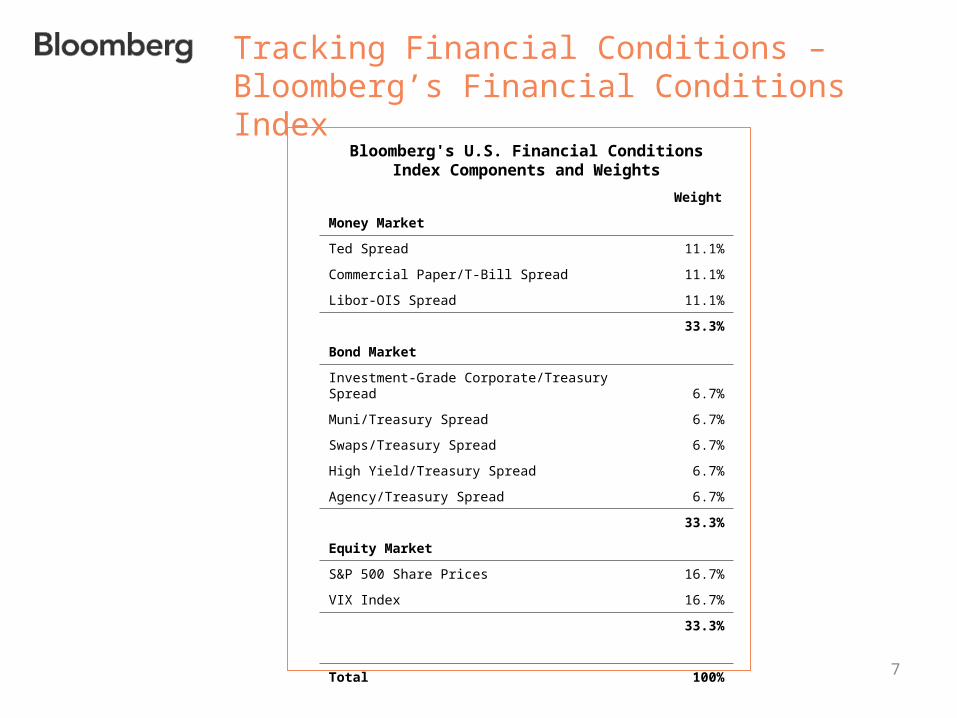
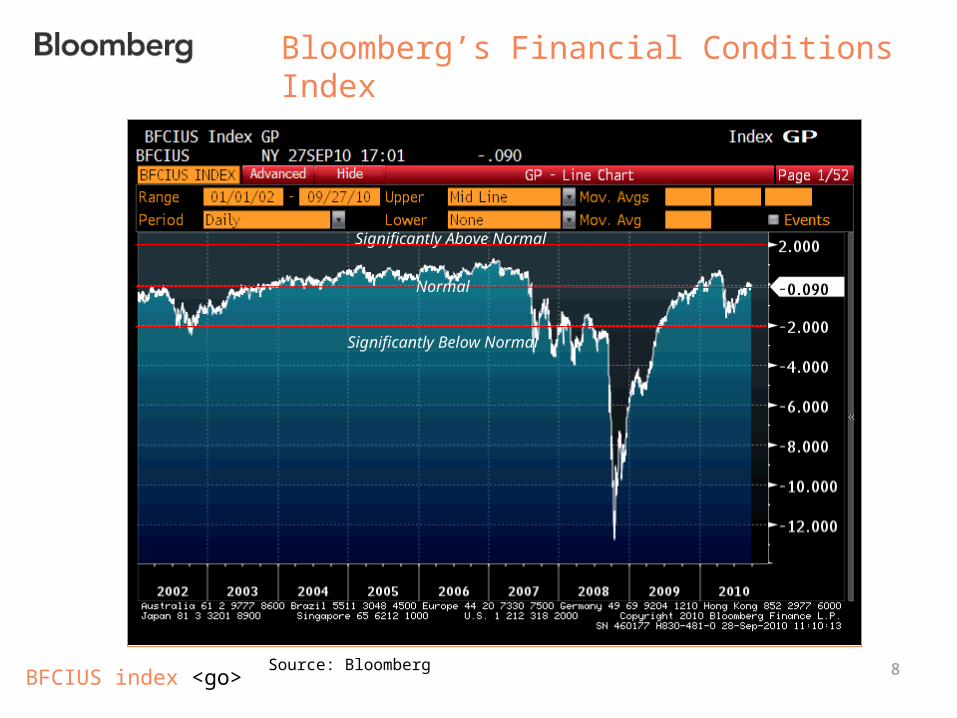
Tracking Financial Conditions –Bloomberg’s Financial Conditions Index
Bloomberg's U.S. Financial Conditions Index Components and Weights
Weight
Money Market
Ted Spread 11.1%
Commercial Paper/T-Bill Spread 11.1%
Libor-OIS Spread 11.1%
33.3%
Bond Market
Investment-Grade Corporate/Treasury Spread 6.7%
Muni/Treasury Spread 6.7%
Swaps/Treasury Spread 6.7%
High Yield/Treasury Spread 6.7%
Agency/Treasury Spread 6.7%
33.3%
Equity Market
S&P 500 Share Prices 16.7%
VIX Index 16.7%
33.3%
Total 100%
8
Bloomberg’s Financial Conditions Index
BFCIUS index <go>Source: Bloomberg
Significantly Below Normal
Significantly Above Normal
Normal
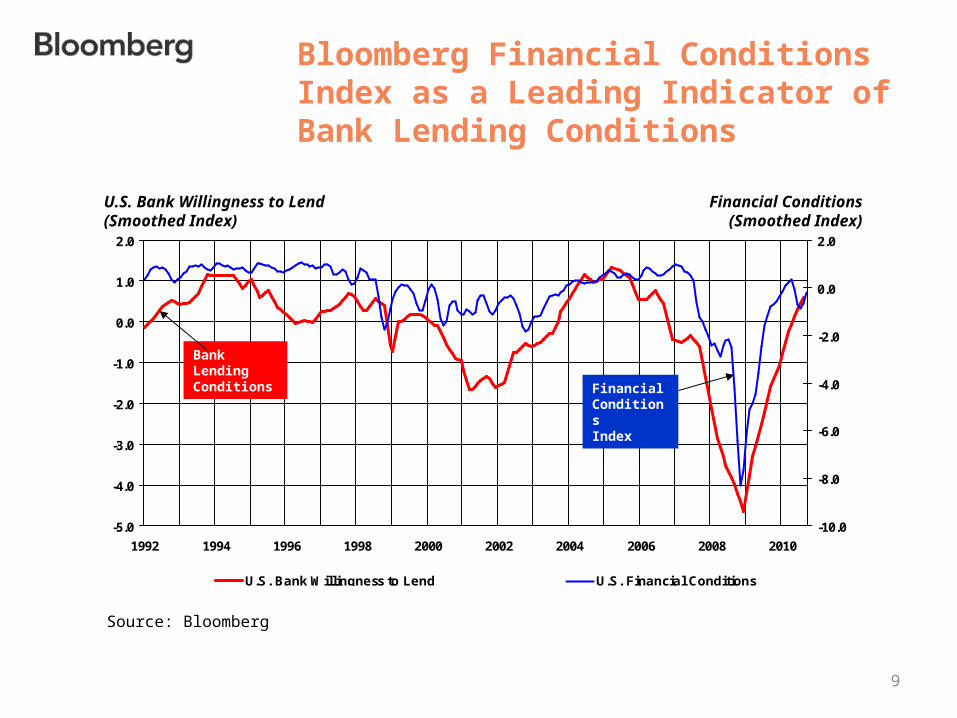
Bloomberg Financial Conditions Index as a Leading Indicator of Bank Lending Conditions
-5.0
-4.0
-3.0
-2.0
-1.0
0.0
1.0
2.0
1992 1994 1996 1998 2000 2002 2004 2006 2008 2010
-10.0
-8.0
-6.0
-4.0
-2.0
0.0
2.0
U.S. Bank Willingness to Lend U.S. Financial Conditions
U.S. Bank Willingness to Lend(Smoothed Index)
Financial ConditionsIndex
Bank Lending Conditions
Financial Conditions(Smoothed Index)
Source: Bloomberg
9
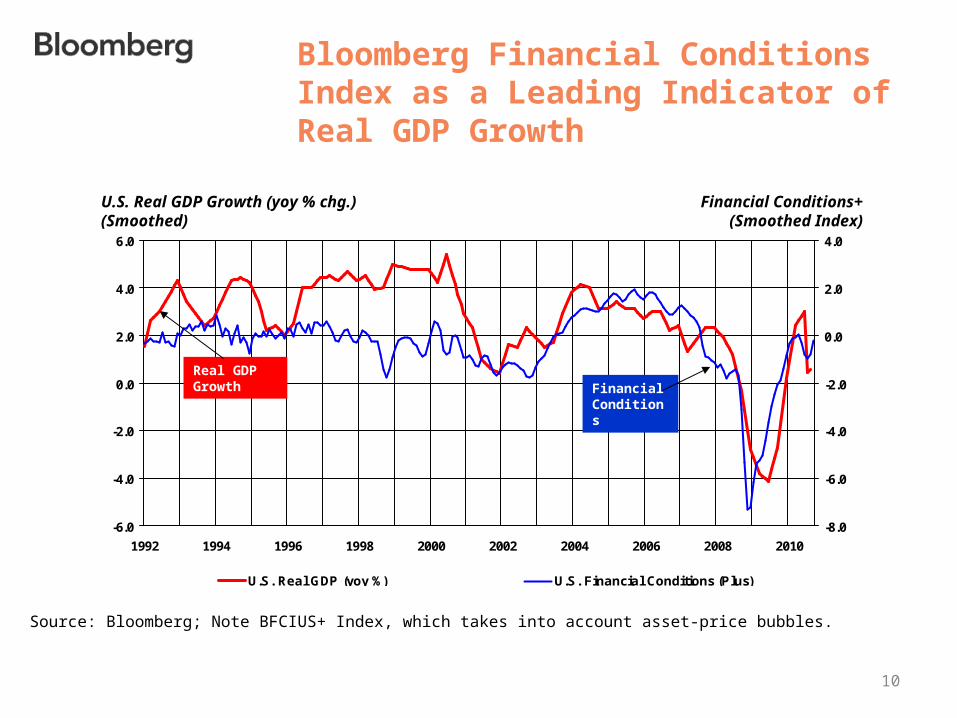
Bloomberg Financial Conditions Index as a Leading Indicator of Real GDP Growth
-6.0
-4.0
-2.0
0.0
2.0
4.0
6.0
1992 1994 1996 1998 2000 2002 2004 2006 2008 2010
-8.0
-6.0
-4.0
-2.0
0.0
2.0
4.0
U.S. Real GDP (yoy %) U.S. Financial Conditions (Plus)
U.S. Real GDP Growth (yoy % chg.)(Smoothed)
Financial Conditions
Real GDP Growth
Financial Conditions+(Smoothed Index)
Source: Bloomberg; Note BFCIUS+ Index, which takes into account asset-price bubbles.
10
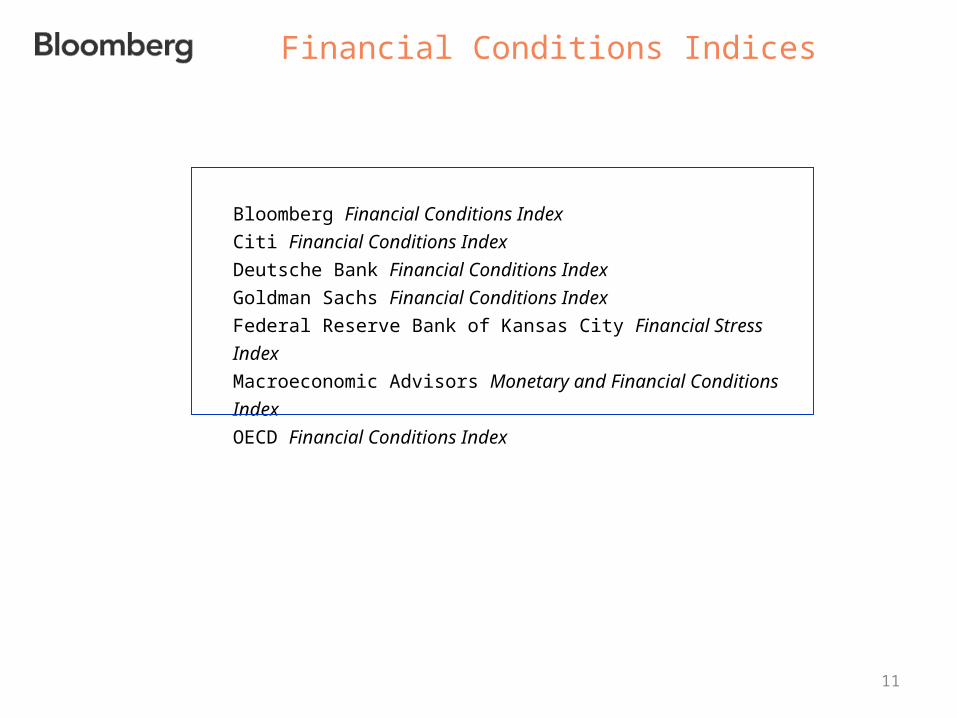
Financial Conditions Indices
11
Bloomberg Financial Conditions Index
Citi Financial Conditions Index
Deutsche Bank Financial Conditions Index
Goldman Sachs Financial Conditions Index
Federal Reserve Bank of Kansas City Financial Stress Index
Macroeconomic Advisors Monetary and Financial Conditions
Index
OECD Financial Conditions Index
12
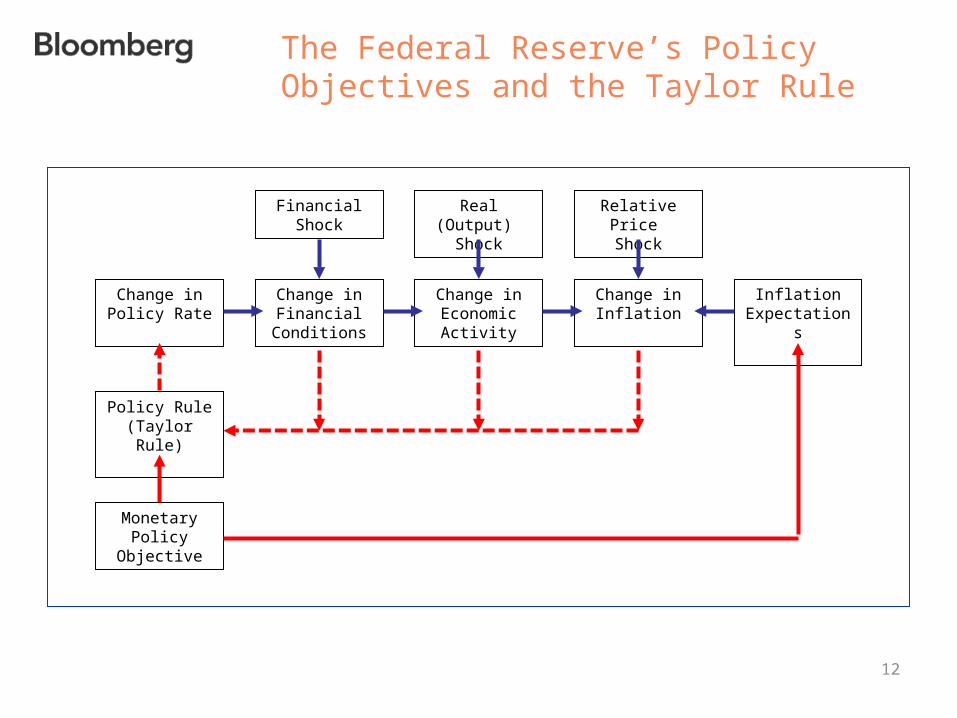
The Federal Reserve’s Policy Objectives and the Taylor Rule
Change inPolicy Rate
Change in Economic
Activity
Financial Shock
Change in Financial
Conditions
Real (Output) Shock
Relative Price Shock
Change in Inflation
Policy Rule(Taylor Rule)
Monetary Policy
Objective
InflationExpectations
13
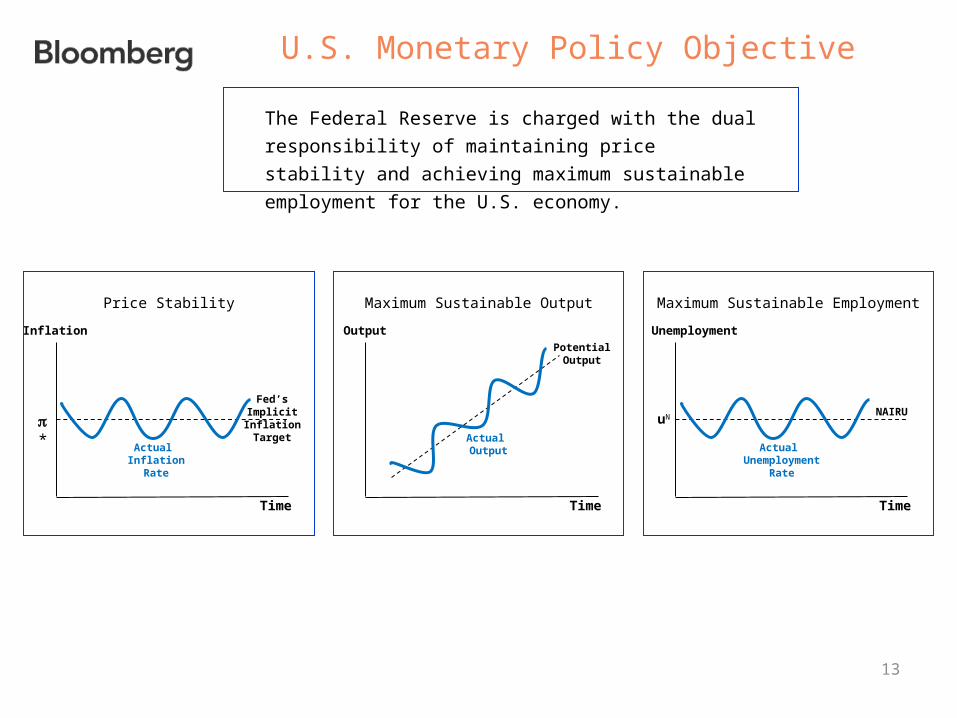
U.S. Monetary Policy Objective
The Federal Reserve is charged with the dual
responsibility of maintaining price stability and
achieving maximum sustainable employment for the
U.S. economy.
Fed’s ImplicitInflation Target
Inflation
Time
*
Actual Inflation
Rate
Price Stability
PotentialOutput
Output
Time
Actual Output
Maximum Sustainable Output
NAIRU
Unemployment
Time
uN
Actual Unemployment
Rate
Maximum Sustainable Employment
14
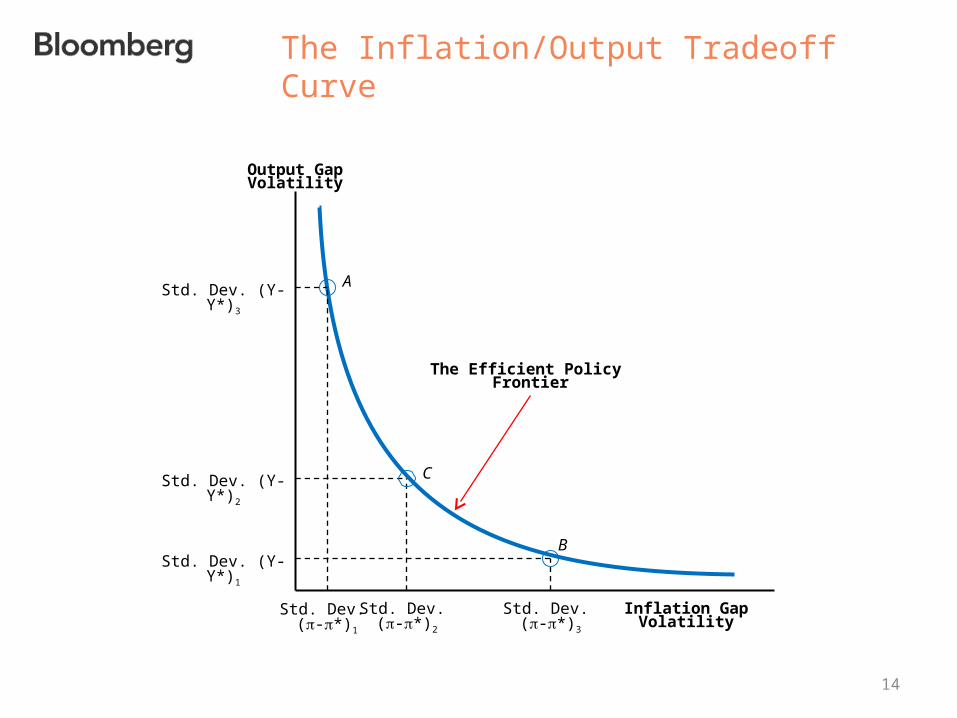
The Inflation/Output Tradeoff Curve
Output Gap Volatility
B
Std. Dev. (Y-Y*)3
Inflation GapVolatility
The Efficient Policy Frontier
A
CStd. Dev. (Y-Y*)2
Std. Dev. (Y-Y*)1
Std. Dev. (-*)3
Std. Dev. (-*)2
Std. Dev. (-*)1
15
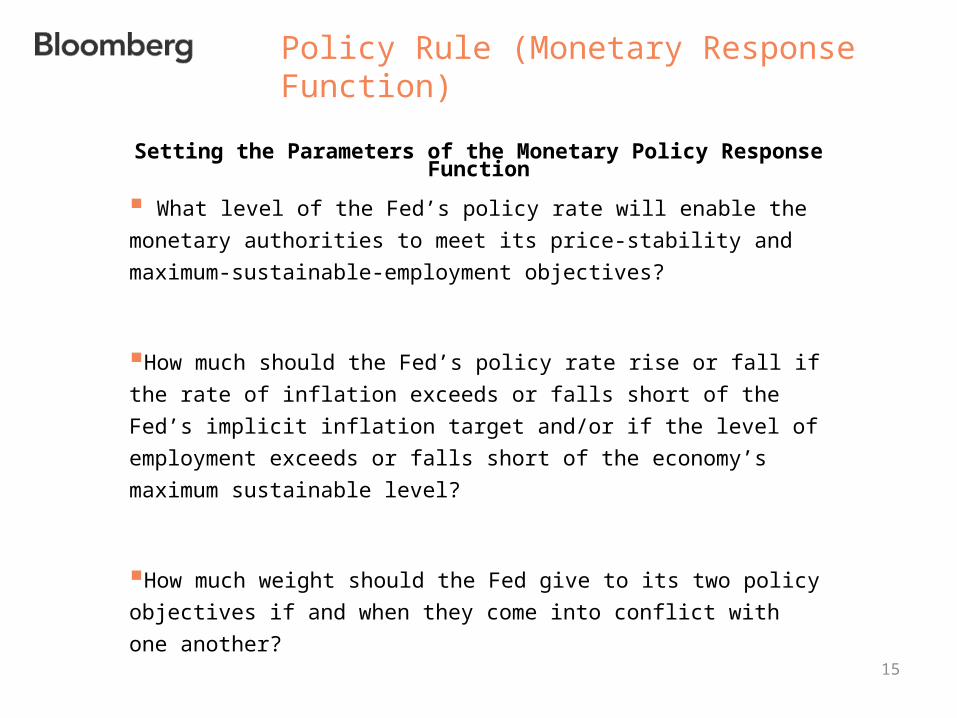
What level of the Fed’s policy rate will enable the monetary authorities
to meet its price-stability and maximum-sustainable-employment
objectives?
How much should the Fed’s policy rate rise or fall if the rate of inflation
exceeds or falls short of the Fed’s implicit inflation target and/or if the
level of employment exceeds or falls short of the economy’s maximum
sustainable level?
How much weight should the Fed give to its two policy objectives if and
when they come into conflict with one another?
Policy Rule (Monetary Response Function)
Setting the Parameters of the Monetary Policy Response Function
16
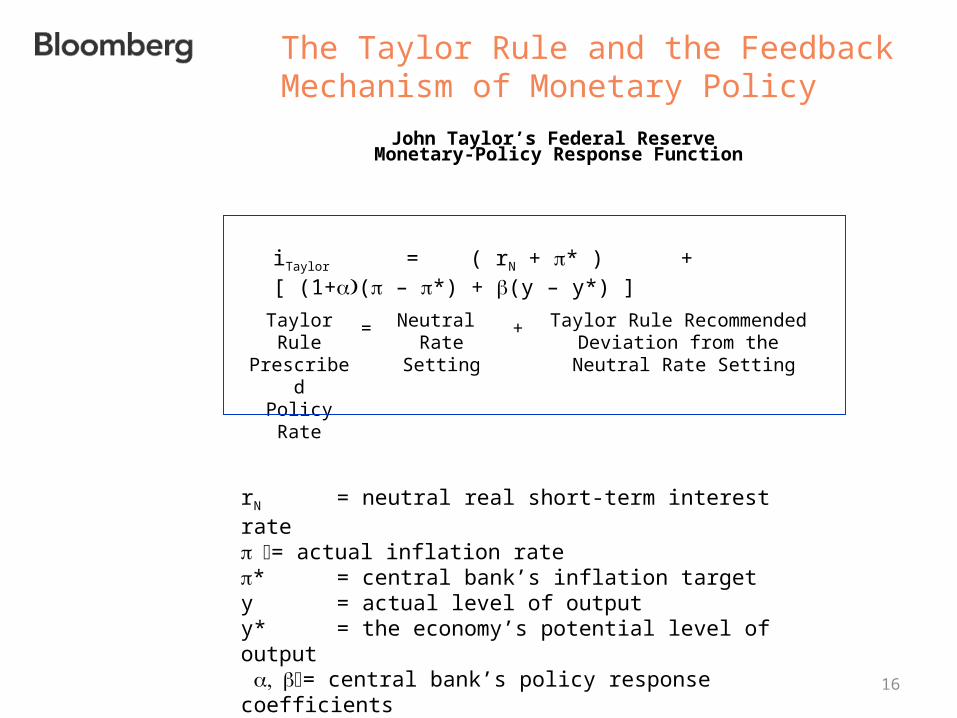
The Taylor Rule and the Feedback Mechanism of Monetary Policy
John Taylor’s Federal Reserve Monetary-Policy Response Function
Taylor Rule PrescribedPolicy Rate
Neutral Rate
Setting
iTaylor = ( rN + * ) + [ (1+( – *) + (y – y*) ]
Taylor Rule Recommended Deviation from the
Neutral Rate Setting
= +
rN = neutral real short-term interest rate= actual inflation rate* = central bank’s inflation targety = actual level of outputy* = the economy’s potential level of output = central bank’s policy response coefficients
17
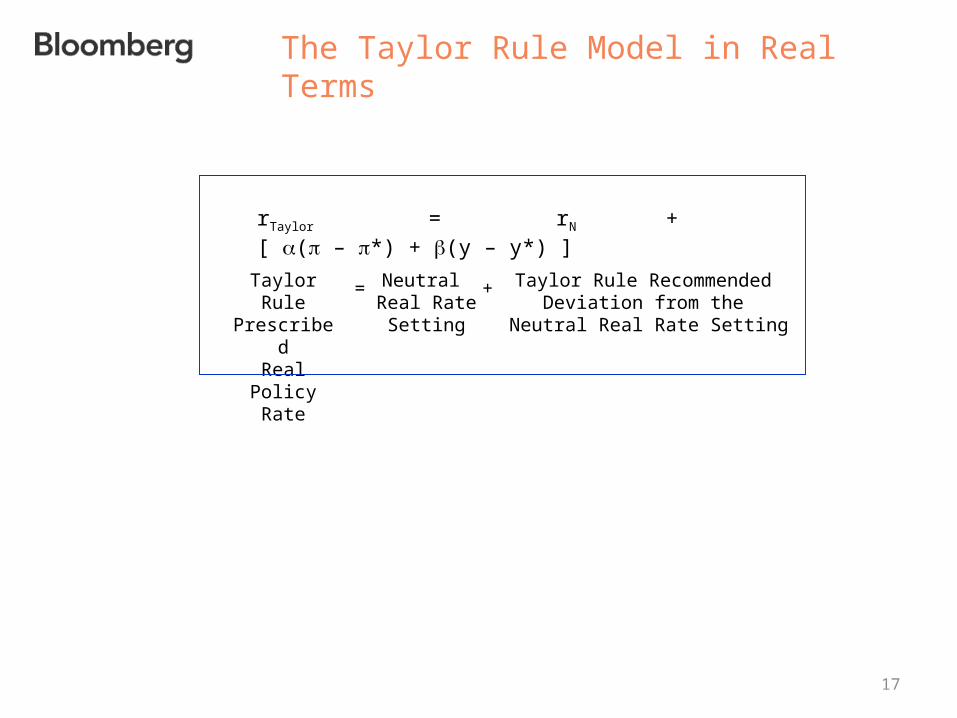
The Taylor Rule Model in Real Terms
Taylor Rule PrescribedReal Policy
Rate
Neutral Real Rate
Setting
rTaylor = rN + [ ( – *) + (y – y*) ]
Taylor Rule Recommended Deviation from the
Neutral Real Rate Setting
= +
18
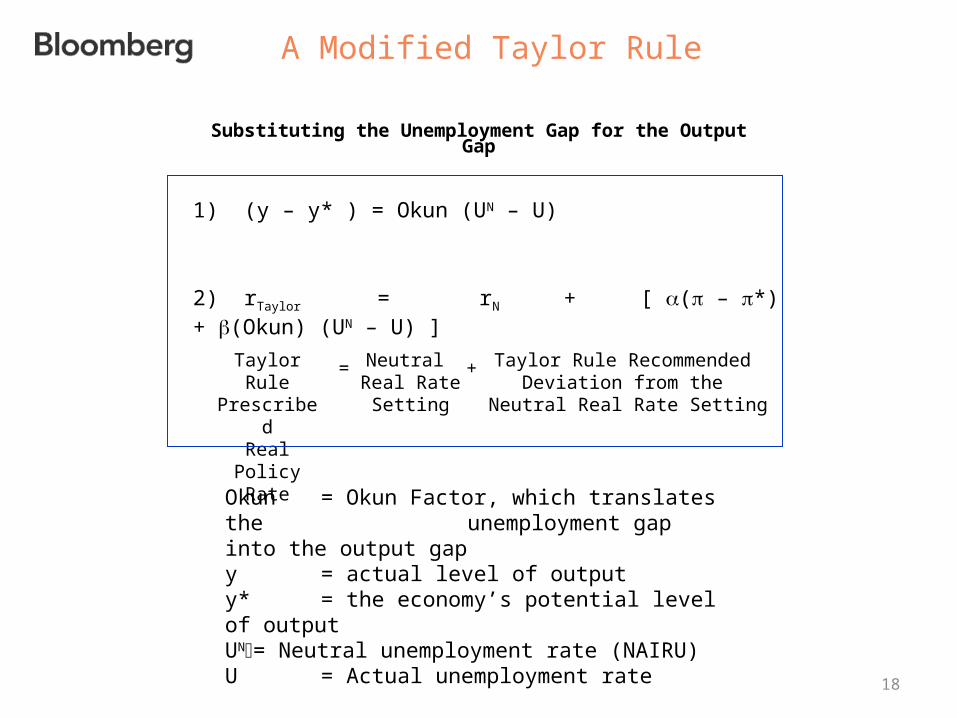
A Modified Taylor Rule
Substituting the Unemployment Gap for the Output Gap
Taylor Rule PrescribedReal Policy
Rate
Neutral Real Rate
Setting
2) rTaylor = rN + [ ( – *) + (Okun) (UN – U) ]
Taylor Rule Recommended Deviation from the
Neutral Real Rate Setting
= +
1) (y – y* ) = Okun (UN – U)
Okun = Okun Factor, which translates the unemployment gap into the output gap
y = actual level of outputy* = the economy’s potential level of outputUN= Neutral unemployment rate (NAIRU)U = Actual unemployment rate
19
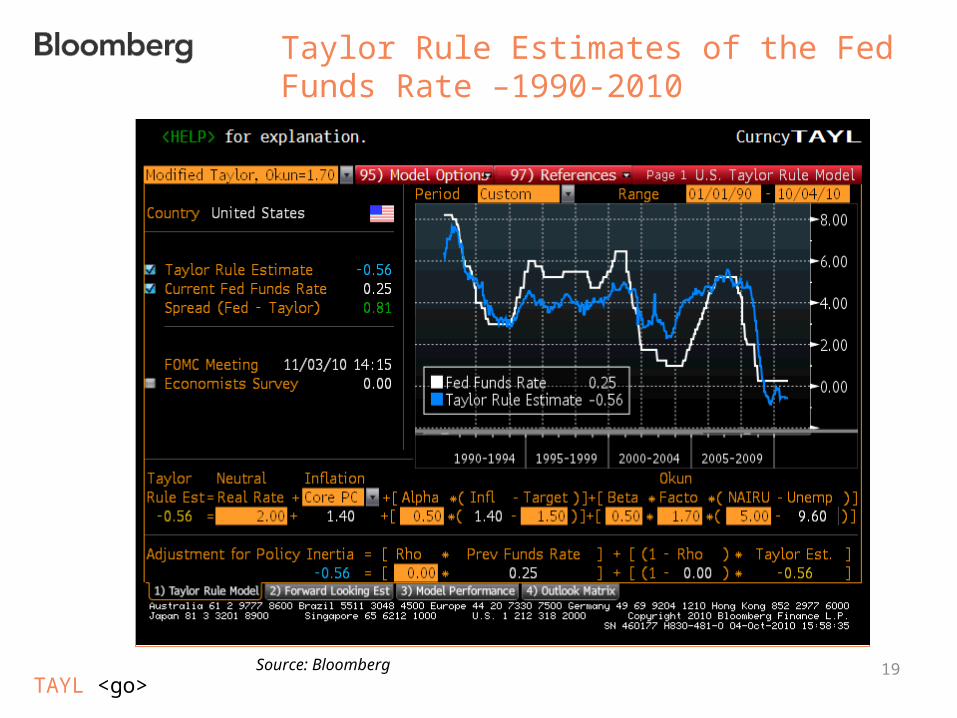
Taylor Rule Estimates of the Fed Funds Rate –1990-2010
TAYL <go>Source: Bloomberg
20
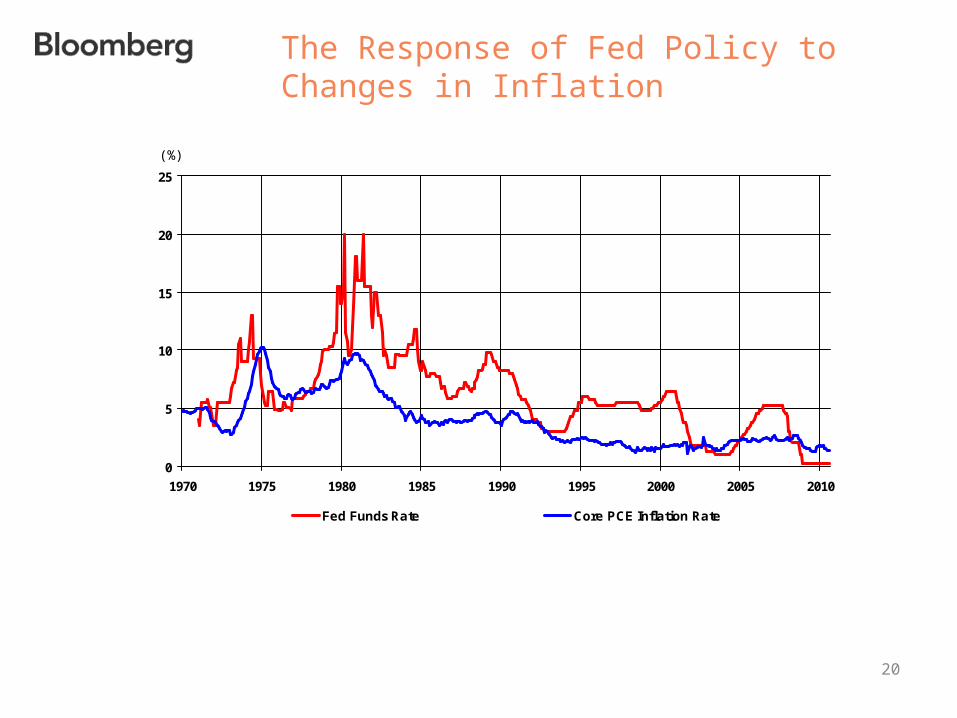
The Response of Fed Policy to Changes in Inflation
0
5
10
15
20
25
1970 1975 1980 1985 1990 1995 2000 2005 2010
Fed Funds Rate Core PCE Inflation Rate
(%)
21
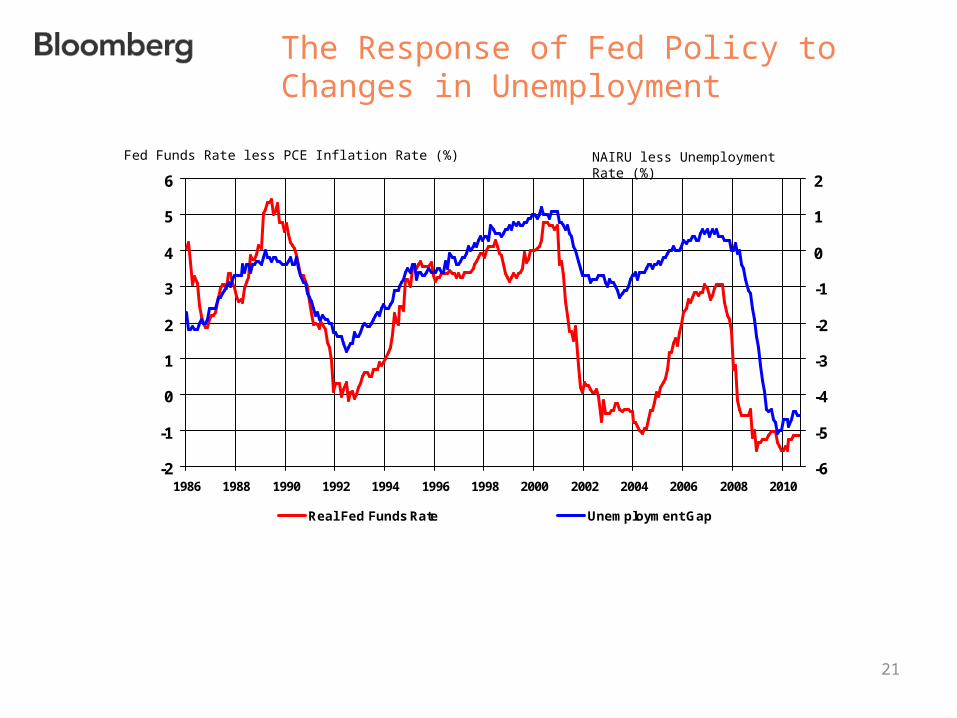
The Response of Fed Policy to Changes in Unemployment
-2
-1
0
1
2
3
4
5
6
1986 1988 1990 1992 1994 1996 1998 2000 2002 2004 2006 2008 2010-6
-5
-4
-3
-2
-1
0
1
2
Real Fed Funds Rate Unemployment Gap
Fed Funds Rate less PCE Inflation Rate (%) NAIRU less Unemployment Rate (%)
22
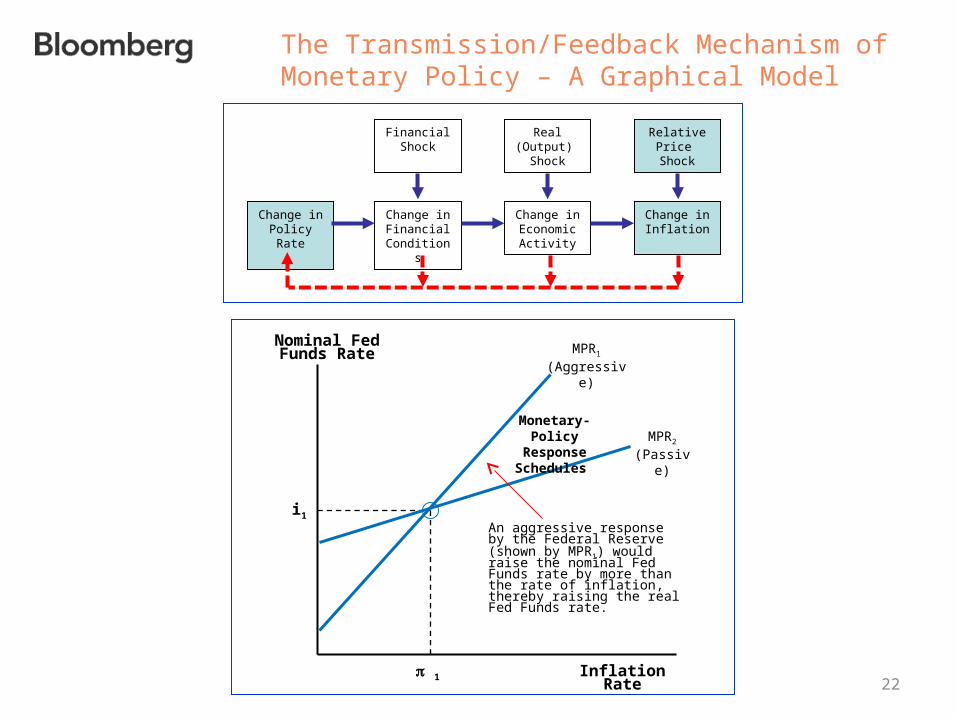
The Transmission/Feedback Mechanism of Monetary Policy – A Graphical Model
Change inPolicy Rate
Change in Economic
Activity
Financial Shock
Change in Financial
Conditions
Real (Output)
Shock
Relative Price Shock
Change in Inflation
Nominal Fed Funds Rate
Inflation Rate
An aggressive response by the Federal Reserve (shown by MPR1) would raise the nominal Fed Funds rate by more than the rate of inflation, thereby raising the real Fed Funds rate.
i1
1
MPR1
(Aggressive)
Monetary-Policy Response Schedules
MPR2
(Passive)
23
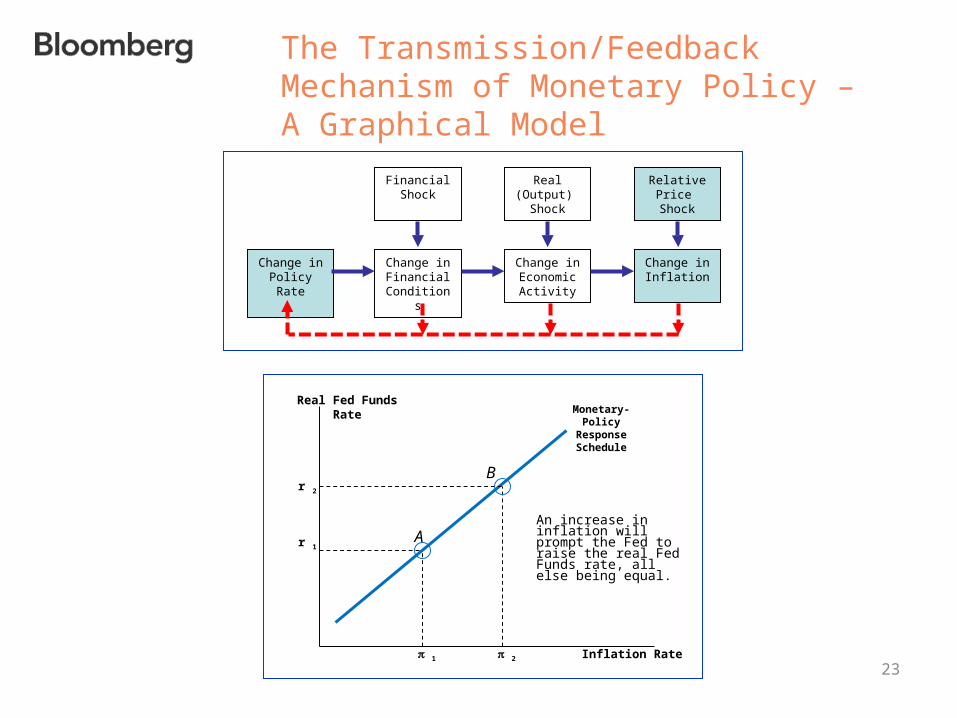
The Transmission/Feedback Mechanism of Monetary Policy – A Graphical Model
Change inPolicy Rate
Change in Economic
Activity
Financial Shock
Change in Financial
Conditions
Real (Output)
Shock
Relative Price Shock
Change in Inflation
Monetary-Policy Response Schedule
Real Fed Funds Rate
Inflation Rate 1 2
r 1
r 2
An increase in inflation will prompt the Fed to raise the real Fed Funds rate, all else being equal.
B
A
24
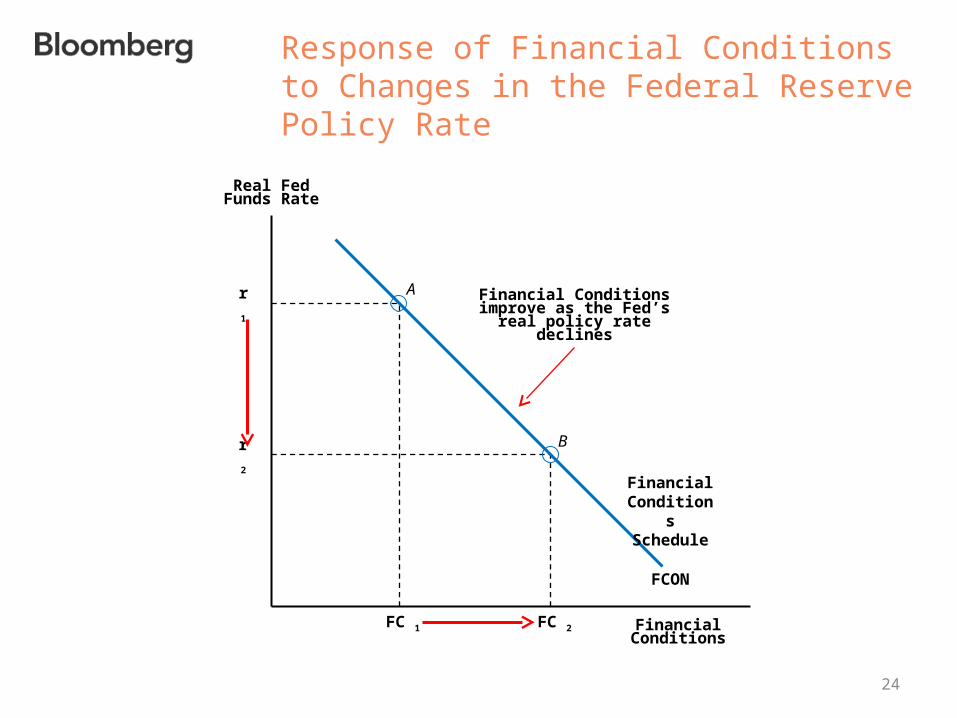
Response of Financial Conditions to Changes in the Federal Reserve Policy Rate
Real Fed Funds Rate
B
Financial Conditions
Financial Conditions improve as the Fed’s real
policy rate declines
Ar 1
r 2
FC 1 FC 2
FCON
Financial Conditions Schedule
25
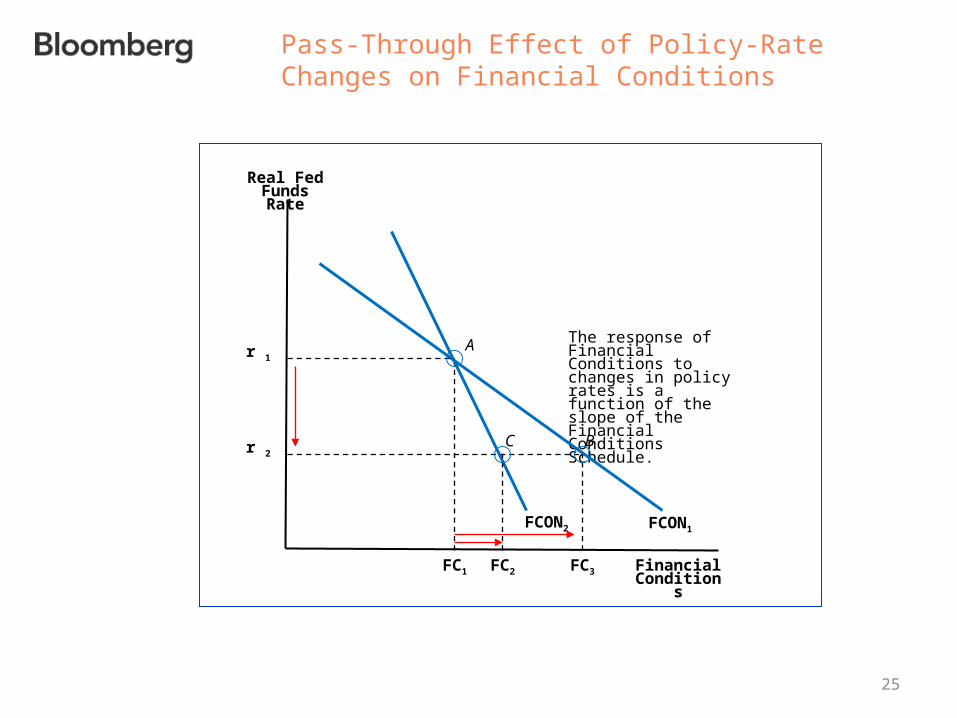
Pass-Through Effect of Policy-Rate Changes on Financial Conditions
Real Fed Funds Rate
B
Financial Conditions
The response of Financial Conditions to changes in policy rates is a function of the slope of the Financial Conditions Schedule.
A
FC1
r 2
FCON1
FC2
C
FCON2
r 1
FC3
26
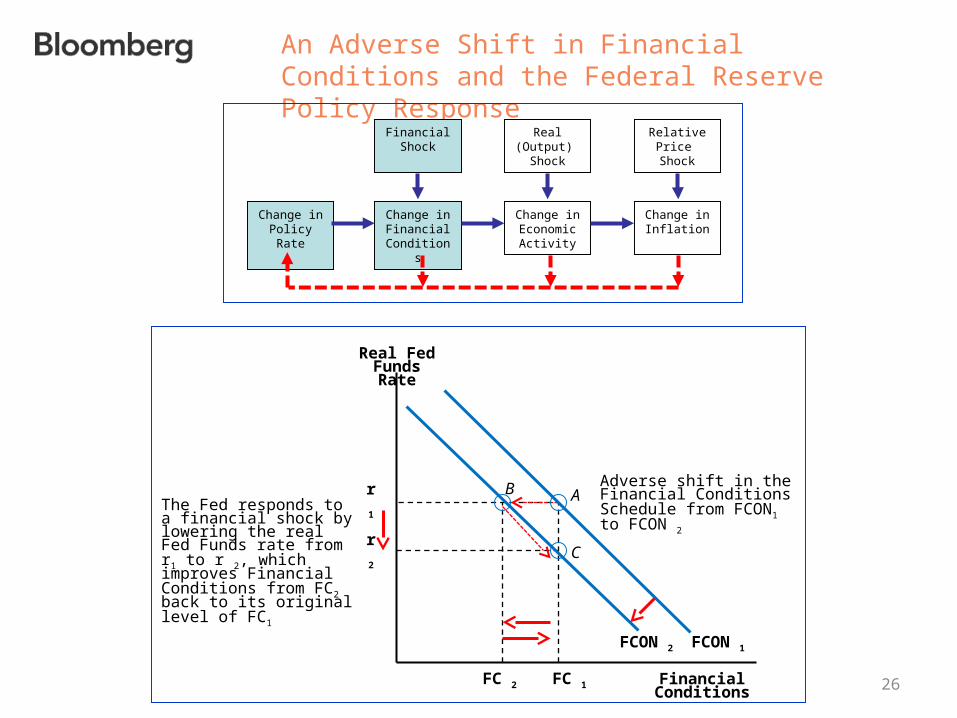
An Adverse Shift in Financial Conditions and the Federal Reserve Policy Response
Change inPolicy Rate
Change in Economic
Activity
Financial Shock
Change in Financial
Conditions
Real (Output)
Shock
Relative Price Shock
Change in Inflation
Real Fed Funds Rate
B
Financial Conditions
Adverse shift in the Financial Conditions Schedule from FCON1 to FCON 2
Ar 1
r 2
FC 1FC 2
C
The Fed responds to a financial shock by lowering the real Fed Funds rate from r1 to r 2, which improves Financial Conditions from FC2 back to its original level of FC1
FCON 1FCON 2
27
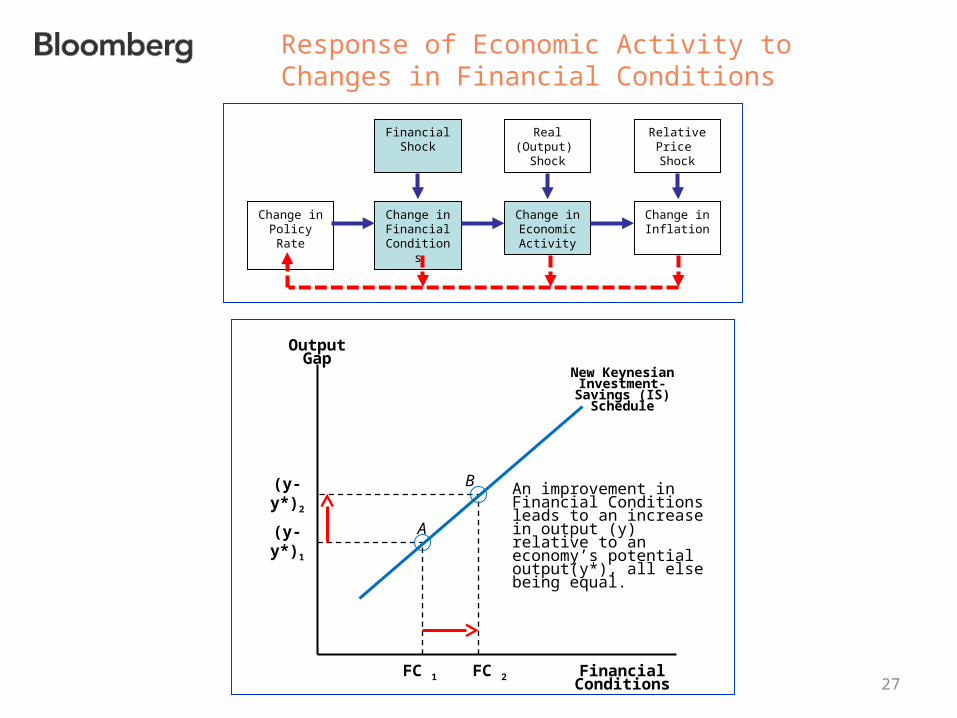
Response of Economic Activity to Changes in Financial Conditions
Change inPolicy Rate
Change in Economic
Activity
Financial Shock
Change in Financial
Conditions
Real (Output)
Shock
Relative Price Shock
Change in Inflation
Output Gap
B
Financial Conditions
An improvement in Financial Conditions leads to an increase in output (y) relative to an economy’s potential output(y*), all else being equal.
A(y-y*)1
FC 2FC 1
New Keynesian Investment-Savings (IS)
Schedule
(y-y*)2
28
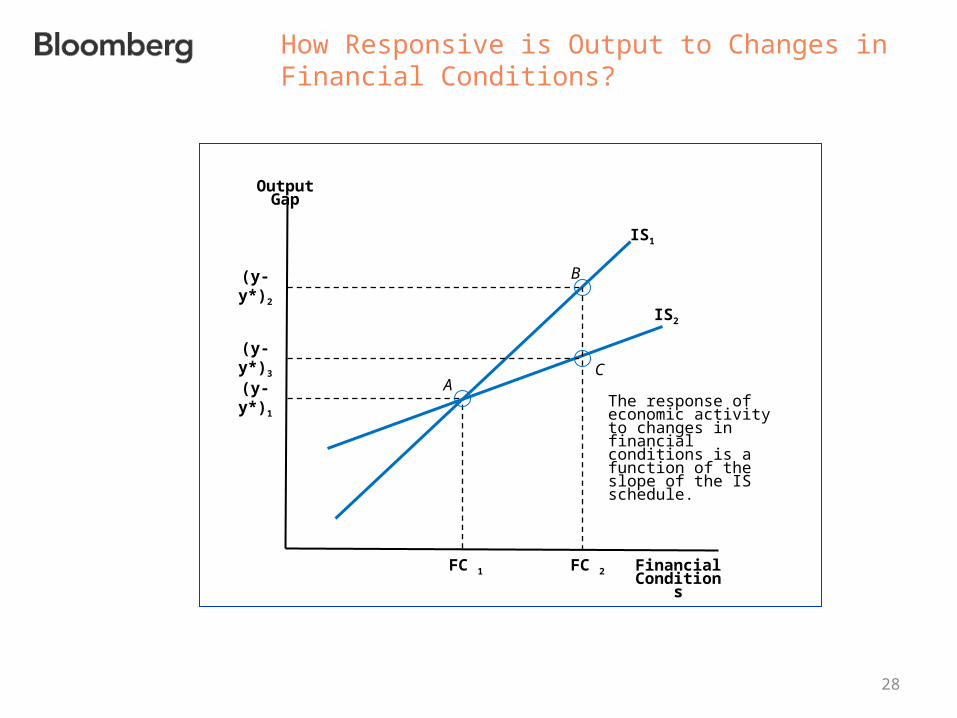
How Responsive is Output to Changes in Financial Conditions?
Output Gap
B
Financial Conditions
The response of economic activity to changes in financial conditions is a function of the slope of the IS schedule.
A(y-y*)1
FC 2FC 1
IS1
(y-y*)2
C(y-y*)3
IS2
29
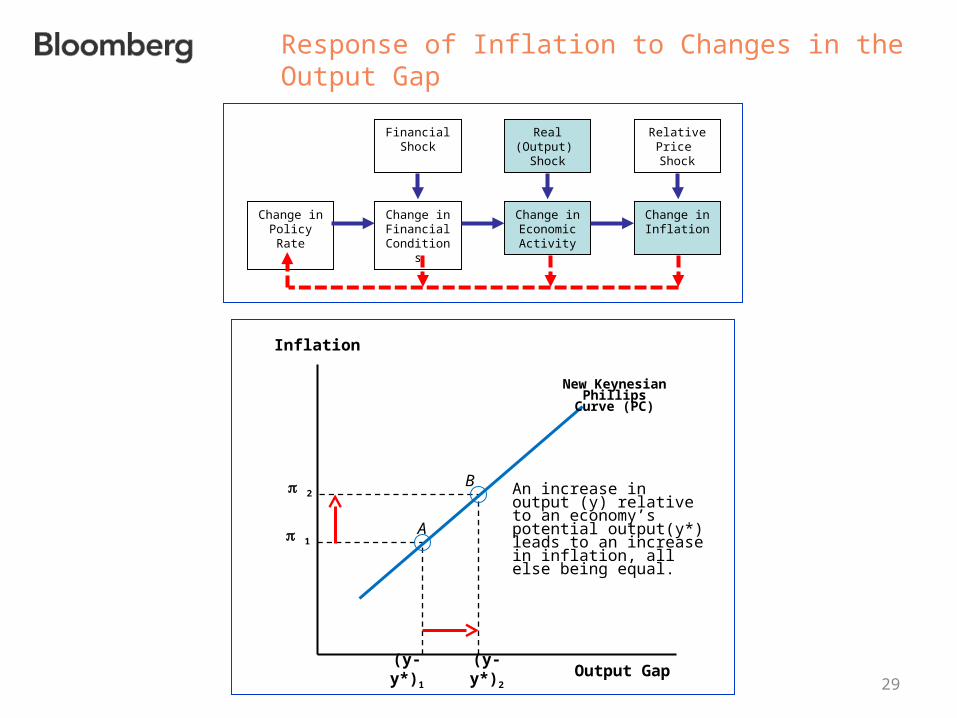
Response of Inflation to Changes in the Output Gap
Change inPolicy Rate
Change in Economic
Activity
Financial Shock
Change in Financial
Conditions
Real (Output)
Shock
Relative Price Shock
Change in Inflation
Inflation
B
Output Gap
An increase in output (y) relative to an economy’s potential output(y*) leads to an increase in inflation, all else being equal.
A
(y-y*)1
2
1
New Keynesian Phillips Curve
(PC)
(y-y*)2
30
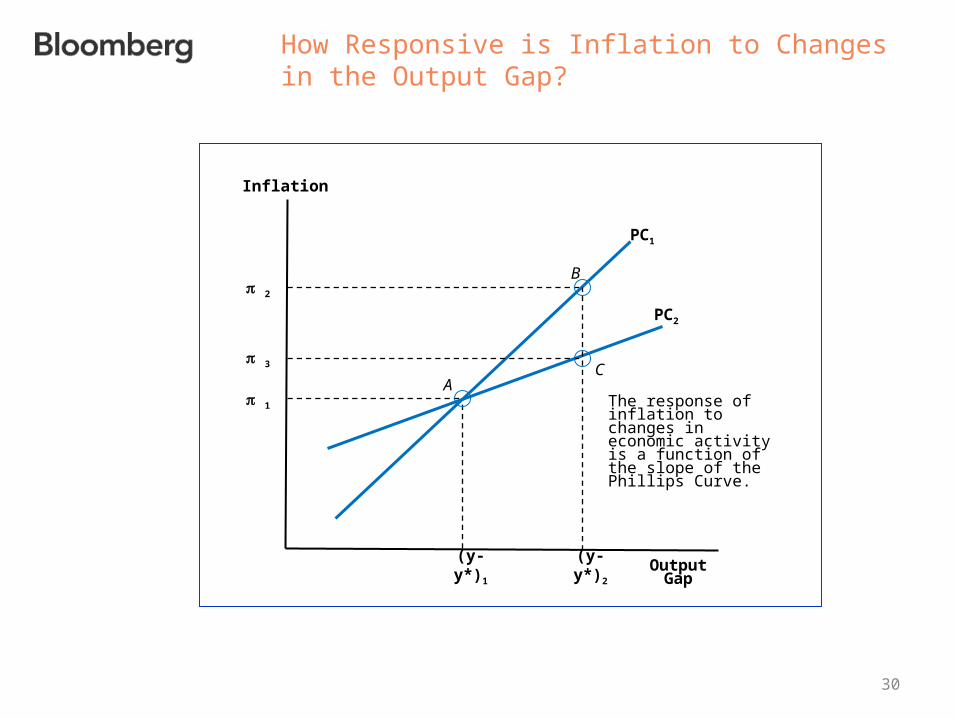
How Responsive is Inflation to Changes in the Output Gap?
Inflation
B
Output Gap
The response of inflation to changes in economic activity is a function of the slope of the Phillips Curve.
A
(y-y*)1
2
PC1
(y-y*)2
C
PC2
1
3
31
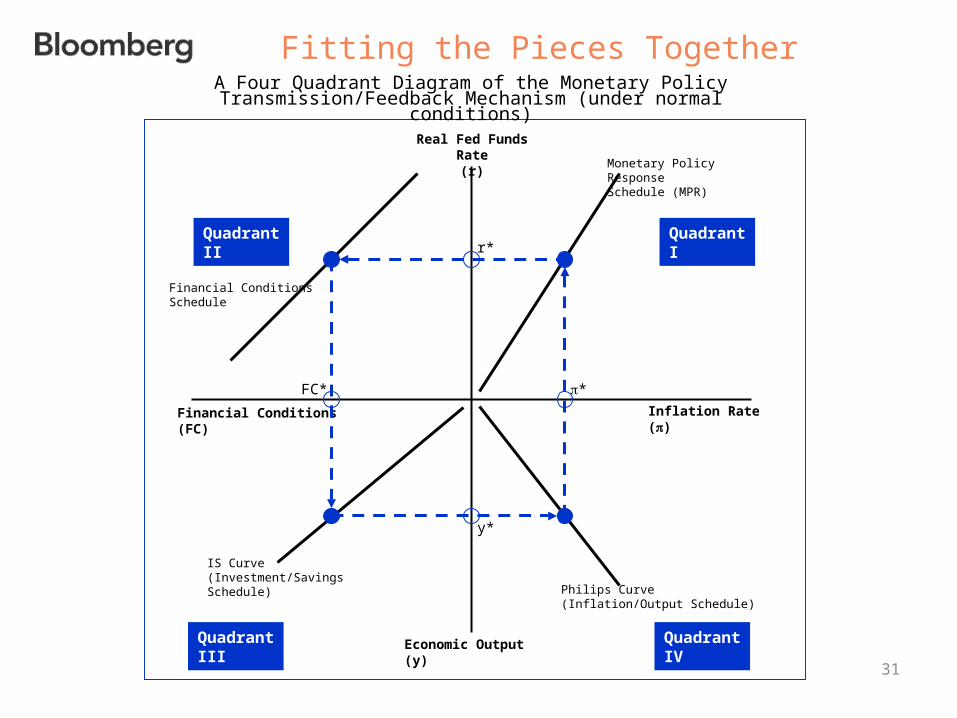
Real Fed Funds Rate(r)
Economic Output (y)
Financial Conditions(FC)
Inflation Rate ()
Monetary Policy ResponseSchedule (MPR)
Philips Curve(Inflation/Output Schedule)
IS Curve (Investment/Savings Schedule)
Financial Conditions Schedule
r*
y*
FC* *
QuadrantI
QuadrantIV
QuadrantII
QuadrantIII
Fitting the Pieces TogetherA Four Quadrant Diagram of the Monetary Policy
Transmission/Feedback Mechanism (under normal conditions)
32
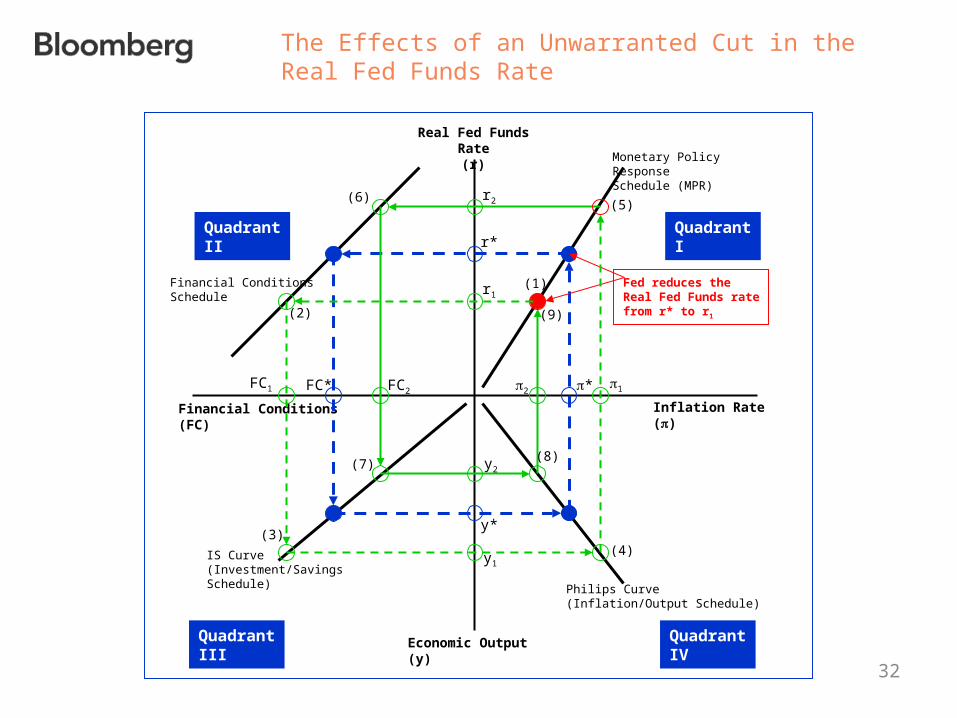
The Effects of an Unwarranted Cut in the Real Fed Funds Rate
Real Fed Funds Rate(r)
Economic Output (y)
Financial Conditions(FC)
Inflation Rate ()
Monetary Policy ResponseSchedule (MPR)
Philips Curve(Inflation/Output Schedule)
IS Curve (Investment/Savings Schedule)
Financial Conditions Schedule
r*
y*
FC* *
QuadrantI
QuadrantIV
QuadrantII
QuadrantIII
Fed reduces the Real Fed Funds ratefrom r* to r1
r1
21FC2
FC1
y2
y1
r2
(1)
(2)
(3)(4)
(5)(6)
(7)(8)
(9)
33
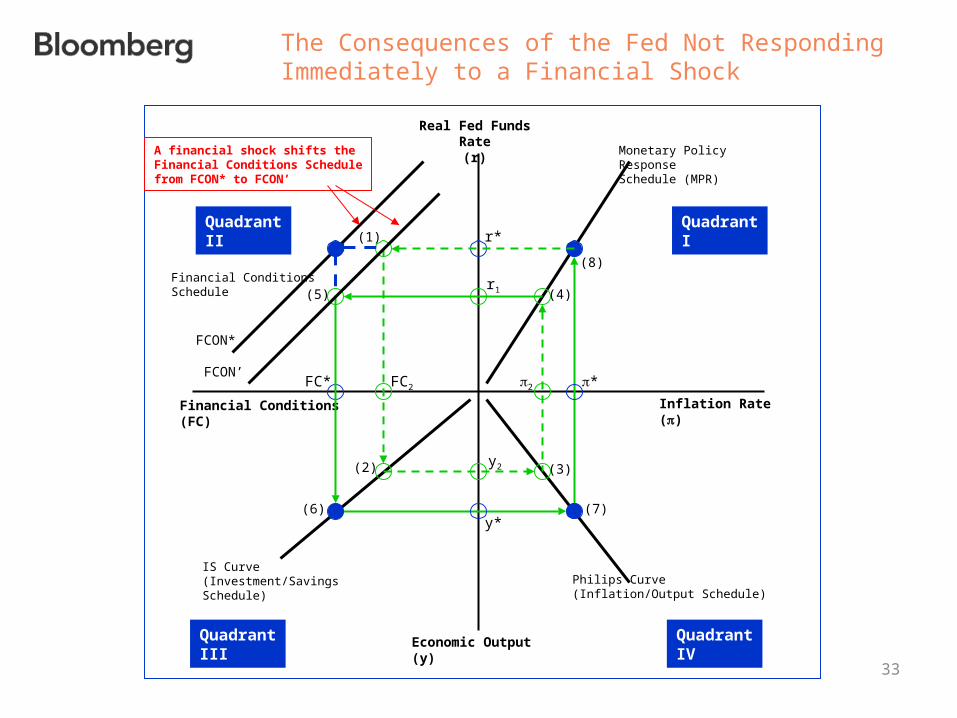
The Consequences of the Fed Not Responding Immediately to a Financial Shock
Real Fed Funds Rate(r)
Economic Output (y)
Financial Conditions(FC)
Inflation Rate ()
Monetary Policy ResponseSchedule (MPR)
Philips Curve(Inflation/Output Schedule)
IS Curve (Investment/Savings Schedule)
Financial Conditions Schedule
r*
y*
FC* *
QuadrantI
QuadrantIV
QuadrantII
QuadrantIII
r1
2FC2
y2
A financial shock shifts the Financial Conditions Schedulefrom FCON* to FCON’
FCON*
FCON’
(1)
(2) (3)
(4)(5)
(6) (7)
(8)
34
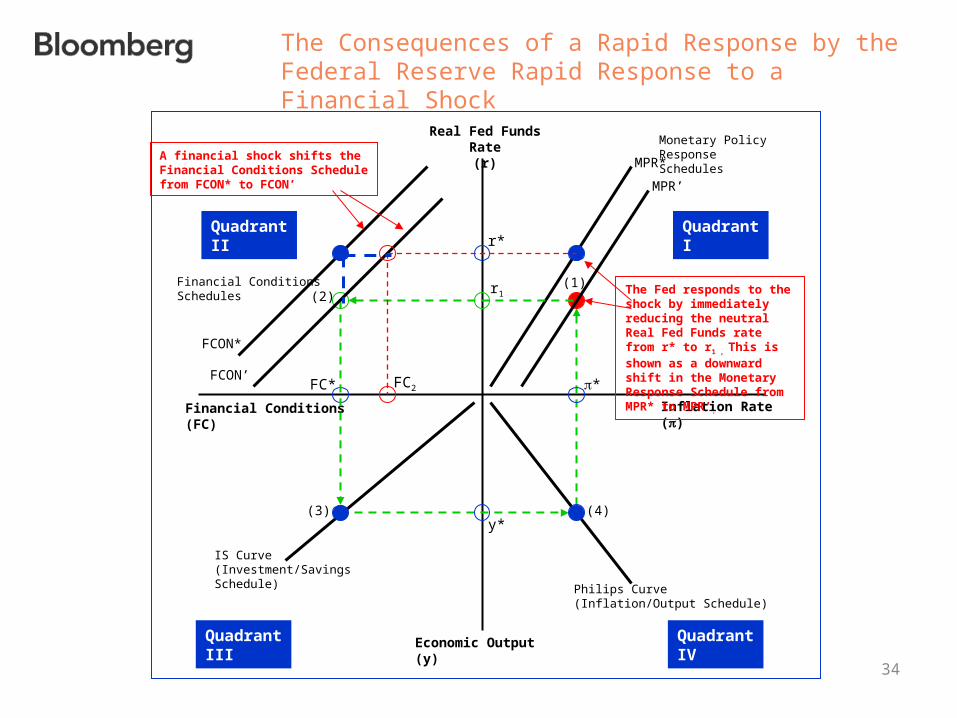
The Consequences of a Rapid Response by the Federal Reserve Rapid Response to a Financial Shock
Real Fed Funds Rate(r)
Economic Output (y)
Financial Conditions(FC)
Inflation Rate ()
Monetary Policy ResponseSchedules
Philips Curve(Inflation/Output Schedule)
IS Curve (Investment/Savings Schedule)
Financial Conditions Schedules
r*
y*
FC* *
QuadrantI
QuadrantIV
QuadrantII
QuadrantIII
r1
A financial shock shifts the Financial Conditions Schedulefrom FCON* to FCON’
FCON*
FCON’
The Fed responds to the shock by immediately reducing the neutral Real Fed Funds rate from r* to r1 , This is shown as a downward shift in the Monetary Response Schedule from MPR* to MPR’.
MPR*
MPR’
(1)(2)
(3) (4)
FC2
35
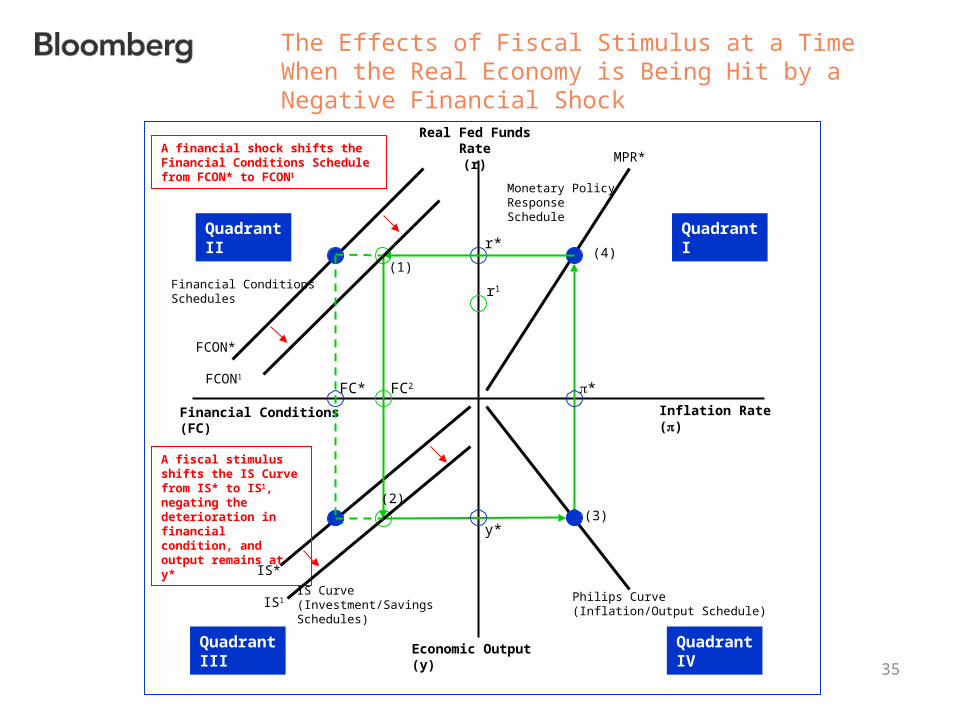
The Effects of Fiscal Stimulus at a Time When the Real Economy is Being Hit by a Negative Financial Shock
Real Fed Funds Rate(r)
Economic Output (y)
Financial Conditions(FC)
Inflation Rate ()
Monetary Policy ResponseSchedule
Philips Curve(Inflation/Output Schedule)
IS Curve (Investment/Savings Schedules)
Financial Conditions Schedules
r*
y*
FC* *
QuadrantI
QuadrantIV
QuadrantII
QuadrantIII
r1
FC2
A financial shock shifts the Financial Conditions Schedulefrom FCON* to FCON1
FCON*
FCON1
(2)
(1)
(3)
A fiscal stimulus shifts the IS Curve from IS* to IS1, negating the deterioration in financial condition, and output remains at y*
MPR*
(4)
IS*
IS1
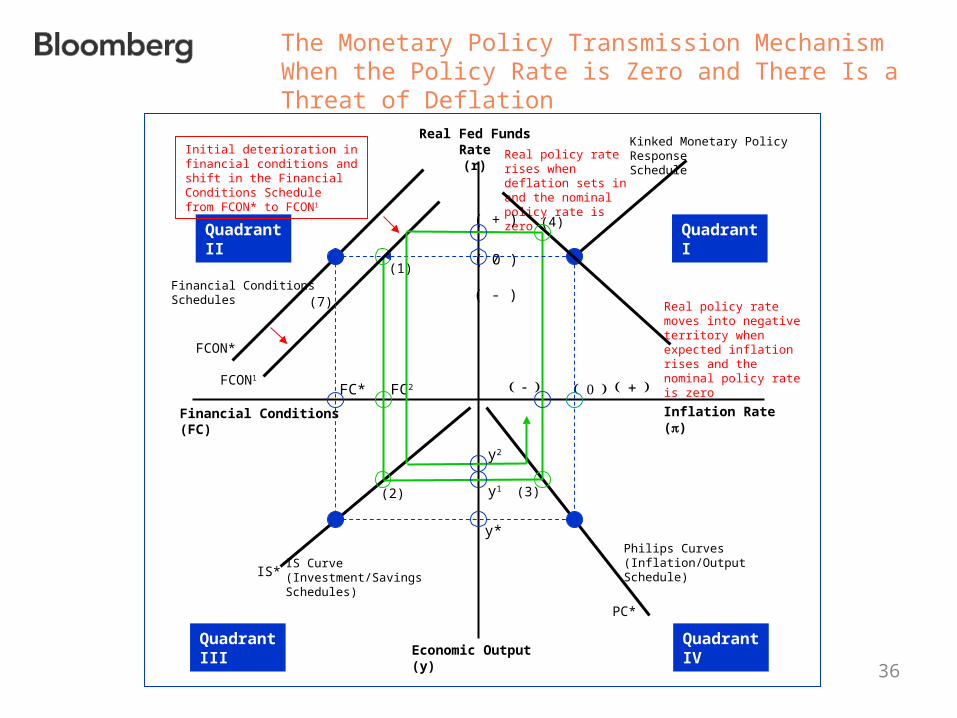
36
The Monetary Policy Transmission Mechanism When the Policy Rate is Zero and There Is a Threat of Deflation
Real Fed Funds Rate(r)
Economic Output (y)
Financial Conditions(FC)
Inflation Rate ()
Kinked Monetary Policy ResponseSchedule
Philips Curves(Inflation/Output Schedule)
IS Curve (Investment/Savings Schedules)
Financial Conditions Schedules
( 0 )
y*
FC*
QuadrantI
QuadrantIV
QuadrantII
QuadrantIII
( - )
FC2
Initial deterioration in financial conditions and shift in the Financial Conditions Schedulefrom FCON* to FCON1
FCON*
FCON1
(2)
(1)
(3)
(4)
IS*
Real policy rate rises when deflation sets in and the nominal policy rate is zero
PC*
Real policy rate moves into negative territory when expected inflation rises and the nominal policy rate is zero
(7)
( + )
.
y2
y1
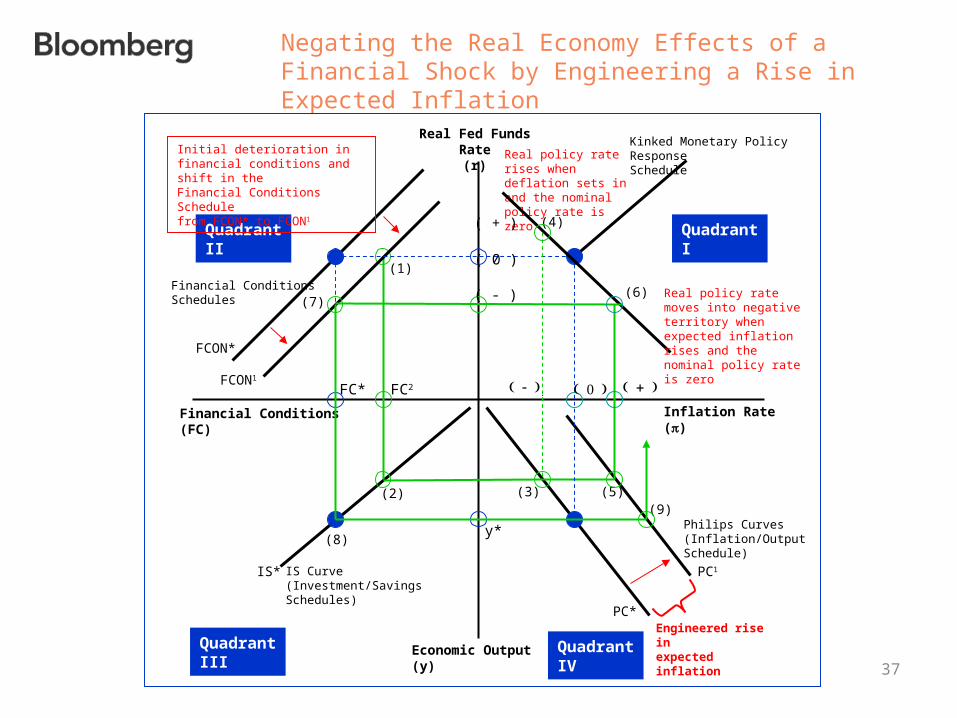
37
Negating the Real Economy Effects of a Financial Shock by Engineering a Rise in Expected Inflation
Real Fed Funds Rate(r)
Economic Output (y)
Financial Conditions(FC)
Inflation Rate ()
Kinked Monetary Policy ResponseSchedule
Philips Curves(Inflation/Output Schedule)
IS Curve (Investment/Savings Schedules)
Financial Conditions Schedules
y*
FC*
QuadrantI
QuadrantIV
QuadrantII
QuadrantIII
FC2
Initial deterioration in financial conditions and shift in the Financial Conditions Schedulefrom FCON* to FCON1
FCON*
FCON1
(2)
(1)
(3)
IS*
Real policy rate rises when deflation sets in and the nominal policy rate is zero
PC*
PC1
Engineered rise inexpected inflation
Real policy rate moves into negative territory when expected inflation rises and the nominal policy rate is zero
(5)
(6)(7)
(8)
(9)
( 0 )
( - )
( + )
.
(4)
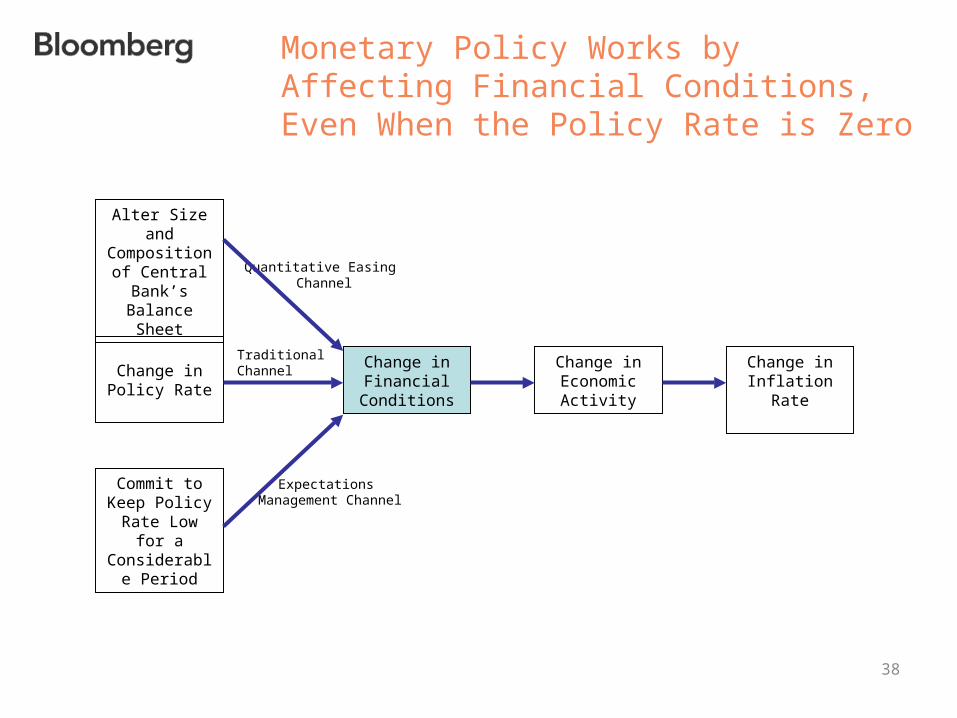
38
Monetary Policy Works by Affecting Financial Conditions, Even When the Policy Rate is Zero
Change inPolicy Rate
Change in Economic
Activity
Alter Size and Composition of Central Bank’s Balance Sheet
Change in Financial
Conditions
Commit to Keep Policy
Rate Low for a Considerable
Period
Change in Inflation Rate
Quantitative Easing Channel
Expectations Management Channel
Traditional Channel
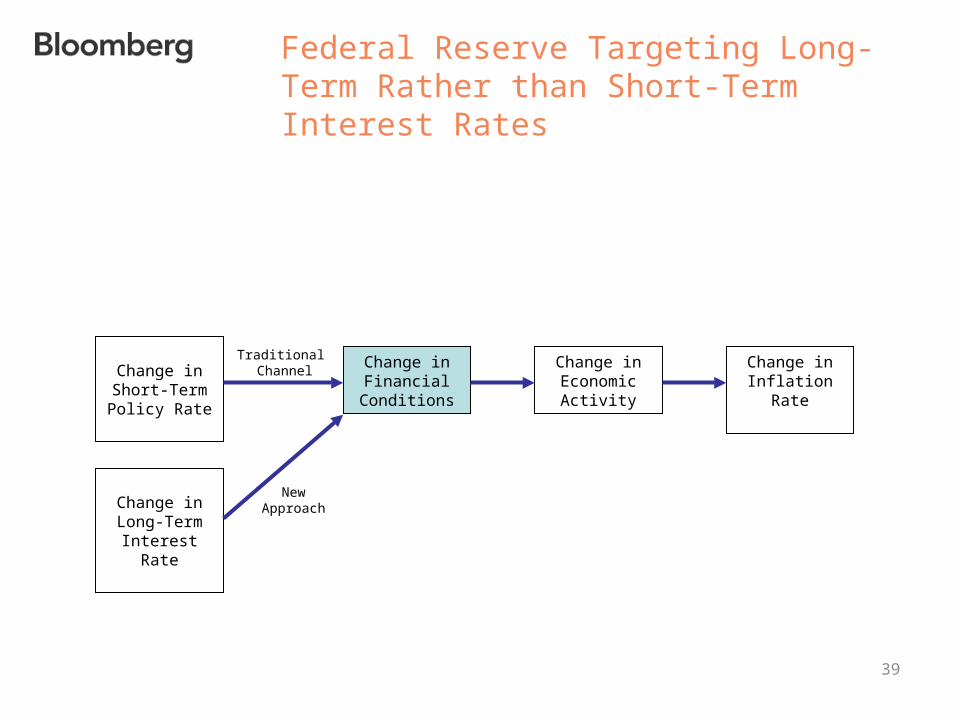
39
Federal Reserve Targeting Long-Term Rather than Short-Term Interest Rates
Change inShort-Term Policy Rate
Change in Economic
Activity
Change in Financial
Conditions
Change in Long-Term
Interest Rate
Change in Inflation Rate
NewApproach
Traditional Channel
40
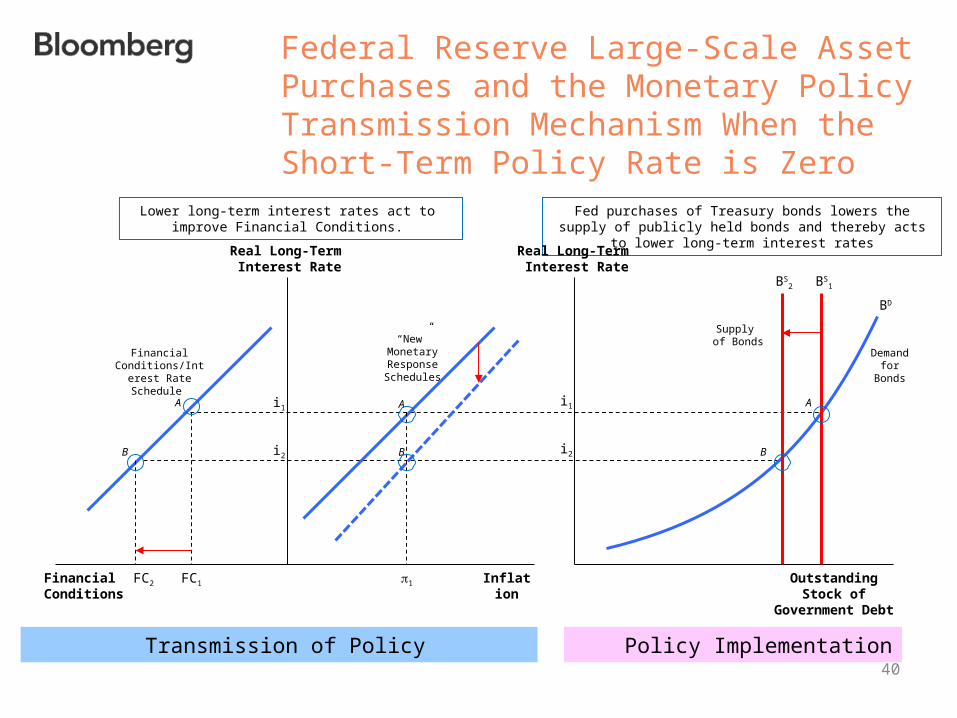
Federal Reserve Large-Scale Asset Purchases and the Monetary Policy Transmission Mechanism When the Short-Term Policy Rate is Zero
Transmission of Policy Policy Implementation
Real Long-Term Interest Rate
Financial Conditions
i1
i2
Outstanding Stock of Government Debt
BS2
Supply of Bonds
FC2 FC1
Fed purchases of Treasury bonds lowers the supply of publicly held bonds and thereby acts to lower long-term interest rates
Lower long-term interest rates act to improve Financial Conditions.
Financial Conditions/Interest
Rate Schedule
“New” Monetary Response Schedules
Real Long-Term Interest Rate
Inflation
i1
i2
1
BS1
Demand for Bonds
BD
A
B
A
B
A
B
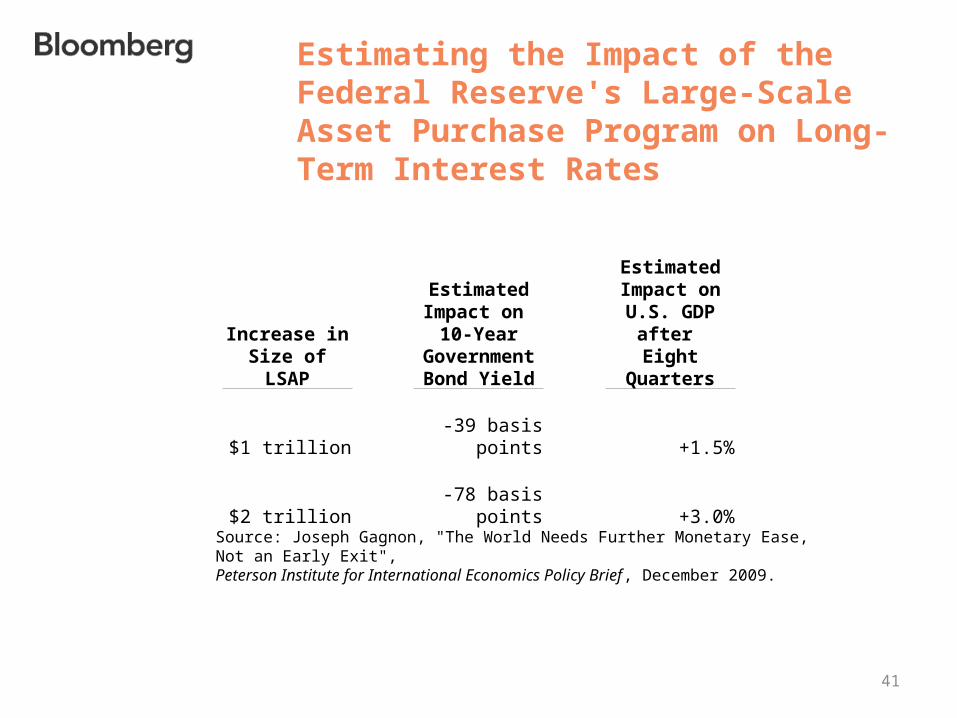
Estimating the Impact of the Federal Reserve's Large-Scale Asset Purchase Program on Long-Term Interest Rates
41
Increase in Size of LSAP
Estimated Impact on
10-Year Government Bond Yield
Estimated Impact on U.S.
GDP after Eight Quarters
$1 trillion -39 basis points +1.5%
$2 trillion -78 basis points +3.0%
Source: Joseph Gagnon, "The World Needs Further Monetary Ease, Not an Early Exit", Peterson Institute for International Economics Policy Brief, December 2009.
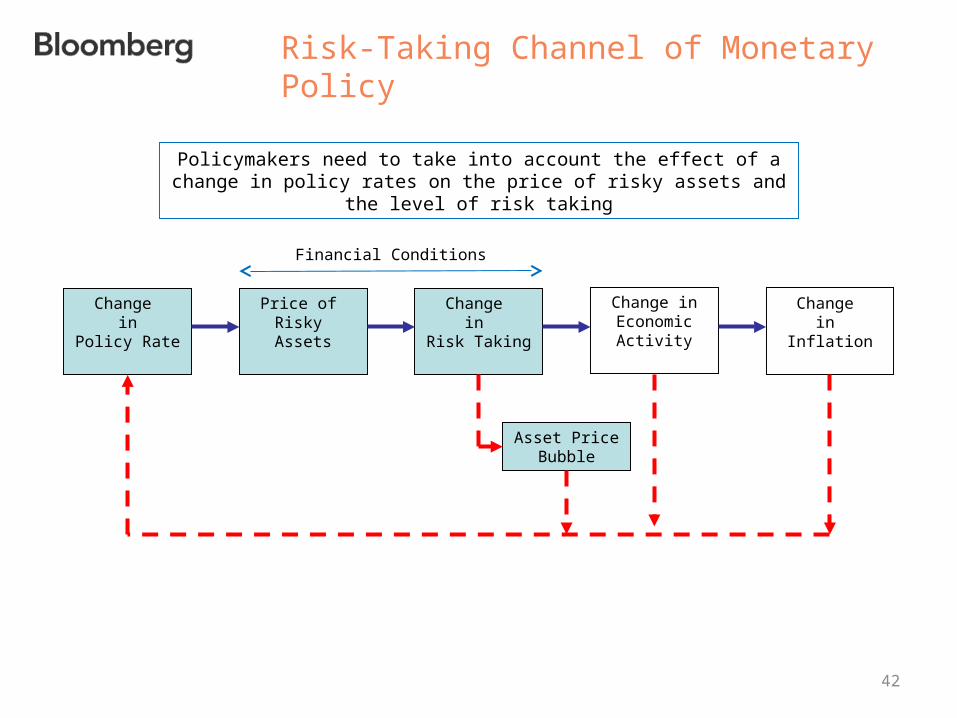
Risk-Taking Channel of Monetary Policy
Change in
Policy Rate
Change in
Risk Taking
Financial Conditions
Price of Risky Assets
Asset Price Bubble
Change in Economic
Activity
Change in
Inflation
42
Policymakers need to take into account the effect of a change in policy rates on the price of risky assets and the level of risk taking
43
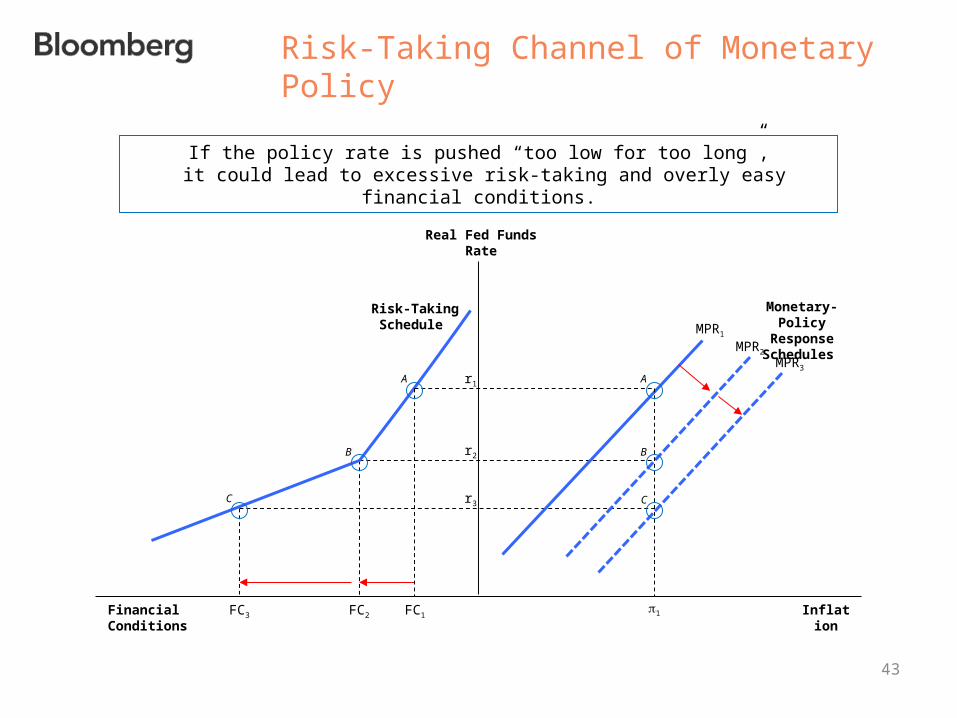
Risk-Taking Channel of Monetary Policy
Real Fed Funds Rate
Financial Conditions
r1
r2
FC2 FC1
If the policy rate is pushed “too low for too long”, it could lead to excessive risk-taking and overly easy financial conditions.
Risk-Taking Schedule
Inflation1
MPR1
Monetary-Policy Response Schedules
r3
FC3
MPR2
MPR3
A
B B
A
CC
Monetary Policy and Risk Taking (1-2)
44
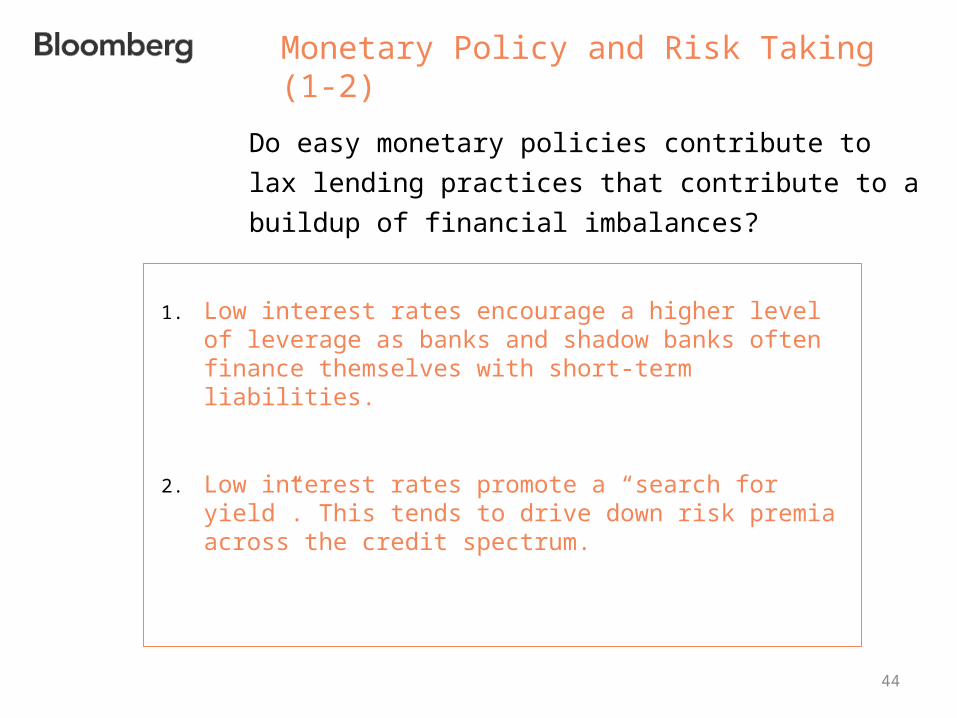
Do easy monetary policies contribute to lax lending
practices that contribute to a buildup of financial
imbalances?
1. Low interest rates encourage a higher level of leverage as banks and shadow banks often finance themselves with short-term liabilities.
2. Low interest rates promote a “search for yield”. This tends to drive down risk premia across the credit spectrum.
Monetary Policy and Risk Taking (3-4)
45
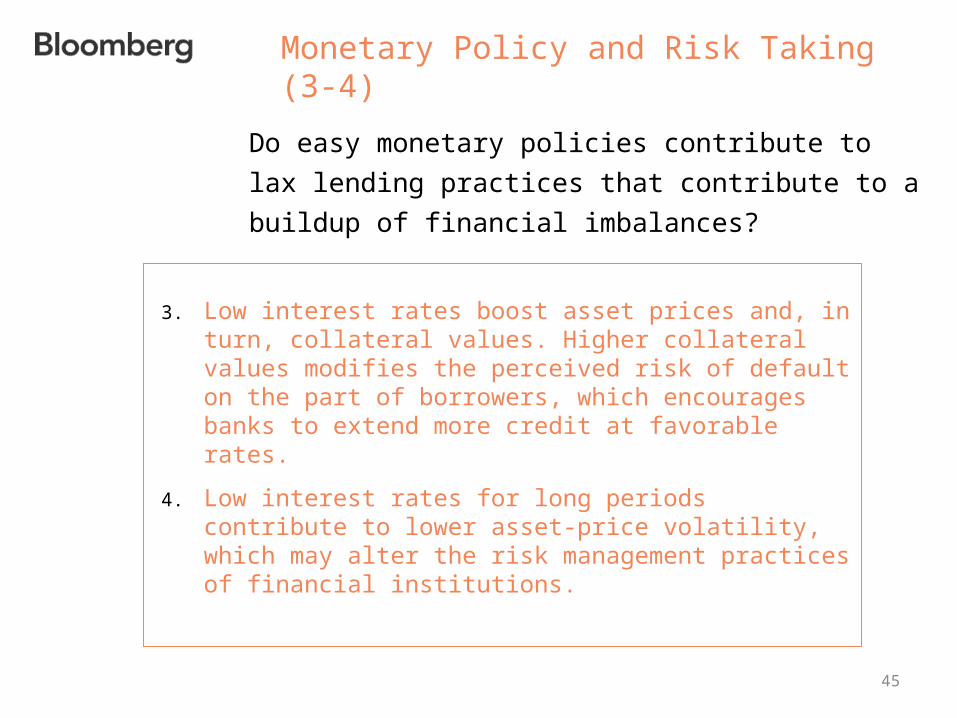
3. Low interest rates boost asset prices and, in turn, collateral values. Higher collateral values modifies the perceived risk of default on the part of borrowers, which encourages banks to extend more credit at favorable rates.
4. Low interest rates for long periods contribute to lower asset-price volatility, which may alter the risk management practices of financial institutions.
Do easy monetary policies contribute to lax lending
practices that contribute to a buildup of financial
imbalances?
Monetary Policy and Risk Taking (5-8)
46
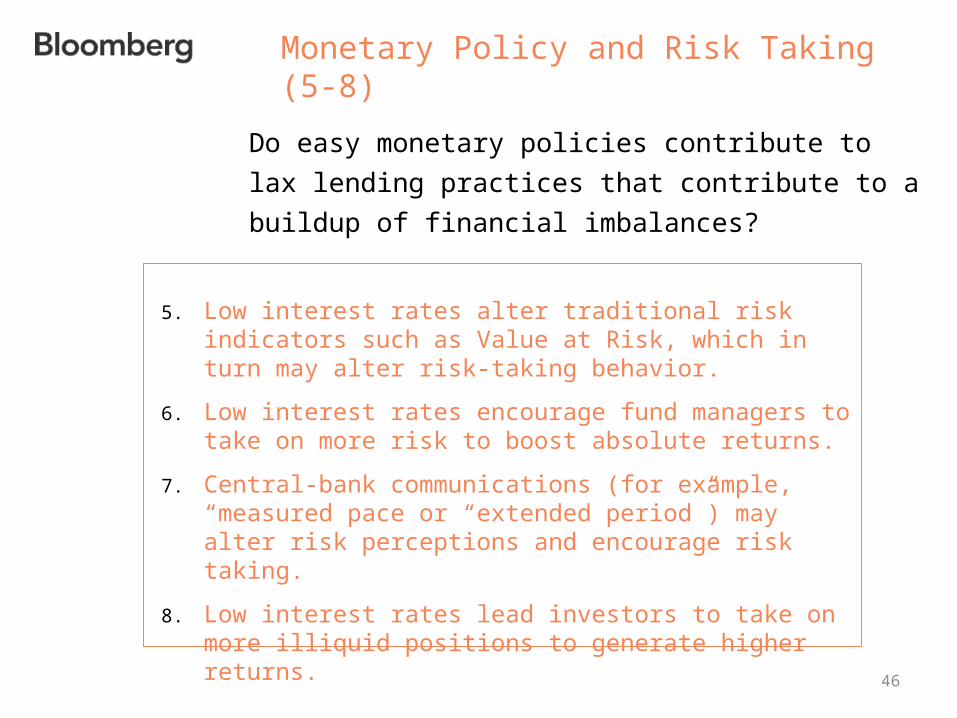
5. Low interest rates alter traditional risk indicators such as Value at Risk, which in turn may alter risk-taking behavior.
6. Low interest rates encourage fund managers to take on more risk to boost absolute returns.
7. Central-bank communications (for example, “measured pace or “extended period”) may alter risk perceptions and encourage risk taking.
8. Low interest rates lead investors to take on more illiquid positions to generate higher returns.
Do easy monetary policies contribute to lax lending
practices that contribute to a buildup of financial
imbalances?
Monetary Policy and Risk Taking(9-11)
47
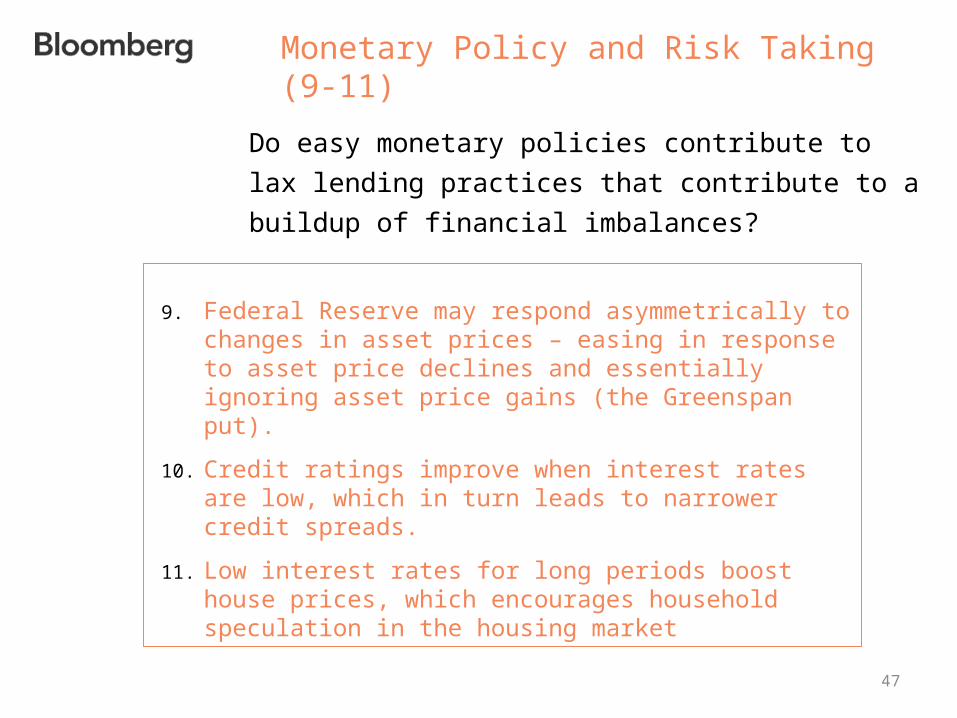
9. Federal Reserve may respond asymmetrically to changes in asset prices – easing in response to asset price declines and essentially ignoring asset price gains (the Greenspan put).
10. Credit ratings improve when interest rates are low, which in turn leads to narrower credit spreads.
11. Low interest rates for long periods boost house prices, which encourages household speculation in the housing market
Do easy monetary policies contribute to lax lending
practices that contribute to a buildup of financial
imbalances?
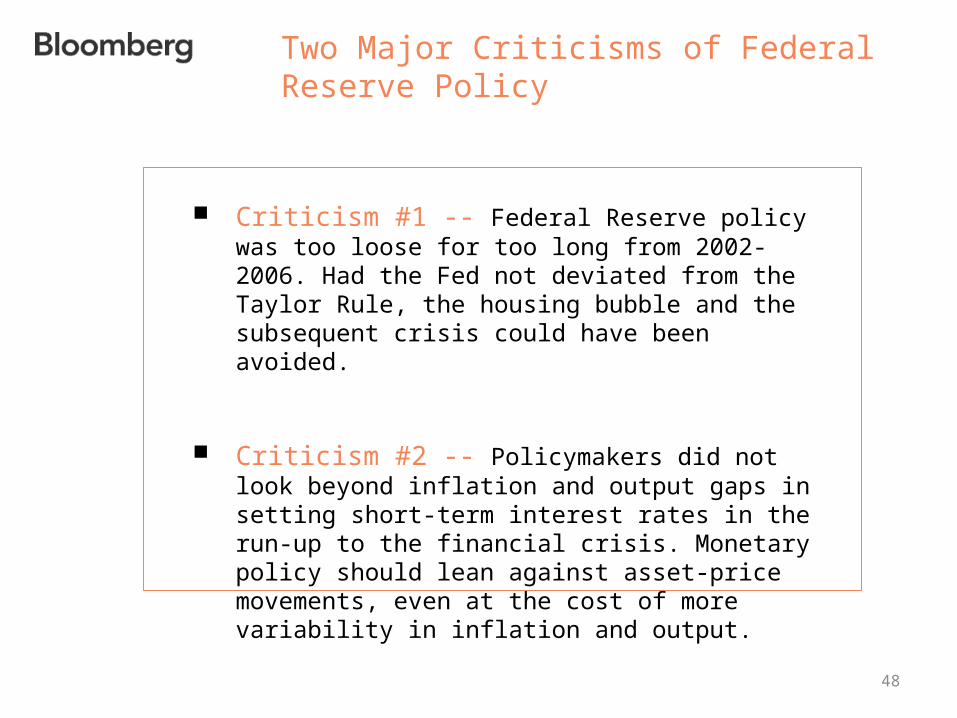
Two Major Criticisms of Federal Reserve Policy
48
Criticism #1 -- Federal Reserve policy was too loose for too long from 2002-2006. Had the Fed not deviated from the Taylor Rule, the housing bubble and the subsequent crisis could have been avoided.
Criticism #2 -- Policymakers did not look beyond inflation and output gaps in setting short-term interest rates in the run-up to the financial crisis. Monetary policy should lean against asset-price movements, even at the cost of more variability in inflation and output.
49
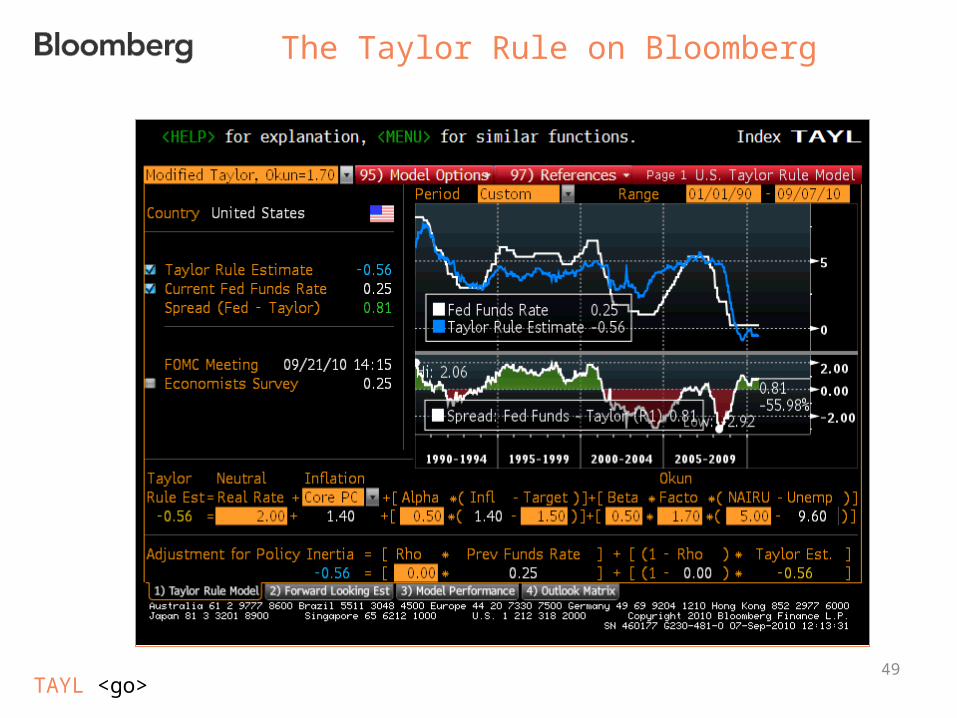
The Taylor Rule on Bloomberg
TAYL <go>
50
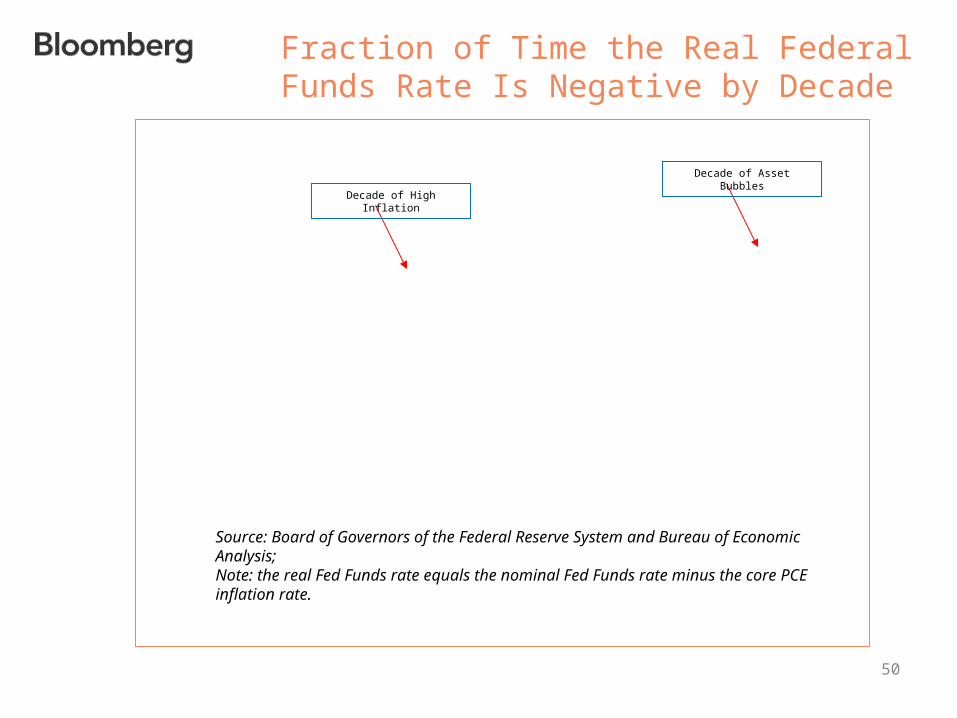
Fraction of Time the Real Federal Funds Rate Is Negative by Decade
Source: Board of Governors of the Federal Reserve System and Bureau of Economic Analysis;Note: the real Fed Funds rate equals the nominal Fed Funds rate minus the core PCE inflation rate.
Decade of High Inflation
Decade of Asset Bubbles
51
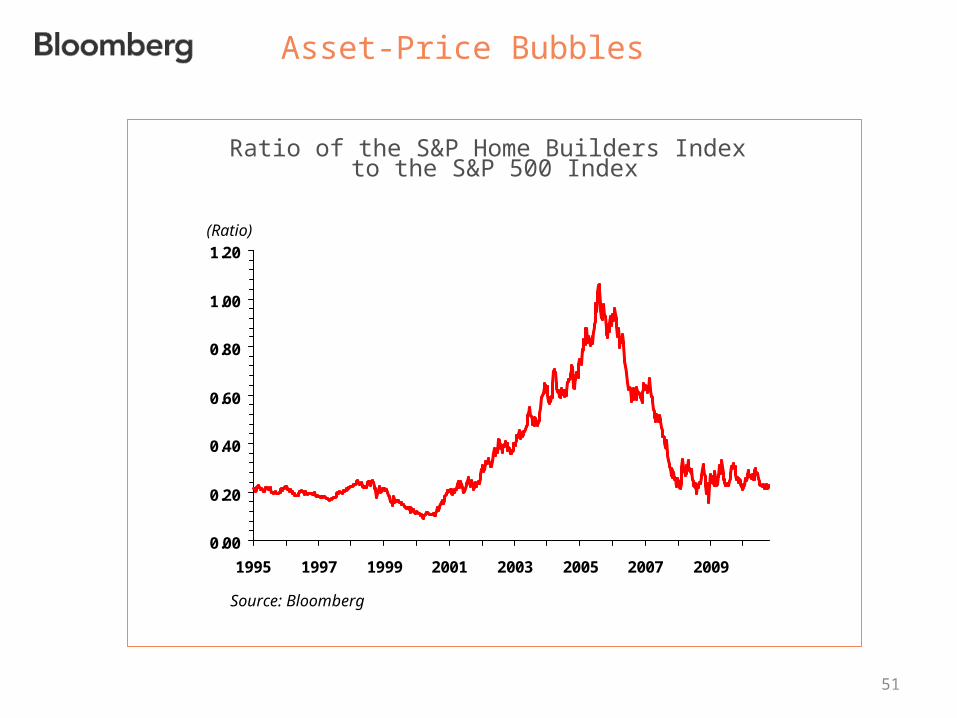
Asset-Price Bubbles
Ratio of the S&P Home Builders Index to the S&P 500 Index
0.00
0.20
0.40
0.60
0.80
1.00
1.20
1995 1997 1999 2001 2003 2005 2007 2009
(Ratio)
Source: Bloomberg
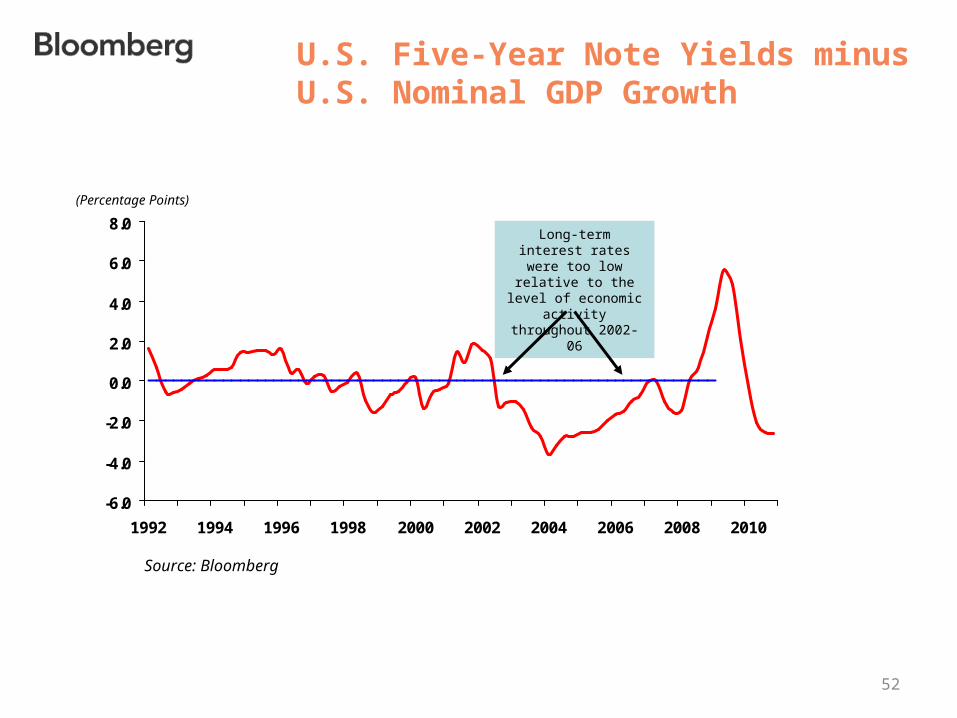
-6.0
-4.0
-2.0
0.0
2.0
4.0
6.0
8.0
1992 1994 1996 1998 2000 2002 2004 2006 2008 2010
U.S. Five-Year Note Yields minus U.S. Nominal GDP Growth
(Percentage Points)
Source: Bloomberg
Long-term interest rates were too low relative to the level of economic
activity throughout 2002-06
52
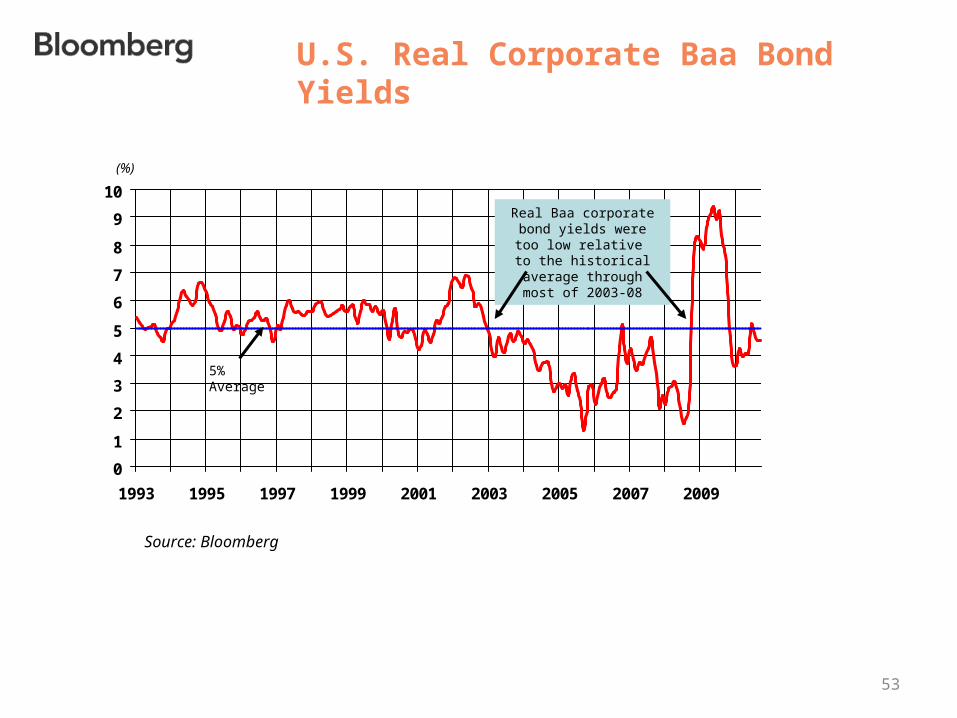
0
1
2
3
4
5
6
7
8
9
10
1993 1995 1997 1999 2001 2003 2005 2007 2009
U.S. Real Corporate Baa Bond Yields
(%)
5% Average
Source: Bloomberg
Real Baa corporate bond yields were too low
relative to the historical average through most of
2003-08
53
54
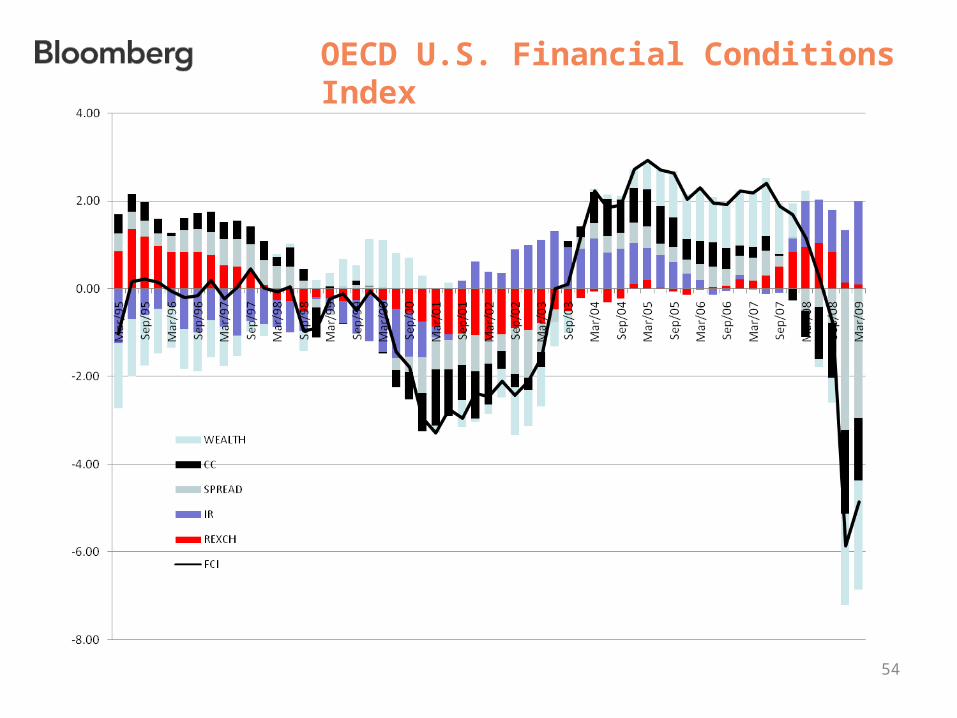
OECD U.S. Financial Conditions Index
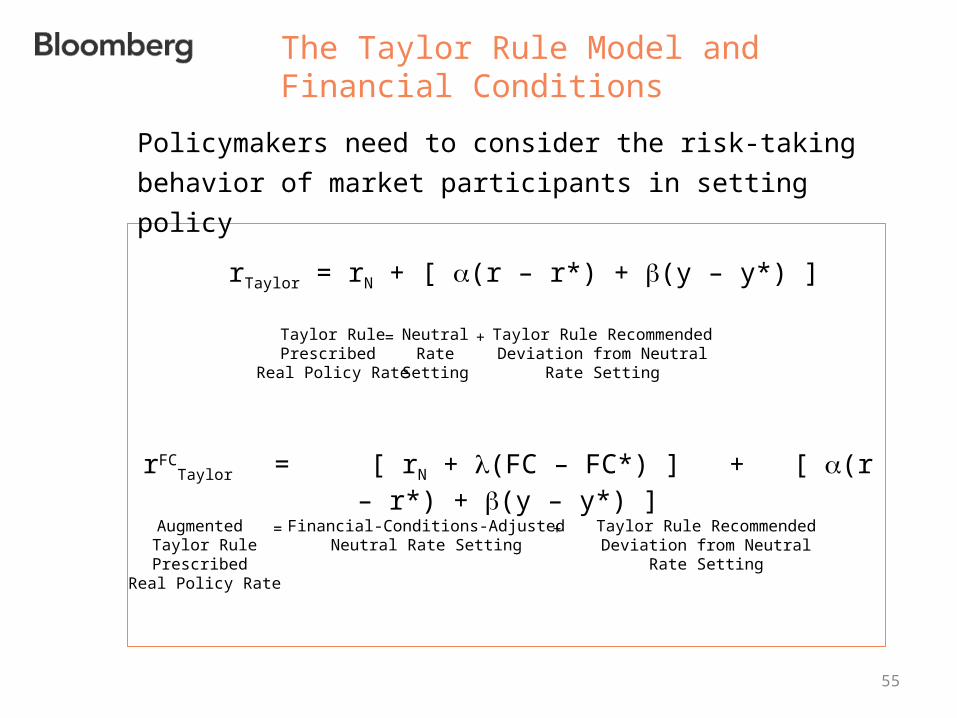
The Taylor Rule Model and Financial Conditions
55
rTaylor = rN + [ (r – r*) + (y – y*) ]
rFCTaylor
= [ rN + (FC – FC*) ] + [ (r – r*) + (y – y*) ]
Taylor RulePrescribed
Real Policy Rate
NeutralRate
Setting
Taylor Rule Recommended Deviation from Neutral Rate
Setting
Augmented Taylor RulePrescribed
Real Policy Rate
Financial-Conditions-AdjustedNeutral Rate Setting
Taylor Rule Recommended Deviation from Neutral Rate
Setting
=
=
+
+
Policymakers need to consider the risk-taking behavior of
market participants in setting policy
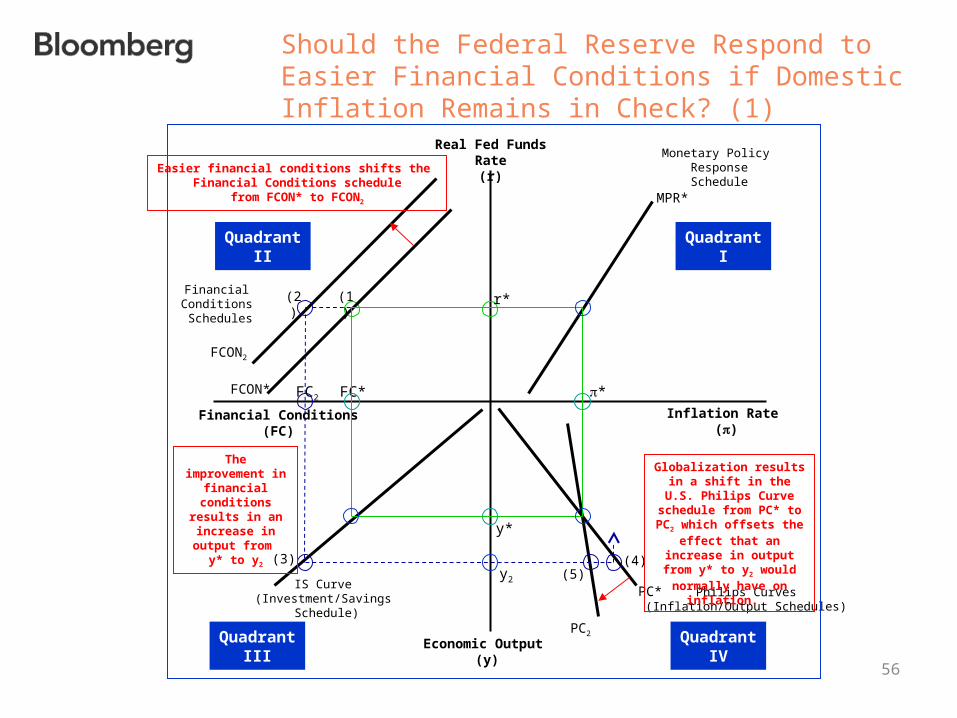
Should the Federal Reserve Respond to Easier Financial Conditions if Domestic Inflation Remains in Check? (1)
56
Real Fed Funds Rate(r)
Economic Output (y)
Financial Conditions(FC)
Inflation Rate ()
Monetary Policy ResponseSchedule
Philips Curves(Inflation/Output Schedules)
IS Curve (Investment/Savings
Schedule)
Financial Conditions Schedules
y*
FC* *
QuadrantI
QuadrantIV
QuadrantII
QuadrantIII
r*
Easier financial conditions shifts the Financial Conditions schedule
from FCON* to FCON2
FCON*
FCON2
MPR*
(1)
(3) (4)
FC2
PC*
PC2
(2)
(5)y2
Globalization results in a shift in the U.S. Philips
Curve schedule from PC* to PC2 which offsets the effect that an increase in
output from y* to y2 would normally have on
inflation.
The improvement in financial
conditions results in an increase in
output from y* to y2
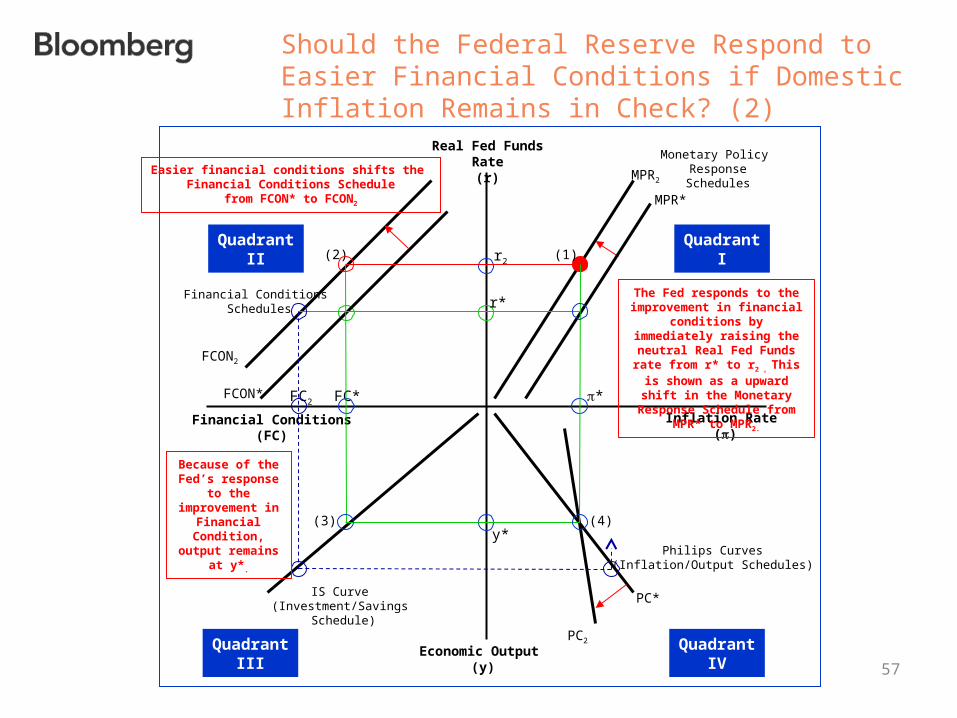
Should the Federal Reserve Respond to Easier Financial Conditions if Domestic Inflation Remains in Check? (2)
57
Real Fed Funds Rate(r)
Economic Output (y)
Financial Conditions(FC)
Inflation Rate ()
Monetary Policy ResponseSchedules
Philips Curves(Inflation/Output Schedules)
IS Curve (Investment/Savings
Schedule)
Financial Conditions Schedules
r2
y*
FC* *
QuadrantI
QuadrantIV
QuadrantII
QuadrantIII
r*
Easier financial conditions shifts the Financial Conditions Schedule
from FCON* to FCON2
FCON*
FCON2
The Fed responds to the improvement in financial
conditions by immediately raising the neutral Real Fed
Funds rate from r* to r2 , This is shown as a upward shift in the Monetary Response Schedule
from MPR* to MPR2.
MPR*
MPR2
(1)(2)
(3) (4)
FC2
PC*
PC2
Because of the Fed’s response to the improvement
in Financial Condition, output
remains at y*.
58
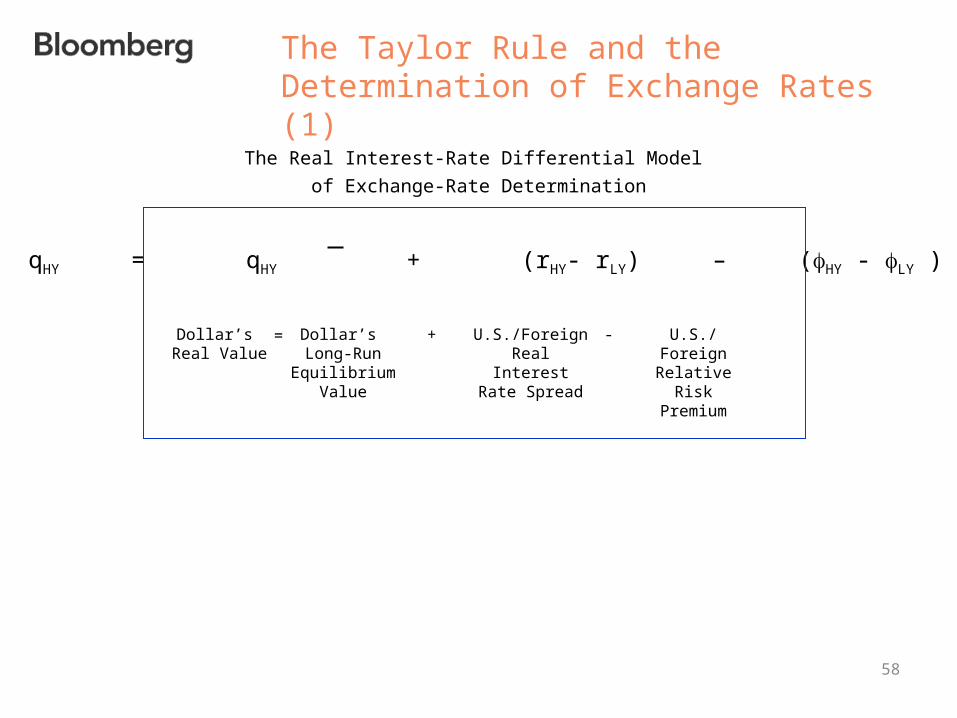
The Taylor Rule and the Determination of Exchange Rates (1)
Dollar’s Real Value
Dollar’s Long-Run Equilibrium
Value
qHY = qHY + (rHY- rLY) – (HY - LY )
U.S./Foreign Real Interest Rate Spread
= + U.S./Foreign Relative Risk
Premium
-
The Real Interest-Rate Differential Model
of Exchange-Rate Determination
59
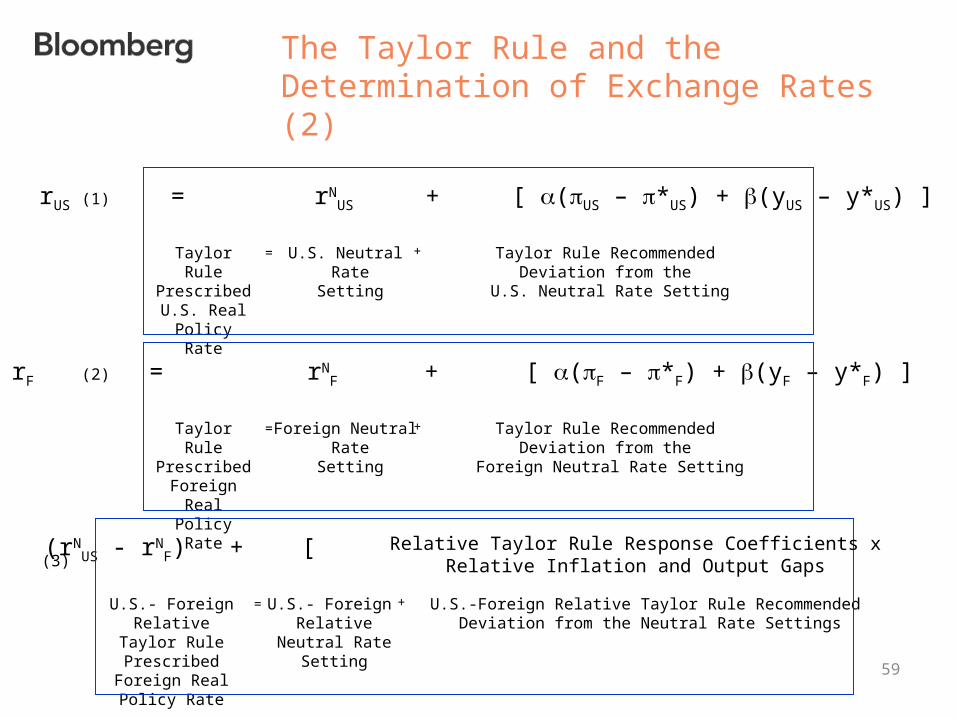
The Taylor Rule and the Determination of Exchange Rates (2)
Taylor Rule PrescribedU.S. Real
Policy Rate
U.S. Neutral Rate
Setting
rUS = rNUS + [ (US – *US) + (yUS – y*US) ]
Taylor Rule Recommended Deviation from the
U.S. Neutral Rate Setting
= +
Taylor Rule Prescribed
Foreign Real Policy Rate
Foreign Neutral Rate
Setting
rF = rNF + [ (F – *F) + (yF – y*F) ]
Taylor Rule Recommended Deviation from the
Foreign Neutral Rate Setting
= +
U.S.- Foreign Relative Taylor Rule Prescribed
Foreign Real Policy Rate
U.S.- Foreign Relative
Neutral RateSetting
rUS - rF = (rNUS - rN
F) + [ ]
U.S.-Foreign Relative Taylor Rule Recommended Deviation from the Neutral Rate Settings
= +
Relative Taylor Rule Response Coefficients xRelative Inflation and Output Gaps
(1)
(2)
(3)
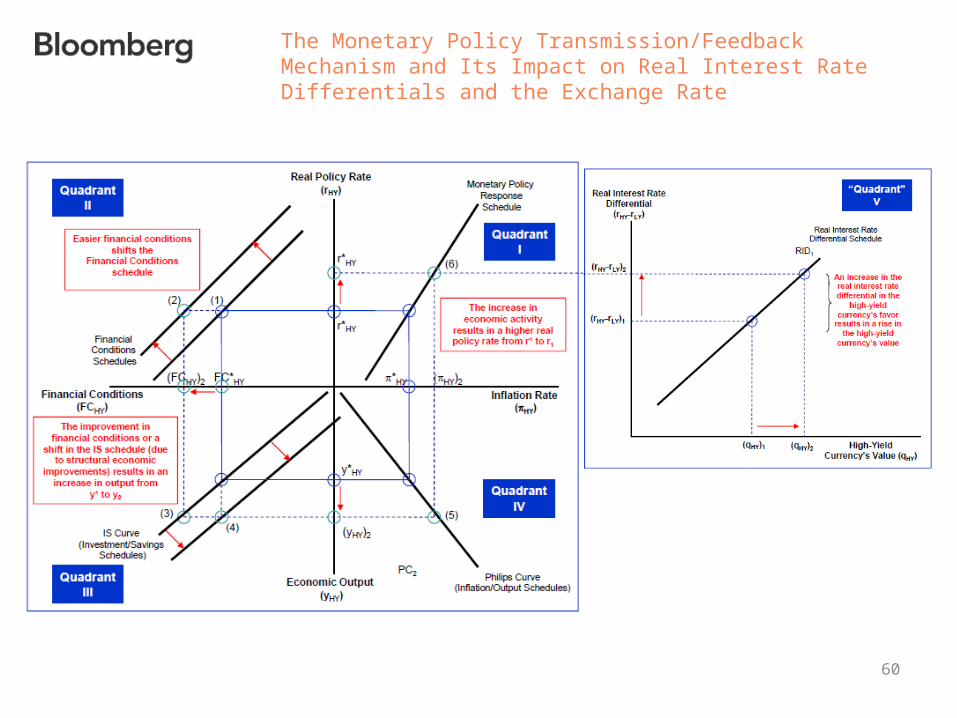
The Monetary Policy Transmission/Feedback Mechanism and Its Impact on Real Interest Rate Differentials and the Exchange Rate
60