Embed Size (px)
Citation preview
lable at ScienceDirect
Environmental Modelling & Software 53 (2014) 154e162
Contents lists avai
Environmental Modelling & Software
journal homepage: www.elsevier .com/locate/envsoft
Short communication
Image time series processing for agriculture monitoringq
Herman Eerens a, Dominique Haesen a, Felix Rembold b, Ferdinando Urbano b,*,Carolien Tote a, Lieven Bydekerke a
aVlaamse Instelling voor Technologisch Onderzoek (VITO), Boeretang 200, B-2400 Mol, Belgiumb Joint Research Centre, European Commission, TP 266, 21027 Ispra, VA, Italy
a r t i c l e i n f o
Article history:Received 12 June 2013Received in revised form17 October 2013Accepted 20 October 2013Available online
Keywords:Remote sensingEarly warningEnvironmental monitoringYield forecasting systemCrop and vegetation monitoring
Software availability
Software name: SPIRITS (Software for the PInterpretation of Remotely sensed
Developers: Herman Eerens, Dominique HaBoeretang 200, b-2400 Mol, Belgivito.be, [email protected]
Year first official release: 2013Hardware requirements: PCSystem requirements: Microsoft Windows
(version 1.6 or higher)Program language: C, JavaProgram size: 240 MBAvailability: http://spirits.jrc.ec.europa.eu/,
en/software/Pages/Spirits.aspxLicense: Free for non-commercial useDocumentation and support for users: Man
data, training sessions
q This is an open-access article distributed undeCommons Attribution-NonCommercial-No Derivativemits non-commercial use, distribution, and reproductthe original author and source are credited.* Corresponding author.
E-mail address: [email protected]
1364-8152/$ e see front matter � 2013 The Authors.http://dx.doi.org/10.1016/j.envsoft.2013.10.021
a b s t r a c t
Given strong year-to-year variability, increasing competition for natural resources, and climate changeimpacts on agriculture, monitoring global crop and natural vegetation conditions is highly relevant,particularly in food insecure areas. Data from remote sensing image series at high temporal and lowspatial resolution can help to assist in this monitoring as they provide key information in near-real timeover large areas. The SPIRITS software, presented in this paper, is a stand-alone toolbox developed forenvironmental monitoring, particularly to produce clear and evidence-based information for crop pro-duction analysts and decision makers. It includes a large number of tools with the main aim of extractingvegetation indicators from image time series, estimating the potential impact of anomalies on cropproduction and sharing this information with different audiences. SPIRITS offers an integrated andflexible analysis environment with a user-friendly graphical interface, which allows sequential taskingand a high level of automation of processing chains. It is freely distributed for non-commercial use andextensively documented.
� 2013 The Authors. Published by Elsevier Ltd. All rights reserved.
rocessing andImage Time Series)esen, Contact address:um (herman.eerens@e)
(XP or later), Java
https://rs.vito.be/africa/
ual, tutorial with test
r the terms of the CreativeWorks License, which per-
ion in any medium, provided
pa.eu (F. Urbano).
Published by Elsevier Ltd. All righ
1. Introduction
The analysis of image time series, particularly those derivedfrom remote sensing, is of increasing relevance for environmentalmonitoring (e.g. ocean, forests, fires, land use/land cover change,flooded areas, climate change, water bodies, ecology) over largeareas, and vegetation and crop monitoring is no exception. In fact,agricultural production depends on a series of factors that arehighly variable over space and time. The 2007/2008 food pricecrisis has brought back to the spotlight the impact of suddenchanges in global crop production in a context of growing pressureon natural resources, increasing uncertainty linked to climaticchange and high levels of vulnerability to food shortage in politi-cally unstable areas such as the Sahel and the Horn of Africa (FAO,2009). Remote sensing significantly contributes to agriculturalproduction assessments thanks to its capacity to collect informa-tion over large areas and with a high temporal frequency(Atzberger, 2013; Baruth et al., 2008; Zhao et al., 2013). Satellitedata made available to users in a timely manner by sensors such asSPOT-Vegetation (VGT) (e.g., Maisongrande et al., 2004), Terra/AquaMODIS (e.g., Cracknell, 1997), NOAA AVHRR (e.g., Justice et al.,1998), Metop AVHRR (e.g., Eerens et al., 2009) and MeteosatMVIRI/SEVIRI (e.g., Fensholt et al., 2011) play a key role in assessingcrop conditions in a qualitative manner and identifying potentialproduction deficits at the end of the cropping season.
ts reserved.
H. Eerens et al. / Environmental Modelling & Software 53 (2014) 154e162 155
Methodologies have been constantly improved since the 1980’s forusing satellite derived biophysical indicators directly as proxy forcrop yield (Tucker et al., 1980) or as inputs for quantitative cropgrowth and biomass estimationmodels (Baret et al., 1989; Delécolleet al., 1992). A review on this evolution has been published byRembold et al. (2013). However, to transform the data embedded inthese images into useful information for decision support, analystsneed a software environment able to manage in an integrated wayboth the spatial and temporal dimensions of the time series(Rasinmäki, 2003).
Most of the available GIS and image processing software pack-ages do not provide a complete range of built-in functionalities tohandle time series of images (Babu et al., 2006), and are not opti-mized for the needs of the crop monitoring community. In the1990’s the Food and Agriculture Organization (FAO) developed thefree WinDisp software (http://www.fao.org/giews/english/windisp/), which marked a clear effort in this direction andbecame a widespread tool in developing countries. Unfortunatelythe development of WinDisp stopped in 2003 and the tool hasbecome obsolete. Advanced crop monitoring analyses can be con-ducted with standard image processing software (e.g., IDRISI,http://clarklabs.org/; ENVI, http://www.exelisvis.com/; GRASS,http://grass.osgeo.org/, Neteler et al., 2012), statistical packages(e.g., MATLAB, http://www.mathworks.it/; R http://www.r-project.org/) or spatial databases (e.g., PostgreSQL/PostGIS, http://www.postgresql.org/, http://postgis.refractions.net/). However, thesetools are generic in nature and their use for advanced image timeseries processing requires specific programming skills, remotesensing knowledge and long program development efforts. Suchcapacities are not always available in institutions dealing withagricultural monitoring and early warning.
Some tools partially address the needs of the agriculturalmonitoring community, for instance the e-station (http://estation.jrc.ec.europa.eu/, Clerici et al., 2013), which focuses on Africanconditions, and other online platforms such as the Global Agricul-ture Monitoring (GLAM) (Becker-Reshef et al., 2010), CropExplorer(http://www.pecad.fas.usda.gov/cropexplorer/), the MARS webviewer (http://www.marsop.info/marsop3/) and the interpretationtools of the United States Geological Survey (USGS) portal ADDS(http://earlywarning.usgs.gov/fews/). All these tools are mainlydesigned to directly provide users with the standard outputs ofremote sensing analyses such as Normalized Difference VegetationIndex (NDVI) (Rouse et al., 1974) and rainfall status, anomaly mapsand graphs of temporal profiles. However, they generally do notoffer a flexible image processing environment that can be used bytechnicians and involved institutions to adapt the data analysissteps and generate additional and customized outputs.
Other online applications offer services related to image timeseries acquisition and processing, but they are designed for eithervery specific purposes (e.g., fires, Díaz et al., 2013; habitats, Duboiset al., 2013) or are typically generalised (e.g. visualization tools,Blower et al., 2013).
The TIMESAT tool (Jönsson and Eklundh, 2004) is quite flexiblebut it focuses on the extraction of phenological parameters and itlacks a graphical user interface. TimeStats (Udelhoven, 2011) offerssome advanced tools for data mining in long-term remote sensingdata archives but is mainly addressed to advanced users (i.e.,remote sensing experts). Finally, gro-meteorological modellingpackages such as GeoWRSI (FEWSNET, http://chg.geog.ucsb.edu/products/geowrsi/) and AGROMET-SHELL (FAO, http://www.hoefsloot.com/agrometshell.htm) also work with time series ofraster data (mainly meteorological data) but they are not optimizedfor the processing of remote sensing imagery.
We can therefore conclude that none of the existing systemsprovides in one package the highly specific set of time series
processing functions to assess crop and vegetation status, includingtemporal smoothing, detection of phenological stages, computationof long term averages and anomalies, classification based onvegetation seasonal performance, and production of the outputstraditionally used in crop monitoring bulletins (statistics, maps,graphs). For this reason, a flexible and user-friendly interface, tar-geting both national and international agriculture and food securityexperts, is highly desirable (Gommes et al., 2011). There is a clearneed for dedicated software with optimized functions to efficientlyprocess and analyse large image archives. This is particularly rele-vant in view of imminent satellite constellations such as the Eu-ropean Space Agency’s (ESA) Sentinel program (Petitjean et al.,2012), which will combine both high spatial and temporal resolu-tion making an improved software approach even more urgent.Finally and especially in developing countries, free software canplay an important contribution to capacity building for local in-stitutions, which are the main actors in the design and imple-mentation of prevention and response policies to potential foodcrises.
SPIRITS is an integrated, modular software platform that aims atanswering the requirements outlined above. The software isextensively documented and distributed freely for non-commercialuse.
2. SPIRITS: general aspects
SPIRITS is developed in JAVA and runs under Windows. Theversion currently available (July 2013) is 1.1.1. Originally it wasconceived as a graphical user interface (GUI) around a softwarecalled GLIMPSE (GLobal IMage Processing SoftwarE), also devel-oped by the Flemish Institute for Technological Research (VITO).GLIMPSE consists of a set of ANSI-C executables performing a widerange of dedicated image processing tasks. The GLIMPSE modulescan only be accessed via a command line interface, but they can bescripted to set up complex processing chains. SPIRITS provides aconvenient GUI, which enables to guide the GLIMPSE modules viaan up-to-date interface and to run them in the background. How-ever, over the years SPIRITS was extended with many (non-GLIMPSE) modules enabling, for example, the import of imagery inexternal formats, the generation of maps and the extraction ofregional databases. To this goal, it makes use of open source li-braries such as GDAL (http://www.gdal.org/), FWTools (http://fwtools.maptools.org/) and HSQLDB (http://hsqldb.org/), whichare included in the SPIRITS installer.
For each function, SPIRITS provides an adapted GUI that allowsusers to enter the relevant parameters, assisted by tooltips and aninteractive help system. Once the parameters have been set, thetools can be executed for a single input image or in a loop for acomplete time series. Extensive error controls provide feedbacksin case of erroneous inputs. Different tasks can be launched andare processed sequentially, whilst a progress bar indicates theevolution of each action. The results of former tasks can berecalled at any time. A typical example of the SPIRITS GUI is shownin Fig. 1.
Settings can be saved and reused in order to automate processesthat have to be repeated whenever new images become available.Multiple operations can be performed in a sequential way so thatcomplex, multi-step processing chains can be launched at once assubsequent jobs only start once previous jobs have finished. Sta-tistics can be extracted from the images for different administrativeregions and thematic units (typically land cover types). These arestored in an internal database and then used to create graphs. Mapsand graphs created for the analysis of a particular variable andregion can be saved as templates and easily reused for applicationon complete time series or sets of regions.
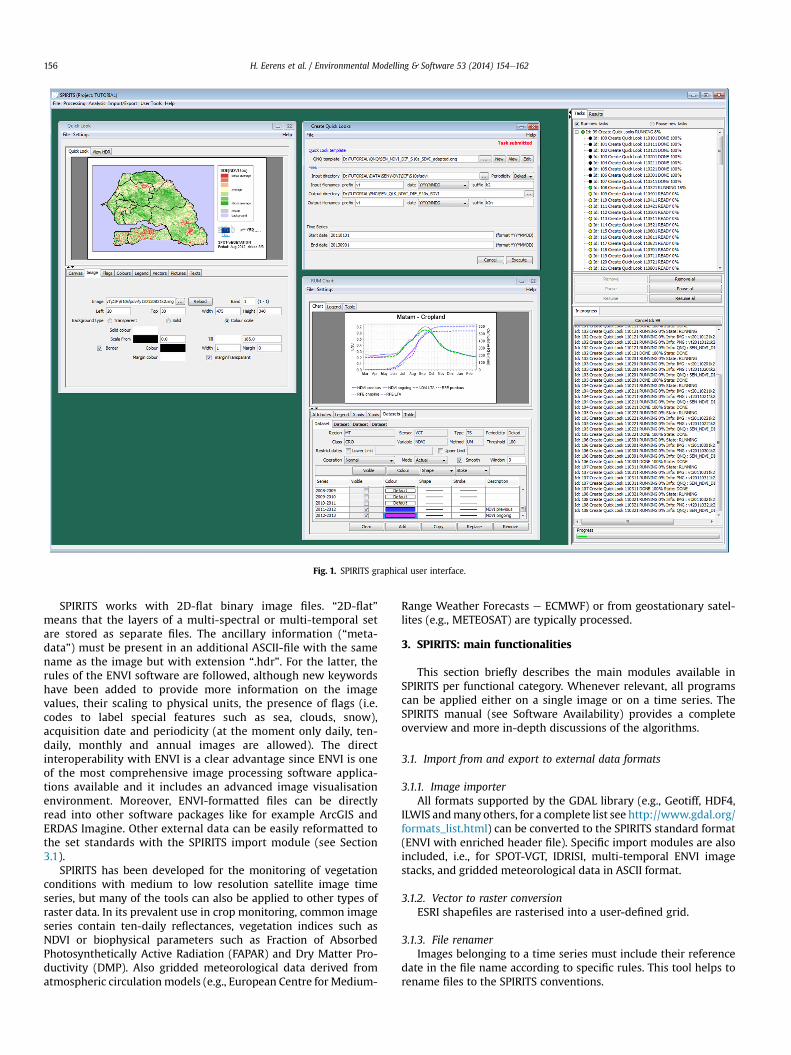
Fig. 1. SPIRITS graphical user interface.
H. Eerens et al. / Environmental Modelling & Software 53 (2014) 154e162156
SPIRITS works with 2D-flat binary image files. “2D-flat”means that the layers of a multi-spectral or multi-temporal setare stored as separate files. The ancillary information (“meta-data”) must be present in an additional ASCII-file with the samename as the image but with extension “.hdr”. For the latter, therules of the ENVI software are followed, although new keywordshave been added to provide more information on the imagevalues, their scaling to physical units, the presence of flags (i.e.codes to label special features such as sea, clouds, snow),acquisition date and periodicity (at the moment only daily, ten-daily, monthly and annual images are allowed). The directinteroperability with ENVI is a clear advantage since ENVI is oneof the most comprehensive image processing software applica-tions available and it includes an advanced image visualisationenvironment. Moreover, ENVI-formatted files can be directlyread into other software packages like for example ArcGIS andERDAS Imagine. Other external data can be easily reformatted tothe set standards with the SPIRITS import module (see Section3.1).
SPIRITS has been developed for the monitoring of vegetationconditions with medium to low resolution satellite image timeseries, but many of the tools can also be applied to other types ofraster data. In its prevalent use in crop monitoring, common imageseries contain ten-daily reflectances, vegetation indices such asNDVI or biophysical parameters such as Fraction of AbsorbedPhotosynthetically Active Radiation (FAPAR) and Dry Matter Pro-ductivity (DMP). Also gridded meteorological data derived fromatmospheric circulationmodels (e.g., European Centre for Medium-
Range Weather Forecasts e ECMWF) or from geostationary satel-lites (e.g., METEOSAT) are typically processed.
3. SPIRITS: main functionalities
This section briefly describes the main modules available inSPIRITS per functional category. Whenever relevant, all programscan be applied either on a single image or on a time series. TheSPIRITS manual (see Software Availability) provides a completeoverview and more in-depth discussions of the algorithms.
3.1. Import from and export to external data formats
3.1.1. Image importerAll formats supported by the GDAL library (e.g., Geotiff, HDF4,
ILWIS andmany others, for a complete list see http://www.gdal.org/formats_list.html) can be converted to the SPIRITS standard format(ENVI with enriched header file). Specific import modules are alsoincluded, i.e., for SPOT-VGT, IDRISI, multi-temporal ENVI imagestacks, and gridded meteorological data in ASCII format.
3.1.2. Vector to raster conversionESRI shapefiles are rasterised into a user-defined grid.
3.1.3. File renamerImages belonging to a time series must include their reference
date in the file name according to specific rules. This tool helps torename files to the SPIRITS conventions.
H. Eerens et al. / Environmental Modelling & Software 53 (2014) 154e162 157
3.1.4. Image exporterThis group of modules converts SPIRITS images to the formats of
IDRISI and ESRI (.BSQ, .BIL, .BIP). A selected set of images can also becombined into a single multi-temporal layer stack file (according toENVI standards).
3.2. Spatial operations
3.2.1. ROI-extractionA rectangular region of interest (ROI) is extracted from an input
image.
3.2.2. ResamplingAn input image is resampled to a user-defined output grid (i.e.,
resolution and extension) in the same reference system.
3.2.3. Generation of AFIsStarting from a high-resolution raster classification with N
classes, N low resolution Area Fraction Images (AFIs) are derivedwith the area fractions of every class in each coarse resolution pixel.The AFIs can be used for the computation of the Regional UnmixedMeans (see Section 3.6).
3.2.4. Low-pass filtersAn input image is spatially smoothed using a moving window
with variable size and one of the available filters (e.g., mean, me-dian, mode).
3.3. Thematic operations
3.3.1. RescaleThe original image values are rescaled or modified according to
a user-defined scheme. Examples of possible actions: modificationof data type (byte, short/long integer, float), stretching, histogramequalisation, reclassification.
3.3.2. IndexThis module allows computing a wide range of vegetation
indices, by combining two or three input images via a selectedoperator.
3.3.3. MaskingSelected image pixels are masked according to the values in
another image (e.g., a crop mask or a country mask).
3.3.4. FlaggingThe information of a statusmask image (e.g., water, cloud, snow)
is transferred as flags into another image (e.g., NDVI).
3.3.5. DMP/NPPImages with Dry Matter Productivity (kgDM/ha/day) or Net
Primary Productivity (gC/m2/day) are derived by applying aMonteith algorithm (Veroustraete et al., 2002) on FAPAR imagesfrom remote sensing and meteorological information.
3.3.6. ClusteringUnsupervised classification using an enhanced iso-clustering
algorithm (see e.g., Memarsadeghi et al., 2007).
3.4. Time series operations e part 1 (within a single year)
3.4.1. Smoothing:The noisy observations (e.g., clouds, snow) in a time series of any
vegetation index (e.g., NDVI, FAPAR) are detected and replaced bymeans of a modified version of the algorithm of Swets et al. (1999).
3.4.2. Compositing:Several input images in a given period (e.g., dekad) are
composited using one of the available criteria to select the bestavailable set of observations per pixel (i.e. maximum, minimum,mean), optionally with conditions on other variables (e.g., scanangle, status map). This module generates for example ten-daily ormonthly composites from daily data. This module can simulta-neously mosaicks images from different adjacent scenes to a fixedoutput frame.
3.4.3. AveragingA temporal average or summation is calculated between two
given dates.
3.4.4. PhenologyBy analysing a 10-daily series of any vegetation index, the dates
of the start (SOS) and end (EOS) of the single or double growingseasons are defined, using a modified version of the pixel wiseadaptive thresholding technique proposed by White et al. (1997).Different percentage thresholds of theminemax NDVI range can beset by the user. It works both for individual years and LTA.
3.4.5. Phenological averagingA temporal average or summation is calculated between two
(pixel-specific) different dates, the first being the SOS, the secondbeing either EOS or the current date if the season has not yetfinished.
3.5. Time series operations e part 2 (over the years)
3.5.1. Long-term statisticsA multi-annual time series is analysed and for each pixel and
period (e.g., the 36 dekads or 12 months in the year) the long-termstatistics (e.g., mean, minimum, maximum, median, standard de-viation) are derived and written to new images.
3.5.2. AnomaliesActual images are compared with the corresponding long-term
statistics (or with the previous year) and new anomaly images arederived using operators such as the absolute, relative or stan-dardized difference. Also the Vegetation Condition Index (Kogan,1995) and Vegetation Productivity Index (Sannier and Taylor,1998) can be computed. The complete list of available operatorscan be found in the software manual.
3.5.3. Similarity analysisThis module compares a time series of the current year with its
equivalents of other years in order to detect (per pixel) the mostsimilar year. Also the current year can be compared with the long-term average to define (per pixel) the overall shift (advance ordelay) of the current season with regard to the average.
3.5.4. Similarity-based yield assessmentThis tool assesses crop yields based on the assumption that the
yield of the current year will most closely resemble the yield of themost similar year (method of analogues). The module combines theresults of the similarity analysis with external information thatshould be provided by the analyst (database with the official yieldsof the concerned crop per year and per region).
3.6. Analysis tools
3.6.1. Map composerVia a dedicated GUI the user can specify and parameterise all
map elements (i.e. image type, title, legend, colours, vectors in
H. Eerens et al. / Environmental Modelling & Software 53 (2014) 154e162158
overlay, logos). The specifications can be stored in a map template,to be used repetitively for time series of images.
3.6.2. Databases with regional statisticsBy overlaying an image set with the corresponding regions map
(e.g., administrative units, ecological zones) and land usemap (hardclassification or a set of AFIs, see Section 3.2), ASCII-formatted fileswith regional unmixed means (RUM) are extracted, i.e. the meanvalues of the concerned image variable, per region and land covertype. The RUM-values are then ingested into an SPIRITS relationaldatabase (HSQLDB) previously defined by the user. The final RUMdatabase contains the time series of different variables per regionand land cover type.
3.6.3. Graph composerThis tool allows for the display of the contents of the RUM
database in the form of cartesian graph where X-axis is time and Y-axis can be any variable (e.g., NDVI, DMP, rainfall). Dedicated graphscan be composed and once settings are stored, they can be appliedon sets of regions and land unit types. Moreover, the graphcomposer can display some additional time series (e.g., long-termaverages and anomalies) computed on fly from the RUM-valuesin the database.
3.6.4. User toolsVia a dedicated GUI, one or more external programs (e.g., files
with extension .exe, .bat, .pty) can be declared together with theirrequired arguments. Dedicated processing chains can be estab-lished by concatenating different programs and/or internal
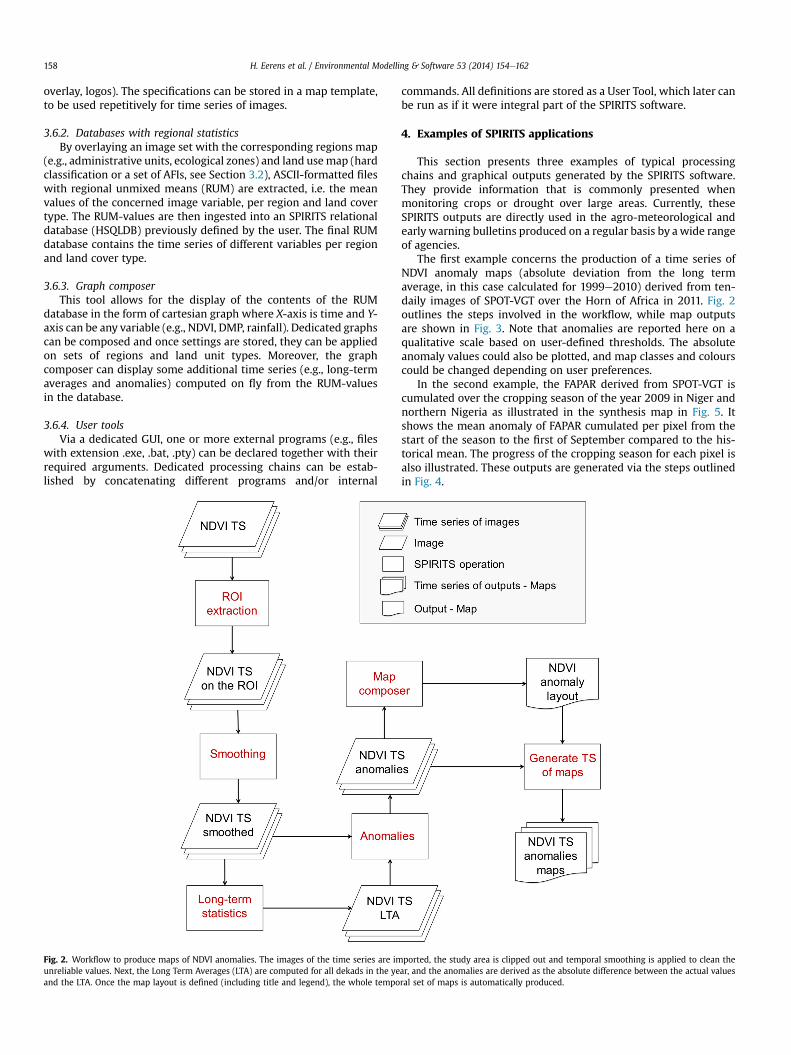
Fig. 2. Workflow to produce maps of NDVI anomalies. The images of the time series are imunreliable values. Next, the Long Term Averages (LTA) are computed for all dekads in the yeand the LTA. Once the map layout is defined (including title and legend), the whole tempo
commands. All definitions are stored as a User Tool, which later canbe run as if it were integral part of the SPIRITS software.
4. Examples of SPIRITS applications
This section presents three examples of typical processingchains and graphical outputs generated by the SPIRITS software.They provide information that is commonly presented whenmonitoring crops or drought over large areas. Currently, theseSPIRITS outputs are directly used in the agro-meteorological andearly warning bulletins produced on a regular basis by awide rangeof agencies.
The first example concerns the production of a time series ofNDVI anomaly maps (absolute deviation from the long termaverage, in this case calculated for 1999e2010) derived from ten-daily images of SPOT-VGT over the Horn of Africa in 2011. Fig. 2outlines the steps involved in the workflow, while map outputsare shown in Fig. 3. Note that anomalies are reported here on aqualitative scale based on user-defined thresholds. The absoluteanomaly values could also be plotted, and map classes and colourscould be changed depending on user preferences.
In the second example, the FAPAR derived from SPOT-VGT iscumulated over the cropping season of the year 2009 in Niger andnorthern Nigeria as illustrated in the synthesis map in Fig. 5. Itshows the mean anomaly of FAPAR cumulated per pixel from thestart of the season to the first of September compared to the his-torical mean. The progress of the cropping season for each pixel isalso illustrated. These outputs are generated via the steps outlinedin Fig. 4.
ported, the study area is clipped out and temporal smoothing is applied to clean thear, and the anomalies are derived as the absolute difference between the actual valuesral set of maps is automatically produced.
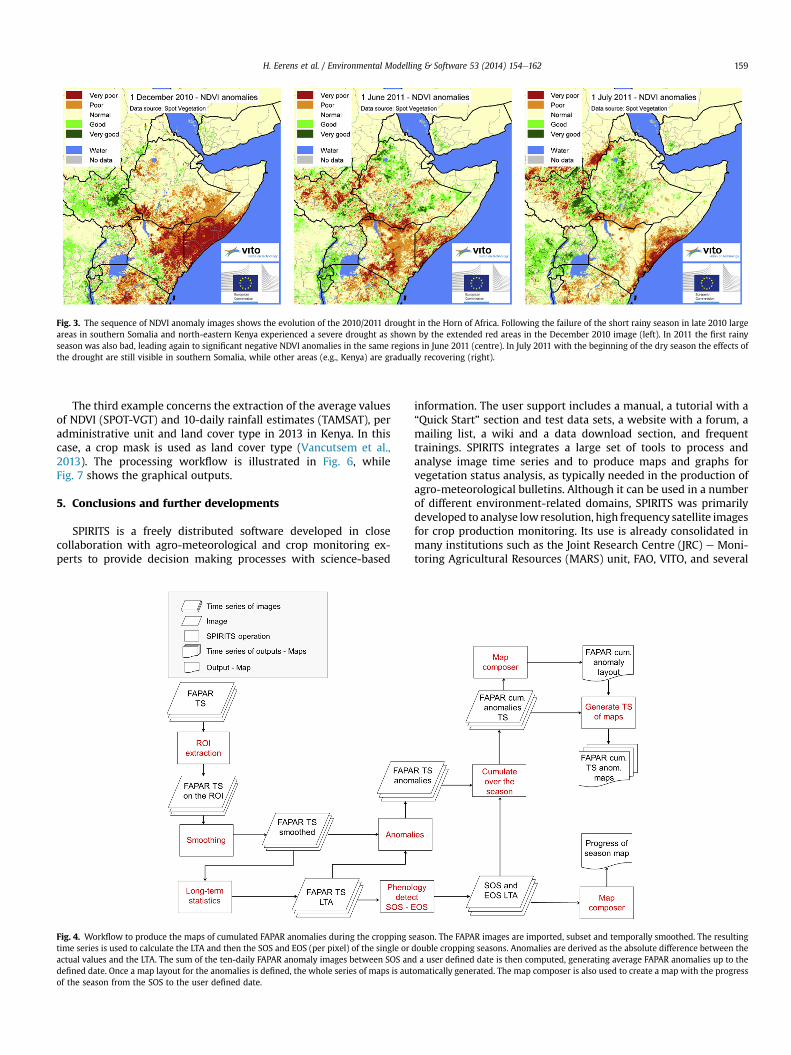
Fig. 3. The sequence of NDVI anomaly images shows the evolution of the 2010/2011 drought in the Horn of Africa. Following the failure of the short rainy season in late 2010 largeareas in southern Somalia and north-eastern Kenya experienced a severe drought as shown by the extended red areas in the December 2010 image (left). In 2011 the first rainyseason was also bad, leading again to significant negative NDVI anomalies in the same regions in June 2011 (centre). In July 2011 with the beginning of the dry season the effects ofthe drought are still visible in southern Somalia, while other areas (e.g., Kenya) are gradually recovering (right).
H. Eerens et al. / Environmental Modelling & Software 53 (2014) 154e162 159
The third example concerns the extraction of the average valuesof NDVI (SPOT-VGT) and 10-daily rainfall estimates (TAMSAT), peradministrative unit and land cover type in 2013 in Kenya. In thiscase, a crop mask is used as land cover type (Vancutsem et al.,2013). The processing workflow is illustrated in Fig. 6, whileFig. 7 shows the graphical outputs.
5. Conclusions and further developments
SPIRITS is a freely distributed software developed in closecollaboration with agro-meteorological and crop monitoring ex-perts to provide decision making processes with science-based
Fig. 4. Workflow to produce the maps of cumulated FAPAR anomalies during the cropping stime series is used to calculate the LTA and then the SOS and EOS (per pixel) of the single oractual values and the LTA. The sum of the ten-daily FAPAR anomaly images between SOS andefined date. Once a map layout for the anomalies is defined, the whole series of maps is autof the season from the SOS to the user defined date.
information. The user support includes a manual, a tutorial with a“Quick Start” section and test data sets, a website with a forum, amailing list, a wiki and a data download section, and frequenttrainings. SPIRITS integrates a large set of tools to process andanalyse image time series and to produce maps and graphs forvegetation status analysis, as typically needed in the production ofagro-meteorological bulletins. Although it can be used in a numberof different environment-related domains, SPIRITS was primarilydeveloped to analyse lowresolution, high frequency satellite imagesfor crop production monitoring. Its use is already consolidated inmany institutions such as the Joint Research Centre (JRC) e Moni-toring Agricultural Resources (MARS) unit, FAO, VITO, and several
eason. The FAPAR images are imported, subset and temporally smoothed. The resultingdouble cropping seasons. Anomalies are derived as the absolute difference between thed a user defined date is then computed, generating average FAPAR anomalies up to theomatically generated. The map composer is also used to create a map with the progress
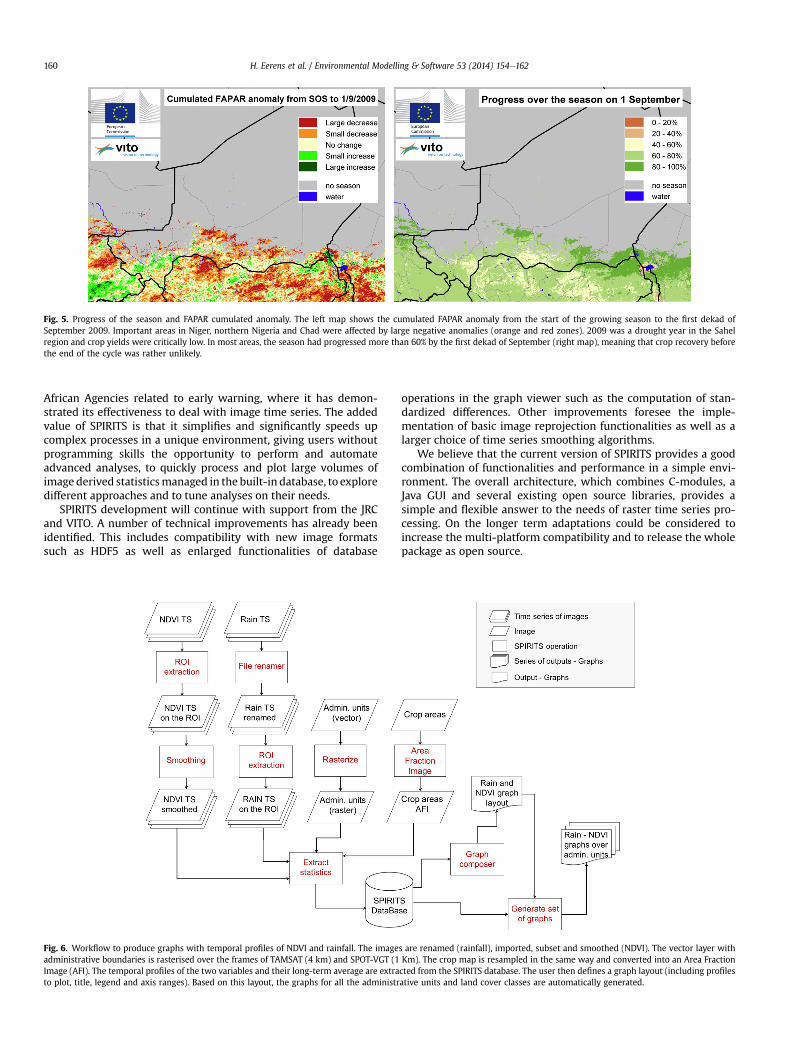
Fig. 5. Progress of the season and FAPAR cumulated anomaly. The left map shows the cumulated FAPAR anomaly from the start of the growing season to the first dekad ofSeptember 2009. Important areas in Niger, northern Nigeria and Chad were affected by large negative anomalies (orange and red zones). 2009 was a drought year in the Sahelregion and crop yields were critically low. In most areas, the season had progressed more than 60% by the first dekad of September (right map), meaning that crop recovery beforethe end of the cycle was rather unlikely.
H. Eerens et al. / Environmental Modelling & Software 53 (2014) 154e162160
African Agencies related to early warning, where it has demon-strated its effectiveness to deal with image time series. The addedvalue of SPIRITS is that it simplifies and significantly speeds upcomplex processes in a unique environment, giving users withoutprogramming skills the opportunity to perform and automateadvanced analyses, to quickly process and plot large volumes ofimage derived statisticsmanaged in the built-in database, to exploredifferent approaches and to tune analyses on their needs.
SPIRITS development will continue with support from the JRCand VITO. A number of technical improvements has already beenidentified. This includes compatibility with new image formatssuch as HDF5 as well as enlarged functionalities of database
Fig. 6. Workflow to produce graphs with temporal profiles of NDVI and rainfall. The imageadministrative boundaries is rasterised over the frames of TAMSAT (4 km) and SPOT-VGT (1Image (AFI). The temporal profiles of the two variables and their long-term average are extrato plot, title, legend and axis ranges). Based on this layout, the graphs for all the administr
operations in the graph viewer such as the computation of stan-dardized differences. Other improvements foresee the imple-mentation of basic image reprojection functionalities as well as alarger choice of time series smoothing algorithms.
We believe that the current version of SPIRITS provides a goodcombination of functionalities and performance in a simple envi-ronment. The overall architecture, which combines C-modules, aJava GUI and several existing open source libraries, provides asimple and flexible answer to the needs of raster time series pro-cessing. On the longer term adaptations could be considered toincrease the multi-platform compatibility and to release the wholepackage as open source.
s are renamed (rainfall), imported, subset and smoothed (NDVI). The vector layer withKm). The crop map is resampled in the same way and converted into an Area Fractioncted from the SPIRITS database. The user then defines a graph layout (including profilesative units and land cover classes are automatically generated.
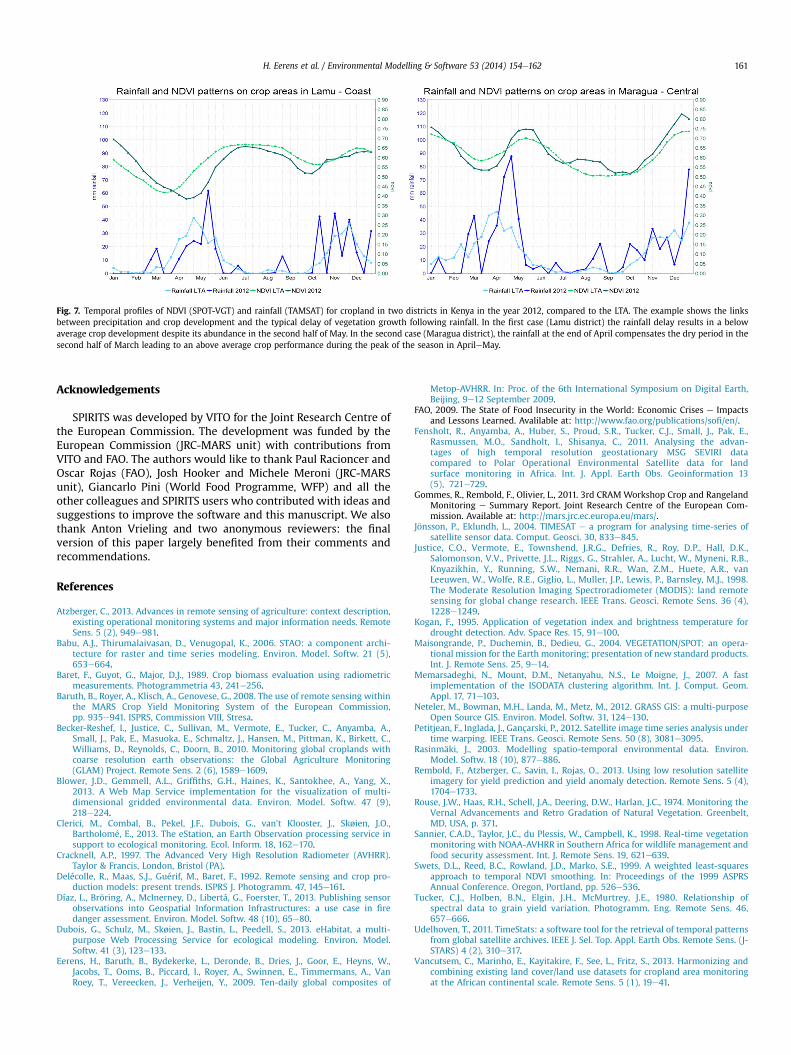
Fig. 7. Temporal profiles of NDVI (SPOT-VGT) and rainfall (TAMSAT) for cropland in two districts in Kenya in the year 2012, compared to the LTA. The example shows the linksbetween precipitation and crop development and the typical delay of vegetation growth following rainfall. In the first case (Lamu district) the rainfall delay results in a belowaverage crop development despite its abundance in the second half of May. In the second case (Maragua district), the rainfall at the end of April compensates the dry period in thesecond half of March leading to an above average crop performance during the peak of the season in AprileMay.
H. Eerens et al. / Environmental Modelling & Software 53 (2014) 154e162 161
Acknowledgements
SPIRITS was developed by VITO for the Joint Research Centre ofthe European Commission. The development was funded by theEuropean Commission (JRC-MARS unit) with contributions fromVITO and FAO. The authors would like to thank Paul Racioncer andOscar Rojas (FAO), Josh Hooker and Michele Meroni (JRC-MARSunit), Giancarlo Pini (World Food Programme, WFP) and all theother colleagues and SPIRITS users who contributed with ideas andsuggestions to improve the software and this manuscript. We alsothank Anton Vrieling and two anonymous reviewers: the finalversion of this paper largely benefited from their comments andrecommendations.
References
Atzberger, C., 2013. Advances in remote sensing of agriculture: context description,existing operational monitoring systems and major information needs. RemoteSens. 5 (2), 949e981.
Babu, A.J., Thirumalaivasan, D., Venugopal, K., 2006. STAO: a component archi-tecture for raster and time series modeling. Environ. Model. Softw. 21 (5),653e664.
Baret, F., Guyot, G., Major, D.J., 1989. Crop biomass evaluation using radiometricmeasurements. Photogrammetria 43, 241e256.
Baruth, B., Royer, A., Klisch, A., Genovese, G., 2008. The use of remote sensing withinthe MARS Crop Yield Monitoring System of the European Commission,pp. 935e941. ISPRS, Commission VIII, Stresa.
Becker-Reshef, I., Justice, C., Sullivan, M., Vermote, E., Tucker, C., Anyamba, A.,Small, J., Pak, E., Masuoka, E., Schmaltz, J., Hansen, M., Pittman, K., Birkett, C.,Williams, D., Reynolds, C., Doorn, B., 2010. Monitoring global croplands withcoarse resolution earth observations: the Global Agriculture Monitoring(GLAM) Project. Remote Sens. 2 (6), 1589e1609.
Blower, J.D., Gemmell, A.L., Griffiths, G.H., Haines, K., Santokhee, A., Yang, X.,2013. A Web Map Service implementation for the visualization of multi-dimensional gridded environmental data. Environ. Model. Softw. 47 (9),218e224.
Clerici, M., Combal, B., Pekel, J.F., Dubois, G., van’t Klooster, J., Skøien, J.O.,Bartholomé, E., 2013. The eStation, an Earth Observation processing service insupport to ecological monitoring. Ecol. Inform. 18, 162e170.
Cracknell, A.P., 1997. The Advanced Very High Resolution Radiometer (AVHRR).Taylor & Francis, London, Bristol (PA).
Delécolle, R., Maas, S.J., Guérif, M., Baret, F., 1992. Remote sensing and crop pro-duction models: present trends. ISPRS J. Photogramm. 47, 145e161.
Díaz, L., Bröring, A., McInerney, D., Libertá, G., Foerster, T., 2013. Publishing sensorobservations into Geospatial Information Infrastructures: a use case in firedanger assessment. Environ. Model. Softw. 48 (10), 65e80.
Dubois, G., Schulz, M., Skøien, J., Bastin, L., Peedell, S., 2013. eHabitat, a multi-purpose Web Processing Service for ecological modeling. Environ. Model.Softw. 41 (3), 123e133.
Eerens, H., Baruth, B., Bydekerke, L., Deronde, B., Dries, J., Goor, E., Heyns, W.,Jacobs, T., Ooms, B., Piccard, I., Royer, A., Swinnen, E., Timmermans, A., VanRoey, T., Vereecken, J., Verheijen, Y., 2009. Ten-daily global composites of
Metop-AVHRR. In: Proc. of the 6th International Symposium on Digital Earth,Beijing, 9e12 September 2009.
FAO, 2009. The State of Food Insecurity in the World: Economic Crises e Impactsand Lessons Learned. Avalilable at: http://www.fao.org/publications/sofi/en/.
Fensholt, R., Anyamba, A., Huber, S., Proud, S.R., Tucker, C.J., Small, J., Pak, E.,Rasmussen, M.O., Sandholt, I., Shisanya, C., 2011. Analysing the advan-tages of high temporal resolution geostationary MSG SEVIRI datacompared to Polar Operational Environmental Satellite data for landsurface monitoring in Africa. Int. J. Appl. Earth Obs. Geoinformation 13(5), 721e729.
Gommes, R., Rembold, F., Olivier, L., 2011. 3rd CRAM Workshop Crop and RangelandMonitoring e Summary Report. Joint Research Centre of the European Com-mission. Available at: http://mars.jrc.ec.europa.eu/mars/.
Jönsson, P., Eklundh, L., 2004. TIMESAT e a program for analysing time-series ofsatellite sensor data. Comput. Geosci. 30, 833e845.
Justice, C.O., Vermote, E., Townshend, J.R.G., Defries, R., Roy, D.P., Hall, D.K.,Salomonson, V.V., Privette, J.L., Riggs, G., Strahler, A., Lucht, W., Myneni, R.B.,Knyazikhin, Y., Running, S.W., Nemani, R.R., Wan, Z.M., Huete, A.R., vanLeeuwen, W., Wolfe, R.E., Giglio, L., Muller, J.P., Lewis, P., Barnsley, M.J., 1998.The Moderate Resolution Imaging Spectroradiometer (MODIS): land remotesensing for global change research. IEEE Trans. Geosci. Remote Sens. 36 (4),1228e1249.
Kogan, F., 1995. Application of vegetation index and brightness temperature fordrought detection. Adv. Space Res. 15, 91e100.
Maisongrande, P., Duchemin, B., Dedieu, G., 2004. VEGETATION/SPOT: an opera-tional mission for the Earth monitoring; presentation of new standard products.Int. J. Remote Sens. 25, 9e14.
Memarsadeghi, N., Mount, D.M., Netanyahu, N.S., Le Moigne, J., 2007. A fastimplementation of the ISODATA clustering algorithm. Int. J. Comput. Geom.Appl. 17, 71e103.
Neteler, M., Bowman, M.H., Landa, M., Metz, M., 2012. GRASS GIS: a multi-purposeOpen Source GIS. Environ. Model. Softw. 31, 124e130.
Petitjean, F., Inglada, J., Gançarski, P., 2012. Satellite image time series analysis undertime warping. IEEE Trans. Geosci. Remote Sens. 50 (8), 3081e3095.
Rasinmäki, J., 2003. Modelling spatio-temporal environmental data. Environ.Model. Softw. 18 (10), 877e886.
Rembold, F., Atzberger, C., Savin, I., Rojas, O., 2013. Using low resolution satelliteimagery for yield prediction and yield anomaly detection. Remote Sens. 5 (4),1704e1733.
Rouse, J.W., Haas, R.H., Schell, J.A., Deering, D.W., Harlan, J.C., 1974. Monitoring theVernal Advancements and Retro Gradation of Natural Vegetation. Greenbelt,MD, USA, p. 371.
Sannier, C.A.D., Taylor, J.C., du Plessis, W., Campbell, K., 1998. Real-time vegetationmonitoring with NOAA-AVHRR in Southern Africa for wildlife management andfood security assessment. Int. J. Remote Sens. 19, 621e639.
Swets, D.L., Reed, B.C., Rowland, J.D., Marko, S.E., 1999. A weighted least-squaresapproach to temporal NDVI smoothing. In: Proceedings of the 1999 ASPRSAnnual Conference. Oregon, Portland, pp. 526e536.
Tucker, C.J., Holben, B.N., Elgin, J.H., McMurtrey, J.E., 1980. Relationship ofspectral data to grain yield variation. Photogramm. Eng. Remote Sens. 46,657e666.
Udelhoven, T., 2011. TimeStats: a software tool for the retrieval of temporal patternsfrom global satellite archives. IEEE J. Sel. Top. Appl. Earth Obs. Remote Sens. (J-STARS) 4 (2), 310e317.
Vancutsem, C., Marinho, E., Kayitakire, F., See, L., Fritz, S., 2013. Harmonizing andcombining existing land cover/land use datasets for cropland area monitoringat the African continental scale. Remote Sens. 5 (1), 19e41.

H. Eerens et al. / Environmental Modelling & Software 53 (2014) 154e162162
Veroustraete, F.,Sabbe,H.,Eerens,H.,2002.EstimationofcarbonmassfluxesoverEuropeusing the C-fix model and Euroflux data. Remote Sens. Environ. 83 (3), 377e400.
White, M.A., Thornton, P.E., Running, S.W., 1997. A continental phenology model formonitoring vegetation responses to inter-annual climatic variability. Glob.Biogeochem. Cycles 11 (2), 217e234.
Zhao, G., Bryan, B.A., King, D., Luo, Z., Wang, E., Bende-Michl, U., Song, X., Yu, Q.,2013. Large-scale, high-resolution agricultural systems modeling using a hybridapproach combining grid computing and parallel processing. Environ. Model.Softw. 41 (3), 231e238.