Embed Size (px)
Citation preview

1
1
Imagery
Chapter 7
2
Imagery
1. Mental representation of stimuli when they are physically absent (Kosslyn, 2000).
2. Can you form images based on all senses: sight, sound, smell, taste and touch?
3. Yes. But some senses form images more readily than others, e.g., visual images are easier to form than touch.
3
Visual Imagery
Within the same visual domain one image may be more finely detailed (quality) than the other.
Ph
oto
Co
urte
sy of H
arald Ed
en
s
ww
w.sp
william
son
.free
uk.co
m
2
4
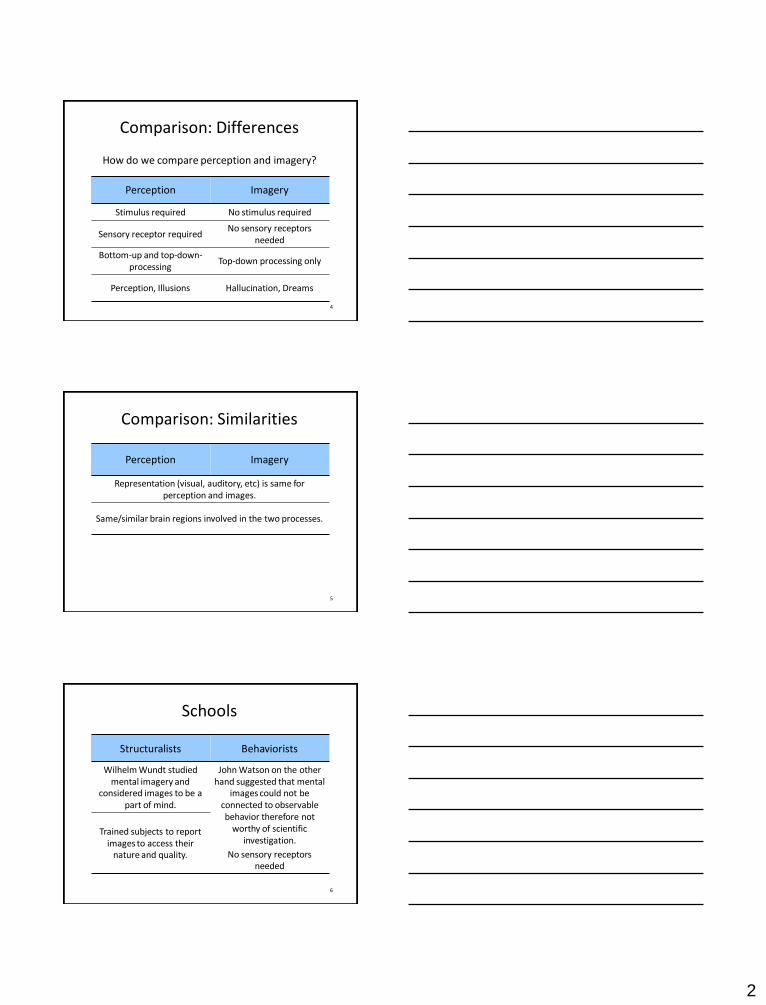
Comparison: Differences
How do we compare perception and imagery?
Perception Imagery
Stimulus required No stimulus required
Sensory receptor requiredNo sensory receptors
needed
Bottom-up and top-down-processing
Top-down processing only
Perception, Illusions Hallucination, Dreams
5
Comparison: Similarities
Perception Imagery
Representation (visual, auditory, etc) is same for perception and images.
Same/similar brain regions involved in the two processes.
6
Schools
Structuralists Behaviorists
Wilhelm Wundt studied mental imagery and
considered images to be a part of mind.
John Watson on the other hand suggested that mental
images could not be connected to observable behavior therefore not
worthy of scientific investigation.
No sensory receptors needed
Trained subjects to report images to access their
nature and quality.

3
7
Research Difficulties
Mental images are not directly observable and fade away quickly (Richardson, 1999).
8
How do we store images?
1. Do we store images in visual forms or in linguistic forms?
2. Do we store information about images in memory and then recreate image?
3. Are images represented differently than facts?
9
Theories
Analog Code Propositional Code
Picture-like code Word-like code
Images are like perception and retain some of the
sensory qualities of perception.
Images are descriptions of visual scenes.
Relations represented implicitly
Relations represented explicitly
Simultaneous Sequential
Different representation for each sense
Same representation for each sense

4
10
Analogical Code
Shepard and Metzler (1971) presented pairs of 3-D line drawings and asked Ss to judge them as same or
different. The second pair of the drawing rotated either in 2-D or 3-D.
11
Images and Rotation
Eight subjects judged 1,600 pair of line drawing with rotations ranging from 20 to 180 degrees. They
measured subjects reaction times.
0 20 40 60 80 100 120Rotation in degrees
1
2
3
4
5
-20 0 20 40 60 80 100 120 140 160 180
Angle of Rotation (2D)
Re
ac
tio
n T
ime
(S
ec
on
ds
)
1
2
3
4
5
-20 0 20 40 60 80 100 120 140 160 180
Angle of Rotation (3D)
Re
ac
tio
n T
ime
(S
ec
on
ds
)
12
Images and Rotation
Reaction times increased linearly as the angle of rotation increased, whether the drawings rotated in 2-D or 3-D. Suggesting an analog representation of
images.

5
13
Images and Rotation
Cooper and Shepard (1973) asked subjects tojudge pairs of alphabets, rotating in 2-D with
much the same results.
R0 60 = 60
R0 120 = 120
R
R0 180 = 180
R0/360 300 = 60
500
600
700
800
900
1000
1100
1200
0 60 120 180 240 300 360
Angle of Rotation (2D)
Re
act
ion
Tim
e (
ms)
14
Letters and Rotation
As degree of rotation increases so does reaction time, therefore the images are rotated in our minds
much like perception.
15
Images and Size
Kosslyn (1983) suggested that we imagine as analogical code.
Imagination Reaction Time
Form image of an elephant, Image a rabbit next to it. Does the rabbit have pink nose?
Slow
(Zoom in on rabbit)
Form an image of a rabbit, Image a fly next to it. Does the rabbit have a pink nose?
Fast
(Already close to the rabbit)

6
16
Images and Size
1. Study map and learn to reproduce it.
2. Mentally travel from one point to another. Measure time to make trip.
3. Expand map mentally. Make the trip again and measure time.
17
Results
1. Time to make trip increases with distance and also when the imagined size of the map increases.
2. Conclusion: Mental travel on the map is like scanning the map with your mind’s eyes.
18
Images and Shape
Are the angle in the faces of the two clocks the same (Pavio, 1978)?
Clock Faces Reaction Time
Slow
Fast

7
19
Results
People with high imagery tend to do better than people with low imagery.
4
5
6
7
8
30 60 90 120
Angle Difference (Degree)
Re
act
ion
Tim
e (
Se
con
ds) High Imagery
Low Imagery
20
Imagery & Perception: Interference
1. Visual imagery interferes with visual perception (Pavio, 1978).
2. Try imagining president Lincoln’s face and read the text given below. Isn’t this hard?
Imagery involves one or more of your five senses, hearing, taste, touch, smell, sight. An author uses a word or phrase to stimulate your memory of those senses. These memories can be positive or negative which will contribute to the mood of your poem…
volw
eb
.utk.e
du
21
Visual & Auditory Imagery
1. How does visual imagery and auditory perception interact?
2. When modalities were the same, images tended to override perception, but when modalities were different subjects are able to perceive the object or sound (Segal & Fusella, 1970).

8
22
Visual & Auditory Imagery
Imagine Stimulus Result
Harmonica sound reported
Could report the arrow
Could not report the arrow
No harmonica sound reported
23
Motor Imagery
1. Participants rotated a joystick (not in view) at either clockwise or anticlockwise direction and simultaneously looked at 2D figures (below) that rotated over certain angles, and responded to the second paired figure as same or different (Wexler, Kosslyn & Berthoz, 1998).
90 degree turn (clockwise).
ww
w.n
trautan
en
.fi
24
Results
2. Reaction times were faster if the rotation of the joy stick was the same as the rotation of the image, and slower if the two were in opposite direction.
0
1
2
3
4
45 90 135
Rotation Angle (Degrees)
Re
acti
on
Tim
e (
Se
con
ds)
Same Direction
Opposite Direction

9
25
Ambiguous Figures
Try this. Imagine the first figure. See if the second figure is part of the first figure.
26
Propositional Code
1. Reed (1974) asked participants to do a similar task. On half the trials the second figure was a part of the first figure, but on the other half it was not.
2. For star-parallelogram type figures accuracy was 14% and across all stimuli only 55%. Suggesting that people were hardly better than chance at deciphering the second figure.
3. This suggested that people used a propositional rather than analogical codes to stores figures.
27
Ambiguous Pictures
1. Chambers and Reisberg (1985) asked participants to look at an ambiguous picture and provide an interpretation (a duck or a rabbit).
2. They were then asked to imagine the picture and give a second interpretation of it. No one was able to do it.

10
28
Ambiguous Pictures
3. The participants were then asked to draw the picture from memory. After drawing the picture the all participants were able to name the picture and provide a second interpretation of it.
4. Chambers and Reisberg (1985) suggest that there is strong propositional (verbal) code that dominates the analog code.
29
Conclusions
1. The above studies supports the conclusion that we use an analog code for simple figures, but when it comes to rich, complicated pictures we use propositional codes.
2. This conclusion is based on the idea that we can hold little information in our memory (working?) for complex visual stimuli.
3. Verbal (propositional) codes may be especially helpful when a visual stimulus is complex.
Anderson & Bower / Pylyshyn
Mental representation use propositions. The same kind of representation is used for all events, verbal or visual.
"the only difference between the internal representation for a linguistic input and a memory
image is detail of information."

11
Propositional Code
The goalkeeper missed the ball
Missed (goalkeeper, ball) Missed (goalkeeper, ball)Wept (goalkeeper)Cursed (goalkeeper)Knelt-down (goalkeeper) …
What you saw What your friend heard
32
Perceptual vs. Imagery Tasks
Imagery Perception Control
Is the X on the F? No question
Positron Emission Tomography (PET)Radioactive marker injected into blood to detect
emissions from marker and blood flow in the brain was monitored. Parts of the brain that are more active require
more blood (Kosslyn, 1994).
33
Results: Perceptual vs. Imagery Task
During perception and imagery same/similar
brain areas were activated (Kosslyn, 1994).

12
34
Cognitive Maps
35
Cognitive Map
1. Mental representation of the external environment that surrounds us.
2. Environment consists of many objects thus cognitive maps represent relationships in objects.
36
Finding Directions
1. Participants: Residents of Venice were asked to describe the most efficient route between two landmarks
2. Raters: Judged the quality of directions based on clarity and other landmark details.
3. Students: made half as many mistakes when given best rated directions compared to poorly rated directions.

13
37
Spatial Cognition
1. Cognitive maps is a subfield of spatial cognition, which refers to thoughts about spatial issues.
2. This field not only addresses issues about maps but also about how we remember the world we navigate through.
3. The field of spatial cognition is interdisciplinary.
38
Interdisciplinary Approach
1. Computer Science: Create models of spatial knowledge.
2. Linguists: How people talk about spatial arrangements.
3. Anthropology: How different cultures use different frameworks to describe locations.
4. Geography: Study all of the above to create efficient maps.
39
Draw Directions
Look at this map and then answer the following
questions on a separate piece of paper:
2. If you stand at position 3 facing 4, point to position 1.
3. Standing at position 1 facing 2, point to position 4.
1
2 3
4

14
40
Draw Directions: Individual Differences
1. Question 1 is easier to respond to because the map and the viewer have the same orientation, question 2 required mental rotation of the map thus usually takes longer.
2. Individuals differ in their ability to judge space.
41
Analog & Propositional Codes
1. Investigators tend to believe that we encode maps by using both analog and propositional codes.
2. This is especially true when we have images of landmarks in a map. We generally tend to connect those landmarks with verbal description.
42
Maps and Distance
Judgment of distance between two landmarks is inflated if there are other landmarks in between
them and underestimated if nothing lies in between the two land marks (Thorndyke, 1981).
A
B
C

15
43
Clustering Bias
Semantics may lead to incorrect estimation of distance between landmarks. Two buildings that
belong (semantically) to each other may be judged closer (clustered) than building that is semantically
different.
Gas Tank
Dorm 2Dorm 1
44
Landmark Effect
General tendency to underestimate distances when traveling from a non-land mark to a landmark than
reverse (Devlin, 2001; Tversky, et al., 1999).
NewTown
Marshland
45
Maps and Heuristics
1. We use heuristics about map shapes. More angled streets are imagined as straight. Therefore we tend to bias our estimates about shape of our maps.
2. Symmetry heuristics help us remember a curved road more than an irregular road.
3. Rotation heuristic lead us to alter our maps in the vertical dimension. Objects/landmarks rotated vertically.
4. Alignment heuristic lead us to keep landmarks aligned in straight lines.

16
Reno
SanDiego
46
Rotational Heuristic
Which city is farther west? San Diego or
Reno? Subjects reported San Diego. The reason for doing so was due to rotation heuristic. The
subjects tend to straighten the tilted
California’s coastline.
Reno
SanDiego
47
Alignment Heuristic
Is Philadelphia north of Rome? Subjects said “yes”. In fact Rome is north of Philadelphia. The reason being alignment heuristic. The subjects tend to think that Rome is in the south of Europe
and Philadelphia in in the north of North America, thus Philadelphia is north of Rome.