Embed Size (px)
Citation preview
Images as Biomarkers – potential future advances in the field as viewed by ISPY-2
Nola Hylton, PhDUniversity of California, San Francisco
Images as Biomarkers• POTENTIAL/PROMISE:
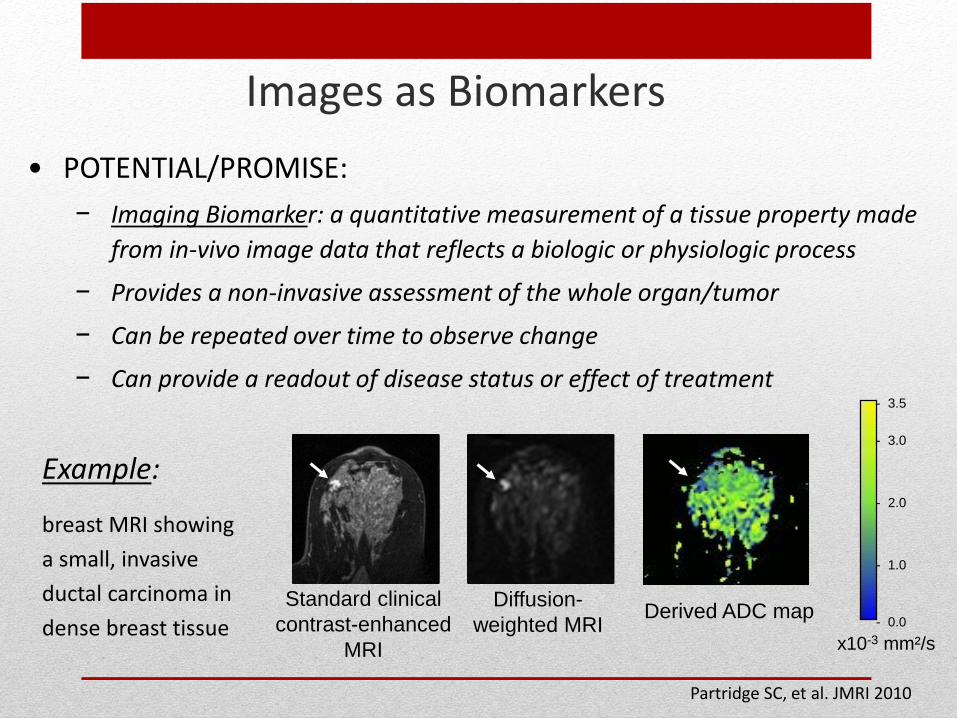
− Imaging Biomarker: a quantitative measurement of a tissue property made from in-vivo image data that reflects a biologic or physiologic process
− Provides a non-invasive assessment of the whole organ/tumor
− Can be repeated over time to observe change
− Can provide a readout of disease status or effect of treatment
Standard clinical contrast-enhanced
MRI
Diffusion-weighted MRI Derived ADC map
x10-3 mm²/s
- 3.5
- 2.0
- 0.0
- 1.0
- 3.0
Partridge SC, et al. JMRI 2010
Example:
breast MRI showing a small, invasive ductal carcinoma in dense breast tissue
Images as Biomarkers• CHALLENGES/BARRIERS:
− Vast number of candidate imaging biomarkers (many imaging modalities –
PET, MRI, US, optical; many quantification methods)
− Technical requirements for clinical imaging and biomarker imaging can be
conflicting (anatomic clarity versus quantitative accuracy; biomarker images
do not always make the prettiest picture)
− Imaging biomarkers need to be optimized for their application (ie., to improve
diagnostic specificity; to predict risk or survival)
− Comparative optimization of imaging biomarkers requires prospective,
standardized collection of imaging datasets and associated outcomes
Different drivers for optimizing clinical imaging and biomarker imaging
• CLINICAL IMAGING: Anatomic clarity and speed
− Image enhancements and filters used to improve contrast, image quality and lesion conspicuity
− Scan time reduction strategies utilized to improve efficiency
− Adjustments made for patient-based optimization of parameters
• BIOMARKER IMAGING: Accuracy and repeatability
− Image acquisition designed to maximize quantitative accuracy
− Controllable errors are minimized (often at expense of resolution, scan time)
− Inter- and intra-patient variability are minimized (fixed protocols; no patient-specific adjustments; controlled introduction of software/hardware upgrades)
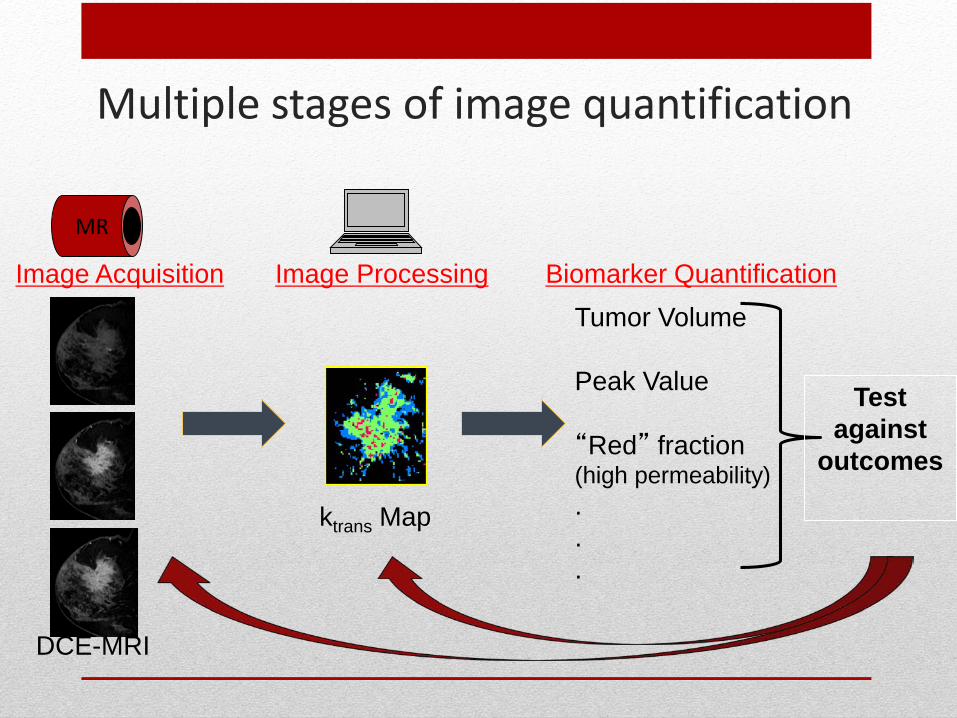
Multiple stages of image quantification
Image Acquisition Image Processing Biomarker Quantification
MR
DCE-MRI
ktrans Map
Tumor Volume
Peak Value
“Red” fraction (high permeability)...
Test against
outcomes
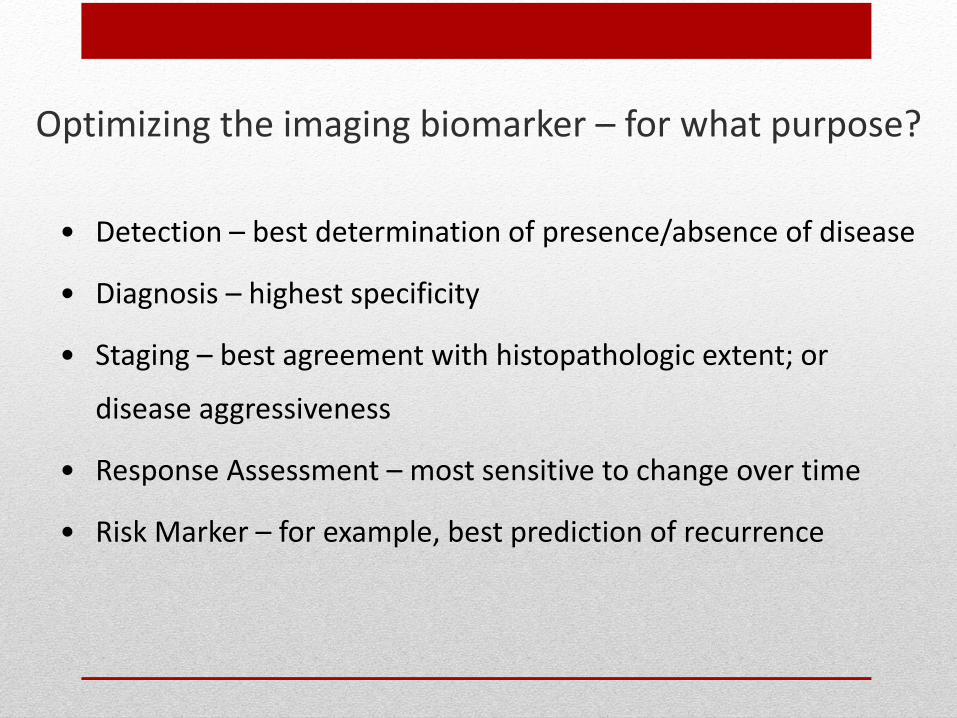
Optimizing the imaging biomarker – for what purpose?
• Detection – best determination of presence/absence of disease
• Diagnosis – highest specificity
• Staging – best agreement with histopathologic extent; or
disease aggressiveness
• Response Assessment – most sensitive to change over time
• Risk Marker – for example, best prediction of recurrence
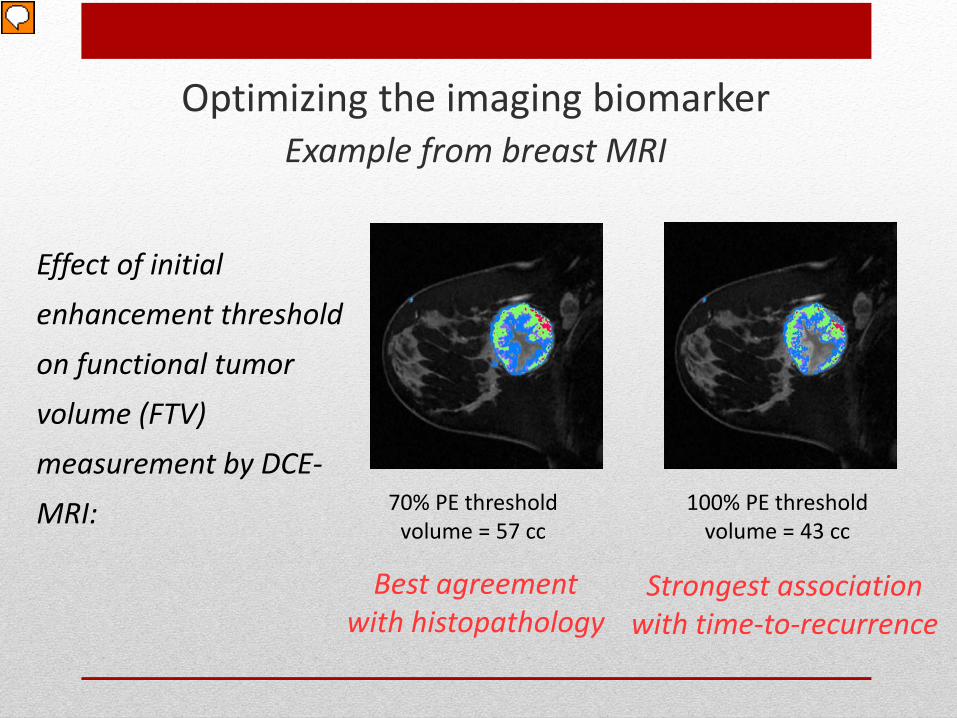
70% PE thresholdvolume = 57 cc
Best agreement with histopathology
100% PE thresholdvolume = 43 cc
Strongest association with time-to-recurrence
Optimizing the imaging biomarkerExample from breast MRI
Effect of initial enhancement threshold on functional tumor volume (FTV) measurement by DCE-MRI:
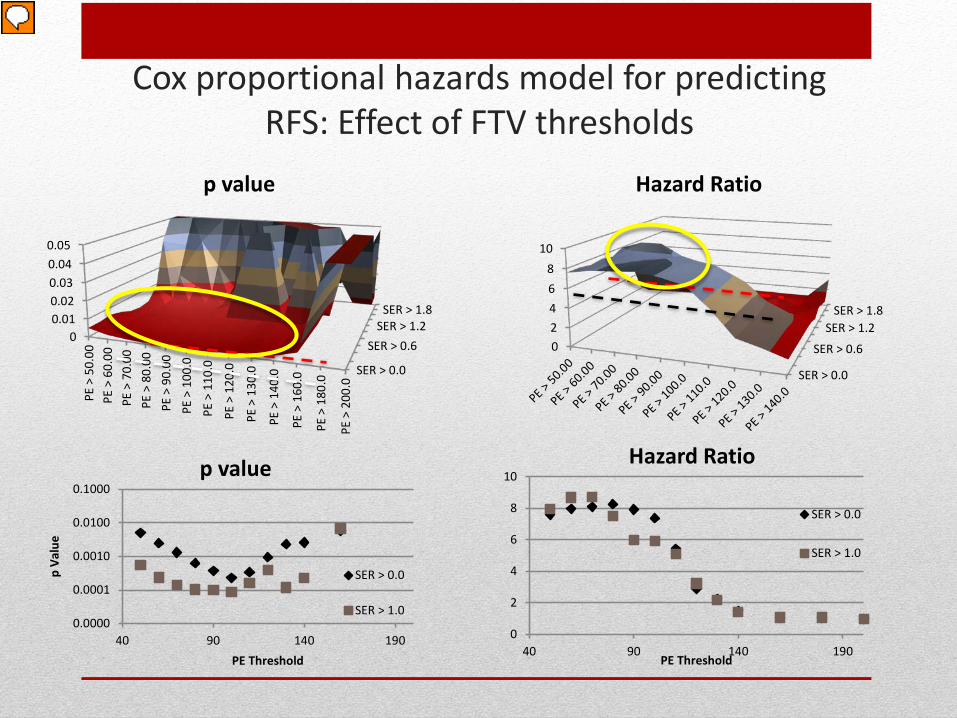
Cox proportional hazards model for predicting RFS: Effect of FTV thresholds
SER > 0.0
SER > 0.6SER > 1.2
SER > 1.8
00.010.020.030.040.05
PE >
50.
00PE
> 6
0.00
PE >
70.
00PE
> 8
0.00
PE >
90.
00PE
> 1
00.0
PE >
110
.0
PE >
120
.0
PE >
130
.0
PE >
140
.0
PE >
160
.0
PE >
180
.0
PE >
200
.0
p value
0.0000
0.0001
0.0010
0.0100
0.1000
40 90 140 190
p Va
lue
PE Threshold
p value
SER > 0.0
SER > 1.0
SER > 0.0
SER > 0.6
SER > 1.2SER > 1.8
02468
10
Hazard Ratio
0
2
4
6
8
10
40 90 140 190PE Threshold
Hazard Ratio
SER > 0.0
SER > 1.0
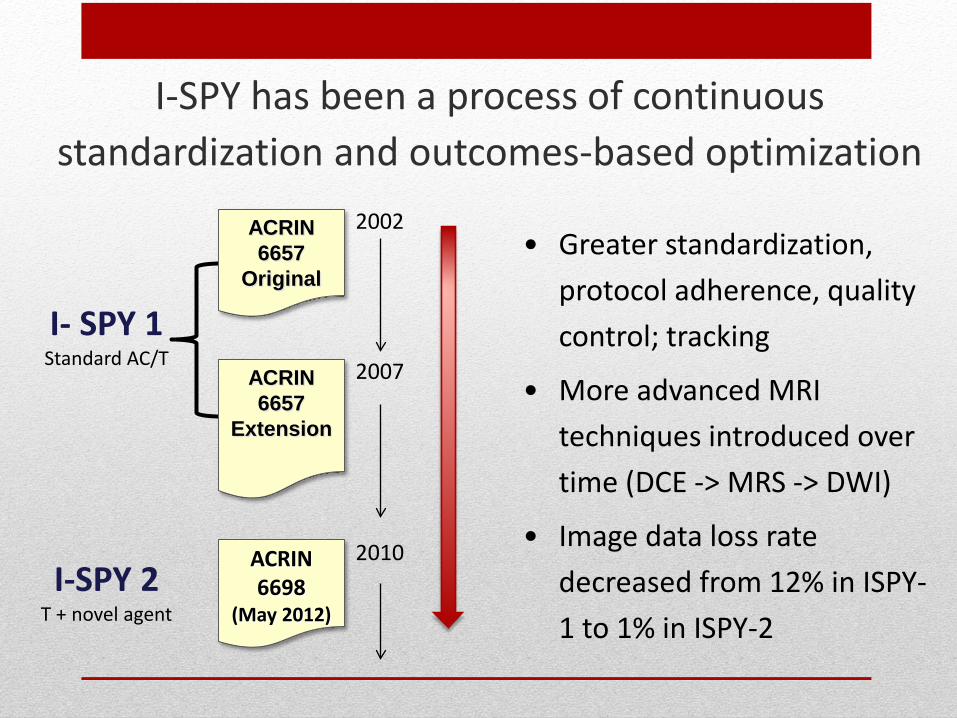
I-SPY has been a process of continuous standardization and outcomes-based optimization
ACRIN 6698
(May 2012)I-SPY 2
T + novel agent
ACRIN 6657
Extension
ACRIN 6657
Original
I- SPY 1Standard AC/T
2002
2007
2010
• Greater standardization, protocol adherence, quality control; tracking
• More advanced MRI techniques introduced over time (DCE -> MRS -> DWI)
• Image data loss rate decreased from 12% in ISPY-1 to 1% in ISPY-2
* developed under NCI Academic-Industrial Partnership (AIP) Grant “Real-time in vivo MRI biomarkers for breast cancer pre-operative treatment trials” (R01 CA132870)
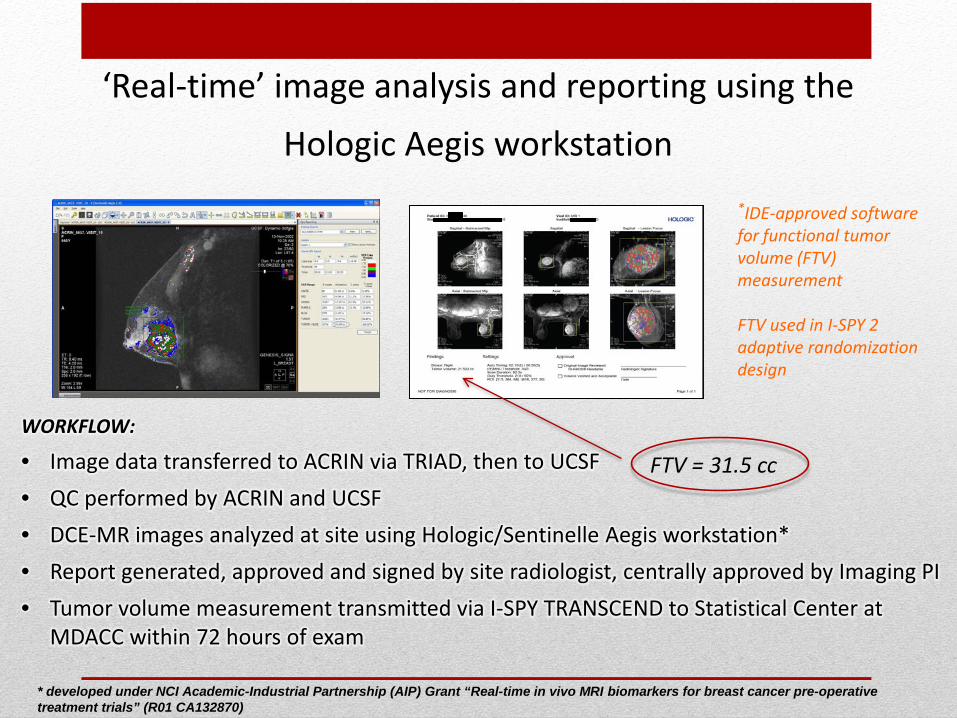
WORKFLOW:
• Image data transferred to ACRIN via TRIAD, then to UCSF• QC performed by ACRIN and UCSF• DCE-MR images analyzed at site using Hologic/Sentinelle Aegis workstation*• Report generated, approved and signed by site radiologist, centrally approved by Imaging PI• Tumor volume measurement transmitted via I-SPY TRANSCEND to Statistical Center at
MDACC within 72 hours of exam
*IDE-approved software for functional tumor volume (FTV) measurement
FTV used in I-SPY 2 adaptive randomization design
‘Real-time’ image analysis and reporting using the Hologic Aegis workstation
FTV = 31.5 cc
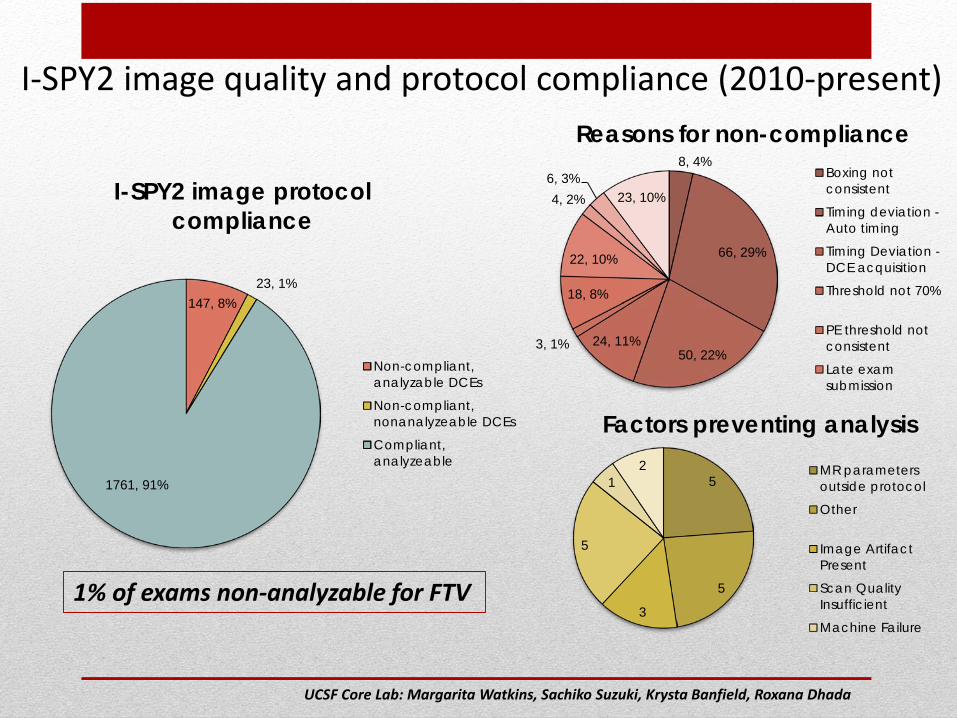
I-SPY2 image quality and protocol compliance (2010-present)
1% of exams non-analyzable for FTV
147, 8%23, 1%
1761, 91%
I-SPY2 image protocol compliance
Non-compliant,analyzable DCEs
Non-compliant,nonanalyzeable DCEs
Compliant,analyzeable
5
5
3
5
12
Factors preventing analysisMR parametersoutside protocol
Other
Image ArtifactPresent
Scan QualityInsufficient
Machine Failure
8, 4%
66, 29%
50, 22%24, 11%3, 1%
18, 8%
22, 10%
4, 2%6, 3%
23, 10%
Reasons for non-complianceBoxing notconsistent
Timing deviation -Auto timing
Timing Deviation -DCE acquisition
Threshold not 70%
PE threshold notconsistent
Late examsubmission
UCSF Core Lab: Margarita Watkins, Sachiko Suzuki, Krysta Banfield, Roxana Dhada
• Quantitative Imaging (QI) metrics have enormous potential to be employed as biomarkers
• Several QI biomarkers are gaining acceptance (PET-SUV, DCE-MRI)
• Many efforts are underway to unify and disseminate standards for quantitative imaging (QIBA, QIN, ACRIN)
• Familiarity and acceptance of QI standards are increasing in the clinical environment and among equipment manufacturers
Where we are..
What’s Needed• Collaboration among imaging scientists and clinical trials investigators to
promote and reinforce QI standards in the clinical environment
‒ This has been done successfully in ISPY-2
‒ The value of the imaging biomarker relies on the quality of the image acquisition
• Partnerships with equipment manufacturers to address the mixed needs of
clinical diagnostic and biomarker imaging
• Embedded processes for testing, optimizing and comparing imaging
biomarkers in prospective, controlled clinical trials
‒ Imaging scientists need meaningful settings for developing and testing imaging
biomarkers
6657/I-SPY 1 Trial Team• UCSF Imaging Core Lab Members‒ David Newitt, Sheye Aliu, Margarita Watkins, Sachiko Suzuki, Krysta Banfield, Roxana
Dhada, Evelyn Proctor, Jessica Gibbs, Ella Jones, Lisa Wilmes
• ACRIN 6657 Trial Team‒ N. Hylton, B. Joe, M. Watkins, S. Suzuki, D. Newitt, E. Proctor, UCSF; J. Blume, H. Marques,
B. Herman, C. Gatsonis, B. Dunning, ACRIN DMC; M. Rosen, M. Schnall, U Penn; E. Pisano, UNC, E. Morris, MSKCC; W. Bernreuter, UAB; S. Polin, Georgetown; C. Lehman, S. Partridge, U Wash; P. Weatherall, UTSW; G. Newstead, U Chicago; P. Bolan, U Minnesota; B. LeStage, N. Sauers, ACRIN Advocates
• I-SPY Trial Network‒ L. Esserman, J. Gray, L Vantveer, UCSF; A. DeMichelle, U Penn; D. Berry, F. Symmans,
MDACC, L Carey, C. Perou, UNC, L. Montgomery, C. Hudis, MSKCC; H. Krontiras, UAB; M. Liu, Georgetown; J. Gralow, U Wash; D. Tripathy, UTSW; F Olopade, U Chicago; D. Yee, U Minnesota; S. Madhavan, K. Buetow, E. Petricoin, J. Perlmutter, NCICB