Embed Size (px)
Citation preview

1

World Bank
December 2, 2020
SHAPING THE FUTURE IN BUSINESS
MEASUREMENT AND ASSURANCE:
EMBRACING TECHNOLOGY AND CHANGE
Creating a Digital Strategy

Outline
• Introduction
– The CarLab
• Some of our projects
– GASB –PIR
– Exogenous Data
– PIOB – what is public interest?
– Machine Learning for accounting estimates
– Big data analytics
– Cooperation with the Volcker Alliance
– Continuous assurance of medication procurement of a state
– NYC cleanliness with Tweet text mining
– Continuous pandemic monitoring
3

INTRODUCTION
The CarLab
4
CarLab

5
All academic Accounting programs around the world are ranked annually by BYU. For many years now, the Accounting Information Systems (AIS) group at RBS has led the world in the application of information technology to the audit profession. We are very proud to announce that the just-released BYU rankings for 2019 confirm again the continued success of Rutgers Business School in both AIS and audit research:

6

Updating Dashboard with document links
7
http://raw.rutgers.edu/CAR%20Lab%20Directory/Sign-in.html
PASSWORD: RARC777


10

GASB
Post-Implementation Review
Project
Ben Yoon
Huaxia Li
Kevin Moffitt
Rutgers CarLab
July 2020

• This project will build a dynamic information system that
1) automatically captures the CAFRs from different
governmental entities,
2) parses relevant items from the CAFRs, and
3) converts them into a structured data
• The structured data be easily used by the GASB to perform the
post-implementation review (PIR) of the new GASB pension
standards.
* In 2012, the GASB announced new pension standards (No. 67 and 68).
Project Objectives
12

• This project consists of 4 steps.
Collect
CAFRs
Convert
CAFRs
Analyze CAFRs
(117 pre-defined
items)
Create
reports
• Rutgers has conducted initial pilot tests.
- Step1: Collecting 36,676 CAFRs from 3 repositories
- Step2: Converting PDF documents
- Step3: Extracting 8 items from the CAFRs
- Step4: Report with Excel format
4 Steps of This Project
13

Miklos A. Vasarhelyi
Helen Brown Liburd
Rutgers Business School
Exogenous data analytics for Auditing

Some sources
• Amazon sales
• Google searches
• Apps used
• Calls made
• GPS or JEEP location
• Sites accessed
• Car license plates photographed
• Pictures of parking lots
• Face recognition pictures
• Site clickpaths
15

16
Social
MediaInternet
of
Things
Economic
data
Weather
data
Locational
data
Internet
sales data
Search
Data
Click
data
ED may be of easier
access
ED is likely less
tamperable
ED relationships will
be stochastic
ED is a form of
confirmationED may complement
many current
procedures
ED may create many
new procedures
Exogenous Data

17

18

IFAC / PIOB project
Kevin Moffitt
Ben Yoon
Hiaxia Li

Rutgers/ PIOB / IFAC Project
• The Public Interest Oversight Board (PIOB) is the global
independent oversight body that seeks to improve the quality
and public interest focus of the international audit and
assurance, and ethics standards formulated by the Standard
Setting Boards supported by the International Federation of
Accountants (IFAC).
• The Rutgers team will automatically identify public interest
regarding auditing from investor, regulator, and professional
accounting websites.
20

Problem: Automatically identify public interest
from investors, regulators, etc…
• Collected and cleaned 7159 documents from 5/40
identified organizations
– ESMA - 4145
– IOSCO - 1164
– SIFMA - 959
– THEIA - 731
– ICGN – 160
• Searched 30 topics identified by PIOB
audit deficiencies conflict of interest fee dependency objectivity
audit quality critical mindset fraud professional
skepticism
auditor independence ethical behavior going concern …and more…
21

Example Sentences Automatically Identified
from Websites
Audit
Quality
www.IOSCO.org 2018 – “this may provide an effective safeguard that a decision is
not unduly influenced by a low audit fee in circumstances where audit quality may
be compromised.”
Auditor
Independen
ce
www.ICGN.org 2018– “so, as you can see, while things have changed since the
passage of the sarbanes-oxley act, it appears that new threats to auditor
independence have emerged, and that others have reappeared.”
Going
Concern
www.ESMA.Europa.eu 2019 – “accordingly, the fair value of the land should be
determined based on the current use of the land in view of the going concern
principle.”
Fraud www.THEIA.org 2019 – “would it be possible to devise a 'reasonable person' test in
assessing the auditors work in relation to fraud detection?”
Professiona
l
Skepticism
www.THEIA.org 2019 – “annually it should assert why it believes the auditor has
been challenging and exercised professional skepticism.”
22

Machine Learning Improves
Accounting Estimates文稿封面标题
Lorem ipsum dolor sit amet, consectetur adipiscing elit.
KexingDing1
Baruch Lev2
Xuan Peng3
Ting Sun4
Miklos A. Vasarhelyi5
1Southwestern University of Finance and Economics; and Rutgers, the State University of New Jersey2Stern School of Business, New York University3Southwestern University of Finance and Economics; and Rutgers, the State University of New Jersey4The College of New Jersey5Rutgers, the State University of New Jersey

Accounting Estimates
• Accounting estimates are highly uncertain and are sometimes manipulated.
• Accounting estimates are difficult to audit and impossible for investors to
evaluate.
• Accounting estimates are ubiquitous in financial reporting.
– Example: account receivables, insurance loss reserves, revenues from contracts, and
pension and warranty expenses.
• Researchers have made several proposals:
– Financial statements disclose which accounts are subject to extreme uncertainty
(Christensen et al. 2012).
– Firms report ex-post realization of critical estimates (e.g., Lundholm 1999).
– Managers restate earnings in case of large deviations (Lev et al. 2008).
24

Machine Learning Algorithms
• Linear Regression
• Random Forest
• Gradient Boosting Machine (Gradient
Tree Boosting)
• Artificial Neural Networks
25

Main Results Summarized
Table 5 Cross-validation results
26
Business lineTraining/Validat
ion SampleObs Managers’ estimates Machine learning without manager estimates Machine learning with manager estimates
MAE RMSE MAE RMSE
Accuracy edge
MAE RMSE
Accuracy edge
(MAE) (RMSE) (MAE)(RMSE
)
Private Passenger
Auto Liability
Random forest Random forest
1996-2005 5,949 9,461 37,494 8,213 34,687 13% 7% 7,758 36,071 18% 4%
1996-2006 6,298 9,793 38,266 7,848 34,547 20% 10% 7,220 30,305 26% 21%
1996-2007 6,602 9,575 37,940 7,869 35,047 18% 8% 6,902 30,220 28% 20%
Commercial Auto
Liability
Random forest Random forest
1996-2005 5,383 4,209 18,562 3,565 14,051 15% 24% 3,446 13,555 18% 27%
1996-2006 5,661 4,155 18,375 3,520 13,881 15% 24% 3,266 13,583 21% 26%
1996-2007 5,957 4,338 19,175 3,575 13,671 18% 29% 3,322 13,121 23% 32%
Workers’
Compensation
Random forest Random forest
1996-2005 4,183 11,547 43,652 7,518 29,418 35% 33% 7,144 28,629 38% 34%
1996-2006 4,398 12,360 44,187 7,434 29,387 40% 33% 6,988 26,888 43% 39%
1996-2007 4,645 13,214 47,541 7,298 29,468 45% 38% 6,861 26,574 48% 44%
Commercial Multi-
Peril
Random forest Random forest
1996-2005 5,235 5,737 27,615 5,103 22,060 11% 20% 4,854 22,062 15% 20%
1996-2006 5,457 5,871 27,931 5,151 23,404 12% 16% 4,968 22,308 15% 20%
1996-2007 5,846 6,017 28,349 4,963 22,556 18% 20% 4,534 21,265 25% 25%
Homeowner/Farmo
wner
Linear regression Linear regression
1996-2005 6,121 3,905 16,789 5,674 22,069 -45% -31% 4,402 16,359 -13% 3%
1996-2006 6,544 3,878 16,611 5,687 21,070 -47% -27% 4,203 16,201 -8% 2%
1996-2007 6,946 3,962 16,826 5,548 21,269 -40% -26% 4,321 16,674 -9% 1%

Concluding Remarks
• There is an urgent need to enhance the quality of accounting estimates and
auditors’ ability to independently evaluate the reliability of these estimates.
• Machine learning can generate accounting estimates useful for auditors to
evaluate managers’ estimates, and for managers to generate original
estimates.
• These finding should be of value for consideration of the value of machine
learning models to standard setters.
• More research is needed to generalize the application of machine learning in
other accounting settings.
27

Big data and algorithmic trading against
periodic and tangible asset reporting: the
need for U-XBRL
Dr. Miklos A. VasarhelyiKPMG Distinguished Professor Rutgers Business School - Newark & New Brunswick
Director, Rutgers Accounting Research Center & Continuous Auditing & Reporting Lab
Duo (Selina) PeiPhD Student Rutgers Business School - Newark & New Brunswick
Some other phenomena observed
Internal
Data
Intangibles
Exogenous
Data
Weather
Internet of
Things
Mobility
Data
Locational
Data
Sales
Economic
Social
Media
Interlinkages
Human
Resources
Peer-to-Peer
Supply Chain
Inventory
General Ledger
Internet
Protocol
Order-to-Cash
29

We need a reporting schema that also integrates
well with current advances in auditing
30

So what kind of information may be missing?
- SASB metrics - Intellectual property and data privacy (Industry-specific)
- Integrity and recruitment/retention programs (Overall)
- “The relationships between [an organization’s] various operating and functional units and the
capitals that the organization uses or affects” in the International Integrated Reporting Council
Framework (2013)
31

ESSAY 2: COOPERATION
WITH THE VOLCKER
ALLIANCE
APPLICATIONS OF DATA ANALYTICS: VISUALIZATION AND CLUSTER
ANALYSIS OF GOVERNMENTAL DATA – TWO CASE STUDIES
32

OBJECTIVES• Since data analytics is one way to explore the data and to
help uncover hidden relationships– In these case studies we plan to explore the literature for the use of emerging data
mining techniques in auditing
✓ In particular, cluster analysis & visualization techniques as supportive tools to gain more
insights into data.
• Conduct two case studies:
1) Rutgers AICPA Data Analytics Research Initiative (RADAR): A Case
Study.
✓ Facilitate the integration of different data analytics tools and techniques into the
audit process.
2) Visualization and Clustering Analytics of U.S. states’ on budgeting.
✓ Information on U.S. States.
CONTRIBUTION
• We show how visualization and data clustering techniques
could be used on governmental data and to help gain more
information about financial statements & budgeting. 33

CONT’D: Moody’s Ratings
34

CONT’D: Clustering Results
35

Continuous Monitoring and Audit
Methodology for Medication
Procurement
Wenru Wang – Rutgers University
Miklos A. Vasarhelyi – Rutgers University

Overview
• Prefeitura de Rio de Janeiro. 30,000+ Medication procurement
data, 2017 – 2019.
• Continuous monitoring and audit system for exception and
anomaly detections.
37

Continuous Monitoring Dashboard
38

New York City Street Cleanliness:
Apply Text Mining Techniques to Social
Media Information
Huijue Kelly Duan1
Mauricio Codesso2
Zamil Alzamil3
1Rutgers, the State University of New Jersey2Northeastern University
3Majmaah University
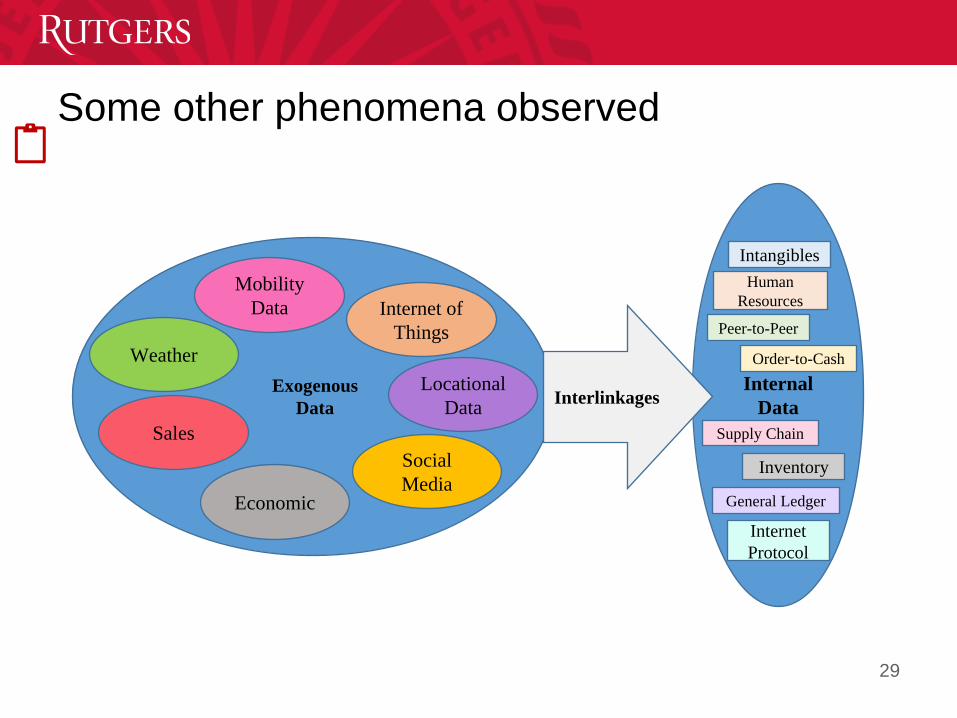
• NYC government performs a cleanliness inspection every year, the
method has not changed for nearly 50 years
• NYC districts receive ratings of 90% or higher; therefore, NYC
government rates majority of its streets as acceptably clean
• NYC residents increasingly contact DSNY via 311 about missing trash
pickups, overflowing litter baskets, and dirty conditions
Motivation
40

• Examine the social media information
➢ to identify temporal trends and patterns of the cleanliness of NYC streets
➢ to analyze whether crowdsourcing information is consistent with NYC
cleanliness ratings
➢ to assess the performance of municipal services via sentiment analysis
Objective
41

Data
Preparation
Relevancy
Determination
Sentiment
Analysis
Workflow
Step 1 Step 2 Step 3 Step 4
• Twitter API
(Streaming API)
• 6.8M collected
(8/27/2018 -
5/22/2019)
• Data Cleaning
• Variable Selection and
Aggregation
• Data Aggregation
• Negative
• Positive
• Neutral
Data
Collection
• Apply Keyword List
• Data Preprocessing
• Supervised Machine Learning
❖ Naïve Bayes
❖ Random Forest
❖ XG Boost42

Twitter Dashboard
43
Continuous Intelligent Pandemic Monitoring
(CIPM)
Huijue Kelly Duan
Hanxin Hu
Miklos Vasarhelyi
Accounting Information System
Rutgers, the State University of New Jersey

Research Objective
45
• Use measurement science (accounting), assurance science
(auditing) to enhance pandemic responses
• This study aims to establish a Continuous Intelligent Pandemic
Monitoring system (CIPM)
– Validate the epidemic related numbers
– Provide guidance to policymakers so that sufficient
resources can be allocated to the upcoming high risky areas

46
Data Collection
• Collect relevant exogenous and endogenous data sources
✓ Total confirmed cases, Total deaths, Daily confirmed cases, Daily deaths, Total test, number of positive tests, etc.
✓ Demographic density, Industrial jobs, Industrial establishments, % of urban population, Territorial extension of the municipality, list of municipalities by region, Volume of passengers carried, Transported cargo flow, GDP, etc.
✓Apple mobility, Google trends, Official announcements, Tweets, Unemployment claims filed, etc.
Model Construction
• Establish a systematic and continuous COVID-19 monitoring model
✓ Use time series and machine learning algorithms to perform predictive analytics
✓Apply clustering approach to perform cross sectional analysis
✓ Simulate the Epidemic models
Alert
• Incorporate audit risk assessment to establish an alert system
✓ The number reasonableness
✓ Disease severity
✓ Regional severity
✓ The policy sufficiency
Action Recommendat
ions
• Present guidance to policymakers based on the simulation results
✓ Number validation
✓ Peer groups evaluation
✓ Policy simulations
Figure 1. Continuous Intelligent Pandemic Monitoring Framework

47

48
Figure 3: Use SEIQHRF model to simulate the impacts of different social
interventions policies assuming the total number of population is equal to
10000. When enforcing self-isolation and social distancing, we can better
control the transmission of COVID-19.
A Machine learning approach To
measuring audit quality With surprise
scores:
Evidence from China
Authors:
Hanxin Hu (Rutgers),
Ting Sun (TCNJ),
Miklos A. Vasarhelyi (Rutgers),
Min Zhang(Renmin University, China)

Data • Dependent variables (we developed a prediction model for
each dependent variable):
– Net income adj
– Total assets adj
– Total liability adj
– Stockholders’ equity adj
– Income before income tax adj
– Income tax adj
– nonclean opinion
– Restatement(misstatement)
• Independent variables (example: using net income
adjustment as the dependent variable):
Companies’ characteristics (27 variables)
Audit firms’ characteristics (28 variables), e.g., revenue,
subsidiaries, net assets
Audit partners’ characteristics (15 variables), e.g., education,
age, gender, birthplace, title
• Data sources: Chinese Ministry of Finance, CICPA (Chinese
Institute of CPAs), CSMAR(China Stock Market & Accounting
Research Database)
• Research period: 2010-2017
• Data size: 11574
• Data splitting: training (6626 observations) /test (1325
observations)/application (3546 observations)
Machine learning algorithms
■ Random Forest
■ SVM
■ Gradient boosting
■ XGBoosting
■ Deep neural networks
■ Logistic regression (the bench mark algorithm)
■ RUSboosting
■ Balanced Random Forest

Prediction Results
Figure 1: ROC AUC for varying algorithms when
“nonclean opinion” is the target variable
Figure 2: ROC AUC for varying algorithms when “net
income adjustments” is the target variable

Independent variable Estimated
coefficient
P value
Nonclean audit opinion -27.78 0.960933
Nonclean opinion surprise score (ML) 3.467 7.84e-13 ***
The aggressiveness score (Logistic) 0.3958 0.008126 **
Application: Results
1. Nonclean audit opinion; Nonclean opinion surprise score; The aggressiveness
score
2. Net income adjustment; Net income adjustment surprise score; The
aggressiveness score Independent variable Estimated
coefficient
P value
Net income adjustment -0.01700 0.853533
Net income adjustment surprise
score (ML)
0.01105 0.911363
The aggressiveness score (Logistic) 0.02298 0.812480Note: the regression results for other audit adjustment variables are similar to those for net
income adjustment.

Multidimensional Clustering for audit fault
detection
Sutapat Thiprungsri
Miklos A. Vasarhelyi
53

545454
Metlife
• Data stream of over 200K wire transfers
• Data only currently available for the wires and the records
possess little information
• Little context knowledge of the major feeding streams
• No fraud training data available
• Worked during the audit supplementing the audit team work
• Developed a series of data filters relating to specific
conditions and trends
• Working on an aggregate weighting model
• Need in the field verification of picked data

Visualizing combination of attributes, we will be able to see similarity and differences among claims

Analyzing individual variables, we will be able to see clearly that some claims have rare values
56

57
Conclusions
• A wide range of analytic methodologies exists to treat any
data rich problem
• Change is very slow rule to anachronistic regulations and
embedded interests, as well as lack of training within
organizations
• CarLab develops an approach for each project it does
– If you know what you are doing you are not doing research (Albert
Einstein)
• The World Bank has the scope and nature to be an ideal
location for experimental analytics using, big data, exogenous
variables, machine learning, and a set of out-of-the-box
sensing and measurement methods
58