Embed Size (px)
Citation preview

University of Birmingham
Imaging and Analysis of Individual CavitationMicrobubbles around Dental UltrasonicVyas, Nina; Sammons, Rachel; Walmsley, Anthony; Wang, Qian; Dehghani, Hamid;Leppinen, DavidDOI:10.1016/j.ultras.2017.05.015
License:Creative Commons: Attribution (CC BY)
Document VersionPublisher's PDF, also known as Version of record
Citation for published version (Harvard):Vyas, N, Sammons, R, Walmsley, A, Wang, Q, Dehghani, H & Leppinen, D 2017, 'Imaging and Analysis ofIndividual Cavitation Microbubbles around Dental Ultrasonic', Ultrasonics, vol. 81, pp. 66–72.https://doi.org/10.1016/j.ultras.2017.05.015
Link to publication on Research at Birmingham portal
General rightsUnless a licence is specified above, all rights (including copyright and moral rights) in this document are retained by the authors and/or thecopyright holders. The express permission of the copyright holder must be obtained for any use of this material other than for purposespermitted by law.
•Users may freely distribute the URL that is used to identify this publication.•Users may download and/or print one copy of the publication from the University of Birmingham research portal for the purpose of privatestudy or non-commercial research.•User may use extracts from the document in line with the concept of ‘fair dealing’ under the Copyright, Designs and Patents Act 1988 (?)•Users may not further distribute the material nor use it for the purposes of commercial gain.
Where a licence is displayed above, please note the terms and conditions of the licence govern your use of this document.
When citing, please reference the published version.
Take down policyWhile the University of Birmingham exercises care and attention in making items available there are rare occasions when an item has beenuploaded in error or has been deemed to be commercially or otherwise sensitive.
If you believe that this is the case for this document, please contact [email protected] providing details and we will remove access tothe work immediately and investigate.
Download date: 13. Feb. 2022

Ultrasonics 81 (2017) 66–72
Contents lists available at ScienceDirect
Ultrasonics
journal homepage: www.elsevier .com/ locate/ul t ras
Imaging and analysis of individual cavitation microbubbles arounddental ultrasonic scalers
http://dx.doi.org/10.1016/j.ultras.2017.05.0150041-624X/� 2017 The Authors. Published by Elsevier B.V.This is an open access article under the CC BY license (http://creativecommons.org/licenses/by/4.0/).
⇑ Corresponding author at: School of Dentistry, University of Birmingham, MillPool Way, Birmingham B5 7EG, UK.
E-mail address: [email protected] (A.D. Walmsley).
N. Vyas a,b, H. Dehghani c, R.L. Sammons b, Q.X. Wang d, D.M. Leppinen d, A.D. Walmsley b,⇑a Physical Sciences of Imaging for Biomedical Sciences (PSIBS) Doctoral Training Centre, College of Engineering & Physical Sciences, University of Birmingham, Birmingham B15 2TT, UKb School of Dentistry, College of Medical and Dental Sciences, University of Birmingham, Mill Pool Way, Birmingham B5 7EG, UKc School of Computer Science, University of Birmingham, Edgbaston, Birmingham B15 2TT, UKd School of Mathematics, University of Birmingham, Edgbaston, Birmingham B15 2TT, UK
a r t i c l e i n f o a b s t r a c t
Article history:Received 11 January 2017Received in revised form 23 May 2017Accepted 23 May 2017Available online 24 May 2017
Keywords:Cavitation bubblesBubble analysisPiezoelectric devicesImage processingHigh speed imagingUltrasonic dental scalers
Cavitation is a potentially effective and less damaging method of removing biofilm from biomaterial sur-faces. The aim of this study is to characterise individual microbubbles around ultrasonic scaler tips usinghigh speed imaging and image processing. This information will provide improved understanding on thedisruption of dental biofilm and give insights into how the instruments can be optimised for ultrasoniccleaning. Individual cavitation microbubbles around ultrasonic scalers were analysed using high speedrecordings up to a million frames per second with image processing of the bubble movement. The radiusand rate of bubble growth together with the collapse was calculated by tracking multiple points on bub-bles over time. The tracking method to determine bubble speed demonstrated good inter-rater reliability(intra class correlation coefficient: 0.993) and can therefore be a useful method to apply in future studies.The bubble speed increased over its oscillation cycle and a maximum of 27 ms�1 was recorded during thecollapse phase. The maximum bubble radii ranged from 40 to 80 mm. Bubble growth was observed whenthe ultrasonic scaler tip receded from an area and similarly bubble collapse was observed when the tipmoved towards an area, corresponding to locations of low pressure around the scaler tip. Previous workshows that this cavitation is involved in biofilm removal. Future experimental work can be based on thesefindings by using the protocols developed to experimentally analyse cavitation around various clinicalinstruments and comparing with theoretical calculations. This will help to determine the main cleaningmechanisms of cavitation and how clinical instruments such as ultrasonic scalers can be optimised.� 2017 The Authors. Published by Elsevier B.V. This is anopenaccess article under the CCBY license (http://
creativecommons.org/licenses/by/4.0/).
1. Introduction
The dynamics of individual cavitation bubbles are of interest tomany scientific disciplines including hydraulics (propellers, tur-bines and pumps), ultrasound cleaning and biomedical engineer-ing. The aim is to understand the mechanisms underlying thesurface cleaning, erosion and sonoporation effects [1]. The charac-teristics of microbubbles around dental ultrasonic scalers aredirectly related to cavitation cleaning behaviour but the exactmechanisms are not fully understood [2]. Current methods of den-tal plaque biofilm removal are predominantly mechanical and arenot effective in removing it from irregular surfaces in the mouth.Cavitation occurring around dental ultrasonic scalers may be amore efficient and less damaging technique. Previous work has
failed to quantify the cavitation bubble dynamics around ultra-sonic scalers and its effects. Understanding the cavitation bubbledynamics could help to provide insights into how the cavitationcan clean biofilms. This will enable manufacturers to developinstruments that optimise the cavitation cleaning effects [3].
High speed imaging of bubbles combined with image analysis isa non-intrusive method of experimentally investigating cavitation,and can provide detailed information on bubble structure withoutinterfering with their dynamic activity [4–7]. A considerableamount of literature has been published on the mathematicalmodelling of individual cavitation bubble behaviour to understandhow they clean or erode surfaces [8–16]. Chahine et al. simulatedbubbles near different boundaries (rigid, elastic and free surface)to measure the pressure driving the bubble and found that the dis-tance between the bubble and the surface to be cleaned influencedthe cleaning [17]. Theoretical calculations have also been com-bined with experimental validation using high speed imaging[10,18]. These studies have calculated the evolution of the bubble
N. Vyas et al. / Ultrasonics 81 (2017) 66–72 67
radius over time and modelled the diffusion inside the liquid fordifferent applications such as drug delivery and erosion. Howeverno such research has been conducted on cavitation bubbles fromultrasonic scalers.
A range of phenomena have been identified which occur duringthe collapse of cavitation bubbles and may contribute to theircleaning effect. If a cavitation bubble collapses near a boundary,such as a wall or another bubble, it will form a high velocity microliquid jet which penetrates through the centre of the bubble andimpacts the opposite surface with large local stresses [8]. The re-entrant jet penetrates the bubble at a higher velocity than the restof the collapsing bubble surface, impacting the opposite surface atspeeds of over 100 m/s and a pressure of �400 MPa [19]. It isbelieved that the jet and resulting shock wave imposes a localisedhigh hydrodynamic load on the solid surface nearby, removing thebiofilm off the surface [1]. In terms of damage from erosion, Phillipand Lauterborn identified that the jet only has an effect when thebubble is very near to or touching the surface, and that the mainmechanism is the formation of a vortex ring bubble (a torus shapedbubble rotating poloidally) which collapses producing high pres-sure pulses [10,19]. This may also contribute to ultrasonic cleaningbut the exact bubble dynamics which lead to biofilm removalremain to be elucidated [1]. Cavitation bubbles can also lyse cellu-lar membranes and could kill bacterial biofilm as well as disruptingit, but the cellular pathways which occur in bacteria when cavita-tion is applied have not yet been identified [1,20].
Quantitative research on cavitation around endodontic files hasbeen done using high speed particle imaging velocimetry and com-putational fluid dynamics to show the fluid flow and acousticmicrostreaming occurring around the files [21,22]. In terms of highspeed imaging to study cavitation around dental instruments, indi-vidual microbubbles have been imaged around endodontic filesand lasers [23–26]. Peeters et al. showed how air trapped in a rootcanal can be released and Matsumoto et al. showed that more cav-itation occurred in an enclosed root canal model compared to infree space. Macedo et al. used high speed imaging to demonstratecavitation occurring at the end of endodontic files, and qualita-tively observed how the cavitation cloud changed with differentirrigant solutions [27]. However these studies have not performedimage analysis of individual cavitation bubbles due to the limitedtemporal and spatial resolution. In addition, very little is knownabout the characteristics of individual cavitation bubbles aroundultrasonic scalers. Bubble dynamics around ultrasonic scaler tipshave not yet been studied using high speed imaging combinedwith image processing. Observing bubble phenomena will help todetermine the timescales of growth and collapse, how this isaffected by scaler power settings and where nucleation sites arelocated. This will contribute to discovering how cavitationmicrobubbles cause biofilm disruption.
The aim of this study is to characterise individual microbubblesaround ultrasonic scaler tips using high speed imaging and imageprocessing. Specifically, we aim to observe cavitation bubble phe-nomena and calculate bubble speed and radius during the growthand collapse phases.
2. Materials and methods
2.1. High speed imaging
An ultrasonic scaler (P5 Newtron, Satelec, Acteon, France) wasimaged with tip 10P at various power settings (Power 5, 7, 10,15, 20 (maximum)) using high speed cameras. It should be notedthat the power control dial of the ultrasonic scaler is not a repro-ducible measure of power. The power output of the ultrasonic sca-
ler cannot be measured accurately due to the tip shape, howeverWalmsley et al. have shown that the displacement amplitude ofthe tip is that main factor which has to be controlled [28,29]. Thedisplacement amplitude of the tip is given in Vyas et al [30].
A Photron SA1.1 high speed camera (Photron, San Diego, CA,USA) was used to image bubbles at 250 k frames per second (fps)or 500 kfps. The camera was attached to a zoom lens (Monozoom7, Leica Microsystems UK Ltd) to obtain a resolution of 5.6 mm/pixel. The size of each pixel was calculated from measurementsof a 2 mm graticule with 10 mm markings. More information aboutthe experimental setup using the Photron camera is given in Vyaset al. [30].
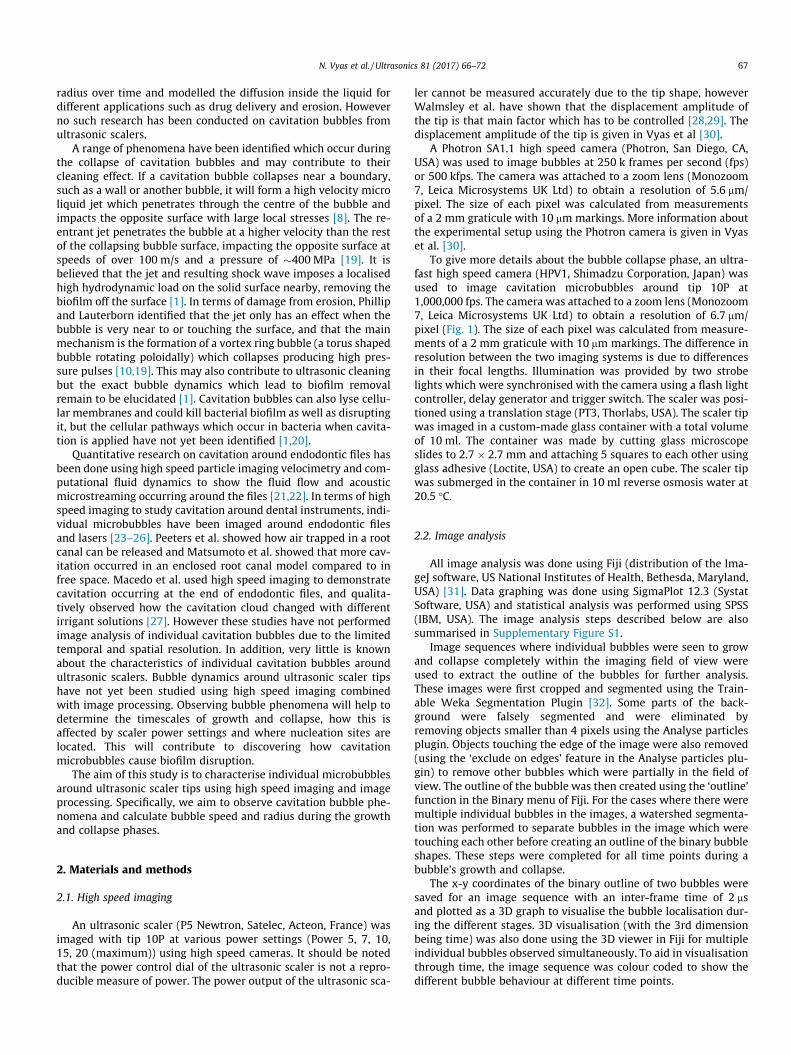
To give more details about the bubble collapse phase, an ultra-fast high speed camera (HPV1, Shimadzu Corporation, Japan) wasused to image cavitation microbubbles around tip 10P at1,000,000 fps. The camera was attached to a zoom lens (Monozoom7, Leica Microsystems UK Ltd) to obtain a resolution of 6.7 mm/pixel (Fig. 1). The size of each pixel was calculated from measure-ments of a 2 mm graticule with 10 mm markings. The difference inresolution between the two imaging systems is due to differencesin their focal lengths. Illumination was provided by two strobelights which were synchronised with the camera using a flash lightcontroller, delay generator and trigger switch. The scaler was posi-tioned using a translation stage (PT3, Thorlabs, USA). The scaler tipwas imaged in a custom-made glass container with a total volumeof 10 ml. The container was made by cutting glass microscopeslides to 2.7 � 2.7 mm and attaching 5 squares to each other usingglass adhesive (Loctite, USA) to create an open cube. The scaler tipwas submerged in the container in 10 ml reverse osmosis water at20.5 �C.
2.2. Image analysis
All image analysis was done using Fiji (distribution of the Ima-geJ software, US National Institutes of Health, Bethesda, Maryland,USA) [31]. Data graphing was done using SigmaPlot 12.3 (SystatSoftware, USA) and statistical analysis was performed using SPSS(IBM, USA). The image analysis steps described below are alsosummarised in Supplementary Figure S1.
Image sequences where individual bubbles were seen to growand collapse completely within the imaging field of view wereused to extract the outline of the bubbles for further analysis.These images were first cropped and segmented using the Train-able Weka Segmentation Plugin [32]. Some parts of the back-ground were falsely segmented and were eliminated byremoving objects smaller than 4 pixels using the Analyse particlesplugin. Objects touching the edge of the image were also removed(using the ‘exclude on edges’ feature in the Analyse particles plu-gin) to remove other bubbles which were partially in the field ofview. The outline of the bubble was then created using the ‘outline’function in the Binary menu of Fiji. For the cases where there weremultiple individual bubbles in the images, a watershed segmenta-tion was performed to separate bubbles in the image which weretouching each other before creating an outline of the binary bubbleshapes. These steps were completed for all time points during abubble’s growth and collapse.
The x-y coordinates of the binary outline of two bubbles weresaved for an image sequence with an inter-frame time of 2 msand plotted as a 3D graph to visualise the bubble localisation dur-ing the different stages. 3D visualisation (with the 3rd dimensionbeing time) was also done using the 3D viewer in Fiji for multipleindividual bubbles observed simultaneously. To aid in visualisationthrough time, the image sequence was colour coded to show thedifferent bubble behaviour at different time points.

Fig. 1. (a) Micro computed tomography 3D reconstruction of Tip 10P with dimensions, (b) schematic of the experimental setup showing the ultrasonic scaler tip in itsimaging container with the zoom lens and strobe lights.
68 N. Vyas et al. / Ultrasonics 81 (2017) 66–72
2.2.1. Calculating bubble radiusThe equivalent radius of a bubble at each time point was calcu-
lated and plotted as a function of time from the binary images ofthe bubbles. Circularity was assumed to calculate the equivalentradius (r):
r ¼ffiffiffiffiffiffiffiffiffiA=p
p
where A is the bubble area. The assumption of spherical bubbles inthis study is valid for most of their life cycle except during collapse,which is asymmetrical. It is difficult to accurately perform calcula-tions of an asymmetric bubble because the internal gas dynamicsand the fluid mechanics of the liquid need to be taken into account.
2.2.2. Calculating speed of bubble wallBubble growth and collapse speed was calculated using the
MTrackJ manual tracking plugin in Fiji [33]. Tracking was done at8 locations on the binary outline of the bubble for each time pointand the mean speed was calculated. The locations on the edge ofthe bubble were chosen to be equispaced approximately every45�. The inter-rater reliability of the manual tracking was foundusing the intra class correlation coefficient (ICC). Seven operatorsperformed manual tracking of one bubble as described above to
Fig. 2. Image sequences of bubbles growing and collapsing around at the end of tip 10P. Itime: 4 ms. Power setting: 10.
test the reproducibility of the tracking method when performedby different people. The average speed of the bubble at each timepoint was calculated from the 8 tracks. The different speedsobtained by the different users were compared using the ICC.
3. Results
Transient cavitation was observed in all high speed videos, i.e.microbubbles continuously grew and collapsed. Stable cavitation(where bubbles oscillate over many cycles without collapsing)was not observed. Typical bubble behaviour at the end of tip 10Pis shown in Fig. 2. One or two individual bubbles first grew and col-lapsed. After their collapse, many more bubbles or a bubble cloudemerged at the same location of the previous bubble during thenext oscillation cycle of the ultrasonic scaler tip (Fig 2, supplemen-tary video S1). The cavitation then formed into a cluster of bubblesgrowing and collapsing at the end of the tip. Groups of cavitationmicrobubbles can be seen around tip 10P at different power set-tings of the ultrasonic scaler (Fig. 3). At low power (Fig. 3a) cavita-tion can be seen at one point on the tip. At medium powers(Fig. 3b & c) more cavitation occurs around the whole end of the
mages show an example of multibubble growth, collapse and regrowth. Inter-frame
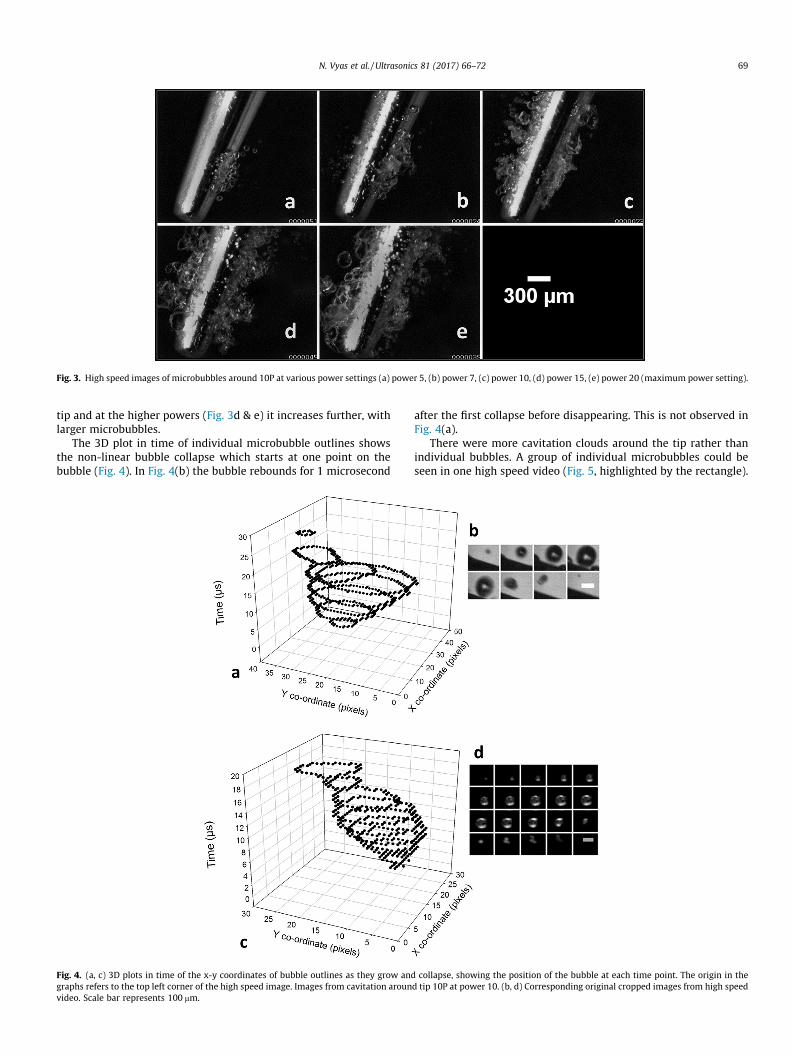
Fig. 3. High speed images of microbubbles around 10P at various power settings (a) power 5, (b) power 7, (c) power 10, (d) power 15, (e) power 20 (maximum power setting).
N. Vyas et al. / Ultrasonics 81 (2017) 66–72 69
tip and at the higher powers (Fig. 3d & e) it increases further, withlarger microbubbles.
The 3D plot in time of individual microbubble outlines showsthe non-linear bubble collapse which starts at one point on thebubble (Fig. 4). In Fig. 4(b) the bubble rebounds for 1 microsecond
Fig. 4. (a, c) 3D plots in time of the x-y coordinates of bubble outlines as they grow andgraphs refers to the top left corner of the high speed image. Images from cavitation arounvideo. Scale bar represents 100 mm.
after the first collapse before disappearing. This is not observed inFig. 4(a).
There were more cavitation clouds around the tip rather thanindividual bubbles. A group of individual microbubbles could beseen in one high speed video (Fig. 5, highlighted by the rectangle).
collapse, showing the position of the bubble at each time point. The origin in thed tip 10P at power 10. (b, d) Corresponding original cropped images from high speed
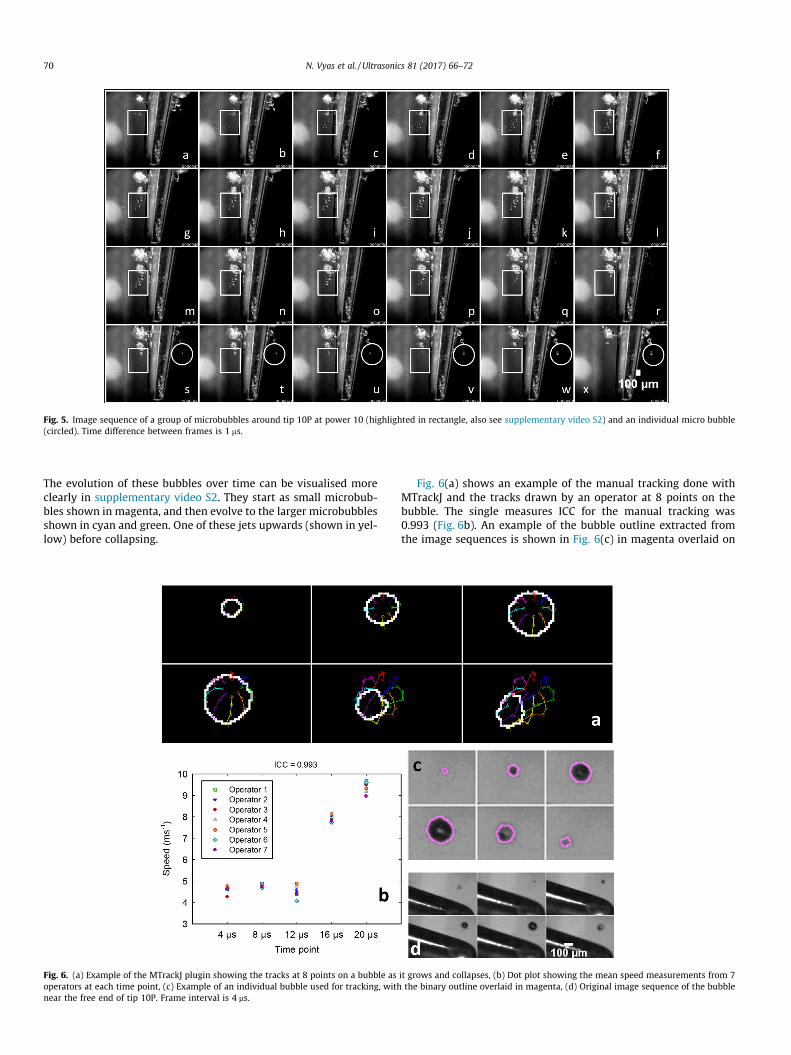
Fig. 5. Image sequence of a group of microbubbles around tip 10P at power 10 (highlighted in rectangle, also see supplementary video S2) and an individual micro bubble(circled). Time difference between frames is 1 ms.
70 N. Vyas et al. / Ultrasonics 81 (2017) 66–72
The evolution of these bubbles over time can be visualised moreclearly in supplementary video S2. They start as small microbub-bles shown in magenta, and then evolve to the larger microbubblesshown in cyan and green. One of these jets upwards (shown in yel-low) before collapsing.
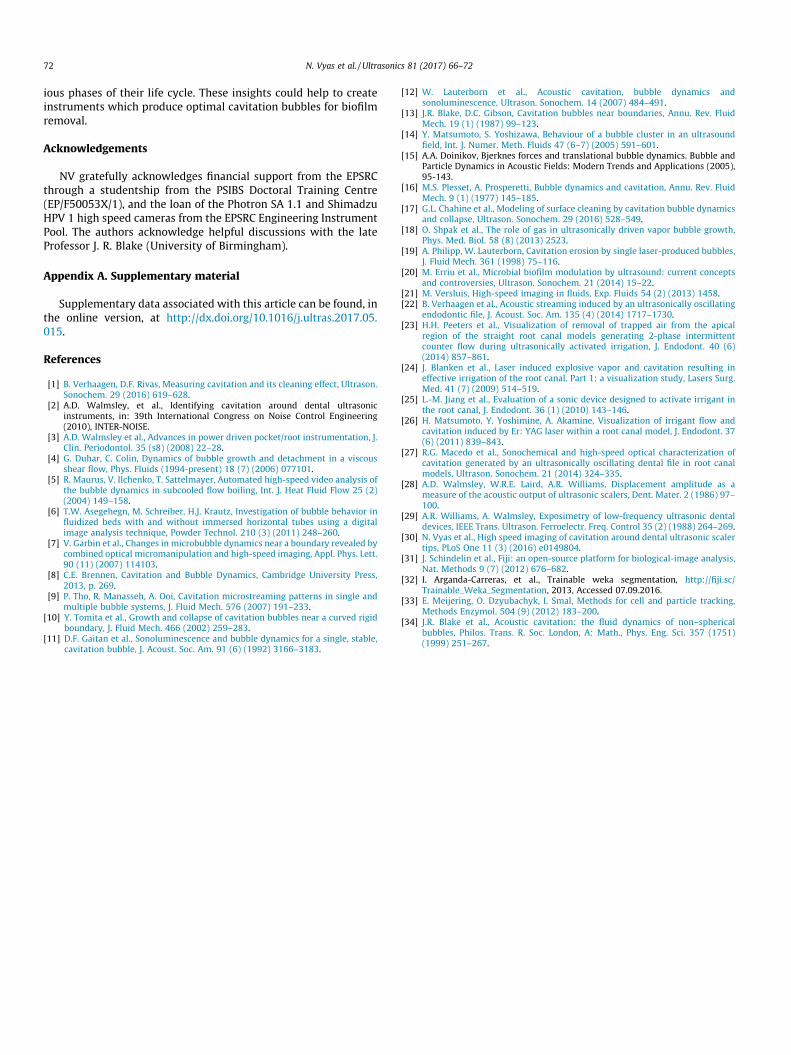
Fig. 6. (a) Example of the MTrackJ plugin showing the tracks at 8 points on a bubble asoperators at each time point, (c) Example of an individual bubble used for tracking, withnear the free end of tip 10P. Frame interval is 4 ms.
Fig. 6(a) shows an example of the manual tracking done withMTrackJ and the tracks drawn by an operator at 8 points on thebubble. The single measures ICC for the manual tracking was0.993 (Fig. 6b). An example of the bubble outline extracted fromthe image sequences is shown in Fig. 6(c) in magenta overlaid on
it grows and collapses, (b) Dot plot showing the mean speed measurements from 7the binary outline overlaid in magenta, (d) Original image sequence of the bubble
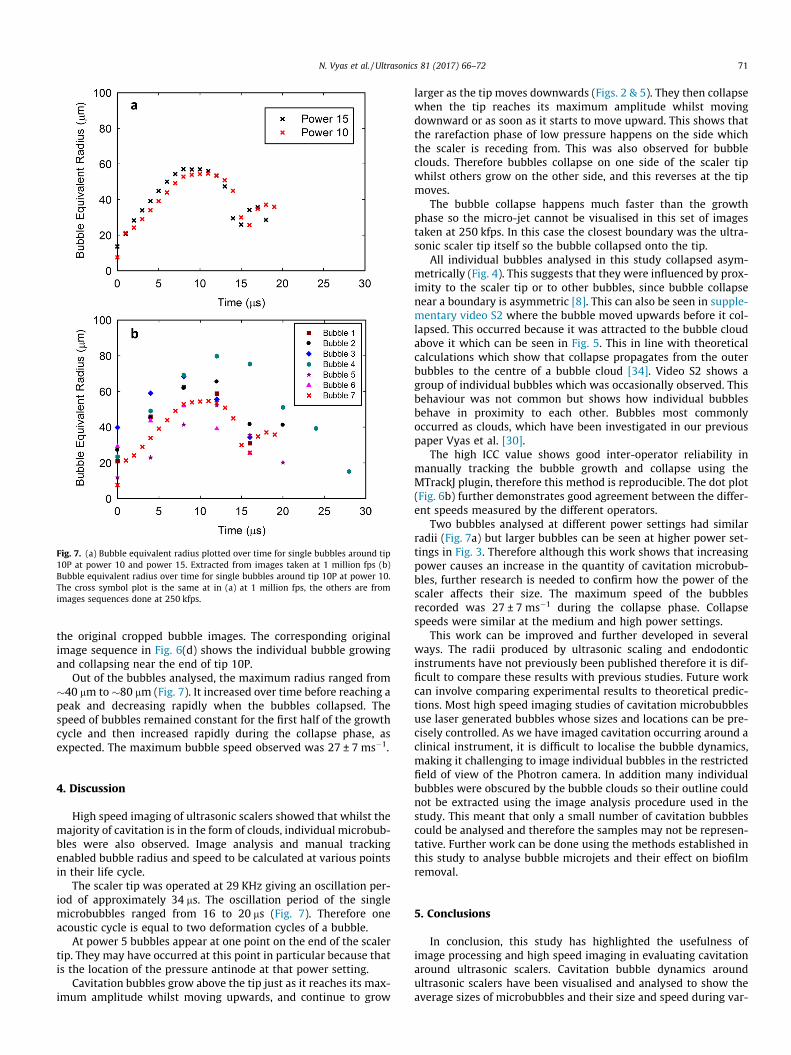
Fig. 7. (a) Bubble equivalent radius plotted over time for single bubbles around tip10P at power 10 and power 15. Extracted from images taken at 1 million fps (b)Bubble equivalent radius over time for single bubbles around tip 10P at power 10.The cross symbol plot is the same at in (a) at 1 million fps, the others are fromimages sequences done at 250 kfps.
N. Vyas et al. / Ultrasonics 81 (2017) 66–72 71
the original cropped bubble images. The corresponding originalimage sequence in Fig. 6(d) shows the individual bubble growingand collapsing near the end of tip 10P.
Out of the bubbles analysed, the maximum radius ranged from�40 mm to �80 mm (Fig. 7). It increased over time before reaching apeak and decreasing rapidly when the bubbles collapsed. Thespeed of bubbles remained constant for the first half of the growthcycle and then increased rapidly during the collapse phase, asexpected. The maximum bubble speed observed was 27 ± 7 ms�1.
4. Discussion
High speed imaging of ultrasonic scalers showed that whilst themajority of cavitation is in the form of clouds, individual microbub-bles were also observed. Image analysis and manual trackingenabled bubble radius and speed to be calculated at various pointsin their life cycle.
The scaler tip was operated at 29 KHz giving an oscillation per-iod of approximately 34 ms. The oscillation period of the singlemicrobubbles ranged from 16 to 20 ms (Fig. 7). Therefore oneacoustic cycle is equal to two deformation cycles of a bubble.
At power 5 bubbles appear at one point on the end of the scalertip. They may have occurred at this point in particular because thatis the location of the pressure antinode at that power setting.
Cavitation bubbles grow above the tip just as it reaches its max-imum amplitude whilst moving upwards, and continue to grow
larger as the tip moves downwards (Figs. 2 & 5). They then collapsewhen the tip reaches its maximum amplitude whilst movingdownward or as soon as it starts to move upward. This shows thatthe rarefaction phase of low pressure happens on the side whichthe scaler is receding from. This was also observed for bubbleclouds. Therefore bubbles collapse on one side of the scaler tipwhilst others grow on the other side, and this reverses at the tipmoves.
The bubble collapse happens much faster than the growthphase so the micro-jet cannot be visualised in this set of imagestaken at 250 kfps. In this case the closest boundary was the ultra-sonic scaler tip itself so the bubble collapsed onto the tip.
All individual bubbles analysed in this study collapsed asym-metrically (Fig. 4). This suggests that they were influenced by prox-imity to the scaler tip or to other bubbles, since bubble collapsenear a boundary is asymmetric [8]. This can also be seen in supple-mentary video S2 where the bubble moved upwards before it col-lapsed. This occurred because it was attracted to the bubble cloudabove it which can be seen in Fig. 5. This in line with theoreticalcalculations which show that collapse propagates from the outerbubbles to the centre of a bubble cloud [34]. Video S2 shows agroup of individual bubbles which was occasionally observed. Thisbehaviour was not common but shows how individual bubblesbehave in proximity to each other. Bubbles most commonlyoccurred as clouds, which have been investigated in our previouspaper Vyas et al. [30].
The high ICC value shows good inter-operator reliability inmanually tracking the bubble growth and collapse using theMTrackJ plugin, therefore this method is reproducible. The dot plot(Fig. 6b) further demonstrates good agreement between the differ-ent speeds measured by the different operators.
Two bubbles analysed at different power settings had similarradii (Fig. 7a) but larger bubbles can be seen at higher power set-tings in Fig. 3. Therefore although this work shows that increasingpower causes an increase in the quantity of cavitation microbub-bles, further research is needed to confirm how the power of thescaler affects their size. The maximum speed of the bubblesrecorded was 27 ± 7 ms�1 during the collapse phase. Collapsespeeds were similar at the medium and high power settings.
This work can be improved and further developed in severalways. The radii produced by ultrasonic scaling and endodonticinstruments have not previously been published therefore it is dif-ficult to compare these results with previous studies. Future workcan involve comparing experimental results to theoretical predic-tions. Most high speed imaging studies of cavitation microbubblesuse laser generated bubbles whose sizes and locations can be pre-cisely controlled. As we have imaged cavitation occurring around aclinical instrument, it is difficult to localise the bubble dynamics,making it challenging to image individual bubbles in the restrictedfield of view of the Photron camera. In addition many individualbubbles were obscured by the bubble clouds so their outline couldnot be extracted using the image analysis procedure used in thestudy. This meant that only a small number of cavitation bubblescould be analysed and therefore the samples may not be represen-tative. Further work can be done using the methods established inthis study to analyse bubble microjets and their effect on biofilmremoval.
5. Conclusions
In conclusion, this study has highlighted the usefulness ofimage processing and high speed imaging in evaluating cavitationaround ultrasonic scalers. Cavitation bubble dynamics aroundultrasonic scalers have been visualised and analysed to show theaverage sizes of microbubbles and their size and speed during var-
72 N. Vyas et al. / Ultrasonics 81 (2017) 66–72
ious phases of their life cycle. These insights could help to createinstruments which produce optimal cavitation bubbles for biofilmremoval.
Acknowledgements
NV gratefully acknowledges financial support from the EPSRCthrough a studentship from the PSIBS Doctoral Training Centre(EP/F50053X/1), and the loan of the Photron SA 1.1 and ShimadzuHPV 1 high speed cameras from the EPSRC Engineering InstrumentPool. The authors acknowledge helpful discussions with the lateProfessor J. R. Blake (University of Birmingham).
Appendix A. Supplementary material
Supplementary data associated with this article can be found, inthe online version, at http://dx.doi.org/10.1016/j.ultras.2017.05.015.
References
[1] B. Verhaagen, D.F. Rivas, Measuring cavitation and its cleaning effect, Ultrason.Sonochem. 29 (2016) 619–628.
[2] A.D. Walmsley, et al., Identifying cavitation around dental ultrasonicinstruments, in: 39th International Congress on Noise Control Engineering(2010), INTER-NOISE.
[3] A.D. Walmsley et al., Advances in power driven pocket/root instrumentation, J.Clin. Periodontol. 35 (s8) (2008) 22–28.
[4] G. Duhar, C. Colin, Dynamics of bubble growth and detachment in a viscousshear flow, Phys. Fluids (1994-present) 18 (7) (2006) 077101.
[5] R. Maurus, V. Ilchenko, T. Sattelmayer, Automated high-speed video analysis ofthe bubble dynamics in subcooled flow boiling, Int. J. Heat Fluid Flow 25 (2)(2004) 149–158.
[6] T.W. Asegehegn, M. Schreiber, H.J. Krautz, Investigation of bubble behavior influidized beds with and without immersed horizontal tubes using a digitalimage analysis technique, Powder Technol. 210 (3) (2011) 248–260.
[7] V. Garbin et al., Changes in microbubble dynamics near a boundary revealed bycombined optical micromanipulation and high-speed imaging, Appl. Phys. Lett.90 (11) (2007) 114103.
[8] C.E. Brennen, Cavitation and Bubble Dynamics, Cambridge University Press,2013, p. 269.
[9] P. Tho, R. Manasseh, A. Ooi, Cavitation microstreaming patterns in single andmultiple bubble systems, J. Fluid Mech. 576 (2007) 191–233.
[10] Y. Tomita et al., Growth and collapse of cavitation bubbles near a curved rigidboundary, J. Fluid Mech. 466 (2002) 259–283.
[11] D.F. Gaitan et al., Sonoluminescence and bubble dynamics for a single, stable,cavitation bubble, J. Acoust. Soc. Am. 91 (6) (1992) 3166–3183.
[12] W. Lauterborn et al., Acoustic cavitation, bubble dynamics andsonoluminescence, Ultrason. Sonochem. 14 (2007) 484–491.
[13] J.R. Blake, D.C. Gibson, Cavitation bubbles near boundaries, Annu. Rev. FluidMech. 19 (1) (1987) 99–123.
[14] Y. Matsumoto, S. Yoshizawa, Behaviour of a bubble cluster in an ultrasoundfield, Int. J. Numer. Meth. Fluids 47 (6–7) (2005) 591–601.
[15] A.A. Doinikov, Bjerknes forces and translational bubble dynamics. Bubble andParticle Dynamics in Acoustic Fields: Modern Trends and Applications (2005),95-143.
[16] M.S. Plesset, A. Prosperetti, Bubble dynamics and cavitation, Annu. Rev. FluidMech. 9 (1) (1977) 145–185.
[17] G.L. Chahine et al., Modeling of surface cleaning by cavitation bubble dynamicsand collapse, Ultrason. Sonochem. 29 (2016) 528–549.
[18] O. Shpak et al., The role of gas in ultrasonically driven vapor bubble growth,Phys. Med. Biol. 58 (8) (2013) 2523.
[19] A. Philipp, W. Lauterborn, Cavitation erosion by single laser-produced bubbles,J. Fluid Mech. 361 (1998) 75–116.
[20] M. Erriu et al., Microbial biofilm modulation by ultrasound: current conceptsand controversies, Ultrason. Sonochem. 21 (2014) 15–22.
[21] M. Versluis, High-speed imaging in fluids, Exp. Fluids 54 (2) (2013) 1458.[22] B. Verhaagen et al., Acoustic streaming induced by an ultrasonically oscillating
endodontic file, J. Acoust. Soc. Am. 135 (4) (2014) 1717–1730.[23] H.H. Peeters et al., Visualization of removal of trapped air from the apical
region of the straight root canal models generating 2-phase intermittentcounter flow during ultrasonically activated irrigation, J. Endodont. 40 (6)(2014) 857–861.
[24] J. Blanken et al., Laser induced explosive vapor and cavitation resulting ineffective irrigation of the root canal. Part 1: a visualization study, Lasers Surg.Med. 41 (7) (2009) 514–519.
[25] L.-M. Jiang et al., Evaluation of a sonic device designed to activate irrigant inthe root canal, J. Endodont. 36 (1) (2010) 143–146.
[26] H. Matsumoto, Y. Yoshimine, A. Akamine, Visualization of irrigant flow andcavitation induced by Er: YAG laser within a root canal model, J. Endodont. 37(6) (2011) 839–843.
[27] R.G. Macedo et al., Sonochemical and high-speed optical characterization ofcavitation generated by an ultrasonically oscillating dental file in root canalmodels, Ultrason. Sonochem. 21 (2014) 324–335.
[28] A.D. Walmsley, W.R.E. Laird, A.R. Williams, Displacement amplitude as ameasure of the acoustic output of ultrasonic scalers, Dent. Mater. 2 (1986) 97–100.
[29] A.R. Williams, A. Walmsley, Exposimetry of low-frequency ultrasonic dentaldevices, IEEE Trans. Ultrason. Ferroelectr. Freq. Control 35 (2) (1988) 264–269.
[30] N. Vyas et al., High speed imaging of cavitation around dental ultrasonic scalertips, PLoS One 11 (3) (2016) e0149804.
[31] J. Schindelin et al., Fiji: an open-source platform for biological-image analysis,Nat. Methods 9 (7) (2012) 676–682.
[32] I. Arganda-Carreras, et al., Trainable weka segmentation, http://fiji.sc/Trainable_Weka_Segmentation, 2013, Accessed 07.09.2016.
[33] E. Meijering, O. Dzyubachyk, I. Smal, Methods for cell and particle tracking,Methods Enzymol. 504 (9) (2012) 183–200.
[34] J.R. Blake et al., Acoustic cavitation: the fluid dynamics of non–sphericalbubbles, Philos. Trans. R. Soc. London, A: Math., Phys. Eng. Sci. 357 (1751)(1999) 251–267.