Embed Size (px)
Citation preview
JOURNAL OF NUCLEAR CARDIOLOGY
IMAGING GUIDELINES FOR
NUCLEAR CARDIOLOGY
PROCEDURES
Part 2
EditorSteven C. Port, PhD
Publication supported byFuijisawa Healthcare, Inc.
andNycomed Amersham Imaging
JOURNAL OF NUCLEAR CARDIOLOGY
IMAGING GUIDELINES FOR
NUCLEAR CARDIOLOGY
PROCEDURES
Part 2
American Society of Nuclear Cardiology
Steven C. Port, MD, FACC, Editor
Committee Chairmen
Daniel Berman, MD Steven C. Port, MDErnest Garcia, PhD, Chairman Al Sinusas, MD
Frans Wackers, MD
Committee Members
Stephen Bacharach, PhD Rory Hachamovich, MDTimothy M. Bateman, MD Lynne L. Johnson, MDSalvador Borges-Neto, MD Kenneth Van Train, MSE. Gordon DePuey, MD Denny Watson, PhD
Howard Weinstein, MD
Copyright © 1999 American Society of Nuclear CardiologyAll rights reserved.
G49Journal of Nuclear CardiologyMarch/April 1999
JOURNAL OF
NUCLEAR CARDIOLOGYVolume 6 • Number 2 March/April 1999
Copyright © 1999 by the American Society of Nuclear Cardiology
The Journal is included in the Cumulative Index Medicus and MEDLINE
TABLE OF CONTENTS
This manual is designed by experts in the field to provide imaging guidelines for those physicians and technolo-gists who are qualified in the practice of nuclear cardiology. Although care has been taken to ensure that the informa-tion in this manual is accurate in representing the consensus of experts, it should not be considered as medical adviceor a professional service. The imaging guidelines described in this manual should not be used in clinical studies at anyinstitution until they have been reviewed and approved by qualified physicians from that institution.
Nomenclature G53
First-Pass Radionuclide Angiography (FPRNA) G53
General Comments G53
Display G53
Quality Control G54
The Bolus G54
Count Statistics G54
Tracer Transit G54
Beat Selection G54
Background Selection G54
Patient Motion G54
Results G54
Cardiac Rhythm and Conduction G54
Chamber Sizes G55
Regional Wall Motion G55
Left and Right Ventricular Ejection Fractions G56
Exercise/Intervention Studies G56
Conclusion G57
First-Pass Radionuclide Angiography: Guideline for Interpretation Table G57
First-Pass Radionuclide Angiography: Guideline for Reporting Table G58
Equilibrium Radionuclide Angiocardiography (ERNA) G57
Display G57
Smoothing G59
Quality Control: Count Statistics G59
Quality Control: Labeling Efficiency G60
Appropriate Imaging Angles G60
Left Anterior Oblique View G60
Anterior View G61
Left Lateral View or Posterior Oblique View G61
Appropriate Zoom G61
Attenuation G61
Processing Accuracy G61

Contents continued
G50 Journal of Nuclear CardiologyMarch/April 1999
Image Analysis G62
Cardiac Rhythm and Conduction G62
Left Ventricular Size G62
Left Ventruclar Volume G62
Left Ventricular Regional Wall Motion G62
Left Ventricular Regional Ejection Fraction G62
Left Ventricular Ejection Fraction G62
Left Ventricular Diastolic Function G63
Qualitative G63
Quantitative G63
Right Ventricular Size G63
Right Ventricular Regional Wall Motion G63
Right Ventricular Ejection Fraction G63
Atrial Sizes G63
Size of Pulmonary Artery and Aorta G63
Left Ventricular Hypertrophy (LVH) G63
Pericardial Space G63
Activity Outside the Heart and Great Vessels G64
Exercise and Interventions G64
Display Rest/Exercise/Intervention Studies G64
Regional Wall Motion Changes from Rest G64
Chamber Size Changes from Rest G64
LVEF, RVEF Changes from Rest G64
Comparison to Previous Studies and Correlation with Clinical Data G64
Study Quality G64
Type of Exercise or Intervention Protocol G65
Symptoms, Heart Rate and Blood Pressure Response, ECG Changes, and
End Point of Stress G65
Conclusion G65
ERNA: Guideline for Interpretation Table G65
ERNA: Guideline for Reporting Table G66
SPECT Myocardial Perfusion Imaging G67
General Comments G67
Display G67
Recommended Medium for Display G67
Conventional Slice Display of SPECT Images G67
Three-dimensional Display G68
Evaluation of the Images for Technical Sources of Error G68
Patient Motion G68
Attenuation and Attenuation Correction G68
Reconstruction Artifacts G68
Myocardial Statistics G68
Initial Image Analysis and Interpretation G69
Ventricular Dilation G69
Lung Uptake G69
Right Ventricular Uptake G69
Non-cardiopulmonary Findings G69
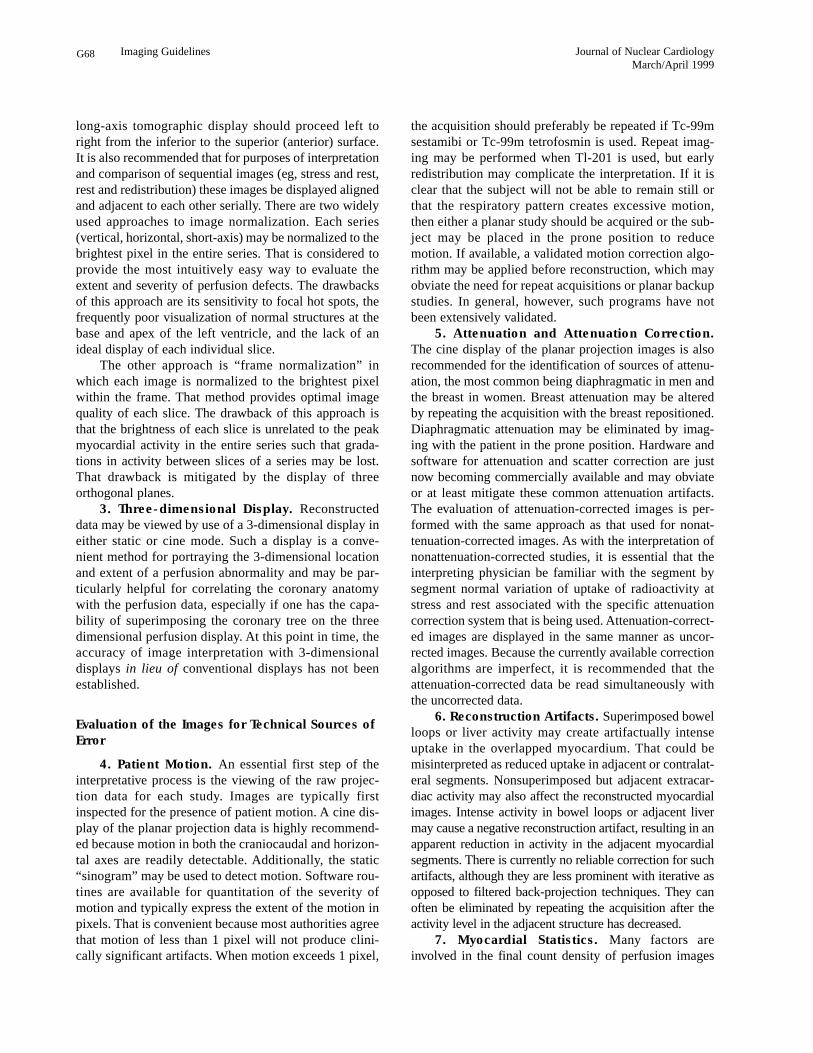
Perfusion Defect Location G69
Perfusion Defect Severity and Extent: Qualitative G69
Perfusion Defect Severity and Extent: Semiquantitative G70
Semiquantitative Scoring System: The Five-point Model G70
Contents continued
G51Journal of Nuclear CardiologyMarch/April 1999
Perfusion Defect Severity and Extent: Quantitative G71
Integration of Findings for Interpretation G72
Reversibility G72
Gated Myocardial Perfusion SPECT G72
Gated SPECT Display G72
Gated SPECT Quality Control G72
Gated SPECT: Regional Wall Motion and Thickening G72
Left Ventricular Ejection Fraction and Volume G73
Integration of Perfusion and Function Results G73
Myocardial Viability G73
Viability: Qualitative Assessment G73
Myocardial Viability: Semiquantitive Assessment G73
Myocardial Viability: Quanitative Assessment G73
Modification of the Interpretation by Relevant Clinical Information G74
Reporting of SPECT Myocardial Perfusion Scan Results G74
Subject Information G74
Type of Study G74
Indication for Study G74
Resting ECG Findings G74
Summary of Stress Data G74
Overall Study Quality G74
Diagnosis and Prognosis of Coronary Artery Disease G74
Myocardial Perfusion SPECT: Guideline for Interpretation Table G75
Myocardial Perfusion SPECT: Guideline for Reporting Table G76
Planar Myocardial Perfusion Imaging G77
Comments G77
Display G77
Recommended Medium G77
Conventional Format for Display G78
Evaluation for Technical Sources of Artifacts G78
Attenuation G78
Noncardiac Activity G78
Myocardial Statistics G78
Motion G78
Initial Image Analysis and Interpretation G78
Ventricular Dilation G78
Lung Uptake G78
Right Ventricular Uptake G78
Noncardiopulmonary Uptake G79
Segmental Perfusion Assessment G79
Perfusion Defect Location G79
Perfusion Defect Severity and Extent: Qualitative G79
Perfusion Defect Severity and Extent: Semiquantitative G79
Perfusion Defect Severity and Extent: Quantitative G79
Perfusion Defect Reversibility G79
Myocardial Viability G79
Viability: Qualitative Assessment G79
Myocardial Viability: Semiquantitative Assessment G80
Myocardial Viability: Quantitative Assessment G80
Integration of Findings for Interpretation G80
Final Study Interpretation G80

Contents continued
G52 Journal of Nuclear CardiologyMarch/April 1999
Reporting of Planar Myocardial Perfusion Scan Results G80
Subject Information G80
Type of Study G80
Indication for Study G80
Resting ECG Findings G80
Summary of Stress Data G80
Overall Study Quality G81
Diagnosis and Prognosis of Coronary Artery Disease G81
Final Interpretation G81
Planar Myocardial Perfusion Imaging: Guideline For Interpretation Table G81
Planar Myocardial Perfusion Imaging: Guideline For Reporting Table G82
Bibliography G83
G53
NOMENCLATURE
The committee has recommended the followingnames, abbreviations, and myocardial segment designa-tions as standard nomenclature: first-pass radionuclideangiography (FPRNA); equilibrium radionuclide angiog-raphy (ERNA); single photon emission computed tomo-graphic myocardial perfusion imaging (SPECT MPI); andplanar myocardial perfusion imaging (planar MPI).Standardization is important for several reasons. Each ofthe studies described in these guidelines has been and stillis called by several different names in different laborato-ries and in different locales. Variability in the names of thestudies results in confusion among the physicians and nonphysicians trying to appropriately order and understandthese radionuclide examinations. Variability in the methodof myocardial segmentation and in segment designationscreates additional confusion about the location of wallmotion and perfusion abnormalities. Standardization ofsegment classification will, it is hoped, extend to otherimaging modalities such as echocardiography, computedtomography (CT), and magnetic resonance imaging (MRI)so that any myocardial segment is similarly designated inany cardiac imaging method. The names and abbreviationshave been selected for their simplicity and lack of ambi-guity. Many clinicians and investigators have their ownpreferences, but ASNC recommends adoption of the pro-posed nomenclature for the sake of uniformity in the field.
Many authors have proposed models for myocardialsegmentation. No data are available to statistically provethe superiority of one model over another. The commit-tee has recommended the number of segments that seemmost appropriate to the resolution of the particular studyand has named the segments with anatomically correctand unambiguous designations.
The committee recognizes that alternative models forsegmentation exist in the literature. The reader should notinfer that the committee considers such models incorrect. Therecommendations represent the opinions of many experts inthe field whose objective was to provide a straightforward,anatomically correct, and easy-to-understand nomenclature.
FIRST-PASS RADIONUCLIDE ANGIOGRAPHY
GUIDELINES FOR INTERPRETATION AND
REPORTING
General Comments
The interpretation of first-pass data should be per-formed in a consistent, methodical manner, with particu-
lar attention to the quality of the data. Unlike equilibriumradionuclide angiography, in which a quick inspection ofthe cinematic display of the cardiac cycle is sufficient toreassure the interpreting physician of the adequacy of thedata, the first-pass study requires considerably moreattention to the details of data acquisition and processingto provide consistently accurate interpretations. The finalrepresentative cardiac cycle that is used to generate boththe quantitative results and the qualitative wall motionassessment can be affected by many factors, includingthe adequacy of the injection bolus, the count rate, thenumber and type of beats chosen for inclusion, the man-ner in which background activity is determined, andoccasionally patient motion. Even in laboratories withextensive experience and well-defined and well-executedacquisition and processing techniques, unavoidablepatient-to-patient variability, different cardiac and pul-monary physiology, as well as some degree of interob-server variability in processing, lead to variability in theend product. The physician must therefore exercise duediligence during interpretation of the results.
Certain data must be routinely available so that theinterpreting physician may quickly assess the technicaladequacy of the data and the accuracy of the processing.Most commercial software routines automatically saveenough of the intermediate steps of processing to enable thephysician to quickly review the processing either directlyon the computer display or by reference to hard copy.
Display. 1. The final representative cycle should bedisplayed in a cinematic, endless loop format. Mostauthorities use a color display in contrast to the recom-mended display for equilibrium images. The lower pixelcount density and the subtler change from cardiac cavitiesto background make a color display useful. The cine dis-play is typically time-smoothed during data processing andshould not need additional smoothing for display. Spatialsmoothing may be used after processing if the data are par-ticularly count poor, but it should not be necessary for theaverage study. It is preferable to normalize the image to thepeak activity in the ventricle because aortic or left atrialactivity may be higher, thus making it more difficult toappreciate the count changes in the ventricles. Cinematicdisplays of the bolus transit through the heart and greatvessels are helpful in analyzing aberrations of tracer tran-sit that may occur in patients with congenital anomalies.
2. Hard copy displays are essential to study inter-pretation. Time-activity curves representing the bolus,the right ventricular (RV) and left ventricular (LV)phases of the bolus transit and a final representativecycle time-activity (volume) curve must be available forproper interpretation. Color hard copy displays of para-metric images may be valuable aides in study interpre-tation. Such displays should not be used to the exclu-sion of the cinematic display of the representative cycle.
Reprint requests: American Society of Nuclear Cardiology, 9111 OldGeorgetown Rd, Bethesda, MD, 20814-1699.
J Nucl Cardiol 1999;6:G47-G84.Copyright © 1999 by the American Society of Nuclear Cardiology.1071-3581/99/$8.00 + 0 43/1/96008
Quality Control
3. The bolus. The adequacy of a bolus may bedefined quantitatively by generating a time-activity curvefrom a region-of-interest (ROI) that includes the superiorvena cava. The FWHM of such a curve should ideally be<1 second. As a routine quality check, it is helpful toinspect the time-activity curve of the bolus. Alternatively,one may inspect a sequence of images from the early por-tion of the study to qualitatively assess the bolus. Serial1-second images are useful for that purpose. The bolusmay be assessed as good (FWHM≤1 second), adequate(1 to 1.5 seconds), delayed (>1.5 seconds), or split (morethan one discrete peak in the time-activity curve). Thesplit bolus is particularly problematic and may precludeaccurate data processing. Identification of a delayed orsplit bolus alerts the physician to the possibility of over-subtraction of background and the resultant spuriousincrease in left ventricular ejection fraction (LVEF),decrease in left ventricular volume, and overestimation ofregional wall motion.
4. Count statistics. The adequacy of the count ratemay be assessed by use of either the unprocessed dataor the representative cycle. When examining theunprocessed data, the count rate in the whole field-of-view during the right ventricular phase of the studyshould optimally be >200,000 cps with a multicrystalsystem and ≥150,000 cps on a single-crystal system.When count rates drop below 100,000 cps, it is highlyunlikely that adequate studies will be obtained.Alternatively, and more accurately, the count rate of therepresentative cycle can be checked. This approach ismore accurate because it is the representative cycle that isused to generate all quantitative results, and counts in therepresentative cycle may be inadequate even when thecount rate on the raw data is adequate if there are insuffi-cient beats for analysis or background oversubtraction. Ingeneral, left ventricular end-diastolic counts in the repre-sentative cycle should not be less than 2000 cps andshould preferably exceed 4000 cps. High resolution wallmotion images will require >5000 cps.
5. Tracer transit. The transit of the radionuclideshould be inspected in every case. Alterations or anom-alies of tracer transit may be detected visually by exam-ining serial static images (Figure 1,B) or by a cinematicdisplay of the bolus transiting the central circulation. Acine display may be particularly helpful when the transitseems anomalous. The most common disturbance of trac-er transit is prolongation of the transit time through eitheror both ventricles. Recognition of a prolonged transittime is important because of the potential diagnosticimplications and because of the impact on backgroundcorrection, which in turn affects ejection fraction, vol-umes, and wall motion. Physiological causes of pro-
longed tracer transit include valvular insufficiency,severely depressed ventricular function, atrial fibrillation,and a left-to-right shunt. Combining image informationsuch as an enlarged left atrial appendage (see below) anda prolonged tracer transit through the left ventricle sug-gests mitral valve disease, whereas prolonged left ven-tricular tracer transit and an enlarged ascending aortasuggest aortic valve disease.
6. Beat selection. A hard copy of the time-activitycurve should be generated by the technologist during pro-cessing so one may confirm that the appropriate beatshave been selected for inclusion in the representativecycle. Unless the number of beats is very limited, oneshould preferably select beats whose end-diastolic countsare ≥70% of the peak end-diastolic counts.
7. Background selection. The same curve used toconfirm appropriate beat selection may be used to con-firm that an appropriate frame was chosen for back-ground correction. A frame as close to the beginning ofthe LV phase but not including LV activity is desired.Viewing the background frame image is helpful in deter-mining that LV activity is not included and in visualizingany residual activity in the right ventricle that could resultin oversubtraction of background. On occasion, the lungframe method of background correction may not be accu-rate because of poor RV-LV temporal separation. In thatcase, the physician should demand that a representativecycle be created that has not been subjected to back-ground correction. The uncorrected representative cycleis always generated during the processing but may not bestored. Viewing this image in cine loop format after man-ually subtracting the background will allow an adequateassessment of regional wall motion.
8. Patient motion. Motion of the patient is rarely, ifever, a problem on a resting study. However, motion ofthe chest during acquisition of an exercise study is seenfrequently during treadmill exercise and occasionallyduring bicycle exercise. Motion should be suspectedwhen typical distortions of the LV time-activity curve arenoted and should be confirmed by viewing a cine displayof the bolus traveling through the chambers. Duringtreadmill exercise, chest wall motion may be correctedwith the use of an external point source. The integrity ofthe point source and especially its appearance in eachframe of the study should be confirmed.
Results
9. Cardiac rhythm and conduction. Interpretation ofthe data may be influenced by the rhythm during theacquisition. For example, frequent premature ventricularcontractions (PVC), ventricular bigeminy or very irregu-lar atrial fibrillation may affect the ejection fraction orregional wall motion. In the setting of ventricularbigeminy, for example, no true sinus beat ejection frac-
G54 Journal of Nuclear CardiologyMarch/April 1999
Imaging Guidelines
tion can be determined. The diagnostic and prognosticsignificance of post-PVC beats are not completely under-stood. With atrial fibrillation, the representative cyclemay consist of beats with widely varying R-R intervalsand, hence, with different volumes and ejection fractions.Pacemaker rhythm confers its own unique contractionsequence, which starts at the apex and proceeds to thebase. The latter can be recognized from the cinematic dis-play of the representative cycle. A phase image may behelpful in recognition of this pattern.
Both regional wall motion and LVEF are typicallyaltered by left bundle branch block (LBBB). Becausemost first-pass studies are acquired in the right anterioroblique (RAO) or anterior projections, paradoxical septalmotion cannot be detected; however, one may see whatappears to be inferoapical or anteroapical wall motionabnormalities. A phase image may aid in recognizing thisphenomenon, although it is usually apparent on the cine-matic display of the representative cycle. Right bundlebranch block does not affect the left ventricular contrac-tion pattern.
10. Chamber sizes. Because the overwhelming major-ity of first-pass studies are performed to evaluate the leftventricle, the final representative cycle will show the LV,the left atrium (in particular its appendage), and theascending aorta. Most of the left atrium is overlapped withthe ascending aorta, and its size is difficult to assess.However, when the left atrium is very dilated, itsappendage is quite prominent in the anterior view, and theaortic root will appear to be dilated. Judging the size of theLV qualitatively is more difficult on a first-pass study thanon an equilibrium study because one does not have all thesurrounding chambers and great vessels in the same imageas references. With enough experience, moderate to severedegrees of LV chamber enlargement can be appreciated.Right atrial, right ventricular, and pulmonary arterial sizescan be evaluated on cinematic display or on serial static0.5- to 1.0-second images from the raw data but are notparticularly reliable.
Actual measurement of LV volume may be per-formed with either geometric or count-based approachesand offers a more consistent and accurate assessment ofchamber size. Normal values for the LV should be estab-lished for each laboratory because they will vary depend-ing on the type of processing used, especially the type ofbackground correction and the patient’s position duringthe acquisition, that is, supine, semisupine, or upright.
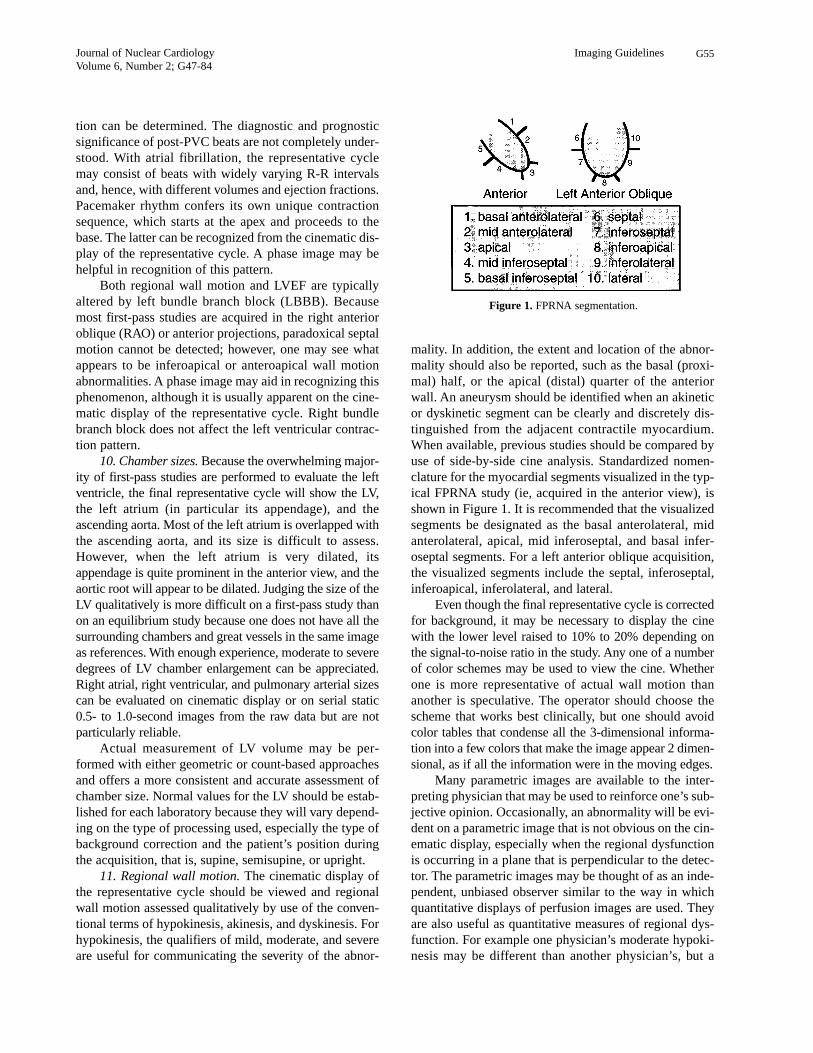
11. Regional wall motion. The cinematic display ofthe representative cycle should be viewed and regionalwall motion assessed qualitatively by use of the conven-tional terms of hypokinesis, akinesis, and dyskinesis. Forhypokinesis, the qualifiers of mild, moderate, and severeare useful for communicating the severity of the abnor-
mality. In addition, the extent and location of the abnor-mality should also be reported, such as the basal (proxi-mal) half, or the apical (distal) quarter of the anteriorwall. An aneurysm should be identified when an akineticor dyskinetic segment can be clearly and discretely dis-tinguished from the adjacent contractile myocardium.When available, previous studies should be compared byuse of side-by-side cine analysis. Standardized nomen-clature for the myocardial segments visualized in the typ-ical FPRNA study (ie, acquired in the anterior view), isshown in Figure 1. It is recommended that the visualizedsegments be designated as the basal anterolateral, midanterolateral, apical, mid inferoseptal, and basal infer-oseptal segments. For a left anterior oblique acquisition,the visualized segments include the septal, inferoseptal,inferoapical, inferolateral, and lateral.
Even though the final representative cycle is correctedfor background, it may be necessary to display the cinewith the lower level raised to 10% to 20% depending onthe signal-to-noise ratio in the study. Any one of a numberof color schemes may be used to view the cine. Whetherone is more representative of actual wall motion thananother is speculative. The operator should choose thescheme that works best clinically, but one should avoidcolor tables that condense all the 3-dimensional informa-tion into a few colors that make the image appear 2 dimen-sional, as if all the information were in the moving edges.
Many parametric images are available to the inter-preting physician that may be used to reinforce one’s sub-jective opinion. Occasionally, an abnormality will be evi-dent on a parametric image that is not obvious on the cin-ematic display, especially when the regional dysfunctionis occurring in a plane that is perpendicular to the detec-tor. The parametric images may be thought of as an inde-pendent, unbiased observer similar to the way in whichquantitative displays of perfusion images are used. Theyare also useful as quantitative measures of regional dys-function. For example one physician’s moderate hypoki-nesis may be different than another physician’s, but a
Journal of Nuclear CardiologyVolume 6, Number 2; G47-84
Imaging Guidelines G55
Figure 1. FPRNA segmentation.
regional ejection fraction of 28% is clear to anyonereceiving the information. The most commonly usedimages are the regional ejection fraction image, thestroke volume image, and the amplitude and phaseimages. The latter three may be used in processing, aswell as in interpretation. One must keep in mind that theaccuracy of the parametric image is highly dependent onthe statistics in the image and may be influenced bytranslational movement of the heart; therefore the para-metric image should not be used to the exclusion of therepresentative cycle cine because the latter gives theoperator the best visual feedback on the statistical quali-ty of the data. Very little literature is available to docu-ment the accuracy of parametric images for diagnosis.
12. Left and right ventricular ejection fractions. TheLVEF is calculated from the background-corrected end-diastolic and end-systolic counts in either ventricle.Published ranges from a normal ejection fraction vary,but most laboratories accept a range of 0.5 to 0.8 for theleft ventricle. The variability of the LVEF has beenreported to be ±0.04 at rest for the same individual stud-ied on different days. It is very important when interpret-ing the LVEF and most especially when interpretingchanges in LVEF from one study to another to keep inmind that the LVEF is not a fixed number for any patient.It will vary with the heart rate, the blood pressure, thelevel of circulating catecholamines, position (upright vssupine), and medications. When there are an adequatenumber of beats to choose for the ejection fraction calcu-lation, it is preferable to select those beats whose end-diastolic counts are ≥70% of the peak end-diastoliccounts. The normal values for the right ventricular ejec-tion fraction (RVEF) vary with the type of processingused. With the use of separate end-diastolic and end-sys-tolic ROIs, the lower limit of normal can be expected tobe 0.40, with a range to 0.65.
13. Diastolic filling of the left ventricle may beassessed by qualitative inspection of the time-activitycurve (volume curve) of the LV representative cycle.Obviously decreased early rapid filling, a prolonged timeto peak filling, and an increase in the atrial contributionto filling may be recognized by visual inspection of theLV volume curve. The quantitative values for peak earlyfilling and the time to peak filling should be expressed inend-diastolic volumes (EDV)/sec and in milliseconds,respectively. The atrial contribution to filling may beexpressed as a ratio of the atrial to early peak filling orvice versa. The atrium typically contributes 15% to 25%of total LV filling. The interpreting physician should notaccept any diastolic values without confirmation by visu-al inspection of the LV volume curve.
It is difficult to evaluate diastolic filling during exer-cise because the increase in heart rate usually results in a
loss of the transition between early peak filling and atri-al filling. At best, one can measure peak diastolic fillingbut without the requisite temporal sampling necessary forhigh heart rates (ie, 10 to 20 msec/frame), any measuredvalues may not be reliable. Some investigators have usedfilling fractions, that is the fraction of filling achievedduring the first third or first half of diastole. It is not clearthat such values offer any advantage over the convention-al values and are certainly a departure from the valuestypically measured in gated equilibrium studies.
Exercise/Intervention Studies. 14. The represen-tative cycles of both resting and exercise or pharmaco-logic intervention studies should be viewed in a split-screen cinematic display. Each study should be normal-ized to itself.
15. Regional wall motion of an exercise or interven-tion study should be visually compared with the regionalwall motion of the resting study by use of standard quali-tative or semiquantitative terms (see paragraph 11).During exercise or during administration of inotropic orafterload-reducing agents, regional wall motion is expect-ed to increase. Regional wall motion may decrease duringischemia, during protocols that result in abrupt increase inafterload such as isometric or sudden strenuous aerobicexercise, or during administration of drugs that acutelyincrease afterload. A semiquantitative scoring system orquantitative regional ejection fractions may be useful forcomparison of rest to exercise or interventional studies.
16. The size of the left ventricle may be qualitativelyevaluated on the cine displays. During exercise in theupright position, left ventricular volume usually increases.The magnitude of the increase is typically in the 10% to20% range, although larger increases do occur in controlsubjects. When the volume increases by ≥50% abovebaseline, coronary artery disease (CAD) should be sus-pected even in the absence of a regional wall motionabnormality, especially if there is a concomitant, signifi-cant drop in LVEF. Left ventricular volume may fail toincrease or may actually decrease even in the upright posi-tion in patients with pericardial or valvular heart disease.
17. During exercise in the upright position, one cananticipate that the ejection fractions of both ventricleswill increase. At one point in time, failure to increase theLVEF during exercise was invariably considered patho-logic. However, it is quite clear that some individualsmay show a flat response to exercise and, occasionally,even a decrease in ejection fraction (especially elderlysubjects) in the absence of coronary or valvular heart dis-ease. The higher the resting ejection fraction, the less ofan increase one tends to see during exercise. For diag-nostic purposes, an absolute value of exercise ejectionfraction may be more useful than the change from rest toexercise. Most normal individuals will have a peak exer-
G56 Journal of Nuclear CardiologyMarch/April 1999
Imaging Guidelines
cise LVEF of ≥0.56. A decrease in LVEF to less than 0.56should be considered abnormal in individuals youngerthan 70, but, in the absence of regional dysfunction, thefinding is not specific for coronary artery disease. Thechange in ejection fraction during exercise may also beinfluenced by the type of exercise protocol used. A stan-dard graded exercise protocol should always be used.
RVEF typically increases during exercise but maydecrease in patients with pulmonary hypertension, includ-ing patients in whom pulmonary hypertension developsduring exercise, such as those with mitral stenosis orsevere exercise-induced left ventricular dysfunction. Inparticular, patients with proximal right coronary arterylesions may show decreases in RVEF during exercise.
18. Left ventricular tracer transit may be prolonged dur-ing exercise because of the appearance of mitral insufficiencyresulting from LV ischemia. This finding may be recognizedmost readily on a time-activity curve of the bolus transitthrough the LV. Occasionally this finding is accompanied byexercise-induced enlargement of the left atrium.
Conclusion. 19. The radionuclide and doses usedfor the study should be permanently archived in thereport, as well as the injection site. These are moreimportant for future reference in case a patient returns tothe laboratory for serial studies. Having the data is par-ticularly useful in avoiding pitfalls if the previous studywas technically suboptimal.
20. The report should include the most important vari-ables from a stress or intervention that will help the receiv-ing physician to assess the clinical significance of the find-
ings. These variables are also important because they haveindependent diagnostic and prognostic information.
21. Overall study quality should be mentioned inthe report. This serves to appropriately increase ordecrease the confidence of the physicians using thereport for clinical decision making. It is also useful forsubsequent screening of studies for inclusion inresearch databases.
22. The initial interpretation of the study should bemade without reference to clinical data to avoid bias. Thephysician should then correlate the findings and interpre-tation with the clinical information to avoid an obviousmisinterpretation and to guarantee that the clinical ques-tion has been addressed. Including the indication for thestudy in the report serves to focus the interpreting physi-cian’s attention to the clinical question and is also usefulfor subsequent coding issues related to reimbursement.Studies should be classified as normal or abnormal.Categories of probably normal, equivocal, and probablyabnormal may be added. Both the diagnostic and prog-nostic contents of the data should be addressed. If perfu-sion scan data are available, then a statement about thesignificance of the two data sets is appropriate.
23. Whenever previous studies are available, the cinedisplays of the representative cycles should be displayedside-by-side. When rest and exercise/intervention dataare available, a quad screen display is optimal.Interpretation of serial changes in ejection fractionsshould always take into account differences in the heartrates, blood pressures, and medications.
Journal of Nuclear CardiologyVolume 6, Number 2; G47-84
Imaging Guidelines G57
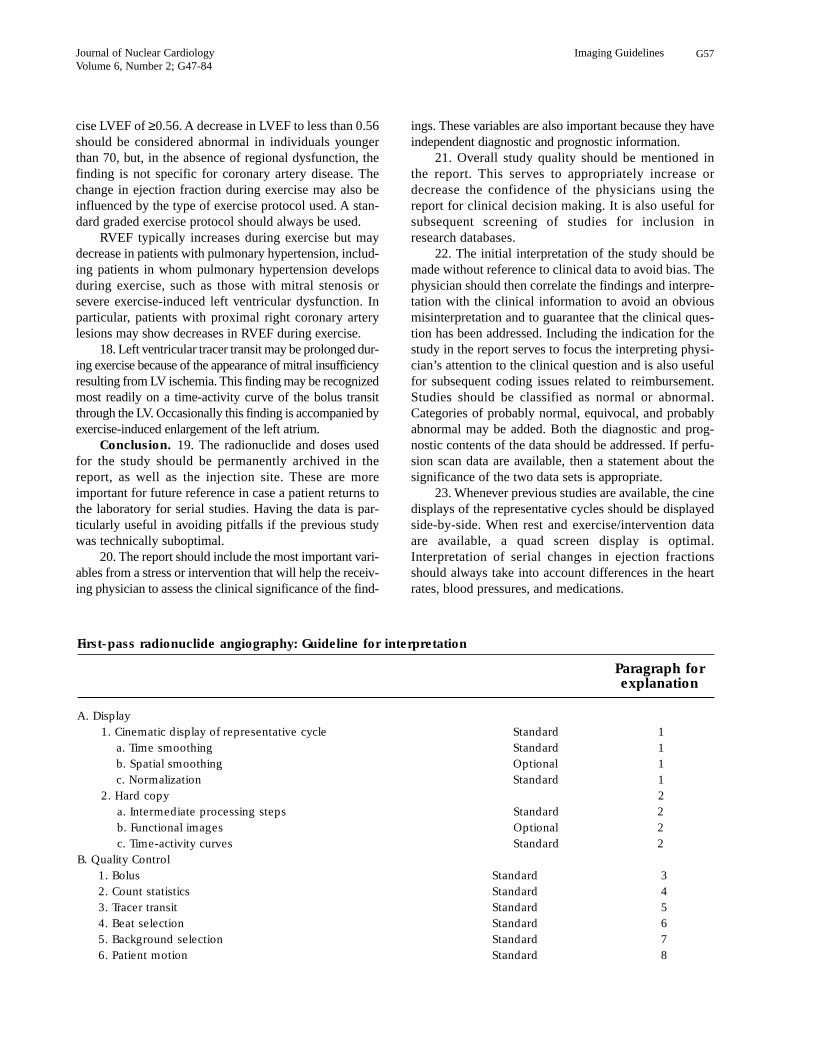
First-pass radionuclide angiography: Guideline for interpretation
Paragraph forexplanation
A. Display
1. Cinematic display of representative cycle Standard 1
a. Time smoothing Standard 1
b. Spatial smoothing Optional 1
c. Normalization Standard 1
2. Hard copy 2
a. Intermediate processing steps Standard 2
b. Functional images Optional 2
c. Time-activity curves Standard 2
B. Quality Control
1. Bolus Standard 3
2. Count statistics Standard 4
3. Tracer transit Standard 5
4. Beat selection Standard 6
5. Background selection Standard 7
6. Patient motion Standard 8

G58 Journal of Nuclear CardiologyMarch/April 1999
Imaging Guidelines
C. Results
1. Cardiac rhythm and conduction Standard 9
2. Chamber sizes
a. Qualitative Standard 10
b. Quantitative Preferred 10
3. Regional wall motion
a. Qualitative Standard 11
b. Quantitative Optional 11
4. LV Ejection fraction Standard 12
5. RV Ejection fraction Optional 12
6. LV Diastolic filling
a. Qualitative Standard 13
b. Quantitative Optional 13
D. Exercise/intervention studies
1. Display Standard 14
2. Regional wall motion: comparison to rest Standard 15
3. Chamber sizes: comparison to rest Standard 16
4. Ejection fractions: comparison to rest Standard 17
E. Conclusion
1. Comparison to previous studies Standard 18
2. Correlation with clinical findings Standard 19
First-pass radionuclide angiography: Guideline for reporting
For information see paragraph
A. Demographics
1. Name Standard
2. Gender Standard
3. Age Standard
4. Date(s) of acquisition(s) Standard
5. Medical record identifier (inpatient) Standard
6. Height/weight a/o BSA Standard
B. Acquisition parameters
1. Type(s) of acquisition(s) rest/exercise/intervention Standard
2. Radionuclide and doses Standard 19
3. Injection site Standard 19
4. Indication for study Standard 22
5. Study quality Standard 21
C. Results: hemodynamic and exercise/intervention variables
1. Rest HR and BP, cardiac rhythm Standard 20
2. Exercise HR and BP, %MPHR, METS Standard 20
3. Exercise symptoms, reason for stopping Standard 20
4. Exercise ECG changes/arrhythmia Standard 20
D. Results: Resting RNA Data
1. Chamber sizes
a. Qualitative Optional 10
b. Quantitative Standard 10
First-pass radionuclide angiography: Guideline for interpretation–con’t
Paragraph forexplanation
EQUILIBRIUM RADIONUCLIDE
ANGIOCARDIOGRAPHY (ERNA)
Purpose. To assess regional and global right and left ven-tricular function at rest during stress or during a pharmacologicintervention.
1. Display.Multiple-view ERNA (left anterior oblique[LAO], anterior, and left lateral or posterior oblique pro-jections) are usually displayed simultaneously as end-less-loop movies in quadrants of the computer screen.The display should visualize the entire heart and its sur-roundings.
ERNA images are best viewed by use of a lineargray scale. Color display is strongly discouraged.Occasionally, intense extracardiac activity may cause aproblem with image display. Computer images are usual-ly normalized to the hottest pixel within the image overall time points. In the presence of intense extracardiacactivity, radioactivity in the heart is at the darker end ofthe gray scale and may be almost invisible. Rather thanusing lead shielding, normalization of the cardiac imageto the hottest pixel within the heart usually deals ade-quately with this display problem. Alternatively, theextracardiac activity may be subtracted or “masked out.”
2. Smoothing. The smoothing process is designedto remove statistical fluctuations from image data bymodifying individual data points within the image.Multiframe digitized ERNA data are often temporally andspatially smoothed. For temporal smoothing, pixels aremodified by averaging data from preceding and followingframes in time, usually 5, and replacing the center pixelwith this average value. For spatial smoothing, pixels aremodified by averaging counts from a group of neighbor-ing pixels within the same image, usually 9, and replacingthe center pixel in the group with this average value. Thisis referred to as gaussian nine-point weighted smoothing.The exact number of temporal or spatial points used forthe smoothing will depend on the number of time pointsacquired and the acquisition resolution. Images contain-ing adequate counts rarely require spatial smoothing.
Quality Control
3. Quality Control: Count Statistics. The mostimportant determinant of the quality of ERNA images isthe count statistics in each frame and in the entire study.Low count rate studies have poor signal-to-noise ratioand are difficult to interpret reliably and reproducibly.Count density within the image does not always reflectcount density within the left ventricle. Relative count
Journal of Nuclear CardiologyVolume 6, Number 2; G47-84
Imaging Guidelines G59
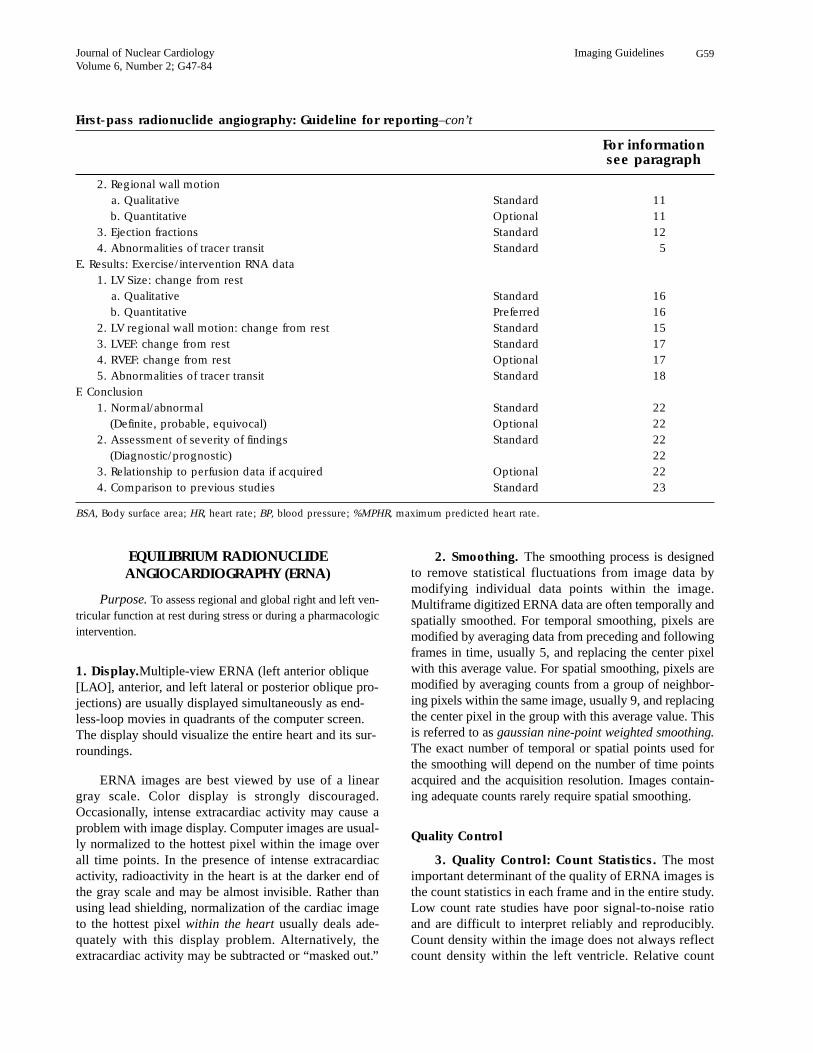
2. Regional wall motion
a. Qualitative Standard 11
b. Quantitative Optional 11
3. Ejection fractions Standard 12
4. Abnormalities of tracer transit Standard 5
E. Results: Exercise/intervention RNA data
1. LV Size: change from rest
a. Qualitative Standard 16
b. Quantitative Preferred 16
2. LV regional wall motion: change from rest Standard 15
3. LVEF: change from rest Standard 17
4. RVEF: change from rest Optional 17
5. Abnormalities of tracer transit Standard 18
F. Conclusion
1. Normal/abnormal Standard 22
(Definite, probable, equivocal) Optional 22
2. Assessment of severity of findings Standard 22
(Diagnostic/prognostic) 22
3. Relationship to perfusion data if acquired Optional 22
4. Comparison to previous studies Standard 23
BSA, Body surface area; HR, heart rate; BP, blood pressure; %MPHR, maximum predicted heart rate.
First-pass radionuclide angiography: Guideline for reporting–con’t
For information see paragraph
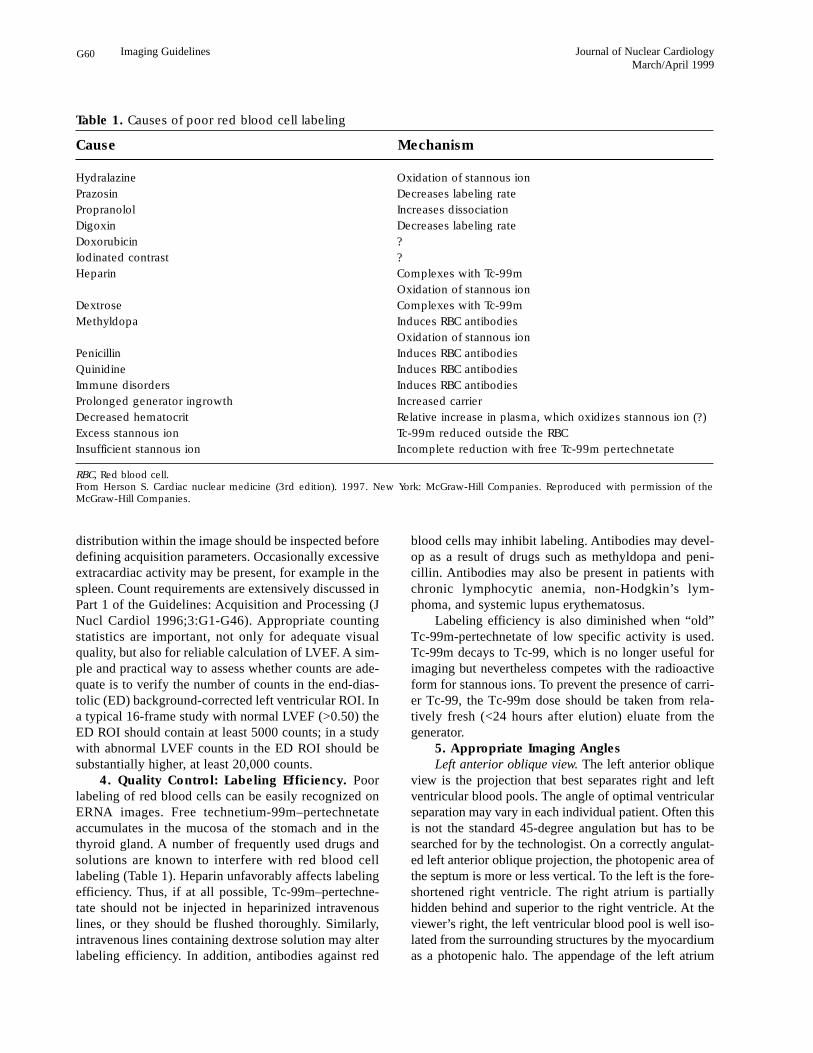
distribution within the image should be inspected beforedefining acquisition parameters. Occasionally excessiveextracardiac activity may be present, for example in thespleen. Count requirements are extensively discussed inPart 1 of the Guidelines: Acquisition and Processing (JNucl Cardiol 1996;3:G1-G46). Appropriate countingstatistics are important, not only for adequate visualquality, but also for reliable calculation of LVEF. A sim-ple and practical way to assess whether counts are ade-quate is to verify the number of counts in the end-dias-tolic (ED) background-corrected left ventricular ROI. Ina typical 16-frame study with normal LVEF (>0.50) theED ROI should contain at least 5000 counts; in a studywith abnormal LVEF counts in the ED ROI should besubstantially higher, at least 20,000 counts.
4. Quality Control: Labeling Efficiency. Poorlabeling of red blood cells can be easily recognized onERNA images. Free technetium-99m–pertechnetateaccumulates in the mucosa of the stomach and in thethyroid gland. A number of frequently used drugs andsolutions are known to interfere with red blood celllabeling (Table 1). Heparin unfavorably affects labelingefficiency. Thus, if at all possible, Tc-99m–pertechne-tate should not be injected in heparinized intravenouslines, or they should be flushed thoroughly. Similarly,intravenous lines containing dextrose solution may alterlabeling efficiency. In addition, antibodies against red
blood cells may inhibit labeling. Antibodies may devel-op as a result of drugs such as methyldopa and peni-cillin. Antibodies may also be present in patients withchronic lymphocytic anemia, non-Hodgkin’s lym-phoma, and systemic lupus erythematosus.
Labeling efficiency is also diminished when “old”Tc-99m-pertechnetate of low specific activity is used.Tc-99m decays to Tc-99, which is no longer useful forimaging but nevertheless competes with the radioactiveform for stannous ions. To prevent the presence of carri-er Tc-99, the Tc-99m dose should be taken from rela-tively fresh (<24 hours after elution) eluate from thegenerator.
5. Appropriate Imaging Angles
Left anterior oblique view. The left anterior obliqueview is the projection that best separates right and leftventricular blood pools. The angle of optimal ventricularseparation may vary in each individual patient. Often thisis not the standard 45-degree angulation but has to besearched for by the technologist. On a correctly angulat-ed left anterior oblique projection, the photopenic area ofthe septum is more or less vertical. To the left is the fore-shortened right ventricle. The right atrium is partiallyhidden behind and superior to the right ventricle. At theviewer’s right, the left ventricular blood pool is well iso-lated from the surrounding structures by the myocardiumas a photopenic halo. The appendage of the left atrium
G60 Journal of Nuclear CardiologyMarch/April 1999
Imaging Guidelines
Table 1. Causes of poor red blood cell labeling
Cause Mechanism
Hydralazine Oxidation of stannous ion
Prazosin Decreases labeling rate
Propranolol Increases dissociation
Digoxin Decreases labeling rate
Doxorubicin ?
Iodinated contrast ?
Heparin Complexes with Tc-99m
Oxidation of stannous ion
Dextrose Complexes with Tc-99m
Methyldopa Induces RBC antibodies
Oxidation of stannous ion
Penicillin Induces RBC antibodies
Quinidine Induces RBC antibodies
Immune disorders Induces RBC antibodies
Prolonged generator ingrowth Increased carrier
Decreased hematocrit Relative increase in plasma, which oxidizes stannous ion (?)
Excess stannous ion Tc-99m reduced outside the RBC
Insufficient stannous ion Incomplete reduction with free Tc-99m pertechnetate
RBC, Red blood cell.From Herson S. Cardiac nuclear medicine (3rd edition). 1997. New York: McGraw-Hill Companies. Reproduced with permission of theMcGraw-Hill Companies.
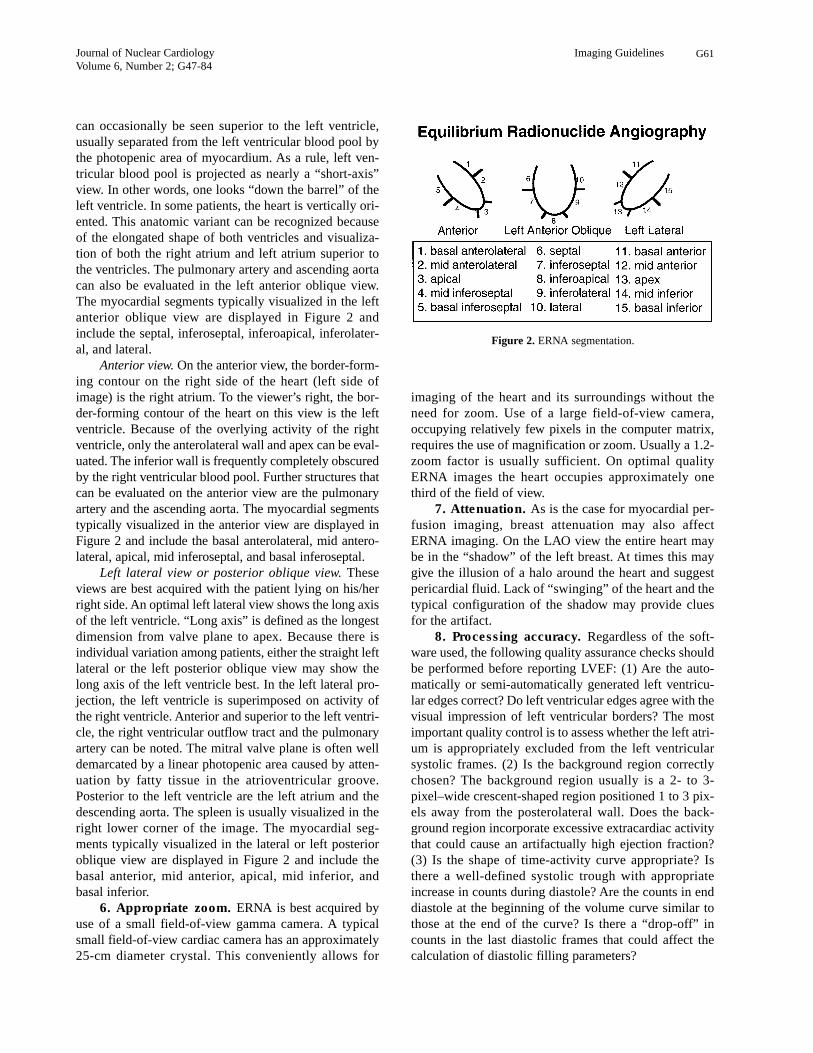
can occasionally be seen superior to the left ventricle,usually separated from the left ventricular blood pool bythe photopenic area of myocardium. As a rule, left ven-tricular blood pool is projected as nearly a “short-axis”view. In other words, one looks “down the barrel” of theleft ventricle. In some patients, the heart is vertically ori-ented. This anatomic variant can be recognized becauseof the elongated shape of both ventricles and visualiza-tion of both the right atrium and left atrium superior tothe ventricles. The pulmonary artery and ascending aortacan also be evaluated in the left anterior oblique view.The myocardial segments typically visualized in the leftanterior oblique view are displayed in Figure 2 andinclude the septal, inferoseptal, inferoapical, inferolater-al, and lateral.
Anterior view. On the anterior view, the border-form-ing contour on the right side of the heart (left side ofimage) is the right atrium. To the viewer’s right, the bor-der-forming contour of the heart on this view is the leftventricle. Because of the overlying activity of the rightventricle, only the anterolateral wall and apex can be eval-uated. The inferior wall is frequently completely obscuredby the right ventricular blood pool. Further structures thatcan be evaluated on the anterior view are the pulmonaryartery and the ascending aorta. The myocardial segmentstypically visualized in the anterior view are displayed inFigure 2 and include the basal anterolateral, mid antero-lateral, apical, mid inferoseptal, and basal inferoseptal.
Left lateral view or posterior oblique view. Theseviews are best acquired with the patient lying on his/herright side. An optimal left lateral view shows the long axisof the left ventricle. “Long axis” is defined as the longestdimension from valve plane to apex. Because there isindividual variation among patients, either the straight leftlateral or the left posterior oblique view may show thelong axis of the left ventricle best. In the left lateral pro-jection, the left ventricle is superimposed on activity ofthe right ventricle. Anterior and superior to the left ventri-cle, the right ventricular outflow tract and the pulmonaryartery can be noted. The mitral valve plane is often welldemarcated by a linear photopenic area caused by atten-uation by fatty tissue in the atrioventricular groove.Posterior to the left ventricle are the left atrium and thedescending aorta. The spleen is usually visualized in theright lower corner of the image. The myocardial seg-ments typically visualized in the lateral or left posterioroblique view are displayed in Figure 2 and include thebasal anterior, mid anterior, apical, mid inferior, andbasal inferior.
6. Appropriate zoom. ERNA is best acquired byuse of a small field-of-view gamma camera. A typicalsmall field-of-view cardiac camera has an approximately25-cm diameter crystal. This conveniently allows for
imaging of the heart and its surroundings without theneed for zoom. Use of a large field-of-view camera,occupying relatively few pixels in the computer matrix,requires the use of magnification or zoom. Usually a 1.2-zoom factor is usually sufficient. On optimal qualityERNA images the heart occupies approximately onethird of the field of view.
7. Attenuation. As is the case for myocardial per-fusion imaging, breast attenuation may also affectERNA imaging. On the LAO view the entire heart maybe in the “shadow” of the left breast. At times this maygive the illusion of a halo around the heart and suggestpericardial fluid. Lack of “swinging” of the heart and thetypical configuration of the shadow may provide cluesfor the artifact.
8. Processing accuracy. Regardless of the soft-ware used, the following quality assurance checks shouldbe performed before reporting LVEF: (1) Are the auto-matically or semi-automatically generated left ventricu-lar edges correct? Do left ventricular edges agree with thevisual impression of left ventricular borders? The mostimportant quality control is to assess whether the left atri-um is appropriately excluded from the left ventricularsystolic frames. (2) Is the background region correctlychosen? The background region usually is a 2- to 3-pixel–wide crescent-shaped region positioned 1 to 3 pix-els away from the posterolateral wall. Does the back-ground region incorporate excessive extracardiac activitythat could cause an artifactually high ejection fraction?(3) Is the shape of time-activity curve appropriate? Isthere a well-defined systolic trough with appropriateincrease in counts during diastole? Are the counts in enddiastole at the beginning of the volume curve similar tothose at the end of the curve? Is there a “drop-off” incounts in the last diastolic frames that could affect thecalculation of diastolic filling parameters?
Journal of Nuclear CardiologyVolume 6, Number 2; G47-84
Imaging Guidelines G61
Figure 2. ERNA segmentation.
Image Analysis
9. Cardiac Rhythm and Conduction. Because theERNA is formatted and displayed as an endless loop cineof a single representative beat, the “rhythm” always looksregular. Abnormalities of rhythm can only be discernedby the relationship of atrial to ventricular contraction.The most common sustained disturbance of rhythm isatrial fibrillation. Atrial fibrillation or flutter can beassumed to be present when no atrial contraction isdetected. Occasionally, one may diagnose flutter or atrialtachycardia by a difference between the atrial and ven-tricular contraction rates, that is, 2 or 3 atrial contractionsto each ventricular contraction. Pacemaker rhythm is usu-ally fairly apparent because the left ventricular activationstarts at the apex, and the wave front of contractions pro-ceeds to the base. LBBB can be diagnosed by the typicalparadoxical pattern of septal motion.
10. Left Ventricular Size. One can qualitativelyassess the relative size of various cardiac chambers. Thisassumes that the same camera and magnification are usedroutinely. Because in many patients the right ventricle isnormal in size and function, right ventricular end-dias-tolic size may serve as a benchmark for qualitativeassessment of the relative size of other cardiac structures.On a normal study, the right ventricle is usually some-what larger than the left ventricle and the RV inferior walland apex extends below the LV. A normally sized left ven-tricle “fits” within the crescent of the right ventricle on theLAO view. The presence or absence of marked left ven-tricular hypertrophy can be estimated by qualitativeassessment of the thickness of the septum. The septum iswell delineated by right and left ventricular blood pool,and thus the thickness of the myocardium can be assessed.In severe left ventricular hypertrophy, a thick photopenichalo typically surrounds the left ventricular blood pool.
11. Left Ventricular Volume. A number of meth-ods have been proposed to determine left ventricular vol-umes from ERNA studies. Several methods involve thedrawing of a measured volume of radiolabeled blood.With the counts derived from this blood volume used asa reference, cardiac volumes are then computed from leftventricular counts in the ERNA image. Although thesemethods provide reasonably accurate measurements ofleft ventricular volume, for routine use in clinical practicethe method is too cumbersome and tedious. A more prac-tical method for routine estimation of volumes, withoutthe need for drawing reference blood, involves the mea-surement of image pixel size as a reference volume forcalculating left ventricular volumes. An equation is usedthat relates total left ventricular volume to the area of apixel and the ratio of total counts within the left ventricleto the counts within the hottest pixel in the left ventricle.This equation can be incorporated in computer softwareto derive routinely left ventricular volumes.
12. Left Ventricular Regional Wall Motion.
Evaluation of left ventricular regional wall motion abnor-malities requires acquisition of multiple good-qualityviews, thereby allowing detailed analysis of each myocar-dial segment. Regional wall motion is usually qualitative-ly graded as normal, mildly hypokinetic, severely hypoki-netic, akinetic, or dyskinetic. Because this assessment issubjective, reproducibility is suboptimal. For systematicevaluation of regional wall motion, the left ventricle maybe subdivided into multiple segments. Regional wallmotion can then be characterized by the anatomic seg-ments involved, as well as the total number of segmentsinvolved. For a more rigorous approach to evaluatingregional motion, one may apply a semiquantitative scoreto each segment where normal = 4, mildly hypokinetic =3, moderately hypokinetic = 2, severely hypokinetic = 1,akinetic = 0, and dyskinetic = –1.
13. Regional LVEF. Regional LVEF can be calcu-lated by determination of the geometric center of the leftventricle and dividing the left ventricle into 5 zones cor-responding to the septal, inferoseptal, inferoapical, infer-olateral, and lateral regions. The areas involving the aor-tic and mitral valve planes are usually excluded. RegionalLVEF is computed from count density changes duringthe cardiac cycle. Because changes in count densityreflect 3-dimensional volume changes, these measure-ments are more meaningful than 1-dimensional methods,such as regional chord shortening.
14. LVEF. The most important quantitative parameterderived from ERNA studies is global LVEF. LVEF can becalculated from the LAO view, because in this projectionthe left ventricular cavity is projected without significantoverlap by other cardiac structures. On the LAO view, thethickness of the myocardium provides a natural “shielding”from radioactivity in the right ventricle and the left atrium.
Many versions of computer software exist on differ-ent commercially available systems to determine LVEF.Some software packages are completely automated; mostare semi-automated and allow operator interaction. Inspite of differences in software details, the basic comput-erized approach to derive LVEF from ERNA studies isthe same. Changes in count density (that are proportion-al to left ventricular volume changes) are assessed fromvarying regions of interest that define the edges of leftventricular endocardial borders throughout the cardiaccycle. Left ventricular counts are then corrected forextracardiac background activity. From the background-corrected counts, a left ventricular time-activity curve isgenerated. LVEF is calculated as follows:
With most commercially available computer soft-ware, the lower limit of normal for the LVEF is 0.50.
End-diastolic counts – End-systolic counts}}}}}
End-diastolic counts
G62 Journal of Nuclear CardiologyMarch/April 1999
Imaging Guidelines
Because background activity is subtracted from both theED and end-systolic (ES) counts, any spurious increasein background activity (eg, background ROI too close tothe LV or inclusive of aortic or splenic activity) will arti-ficially raise the calculated LVEF.
15. Left Ventricular Diastolic Function
Qualitative. Visual analysis of the shape of the LVtime-activity curve is frequently sufficient to detect grossabnormalities of diastolic filling. Prolongation of isovo-lumic relaxation, a delay in the onset of rapid filling, adecrease in the slope of the rapid filling phase or an exag-gerated contribution of atrial contraction to LV fillingmay be readily apparent and should be noted. Such find-ings are typical of hypertrophic ventricles. Aging, peri-cardial disease, and restrictive myocardial disease arealso associated with changes in the pattern of filling.
Quantitative. Peak diastolic filling rate can be quan-tified from the first derivative of the diastolic portion ofthe left ventricular time-activity curve. To obtain reliablevalues for diastolic filling, the left ventricular volumecurve should have sufficient temporal resolution. Valuesfor normal studies vary from laboratory to laboratory, buta generally accepted lower limit-of-normal for the peakdiastolic filling rate (PFR) is 2.50 EDV/sec. PFR tends todecrease with age in otherwise healthy older subjects. Inaddition to the PFR, the time-to-peak-diastolic-filling(tPFR) can also be measured from the left ventriculartime-activity curve and is expressed in milliseconds. Aswith the PFR, the tPFR also varies from laboratory to lab-oratory but on average should be expected to be less than180 msec. The relative contribution of atrial filling to LVfilling may be quantified as the ratio of the atrial peak tothe peak of the rapid filling phase on the first derivativecurve. Ratios of less than 1:4 are normal but may increasewith aging.
16. Right Ventricular Size. Right ventricular sizeis best evaluated in the anterior view. Assuming thatERNA images are routinely acquired with the samegamma camera and same zoom factor, abnormal enlarge-ment of the right ventricle can be identified by visualinspection and mental comparison to normal studies.There is no reliable quantitative measurement method forthe right ventricular volume with ERNA.
17. RV Regional Wall Motion. RV regional wallmotion is best assessed by use of the information fromboth the anterior and LAO views. Any single view maybe inadequate. Regional wall motion is usually qualita-tively graded as normal, mildly hypokinetic, severelyhypokinetic, akinetic, or dyskinetic.
18. RVEF. Because of overlap with other cardiacchambers, ERNA is not the procedure of choice for mea-surement of RVEF. Frequently, there is overlap of rightatrial activity during right ventricular systole, which willlead to erroneously low calculation of RVEF. Either true
first-pass or “gated first-pass” radionuclide angiocardio-graphy is the preferred approach. Both of those tech-niques yield RVEF values that are higher than those mea-sured on a standard ERNA study. The lower limit of nor-mal with these methods is 0.40. RVEF is frequentlyreduced in patients with pulmonary hypertension.
19. Atrial Sizes. The right atrium forms the leftlower border on the anterior view of the cardiac image.Size and contraction of the right atrium can be evaluatedin this view during ventricular systole. The left atrium isbest evaluated on the left lateral view during ventricularsystole. Because of overlying and surrounding radioac-tivity, frequently no clear outline of the left atrium is pre-sent. However, the general size and contractility of theleft atrium usually can be appreciated. The size of the leftatrium should be judged in comparison to the long axis ofthe left ventricle. The contraction of the left atrium isappreciated as a change in count density (changingbrightness) during ventricular diastole and is sometimesdiscernible on radionuclide studies.
Atrial contraction does, however, occur at the veryend of the acquisition cycle. Atrial contraction is shorterthan the ventricular cycle. In the presence of ventricularectopy or irregular rhythm, the last frames have lowercount density, resulting in “flicker” of the endless-loopcine. The technologist often “cuts off” one or two framesat the end of the cycle for aesthetic reasons. As a result,atrial contraction may no longer be visible.
20. Size of Pulmonary Artery and Aorta. Thepulmonary artery and the ascending and descending aortacan also be evaluated visually on good quality ERNAstudies. Only qualitative assessments, such as dilation ofthe pulmonary artery, dilation and tortuosity of theascending aorta, aortic arch, or descending aorta, can bemade. The three conventional views allow for visualassessment from different angles.
21. Left Ventricular Hypertrophy. The presenceof left ventricle hypertrophy (LVH) is best assessed in theLAO view as more than normal thickening of the septum.This is a subjective evaluation that requires familiaritywith the normal appearance of the septum on ERNAimages acquired with a particular gamma camera. Insevere LVH the left ventricular blood pool is surroundedby a massive photopenic area, that is, the hypertrophiedmyocardium. During systole there can be almost com-plete left ventricular cavity obliteration.
22. Pericardial Space. Pericardial fluid accumula-tion can be identified on ERNA studies. When a largeamount of fluid is present, a photopenic area surroundsthe heart, extending up to the roots of the large vessels.On the cine display a swinging motion of the heart can beappreciated. When estimating the extent of the pho-topenic area around the ventricular blood pool, oneshould account for both the thickness of the myocardium
Journal of Nuclear CardiologyVolume 6, Number 2; G47-84
Imaging Guidelines G63
and the presence of epicardial fat before deciding thatpericardial fluid is present. Consequently, small amountsof fluid are impossible to distinguish from normal vari-ants. The shadow of a large overlying breast may, partic-ularly in the LAO view, mimic pericardial fluid. Onlyswinging motion of the heart is a certain sign of a largeamount of pericardial fluid. The preferred technique toassess pericardial fluid continues to be echocardiography.
23. Activity Outside the Heart and Great
Vessels. Any vascular structure (tumor, etc) with suffi-cient volume of red blood cells can be visualized by ERNAimaging. Therefore it is important to be attentive for anyunusual radioactivity outside the heart and great vesselsand seek clinical correlation. Free Tc-99m–pertechnetateaccumulates in the thyroid gland and stomach mucosa.
D. Exercise and Interventions
24. Display Rest/Exercise/Intervention Studies.
ERNA images acquired at baseline and during exercise orpharmacologic interventions should be displayed side-by-side on quadrants of the computer screen for evalua-tion of changes between the two sets of images.
25. Regional Wall Motion Changes from Rest.
One should expect an increase in regional excursion dur-ing exercise, during inotropic stimulation, and duringadministration of afterload-reducing agents such as nitro-glycerin. The standard approach to detection of changesin regional wall motion between two studies is to visuallyassess the change on the side-by-side display. A somewhatmore rigorous approach is the semiquantitative method inwhich ventricular segments are assigned scores wherenormal = 4, mildly hypokinetic = 3, moderately hypoki-netic = 2, severely hypokinetic = 1, akinetic = 0, and dys-kinetic = –1. A significant change in regional wall motionbetween two studies is defined as a change in score of ≥2.
26. Chamber Size Changes from Rest. Duringinterventions, changes in chamber size may occur. A mildincrease in end-diastolic volume is normal during physi-cal exercise, especially with the patient in the uprightposition. During dobutamine stress a mild decrease in leftventricular chamber size may be observed. Thesechanges are usually too mild to be appreciated by visualanalysis but can be quantified either as a relative change(from decay-corrected count changes) or absolute vol-ume change. Visually, only moderate to severe dilation ofthe ventricles should be reported. Such marked volumechanges are almost always abnormal. If volume is mea-sured quantitatively, one should expect increases in leftventricular EDV of 10% to 20% during exercise and con-comitant decreases in ESV.
27. LVEF, RVEF Changes from Rest. Both LVEFand RVEF typically increase during exercise. Many
authors have suggested that the normal response is anincrease of at least 5 ejection fraction (EF) units. That cri-terion is based on the reproducibility of the ERNA-derived EF. Nevertheless, this criterion does not hold trueunder all circumstances. For instance, with increasingage, the ability to augment LVEF during exercisedecreases. The type of exercise protocol, the subjects’gender, acquisition during submaximal exercise, isomet-ric exercise, markedly hypertensive responses to exerciseand coexisting non-coronary heart disease may all alterthe response of the EF to exercise. Consequently, anincrease in LVEF of at least 0.05 units is a sensitive butvery nonspecific criterion for diagnosis of coronary heartdisease. In the absence of an exercise-induced regionalwall motion abnormality, changes in LVEF alone arenonspecific. Coupled with a large increase in EDV dur-ing exercise, a drop in LVEF with normal regional wallmotion during exercise should be viewed as highly sus-picious for coronary artery disease.
A more important parameter is the absolute level ofLVEF at peak exercise. Even if angiographic coronaryartery disease is documented, a peak exercise LVEF>0.50 indicates a favorable prognosis and vice versa. It isimportant to ensure that acquisition of radionuclide datais performed during peak exercise. In most patients, withand without significant disease, a sharp increase in LVEFcan be noted immediately after discontinuation of exer-cise. Abnormalities in RVEF during exercise are mostoften seen in patients with chronic pulmonary diseasesand in particular in those with pulmonary hypertension.
28. Comparison to Previous Studies and
Correlation with Clinical Data. When a patient hasundergone previous radionuclide studies, the results ofthis study should be compared with the previous ones.Ideally one should display the old and new studies side-by-side. Serial LVEF data are particularly important inpatients undergoing chemotherapy for cancer and also inpatients with heart failure, myocarditis, cardiomyopathy,or after undergoing transplantation. For this reason it ishelpful to record and reproduce the camera angles atwhich the three planar cardiac views are acquired foreach study. Interpretation of ERNA data may be per-formed without knowledge of the clinical data; however,once an initial interpretation is made, the interpretingphysician should always review the available clinicalinformation to avoid obvious misinterpretation and toguarantee that the interpretation appropriately addressesthe clinical question that prompted the study.
29. Study Quality. Poor-quality studies cannot beinterpreted with confidence and a high degree of repro-ducibility. Studies can be subjectively graded as (1)excellent, (2) average, (3) suboptimal but interpretable,and (4) uninterpretable. Placing such a designation in
G64 Journal of Nuclear CardiologyMarch/April 1999
Imaging Guidelines
the report communicates a level of confidence in thedata that is helpful to recipients of the report. It mayalso be used to screen studies from inclusion inresearch data.
30. Type of Exercise or Intervention Protocol.
The type of exercise should be specified in the report:physical exercise on treadmill or supine or upright bicy-cle. The exercise protocol should be mentioned: standardBruce, modified Bruce, Naughton. For pharmacologicintervention, the generic name of drug (eg, dobutamine)and maximal dose (eg, 40 mg/kg/min) infused should bestated. Furthermore whether drugs were administered toeither enhance or counteract the effect of the pharmaco-logic stressor should be reported.
31. Symptoms, Heart Rate and Blood Pressure
Response, Electrocardiographic Changes, and End
Point of Stress. Within the report of the radionuclidestudy a succinct description should be given of important
clinical parameters: duration of exercise or stress proto-col, baseline and peak stress heart rate, maximal workload (in METS when applicable), baseline and peakstress blood pressure, symptoms during test, (re)produc-tion of symptoms and chest pain, electrocardiographic(ECG) changes compared with baseline.
32. Conclusion. It is extremely important to sum-marize the results of the test as either “normal” or“abnormal.” Equivocal statements should be avoided ifat all possible. In addition, the report should reflect thedegree to which the test is abnormal: “markedly,” “mod-erately,” or “mildly” abnormal. The report should con-tain a statement concerning the diagnostic significanceof the findings and, most importantly, concerning theprognostic significance of the results. Finally, a compar-ison should be made to previous results, if applicable. Aserious attempt should be made to provide an answer tothe clinical questions and indication for study.
Journal of Nuclear CardiologyVolume 6, Number 2; G47-84
Imaging Guidelines G65
Equilibrium radionuclide angiocardiography: Guideline for interpretation
For informationsee paragraph
A. Display
1. Quad screen cinematic display Standard 1
2. Time smoothing Standard 2
3. Spatial smoothing Optional 2
B. Quality control
1. Image quality
Statistics-qualitative Standard 3
Statistics-quantitative Optional 3
Labeling efficiency-qualitative Standard 4
2. Appropriate imaging angles Standard 5
3. Appropriate zoom Standard 6
4. Attenuation Standard 7
5. Processing accuracy
Ventricular regions-of-interest Standard 8
Background region-of-interest Standard 8
Volume curve(s) Standard 8
C. Image Analysis
1. Cardiac rhythm and conduction Standard 9
2. Left ventricular (LV) size
Qualitative Standard 10
Quantitative volume Preferred 11
3. LV regional wall motion
Qualitative Standard 12
Semi-quantitative Optional 12
Quantitative Optional 13
4. LV ejection fraction (EF) Standard 14
5. LV diastolic filling
Qualitative Standard 15
Quantitative Preferred 15
G66 Journal of Nuclear CardiologyMarch/April 1999
Imaging Guidelines
Equilibrium radionuclide angiocardiography: Guideline for reporting
For information
see paragraph
A. Demographic data
1. Name Standard
2. Gender Standard
3. Age Standard
4. Ethnic background Optional
5. Date acquisition Standard
6. Medical record number for inpatient Standard
7. Height/weight (BSA) Standard
B. Acquisition parameters
1. Type of study Standard
2. Radionuclide/dose Standard
3. Indication for study Standard 28
4. Study quality Optional 30
C. Results: Rest
1. Left ventricular (LV) Size
Qualitative Standard 10
Quantitative Optional 11
2. LV regional wall motion Standard 12, 13
3. LV hypertrophy Optional 21
4. LV ejection fraction (LVEF) Standard 14
5. Left ventricular diastolic function
Qualitative Standard 15
Quantitative Preferred 15
6. Right ventricular (RV) size
Qualitative Standard 16
7. RV regional wall motion Standard 17
6. Right ventricular (RV) size Standard 16
7. RV regional wall motion Standard 17
8. RVEF Optional 18
9. Atrial sizes Standard 19
10. Aortic and pulmonary artery sizes Standard 20
11. LV hypertrophy Optional 21
12. Pericardial space Standard 22
13. Activity outside heart and great vessels Standard 23
D. Exercise/intervention study
1. Display Standard 24
2. Regional wall motion: changes from rest Standard 25
3. Chamber size: changes from rest Standard 26
4. LVEF, RVEF: changes from rest Standard 27
E. Conclusion
1. Correlation with clinical data Standard 28
2. Comparison to previous studies Standard 29
Equilibrium radionuclide angiocardiography: Guideline for interpretation–cont
For informationsee paragraph
SPECT MYOCARDIAL PERFUSION IMAGING:
GUIDELINE FOR INTERPRETATION AND
REPORTING
General Comments
The interpretation of myocardial perfusion SPECTimages should be performed in a systematic fashion toinclude (1) evaluation of the images to determine thepresence of technical sources of abnormalities, (2) theacquisition of additional views when appropriate, (3)interpretation of images with respect to the extent andseverity of perfusion abnormalities that are believed to bepresent, as well as lung uptake, chamber sizes, andextracardiac activity (4) incorporation of the results ofquantitative analysis, (5) consideration of functional dataobtained from the study, and (6) consideration of clinicalfactors that may have influenced the presence of anyfindings. All of those factors contribute to the productionof a final clinical report. It is assumed that the studies tobe considered were acquired and processed by use of pro-tocols that adhere to the principles described in Part I ofthese guidelines (J Nucl Cardiol 1996;3:G1-G46).
Display
1. Recommended Medium for Display. Asdetailed in the previous guidelines, we reaffirm the rec-ommendation that the reading physician use the monitorscreen rather than hard copy to interpret the study. It issuggested that physicians use a linear gray scale ratherthan color display of images resulting from lack of stan-dardization of color displays.
2. Conventional Slice Display of SPECT Images.
As previously recommended by the AHA/ACC/SNMpolicy statement (J Am Coll Cardiol 1992;20:255-6),three sets of images should be displayed: (1) a view gen-erated by slicing perpendicular to the long axis of the leftventricle (short axis), (2) a view of long-axis tomogramsgenerated by slicing in the vertical plane (vertical longaxis), (3) a view of long-axis tomograms generated byslicing in the horizontal plane (horizontal long axis). Theshort-axis tomograms should be displayed with the apicalslices to the far left with progression of slices toward thebase in a left-to-right fashion. The vertical long axisshould be displayed with septal slices on the left and pro-gression through the midventricular slices to the lateralslices in a left-to-right fashion. Similarly, the horizontal
Journal of Nuclear CardiologyVolume 6, Number 2; G47-84
Imaging Guidelines G67
Equilibrium radionuclide angiocardiography: Guideline for reporting–cont
For information
see paragraph
8. RVEF Optional 18
9. Atrial sizes Standard 19
10. Aortic and pulmonary artery size Standard 20
D. Results: exercise/intervention parameters
1. Type of exercise/intervention protocol Standard 31
2. Symptom(s) Standard 32
3. Peak heart rate and blood pressure Standard 32
4. METS achieved or percent maximum heart rate Optional 32
E. Results: exercise/intervention ERNA data
1. LV size: change from rest
a. Qualitative Standard 26
b. Quantitative Preferred 26
2. LV regional wall motion change from rest Standard 25
3. LVEF exercise Standard 27
4. RV size: change from rest Standard 26
5. RV regional wall motion: change from rest Standard 25
6. RVEF exercise Optional 27
F. Conclusion
1. Normal or abnormal Standard 33
2. Diagnostic significance of rest/exercise response Standard 33
3. Prognostic significance of rest/exercise response Optional 33
4. Comparison to previous results Standard 29
G68 Journal of Nuclear CardiologyMarch/April 1999
Imaging Guidelines
long-axis tomographic display should proceed left toright from the inferior to the superior (anterior) surface.It is also recommended that for purposes of interpretationand comparison of sequential images (eg, stress and rest,rest and redistribution) these images be displayed alignedand adjacent to each other serially. There are two widelyused approaches to image normalization. Each series(vertical, horizontal, short-axis) may be normalized to thebrightest pixel in the entire series. That is considered toprovide the most intuitively easy way to evaluate theextent and severity of perfusion defects. The drawbacksof this approach are its sensitivity to focal hot spots, thefrequently poor visualization of normal structures at thebase and apex of the left ventricle, and the lack of anideal display of each individual slice.
The other approach is “frame normalization” inwhich each image is normalized to the brightest pixelwithin the frame. That method provides optimal imagequality of each slice. The drawback of this approach isthat the brightness of each slice is unrelated to the peakmyocardial activity in the entire series such that grada-tions in activity between slices of a series may be lost.That drawback is mitigated by the display of threeorthogonal planes.
3. Three-dimensional Display. Reconstructeddata may be viewed by use of a 3-dimensional display ineither static or cine mode. Such a display is a conve-nient method for portraying the 3-dimensional locationand extent of a perfusion abnormality and may be par-ticularly helpful for correlating the coronary anatomywith the perfusion data, especially if one has the capa-bility of superimposing the coronary tree on the threedimensional perfusion display. At this point in time, theaccuracy of image interpretation with 3-dimensionaldisplays in lieu of conventional displays has not beenestablished.
Evaluation of the Images for Technical Sources of
Error
4. Patient Motion. An essential first step of theinterpretative process is the viewing of the raw projec-tion data for each study. Images are typically firstinspected for the presence of patient motion. A cine dis-play of the planar projection data is highly recommend-ed because motion in both the craniocaudal and horizon-tal axes are readily detectable. Additionally, the static“sinogram” may be used to detect motion. Software rou-tines are available for quantitation of the severity ofmotion and typically express the extent of the motion inpixels. That is convenient because most authorities agreethat motion of less than 1 pixel will not produce clini-cally significant artifacts. When motion exceeds 1 pixel,
the acquisition should preferably be repeated if Tc-99msestamibi or Tc-99m tetrofosmin is used. Repeat imag-ing may be performed when Tl-201 is used, but earlyredistribution may complicate the interpretation. If it isclear that the subject will not be able to remain still orthat the respiratory pattern creates excessive motion,then either a planar study should be acquired or the sub-ject may be placed in the prone position to reducemotion. If available, a validated motion correction algo-rithm may be applied before reconstruction, which mayobviate the need for repeat acquisitions or planar backupstudies. In general, however, such programs have notbeen extensively validated.
5. Attenuation and Attenuation Correction.
The cine display of the planar projection images is alsorecommended for the identification of sources of attenu-ation, the most common being diaphragmatic in men andthe breast in women. Breast attenuation may be alteredby repeating the acquisition with the breast repositioned.Diaphragmatic attenuation may be eliminated by imag-ing with the patient in the prone position. Hardware andsoftware for attenuation and scatter correction are justnow becoming commercially available and may obviateor at least mitigate these common attenuation artifacts.The evaluation of attenuation-corrected images is per-formed with the same approach as that used for nonat-tenuation-corrected images. As with the interpretation ofnonattenuation-corrected studies, it is essential that theinterpreting physician be familiar with the segment bysegment normal variation of uptake of radioactivity atstress and rest associated with the specific attenuationcorrection system that is being used. Attenuation-correct-ed images are displayed in the same manner as uncor-rected images. Because the currently available correctionalgorithms are imperfect, it is recommended that theattenuation-corrected data be read simultaneously withthe uncorrected data.
6. Reconstruction Artifacts. Superimposed bowelloops or liver activity may create artifactually intenseuptake in the overlapped myocardium. That could bemisinterpreted as reduced uptake in adjacent or contralat-eral segments. Nonsuperimposed but adjacent extracar-diac activity may also affect the reconstructed myocardialimages. Intense activity in bowel loops or adjacent livermay cause a negative reconstruction artifact, resulting in anapparent reduction in activity in the adjacent myocardialsegments. There is currently no reliable correction for suchartifacts, although they are less prominent with iterative asopposed to filtered back-projection techniques. They canoften be eliminated by repeating the acquisition after theactivity level in the adjacent structure has decreased.
7. Myocardial Statistics. Many factors areinvolved in the final count density of perfusion images
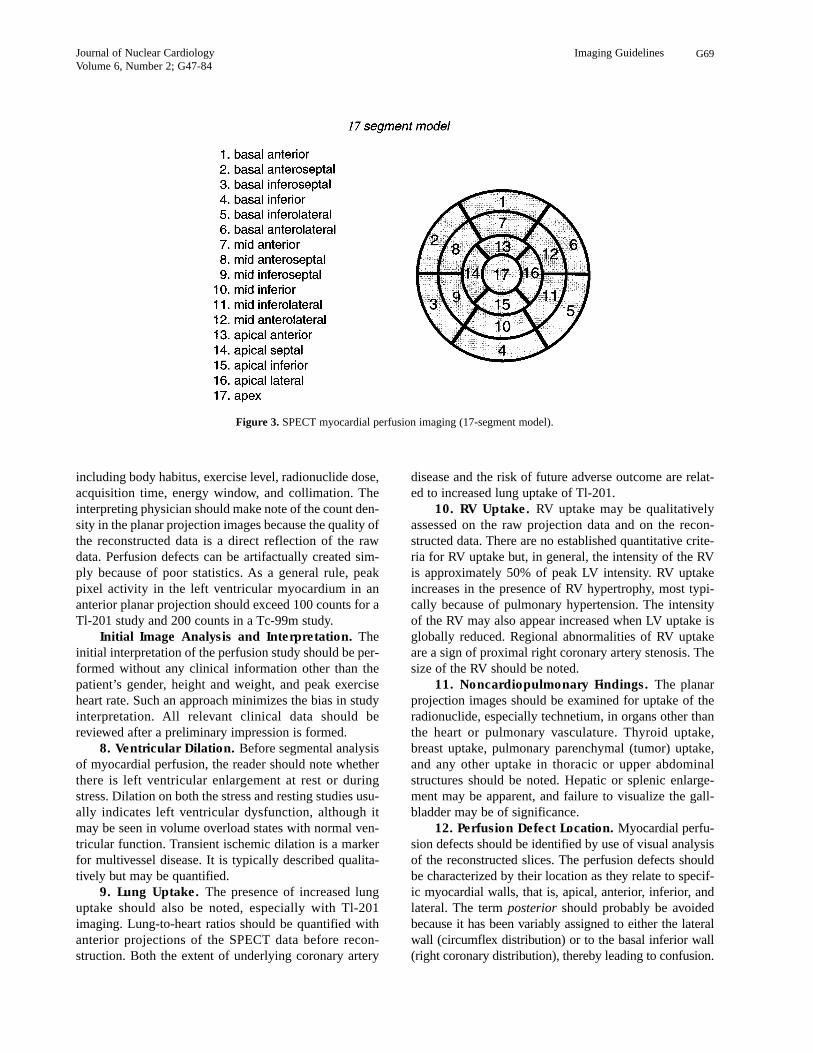
Journal of Nuclear CardiologyVolume 6, Number 2; G47-84
Imaging Guidelines G69
including body habitus, exercise level, radionuclide dose,acquisition time, energy window, and collimation. Theinterpreting physician should make note of the count den-sity in the planar projection images because the quality ofthe reconstructed data is a direct reflection of the rawdata. Perfusion defects can be artifactually created sim-ply because of poor statistics. As a general rule, peakpixel activity in the left ventricular myocardium in ananterior planar projection should exceed 100 counts for aTl-201 study and 200 counts in a Tc-99m study.
Initial Image Analysis and Interpretation. Theinitial interpretation of the perfusion study should be per-formed without any clinical information other than thepatient’s gender, height and weight, and peak exerciseheart rate. Such an approach minimizes the bias in studyinterpretation. All relevant clinical data should bereviewed after a preliminary impression is formed.
8. Ventricular Dilation. Before segmental analysisof myocardial perfusion, the reader should note whetherthere is left ventricular enlargement at rest or duringstress. Dilation on both the stress and resting studies usu-ally indicates left ventricular dysfunction, although itmay be seen in volume overload states with normal ven-tricular function. Transient ischemic dilation is a markerfor multivessel disease. It is typically described qualita-tively but may be quantified.
9. Lung Uptake. The presence of increased lunguptake should also be noted, especially with Tl-201imaging. Lung-to-heart ratios should be quantified withanterior projections of the SPECT data before recon-struction. Both the extent of underlying coronary artery
disease and the risk of future adverse outcome are relat-ed to increased lung uptake of Tl-201.
10. RV Uptake. RV uptake may be qualitativelyassessed on the raw projection data and on the recon-structed data. There are no established quantitative crite-ria for RV uptake but, in general, the intensity of the RVis approximately 50% of peak LV intensity. RV uptakeincreases in the presence of RV hypertrophy, most typi-cally because of pulmonary hypertension. The intensityof the RV may also appear increased when LV uptake isglobally reduced. Regional abnormalities of RV uptakeare a sign of proximal right coronary artery stenosis. Thesize of the RV should be noted.
11. Noncardiopulmonary Findings. The planarprojection images should be examined for uptake of theradionuclide, especially technetium, in organs other thanthe heart or pulmonary vasculature. Thyroid uptake,breast uptake, pulmonary parenchymal (tumor) uptake,and any other uptake in thoracic or upper abdominalstructures should be noted. Hepatic or splenic enlarge-ment may be apparent, and failure to visualize the gall-bladder may be of significance.
12. Perfusion Defect Location. Myocardial perfu-sion defects should be identified by use of visual analysisof the reconstructed slices. The perfusion defects shouldbe characterized by their location as they relate to specif-ic myocardial walls, that is, apical, anterior, inferior, andlateral. The term posterior should probably be avoidedbecause it has been variably assigned to either the lateralwall (circumflex distribution) or to the basal inferior wall(right coronary distribution), thereby leading to confusion.
Figure 3. SPECT myocardial perfusion imaging (17-segment model).
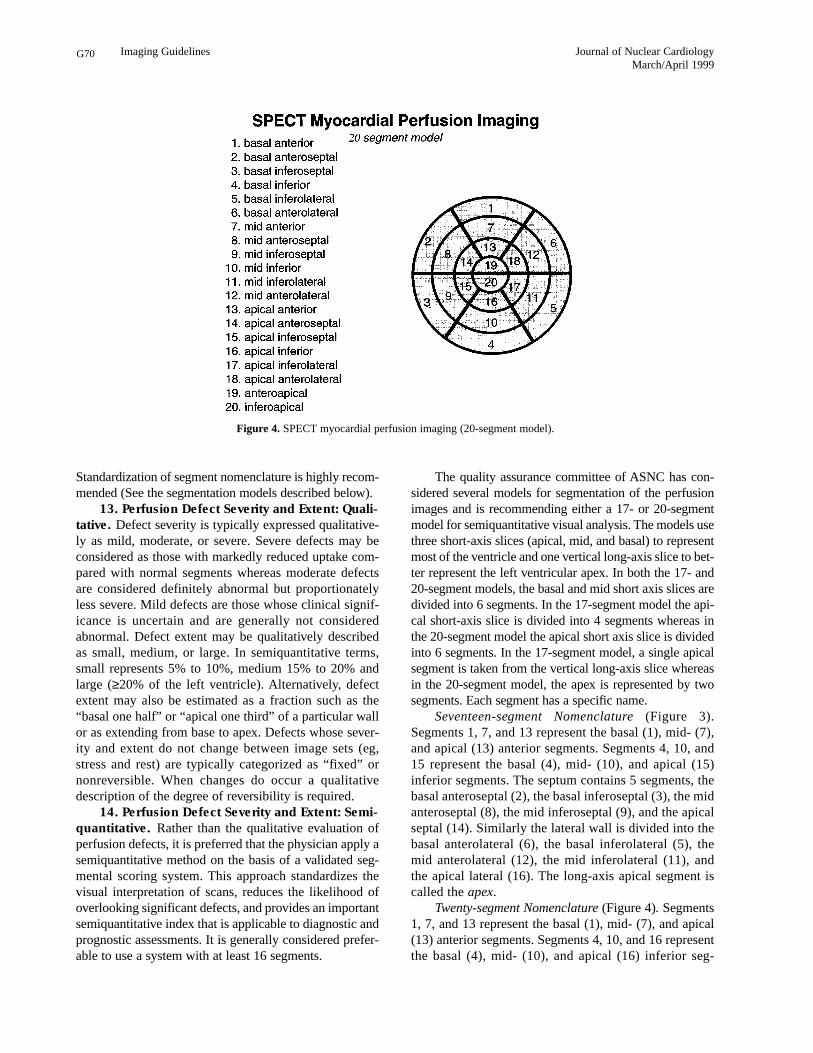
G70 Journal of Nuclear CardiologyMarch/April 1999
Imaging Guidelines
Standardization of segment nomenclature is highly recom-mended (See the segmentation models described below).
13. Perfusion Defect Severity and Extent: Quali-
tative. Defect severity is typically expressed qualitative-ly as mild, moderate, or severe. Severe defects may beconsidered as those with markedly reduced uptake com-pared with normal segments whereas moderate defectsare considered definitely abnormal but proportionatelyless severe. Mild defects are those whose clinical signif-icance is uncertain and are generally not consideredabnormal. Defect extent may be qualitatively describedas small, medium, or large. In semiquantitative terms,small represents 5% to 10%, medium 15% to 20% andlarge (≥20% of the left ventricle). Alternatively, defectextent may also be estimated as a fraction such as the“basal one half” or “apical one third” of a particular wallor as extending from base to apex. Defects whose sever-ity and extent do not change between image sets (eg,stress and rest) are typically categorized as “fixed” ornonreversible. When changes do occur a qualitativedescription of the degree of reversibility is required.
14. Perfusion Defect Severity and Extent: Semi-
quantitative. Rather than the qualitative evaluation ofperfusion defects, it is preferred that the physician apply asemiquantitative method on the basis of a validated seg-mental scoring system. This approach standardizes thevisual interpretation of scans, reduces the likelihood ofoverlooking significant defects, and provides an importantsemiquantitative index that is applicable to diagnostic andprognostic assessments. It is generally considered prefer-able to use a system with at least 16 segments.
The quality assurance committee of ASNC has con-sidered several models for segmentation of the perfusionimages and is recommending either a 17- or 20-segmentmodel for semiquantitative visual analysis. The models usethree short-axis slices (apical, mid, and basal) to representmost of the ventricle and one vertical long-axis slice to bet-ter represent the left ventricular apex. In both the 17- and20-segment models, the basal and mid short axis slices aredivided into 6 segments. In the 17-segment model the api-cal short-axis slice is divided into 4 segments whereas inthe 20-segment model the apical short axis slice is dividedinto 6 segments. In the 17-segment model, a single apicalsegment is taken from the vertical long-axis slice whereasin the 20-segment model, the apex is represented by twosegments. Each segment has a specific name.
Seventeen-segment Nomenclature (Figure 3).Segments 1, 7, and 13 represent the basal (1), mid- (7),and apical (13) anterior segments. Segments 4, 10, and15 represent the basal (4), mid- (10), and apical (15)inferior segments. The septum contains 5 segments, thebasal anteroseptal (2), the basal inferoseptal (3), the midanteroseptal (8), the mid inferoseptal (9), and the apicalseptal (14). Similarly the lateral wall is divided into thebasal anterolateral (6), the basal inferolateral (5), themid anterolateral (12), the mid inferolateral (11), andthe apical lateral (16). The long-axis apical segment iscalled the apex.
Twenty-segment Nomenclature (Figure 4). Segments1, 7, and 13 represent the basal (1), mid- (7), and apical(13) anterior segments. Segments 4, 10, and 16 representthe basal (4), mid- (10), and apical (16) inferior seg-
Figure 4. SPECT myocardial perfusion imaging (20-segment model).
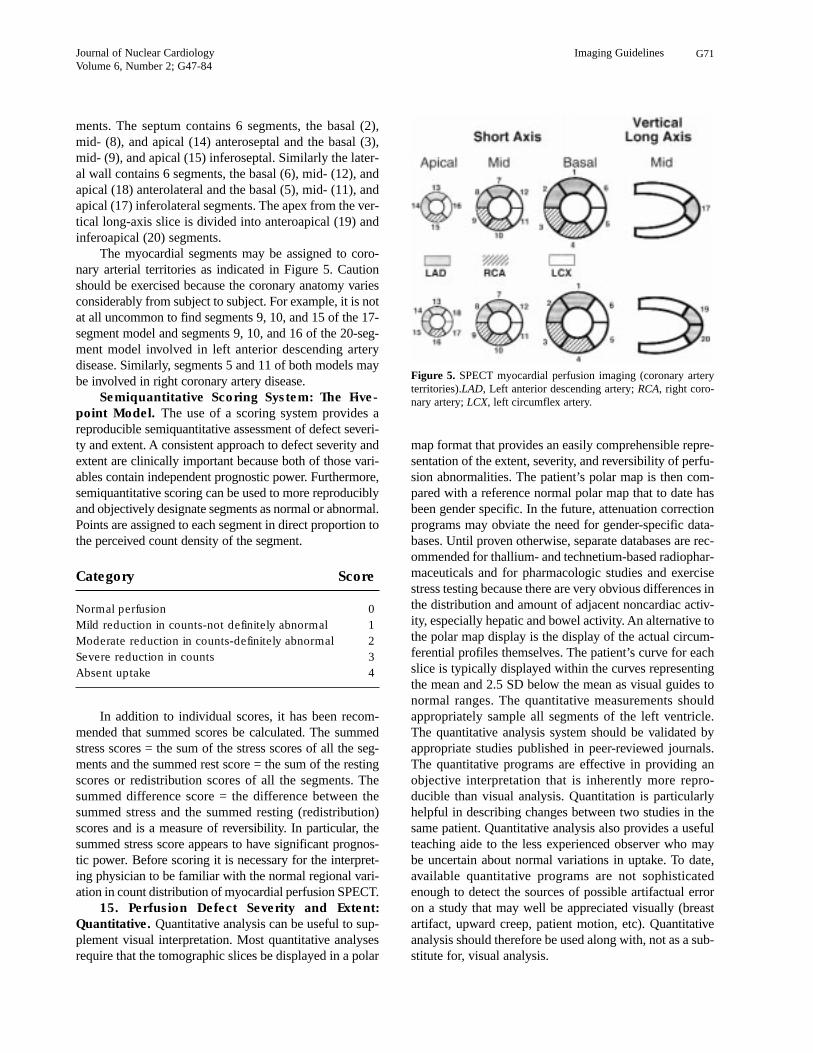
Journal of Nuclear CardiologyVolume 6, Number 2; G47-84
Imaging Guidelines G71
ments. The septum contains 6 segments, the basal (2),mid- (8), and apical (14) anteroseptal and the basal (3),mid- (9), and apical (15) inferoseptal. Similarly the later-al wall contains 6 segments, the basal (6), mid- (12), andapical (18) anterolateral and the basal (5), mid- (11), andapical (17) inferolateral segments. The apex from the ver-tical long-axis slice is divided into anteroapical (19) andinferoapical (20) segments.
The myocardial segments may be assigned to coro-nary arterial territories as indicated in Figure 5. Cautionshould be exercised because the coronary anatomy variesconsiderably from subject to subject. For example, it is notat all uncommon to find segments 9, 10, and 15 of the 17-segment model and segments 9, 10, and 16 of the 20-seg-ment model involved in left anterior descending arterydisease. Similarly, segments 5 and 11 of both models maybe involved in right coronary artery disease.
Semiquantitative Scoring System: The Five-
point Model. The use of a scoring system provides areproducible semiquantitative assessment of defect severi-ty and extent. A consistent approach to defect severity andextent are clinically important because both of those vari-ables contain independent prognostic power. Furthermore,semiquantitative scoring can be used to more reproduciblyand objectively designate segments as normal or abnormal.Points are assigned to each segment in direct proportion tothe perceived count density of the segment.
Category Score
Normal perfusion 0
Mild reduction in counts-not definitely abnormal 1
Moderate reduction in counts-definitely abnormal 2
Severe reduction in counts 3
Absent uptake 4
In addition to individual scores, it has been recom-mended that summed scores be calculated. The summedstress scores = the sum of the stress scores of all the seg-ments and the summed rest score = the sum of the restingscores or redistribution scores of all the segments. Thesummed difference score = the difference between thesummed stress and the summed resting (redistribution)scores and is a measure of reversibility. In particular, thesummed stress score appears to have significant prognos-tic power. Before scoring it is necessary for the interpret-ing physician to be familiar with the normal regional vari-ation in count distribution of myocardial perfusion SPECT.
15. Perfusion Defect Severity and Extent:
Quantitative. Quantitative analysis can be useful to sup-plement visual interpretation. Most quantitative analysesrequire that the tomographic slices be displayed in a polar
map format that provides an easily comprehensible repre-sentation of the extent, severity, and reversibility of perfu-sion abnormalities. The patient’s polar map is then com-pared with a reference normal polar map that to date hasbeen gender specific. In the future, attenuation correctionprograms may obviate the need for gender-specific data-bases. Until proven otherwise, separate databases are rec-ommended for thallium- and technetium-based radiophar-maceuticals and for pharmacologic studies and exercisestress testing because there are very obvious differences inthe distribution and amount of adjacent noncardiac activ-ity, especially hepatic and bowel activity. An alternative tothe polar map display is the display of the actual circum-ferential profiles themselves. The patient’s curve for eachslice is typically displayed within the curves representingthe mean and 2.5 SD below the mean as visual guides tonormal ranges. The quantitative measurements shouldappropriately sample all segments of the left ventricle.The quantitative analysis system should be validated byappropriate studies published in peer-reviewed journals.The quantitative programs are effective in providing anobjective interpretation that is inherently more repro-ducible than visual analysis. Quantitation is particularlyhelpful in describing changes between two studies in thesame patient. Quantitative analysis also provides a usefulteaching aide to the less experienced observer who maybe uncertain about normal variations in uptake. To date,available quantitative programs are not sophisticatedenough to detect the sources of possible artifactual erroron a study that may well be appreciated visually (breastartifact, upward creep, patient motion, etc). Quantitativeanalysis should therefore be used along with, not as a sub-stitute for, visual analysis.
Figure 5. SPECT myocardial perfusion imaging (coronary arteryterritories).LAD, Left anterior descending artery; RCA, right coro-nary artery; LCX, left circumflex artery.
G72 Journal of Nuclear CardiologyMarch/April 1999
Imaging Guidelines
Defect extent may be quantitatively expressed as apercentage of the entire LV or as a percentage of individ-ual vascular territories, the latter being much more unre-liable because of the vagaries of coronary anatomy.Defect severity may be quantitatively expressed as thenumber of standard deviations by which the segmentvaries from the normal range for that particular segmentor segments. Defect reversibility may also be expressedas a percentage of the entire LV or of a vascular territory.
16. Integration of Findings for Interpretation.
After the segmental scoring or quantitative analysis isperformed, the interpreting physician should take intoaccount the correspondence of observed defects to stan-dard coronary artery territories, the reversibility ofobserved defects, possible sources of artifact in the study,and whether the location of the defects observed are inlocations with highly variable count statistics (eg, theanterior or anterolateral wall in women with largerbreasts, the inferior wall in patients with possiblediaphragmatic attenuation, etc).
Because not all studies can be unequivocally desig-nated as clearly abnormal or normal, it is recommendedthat the traditional three-category system (normal-equiv-ocal-abnormal) be replaced with a five-category system(definitely normal, probably normal, equivocal, probablyabnormal, definitely abnormal). The 5-tiered systemactually decreases the frequency of studies judged to beequivocal and should prove to be more effective. In gen-eral, interpreting physicians are strongly encouraged toavoid “equivocal” interpretations whenever possible.
16. Reversibility. Reversibility of perfusion defectsmay be categorized qualitatively as partial or complete,the latter being present when the activity in the defectreturns to a level comparable to surrounding normalmyocardium. The semiquantitative scoring system maybe used to define reversibility as a ≥2-grade improvementor improvement to a score of 1. Reversibility on a quan-titative polar or on 3-dimensional displays will depend onthe particular software routine in use and the normal ref-erence databases used in the program. Areas of reversibil-ity are typically described by pixels that improve to <2.5SD from the normal reference redistribution or restingdatabase. How many pixels have to improve for rever-sibility to be deemed present is arbitrary.
So-called reverse redistribution may be seen in stress-delayed thallium imaging sequences and has beendescribed in rest-delayed technetium-sestamibi sequences.Reverse redistribution refers to segments with decreasedor normal intensity on the initial set of images that showeven less relative intensity on the delayed images. Theinterpretation of the finding remains controversial, but incertain clinical situations it seems to represent segmentswith a mixture of viable and nonviable myocardia that arefrequently supplied by patent infarct-related arteries.
D. Gated Myocardial Perfusion SPECT
Because of its relatively minimal expense and itsincremental information, gated studies of ventricularfunction should be a routine part of myocardial perfusionSPECT. A systematic approach to display and interpreta-tion of the ventricular function derived from gatedSPECT is important.
17. Gated SPECT Display. Multiple ventricularslices should be evaluated. At a minimum, a quad-screendisplay of apical and mid-basal short axis, a mid-ventric-ular horizontal long-axis and a mid-ventricular verticallong-axis slice should be viewed. Other slices may beviewed for completeness or to resolve a discrepancybetween the clinical impression and what is seen on thefour standard cine views. Ideally, the software shouldallow the user to scroll through any of the slices in anyaxis in cine mode. Each view should be normalized to theseries of end-diastolic to end-systolic slices to maintainthe count density changes that reflect wall thickening.When available, software routines that automaticallydefine epicardial and endocardial borders and that subse-quently calculate ventricular volumes and ejection frac-tion should be applied.
Regional wall motion should be interpreted with ablack-and-white display. When computer edge analysissoftware is available, the physician may choose to analyzewall motion by use of the assigned endocardial and epi-cardial contours, but reference should also be made to thewall motion without computer-derived edges. Regionalwall thickening may be analyzed in black and white or ina suitable color scheme, although color displays maymake it easier to see changes in count intensity.
18. Gated SPECT Quality Control. All the qualityassurance procedures for routine SPECT are applicableto gated SPECT. In addition, one should evaluate the ade-quacy of the ECG gate. The most common result of poorgating is the appearance of a flashing pattern on the rotat-ing planar projection images that results from count fluc-tuations from frame to frame. Ideally, a heart-rate his-togram should also be viewed to verify beat length unifor-mity. Inspecting a time-volume curve may be useful to ver-ify that the gating was appropriate. The curve should havethe typical appearance of a left ventricular volume curve instandard equilibrium radionuclide angiography. As yet,there is no clear consensus on the beat length window forgated SPECT acquisitions. As in blood pool imaging, thenarrower the window, the more physiological the data, butthe SPECT study will suffer from suboptimal statistics if anarrow window is selected unless imaging time is propor-tionately extended. Another important aspect of qualitycontrol is a visual or quantitative determination that thenumber of counts acquired in each frame of the gatedstudy was adequate for assessment of function.
19. Gated SPECT: Regional Wall Motion and
Journal of Nuclear CardiologyVolume 6, Number 2; G47-84
Imaging Guidelines G73
Thickening. Regional wall motion should be analyzedby use of standard nomenclature: normal, hypokinesis,akinesis, and dyskinesis. Hypokinesis should be furtherqualified as mild, moderate, or severe. A semiquantitativescoring system is recommended where 0 = normal, 1 =mild hypokinesis, 2 = moderate hypokinesis, 3 = severehypokinesis, 4 = akinesis, and 5 = dyskinesis.
This is comparable to the 5-point scoring systemused in both contrast and radionuclide ventriculography.As in any assessment of regional ventricular function,one must be cognizant of expected normal and abnormalvariations such as the reduced wall excursion at the basecompared with the apex, the greater excursion of thebasal lateral wall compared with the basal septum, andparadoxical septal motion resulting from LBBB.
Regional wall thickening is evaluated by use of thecount increase from end-diastole to end-systole. Visuallyit is not as easy to assign degrees of abnormality of thick-ening as it is to wall motion. However, the radionuclideevaluation of thickening lends itself to quantitationbecause it is characterized by count changes.Quantitative normal databases should be available forassessment of regional wall thickening in the future.Similarly, it is difficult to reliably detect LVH on recon-structed SPECT slices unless it is severe.
The assessment of wall motion and wall thickeninggenerally go hand in hand. The principle exception tothis occurs in patients who have undergone bypasswhere septal dyskinesis is commonly found associatedwith normal wall thickening. Rather than separatelyscoring wall motion and wall thickening, it is common-ly accepted to incorporate the two findings into a singlescore while noting the presence of discordance in wallmotion and wall thickening when it occurs. In additionto noting left ventricular wall motion, wall thickening,and ejection fraction, the size of the left and right ven-tricles should be observed, and the function of the rightventricle should be noted.
20. Left Ventricular Ejection Fraction and
Volume. LVEF and LV and RV chamber sizes shouldroutinely be evaluated qualitatively. Ejection fractionmay be categorized as normal, mildly, moderately, orseverely reduced. Volume may be categorized as normal,mildly, moderately, or severely increased.
Alternatively, LVEF and end-diastolic and end-sys-tolic volumes may be calculated with geometric modelsapplied to the reconstructed data set. Several softwareroutines that correlate well with contrast and otherradionuclide measurements are commercially available.
21. Integration of Perfusion and Function
Results. The results of the perfusion and gated SPECTdata sets should be integrated to reach a final interpreta-tion. The wall motion is particularly helpful in distin-guishing real nonreversible perfusion defects from atten-
uation or motion artifacts. Fixed perfusion defects that donot show a corresponding abnormality of motion orthickening should be suspected of being artifacts, espe-cially if the clinical data do not support prior infarctionand should be considered normal.
E. Myocardial Viability
22. Viability: Qualitative Assessment. The assess-ment of myocardial viability is a complex issue. Recentliterature has suggested that different imaging modalitiesprovide different estimates of viability. It is, as yet, notentirely clear which imaging method or methods repre-sent the best clinical approach. It is, however, clear, thatthe quantitative uptake of radionuclides such as Tl-201and the available technetium agents does correlate withmyocardial viability as judged by post-revascularizationimprovement in both tracer uptake and regional function.Myocardial segments with normal or mildly reducedtracer uptake at rest or on delayed imaging almost invari-ably prove to be viable. The majority of myocardial seg-ments in which there is unequivocal improvement ofuptake on either redistribution or resting images alsoprove to be viable. The more difficult challenge for thesingle photon assessment of viability is in segments withseverely reduced tracer uptake. Because of the severelyreduced uptake, simple visual assessment of viability insuch regions is difficult at best.
23. Myocardial Viability: Semiquantitative Assess-
ment. The semiquantitative scoring system describedabove may be used to assess viability as follows.Segments with rest, reinjection, or redistribution scoresof 0 (normal perfusion) or 1 (slight reduction in counts)are considered viable. Segments with rest, redistribution,or reinjection scores of 2 (moderately decreased perfu-sion) are consistent with a combination of viable andnonviable myocardium, and segments with scores of 3and 4 are generally nonviable. Segments with final scoresof 4 are considered nonviable.
Segments with final scores of 2 or 3 should be fur-ther characterized by use of a nitroglycerin protocol or adifferent modality such as positron emission tomography(PET) imaging or low-dose dobutamine echocardiogra-phy. Low-dose dobutamine SPECT may also be useful.
24. Myocardial Viability: Quantitative Assess-
ment. An alternate and perhaps more rigorous approach tothe assessment of the viability of any segment is the quan-titative determination of ischemic to normal ratios. ROImay be placed over the segment in question and over themost normal segment of the myocardium in that particularseries of images. The analysis should be applied to theresting images for technetium images or to the resting,redistribution, or reinjection images for thallium. Whenthis approach is used, one must take into account the nor-
G74 Journal of Nuclear CardiologyMarch/April 1999
Imaging Guidelines
ed in the report because they may directly affect theimage results and interpretation. For medical recordspurposes, any identification number should be included.Pertinent medications that may influence the resultsmay be included.
27. Type of Study. The imaging protocol should bespecified, including the radiopharmaceutical and dose,imaging technique (gated vs ungated, supine, or prone),imaging sequence (stress/4-hour redistribution, 1-day or2-day rest/stress or stress/rest, etc.) The date(s) of studyacquisitions should also be included.
28. Indication for Study. Placing the indication forthe study in the report helps focus the interpreting physi-cian on the clinical question raised by the ordering physi-cian and may be subsequently important for reimburse-ment issues.
29. Resting ECG Findings. Inclusion of ECGfindings that may have direct bearing on the study inter-pretation should be included such as the presence ofLBBB or LVH.
30. Summary of Stress Data. The type of stress(bicycle or treadmill) and the protocol should be identi-fied (Bruce, Modified Bruce, Naughton, Manual). Forpharmacologic stress, the agent, route of administration,and dose should be indicated. The reason for stopping thetest should be noted. All symptoms experienced by thepatient during the stress (eg, chest pain, dyspnea, claudi-cation, dizziness) should be mentioned.
If a separate stress test report is generated, then thestress variables that could impact on the perfusion studyquality or findings should be included in the perfusionscan report. At a minimum that should include the totalexercise duration, maximal heart rate and percent of pre-dicted maximum heart rate, blood pressure and maximalworkload achieved (estimated METS), and the magni-tude (in millimeters) of any ST segment deviation.
If only one report is used for both the exercise orpharmacologic study and the perfusion results, then moredetail about the stress test should be included such astime of onset, duration and exact ECG leads with ST seg-ment changes, the type of chest pain (typical, atypical,non-anginal) and its severity (mild, moderate, severe),and the presence of arrhythmia.
31. Overall Study Quality. Including a statementabout the quality of the study is helpful for two reasons.First, it alerts the physicians using the report to any short-comings that might reduce the accuracy of the data andtheir interpretation. Second, it is useful as an inclusion/exclusion criterion for subsequent acceptance of thestudy for research or other statistical analyses.
32. Diagnosis and Prognosis of CAD. The prob-ability of CAD may be determined with available algo-rithms that use the pre-scan likelihood of CAD as deter-
mal count variations such as the relatively reduced countsin the normal inferior wall. Segments with ratios less than0.30 are considered nonviable. Areas with ratios greaterthan 0.50 are considered viable whereas areas with ratiosof 0.30 to 0.50 are equivocal for viability. As indicatedabove for the semiquantitative approach, such regionsrequire additional data such as wall motion of the region,exercise perfusion in the region, the change in perfusion orwall motion after nitroglycerin, the response of regionalfunction to low-dose dobutamine, or myocardial metabol-ic imaging with 18-fluorodeoxyglucose.
It is also important to recognize that viability of agiven segment does not necessarily equate to improve-ment in clinical outcome after revascularization unlessenough segments that are viable are available. The criti-cal number of segments necessary to justify revascular-ization strategies has not been adequately studied.
F. Modification of the Interpretation by Relevant
Clinical Information
25. Although the initial scan interpretation should bemade without knowledge of the patient’s clinical charac-teristics and the results of the stress portion of the nuclearstudy, the final interpretation should be adjusted to a lim-ited degree on the basis of clinically relevant data.Relevant clinical data include the history, indication forthe study, and the results of the exercise or intervention.Key variables from the exercise/intervention data setshould be included in the final report including heart rate,blood pressure, percent of maximum predicted heart rate,or METS achieved, as well as symptoms and ECGchanges because those variables influence the signifi-cance of the perfusion results and contain independentdiagnostic and prognostic information.
By convention, the modified interpretation shouldnot vary from the initial assessment by more than onecategory of probability. For example, if the initial con-clusion was “probably normal” (in a 5-category scale asdescribed above), the final interpretation could bechanged to “equivocal” or “definitely normal,” but itshould not be recategorized as “probably” or “definitelyabnormal.” The modification has the effect of improvingthe overall concordance of information sent to clinicianswithout substantially altering the information containedin the scintigraphic examination. It is analogous to apply-ing a smoothing filter to a curve or image.
Reporting of SPECT Myocardial Perfusion Scan
Results
26. Subject Information. The age, gender,height, weight, and body surface area should be includ-
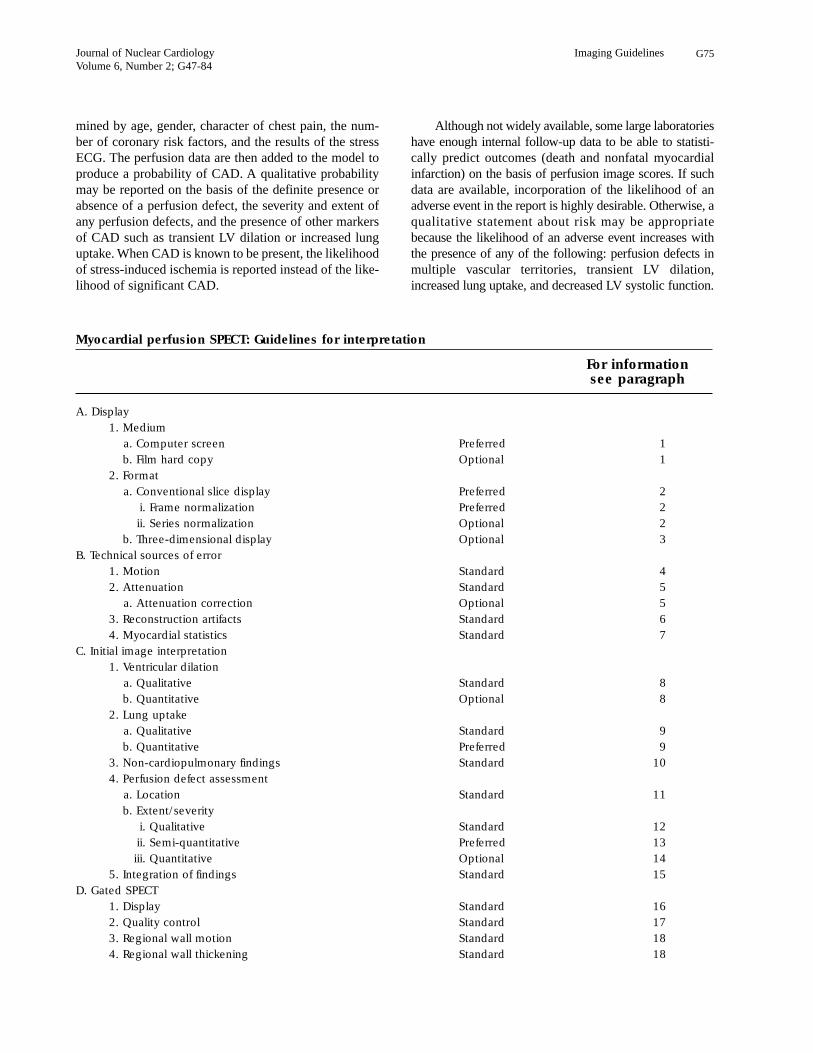
Journal of Nuclear CardiologyVolume 6, Number 2; G47-84
Imaging Guidelines G75
Myocardial perfusion SPECT: Guidelines for interpretation
For informationsee paragraph
A. Display
1. Medium
a. Computer screen Preferred 1
b. Film hard copy Optional 1
2. Format
a. Conventional slice display Preferred 2
i. Frame normalization Preferred 2
ii. Series normalization Optional 2
b. Three-dimensional display Optional 3
B. Technical sources of error
1. Motion Standard 4
2. Attenuation Standard 5
a. Attenuation correction Optional 5
3. Reconstruction artifacts Standard 6
4. Myocardial statistics Standard 7
C. Initial image interpretation
1. Ventricular dilation
a. Qualitative Standard 8
b. Quantitative Optional 8
2. Lung uptake
a. Qualitative Standard 9
b. Quantitative Preferred 9
3. Non-cardiopulmonary findings Standard 10
4. Perfusion defect assessment
a. Location Standard 11
b. Extent/severity
i. Qualitative Standard 12
ii. Semi-quantitative Preferred 13
iii. Quantitative Optional 14
5. Integration of findings Standard 15
D. Gated SPECT
1. Display Standard 16
2. Quality control Standard 17
3. Regional wall motion Standard 18
4. Regional wall thickening Standard 18
mined by age, gender, character of chest pain, the num-ber of coronary risk factors, and the results of the stressECG. The perfusion data are then added to the model toproduce a probability of CAD. A qualitative probabilitymay be reported on the basis of the definite presence orabsence of a perfusion defect, the severity and extent ofany perfusion defects, and the presence of other markersof CAD such as transient LV dilation or increased lunguptake. When CAD is known to be present, the likelihoodof stress-induced ischemia is reported instead of the like-lihood of significant CAD.
Although not widely available, some large laboratorieshave enough internal follow-up data to be able to statisti-cally predict outcomes (death and nonfatal myocardialinfarction) on the basis of perfusion image scores. If suchdata are available, incorporation of the likelihood of anadverse event in the report is highly desirable. Otherwise, aqualitative statement about risk may be appropriatebecause the likelihood of an adverse event increases withthe presence of any of the following: perfusion defects inmultiple vascular territories, transient LV dilation,increased lung uptake, and decreased LV systolic function.
G76 Journal of Nuclear CardiologyMarch/April 1999
Imaging Guidelines
A. Demographic data
1. Name Standard 26
2. Gender Standard 26
3. Age Standard 26
4. Date(s) of acquisition(s) Standard 26
5. Medical record identification Standard 26
6. Height/weight (BSA) Standard 26
7. Relevant medications Optional 26
8. Indication for study Standard 28
B. Acquisition parameters
1. Type(s) of studies Standard 27
2. Radionuclide(s) and doses Standard 27
C. Results: exercise/intervention data
1. Resting ECG findings Standard 29
2. Exercise/intervention parameters
a. HR, BP, %MPHR, METS Standard 30
b. Symptoms Standard 30
c. Reason for terminating Standard 30
d. ECG changes with exercise Standard 30
D. Results: perfusion scan data
1. Potential sources of error
a. Motion Standard 4
b. Attenuation Standard 5
c. Adjacent/overlapping uptake Standard 6
2. Chamber sizes Standard 8
3. Lung uptake (thallium)
a. Qualitative Standard 9
b. Quantitative Preferred 9
4. Initial defect location Standard 12
5. Initial defect severity and extent
a. Qualitative Standard 13
b. Semiquantitative Preferred 14
Myocardial perfusion SPECT: Guideline for reporting
For informationsee paragraph
Myocardial perfusion SPECT: Guidelines for interpretation–con’t
For informationsee paragraph
5. LV Ejection fraction
a. Qualitative Standard 19
b. Quantitative Optional 19
6. LV Volume
a. Qualitative Standard 19
b. Quantitative Optional 19
E. Integration of perfusion and function results Standard 20
F. Myocardial viability
1. Qualitative Standard 21
2. Semi-quantitative Optional 22
3. Quantitative Preferred 23
G. Modification of interpretation Preferred 24
Journal of Nuclear CardiologyVolume 6, Number 2; G47-84
Imaging Guidelines G77
PLANAR MYOCARDIAL PERFUSIONIMAGING: GUIDELINES FOR INTERPRETATION
AND REPORTING
Comments
Although largely supplanted by advanced tomo-graphic techniques, planar myocardial perfusion imagingremains a practical and acceptable alternative where lowinitial cost, in-hospital portability, and mobile off-sitecapability are paramount. Planar imaging remains animportant option in patients who cannot tolerate SPECTimaging or in whom SPECT imaging cannot be per-formed for any reason.
Myocardial perfusion studies should be acquired andinterpreted in accordance with clearly defined clinicalobjectives. Is the planar perfusion study being performedfor detection of CAD, assessment of the magnitude ofischemia or infarction, detection of the “culprit” lesion,detection of myocardial viability, or risk stratification?
Image interpretation should be rendered with a fullknowledge of the imaging protocol used. Specifically, theinterpreting physician should be aware of the perfusionagent used (eg, Tl-201, Tc-99m, sestamibi, or tetrofos-min), and the specific myocardial kinetics of the agent.Stress perfusion studies should be interpreted withknowledge of the stress modality (treadmill or bicycle
exercise, adenosine, dipyridamole, or dobutamine). Ifresting imaging is used, was the injection performed dur-ing chest pain? Interpretation of the study is criticallydependent on knowledge of the specific imagingsequence (1- or 2-day, stress-rest, rest-stress, rest-redis-tribution), and acquisition parameters (imaging time,projections used, collimation, count statistics). Imagesshould be assessed initially for technical adequacy,including target-to-background activity, splanchnic traceruptake, count adequacy in the cardiac ROI, adequacy ofcount normalization and masking, appropriate orienta-tion of the planar projections, and registration of thestress and delay (Tl-201) or stress and rest (Tc-99magents) planar projections.
Display
1. Recommended Medium. Planar perfusionimages may be displayed by use of the computer screen,x-ray film, or paper copy. The use of the computer screenis strongly recommended and is the preferred medium.Counts should preferably be represented by a linear grayscale. If a color table is used, the scale should be simul-taneously displayed on-screen. The adequacy of the dis-play medium should be established by inspection of astandard test pattern, which provides testing of both res-olution and gray scale.
c. Quantitative Optional 15
6. Reversibility
a. Qualitative Standard 16
b. Semiquantitative Preferred 17
c. Quantitative Optional 18
7. RV uptake Standard 10
8. Abnormal noncardiac uptake Standard 11
E. Results: gated SPECT
1. Regional wall motion Standard 19
2. Regional wall thickening Standard 19
3. Ejection fraction
a. Qualitative Standard 20
b. Quantitative Optional 20
4. LV volume Optional 20
F. Overall study quality Optional 31
G. Conclusion
1. Normal/abnormal
a. Three categories Standard 16
b. Five categories Preferred 16
2. Probability of CAD Optional 32
3. Estimated risk of adverse events Optional 32
Myocardial perfusion SPECT: Guideline for reporting–con’t
For informationsee paragraph
G78 Journal of Nuclear CardiologyMarch/April 1999
Imaging Guidelines
2. Conventional Format for Display. The initialset of images is typically displayed together with the sub-sequent set of images aligned adjacent to or underneathit. The interpreting physician should confirm that theimaging angles have not changed between image sets.Images are typically normalized to themselves. Planarimages should be interpreted without any processing.Background subtracted images may be generated forquantitative analysis but should not be interpreted with-out viewing the unsubtracted images as well.
Evaluation for Technical Sources of Artifacts
3. Attenuation. The images should then be carefullyinspected for potential image artifacts, the most common ofwhich is attenuation. Suspected soft tissue attenuation shouldbe thoroughly evaluated and its effect on the interpretationcarefully considered. The use of breast marker images (seeImaging Guidelines for Nuclear Cardiology Procedures, Part1 [J Nucl Cardiol 1996;3:G1-G46]) may be helpful in distin-guishing true perfusion defects from breast attenuation.Attenuation of the inferior wall by the diaphragm or anenlarged right ventricle should also be considered. Othersources of attenuation (eg, pleural effusions or infiltrates, for-eign objects, other soft tissues) should be noted.
4. Noncardiac Activity. Adjacent subdiaphragmat-ic activity, as is frequently seen in liver and bowel, maycreate overlap artifacts that spuriously increase the activ-ity in the inferior wall, creating the appearance of a rela-tive paucity of counts in other myocardial segments.Intense noncardiac activity may cause scaling artifacts inthe myocardial images. Techniques for masking suchnoncardiac activity are available.
5. Myocardial Statistics. Count-poor studies aresubject to misinterpretation. Apparent perfusion abnor-malities may resolve when a statistically adequate studyis available. The factors leading to suboptimal count sta-tistics include body habitus, radionuclide dose, collima-tion, window, acquisition time, and the level of myocar-dial blood flow.
6. Motion. Patient motion is rarely a problembecause of the short duration of imaging.
Initial Image Analysis and Interpretation
The initial interpretation of the perfusion scan shouldbe performed without any clinical information other thanthe patient’s gender, height and weight, and presence ofLBBB. That approach minimizes the bias in study inter-pretation. All relevant clinical information should bereviewed after a preliminary impression is formed.
7. Ventricular Dilation. Before segmental analysisof myocardial perfusion, the reader should note whetherthere is LV cavity dilation at rest or during exercise or
pharmacologic challenge. Dilation on both the stress andresting studies suggests LV dysfunction but may occur involume overload states with normal ventricular function.Transient ischemic dilation is a marker for multivesselcoronary artery disease. It is typically described qualita-tively but may be quantified.
8. Lung Uptake. The presence of increased lunguptake should be noted by comparison of the pulmonaryto myocardial counts. This is especially important whenimaging with Tl-201. Although qualitative assessment isstandard, calculation of lung-to-heart ratios is preferred.Lung uptake may be increased on stress images if theexercise was submaximal. Lung uptake during dipyri-damole and adenosine imaging tends to be higher thanthat seen during adequate exercise. Both the likelihood ofCAD and the risk of an adverse outcome are increasedwhen lung uptake is increased.
9. Right Ventricular Uptake. RV intensity is nor-mally about 50% of the peak LV intensity. Increasedright ventricular uptake is indicative of RV overload,most typically because of pulmonary hypertension. RVintensity may also appear increased when LV uptake isglobally reduced.
10. Noncardiopulmonary Uptake. The imagesshould be examined for the presence of activity in organsother than the heart and pulmonary vasculature. Thyroiduptake, breast uptake, pulmonary parenchymal (tumor)uptake, or uptake in other thoracic or upper abdominalstructures should be noted. Hepatic or splenic enlarge-ment and the apparent absence of a gallbladder on tech-netium studies may be of clinical significance.
Segmental Perfusion Assessment
11. Perfusion Defect Location. The detection andlocalization of perfusion defects is typically performed byuse of visual analysis of the unprocessed images.Perfusion defects are assigned to a particular myocardialsegment or segments. Standardized nomenclature is rec-ommended (Figure 6). In the anterior planar image, theanterolateral and inferior walls are divided into basal (1,5),and mid (2,4) segments, and the apex (3) separates theinferior and anterolateral walls. In the LAO view, the sep-tum is divided into anteroseptal (6) and inferoseptal (7)segments, whereas the lateral wall is divided into infero-lateral (9) and anterolateral (10) segments, and the inferiorsegment (8) separates the septum from the lateral wall. Inthe lateral view, the anterior and inferior walls are dividedinto basal (11,15) and mid (12,14) segments, whereas theapex (13) separates the anterior and inferior walls.
12. Perfusion Defect Severity and Extent:
Qualitative. Perfusion defect severity is typicallyexpressed qualitatively with terms such as mild, moderate,or severe. Severe defects are those minimal to absent trac-
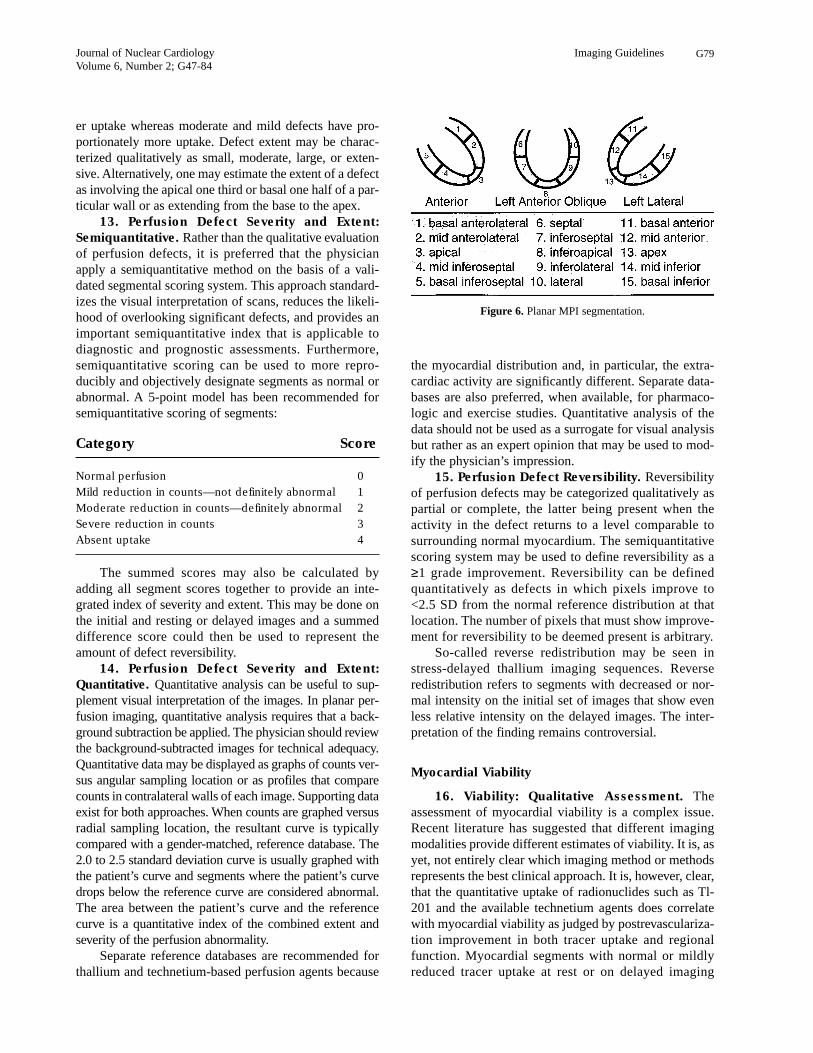
Journal of Nuclear CardiologyVolume 6, Number 2; G47-84
Imaging Guidelines G79
er uptake whereas moderate and mild defects have pro-portionately more uptake. Defect extent may be charac-terized qualitatively as small, moderate, large, or exten-sive. Alternatively, one may estimate the extent of a defectas involving the apical one third or basal one half of a par-ticular wall or as extending from the base to the apex.
13. Perfusion Defect Severity and Extent:
Semiquantitative. Rather than the qualitative evaluationof perfusion defects, it is preferred that the physicianapply a semiquantitative method on the basis of a vali-dated segmental scoring system. This approach standard-izes the visual interpretation of scans, reduces the likeli-hood of overlooking significant defects, and provides animportant semiquantitative index that is applicable todiagnostic and prognostic assessments. Furthermore,semiquantitative scoring can be used to more repro-ducibly and objectively designate segments as normal orabnormal. A 5-point model has been recommended forsemiquantitative scoring of segments:
Category Score
Normal perfusion 0
Mild reduction in counts—not definitely abnormal 1
Moderate reduction in counts—definitely abnormal 2
Severe reduction in counts 3
Absent uptake 4
The summed scores may also be calculated byadding all segment scores together to provide an inte-grated index of severity and extent. This may be done onthe initial and resting or delayed images and a summeddifference score could then be used to represent theamount of defect reversibility.
14. Perfusion Defect Severity and Extent:
Quantitative. Quantitative analysis can be useful to sup-plement visual interpretation of the images. In planar per-fusion imaging, quantitative analysis requires that a back-ground subtraction be applied. The physician should reviewthe background-subtracted images for technical adequacy.Quantitative data may be displayed as graphs of counts ver-sus angular sampling location or as profiles that comparecounts in contralateral walls of each image. Supporting dataexist for both approaches. When counts are graphed versusradial sampling location, the resultant curve is typicallycompared with a gender-matched, reference database. The2.0 to 2.5 standard deviation curve is usually graphed withthe patient’s curve and segments where the patient’s curvedrops below the reference curve are considered abnormal.The area between the patient’s curve and the referencecurve is a quantitative index of the combined extent andseverity of the perfusion abnormality.
Separate reference databases are recommended forthallium and technetium-based perfusion agents because
the myocardial distribution and, in particular, the extra-cardiac activity are significantly different. Separate data-bases are also preferred, when available, for pharmaco-logic and exercise studies. Quantitative analysis of thedata should not be used as a surrogate for visual analysisbut rather as an expert opinion that may be used to mod-ify the physician’s impression.
15. Perfusion Defect Reversibility. Reversibilityof perfusion defects may be categorized qualitatively aspartial or complete, the latter being present when theactivity in the defect returns to a level comparable tosurrounding normal myocardium. The semiquantitativescoring system may be used to define reversibility as a≥1 grade improvement. Reversibility can be definedquantitatively as defects in which pixels improve to<2.5 SD from the normal reference distribution at thatlocation. The number of pixels that must show improve-ment for reversibility to be deemed present is arbitrary.
So-called reverse redistribution may be seen instress-delayed thallium imaging sequences. Reverseredistribution refers to segments with decreased or nor-mal intensity on the initial set of images that show evenless relative intensity on the delayed images. The inter-pretation of the finding remains controversial.
Myocardial Viability
16. Viability: Qualitative Assessment. Theassessment of myocardial viability is a complex issue.Recent literature has suggested that different imagingmodalities provide different estimates of viability. It is, asyet, not entirely clear which imaging method or methodsrepresents the best clinical approach. It is, however, clear,that the quantitative uptake of radionuclides such as Tl-201 and the available technetium agents does correlatewith myocardial viability as judged by postrevasculariza-tion improvement in both tracer uptake and regionalfunction. Myocardial segments with normal or mildlyreduced tracer uptake at rest or on delayed imaging
Figure 6. Planar MPI segmentation.
G80 Journal of Nuclear CardiologyMarch/April 1999
Imaging Guidelines
almost invariably prove to be viable. The majority ofmyocardial segments in which there is unequivocalimprovement of uptake on either redistribution or restingimages prove to be viable. The more difficult challengefor the single photon assessment of viability is in seg-ments with severely reduced tracer uptake. Because ofthe severely reduced uptake, simple visual assessment ofviability in such regions is difficult at best.
17. Myocardial Viability: Semiquantitative Assess-
ment. The semiquantitative scoring system describedabove may be used to assess viability as follows.Segments with rest, reinjection, or redistribution scores of0 (normal perfusion) or 1 (slight reduction in counts) areconsidered viable. Segments with rest, redistribution, orreinjection scores of 2 (moderately decreased perfusion)are consistent with a combination of viable and nonviablemyocardium, and segments with scores of 3 and 4 aregenerally nonviable. Segments with final scores of 4 mustbe considered nonviable. Segments with final scores of 3should be further characterized by use of a nitroglycerinprotocol or a different modality such as PET imaging orlow-dose dobutamine echocardiography.
18. Myocardial Viability: Quantitative Assess-
ment. An alternate and perhaps more rigorous approachto the assessment of the viability of any segment is thequantitative determination of ischemic to normal ratios.ROI may be placed over the segment in question and overthe most normal segment of the myocardium in that partic-ular series of images. The analysis should be applied to theresting images for technetium images or to the resting,redistribution, or reinjection images for thallium. Segmentswith ratios less than 0.30 are considered nonviable. Areaswith ratios greater than 0.50 are considered viable whereasareas with ratios of 0.30 to 0.50 are equivocal for viability.As indicated above for the semiquantitative approach, suchregions require additional data such as wall motion of theregion, exercise perfusion in the region, the change in per-fusion, or wall motion after nitroglycerin, the response ofregional function to low-dose dobutamine or myocardialmetabolic imaging with 18-fluorodeoxyglucose.
It is also important to recognize that viability of agiven segment does not necessarily equate to improvementin clinical outcome after revascularization unless there areenough segments that are viable. The critical number ofsegments necessary to justify revascularization strategieshas not been adequately studied. In fact, recent literaturesuggests that “thallium viability” may overestimate recov-ery of wall motion as judged by echocardiography.
19. Integration of Findings for Interpretation.
After segmental scoring or quantitative analysis is per-formed, the interpreting physician should take into accountthe correspondence of observed defects to standard coro-nary artery anatomy, the reversibility of observed defects,possible sources of artifact in the study, and whether the
location of the defects are in locations with highly variablecount statistics (eg, the anterior, anteroseptal, and anterolat-eral segments in women or the inferior segments in men).
Because not all studies can be unequivocally judgedto be normal or abnormal, it is recommended that the tra-ditional 3-tier system (normal, equivocal, abnormal) bereplaced with a 5-category system: definitely normal,probably normal, equivocal, probably abnormal, and def-initely abnormal. The 5-category system decreases thefrequency of studies judged to be equivocal. It alsoallows for a shift in the final interpretation after review ofthe clinical data and stress test results.
20. Final Study Interpretation. Once the physicianhas reached a preliminary unbiased interpretation on thebasis of the results of the image analysis, the clinical data,including the reason for the study, prior cardiovascular eventssuch as angina, myocardial infarction, percutaneous translu-minal coronary angioplasty, coronary artery bypass grafting,congestive heart failure, or LV dysfunction, the presence ofhypertension and the administration of medications thatmight influence the results should be reviewed. If a stress orpharmacologic study was performed, the pertinent resultsshould be reviewed. The physician may then modify the pre-liminary interpretation on the basis of that review to arrive ata final study interpretation. It is recommended that the initialinterpretation only be changed by one category (within the 5-category system) so that bias is not introduced.
Reporting of Planar Myocardial Perfusion
Scanning Results
21. Subject Information. The age, gender, height,weight, and preferably body surface area should beincluded in the report because they may directly affectthe image results and interpretation. For medical recordspurposes, any identification number should be included.
22. Type of Study. The imaging protocol should bespecified, including the radiopharmaceutical and dose,imaging technique (planar), projections used, imagingsequence (stress/4-hour redistribution, 1- or 2-day rest/stress or stress/rest, and use of gating.
23. Indication for Study. Placing the indication forthe study in the report helps focus the interpreting physicianon the clinical question raised by the ordering physician andmay be subsequently important for reimbursement issues.
24. Resting ECG Findings. Inclusion of ECG find-ings that may have direct bearing on the study interpretationshould be included, such as the presence of LBBB or LVH.
25. Summary of Stress Data. The type of stress(bicycle or treadmill) and the protocol should be identi-fied (Bruce, Modified Bruce, Naughton, manual). Forpharmacologic stress, the agent, route of administration,and maximum dose should be indicated. The reason forstopping the test should be noted. All symptoms experi-
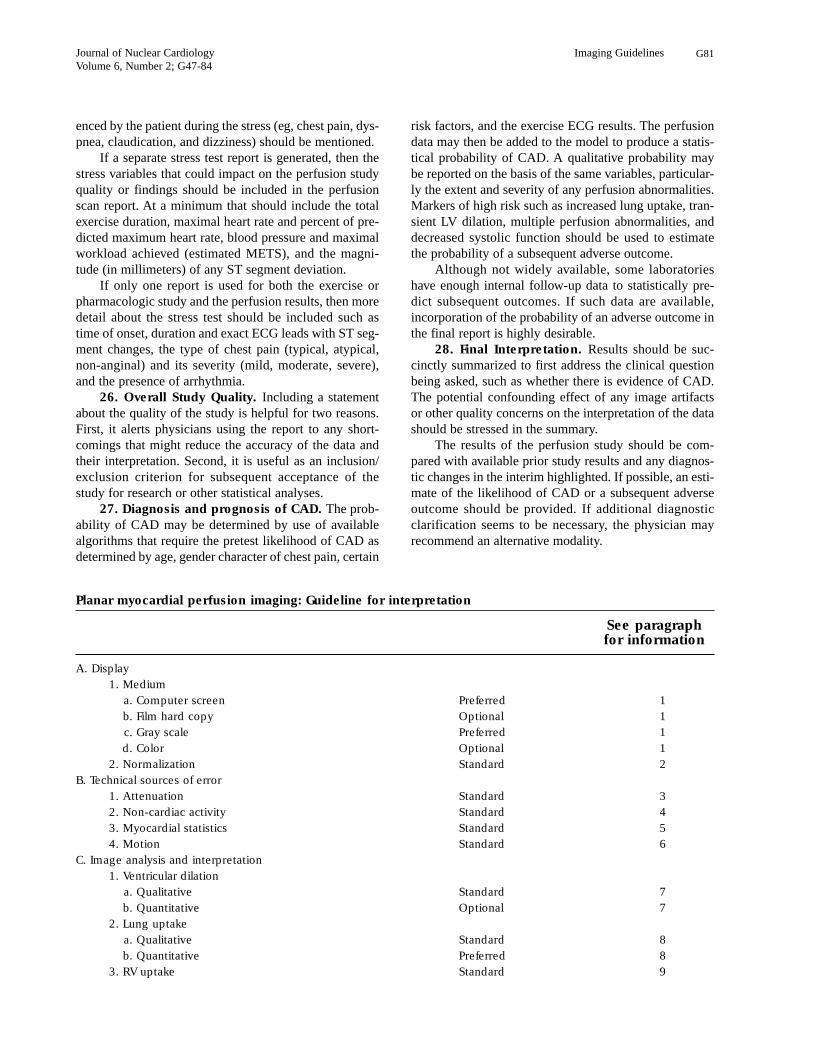
Journal of Nuclear CardiologyVolume 6, Number 2; G47-84
Imaging Guidelines G81
enced by the patient during the stress (eg, chest pain, dys-pnea, claudication, and dizziness) should be mentioned.
If a separate stress test report is generated, then thestress variables that could impact on the perfusion studyquality or findings should be included in the perfusionscan report. At a minimum that should include the totalexercise duration, maximal heart rate and percent of pre-dicted maximum heart rate, blood pressure and maximalworkload achieved (estimated METS), and the magni-tude (in millimeters) of any ST segment deviation.
If only one report is used for both the exercise orpharmacologic study and the perfusion results, then moredetail about the stress test should be included such astime of onset, duration and exact ECG leads with ST seg-ment changes, the type of chest pain (typical, atypical,non-anginal) and its severity (mild, moderate, severe),and the presence of arrhythmia.
26. Overall Study Quality. Including a statementabout the quality of the study is helpful for two reasons.First, it alerts physicians using the report to any short-comings that might reduce the accuracy of the data andtheir interpretation. Second, it is useful as an inclusion/exclusion criterion for subsequent acceptance of thestudy for research or other statistical analyses.
27. Diagnosis and prognosis of CAD. The prob-ability of CAD may be determined by use of availablealgorithms that require the pretest likelihood of CAD asdetermined by age, gender character of chest pain, certain
risk factors, and the exercise ECG results. The perfusiondata may then be added to the model to produce a statis-tical probability of CAD. A qualitative probability maybe reported on the basis of the same variables, particular-ly the extent and severity of any perfusion abnormalities.Markers of high risk such as increased lung uptake, tran-sient LV dilation, multiple perfusion abnormalities, anddecreased systolic function should be used to estimatethe probability of a subsequent adverse outcome.
Although not widely available, some laboratorieshave enough internal follow-up data to statistically pre-dict subsequent outcomes. If such data are available,incorporation of the probability of an adverse outcome inthe final report is highly desirable.
28. Final Interpretation. Results should be suc-cinctly summarized to first address the clinical questionbeing asked, such as whether there is evidence of CAD.The potential confounding effect of any image artifactsor other quality concerns on the interpretation of the datashould be stressed in the summary.
The results of the perfusion study should be com-pared with available prior study results and any diagnos-tic changes in the interim highlighted. If possible, an esti-mate of the likelihood of CAD or a subsequent adverseoutcome should be provided. If additional diagnosticclarification seems to be necessary, the physician mayrecommend an alternative modality.
A. Display
1. Medium
a. Computer screen Preferred 1
b. Film hard copy Optional 1
c. Gray scale Preferred 1
d. Color Optional 1
2. Normalization Standard 2
B. Technical sources of error
1. Attenuation Standard 3
2. Non-cardiac activity Standard 4
3. Myocardial statistics Standard 5
4. Motion Standard 6
C. Image analysis and interpretation
1. Ventricular dilation
a. Qualitative Standard 7
b. Quantitative Optional 7
2. Lung uptake
a. Qualitative Standard 8
b. Quantitative Preferred 8
3. RV uptake Standard 9
Planar myocardial perfusion imaging: Guideline for interpretation
See paragraphfor information
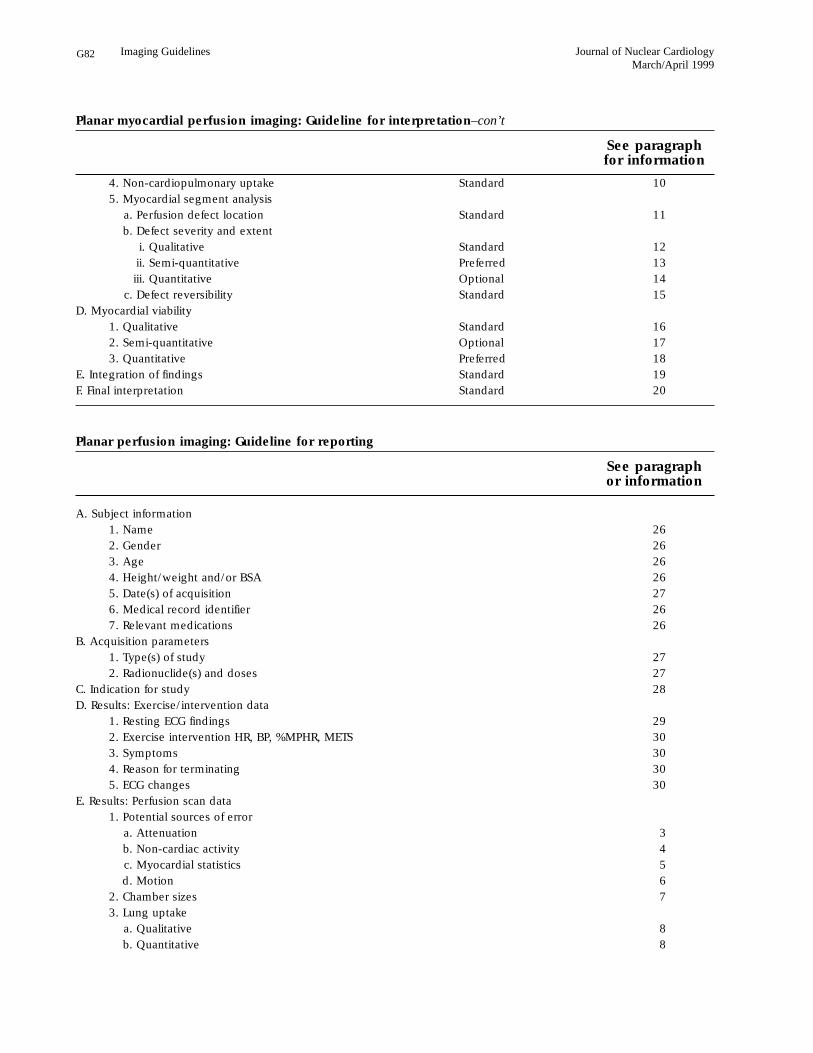
G82 Journal of Nuclear CardiologyMarch/April 1999
Imaging Guidelines
Planar perfusion imaging: Guideline for reporting
See paragraphor information
A. Subject information
1. Name 26
2. Gender 26
3. Age 26
4. Height/weight and/or BSA 26
5. Date(s) of acquisition 27
6. Medical record identifier 26
7. Relevant medications 26
B. Acquisition parameters
1. Type(s) of study 27
2. Radionuclide(s) and doses 27
C. Indication for study 28
D. Results: Exercise/intervention data
1. Resting ECG findings 29
2. Exercise intervention HR, BP, %MPHR, METS 30
3. Symptoms 30
4. Reason for terminating 30
5. ECG changes 30
E. Results: Perfusion scan data
1. Potential sources of error
a. Attenuation 3
b. Non-cardiac activity 4
c. Myocardial statistics 5
d. Motion 6
2. Chamber sizes 7
3. Lung uptake
a. Qualitative 8
b. Quantitative 8
Planar myocardial perfusion imaging: Guideline for interpretation–con’t
See paragraphfor information
4. Non-cardiopulmonary uptake Standard 10
5. Myocardial segment analysis
a. Perfusion defect location Standard 11
b. Defect severity and extent
i. Qualitative Standard 12
ii. Semi-quantitative Preferred 13
iii. Quantitative Optional 14
c. Defect reversibility Standard 15
D. Myocardial viability
1. Qualitative Standard 16
2. Semi-quantitative Optional 17
3. Quantitative Preferred 18
E. Integration of findings Standard 19
F. Final interpretation Standard 20
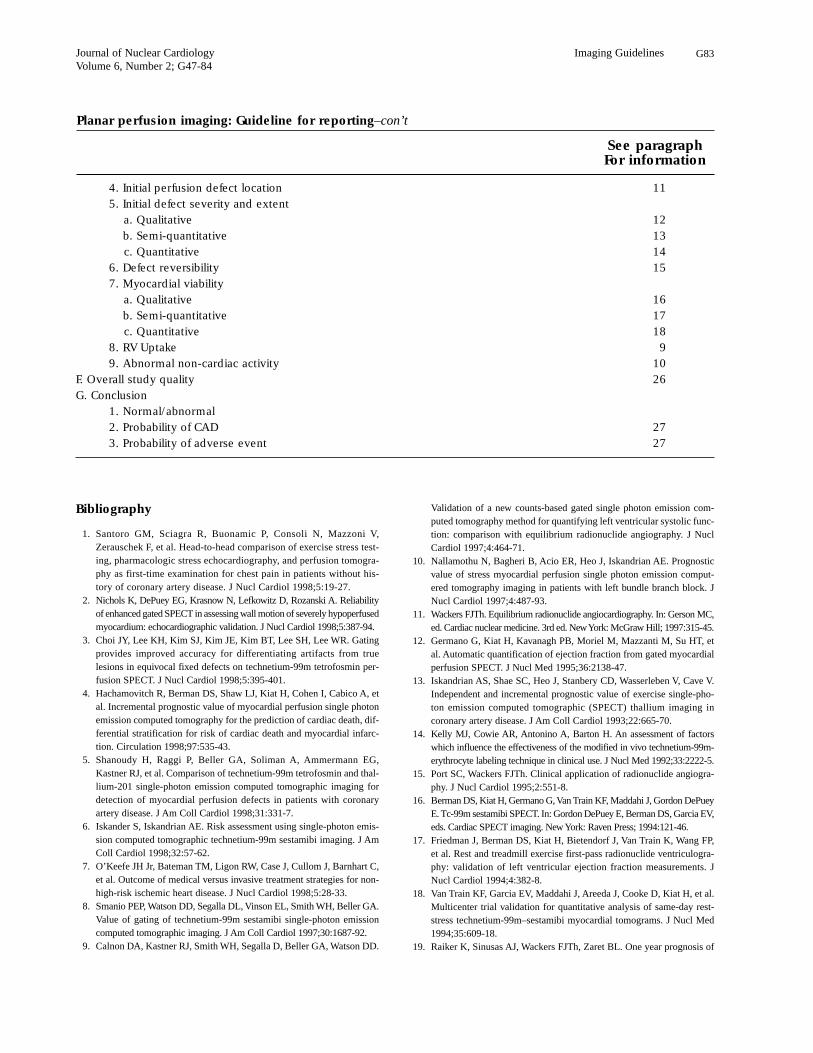
Journal of Nuclear CardiologyVolume 6, Number 2; G47-84
Imaging Guidelines G83
Bibliography
1. Santoro GM, Sciagra R, Buonamic P, Consoli N, Mazzoni V,Zerauschek F, et al. Head-to-head comparison of exercise stress test-ing, pharmacologic stress echocardiography, and perfusion tomogra-phy as first-time examination for chest pain in patients without his-tory of coronary artery disease. J Nucl Cardiol 1998;5:19-27.
2. Nichols K, DePuey EG, Krasnow N, Lefkowitz D, Rozanski A. Reliabilityof enhanced gated SPECT in assessing wall motion of severely hypoperfusedmyocardium: echocardiographic validation. J Nucl Cardiol 1998;5:387-94.
3. Choi JY, Lee KH, Kim SJ, Kim JE, Kim BT, Lee SH, Lee WR. Gatingprovides improved accuracy for differentiating artifacts from truelesions in equivocal fixed defects on technetium-99m tetrofosmin per-fusion SPECT. J Nucl Cardiol 1998;5:395-401.
4. Hachamovitch R, Berman DS, Shaw LJ, Kiat H, Cohen I, Cabico A, etal. Incremental prognostic value of myocardial perfusion single photonemission computed tomography for the prediction of cardiac death, dif-ferential stratification for risk of cardiac death and myocardial infarc-tion. Circulation 1998;97:535-43.
5. Shanoudy H, Raggi P, Beller GA, Soliman A, Ammermann EG,Kastner RJ, et al. Comparison of technetium-99m tetrofosmin and thal-lium-201 single-photon emission computed tomographic imaging fordetection of myocardial perfusion defects in patients with coronaryartery disease. J Am Coll Cardiol 1998;31:331-7.
6. Iskander S, Iskandrian AE. Risk assessment using single-photon emis-sion computed tomographic technetium-99m sestamibi imaging. J AmColl Cardiol 1998;32:57-62.
7. O’Keefe JH Jr, Bateman TM, Ligon RW, Case J, Cullom J, Barnhart C,et al. Outcome of medical versus invasive treatment strategies for non-high-risk ischemic heart disease. J Nucl Cardiol 1998;5:28-33.
8. Smanio PEP, Watson DD, Segalla DL, Vinson EL, Smith WH, Beller GA.Value of gating of technetium-99m sestamibi single-photon emissioncomputed tomographic imaging. J Am Coll Cardiol 1997;30:1687-92.
9. Calnon DA, Kastner RJ, Smith WH, Segalla D, Beller GA, Watson DD.
Validation of a new counts-based gated single photon emission com-puted tomography method for quantifying left ventricular systolic func-tion: comparison with equilibrium radionuclide angiography. J NuclCardiol 1997;4:464-71.
10. Nallamothu N, Bagheri B, Acio ER, Heo J, Iskandrian AE. Prognosticvalue of stress myocardial perfusion single photon emission comput-ered tomography imaging in patients with left bundle branch block. JNucl Cardiol 1997;4:487-93.
11. Wackers FJTh. Equilibrium radionuclide angiocardiography. In: Gerson MC,ed. Cardiac nuclear medicine. 3rd ed. New York: McGraw Hill; 1997:315-45.
12. Germano G, Kiat H, Kavanagh PB, Moriel M, Mazzanti M, Su HT, etal. Automatic quantification of ejection fraction from gated myocardialperfusion SPECT. J Nucl Med 1995;36:2138-47.
13. Iskandrian AS, Shae SC, Heo J, Stanbery CD, Wasserleben V, Cave V.Independent and incremental prognostic value of exercise single-pho-ton emission computed tomographic (SPECT) thallium imaging incoronary artery disease. J Am Coll Cardiol 1993;22:665-70.
14. Kelly MJ, Cowie AR, Antonino A, Barton H. An assessment of factorswhich influence the effectiveness of the modified in vivo technetium-99m-erythrocyte labeling technique in clinical use. J Nucl Med 1992;33:2222-5.
15. Port SC, Wackers FJTh. Clinical application of radionuclide angiogra-phy. J Nucl Cardiol 1995;2:551-8.
16. Berman DS, Kiat H, Germano G, Van Train KF, Maddahi J, Gordon DePueyE. Tc-99m sestamibi SPECT. In: Gordon DePuey E, Berman DS, Garcia EV,eds. Cardiac SPECT imaging. New York: Raven Press; 1994:121-46.
17. Friedman J, Berman DS, Kiat H, Bietendorf J, Van Train K, Wang FP,et al. Rest and treadmill exercise first-pass radionuclide ventriculogra-phy: validation of left ventricular ejection fraction measurements. JNucl Cardiol 1994;4:382-8.
18. Van Train KF, Garcia EV, Maddahi J, Areeda J, Cooke D, Kiat H, et al.Multicenter trial validation for quantitative analysis of same-day rest-stress technetium-99m–sestamibi myocardial tomograms. J Nucl Med1994;35:609-18.
19. Raiker K, Sinusas AJ, Wackers FJTh, Zaret BL. One year prognosis of
4. Initial perfusion defect location 11
5. Initial defect severity and extent
a. Qualitative 12
b. Semi-quantitative 13
c. Quantitative 14
6. Defect reversibility 15
7. Myocardial viability
a. Qualitative 16
b. Semi-quantitative 17
c. Quantitative 18
8. RV Uptake 9
9. Abnormal non-cardiac activity 10
F. Overall study quality 26
G. Conclusion
1. Normal/abnormal
2. Probability of CAD 27
3. Probability of adverse event 27
Planar perfusion imaging: Guideline for reporting–con’t
See paragraphFor information
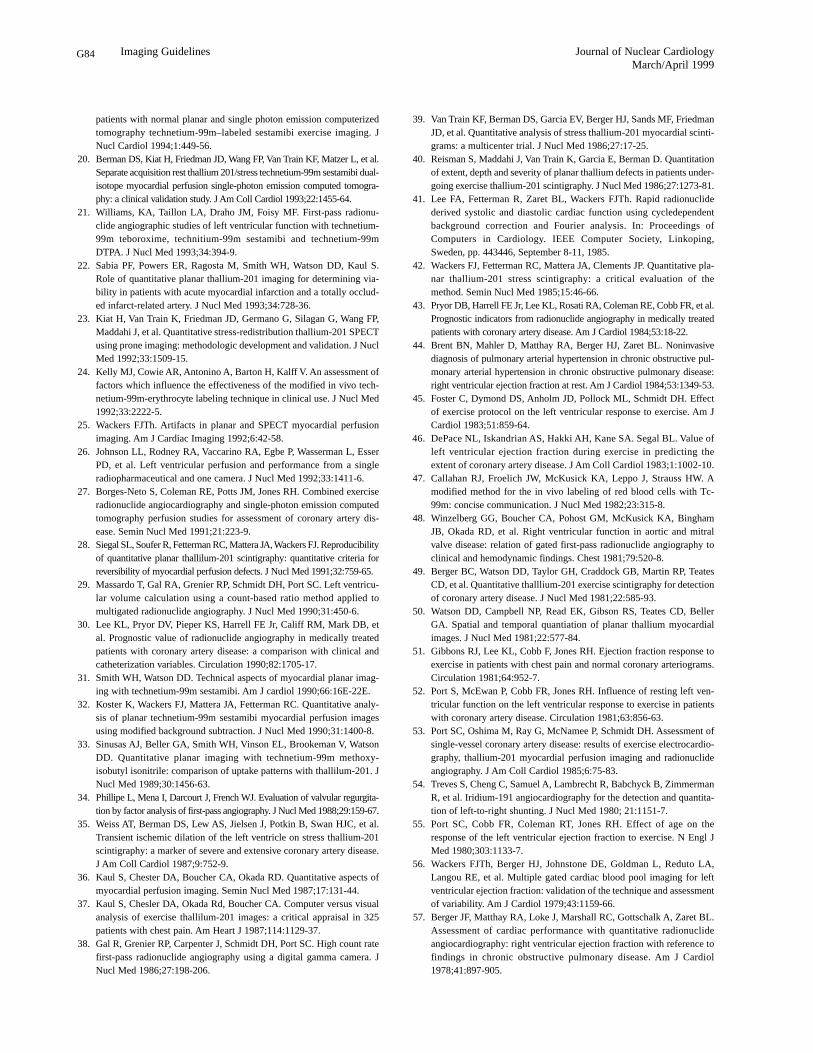
G84 Journal of Nuclear CardiologyMarch/April 1999
Imaging Guidelines
patients with normal planar and single photon emission computerizedtomography technetium-99m–labeled sestamibi exercise imaging. JNucl Cardiol 1994;1:449-56.
20. Berman DS, Kiat H, Friedman JD, Wang FP, Van Train KF, Matzer L, et al.Separate acquisition rest thallium 201/stress technetium-99m sestamibi dual-isotope myocardial perfusion single-photon emission computed tomogra-phy: a clinical validation study. J Am Coll Cardiol 1993;22:1455-64.
21. Williams, KA, Taillon LA, Draho JM, Foisy MF. First-pass radionu-clide angiographic studies of left ventricular function with technetium-99m teboroxime, technitium-99m sestamibi and technetium-99mDTPA. J Nucl Med 1993;34:394-9.
22. Sabia PF, Powers ER, Ragosta M, Smith WH, Watson DD, Kaul S.Role of quantitative planar thallium-201 imaging for determining via-bility in patients with acute myocardial infarction and a totally occlud-ed infarct-related artery. J Nucl Med 1993;34:728-36.
23. Kiat H, Van Train K, Friedman JD, Germano G, Silagan G, Wang FP,Maddahi J, et al. Quantitative stress-redistribution thallium-201 SPECTusing prone imaging: methodologic development and validation. J NuclMed 1992;33:1509-15.
24. Kelly MJ, Cowie AR, Antonino A, Barton H, Kalff V. An assessment offactors which influence the effectiveness of the modified in vivo tech-netium-99m-erythrocyte labeling technique in clinical use. J Nucl Med1992;33:2222-5.
25. Wackers FJTh. Artifacts in planar and SPECT myocardial perfusionimaging. Am J Cardiac Imaging 1992;6:42-58.
26. Johnson LL, Rodney RA, Vaccarino RA, Egbe P, Wasserman L, EsserPD, et al. Left ventricular perfusion and performance from a singleradiopharmaceutical and one camera. J Nucl Med 1992;33:1411-6.
27. Borges-Neto S, Coleman RE, Potts JM, Jones RH. Combined exerciseradionuclide angiocardiography and single-photon emission computedtomography perfusion studies for assessment of coronary artery dis-ease. Semin Nucl Med 1991;21:223-9.
28. Siegal SL, Soufer R, Fetterman RC, Mattera JA, Wackers FJ. Reproducibilityof quantitative planar thallilum-201 scintigraphy: quantitative criteria forreversibility of myocardial perfusion defects. J Nucl Med 1991;32:759-65.
29. Massardo T, Gal RA, Grenier RP, Schmidt DH, Port SC. Left ventricu-lar volume calculation using a count-based ratio method applied tomultigated radionuclide angiography. J Nucl Med 1990;31:450-6.
30. Lee KL, Pryor DV, Pieper KS, Harrell FE Jr, Califf RM, Mark DB, etal. Prognostic value of radionuclide angiography in medically treatedpatients with coronary artery disease: a comparison with clinical andcatheterization variables. Circulation 1990;82:1705-17.
31. Smith WH, Watson DD. Technical aspects of myocardial planar imag-ing with technetium-99m sestamibi. Am J cardiol 1990;66:16E-22E.
32. Koster K, Wackers FJ, Mattera JA, Fetterman RC. Quantitative analy-sis of planar technetium-99m sestamibi myocardial perfusion imagesusing modified background subtraction. J Nucl Med 1990;31:1400-8.
33. Sinusas AJ, Beller GA, Smith WH, Vinson EL, Brookeman V, WatsonDD. Quantitative planar imaging with technetium-99m methoxy-isobutyl isonitrile: comparison of uptake patterns with thallilum-201. JNucl Med 1989;30:1456-63.
34. Phillipe L, Mena I, Darcourt J, French WJ. Evaluation of valvular regurgita-tion by factor analysis of first-pass angiography. J Nucl Med 1988;29:159-67.
35. Weiss AT, Berman DS, Lew AS, Jielsen J, Potkin B, Swan HJC, et al.Transient ischemic dilation of the left ventricle on stress thallium-201scintigraphy: a marker of severe and extensive coronary artery disease.J Am Coll Cardiol 1987;9:752-9.
36. Kaul S, Chester DA, Boucher CA, Okada RD. Quantitative aspects ofmyocardial perfusion imaging. Semin Nucl Med 1987;17:131-44.
37. Kaul S, Chesler DA, Okada Rd, Boucher CA. Computer versus visualanalysis of exercise thallilum-201 images: a critical appraisal in 325patients with chest pain. Am Heart J 1987;114:1129-37.
38. Gal R, Grenier RP, Carpenter J, Schmidt DH, Port SC. High count ratefirst-pass radionuclide angiography using a digital gamma camera. JNucl Med 1986;27:198-206.
39. Van Train KF, Berman DS, Garcia EV, Berger HJ, Sands MF, FriedmanJD, et al. Quantitative analysis of stress thallium-201 myocardial scinti-grams: a multicenter trial. J Nucl Med 1986;27:17-25.
40. Reisman S, Maddahi J, Van Train K, Garcia E, Berman D. Quantitationof extent, depth and severity of planar thallium defects in patients under-going exercise thallium-201 scintigraphy. J Nucl Med 1986;27:1273-81.
41. Lee FA, Fetterman R, Zaret BL, Wackers FJTh. Rapid radionuclidederived systolic and diastolic cardiac function using cycledependentbackground correction and Fourier analysis. In: Proceedings ofComputers in Cardiology. IEEE Computer Society, Linkoping,Sweden, pp. 443446, September 8-11, 1985.
42. Wackers FJ, Fetterman RC, Mattera JA, Clements JP. Quantitative pla-nar thallium-201 stress scintigraphy: a critical evaluation of themethod. Semin Nucl Med 1985;15:46-66.
43. Pryor DB, Harrell FE Jr, Lee KL, Rosati RA, Coleman RE, Cobb FR, et al.Prognostic indicators from radionuclide angiography in medically treatedpatients with coronary artery disease. Am J Cardiol 1984;53:18-22.
44. Brent BN, Mahler D, Matthay RA, Berger HJ, Zaret BL. Noninvasivediagnosis of pulmonary arterial hypertension in chronic obstructive pul-monary arterial hypertension in chronic obstructive pulmonary disease:right ventricular ejection fraction at rest. Am J Cardiol 1984;53:1349-53.
45. Foster C, Dymond DS, Anholm JD, Pollock ML, Schmidt DH. Effectof exercise protocol on the left ventricular response to exercise. Am JCardiol 1983;51:859-64.
46. DePace NL, Iskandrian AS, Hakki AH, Kane SA. Segal BL. Value ofleft ventricular ejection fraction during exercise in predicting theextent of coronary artery disease. J Am Coll Cardiol 1983;1:1002-10.
47. Callahan RJ, Froelich JW, McKusick KA, Leppo J, Strauss HW. Amodified method for the in vivo labeling of red blood cells with Tc-99m: concise communication. J Nucl Med 1982;23:315-8.
48. Winzelberg GG, Boucher CA, Pohost GM, McKusick KA, BinghamJB, Okada RD, et al. Right ventricular function in aortic and mitralvalve disease: relation of gated first-pass radionuclide angiography toclinical and hemodynamic findings. Chest 1981;79:520-8.
49. Berger BC, Watson DD, Taylor GH, Craddock GB, Martin RP, TeatesCD, et al. Quantitative thalllium-201 exercise scintigraphy for detectionof coronary artery disease. J Nucl Med 1981;22:585-93.
50. Watson DD, Campbell NP, Read EK, Gibson RS, Teates CD, BellerGA. Spatial and temporal quantiation of planar thallium myocardialimages. J Nucl Med 1981;22:577-84.
51. Gibbons RJ, Lee KL, Cobb F, Jones RH. Ejection fraction response toexercise in patients with chest pain and normal coronary arteriograms.Circulation 1981;64:952-7.
52. Port S, McEwan P, Cobb FR, Jones RH. Influence of resting left ven-tricular function on the left ventricular response to exercise in patientswith coronary artery disease. Circulation 1981;63:856-63.
53. Port SC, Oshima M, Ray G, McNamee P, Schmidt DH. Assessment ofsingle-vessel coronary artery disease: results of exercise electrocardio-graphy, thallium-201 myocardial perfusion imaging and radionuclideangiography. J Am Coll Cardiol 1985;6:75-83.
54. Treves S, Cheng C, Samuel A, Lambrecht R, Babchyck B, ZimmermanR, et al. Iridium-191 angiocardiography for the detection and quantita-tion of left-to-right shunting. J Nucl Med 1980; 21:1151-7.
55. Port SC, Cobb FR, Coleman RT, Jones RH. Effect of age on theresponse of the left ventricular ejection fraction to exercise. N Engl JMed 1980;303:1133-7.
56. Wackers FJTh, Berger HJ, Johnstone DE, Goldman L, Reduto LA,Langou RE, et al. Multiple gated cardiac blood pool imaging for leftventricular ejection fraction: validation of the technique and assessmentof variability. Am J Cardiol 1979;43:1159-66.
57. Berger JF, Matthay RA, Loke J, Marshall RC, Gottschalk A, Zaret BL.Assessment of cardiac performance with quantitative radionuclideangiocardiography: right ventricular ejection fraction with reference tofindings in chronic obstructive pulmonary disease. Am J Cardiol1978;41:897-905.