Embed Size (px)
Citation preview

14 SPECTROSCOPY 16(9) SEPTEMBER 2001
Combinatorial chemistr y methodsuse a series of reaction steps withmultiple reagents for each step tocreate a collection of as many asseveral million compounds. The
ability to create such chemical diversityis inspiring enthusiasm for novel drug
discovery strategies in the pharmaceuti-cal industry. For libraries of this size, thesyntheses are usually carried out eitheron functionalized silicon wafers or onpolystyrene spheres with diameters of20–500 mm. From a drug discovery pointof view, the idea is to massively bioassay
Nicholas Winograd and Robert M. BraunPenn State UniversityUniversity Park, PA
Speed is of the essence inscreening diverse libraries ofmolecules for drug efficacy.Spatially resolved time-of-flight mass spectrometrypotentially offers chemicalanalysis at the rate of 10compounds per second ormore and is amenable tomicroarray formats.
© I M A G I N G
Imaging Mass Spectrometry and Combinatorial Chemistry
Charge compensation
Laser
Laser beam
Stage voltage
Samplestage
Ion gun
Extractionoptics
Retard
Reflect
Liquid-metalion gun
Ga
Figure 1. Schematic diagram of a TOF-SIMS apparatus.
www.spec t roscopyo n l i n e . com

SEPTEMBER 2001 16(9) SPECTROSCOPY 15
the entire library. The active compoundsare then identified as leads after releasefrom the beads, and their structure maybe identified by spectroscopic means.
Mass spectrometry (MS) has becomean essential element in the repertoire oftools available for the characterization ofcombinatorial libraries. The strategiesrange from traditional mass spectral mea-surements on bulk solutions for struc-tural studies to identification of moleculesdelinked from a single polystyrene bead.Most types of MS, including matrix-assisted laser desorption ionization( MALDI ), electrospray, liquid chro-matography–MS (LC-MS), and Fouriertransform–infrared spectroscopy (1–5),have been brought to bear on the prob-lem. The popularity of these methodsstems in part from the chemical speci-ficity, sensitivity, and speed of MS.
Our laboratory has been exploring theuse of imaging time-of-flight secondaryion MS (TOF-SIMS) as a means to fur-ther extend the applicability of thesesorts of measurements (6). With this ap-proach, molecules are desorbed from asolid surface by a pulsed energetic ionbeam that is focused to a spot size of ,1mm in diameter. Our experiments haveshown so far that, with this probe, massspectral information can be ascertainedfrom molecules on a single bead providedthat the attachment bond is somehowcleaved before measurement. The mainadvantage of this scheme is that manyhundreds of beads can be assayed in asingle measurement by rastering theprobe beam across an array of targetspheres (7). At the present time, for ex-ample, we have obtained spectral infor-mation at the rate of ;10 beads/s usingmodel systems. At this rate, it wouldclearly be possible to completely charac-terize rather large combinatorial librariesof a million members or more in just afew days. An important reason why thesekinds of assays have not yet beenachieved is that molecular desorption byenergetic ion beams often leads to exten-sive fragmentation, thus complicatinganalysis (8). Moreover, all of the des-orbed molecules must originate from thesample surface, a disadvantage in dealingwith conventional polymeric solid sup-ports where much of the action occurs in-side the material.
Here, we evaluate the prospects for us-ing imaging TOF-SIMS to assay largenumbers of compounds on beads or othersupports in a short period of time. Our
evaluation begins with a description ofhow this type of MS differs from othertypes, and proceeds by showing exam-ples of several preliminary experimentson single beads. We also focus on thegoal of characterizing arrays of beads inparallel fashion so as to achieve the fullpotential of the combinatorial chemistryidea.
EXPERIMENTAL TECHNIQUESFigure 1 shows a schematic diagram ofan imaging TOF-SIMS spectrometer. De-tails are available elsewhere (9). Themass spectra are generated by ion bom-bardment using a pulsed liquid metal iongun (LMIG). These sources consist of asharp tungsten tip that is coated with liq-uid gallium. A field of 25 keV extracts
§I M A G I N G
Inte
nsity
Inte
nsity
100 200 300 400 500 600
2000
1500
1000
500
0
m/z
100 200 300 400 500 600
600
500
400
300
200
100
0
m/z
Inte
nsity
100 200 300 400 500 600
500
400
300
200
100
0
m/z
Figure 2. Molecule-specific imaging. These are two 200-mm polystyrene beads, each coveredwith a different peptide mimic with molecular weights 226 and 547 and placed on a siliconsubstrate. The top panel shows an image of all of the positive ions emitted from the field ofview and the mass spectrum associated with that image. The remaining panels show massspectra and images associated with the specific regions of space corresponding to the pres-ence of one bead or the other. From the spectra, it is obvious which species is associatedwith a specific bead. (Sample courtesy of D. Wagner and M. Geysen.)

16 SPECTROSCOPY 16(9) SEPTEMBER 2001 www.spec t roscopyo n l i n e . com
Ga+ or In+ ions from the tip. With appro-priate ion beam optics these ions may befocused onto the sample surface into aspot size of ,50 nm in diameter. Metallost at the tip is replenished by electrohy-drodynamic flow, and the beams will per-sist for ;1000 h of operation. Pulsing isachieved by using apertures and deflec-tion plates. By using fast electronicswitching, we can easily achieve pulsewidths of ,1 ns with a repetition rate of10,000 pulses/s. In addition to the LMIG-based probe’s small size, it also producesan extremely bright source of ions. Forour work, we had 1 nA of ion current fo-cused into a 100-nm spot, yielding a cur-
rent density of 10 A/cm2. It is also inter-esting to note that a 10-ns ion pulse con-tains 62 Ga+ ions and that ;104 moleculesper layer are exposed to the beam.
Once desorbed, the ionized moleculesare extracted into a reflecting mirrorTOF mass spectrometer, as shown in Fig-ure 1. The extraction voltage is 6 keV andthe TOF drift voltage of 2.5 keV is appliedover a distance of 3 m. Hence, the flighttime of an ion of m/z 800 is ;100 ms.These analyzers generally achieve quitehigh per formance. For example, thetransmission efficiency is on the order of50%, and the mass resolution exceeds onepart in 5000. Moreover, with appropriate
calibration, m/z can be determined to afew ppm accuracy, an important featurefor composition studies.
A limitation of this design involves thefield of view of the analyzer and the mag-nitude of the deflection of the ion beam.Because of the magnitude of the voltagesand the requisite scan speed, a 2 mm 32-mm raster pattern is the largest possi-ble scan area for a primary ion beam en-ergy of 25 keV. Moreover, the ions enter-ing the TOF analyzer must maintain theirtime coherence, so ions emitted from aregion larger than several square millime-ters will not reach the detector. Hence,molecule-specific images are restricted toan area of this size.
The instrumentation is equipped with alow-energy electron gun (not shown inFigure 1) for surface charge compensa-tion purposes. On insulating materialssuch as our polystyrene beads, an imbal-ance of charged species emitted from thesurface can result in the buildup of a sur-face potential. This potential can, in prin-ciple, be nearly as large as the energy ofthe primary ion beam and deflect sec-ondary ions away from the TOF analyzer.To account for this phenomenon, thesample is flooded with a pulsed 30-eVelectron beam that has a current densityof a few microamperes per square cen-timeter. The timing is adjusted so that thebeam strikes the target for ;50 ms duringthe time when the secondary ions are al-ready in the drift tube. This procedure ef-fectively neutralizes any charge buildupand allows the analysis to proceed in anunimpeded fashion.
Imaging is achieved by moving the ionbeam over a given area of the target andrecording mass spectra on the fly. Figure2 shows an example of this kind of image.Typically, a picture like this contains 2563 256 pixels and the Ga+ ion beamstrikes each pixel 10 times. At 10,000mass spectra/s, the image is recorded in64 s. This number of pulses keeps theGa+ ion beam dose within a regime thatdoes not observably change the surfacechemistry by beam damage, commonlyreferred to as the static SIMS limit. Forthe image in Figure 2, each pixel repre-sents an area of 1 mm2 or 106 moleculesper layer and is interrogated with a doseof 6 3 102 Ga+ ions. Only 0.06% of the sur-face sites then are actually sampled.
The resulting data file contains infor-mation associated with 65,536 mass spec-tra. Although this number at first seemsdaunting, data compression techniques
© I M A G I N G
Inte
nsity
223 225 227 229 231 233
(a)
600500400300200100
0
Inte
nsity
546 548 550 552
(b)
(c)
m/zm/z
150
100
50
0
Figure 3. Molecule-specific imaging in which the images are recorded by plotting the total in-tensity of ions within the indicated mass window as a function of position on the surface.The images were produced using (a) only the red channel of a standard RGB 24-bit image atm/z 227, (b) only the green channel at m/z 548, and (c) by adding the two upper images to-gether. The resulting picture keys a specific color to a specific mass range.


18 SPECTROSCOPY 16(9) SEPTEMBER 2001 www.spec t roscopyo n l i n e . com
actually make storage and retrieval quitestraightforward. During imaging, posi-tion and flight time information is storedfor each detected ion. This file can thenbe sorted quickly to provide images asso-ciated with a particular flight time or m/zvalue. An example of how the analysisproceeds is shown in Figures 2 and 3.The size of this data file is ;10 MB, andthe image processing is completed in afraction of a second with a standard per-sonal computer.
Finally, some experiments use a pulsedlaser beam to photoionize the desorbedneutral molecules (10). This methodol-ogy is incorporated in Figure 1 and is dis-cussed briefly near the end of this sec-tion. For these experiments, the laser isfired ;100 ns after the primary ion pulse.The sample voltage is also pulsed to elim-inate spurious ions. The results pre-sented in this work do not yet use thisfeature.
RESULTS AND DISCUSSIONThe mechanism of molecular ion forma-tion in SIMS is distinct from that ob-served with related forms of MS such asMALDI and electrospray MS (ESMS).The presence of energetic collisions froma 25-keV ion source generally inducesmore fragmentation than softer ionizationschemes. The fact that molecules desorbmainly from surface layers produces spe-cial sample-handling issues that are notassociated with techniques that deal withbulk materials. Here, we evaluate theprospects for overcoming these difficul-ties and detail how to exploit the highspeed and spatial resolution associatedwith TOF-SIMS measurements.
Mechanisms of molecular desorption. It is ofinterest to consider some of the mecha-nisms by which surface molecules aredesorbed by energetic ion beams. Thebasic idea is that the incident projectilesets in motion a large number of atomsnear the sample surface (11). Becausethe attractive forces that hold the solid to-
gether are generally in the range of 3–6eV, eventually a few particles escape andare detected. Extensive local disruptionoccurs near the point of impact of the pri-mary ion, and it is remarkable that intactmolecular desorption occurs so readily.
The details of this disruption havebeen modeled by molecular dynamicscomputer simulations (12, 13). These cal-culations provide an atomic-level view ofthe motion that leads to desorption. Fig-ure 4 shows the results of a typical calcu-lation for 500-eV Ar+ ion bombardment ofa layer of C2H3 on a platinum crystal (12).The results indicate that the desorptionevent is finished in ;500 fs and that thedisruption area extends to ;10 atoms(;25 Å) away from the impact point. Weobser ve fragment species and parentmolecular species in these calculations.The desorption is induced by atoms mov-ing at just a few electron volts after theprimary ion energy has been transferredto many more slowly moving atoms. Verysimilar pictures have been reported usingmore energetic ions such as the ones em-ployed in this section. Note that thesemoving atoms, generally referred to asthe collision cascade, cause desorption ofmolecules from an area that is compara-ble to or smaller than the size of the ionbeam probe. Ionization can occur by di-rect collisional excitation or by cationiza-tion with protons or other charged ions inthe desorption flux.
Covalently linked surface molecules. Ourgoal is to interrogate an array of beadsand acquire mass spectral informationfrom each bead in parallel fashion. Thisgoal seems feasible enough because theSIMS technique is known to desorb mole-cules directly from the surface of a widevariety of materials and with high lateralresolution. For molecules synthesized onbeads, however, uninterpretable massspectra usually ensue using this strategy.Figure 5 shows an example of this. Herestearic acid, selected as a model com-pound, was attached to a 50-mm bead us-ing the acid-sensitive Sasrin linker andthen bombarded with the Ga+ ion beam.The mass spectrum consists entirely oflow-mass fragment ions, which yield littlestructural information about any stearicacid that is desorbed. We know, however,that stearic acid itself, when prepared as athin film, yields very clean mass spectrawith peaks at (M 1 H)+ and (M 2 H2O1 H)+ where M is the molecular weightof stearic acid. In fact, it would be feasibleto delink the stearic acid from the bead,
0 fs
535 fs
Figure 4. Molecular dynamics computer simulation of molecular desorption.
© I M A G I N G


20 SPECTROSCOPY 16(9) SEPTEMBER 2001 www.spec t roscopyo n l i n e . com
© I M A G I N G
prepare a thin film, and complete the as-say. This is essentially the strategy em-ployed by MALDI or ESMS in character-izing molecules that are synthesized onbeads. Although this procedure canwork, lateral resolution is lost becausemolecules are not confined to specificbeads, and the parallel aspects of the as-say cannot be carried out.
It is interesting to briefly examine themechanisms that cause the linker to influ-ence the SIMS spectrum. Computer sim-ulations that use a model system ofpentylidyne adsorbed on platinum havebeen performed in which the strength ofthe covalent interaction between the ad-sorbate and the substrate was changedarbitrarily (14). The results show that for
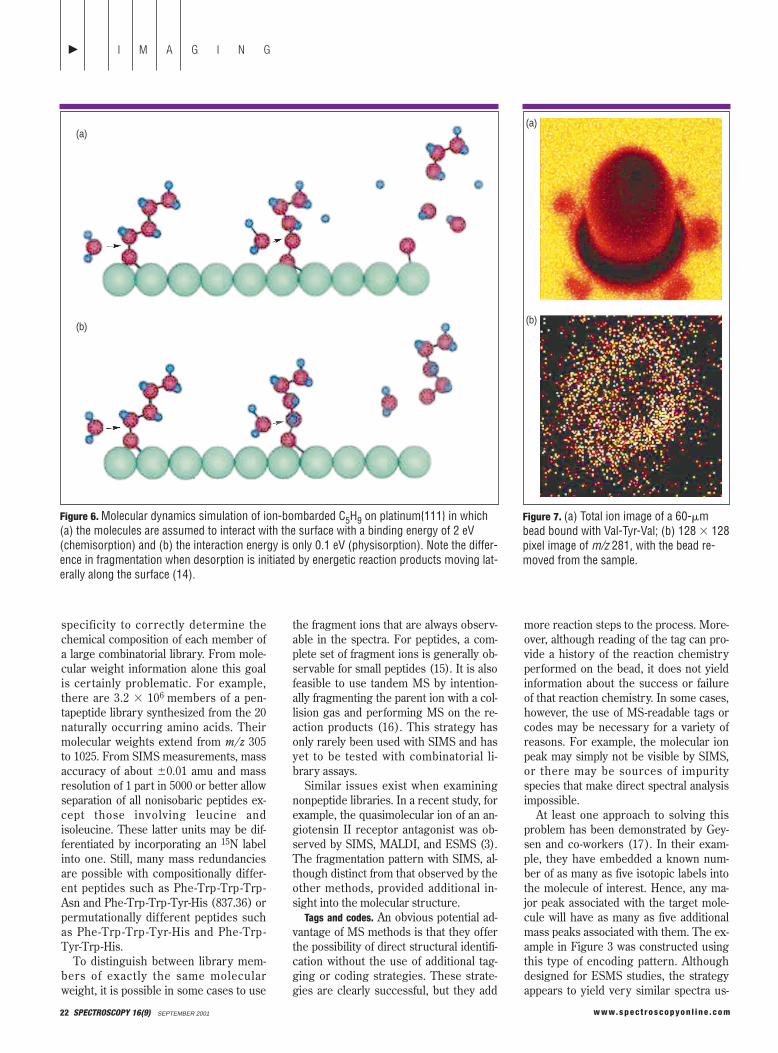
weak interactions, the collision cascadecan successfully eject intact moleculeswith minimal fragmentation. For strongerinteractions, however, smaller fragmentspecies created by energetic collisionscan move laterally and collide with adsor-bate molecules. These collisions tend tobreak the molecule near the bondingpoint on the surface, causing ejection ofthe top molecular piece. This mechanismis illustrated schematically in Figure 6.Hence, both experimental observationsand computer simulations suggest thatthe link between the library member andthe bead needs to be severed beforemass spectral assay.
To achieve this condition, we have de-veloped a protocol for clipping the cova-
lent surface attachment while leaving thetarget molecule resting in place on thebead (6). This protocol involves placing asingle bead or array of beads into an en-closed chamber saturated with trifluo-roacetic acid (TFA) and methylene chlo-ride vapors from a 15% TFA in methylenechloride solution. A 3–30 min exposure issufficient to cleave the molecule from thebead. The progress of the reaction can bemonitored by the observation of a colorchange from off-white to purple on thebeads themselves. Once the cleavage re-action is complete, the array can be in-serted directly into the TOF-SIMS foranalysis. The effect of this protocol on theSIMS data is shown in Figure 5, wherespectra for stearic acid linked to a poly-styrene bead by either Sasrin, Rink, orWang linkers and vapor-phase TFAclipped are shown. Note the appearanceof the (M 1 H)+ ion at m/z 285 and the(M 1 H 2 H2O)+ ion at m/z 268 for theSasrin- and Wang-linked beads, and theappearance of the stearamide molecularion for the Rink-linked beads. In the lattercase, the point of attachment is throughan amine functionality.
In addition to enhancing the informa-tion content of the SIMS spectra, the gas-phase TFA treatment preserves the spa-tial configuration of the molecules. Theimages shown in Figures 2 and 3, for ex-ample, were treated with TFA vapor.From the color encoding scheme, it is ob-vious that there is no movement of mole-cules either off the bead or onto a neigh-boring bead. This very clear situation isnot always observed, however. As Figure7 shows, exposure to excessive TFA va-por can cause some molecules to bewashed off and onto the holder. For thiscase, the tripeptide Val-Tyr-Val was boundto a 60-mm sphere via the Sasrin linker.After TFA exposure the Y2 1 2 peptidefragment at m/z 281 was imaged with thebead present and after removal of thebead. Although the molecule is still foundto be localized on the target, it is alsofound in a halolike residue on the sub-strate itself. Because clipping can pro-duce ar tifacts such as these, more re-search is needed to find self-cleavablelinking agents or alternative means of re-leasing target molecules from the beadwithout changing their location. The useof photosensitive linkers represents onepossible approach of this type.
Compound identification with SIMS. A criti-cal issue is whether MS in general orSIMS in particular has enough molecular
Inte
nsity
(cou
nts)
Inte
nsity
(cou
nts)
0 100 200 300 400
0 100 200 300 400
0 100 200 300 400
(b)
(a)
R
St
O St
100
0
Inte
nsity
(cou
nts)
0 100 200 300 400
(c)200
100
0
100
75
50
25
0
3200
2400
1600
800
0
R
R
St
O St
OSt
N2
St
Figure 5. Mass spectra of stearic acid under various conditions. Spectra obtained (a) fromstearic acid attached to polystyrene spheres using the Sasrin linker, (b) after exposing thesample in (a) to a gas phase mixture of TFA and methyl chloride for 30 min, and (c) usingthe Rink linker.

22 SPECTROSCOPY 16(9) SEPTEMBER 2001 www.spec t roscopyo n l i n e . com
specificity to correctly determine thechemical composition of each member ofa large combinatorial library. From mole-cular weight information alone this goalis certainly problematic. For example,there are 3.2 3 106 members of a pen-tapeptide library synthesized from the 20naturally occurring amino acids. Theirmolecular weights extend from m/z 305to 1025. From SIMS measurements, massaccuracy of about 60.01 amu and massresolution of 1 part in 5000 or better allowseparation of all nonisobaric peptides ex-cept those involving leucine andisoleucine. These latter units may be dif-ferentiated by incorporating an 15N labelinto one. Still, many mass redundanciesare possible with compositionally differ-ent peptides such as Phe-Trp -Trp -Trp -Asn and Phe-Trp-Trp-Tyr-His (837.36) orpermutationally different peptides suchas Phe-Trp -Trp -Tyr-His and Phe-Trp -Tyr-Trp-His.
To distinguish between library mem-bers of exactly the same molecularweight, it is possible in some cases to use
the fragment ions that are always observ-able in the spectra. For peptides, a com-plete set of fragment ions is generally ob-servable for small peptides (15). It is alsofeasible to use tandem MS by intention-ally fragmenting the parent ion with a col-lision gas and performing MS on the re-action products (16). This strategy hasonly rarely been used with SIMS and hasyet to be tested with combinatorial li-brary assays.
Similar issues exist when examiningnonpeptide libraries. In a recent study, forexample, the quasimolecular ion of an an-giotensin II receptor antagonist was ob-served by SIMS, MALDI, and ESMS (3).The fragmentation pattern with SIMS, al-though distinct from that observed by theother methods, provided additional in-sight into the molecular structure.
Tags and codes. An obvious potential ad-vantage of MS methods is that they offerthe possibility of direct structural identifi-cation without the use of additional tag-ging or coding strategies. These strate-gies are clearly successful, but they add
more reaction steps to the process. More-over, although reading of the tag can pro-vide a history of the reaction chemistryperformed on the bead, it does not yieldinformation about the success or failureof that reaction chemistry. In some cases,however, the use of MS-readable tags orcodes may be necessary for a variety ofreasons. For example, the molecular ionpeak may simply not be visible by SIMS,or there may be sources of impurityspecies that make direct spectral analysisimpossible.
At least one approach to solving thisproblem has been demonstrated by Gey-sen and co-workers (17). In their exam-ple, they have embedded a known num-ber of as many as five isotopic labels intothe molecule of interest. Hence, any ma-jor peak associated with the target mole-cule will have as many as five additionalmass peaks associated with them. The ex-ample in Figure 3 was constructed usingthis type of encoding pattern. Althoughdesigned for ESMS studies, the strategyappears to yield very similar spectra us-
(a)
(b)
Figure 6. Molecular dynamics simulation of ion-bombarded C5H9 on platinum{111} in which(a) the molecules are assumed to interact with the surface with a binding energy of 2 eV(chemisorption) and (b) the interaction energy is only 0.1 eV (physisorption). Note the differ-ence in fragmentation when desorption is initiated by energetic reaction products moving lat-erally along the surface (14).
(a)
(b)
Figure 7. (a) Total ion image of a 60-mmbead bound with Val-Tyr-Val; (b) 128 3 128pixel image of m/z 281, with the bead re-moved from the sample.
© I M A G I N G


24 SPECTROSCOPY 16(9) SEPTEMBER 2001
ing SIMS. One significant dif ference,however, involves the formation ofquasimolecular ions with Na+ or K+ ratherthan with H+. Because solid-phase sam-ples are often formed in the presence of asalt, these cations can easily attach todesorbing molecules, thereby increasingtheir apparent molecular weight. WithESMS, however, the samples can be puri-
fied using liquid chromatography, elimi-nating this complication. An example ofthis effect is shown in Figure 8, whichcompares the SIMS and ESMS of thesame isotopically encoded compoundsynthesized on bead and extracted withTFA. Note that although one group ofpeaks is shifted by m/z 22, the relative in-tensities of the isotopic components areidentical. This result further supports theuse of tags to overcome complications inthe interpretation of mass spectra and toenhance general applicability. It will be in-teresting to see whether MS-readable tagmolecules can be developed to further ex-pand options. Some attempts have al-ready been successful in this direction forMALDI analysis of bead-bound DNAfragments.
Arraying of beads for parallel assay. Thelong-term payoff for imaging MS in com-binatorial library research focuses on thepossible characterization of a large num-ber of beads in parallel fashion. There aremany envisionable scenarios that couldlead to ultrahigh-throughput screeningsolutions, but perhaps the most directmodality is illustrated in Figure 9. In thisinstance, 50-mm beads are arrayed into aspecially designed metallic disk that isfabricated with holes of appropriate sizes.This disk could be chemically assayedwith imaging TOF-SIMS on one side andscreened against a variety of receptors onthe other side. Bioactivity can be checkedusing any number of traditional handlesincluding autoradiography or fluores-cence microscopy. Information from thetwo sides of the disk is then correlated toacquire chemical str ucture –activityrelationships.
Protocols necessary to accomplish thisscenario are emerging rapidly. For exam-ple, we have fabricated a prototype bead-holder of the type described above usinga double-sided photolithographic tech-
nique. Positive and negative masks arecast onto the surfaces of a copper disk us-ing an appropriate photoresist. The nega-tive mask is then electroplated withnickel so the exposed copper regions onthe positive mask can be etched withchromic acid. Once the photoresist isstripped from the metal substrate it isgold-plated to improve chemical robust-ness. Beads are then loaded directly intothe ar ray by forcing a liquid slur r ythrough the holes. Figure 10 shows anoptical picture of this ar ray and aschematic cross-sectional diagram.
To complete a chemical assay usingimaging TOF-SIMS, the array shown inFigure 10 is filled with beads that are cre-ated in a split-and-mix combinatorialchemistry synthesis. Our chip was con-structed for 50-mm spheres and containsas many as 10,000 beads/cm2. Note thatwe have chosen to use fairly smallspheres rather than the more standard200-mm beads in an attempt to create ashigh a density as possible. As noted ear-lier, the field of view of the mass spec-trometer is approximately 2 mm 3 2 mm,implying that as many as 400 beads canbe assayed in one TOF-SIMS image. Atypical example, shown in Figure 11, usesthe stearic acid model system describedearlier. In this picture, the red color de-notes the presence of stearic acid, andthe blue color denotes the presence ofions associated with the arraying disk.Each picture is displayed using 256 3 256pixels with 10 Ga+ ion pulses of 10 ns du-ration applied to each pixel at the rate of10,000 pulses/s. Hence, each image re-quires ;1 min to acquire. Consideringthat the beads occupy slightly less than20% of the surface area for this configura-tion, the Ga+ ion beam interrogates eachbead for 650 ms, shown in Figure 11a,and 32 ms, shown in Figure 11b. The as-say of the entire array of 10,000 beadscould be completed in less than an hourby moving the sample into an appropriatesection of 25 tiled 2 mm 3 2 mm images.
Sensitivity issues. Ion beam–induced de-sorption occurs primarily from the sur-face layer of the sample. For polystyrenespheres, the solid-phase synthesis proce-dure allows activation of sites throughoutthe bulk of the material. A 200-mm bead,for example, is capable of carrying asmuch as a few nanomoles of the desiredcompound. Yet, even if all sites are occu-pied, only a few femtomoles of materialare present on the surface and amenablefor SIMS analysis. These simple observa-
www.spec t roscopyo n l i n e . com
540 550 560
(a)
200
160
120
80
40
0
(b)
537.4
549.5
559.5
m/z
540 550 560
20
15
10
5
m/z
Figure 8. Comparison of (a) SIMS and (b)ESMS for an isotopically encoded peptidemimic. For (a), the molecule was extractedfrom the bead with TFA, deposited on agold substrate, and analyzed as a dried thinfilm. For (b), the extract was injected di-rectly into the ionization source of the spec-trometer. Note that the intensity ratios ofthe peaks in a given cluster are very similarbut that the amount of (M 1 Na)+ at m/z559.5 is much greater with SIMS. (ESMScourtesy of D. Wagner, Glaxo Wellcome[Research Triangle Park, NC].)
© I M A G I N G


26 SPECTROSCOPY 16(9) SEPTEMBER 2001
tions suggest that the polymer surfacemust be kept rather clean because impu-rities can effectively cover the moleculeof interest, rendering it invisible. More-over, hydrophobic or coulombic interac-tions that occur on the surface could po-tentially force surface molecules into thebulk and decrease the signal.
Sensitivity is obviously a key issue ifthis strategy is to become a practicalscreening tool. It is especially importantif the technique is being used with codesor tags that may only be present at the1–10% level. So far, the results suggestthat the limit of detection is on the orderof a few femtomoles for peptides (6) anda bit lower for an angiotensin II antago-nist (3). Model compounds such as
stearic acid exhibit detection limits atleast an order of magnitude lower, pre-sumably because of the high ionizationefficiency of these types of systems.
Although these limits are generallysatisfactor y, there are many possibleschemes for increasing sensitivity fur-ther. One possibility that has been ex-ploited by many groups involves the useof an intense, pulsed UV laser to pho-toionize any neutral molecules that havedesorbed from the sur face (10). Thisstrategy is attractive in principle becausewe know that more than 99% of the de-sorbed flux is, in fact, neutral. Anecdotalreports of examples of systems indicatethat sensitivity improvements of an orderof magnitude have been observed. Be-cause of molecular photodissociation,however, the method is not yet generalenough to be applied to a large set of sim-ilar molecules.
Another possibility involves the use ofa matrix molecule to enhance the SIMSyield. This scheme follows the observa-tions leading to enhanced molecular ion
emission by MALDI and appears to besuccessful for some systems. Preliminaryexperiments in which a matrix is added tothe bead surface are so far inconclusive,but work is continuing (18).
Finally, molecular ion yields are foundto be enhanced by the use of cluster ionbeam sources (19). Apparently, the col-lection of incident particles is more effec-tive at initiating the collision cascade thana single particle of equivalent mass, par-ticularly with light substrates such aspolystyrene. Some lateral resolution hasbeen achieved using SF6 as the projectile,and yield enhancements of at least 10-foldhave been observed. It will be interestingto see if this advance can further improvedetection limits, especially if imagingcluster sources can be found.
CONCLUSIONS AND PROSPECTSHere, we have attempted to show howthe marriage of MS, nanofabrication, andimaging can lead to new ultrahigh-throughput screening opportunities forcombinatorial chemistr y research. Al-though the preliminary experiments thathave been completed appear promising, itis obvious that a number of technical hur-dles remain to be overcome before thismethod can be reliably implemented. Thebiggest problem involves the fragmenta-tion of desorbing molecules by the Ga+
ion probe. Many solutions to this prob-lem present themselves for future re-search, including development of embed-ded isotope labels or tags and theincorporation of special matrices that en-hance the molecular ion yield.
Another issue involves the selection ofthe most appropriate configuration forchemical and bioassay using a sampleholder similar to the prototype describedhere. So far, large libraries have not beenexamined, and it is unclear whethermass redundancies and other interfer-ences will be serious deterrents. Thepossibility of creating a spatially encodedarray of beads that is directly amenableto bioassay, however, appears to be emi-nently feasible.
In summary, we have demonstratedthat read rates of greater than 10 beads/sare possible using imaging TOF-SIMS un-der the right set of experimental parame-ters. With this capability, it should ulti-mately be possible to achieve a great dealof information about the chemical reactiv-ity of large combinatorial libraries thathas not been possible previously. By cov-
www.spec t roscopyo n l i n e . com
© I M A G I N G
RR
RR
RR R RR
R
RR
R
R
R RRR
R R
R R
R
R
RRR
RRRR
Figure 9. Schematic diagram of arrayingstrategy.
Figure 10. Optical micrograph of bead array,and a schematic diagram showing a cross section of one of the holes.
(a)
(b)
Figure 11. Molecule-specific TOF-SIMS im-ages of an array of stearic acid beads. TheGa+ ion beam interrogated each bead for (a)650 ms and (b) 32 ms.

SEPTEMBER 2001 16(9) SPECTROSCOPY 27
ering a larger domain of molecular com-position, many of the drug discovery con-cepts created by the combinatorial ap-proach may be fully realized.
REFERENCES(1) R .S. Youngquist, G.R . Fuentes, M.P.
Lacey, and T.J. Keough, J. Am. Chem. Soc.8, 77 (1994).
(2) B. J. Egner, G. J. Langley, and M. J.Bradley, J. Org. Chem. 60, 2652 (1995).
(3) C.L . Brummel, J.C. Vickerman, S. A .Carr, M.E. Hemling, G.D. Roberts, W.Johnson, J. Weinstock, D. Gaitanopoulos,S. J. Benkovic, and N. Winograd, Anal.Chem. 68, 237 (1996).
(4) Y.-H. Chu, Y.M. Dunayevskiy, D.P. Kirby,P. Vouros, and B.L. Karger, J. Am. Chem.Soc. 118 (33), 7827–7835 (1996).
(5) P.K. Jensen, L. Pasa-Toli, G. A. Anderson,J. A. Horner, M.S. Lipton, J.E. Bruce, andR.D. Smith, Anal. Chem. 71, 2076 (1999).
(6) C.L. Brummel, I.N.W. Lee, Y. Zhou, S.J.Benkovic, and N. Winograd, Science,264, 399 (1994).
(7) R.M. Braun, M.L. Pacholski, A. Beyder,and N. Winograd, Secondar y Ion MassSpectrometr y (SIMS XI), G. Gillen, R.Lareau, J. Bennet, and F. Stevie, Eds. (Wi-ley, New York, 1998), p. 89.
(8) Secondary Ion Mass Spectrometry, Princi-ples and Applications, J.C. Vickerman, A.Brown, and N.M. Reed, Eds. (Oxford Uni-versity Press, 1989).
(9) R.M. Braun, P. Blenkinsopp, S.J. Mullock,C. Corlett, K.F. Willey, J.C. Vickerman,and N. Winograd, Rapid Commun. MassSpec. 12, 1246–1252 (1998).
(10) K.F. Willey, V. Vorsa, R.M. Braun, and N.Winograd, Rapid Commun. Mass Spec.12, 1253–1260 (1998).
(11) Sputtering by Particle Bombardment III,R. Behrish and K. Wittmaack (Springer-Verlag, Berlin, 1991).
(12) R.S. Taylor and B. J. Garrison, J. Am.Chem. Soc. 116, 4465 (1994).
(13) R. Chatterjee, Z. Postawa, N. Winograd,and B. J. Garrison, J. Phys. Chem. 103,151 (1999).
(14) R.S. Taylor and B.J. Garrison, Int. J. MassSpec. Ion Processes 143, 225 (1995).
(15) K. Biemann and S. A. Martin, Mass Spec-trom. Rev. 6, 1 (1987).
(16) V.M. Doroshenko and R.J. Cotter, Anal.Chem. 68, 463–472 (1996).
(17) H.M. Geysen, C.D. Wagner, W.M. Bod-nar, C. J. Markwor th, G. J. Parke, F. J.Schoenen, D.S. Wagner, and D.S. Kinder,Chem. Biol. 3, 679 (1996).
(18) K.J. Wu, T.F. Fister, and R.W. Odom, 12thAnnual SIMS Workshop, Gaithersburg,MD, April 25–29, 1999.
(19) G. Gillen and S. Roberson, Rapid Comm.Mass Spec. 12, 1303–1312 (1998).
Nicholas Winograd is Evan Hugh Professorin the department of chemistry at PennState University, 184 MRI Building, Uni-versity Park, PA 16802. He may be con-tacted by telephone at (814) 863-0001, byfax at (814) 863-0618, and by e-mail [email protected]. Robert M. Braun is a seniorlaboratory scientist at Evans PHI Labora-
tor y, 6509 Flying Cloud Drive, EdenPrairie, MN 55344. He may be contactedby phone at (952) 828-6493, by fax at(952) 828-6449, or by e-mail [email protected]. ◆
§I M A G I N G
Circle 17