Embed Size (px)
Citation preview

Imaging Spectroscopy Applied to the Animas River Watershed and Silverton Caldera
By J. Bradley Dalton, Dana J. Bove, Carol S. Mladinich, and Barnaby W. Rockwell
Chapter E2 ofIntegrated Investigations of Environmental Effects of Historical Mining in the Animas River Watershed, San Juan County, ColoradoEdited by Stanley E. Church, Paul von Guerard, and Susan E. Finger
Professional Paper 1651
U.S. Department of the InteriorU.S. Geological Survey
Contents
Abstract .......................................................................................................................................................143Introduction.................................................................................................................................................143Acknowledgments .....................................................................................................................................143Imaging Spectroscopy Data: Background and Reduction .................................................................143
Materials Characterization by Spectroscopy ..............................................................................143The AVIRIS Instrument .....................................................................................................................144Spectral Analysis ..............................................................................................................................145Spatial Corrections and Orthorectification ..................................................................................146
Discussion ...................................................................................................................................................146Animas River Watershed AVIRIS Coverage .................................................................................146Spectral Mapping Results ...............................................................................................................148
Iron-Bearing and Associated Minerals ...............................................................................148Clay, Mica, Carbonate, and Sulfate Minerals .....................................................................151Calcite, Epidote, Chlorite, and Sericite .................................................................................154
Acid-Generating and Acid-Neutralizing Mineral Assemblages ...............................................155Sources of Acidic Drainage ............................................................................................................155
Summary and Conclusions .......................................................................................................................156Selected References .................................................................................................................................156
Figures 1–3. Graphs showing: 1. Infrared spectra of jarosite, goethite, and hematite ....................................................144 2. Infrared spectra of kaolinite, muscovite, and halloysite .............................................145 3. Infrared spectra of calcite, chlorite, and epidote ........................................................146 4. Landsat image of part of the Animas River watershed showing area
covered by AVIRIS data ...........................................................................................................147 5–9. Maps showing: 5. Geographic features of the study area, and outlines of AVIRIS data
acquisition areas ...............................................................................................................149 6. Red Mountain area showing minerals detected in the 1-µm spectral
region using AVIRIS ..........................................................................................................150 7. Red Mountain area showing minerals detected in the 2-µm spectral
region using AVIRIS ..........................................................................................................151 8. Silverton area showing minerals detected in the 1-µm spectral region
using AVIRIS .......................................................................................................................152 9. Silverton area showing minerals detected in the 2-µm spectral region
using AVIRIS .......................................................................................................................153
AbstractKnowledge of the distribution of acid-generating and
acid-neutralizing mineral assemblages in the Animas River watershed is necessary for accurate assessment of premining and anthropogenic contributions to stream quality. To achieve this objective, the Jet Propulsion Laboratory (JPL) Airborne Visible and Infrared Imaging Spectrometer (AVIRIS) was used to acquire visible to near-infrared wavelength spectral data over the Animas River watershed. These spectral data were processed using the U.S. Geological Survey Tetracorder v3.6a2 expert system to create a set of georeferenced images detailing the distributions of major minerals of interest within the water-shed. Large exposures of unmined, pervasively altered, and locally pyritized rocks mapped by this effort are associated with significant acidic runoff. Large areas of propylitized rock con-taining high concentrations of calcite, chlorite, and epidote were also mapped and may contribute significant acid-neutralizing potential to the watershed. The distribution of mineral assem-blages in the watershed strongly affects stream geochemistry, dissolved metal concentrations, and overall water quality, which must be taken into account when remediation and reclamation plans are devised for the Animas River watershed.
IntroductionThe Animas River watershed is the site of a coordinated
effort by several Federal and State agencies and local citizens to characterize the extent and severity of environmental effects from acid drainage. Acidic water originates both from numer-ous inactive mine sites that date back as much as a century or more, and from extensive areas of unmined mineralized and hydrothermally altered rocks. The headwaters of the Animas River in the study area of this volume are within the Tertiary San Juan and Silverton volcanic calderas, which were associ-ated with large faults and intense fracturing suitable for later mineralization (Yager and Bove, this volume, Chapter E1 and pl. 1).
As part of this study by the U.S. Geological Survey (USGS), the Jet Propulsion Laboratory (JPL) was contracted to acquire AVIRIS data (Airborne Visible and Infrared Imaging Spectrometer) over the San Juan Mountains and Animas River watershed. Methods of infrared spectral analysis developed at the USGS have been applied to characterize the surface distributions of a number of natural and artificial materials. These results are being used in conjunction with field geologic mapping, geochemistry, and geophysics to determine the rela-tive extent of natural and anthropogenic sources of acidic and metal-bearing surface runoff, and their effect on water quality. The results also show the areal distribution of mineral assem-blages with acid-neutralizing potential that may to some extent mitigate the deleterious effects of acid drainage.
Acknowledgments
The authors thank B. Berger for a helpful review, B. Ramsey for production of several maps and figures, and T.V.V. King for extensive editorial assistance in the prepara-tion of the final manuscript.
Imaging Spectroscopy Data: Background and Reduction
Materials Characterization by Spectroscopy
Spectroscopy is the study of how energy is differentially absorbed and transmitted by materials because of contrasting physical and chemical characteristics. Many minerals exhibit diagnostic spectral absorption features because of vibrational overtones, electronic transitions, charge transfer, and conduc-tion processes. The causes of these absorption features are reviewed in Hunt (1977). Briefly, the absorption of photons leads the atom or molecule to an excited state. In many atoms,
Chapter E2Imaging Spectroscopy Applied to the Animas River Watershed and Silverton Caldera
By J. Bradley Dalton, Dana J. Bove, Carol S. Mladinich, and Barnaby W. Rockwell

the absorbed energy can be used to move electrons to higher orbitals. In molecules, vibrations, rotations, and translations of the component atoms may dissipate the excess energy. All atoms and molecules have a limited set of possible excited states that are defined by quantum physics. The transition between energy states must always be accompanied by the absorption or emission of energy in the form of photons at discrete wavelengths. Only photons having the energy cor-responding to a permitted transition may be absorbed.
A mineral is an aggregation of atoms into a crystal lattice held together by molecular bonds. All minerals are capable of absorbing light at the specific frequencies related to the energy states of their component atoms, the harmonic oscillations of their particular molecular bonds, and character-istics of the crystal lattice. Solid objects have colors because they preferentially absorb light at the frequencies correspond-ing to their permitted transitions. The human eye receives the reflected (non-absorbed) light, and the brain interprets this as color. A spectrometer operates according to the same prin-ciples, except that it may receive and record reflected light at frequencies and wavelengths outside the range of the human eye.
To detect and classify materials with visible and near-infrared spectroscopy, one must first understand their char-acteristic spectral behavior. Most materials can be grouped spectrally into classes on the basis of their diagnostic absorp-tion features. In the 0.35- to 2.50-µm (micrometer) wavelength
region, materials can be discriminated on the basis of two important types of absorption features, electronic and vibra-tional (Hunt, 1977 and references therein).
Many of the absorptions of polyatomic molecules lie in the visible and infrared wavelength ranges (Hunt, 1977; Herzberg, 1989, 1991a,b; Burns, 1993; Clark, 1999). Reflec-tance spectra (figs. 1–3) relate the amount of light reflected by a given material to that reflected from an ideal surface. The absorption features diagnostic of a given material appear as regions of reduced intensity or troughs in the spectrum, centered upon the frequencies of permitted transitions. For example, in figure 1, the minerals goethite, hematite, and jarosite all exhibit such absorption features at approximately 0.8–1.0 µm; these are caused by electronic transitions in the iron (Fe3+) atoms. Jarosite has additional absorption features at 2.0–2.4 µm, related to Fe-OH molecular vibrations. These absorption features correspond directly to the molecular struc-ture of the material being measured. The unique character of individual reflectance spectra makes them powerful tools for mineralogical and compositional analysis.
The AVIRIS Instrument
The burgeoning field of imaging spectroscopy combines aspects of remote sensing and photography with spectroscopy. Spectra are typically acquired by a scanning sensor mounted on a spacecraft or airborne platform, which passes over the
Figure 1. Infrared spectra of the iron-bearing minerals jarosite, goethite, and hematite, showing the diagnostic absorption features at 0.8–1.0 µm. Sample numbers labeled after mineral names.
SC
ALE
D R
EFL
EC
TA
NC
E
0.0
0.5
1.0
0.5 1.0 1.5 2.0 2.5WAVELENGTH, IN MICROMETERS
Hematite FE2602
Goethite WS222
Jarosite GDS99
144 Environmental Effects of Historical Mining, Animas River Watershed, Colorado

Imaging Spectroscopy 145
study area. Data are recorded on a pixel-by-pixel basis along the flightline, creating a single, two-dimensional, gray-scale image for each discrete wavelength region, which is repre-sented by a channel. A typical spectroscopy data set is made up of hundreds of such channels, which, when combined into a single data set, provide a third, or spectral, dimension to the data. Each pixel of the image thus not only represents a two-dimensional area on the Earth’s surface, but also contains continuous spectral data over a region of the electromagnetic spectrum. The spectral data can be viewed in either spectral or spatial dimensions.
The Airborne Visible Infrared Imaging Spectrometer (AVIRIS) instrument (Porter and Enmark, 1987; Green and others, 1988, 1998) operated by the NASA Jet Propulsion Laboratory was originally conceived as a test bed sensor for development of Earth-orbiting spectrometers. An imaging spec-trometer usually consists of a telescope and a detector array. AVIRIS uses a rotating mirror and a set of four grating spec-trometers to separate the light into its component wavelengths for measurement. The AVIRIS data presented in this chapter were acquired from an ER–2 aircraft flying at 65,000 feet above sea level. Each pixel of this AVIRIS data nominally represents a 17 m by 17 m spatial area on the Earth’s surface. The spectral dimension of the data is represented in 224 discrete channels,
which, when combined, produce a continuous spectrum for each pixel over the 0.35- to 2.50-µm wavelength region. The signal-to-noise ratios of the data are typically between 800 and 200, outside of the major atmospheric water vapor absorption features at 1.4 and 2.0 µm.
Spectral Analysis
Large spectral data sets, such as those collected by AVIRIS, are a challenge to reduce and interpret. Expert sys-tems and artificial intelligence programs have been developed that attempt to classify spectra with a minimum of human guidance. Mathematical systems, such as principal com-ponents and spectral angle mapping (SAM), use statistical methods to group similar spectra into classes without any a priori information about composition (Sabins, 1987). Neu-ral network approaches (Haykin, 1999) also classify spectra into groups, which are then interpreted by an operator. A number of classification methods, including physical models such as linear unmixing, Hapke theory (Hapke, 1981, 1993), mixture-tuned matched filtering, and others, are reviewed in Mustard and Sunshine (1999). Other approaches, such as the Tetracorder system developed at the USGS (Clark and others, 2003), attempt to classify spectra in a scene by applying expert
Figure 2. Infrared spectra of the minerals kaolinite, muscovite, and halloysite, showing their diagnostic 2.2-µm absorption features. The strong absorption feature at 1.4 µm is caused by water adsorbed onto the sample and is not useful for remote sensing purposes because of atmospheric water vapor. Sample numbers labeled after mineral names. From Clark, Swayze, Gallagher, and others, 1993.
0.0
0.5
1.0
0.5 1.0 1.5 2.0 2.5WAVELENGTH, IN MICROMETERS
Kaolinite GDS11
Muscovite HS24.3
Halloysite KLH503
SC
ALE
D R
EFL
EC
TA
NC
E

knowledge of diagnostic mineral absorption features in the same way a trained spectroscopist would. This physics-based approach allows the algorithm to uniquely identify specific materials that exist at the surface.
The Tetracorder expert system (Clark and others, 1990, 1991; Clark, Swayze, and Gallagher, 1993; Clark and Swayze, 1995; Dalton and others, 1998; Dalton, 2000; Dalton and oth-ers, 2000; Swayze and others, 2000; Clark and others, 2003 and references therein) is a rule-based program for classifica-tion of spectral data on the basis of comparisons to a library of reference spectra of minerals, mineral mixtures, vegetation, water, and man-made organic materials. The reference library is composed of laboratory measurements of the reflectance spectra from pure samples of materials of interest.
The results of Tetracorder spectral analysis are grouped and displayed on the basis of the types of dominant diagnostic absorption features. For presentation purposes, separate maps
are generated for the iron-bearing minerals (electronic absorp-tions), and the phyllosilicate/carbonate/sulfate/silica minerals (vibrational absorptions).
Spatial Corrections and Orthorectification
Data acquired by the AVIRIS sensor are provided to the user in radiance format. After the radiance spectral data have been converted to reflectance values using a path-radiance and ground calibration correction scheme (Clark, Swayze, Heidebrecht, and others, 1993; Clark and others, 2002), the Tetracorder processing is applied. Once the resultant imagery has been engineering-corrected for platform motion, the images are much closer to a flat x-y plane. Some residual spatial distor-tions still remain, and the effects of topography must be taken into account. Traditional orthorectification processes cannot be used for AVIRIS airborne scanner data because the image is not acquired instantaneously as in aerial photography. Each pixel of each scan line has a unique geometric model. Radial basis functions, such as multiquadric (Ehlers and Fogel, 1994) and thin plate spline (Bookstein, 1989), were used for this study because they have produced the best results for ortho-rectification of airborne scanner data (Wiemker and others., 1996; Ehlers, 1994; Ehlers and Fogel, 1994). Root mean square (RMS) errors were nominally kept in the 3- to 4-m range, with no RMS errors over 10 m. The registration was checked by selection of points throughout the AVIRIS image and com-parison to the same points in the USGS 1-m digital orthophoto quadrangle (DOQ) images. Comparisons of the AVIRIS image were also checked against revised hydrography and transporta-tion vectors. The distances between the revised vector features and DOQs, and the rectified imagery were generally within one to two pixels. Further details of the correction procedures are given in Dalton and others (2005).
Discussion
Animas River Watershed AVIRIS Coverage
The flight acquisition program was designed to cover the Animas River and its drainage basin. In this report, we have focused on a portion of the headwaters, mostly within the boundaries of the Silverton and San Juan calderas, a highly mineralized area that is the source of acidic runoff into the Animas River. The Silverton caldera is roughly circumscribed by Mineral Creek and the Animas River upstream of Silverton (Yager and Bove, this volume). Data were acquired during two overpasses of the ER–2 aircraft carrying the AVIRIS instrument. The outline of the merged AVIRIS data set is overlaid upon a Landsat Thematic Mapper image (fig. 4). The Animas River watershed in Colorado covers a region bounded approximately by lat 37°15' and 38° N. and long 107° and
2.0 2.1 2.2 2.3 2.4 2.5WAVELENGTH, IN MICROMETERS
0.0
0.5
1.0
SC
ALE
D R
EFL
EC
TA
NC
E
SJ98-74D
Epidote
Chlorite
Calcite
Figure 3. Infrared spectra of the minerals calcite, chlorite, and epidote, showing the 2.3-µm absorption feature, which differs slightly for each mineral. The lower spectrum is of sample SJ98–74D, a rock which contains all three minerals in a fine-grained mixture.
146 Environmental Effects of Historical Mining, Animas River Watershed, Colorado

Imaging Spectroscopy 147
Telluride
Durango
Hermosa
Silverton
Ouray
a
b
5 km
N
Figure 4. Landsat image of Animas River watershed, showing area covered by AVIRIS data. Flightlines outlined in red. The two smaller rectangles are the area of the Red Mountain scene (fig. 5, outline a) and Silverton scene (fig. 5, outline b) discussed in this report.
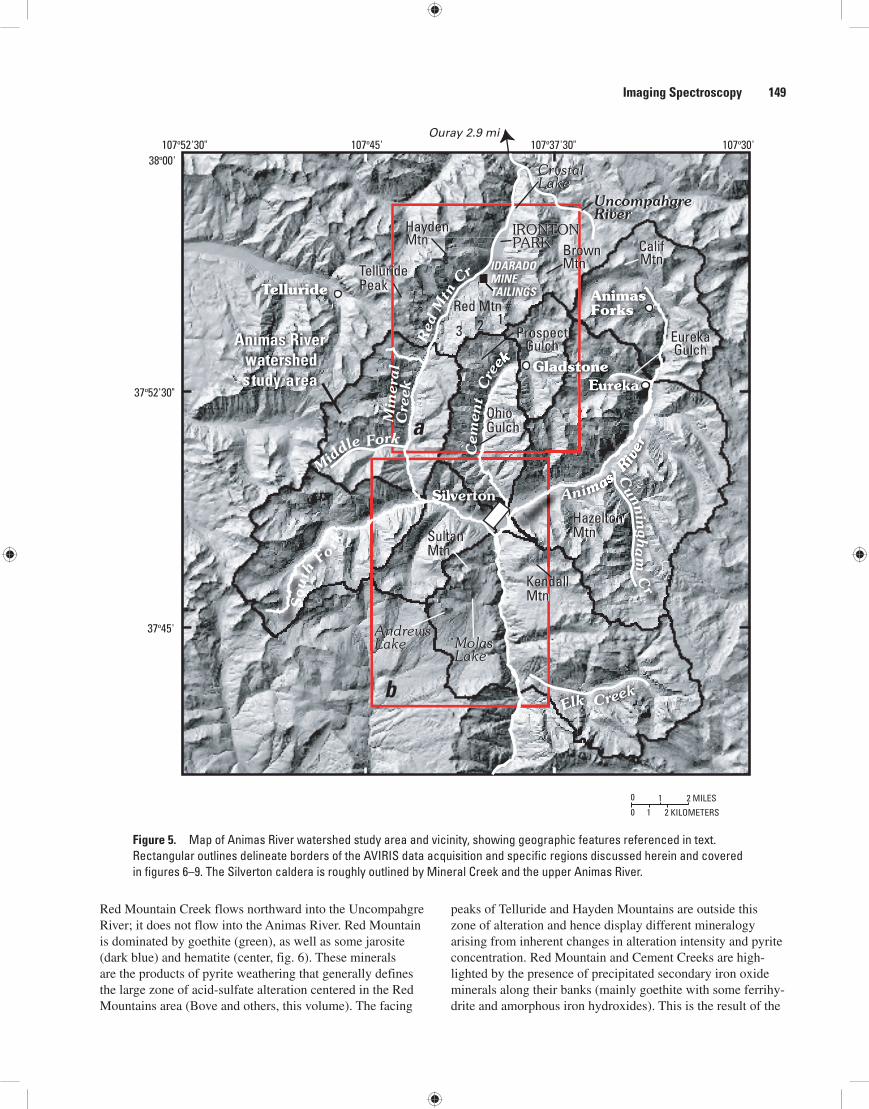
108° W. and is between the towns of Durango and Ouray, Colo. (fig. 4) in the San Juan Mountains. The flightlines extend from a headwater region at Animas Forks, Colo., to agricultural areas near Hermosa, Colo. (figs. 4, 5). The AVIRIS data coverage includes most of the watershed in Colorado, including the heavily mineralized areas of Red Mountain, Ohio Peak, Anvil Mountain, and peak 3,792 m (between Middle Fork and South Fork Mineral Creek) (Yager and Bove, this volume, fig. 4); and it thus reaches into territory outside the specific study area of this volume. Much of the region is covered by dense vegetation, preventing remote assessment of the geology in large areas. Within the mountains, however, heavily mineralized zones and other locations contain scant if any vegetation, permitting direct insight into geologic trends and mineral distributions.
Spectral Mapping Results
Tetracorder compositional maps for the Red Mountain scene (area a, fig. 5) are shown in figures 6 and 7, and cover an area bounded by lat 37°50'40" to 37°57'40" N. and long 107°37'0" to 107°43'50"W. Figures 8 and 9 are com-positional maps for the Silverton scene (area b), which is bounded by lat 37°42'40" to 37°49'40" N. and long 107°37'55" to 107°44'05" W.
Iron-Bearing and Associated MineralsThe Fe3+ and Fe2+ crystal field transitions in the 1 µm
spectral region provide a convenient tool to discriminate iron-bearing minerals through visible and near-infrared spectroscopy. Of greatest importance to this study was the identification of the pyrite (FeS
2) oxidation assemblage
products. Although difficult to detect spectrally, pyrite is the predominant source of acidic drainage in the study area (Bove and others, this volume; Mast and others, this volume, Chapter E7). Pyrite is extremely dark in the infrared, and its only absorption features in the visible to near-infrared (VNIR) region are very weak compared to those of other iron-bearing minerals. However, weathering of pyrite produces the miner-als jarosite (K
2Fe3+
6(SO
4)
4(OH)
12), goethite (Fe3+O(OH)), and
hematite (α-Fe2O
3), which are readily distinguished on the
basis of strong VNIR absorption features (fig. 1) (Swayze and others, 2000). The pyrite weathering sequence (Swayze and others, 2000) is closely linked to production of acidic runoff, and these minerals, particularly jarosite, serve as indicators of the presence of pyrite (Swayze and others, 2000). As an end product, hematite is not responsible for acid production, but these three minerals tend to occur in roughly concentric zones, with the highest jarosite and pyrite concentrations at the center, goethite in the intermediate zones, and hematite at the outer edges (Rose and Burt, 1979; Sabins, 1987; Swayze and others, 2000). These minerals, as well as maghemite (γ–Fe
2O
3), and schwertmannite (Fe
8O
8(OH)
6SO
4), are read-
ily discriminated by their diagnostic crystal field absorptions arising from ferric iron in the 0.8- to 1.0-µm spectral region
(fig. 1). Very little maghemite and schwertmannite were identi-fied spectrally in the Animas River watershed. Because the hematite spectrum is strongly affected by grain size, it was possible to separate fine-grained nanocrystalline hematite from the coarser grained variety. These grain size differences may reflect the process of formation.
An additional suite of Fe2+-bearing minerals is widely distributed in the region. The Fe2+-bearing minerals are important in that they tend to differentiate weakly altered rock from intensely altered and pyritized rock. Field mapping within the study area demonstrates that propylitic to weak sericitic altered rocks (characterized by an illite-dominated spectral signature) typically map as Fe2+-bearing minerals in the 1-µm region. These occurrences of Fe2+-bearing minerals generally reflect oxidation of primary Fe-Ti oxide and other iron-bearing minerals. In contrast, more intensely altered rock of the quartz-sericite-pyrite assemblage (Bove and others, this volume), which may also map as illite-dominant in the 2.0- to 2.5-µm spectral region, was found to also contain Fe3+-bearing minerals such as goethite and jarosite. What is also of inter-est is that these materials, along with amorphous iron oxides, ferrihydrites (5Fe
2O
3•9H
2O), and amorphous iron hydroxides,
have been identified along stream reaches of the Animas River watershed and are believed to have precipitated from metal-rich acidic stream waters (Dalton and others, 2000; Church and others, 2000). However, because the precipitated mineral zones along streams tend to be small fractions of the AVIRIS pixel area, spectral identification of these precipitates is limited by their low relative contribution to the collected radiation field.
Plagioclase is a primary rock-forming mineral common in volcanic rocks, but it is difficult to detect spectrally because of its weak VNIR absorption features. Where identified spectrally, plagioclase has been mapped in the AVIRIS images; however, this identification should be considered tentative because of the weak absorption features and other uncertainties regarding spectral identification of this mineral. Plagioclase is much more prevalent than the images indicate, so its absence in the images should not be interpreted to mean that it is not pres-ent in the rocks. Rather, the spectral signature of plagioclase is easily overshadowed by that of other minerals. The images mapping the distribution of iron minerals also include epidote and some chlorite identified on the basis of 1-µm spectral com-parisons. These mineral identifications should be considered supplemental to the more complete mineral maps of the iron minerals derived from 2-µm spectra.
The Red Mountain area between Ouray and Silverton exhibits most of the salient features characteristic of the iron oxide minerals (fig. 6). The processed AVIRIS data in this image correspond to a portion of the 1:24,000-scale Ironton quadrangle (U.S. Geological Survey, 1955a). The northwest boundary of the Silverton caldera can be generally discerned from the concentration of mineralized zones about the primary hydrothermal alteration zones. Hematite is widely distributed along the ridges of Telluride Peak and Hayden Mountain (reds and oranges in fig. 6). These ridges are separated from Red Mountain by Ironton Park and Red Mountain Creek.
148 Environmental Effects of Historical Mining, Animas River Watershed, Colorado
Imaging Spectroscopy 149
Red Mountain Creek flows northward into the Uncompahgre River; it does not flow into the Animas River. Red Mountain is dominated by goethite (green), as well as some jarosite (dark blue) and hematite (center, fig. 6). These minerals are the products of pyrite weathering that generally defines the large zone of acid-sulfate alteration centered in the Red Mountains area (Bove and others, this volume). The facing
peaks of Telluride and Hayden Mountains are outside this zone of alteration and hence display different mineralogy arising from inherent changes in alteration intensity and pyrite concentration. Red Mountain and Cement Creeks are high-lighted by the presence of precipitated secondary iron oxide minerals along their banks (mainly goethite with some ferrihy-drite and amorphous iron hydroxides). This is the result of the
Figure 5. Map of Animas River watershed study area and vicinity, showing geographic features referenced in text. Rectangular outlines delineate borders of the AVIRIS data acquisition and specific regions discussed herein and covered in figures 6–9. The Silverton caldera is roughly outlined by Mineral Creek and the upper Animas River.
a
b
0
0 1
1 2 MILES
2 KILOMETERS
HazeltonMtn
TelluridePeak
CrystalLake
ProspectGulch
UncompahgreRiver
HaydenMtn
SultanMtn
KendallMtn
EurekaGulch
CalifMtn
OhioGulch
MolasLake
AndrewsLake
BrownMtn
IRONTONPARK
107º52'30" 107º45' 107º37'30" 107º30'38º00'
37º52'30"
37º45'
Telluride
SultaMtn
Andrerr wsLake
Sou
th
F
o rk
aMin
eral
Cre
ek
Middle Fork
GullchGladstone
AnimasForks
azeltontn
Cunnin
gha
m C
r
MolasLake
AndrewsLake
e
Mtn
Red
Mtn
Cr
CrystalLake
IRONTONPARK
UncompahgreRiver
IDARADOMINETAILINGS
Ouray 2.9 mi
KendallMtn
SultanMtn
HazeltonMtn
TelluridePeak
HaydenMtn Calif
Mtn
Red Mtn #
3 2 1
BrownMtn
OhioGulch
ProspectGulch
EurekaGulch

low pH and high dissolved metal concentrations in the streams draining the heavily mineralized Red Mountain area (Wright and others, this volume, Chapter E10). The location of the American tunnel (mine # 96, Church, Mast, and others, this volume, Chapter E5) along Cement Creek is also recogniz-able by its high concentration of iron-bearing minerals (lower right, fig. 6). The scattered workings of the Idarado mine are also apparent on the west side of Red Mountain. The primary
tailings sites of the Idarado mill complex along Red Mountain Creek (center near top of fig. 6), however, are not obvious because they have been buried and the surface planted with grass. Only a rim, spectrally dominated by goethite, surround-ing a noticeably homogeneous surface, hints at the presence of a covered mill tailings pile. Smaller prospects and tailings piles, in contrast, are revealed as exposures of jarosite and goethite dotting the surrounding mountains.
Figure 6. Red Mountain scene showing distributions of minerals having absorption features in the 1-µm spectral range in an acid-sulfate hydrothermal alteration zone within the Silverton caldera. Image coordinates are lat 37°50'40" to 37°57'40" N. and long 107°37'0" to 107°43'50" W. (box a, fig. 5).
Goethite
Jarosite
Chlorite
Nanocrystalline hematite
Hematite
Epidote
Maghemite
Schwertmannite
Fe -bearing minerals3+
Plagioclase feldspar
Fe -bearing minerals2+
Fe -bearing minerals2+
Fe -bearing minerals2+
Fe -bearing mineralswith hematite
2+
Amorphous and other iron oxides and hydroxides
Group 1 materialsIron oxides and
associated minerals
1 km
N
Idaradotailings
Americantunnel
150 Environmental Effects of Historical Mining, Animas River Watershed, Colorado

Imaging Spectroscopy 151
Clay, Mica, Carbonate, and Sulfate Minerals
Many of the minerals associated with hydrothermal alteration exhibit diagnostic vibrational absorption features in the 2-µm spectral range of the infrared spectrum. The altera-tion products and other minerals identified from this spectral range include the clay, mica, carbonate, and sulfate miner-als. As with the iron oxides, these minerals tend to occur in discrete assemblages that have characteristic zonation patterns
related to changes in temperature and chemistry of the associ-ated hydrothermal fluids (Rose and Burt, 1979; Sabins, 1987; Bove and others, this volume; Yager and others, 2000).
The clay minerals typically exhibit strong absorption fea-tures near 2.2 µm arising from vibrational absorptions related to the Al-OH structural bond (fig. 2). The fine structure within these absorption features arises from the specific structure and orientation of the molecules within the crystal lattice. As a result, minerals such as kaolinite (Al
2Si
2O
5(OH)
4), muscovite
Figure 7. Red Mountain scene (box a, fig. 5) showing distribution of minerals having absorption features in the 2-µm spectral range.
1 km
N
Group 2 materialsAlteration products
and associated minerals
Na-alunites
Intermediate alunites
K-alunites
Kaolinite and alunite
Alunite with pyrophyllite
Alunite with kaolinite and (or) sericiteAlunite with sericiteand (or) pyrophylliteSericite (illite)
Sericite and jarosite
Sericite and pyrophylliteSericite with calcite,epidote and (or) calcite
Calcite
Epidote
Na-montmorillonite
Ca-montmorillonite
Dickite
Kaolinite
Kaolinite and sericite
Kaolinite with smectites
Kaolinite with pyrophyllite
Pyrophyllite

(KAl2(Si
3Al)O
10(OH,F)
2) and halloysite (Al
2Si
2O
5(OH)
4)
can be separated from each other solely on the basis of their 2.2-µm absorption features. The wavelength center of the 2.2-µm absorption feature is slightly different for each min-eral; furthermore the shape and relative depth of the absorp-tion feature also vary. In kaolinite, for example, the absorption
feature separates into a doublet (two closely spaced reflectance minima, fig. 2) because of variations of composition and structure. A finer discrimination for muscovite is achieved by utilizing its weak 2.35-µm absorption as well. These differ-ences are exploited by the Tetracorder system to discriminate and map specific minerals.
Figure 8. Silverton scene showing distribution of minerals having absorption features in the 1-µm spectral range, along Mineral and Cement Creeks, and the Animas River. Image coordinates are lat 37°42'40" to 37°49'40" N. and long 107°37'55" to 107°44'05" W. (box b, fig. 5). Note that oval-shaped area near northeast corner of area in scene is large tailings pond composed mostly of material from the Sunnyside mine.
Goethite
Jarosite
Chlorite
Nanocrystalline hematite
Hematite
Epidote
Maghemite
Schwertmannite
Fe -bearing minerals3+
Plagioclase feldspar
Fe -bearing minerals2+
Fe -bearing minerals2+
Fe -bearing minerals2+
Fe -bearing mineralswith hematite
2+
Amorphous and other iron oxides and hydroxides
Group 1 materialsIron oxides and
associated minerals
1 km
N
152 Environmental Effects of Historical Mining, Animas River Watershed, Colorado
Imaging Spectroscopy 153
Figure 7 shows the distribution of minerals identified in the 2.0- to 2.5-µm spectral region in the Red Mountain area. Sulfide minerals in acid-sulfate systems are usually deposited in a breccia-hosted silicic zone dominated by sub-stantial quartz and smaller amounts of alunite and kaolinite (Luedke and Burbank, 1966; Fisher and Leedy, 1973; Bove and others, this volume). Sodium and potassium alunite may
be discriminated spectrally, and are given separate colors in figure 7. Beyond the silicic zone is usually a zone of argillic alteration, which hosts many clay minerals, including kaolin-ite, halloysite, dickite, and pyrophyllite along with minor alu-nite (Meyer and Hemley, 1967; Bove and others, this volume). Smectitic clays are commonly mapped on the periphery of these zones and grade outward into propylitic-altered zones,
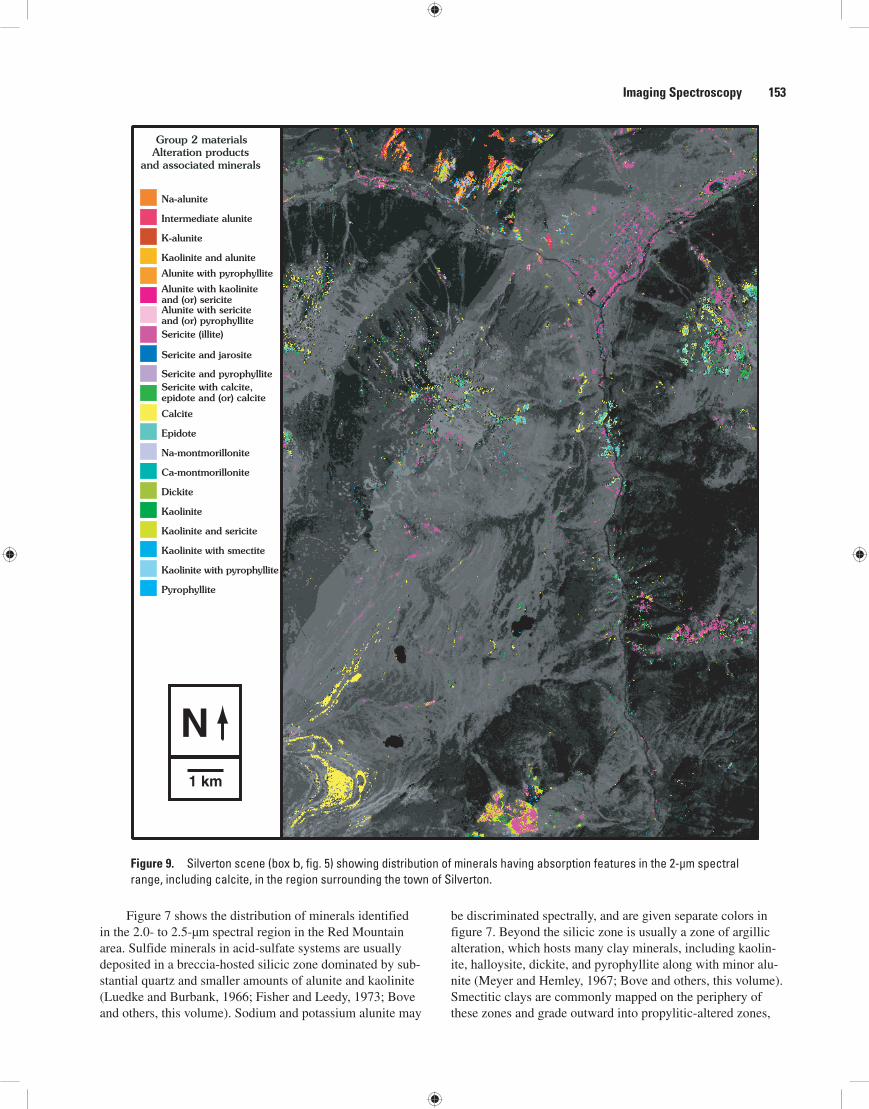
Figure 9. Silverton scene (box b, fig. 5) showing distribution of minerals having absorption features in the 2-µm spectral range, including calcite, in the region surrounding the town of Silverton.
1 km
N
Group 2 materialsAlteration products
and associated minerals
Na-alunite
Intermediate alunite
K-alunite
Kaolinite and alunite
Alunite with pyrophyllite
Alunite with kaolinite and (or) sericiteAlunite with sericiteand (or) pyrophylliteSericite (illite)
Sericite and jarosite
Sericite and pyrophylliteSericite with calcite,epidote and (or) calcite
Calcite
Epidote
Na-montmorillonite
Ca-montmorillonite
Dickite
Kaolinite
Kaolinite and sericite
Kaolinite with smectite
Kaolinite with pyrophyllite
Pyrophyllite

in which chlorite, epidote, and calcite are abundant. Micas such as illite (Eberl and others, 1987; Bove and others, 2000) or fine-grained muscovite are found in argillic, quartz-sericite-pyrite (QSP), and propylitic zones.
The term sericite is a general name used to describe highly birefringent, fine-grained mica in the vicinity of hydro-thermal mineral deposits (Eberl and others, 1987; Srodon and Eberl, 1984; Meyer and Hemley, 1967). This term has been loosely applied over time and can include muscovite (KAl
2(Si
2Al)O
10(OH,F)
2), paragonite (NaAl
2(Si
3Al)O
10(OH)
2),
and illite [(K,H3O)(Al,Mg,Fe)
2(Si,Al)
4O
10((OH)
2H
2O)]
(Fleischer and Mandarino, 1995). These minerals are all compositionally and structurally quite similar (Klein and Hurlbut, 1993), particularly with regard to the position of the hydroxyl components. As a result, their spectra are also very similar, especially in the 2-µm spectral range, which is most sensitive to hydroxyl vibrational transitions (Hunt and others, 1973; Hunt and Ashley, 1979). For example, muscovite (fig. 2) exhibits spectral behavior arising from hydroxyl at 2.20, 2.35, and 2.45 µm. The positions and relative strengths of these absorption features are very close to those in paragonite and illite (Hunt and Ashley, 1979; Clark, Swayze, Gallagher, and others, 1993). Virtually all of the mica encountered in the field during this study was determined by X-ray diffraction and geochemical analysis to be illite (Bove and others, 2000; Eberl and others, 1987). Hence, in this report the term sericite will be used in its general sense, with the understanding that illite is the most abundant form of mica in the region (Eberl and others, 1987).
As stated previously, the iron sulfate mineral jarosite is characterized by absorption features arising from both electronic (crystal field, ≈0.9 µm) and vibrational (Fe-OH, 2.27 µm) processes. As the Tetracorder system queries image spectra for these features independently, these minerals can be present on both types of materials maps. Discrepancies in the distributions of jarosite between the two maps exist because the 2.27-µm absorption of jarosite is often masked by Al-OH absorption features related to the phyllosilicates. In areas where few phyllosilicates are present, jarosite can be reliably mapped using the 2.27-µm absorption feature. Chlorite and epidote also are characterized by both types of absorption features, and can thus be on both mineral maps. Like jarosite, chlorite is most reliably identified using electronic absorp-tion features (0.6–1.0 µm), whereas epidote is more reliably mapped using the 2.25- and 2.33-µm vibrational features.
Whereas the Tetracorder method does not provide quantitative abundance estimates for mixtures of minerals, it can determine when one material is spectrally dominant. In figure 7, for example, “Kaolinite and alunite” is denoted by a light orange, whereas a darker orange is used for “Alunite with pyrophyllite.” In the former case, the kaolinite and alunite occur in roughly equivalent proportions, so the color is assigned to kaolinite and alunite, more or less equally. The term “Alunite with pyrophyllite” on the other hand implies that the dark-orange pixels are dominated by alunite, with lesser amounts of pyrophyllite. It is a subtle distinction, but one that requires a minimum of space on the figure and depicts
the subtle mineralogical changes in the hydrothermal altera-tion mineral assemblage. Similar logic applies to mixtures of three or more minerals. “Alunite with muscovite and (or) pyrophyllite” means that alunite is dominant, but either sericite or pyrophyllite, or both, may be present. Sorting out the rela-tive abundances of the minor components by remote sensing alone may prove intractable for some of these cases.
Calcite, Epidote, Chlorite, and SericiteThe minerals calcite (CaCO
3), epidote (Ca
2(Fe3+,Al)
3
(SiO4)
3(OH), and chlorite ((Mg,Fe2+)
5Al(Si
3Al)O
10(OH)
8) have
similarly shaped absorption features in the 2.2- to 2.4-µm spectral region arising from metal-OH vibrations. Because of calcite’s ability to neutralize acidic water resulting from the weathering of pyrite, distribution of calcite in the watershed is very important. Chlorite also has a slight to perhaps moder-ate acid-neutralizing potential (Desborough and others, 1998; Jambor and others, 2000), though it is an order of magnitude less effective than calcite. Limestone occurs throughout the sedimentary rocks outside the Silverton caldera. Some of this limestone was identified using AVIRIS data (Dalton and others, 1998). Calcite-bearing propylitic alteration zones containing abundant epidote and chlorite also occur within the caldera region and may be responsible for significant neutralization of acidic water (Bove and others, 2000; Dalton and others, 2000).
Progress in mapping the extent and composition of the propylitic zones was hampered by the spectral similarity of the diagnostic absorption features of calcite, epidote, and chlorite (Dalton and others, 1998, 2000, 2001; fig. 3). Although the pure end members may be readily distinguished using labora-tory spectra, the identical center positions of these absorption features make it difficult to correctly identify mixtures of these three minerals using AVIRIS data. The lower spectrum in figure 3 is from a rock, sample SJ98–74D. This sample is a fine-grained, propylitically altered igneous rock containing abundant epidote (approximately 45 percent) intimately mixed with about 7 percent calcite and 11 percent chlorite.
Where calcite, epidote, and chlorite occur together with sericite (illite), the 2.35-µm hydroxyl absorption feature in the sericite spectra (muscovite in fig. 2) interferes with the comparisons of the 2.34-µm absorption features of the calcite, chlorite, and epidote (fig. 3). However, the 2.20-µm absorp-tion feature in sericite is readily distinguished, and so pixels containing sericite in combination with calcite, epidote, or chlorite have been identified as such. Further interpretation of these spectra was not possible, but it might be accomplished by a detailed laboratory investigation of the type reported in Dalton and others (2001), focusing on the six minerals (cal-cite, epidote, chlorite, muscovite, paragonite, and illite) and combinations thereof, rather than just the first three minerals. Such a study would be valuable in extending the capabilities of remote sensing for characterization of hydrothermally altered rocks. Still, useful results have been obtained by classifying mixtures of these materials into categories, establishing a primary phase where possible.
154 Environmental Effects of Historical Mining, Animas River Watershed, Colorado

Imaging Spectroscopy 155
Acid-Generating and Acid-Neutralizing Mineral Assemblages
Whereas AVIRIS spectroscopy cannot directly mea-sure acidity of surface waters, it can reveal much about the surrounding minerals that affect and are affected by stream pH. Several minerals associated with acid-generating poten-tial are readily identified in the 1-µm spectral range. These include goethite, hematite, and jarosite, which are products of pyrite weathering and therefore indicative of acid-generating potential (Desborough and others, 2000; Williams and others, 2002). Other ferric iron-bearing minerals include schwertman-nite and ferrihydrite, which are deposited in waters having acidic to nearly neutral pH (Desborough and others, 2000). Minerals with acid-neutralizing potential are essentially limited to calcite and chlorite (Desborough and others, 1998; Bove and others, this volume) and are most easily detected by looking in the 2.0- to 2.5-µm spectral range. Such infor-mation contained in the preceding maps can be combined to determine the distributions of the acid-generating and acid-neutralizing mineral assemblages.
Figure 8 is a map of minerals identified in the 1-µm spec-tral region in the area around the town of Silverton, Colo. The image corresponds to a portion of the 1:24,000-scale Silverton quadrangle (U.S. Geological Survey, 1955b). The streets of Silverton can be seen outlined by different minerals identified from the AVIRIS data (upper right, fig. 8). The Animas River enters the scene from the upper right and flows south past the town, where it is joined first by Cement Creek, and then by Mineral Creek. Both creeks drain the Red Mountain area, and they consequently have low pH (≈3–3.7) and high dis-solved metal concentrations (Wright and others, this volume; Kimball and others, this volume, Chapter E9). Mineral Creek is indicated by the presence of goethite (green, fig. 8). The yellow pixels downstream from the confluence of Cement Creek in the Animas River indicate the presence of iron col-loids precipitated out of the stream following mixing with the more neutral water in the Animas River (Schemel and others, 2000; Church, Fey, and Unruh, this volume, Chapter E12). Note the dominance of jarosite and goethite in pixels mapped along the slopes of Anvil Mountain north of Mineral Creek at the top of the image (fig. 8, 1-µm scene). The slopes of Anvil Mountain along the north side of Mineral Creek also contain significant alunite, kaolinite, and pyrophyllite, which reflect the acid-sulfate alteration suite (fig. 9, 2-µm scene; Bove and others, this volume).
The corresponding map of minerals identified in the 2-µm spectral region (fig. 9) illustrates the relative abundance of cal-cite and chlorite, the two major minerals with significant acid-neutralizing potential in the Animas River basin. Rocks of the slopes of Kendall Mountain, directly southeast of the town of Silverton (upper right edge, fig. 9) are altered to the propylitic assemblage dominated by chlorite, epidote, and calcite, and were not influenced by the hydrothermal fluids that formed the acid-sulfate minerals on Anvil Mountain. The headwaters of the Animas River in our study region are also surrounded by
significant exposures of propylitically altered rock containing abundant calcite and chlorite, which together have a high acid-neutralizing potential (Desborough and Yager, 2000; Bove and others, this volume). The streambeds of Mineral and Cement Creeks are dominated by goethite and iron-bearing minerals, including amorphous iron oxides and hydroxides precipitated from the streams. As these two relatively acidic and metal-laden streams mix with the higher pH water of the Animas River, aluminum oxy-sulfates and Fe-oxy-hydroxides pre-cipitate, coating the rocks on the banks and in the streambed (Church, Fey, and Unruh, this volume). Another exposure of calcite-epidote-chlorite-altered rock is visible just downstream of Silverton (fig. 9). Farther downstream, the Animas River flows out of the Silverton and San Juan calderas through a sequence of sedimentary rocks in the Pennsylvanian Hermosa Formation that contain limestone. This sequence of bed-ded, carbonate-rich rocks, which spectrally map as calcite, manifests as parallel bands (colored yellow, lower left corner, fig. 9). The streams that pass through the Lime Creek subbasin contribute significant acid-neutralizing potential to the water-shed and reduce metal toxicity of dissolved metals (Besser and Brumbaugh, this volume, Chapter E18; Besser and others, this volume, Chapter D).
Sources of Acidic Drainage
Because vegetation obscures much of the mineralogy of the San Juan Mountains, the detailed hydrothermal alteration mineral assemblage map must be developed using field map-ping and geologic interpretation (Bove and others, 2000; Bove and others, this volume). Within the Animas River watershed study area, the most heavily mineralized zones are associated with the greatest production of acidic runoff (Mast and others, this volume; Bove and others, this volume) and are delineated by the presence of ferricrete deposits (Verplanck and oth-ers, this volume, Chapter E15; Wirt and others, this volume, Chapter E17; Yager and Bove, this volume, pl. 2). This applies equally to mined and unmined regions. Such localities are typically marked by an abundance of jarosite in the mapped pixels, and are so acidic that very little vegetation is present in these areas, simplifying the task of determining their distribu-tion. Tailings piles associated with mines, mills, and prospects (Church, Mast, and others, this volume) and pervasively altered areas such as those at Red Mountain, peak 3,792 m (Yager and others, 2000), Ohio Peak and Anvil Mountain, and elsewhere (Bove and others, this volume) are readily identified and mapped using the AVIRIS imagery (Dalton and others, 2001) on the basis of the 1-µm spectral characteris-tics described herein. Percolation of rainwater and snowmelt through finely divided metal-rich mill tailings or mountains perforated with mine workings produces acidic drainage. Naturally mineralized areas with zones of pervasive pyrite also create significant acidic runoff (Fey and others, 2000; Nash and Fey, this volume, Chapter E6; Mast and others, this volume; Bove and others, this volume).

Summary and ConclusionsThe mineral maps shown in figures 6 through 9 cor-
respond to only a small portion of the complete AVIRIS coverage (fig. 4). Comprehensive treatment of the full study area and scope is presented in Dalton and others (2005). The AVIRIS data set covers all portions of the Animas River watershed that lie within the Silverton caldera (fig. 2), and most of the significant sources of acidic and metal-bearing waters. The primary assemblages of minerals associated with acid-generating potential have been mapped and field-checked in the watershed. Because the soil is highly acidified in the presence of these minerals, interference from encroaching vegetation is minimized. The distributions of the primary acid-neutralizing minerals calcite and chlorite have also been deter-mined, including calcite in limestone south of the Silverton caldera. These results will be useful for approximating the levels of acid-generating and acid-neutralizing potential within the watershed.
Primary areas of acid-generating potential within the watershed are concentrated within the Silverton caldera. The full AVIRIS image mosaics (Dalton and others, 2005) show these in detail and were used in the compilation of the hydro-thermal alteration maps (Bove and others, this volume). Pro-pylitic alteration dominates much of the exposed rock on the east side of the Silverton caldera, as indicated by the calcite-epidote-chlorite assemblage, and provides acid-neutralizing potential. In the Red Mountain and Ohio Peak-Anvil Mountain areas, acid-sulfate alteration assemblages maintain the pH of Mineral and Cement Creeks at values < 4.5; likewise, the quartz-sericite-pyrite alteration assemblage at peak 3,792 m also contributes water having a low pH and high dissolved metal loads (Mast and others, this volume; Kimball and others, this volume; Wright and others, this volume). Similar results hold for smaller deposits elsewhere. The upper Animas River, upstream from Silverton to Eureka Gulch, drains a basin con-taining far more propylitically altered rocks with substantial acid-neutralizing potential (Dalton and others, 2000, 2005), which is one of the major reasons that the upper Animas River has a near-neutral pH (>6.5). Small tailings piles, adits, and prospects dot these slopes (Church, Mast, and others, this volume); in addition, barren scarps of pervasively altered and pyritized rock are present. However, the presence of areas of propylitically altered rock in this basin helps to mitigate the effects of the acid-generating minerals. South of Silverton, outside the caldera margins, areas containing acid-generating minerals are nearly absent, whereas sedimentary limestone is abundant. As a result, these tributaries of the Animas River have near-neutral pH and contain low concentrations of dis-solved metals. In contrast, pH of the Animas River is also near neutral, yet it still carries substantial metal loads (Kimball and others, this volume) from drainages upstream.
The field of imaging spectroscopy is now established as a practical and comprehensive approach (King and others, 2000; Swayze and others, 2000) to the study of acidic mine drainage.
New digital remote sensing methods enable the characteriza-tion and mapping of mineral suites over a large study area at relatively low cost, which is critical to the watershed approach needed to deal in a cost-effective manner with the environmen-tal effects of historical mining.
The interplay of acid-generating and acid-neutralizing mineral assemblages affects the geochemistry of surface and ground water throughout the Animas River watershed. Using imaging spectroscopy, scientists can map the distributions of mineral suites and use them to make informed decisions regarding acid rock drainage and associated remediation efforts. As expected, the most significant production of acidic surface waters originates within the most pervasively altered and pyritized portions of the watershed. These are the regions approximately bounded by the Animas River, Mineral Creek, and Red Mountain Creek, and containing Animas Forks, the Red Mountains, Anvil Mountain, and peak 3,792 m. Com-panion studies by the USGS, some of which are presented in this volume, suggest that acidity within reaches downstream of these areas may be more influenced by weathering of these hydrothermally altered rocks than by discharge from mining and exploration activity (Wirt and others, 2001; Mast and oth-ers, this volume; Kimball and others, this volume; Walton-Day and others, this volume, Chapter E24). Areas dominated by propylitic alteration and containing only small percentages of pyritized rock are important in neutralizing acidic rock drain-age in surrounding streams (Bove and others, this volume; Mast and others, this volume). The AVIRIS results provide an important component useful in mapping the distributions of hydrothermal alteration mineral assemblages, and the deter-mination of their relative contributions to the chemistry of the Animas River watershed.
Selected References
Bevington, P.R., 1992, Data reduction and error analysis for the physical sciences, Second Edition: New York, McGraw-Hill, 328 p.
Bookstein, F.L., 1989, Principal warps—Thin-plate splines and the decomposition of deformations: IEEE Transac-tions on Pattern Analysis and Machine Intelligence, v. 11, p. 567–585.
Bove, D.J., Mast, M.A., Wright, W.G., Meeker, G.P., Yager, D.B., and Verplanck, P.L., 2000, Geologic control on acidic and metal-rich waters in the southeast Red Mountain area, near Silverton, Colorado, in ICARD 2000; Proceedings of the Fifth International Conference on Acid Rock Drainage, Volume 1: Society for Mining, Metallurgy, and Exploration, Inc., p. 523–533.
156 Environmental Effects of Historical Mining, Animas River Watershed, Colorado

Imaging Spectroscopy 157
Bove, D.J., Hon, Ken, Budding, K.E., Slack, J.F., Snee, L.W., and Yeoman, R.A., 2001, Geochronology and geology of late Oligocene through Miocene volcanism and min-eralization in the western San Juan Mountains, Colorado: U.S. Geological Survey Professional Paper 1642, 30 p.
Burns, R., 1993, Mineralogical applications of crystal field theory, Second Edition: Cambridge University Press, 551 p.
Church, S.E., Kimball, B.A., Fey, D.L., Ferderer, D.A., Yager, T.J., and Vaughn, R.B., 1997, Source, transport, and partitioning of metals between water, colloids, and bed sediments of the Animas River, Colorado: U.S. Geological Survey Open-File Report 97–151, 136 p.
Church, S.E., Fey, D.L., and Blair, Robert, 2000, Pre-mining bed sediment geochemical baseline in the Animas River Watershed, southwestern Colorado, in ICARD 2000; Proceedings of the Fifth International Conference on Acid Rock Drainage, Volume 1: Society for Mining, Metallurgy, and Exploration, Inc., p. 499–512.
Clark, R.N., 1999, Spectroscopy of rocks and minerals, and principles of spectroscopy, in Rencz, A.N., ed., Manual of remote sensing, Third Edition, Volume 3, Remote sens-ing for the earth sciences: New York, John Wiley, 741 p.
Clark, R.N., Gallagher, A.J., and Swayze, G.A.S., 1990, Mate-rial absorption band depth mapping of imaging spectrometer data using a complete band shape least-squares fit with library reference spectra, in Proceedings of the 2nd Airborne Visible / Infrared Imaging Spectrometer (AVIRIS) Work-shop: Pasadena, Calif., JPL Publication 90–54, Jet Propul-sion Laboratory, p. 176–186.
Clark, R.N., and Roush, T.L., 1984, Reflectance spectroscopy—Quantitative analysis techniques for remote sensing applica-tions: Journal of Geophysical Research, v. 89, p. 6329–6340.
Clark, R.N., and Swayze, G.A.S., 1995, Mapping minerals, amorphous materials, environmental materials, vegeta-tion, water, ice and snow, and other materials—The USGS Tricorder algorithm, in Summaries of the 5th Annual JPL Airborne Earth Science Workshop: Pasadena, Calif., JPL Publication 95–1, Jet Propulsion Laboratory, p. 9–40.
Clark, R.N., Swayze, G.A.S., and Gallagher, A., 1993, Map-ping materials with imaging spectroscopy: U.S. Geologi-cal Survey Office of Mineral Resources Bulletin 2039, p. 141–150.
Clark, R.N., Swayze, G.A.S., Gallagher, A.J., Gorelick, N., and Kruse, F., 1991, Mapping with imaging spectrometer data using the complete band shape least-squares algo-rithm simultaneously fit to multiple spectral features from multiple materials, in Proceedings of the 3rd Airborne Visible / Infrared Imaging Spectrometer (AVIRIS) Work-shop: Pasadena, Calif., JPL Publication 91–28, Jet Propul-sion Laboratory, p. 2–3.
Clark, R.N., Swayze, G.A.S., Gallagher, A.J., King, T.V.V., and Calvin, W.M., 1993, The U.S. Geological Survey Digi-tal Spectral Library; Version 1, 0.2 to 3.0 µm: U.S. Geologi-cal Survey Open-File Report 93–592, 1,340 p., available at URL http://speclab.cr.usgs.gov
Clark, R.N., Swayze, G.A.S., Heidebrecht, K.B., Goetz, A.F.H., and Green, R.O., 1993, Comparison of methods for calibrating AVIRIS data to ground reflectance, Summaries of the 4th Annual JPL Airborne Geosciences Workshop—Volume 1, AVIRIS Workshop: Pasadena, Calif., JPL Publi-cation 93–26, Jet Propulsion Laboratory, p. 31–34.
Clark, R.N., Swayze, G.A.S., Livo, K.E., Kokaly, R.F., King, T.V.V., Dalton, J.B., Vance, J.S., Rockwell, B.W., Hoefen, T., and McDougal, R.R., 2002, Surface reflectance calibra-tion of terrestrial imaging spectroscopy data—A tutorial using AVIRIS: Proceedings of the 11th JPL Airborne Earth Science Workshop, JPL Publication 03–4, p. 43–63.
Clark, R.N., Swayze, G.A.S., Livo, K.E., Kokaly, R.F., Sutley, S.J., Dalton, J.B., McDougal, R.R., and Gent, C.A., 2003, Imaging spectroscopy—Earth and planetary remote sensing with the USGS Tetracorder and Expert Systems: Journal of Geophysical Research, v. 108 (E12), no. 5,131, p. 5–1 to 5–44.
Dalton, J.B., 2000, Constraints on the surface composition of Jupiter’s moon Europa based on laboratory and spacecraft data: Boulder, Colo., University of Colorado Ph. D. disser-tation, 253 p.
Dalton, J.B., Bove, D.J., and Mladinich, C.S., 2005, Remote sensing characterization of the Animas River watershed, southwestern Colorado, by AVIRIS imaging spectroscopy: U.S. Geological Survey Scientific Investigations Report 2004–5203, 49 p.
Dalton, J.B., Bove, D.J., Mladinich, C.S., Clark, R.N., Rockwell, B.W., Swayze, G.A.S., King, T.V.V., and Church, S.E., 2001, Spectral classification of similar materials using the USGS Tetracorder algorithm—The calcite-epidote-chlorite problem, in Green, R.O., ed., Summaries of the 10th Annual JPL Airborne Earth Science Workshop: Pasa-dena, Calif., JPL Publication 02–1, Jet Propulsion Labora-tory, p. 93–103.

Dalton, J.B., King, T.V.V., Bove, D.J., Kokaly, R.F., Clark, R.N., Vance, J.S., and Swayze, G.A.S., 1998, Mapping of acid-generating and acid-buffering minerals in the Animas watershed by AVIRIS spectroscopy, in Green, R.O., ed., Summaries of the 7th Annual JPL Airborne Earth Science Workshop: Pasadena, Calif., JPL Publication 97–21, Jet Propulsion Laboratory, p. 79–83.
Dalton, J.B., King, T.V.V., Bove, D.J., Kokaly, R.F., Clark, R.N., Vance, J.S., and Swayze, G.A.S., 2000, Distribution of acid-generating and acid-buffering minerals in the Animas River watershed by AVIRIS spectroscopy, in ICARD 2000; Proceedings of the Fifth International Conference on Acid Rock Drainage, Volume 2: Society for Mining, Metallurgy, and Exploration, Inc., p. 1541–1550.
Desborough, G.A., Briggs, P.H., and Mazza, Nilah, 1998, Chemical and mineralogical characteristics and acid-neutralizing potential of fresh and altered rocks and soils of the Boulder River Headwaters in Basin and Cataract Creeks of northern Jefferson County, Montana: U.S. Geological Survey Open-File Report 98–40, 21 p.
Desborough, G.A., Leinz, R.W., Sutley, S.J., Briggs, P.H., Swayze, G.A.S., Smith, K.S., and Breit, G.N., 2000, Leach-ing studies of schwertmannite-rich precipitates from the Animas River headwaters, Colorado and Boulder River headwaters, Montana: U.S. Geological Survey Open-File Report 00–0004, 16 p.
Desborough, G.A., and Yager, D.B., 2000, Acid-neutralizing potential of igneous bedrocks in the Animas River headwaters, San Juan County, Colorado: U.S. Geological Survey Open-File Report 00–165, 14 p.
Eberl, D.D., Srodon, J., Lee, M., Nadeau, P.H., and Northrup, H.R., 1987, Sericite from the Silverton caldera, Colorado—Correlation among structure, composition, origin and par-ticle thickness: American Mineralogist, v. 72, p. 914–934.
Ehlers, M., 1994, Geometric registration of airborne scanner data using multiquadric interpolation techniques, in Pro-ceedings of the First International Airborne Remote Sensing Conference and Exhibition, Strasbourg: Ann Arbor, Mich., Environmental Research Institute of Michigan, p. 492–502.
Ehlers, M., and Fogel, D.N., 1994, High-precision geomet-ric correction of airborne remote sensing revisited—The multiquadric interpolation, in Proceedings of the Interna-tional Society for Optical Engineering Conference; Image and Signal Processing for Remote Sensing, Rome, Italy, Sept. 26–30, 1994: Rome, International Society for Optical Engineering, v. 2315, p. 814–824.
Fey, D.L., Desborough, G.A., and Church, S.E., 2000, Com-parison of two leach procedures applied to metal-mining related wastes in Colorado and Montana and a relative ranking method for mine wastes, in ICARD 2000; Proceed-ings of the Fifth International Conference on Acid Rock Drainage, Volume 2: Society for Mining, Metallurgy, and Exploration, Inc., p. 1477–1487.
Fisher, F.S., and Leedy, W.P., 1973, Geochemical character-istics of mineralized breccia pipes in the Red Mountain district, San Juan Mountains, Colorado: U.S. Geological Survey Bulletin 1381, 43 p.
Fleischer, Michael, and Mandarino, J.A., 1995, Glossary of mineral species, Seventh Edition: Tucson, Ariz., Mineral-ogical Record, 280 p.
Green, R.O., Vane, G., and Conel, J.E., 1988, Determination of in-flight AVIRIS spectral, radiometric, spatial and signal-to-noise characteristics using atmospheric and surface measurements from the vicinity of the rare-earth bearing carbonatite at Mountain Pass, California, in Vane, G., ed., Proceedings of the Airborne Visible / Infrared Imaging Spectrometer Performance Evaluation Workshop: Pasadena, Calif., JPL Publication 88–38, Jet Propulsion Laboratory, p. 162–185.
Green, R.O., Pavri, B., Faust, J., Williams, O., and Chavoit, C., 1998, Inflight validation of AVIRIS Calibration in 1996 and 1997, in Summaries of the Seventh JPL Airborne Earth Sci-ence Workshop: Pasadena, Calif., JPL Publication 97–21, Jet Propulsion Laboratory, p. 193–203.
Hapke, B., 1981, Bidirectional reflectance spectroscopy—1, Theory: Journal of Geophysical Research, v. 86, p. 3039–3054.
Hapke, B., 1993, Theory of reflectance and emittance spec-troscopy: Cambridge, Mass., Cambridge University Press, 455 p.
Haykin, S., 1999, Neural networks—A comprehensive foun-dation, Second Edition: Upper Saddle River, N.J., Prentice-Hall, 842 p.
Herzberg, G., 1989, Molecular spectra and molecular struc-ture—I, Spectra of diatomic molecules: Malabar, Fla., Krieger, 660 p.
Herzberg, G., 1991a, Molecular spectra and molecular structure—II, Infrared and raman spectra of polyatomic molecules: Malabar, Fla., Krieger, 636 p.
Herzberg, G., 1991b, Molecular spectra and molecular structure—III, Electronic spectra and electronic structure of polyatomic molecules: Malabar, Fla., Krieger, 757 p.
Hunt, G.R., 1977, Spectral signatures of particulate miner-als, in the visible and near-infrared: Geophysics, v. 42, p. 501–513.
158 Environmental Effects of Historical Mining, Animas River Watershed, Colorado

Imaging Spectroscopy 159
Hunt, G.R., and Ashley, R.P., 1979, Spectra of altered rocks in the visible and near-infrared: Economic Geology, v. 74, p. 1613–1629.
Hunt, G.R., Salisbury, J.W., and Lenhoff, C.J., 1973, Vis-ible and near-infrared spectra of minerals and rocks—VII, Acidic igneous rocks: Modern Geology, v. 4, p. 217–224.
Jambor, J.L, Dutrizac, J.E., and Chen, T.T., 2000, Contribution of specific minerals to the neutralization potential in static tests, in ICARD 2000; Proceedings of the Fith International Conference on Acid Rock Drainage, Volume 1: Society for Mining, Metallurgy, and Exploration, Inc., p. 551–565.
Klein, C., and Hurlbut, C.S., 1993, Manual of mineralogy, Twenty-first Edition: New York, John Wiley, 682 p.
King, T.V.V., Clark, R.N., and Swayze, G.A., 2000, Applica-tions of imaging spectroscopy data—A case study at Sum-mitville, Colorado, in Kuehn, F., King, T., Hoerig, B., and Pieters, D., eds., Remote sensing for site characterization: Berlin, Springer, p. 164–185.
Luedke, R.G., and Burbank, W.S., 1966, Volcanism in the western San Juan Mountains, Colorado: Bulletin of Volca-nology, v. 29, p. 345–346.
Meyer, C., and Hemley, J.J., 1967, Wall rock alteration, in Barnes, H.L., ed., Geochemistry of hydrothermal ore depos-its: New York, Holt, Rinehart and Winston, p. 166–235.
Mustard, J.F., and Sunshine, J.M., 1999, Spectral analysis for earth science—Investigations using remote sensing data, in Rencz, A.N., ed., Remote sensing for the earth sciences—Manual of remote sensing: New York, John Wiley, p. 251–306.
Porter, W.M., and Enmark, H.T., 1987, System overview of the Airborne Visible / Infrared Imaging Spectrometer (AVIRIS), in Vane, G., ed., Imaging spectroscopy II, Volume 834: Bellingham, Wash., International Society for Optical Engi-neering, p. 22–31.
Rose, A.W., and Burt, D.M., 1979, Hydrothermal alteration, in Barnes, H.L., ed., Geochemistry of hydrothermal ore depos-its, Second Edition: New York, John Wiley, 798 p.
Sabins, F.F., 1987, Remote sensing principles and interpreta-tion: New York, Freeman and Co., 449 p.
Schemel, L.E., Kimball, B.A., and Bencala, B.A., 2000, Col-loid formation and transport of aluminum and iron in the Animas River near Silverton, Colorado: Applied Geochem-istry, v. 15, p. 1003–1018.
Srodon, J., and Eberl, D.D., 1984, Illite: Reviews in Mineral-ogy, v. 13, p. 495–544.
Swayze, G.A.S., Smith, K.S., Clark, R.N., and Sutley, S.J., 2000, Imaging spectroscopy—A new screening tool for mapping acidic mine waste, in ICARD 2000; Proceedings of the Fifth International Conference on Acid Rock Drain-age, Volume 2: Society for Mining, Metallurgy, and Explo-ration, Inc., p. 1531–1540.
U.S. Geological Survey, 1955a, Ironton quadrangle topo-graphic map: U.S. Geological Survey, scale 1:24,000.
U.S. Geological Survey, 1955b, Silverton quadrangle topo-graphic map: U.S. Geological Survey, scale 1:24,000.
Wiemker, Rafael, Rohr, K., Binder, L., Srengel, R., and Stiehl, H.S., 1996, Application of elastic registration to imagery from airborne scanners, in Proceedings of the 18th Con-gress of the International Society for Photogrammetry and Remote Sensing: Vienna, International Archives of Photo-grammetry and Remote Sensing, v. 31 (part B4), ISPRS, p. 949–954.
Williams, D.J., Bigham, J.M., Cravotta III, C.A., Traina, S.J., Anderson, J.E., and Lyon, J.G., 2002, Assessing mine drain-age pH from the color and spectral reflectance of chemical precipitates: Applied Geochemistry, v. 17, p. 1273–1286.
Wirt, Laurie, Leib, K.J., Melick, R., and Bove, D.J., 2001, Metal loading assessment of a small mountainous sub-basin characterized by acid drainage; Prospect Gulch, upper Animas River watershed, Colorado: U.S. Geological Survey Open-File Report 01–0258, 36 p.
Yager, D.B., Mast, M.A., Verplanck, P.L., Bove, D.J., Wright, W.G., and Hageman, P.L., Natural versus mining-related water quality degradation to tributaries draining Mount Moly, Silverton, Colorado, in ICARD 2000; Proceedings of the Fifth International Conference on Acid Rock Drainage, Volume 1: Society for Mining, Metallurgy, and Exploration, Inc., p. 535–550.