Embed Size (px)
Citation preview

Imaging the State-Specific Vibrational Predissociation of the Ammonia-WaterHydrogen-Bonded Dimer
Andrew K. Mollner, Blithe E. Casterline, Lee C. Ch’ng, and Hanna Reisler*Department of Chemistry, UniVersity of Southern California, Los Angeles, California 90089-0482
ReceiVed: May 15, 2009; ReVised Manuscript ReceiVed: August 7, 2009
The state-to-state vibrational predissociation (VP) dynamics of the hydrogen-bonded ammonia-water dimerwere studied following excitation of the bound OH stretch. Velocity-map imaging (VMI) and resonance-enhanced multiphoton ionization (REMPI) were used to determine pair-correlated product energy distributions.Following vibrational excitation of the bound OH stretch fundamental, ammonia fragments were detected by2 + 1 REMPI via the B̃1E′′ r X̃1A1′ transition. The REMPI spectra show that NH3 is produced with one andtwo quanta of the symmetric bend (ν2 umbrella mode) excitation, as well as in the ground vibrational state.Each band is quite congested, indicating population in a large number of rotational states. The fragments’center-of-mass (c.m.) translational energy distributions were determined from images of selected rotationallevels of ammonia with zero, one, or two quanta in ν2 and were converted to rotational state distributions ofthe water cofragment. All the distributions could be fit well by using a dimer dissociation energy of D0 )1538 ( 10 cm-1. The rotational state distributions in the water cofragment pair-correlated with specificrovibrational states of ammonia are broad and include all the JKaKc states allowed by energy conservation.The rotational populations increase with decreasing c.m. translational energy. There is no evidence for ammoniaproducts with significant excitation of the asymmetric bend (ν4) or water products with bend (ν2) excitation.The results show that only restricted pathways lead to predissociation, and these do not always give rise tothe smallest possible translational energy release, as favored by momentum gap models.
1. Introduction
Understanding the nature, strength, and dynamics of hydrogenbonds has been a goal of physical chemistry research in thepast century. Hydrogen bonding is critical to a wide range ofchemical systems, from gas-phase dimers to condensed phasesystems and complex biological molecules. In the gas phase,emphasis has been placed on studying hydrogen-bonded dimersin the cold environment of supersonic expansions. Experimentsproviding detailed state-specific information on the vibrationalpredissociation (VP) of hydrogen-bonded complexes primarilypertain to smaller hydrogen-bonded dimers containing at leastone diatomic subunit such as a hydrogen halide.1,2 In thesesystems, the disparity between the frequencies of the intramo-lecular and intermolecular vibrational modes causes energytransfer in the complex to be inefficient, leading to nonstatisticalpredissociation. For the predissociation of dimers containing twopolyatomic molecules, state-specific information on energydisposal is scarce. The existence of low-frequency intramolecularvibrational modes in polyatomics may facilitate energy transferin their complexes and lead to quite different predissociationbehavior. Detailed studies of the predissociation of polyatomichydrogen-bonded dimers are therefore critical for extending ourunderstanding of hydrogen bonding to larger systems.
One such hydrogen-bonded dimer involving two polyatomicmolecules that has been of considerable interest is that ofammonia and water (NH3-H2O). Mixtures of ammonia andwater are important in a vast array of chemical fields, includingindustrial chemistry as a refrigerant,3 in chemical evolutionstudies,4 as a component of the surfaces of Neptune and Uranus,5
in atmospheric chemistry,6 and astrochemistry.7-11 NH3-H2O
represents also the simplest system containing the O-H · · ·Nhydrogen bonds ubiquitous in biological molecules. In fact, thiswas one of the earliest recognized hydrogen bonds, documentedby Moore and Winmill in 1912 when studying the acidity ofamines in aqueous solution.12 As a result of its importance,NH3-H2O has been the subject of numerous theoretical13-24
and experimental studies.25-32
The structure of NH3-H2O has been extensively studied bothexperimentally and theoretically. As shown in Figure 1, theequilibrium structure of the dimer has a slightly bent hydrogenbond (∠NHO ≈ 170°), with the water acting as hydrogen-bonddonor to the nitrogen of ammonia and the free hydrogen of waterin a trans position relative to the ammonia hydrogens. The mostdetailed structural study is the spectroscopic work of Stockmanet al.32 They found two structures that were consistent with thedata, differing primarily in the angle between the C3V axis anda-axis of the dimer (θN). On the basis of the available ab initiocalculations at the time, the authors preferred the structure withthe smaller value of θN (Stockman et al. structure a). Moresophisticated calculations performed later have shown that thelarger value of θN ) 23.1° (Stockman et al. structure b) is likelythe true equilibrium structure.18 Although Figure 1 represents
* To whom correspondence should be addressed. E-mail: [email protected]: 213-740-7071. Fax: 213-740-3972.
Figure 1. Equilibrium geometry of the ammonia-water dimer (ref.32). R(N-O) ) 2.989 Å; θN ) 23.1°; θO ) 49.8°.
J. Phys. Chem. A 2009, 113, 10174–1018310174
10.1021/jp904566w CCC: $40.75 2009 American Chemical SocietyPublished on Web 08/28/2009

the lowest-energy equilibrium structure, NH3-H2O is far fromrigid. The NH3 monomer is nearly free to rotate, with therotation barrier through the cis configuration estimated to be10.5 cm-1 spectroscopically32 and calculations giving 0.1-2.2cm-1.19,20 Exchange of the water hydrogens is also possible,but the barrier (700-1300 cm-1) and minimum-energy pathwayare less well-established.19,32
The infrared (IR) spectrum of NH3-H2O was first measuredin low-temperature matrixes.25-27 The most prominent featureof these spectra was the large red-shift of about 300 cm-1 forthe bound OH stretch frequency relative to that of the monomer.The observed frequency of the bound OH stretch ranged from3412 to 3456 cm-1 depending upon the nature of the matrix.More recently, the infrared spectrum of NH3-H2O was inves-tigated in He droplets,28 where perturbations by He are minimal.The observed bound OH stretch frequency of 3480 cm-1 shouldtherefore be close to the expected gas-phase value. Ab initiocalculations confirm that the dominant change in monomerfrequencies upon complexation is the red-shift of the bound OHstretch (shift ≈ -200 cm-1), with smaller blue-shifts of theammonia bend (shift ≈ 50 cm-1) and water bend (shift ≈ 40cm-1), whereas all other intramolecular modes are only slightlyperturbed.18,20 In addition, four intermolecular modes below200 cm-1 have been calculated: the intermolecular stretch (199cm-1), NH3 wag (166 and 175 cm-1), and NH3 torsion (19cm-1).20
Despite the large amount of interest in NH3-H2O, there hasbeen no experimental determination of the strength of itshydrogen bond. The large red-shift of the bound OH stretchindicates that the hydrogen bond is relatively strong. Fraser andSuenram29 observed that the dimer does not dissociate uponexcitation of the NH3 symmetric bend (ν2 umbrella mode),indicating that the dissociation energy is greater than 1021 cm-1.There have been a number of ab initio calculations of the bindingenergy, with quite good agreement among recent calculations.18-20
Sadlej et al. calculated the energy (using MP2/AVQZ theory/basis) at the optimized geometry (MP2/AVTZ) with zero-pointvibrational energy corrections (MP2/AVTZ). Their best estimateof D0 was 4.149 kcal mol-1 (1451 cm-1). Lane et al. reporteda binding energy calculated with the CCSD(T)/AVQZ theory/basis including zero-point vibrational energy correction (CCSD(T)/AVTZ) to yield a best estimate of D0 ) 4.20 kcal mol-1 (1470cm-1).
In our previous studies of VP at the pair-correlated level forthe hydrogen-bonded dimers H(D)Cl-acetylene and NH3
-acetylene we have exploited the imaging technique.33-35 Bothdimers provided clear evidence for state-specific VP dynamics.In particular, for the NH3-acetylene dimer products were onlyobserved with vibrational excitation in specific modes. Allammonia products observed had some excitation of ν2 with themain predissociation channel being NH3(1ν2) + C2H2(2ν4 or1ν4 + 1ν5) where ν4 and ν5 are bending modes. There are twomain differences between the hydrogen bonds in NH3-acetyleneand NH3-H2O: (i) whereas the NH3-acetylene hydrogen bondis linear, the NH3-H2O hydrogen bond is slightly bent, and(ii) the hydrogen bond in NH3-H2O is expected to besignificantly stronger than that in NH3-acetylene (900 ( 10cm-1)34 due to the stronger acidity of water. A primarymotivation for the experiments described here was to determinehow these differences affect energy flow patterns and the VPmechanism.
In this paper, we report the first VP study of NH3-H2O.Complexes were formed in a pulsed molecular beam and thebound OH stretch was excited by a pulsed IR laser to induce
vibrational predissociation. Resonance-enhanced multiphotonionization (REMPI) was used to detect the ammonia fragments.We used the ammonia REMPI spectrum to determine ammoniastate distributions and velocity-map imaging (VMI) to obtainenergy distributions of water fragments pair-correlated withspecific rovibrational states of ammonia. The observed statedistributions were less state-specific than those observed previ-ously in NH3-acetylene, with population observed in allenergetically accessible NH3 ν2 levels, as well as its groundvibrational state. However, other levels that are energeticallyallowed and give rise to low translational energy release, namely,the asymmetric ammonia bend and the water bend, have onlya little, if any, population. A detailed analysis of pair-correlatedstate distributions was complicated by the highly congestedammonia REMPI spectrum and the large number of waterrotational states available. Nevertheless, several general trendsemerged, and the dimer’s dissociation energy was determinedto be D0 ) 1538 ( 10 cm-1.
2. Experimental Details
Vibrational predissociation of NH3-H2O formed in a pulsedsupersonic molecular beam was studied following pulsed IRlaser excitation. Rotationally excited NH3 fragments wereionized by 2 + 1 REMPI and detected by time-of-flight (TOF)mass spectroscopy and VMI. The experimental procedures weresimilar to those used in our studies of HCl-acetylene andNH3-acetylene.33,34
The dimers were formed in a pulsed supersonic molecularbeam by expanding a mixture of 0.75% water and 1.5%ammonia (Matheson, anhydrous 99.99%) in He (Gilmore,99.9999%) at a stagnation pressure of ∼1.5 atm through the0.5 mm orifice of a pulsed valve (150 µs opening time) operatingat 10 Hz. Samples were prepared by transferring water byvacuum distillation to an evacuated bulb followed by addinggaseous ammonia. The concentrations were optimized tominimize contamination from larger clusters of ammonia andammonia-water. Dimer formation was not found to be criticallydependent on gas concentrations or backing pressure; however,contributions from larger clusters increased dramatically athigher gas concentrations (see below). The skimmed molecularbeam was intersected at right angles by two counterpropagatinglaser beams in the interaction region.
Unfocused IR laser radiation (∼5 mJ/pulse) was used to excitethe bound OH stretch of the dimer (3485 cm-1), and focused(focal length ) 40 cm) frequency-doubled (Inrad AutotrackerIII) ultraviolet (UV) radiation (0.5 mJ; ∼0.4 cm-1 linewidth)was used to ionize state-selected ammonia fragments from thevibrational predissociation of the dimer. The IR radiation wasgenerated by an OPO/OPA system (LaserVision, up to 22 mJ;0.4 cm-1 linewidth). The IR frequency was calibrated using theabsorption spectra of gaseous CH4 and H2O. The UV radiationwas generated by a dye laser (Continuum ND 6000, LDS 698)pumped by a Nd:YAG laser (Continuum Surelite-III) andfrequency calibrated by the known REMPI spectrum of NH3
(see below). The timing of the lasers was adjusted by a delaygenerator (Stanford, DG535) controlled through a GPIB inter-face (National Instruments). Spectra were collected by alternat-ing “IR on” and “IR off” conditions at each frequency. In “IRon”, the IR laser fired 50 ns before the UV laser, whereas in“IR off”, the IR laser was fired 1 µs after the UV laser. Laserconditions were optimized to minimize multiphoton signalcontributions from larger clusters.
The timing of the lasers’ firings was carefully optimized toexcite dimers in the later part of the molecular beam pulse,
Vibrational Predissociation of Ammonia-Water Dimer J. Phys. Chem. A, Vol. 113, No. 38, 2009 10175

where their highest relative abundance was found. The rotationaltemperature of the background ammonia was estimated to be5-10 K by monitoring the origin band of the B̃1E′′ r X̃1A1′system of monomer ammonia by 2 + 1 REMPI.36 The UVspectra were modeled using the program PGOPHER37 developedby Western with rotational constants from Cottaz et al.38 Forν2 ) 0+, B ) 9.95 cm-1, and C ) 6.23 cm-1. The well-knownorigin band positions were used to calibrate the UV wavelength.Vibrationally excited ammonia fragments were detected throughthe same B̃ state in the range of 342.1-347.8 nm. A smallbackground signal from vibrationally excited ammonia was alsoobserved, indicating that vibrational cooling was not as efficientas rotational cooling.
The VMI arrangement has been described in detail previ-ously.39,40 In brief, it consists of a four-lens ion accelerationassembly, a 60 cm field-free drift tube, and a CCD camera(LaVision, Imager) that monitors a phosphor screen coupled toa microchannel plate (MCP) detector (BURLE Electro-OpticsCo.). In this experiment, two modes were used to collect data:(i) TOF mass spectrometry for spectroscopic investigations and(ii) VMI mode for determining center-of-mass (c.m.) transla-tional energy distributions. The two-dimensional projectionswere collected using an event counting method (DaVis) andreconstructed to three-dimensional images by using the BASEXmethod,41 which also provided the speed distributions aftersumming over the angular distribution for each radius. Speed(radial distance) distributions were converted to c.m. transla-tional energy distributions by using momentum conservationand calibration constants obtained by imaging photodissociationproducts from the well-known I2, NO2, and O2 systems.42-44
The translational energy distributions were analyzed to deter-mine the internal energy of the water cofragments as well asthe dissociation threshold of NH3-H2O.
3. Results and Analysis
3.1. Infrared Action Spectra. We obtained IR spectra ofthe dimer in the range of the bound OH stretch fundamental bymonitoring NH3 photofragments in selected rovibrational statesby REMPI while scanning the IR laser frequency. IR spectrameasured at 3340-3510 cm-1 under varying conditions areshown in Figure 2. The data shown are the enhancement of theNH3
+ signal following IR excitation and have the backgroundNH3
+ signal with the IR laser off subtracted. It is importantto note that these are “action” spectra; in order to observe signalnot only must there be absorption of IR photons, but thisabsorption must lead to the production of NH3 fragments in thespecific rovibrational state being monitored. The traces shownin Figure 2 were obtained by monitoring NH3(ν2 ) 1+, J ) 1or 3). Similar spectra were observed monitoring NH3(ν2 ) 2+).Spectra taken monitoring NH3(ν2 ) 0+) were qualitativelysimilar but much noisier due to the larger background signal.
In the process of optimizing the dimer signal, IR scans weretaken with many combinations of gas concentrations and laserpowers. Figure 2 shows three survey IR scans which representan illustrative range of conditions. The top trace, taken underconditions of high IR laser fluence (5 mJ; focal length ) 40cm) and high water and ammonia concentrations (1% water,3% ammonia), shows significant enhancements throughout thisregion, dominated by a peak around 3410 cm-1. When theconcentrations were decreased (e.g., 0.6% water, 1.25% am-monia; middle trace), the intensity of the 3410 cm-1 peak alsodecreased, leaving a broad absorption throughout the scannedregion with smaller peaks at 3445 and 3485 cm-1. When theIR laser fluence was also decreased (3 mJ unfocused; bottom
trace), NH3 fragments from multiphoton dissociation of largerclusters containing ammonia were minimized, and the featurecentered at ∼3485 cm-1 became the prominent spectral feature.As discussed below, we assign this absorption to the bound OHstretch of NH3-H2O. The smaller two peaks at ∼3430 cm-1
correspond to the ammonia dimer.31
The inset in Figure 2 shows the average of several scans ofthe NH3-H2O peak recorded under optimized conditions (0.75%water, 1.5% ammonia, 1.5 atm of stagnation pressure, 3-5 mJ ofunfocused IR). This peak is well-separated from the signals fromlarger clusters at lower frequencies. The observed peak profilehas a 12 cm-1 width and no resolvable rotational structure. Itconsists of two subpeaks whose relative intensity, but notpositions or shapes, vary with experimental conditions. The mostsignificant variation was with IR laser fluence, with the high-frequency peak growing faster than the low-frequency peak asIR fluence increased. Changing the beam conditions to vary thetemperature of the expansion produced no observable changein the relative intensity of the two peaks. A careful inspectionof the product NH3 REMPI spectrum upon changing the IRfrequency from the low-frequency peak to the high-frequencypeak indicated no significant change in relative NH3 productstate distributions. As discussed below, we believe that the high-frequency peak is due to combination bands present in internallyexcited dimers. To avoid potential overlap, all data reportedbelow were obtained with the IR frequencies fixed on the low-frequency peak centered at 3485 cm-1.
3.2. REMPI Spectroscopy of Ammonia Fragments. Figure3 shows all the monomer vibrational modes that are availablefor energy disposal given our excitation energy and measuredD0. REMPI spectra of NH3 fragments produced from the VPof NH3-H2O at 3485 cm-1 are shown in Figures 4 and 5. Thespectra clearly show bands corresponding to NH3 produced with
Figure 2. NH3(ν2 ) 1+; J ) 1-3) fragment yield IR spectra of NH3-containing clusters. Survey scans were taken at high concentration andIR power (top, red), low concentration and high IR power (middle,blue), and low power and concentration (bottom, black). See the textfor details. Colored lines have been smoothed to the resolution of ourlaser (0.4 cm-1). The inset shows the average of 15 scans of the peakassigned to NH3-H2O taken with 3-5 mJ IR power (unfocused), 0.75%water, 1.5% ammonia, and 1.5 atm stagnation pressure. The dotted curveis the simulation of an a-type band with rotational temperature of 10K, fwhm ) 0.4 cm-1, and published rotational constants (ref. 32).
10176 J. Phys. Chem. A, Vol. 113, No. 38, 2009 Mollner et al.

umbrella bending mode (ν2) excitation, as well as in the groundvibrational state. Each band is quite congested, indicatingpopulation in a large number of rotational states.
Due to the large amount of energy deposited into NH3 ν2 )2+ (1597.5 cm-1), the B̃(ν2 ) 0) r X̃(ν2 ) 2+) band (Figure5a) has the fewest number of allowed rotational states and isthe least congested. The spectrum was simulated with arotational temperature of 300 K and J e 7. The peak positionsand relative heights are simulated quite well, indicating the NH3
rotational state distribution for this band is Boltzmann-like,truncated at the highest rotational level allowed by energyconservation. However, the spectrum is too congested to extracta more detailed rotational state distribution. In this region, noevidence was found for the B̃(ν4 ) 0) r X̃(ν4 ) 1) transition,even though population of the ammonia asymmetric bend isenergetically allowed (see Figure 3). Although the B̃(ν4 ) 0)r X̃(ν4 ) 1) REMPI spectrum is expected to have a sharpQ-branch peak around 57 600 cm-1, the relative strength of thistransition could be much lower than for B̃(ν2 ) 0) r X̃(ν2 )2+), so some production of NH3 with one quantum in ν4 cannotbe ruled out.
The REMPI spectrum of NH3 product fragments in the regionof the B̃(ν2 ) 0) r X̃(ν2 ) 1+) band is shown in Figure 5b.The best simulation for this spectrum was with a rotationaltemperature of 400 K and J e 13. No clear evidence was seenfor the energy- and symmetry-allowed B̃(ν2 ) 1) r X̃(ν2 )2-) transition in this region (Figure 3). However, consideringthe value of D0, we expect only very few rotational states andthose peaks would be buried beneath the dense forest of peaksobserved for the B̃(ν2 ) 0) r X̃(ν2 ) 1+) transition.
The region corresponding to the B̃(ν2 ) 0) r X̃(ν2 ) 0+)transition is shown in Figure 5c. The signal-to-noise of theenhancement spectrum in this region was degraded due to themuch larger monomer signal obtained with the IR laser off. Inaddition, enhancement from 59 210 to 59 360 cm-1 could notbe measured due to very strong transitions from low-J levelsof monomer NH3. Analysis in this region was further compli-cated by the large amount of energy available for NH3 rotationas well as the overlap of two other allowed transitions, B̃(ν2 )1)r X̃(ν2 ) 1-) and B̃(ν2 ) 2)r X̃(ν2 ) 2+). Shown in Figure5c is a simulation with a rotational temperature of 300 K. Nocombination of temperatures and intensities for the three allowedtransitions was found to adequately reproduce the observedspectrum, and the rotational state distributions for NH3 formedin ν2 ) 0+ appear to be poorly described by a Boltzmanndistribution. This may be partly a result of the blended natureof the transitions.
The NH3 bands of (-) symmetry are not resolved, althoughthe high density of rotational states near 59 100 cm-1 is likely
due to contributions from B̃(ν2 ) 1) r X̃(ν2 ) 1-). No statespecificity regarding the two symmetry components of theumbrella mode is expected, in analogy with observations ofthe NH3-acetylene dimer.34 However, it is difficult to see these(-) bands via the C̃ r X̃ transition used previously because ofmuch greater congestion and overlap.
3.3. Ion Imaging Results and Analysis. VMI data monitor-ing state-selected NH3 photofragments are shown in Figures6-9. Photofragment images were obtained for state-selectedNH3 in ν2 ) 0+, 1+, and 2+. The angular distributions in allimages were isotropic, as illustrated by the unreconstructedimage in Figure 6 taken by monitoring ν2 ) 2+, J ) 3. Figure6 also shows the BASEX reconstruction, plotted in velocity(pixel) space, of this image. The size of the image in pixels isproportional to the radial distance from the center and to thespeed. Images of NH3 fragments with less vibrational excitationare larger, with ν2 ) 0+ fragment image radii on the order of150 pixels. The speed distributions were then converted to c.m.translational energy distributions, and typical examples areshown in Figures 7-9.
To determine the correlated internal state distributions of thewater fragment, conservation of energy was used:
where Eint(NH3-H2O) is the internal energy of the dimer priorto excitation, hν is the photon energy used for vibrationalexcitation of the dimer (3485 cm-1), D0 is the dissociationenergy of the dimer, ET is the c.m. translational energy,Evib(NH3) and Evib(H2O) are the vibrational energies of ammoniaand water, respectively, and Erot(NH3) and Erot(H2O) are thecorresponding rotational energies. Eint(NH3-H2O) is estimatedto be 5 cm-1 (see below). State-selective REMPI definesErot(NH3) and Evib(NH3), and ET is determined from the images.This leaves D0, Evib(H2O), and Erot(H2O) as unknowns, althoughfor images with NH3 bending excitation Evib(H2O) must be zerodue to conservation of energy.
Reconstructed images in velocity (pixels) space were usedto determine the rotational level populations of pair-correlatedwater fragments. This procedure improves our ability to resolvestructures at low ET and identify the maximum observed ET
(compare Figures 6 and 7). Fitting was accomplished byassigning a Gaussian-shaped curve to each rovibrational stateof H2O,45 with a width characteristic of our experimentalresolution. The positions of these Gaussians were then shiftedtogether by adjusting D0 until both the observed structure andmaximum ET were best matched. The heights of the Gaussianswere described by a smooth function of ET and then adjustedto fit structural features at low ET.
Every effort was made to monitor single rovibrational statesof NH3. Given the complexity of the REMPI spectra, this wasa major challenge. We were most successful with NH3(ν2 )2+). Characterizing the selected transitions with ∆K∆JK(J)notation, images were recorded by monitoring the rS0(3), rR3(3),and rR6(6) at 57 790, 57 634, and 57 618 cm-1, respectively.Despite their differing amounts of NH3 rotational energy, allthree images were best fit with a consistent D0 of 1537 ( 2cm-1. The rS0(3) image along with its fit is shown in Figure 6,and the corresponding c.m. translational energy distributions,P(ET), along with the normalized state distribution for the pair-correlated H2O rotational states are shown in Figure 7.
For NH3 with ν2 ) 1+ we were also able to fit images fromthree isolated states: rS0(3), rS0(5), and rS1(2) at 58 459, 58 537,
Figure 3. Accessible vibrational levels in the monomer fragmentsfollowing vibrational predissociation. Ehν - D0 ) 3485 - 1538 ) 1947cm-1.
Eint(NH3-H2O) + hν ) D0 + ET + Evib(NH3) +Evib(H2O) + Erot(NH3) + Erot(H2O)
Vibrational Predissociation of Ammonia-Water Dimer J. Phys. Chem. A, Vol. 113, No. 38, 2009 10177
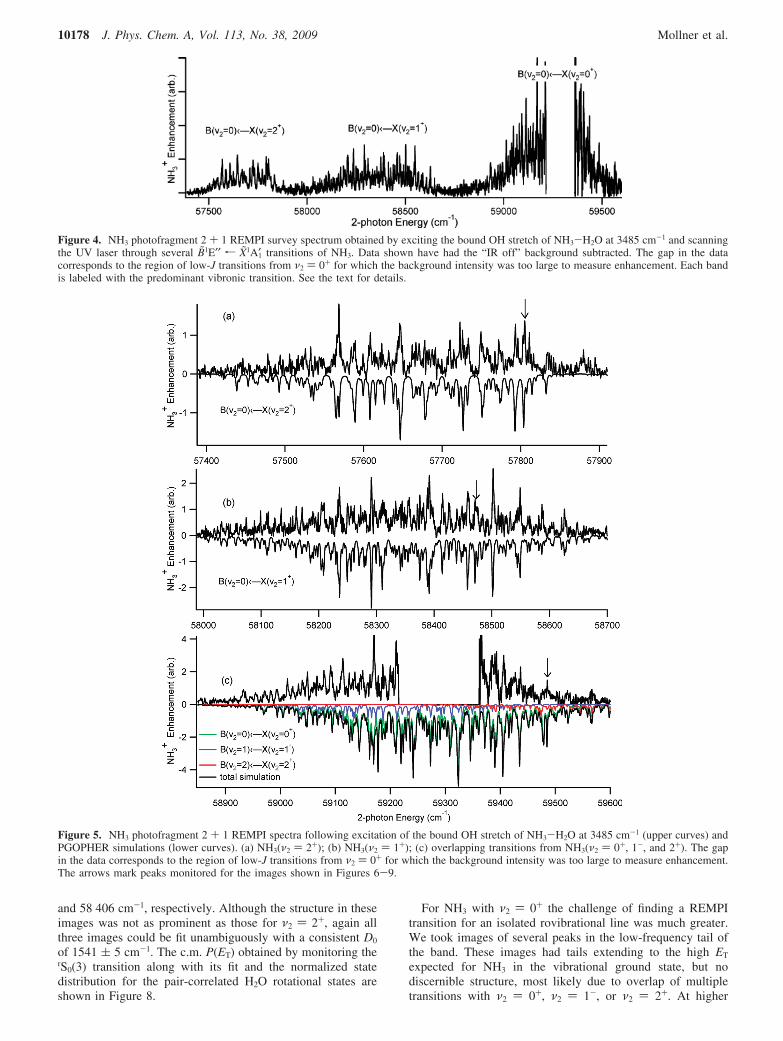
and 58 406 cm-1, respectively. Although the structure in theseimages was not as prominent as those for ν2 ) 2+, again allthree images could be fit unambiguously with a consistent D0
of 1541 ( 5 cm-1. The c.m. P(ET) obtained by monitoring therS0(3) transition along with its fit and the normalized statedistribution for the pair-correlated H2O rotational states areshown in Figure 8.
For NH3 with ν2 ) 0+ the challenge of finding a REMPItransition for an isolated rovibrational line was much greater.We took images of several peaks in the low-frequency tail ofthe band. These images had tails extending to the high ET
expected for NH3 in the vibrational ground state, but nodiscernible structure, most likely due to overlap of multipletransitions with ν2 ) 0+, ν2 ) 1-, or ν2 ) 2+. At higher
Figure 4. NH3 photofragment 2 + 1 REMPI survey spectrum obtained by exciting the bound OH stretch of NH3-H2O at 3485 cm-1 and scanningthe UV laser through several B̃1E′′ r X̃1A1′ transitions of NH3. Data shown have had the “IR off” background subtracted. The gap in the datacorresponds to the region of low-J transitions from ν2 ) 0+ for which the background intensity was too large to measure enhancement. Each bandis labeled with the predominant vibronic transition. See the text for details.
Figure 5. NH3 photofragment 2 + 1 REMPI spectra following excitation of the bound OH stretch of NH3-H2O at 3485 cm-1 (upper curves) andPGOPHER simulations (lower curves). (a) NH3(ν2 ) 2+); (b) NH3(ν2 ) 1+); (c) overlapping transitions from NH3(ν2 ) 0+, 1-, and 2+). The gapin the data corresponds to the region of low-J transitions from ν2 ) 0+ for which the background intensity was too large to measure enhancement.The arrows mark peaks monitored for the images shown in Figures 6-9.
10178 J. Phys. Chem. A, Vol. 113, No. 38, 2009 Mollner et al.

frequencies, transitions from ν2 ) 1- no longer contribute, andwe were able to record an image that is dominated by the rS0(5)transition from ν2 ) 0+. This image shows clear structure atlow ET but much less structure at higher ET than expected fromthe simulations. This is likely due to some persisting overlapof other transitions. Using the structure at low ET and themaximum ET observed, the image was fit with D0 ) 1539 ( 5cm-1. The corresponding c.m. P(ET) along with its fit and thenormalized state distribution of the correlated H2O rotationalstates are shown in Figure 9. For this state, the available energyis hν - D0 - Erot(NH3) ) 3485 - 1539 - 298 ) 1648 cm-1,sufficient to populate the bending mode of water (E(010) )1595 cm-1). Unfortunately, the internal energy of the allowedwater rotational states associated with NH3(J ) 5) and onequantum of water bend (1595, 1619, 1635 cm-1) are nearlydegenerate with water rotational states with no bending excita-tion (1591, 1616, 1631 cm-1), so a direct analysis of the bendingmode population could not be made. The filled triangles inFigure 9 represent those states that could include contributionsfrom water bend.
4. Discussion
4.1. Infrared Spectrum of Ammonia-Water Clusters. Todate, no high-resolution gas-phase spectra of the bound OHstretch region of NH3-H2O have been published. Thus, adefinite correlation between the observed NH3 photofragmentaction spectra and dimer absorption features needs to beestablished. Our survey scans (Figure 2) obtained by monitoringNH3 in ν2 ) 1+ and 2+ show large enhancements upon IRexcitation at 3360-3480 cm-1 that depend on the monomerconcentrations and laser power. Because we measure the
Figure 7. Fragment translational energy distribution (c.m.) obtainedby monitoring NH3(ν2 ) 2+, J ) 3, K ) 0) via the rS0(3) line of theB̃ r X̃ transition and simulation (see text for details). The arrowindicates the maximum available translational energy for D0 ) 1538cm-1. The top panel shows the normalized relative populations of thewater rotational states used to fit the data. The x-axis has been invertedsuch that the states line up vertically with the corresponding featuresin the c.m. translational energy distribution.
Figure 6. Unreconstructed image (top) and the corresponding velocitydistribution derived from the BASEX-reconstructed image (bottom) ofstate-selected NH3(ν2 ) 2+, J ) 3, K ) 0) fragments produced in thevibrational predissociation of NH3-H2O plotted in units of pixels(proportional to velocity). Positions of Gaussians used in the simulationwere determined by known H2O rotational energies and the fit parameterD0. The widths of the Gaussians are determined by the experimentalresolution.
Figure 8. Fragment translational energy distribution (c.m.) obtainedby monitoring NH3(ν2 ) 1+, J ) 3, K ) 0) via the rS0(3) line of theB̃ r X̃ transition and simulation (see text for details). The arrowindicates the maximum available translational energy for D0 ) 1538cm-1. The top panel shows the normalized relative populations of thewater rotational states used to fit the data. The x-axis has been invertedsuch that the states line up vertically with the corresponding featuresin the c.m. translational energy distribution.
Vibrational Predissociation of Ammonia-Water Dimer J. Phys. Chem. A, Vol. 113, No. 38, 2009 10179
enhancement of NH3 REMPI signal following IR excitation,this signal must be due to IR absorption by NH3-containingcomplexes.
The strong concentration dependence of the prominent featureat 3410 cm-1 indicates this is absorption by larger (NH3)x(H2O)y
complexes. Complexes of pure (NH3)x have previously beenobserved in He droplets at 3420 cm-1 (x ) 2) and 3400 cm-1
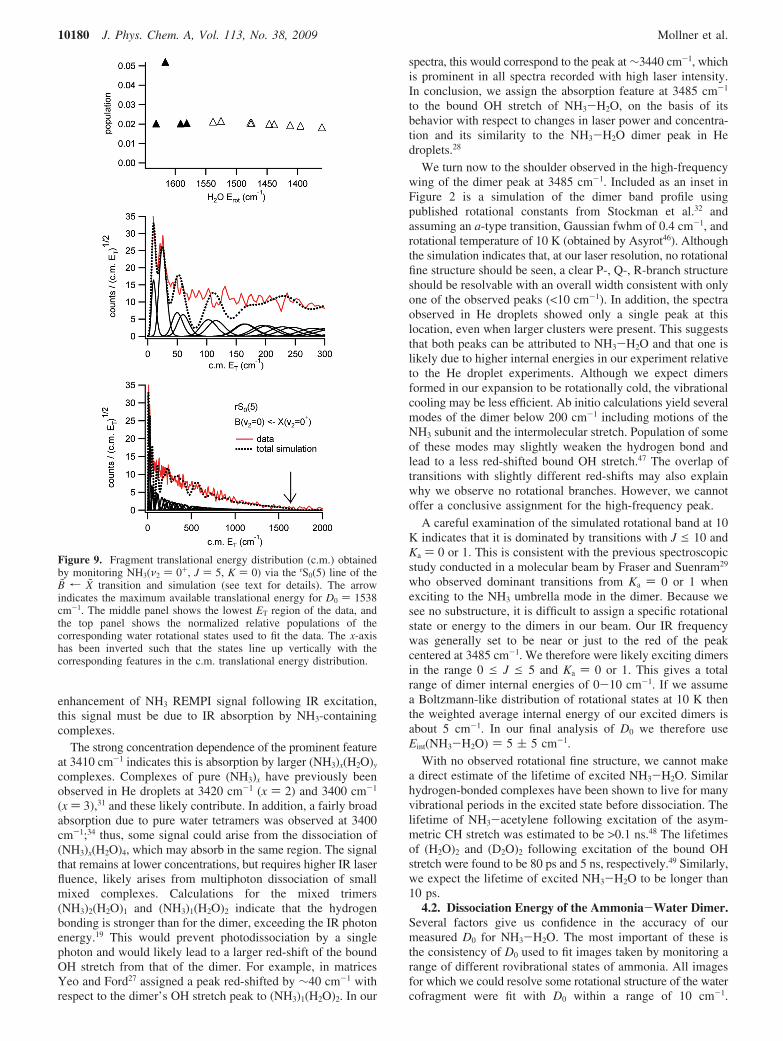
(x ) 3),31 and these likely contribute. In addition, a fairly broadabsorption due to pure water tetramers was observed at 3400cm-1;34 thus, some signal could arise from the dissociation of(NH3)x(H2O)4, which may absorb in the same region. The signalthat remains at lower concentrations, but requires higher IR laserfluence, likely arises from multiphoton dissociation of smallmixed complexes. Calculations for the mixed trimers(NH3)2(H2O)1 and (NH3)1(H2O)2 indicate that the hydrogenbonding is stronger than for the dimer, exceeding the IR photonenergy.19 This would prevent photodissociation by a singlephoton and would likely lead to a larger red-shift of the boundOH stretch from that of the dimer. For example, in matricesYeo and Ford27 assigned a peak red-shifted by ∼40 cm-1 withrespect to the dimer’s OH stretch peak to (NH3)1(H2O)2. In our
spectra, this would correspond to the peak at ∼3440 cm-1, whichis prominent in all spectra recorded with high laser intensity.In conclusion, we assign the absorption feature at 3485 cm-1
to the bound OH stretch of NH3-H2O, on the basis of itsbehavior with respect to changes in laser power and concentra-tion and its similarity to the NH3-H2O dimer peak in Hedroplets.28
We turn now to the shoulder observed in the high-frequencywing of the dimer peak at 3485 cm-1. Included as an inset inFigure 2 is a simulation of the dimer band profile usingpublished rotational constants from Stockman et al.32 andassuming an a-type transition, Gaussian fwhm of 0.4 cm-1, androtational temperature of 10 K (obtained by Asyrot46). Althoughthe simulation indicates that, at our laser resolution, no rotationalfine structure should be seen, a clear P-, Q-, R-branch structureshould be resolvable with an overall width consistent with onlyone of the observed peaks (<10 cm-1). In addition, the spectraobserved in He droplets showed only a single peak at thislocation, even when larger clusters were present. This suggeststhat both peaks can be attributed to NH3-H2O and that one islikely due to higher internal energies in our experiment relativeto the He droplet experiments. Although we expect dimersformed in our expansion to be rotationally cold, the vibrationalcooling may be less efficient. Ab initio calculations yield severalmodes of the dimer below 200 cm-1 including motions of theNH3 subunit and the intermolecular stretch. Population of someof these modes may slightly weaken the hydrogen bond andlead to a less red-shifted bound OH stretch.47 The overlap oftransitions with slightly different red-shifts may also explainwhy we observe no rotational branches. However, we cannotoffer a conclusive assignment for the high-frequency peak.
A careful examination of the simulated rotational band at 10K indicates that it is dominated by transitions with J e 10 andKa ) 0 or 1. This is consistent with the previous spectroscopicstudy conducted in a molecular beam by Fraser and Suenram29
who observed dominant transitions from Ka ) 0 or 1 whenexciting to the NH3 umbrella mode in the dimer. Because wesee no substructure, it is difficult to assign a specific rotationalstate or energy to the dimers in our beam. Our IR frequencywas generally set to be near or just to the red of the peakcentered at 3485 cm-1. We therefore were likely exciting dimersin the range 0 e J e 5 and Ka ) 0 or 1. This gives a totalrange of dimer internal energies of 0-10 cm-1. If we assumea Boltzmann-like distribution of rotational states at 10 K thenthe weighted average internal energy of our excited dimers isabout 5 cm-1. In our final analysis of D0 we therefore useEint(NH3-H2O) ) 5 ( 5 cm-1.
With no observed rotational fine structure, we cannot makea direct estimate of the lifetime of excited NH3-H2O. Similarhydrogen-bonded complexes have been shown to live for manyvibrational periods in the excited state before dissociation. Thelifetime of NH3-acetylene following excitation of the asym-metric CH stretch was estimated to be >0.1 ns.48 The lifetimesof (H2O)2 and (D2O)2 following excitation of the bound OHstretch were found to be 80 ps and 5 ns, respectively.49 Similarly,we expect the lifetime of excited NH3-H2O to be longer than10 ps.
4.2. Dissociation Energy of the Ammonia-Water Dimer.Several factors give us confidence in the accuracy of ourmeasured D0 for NH3-H2O. The most important of these isthe consistency of D0 used to fit images taken by monitoring arange of different rovibrational states of ammonia. All imagesfor which we could resolve some rotational structure of the watercofragment were fit with D0 within a range of 10 cm-1.
Figure 9. Fragment translational energy distribution (c.m.) obtainedby monitoring NH3(ν2 ) 0+, J ) 5, K ) 0) via the rS0(5) line of theB̃ r X̃ transition and simulation (see text for details). The arrowindicates the maximum available translational energy for D0 ) 1538cm-1. The middle panel shows the lowest ET region of the data, andthe top panel shows the normalized relative populations of thecorresponding water rotational states used to fit the data. The x-axishas been inverted such that the states line up vertically with thecorresponding features in the c.m. translational energy distribution.
10180 J. Phys. Chem. A, Vol. 113, No. 38, 2009 Mollner et al.

Additional images taken by monitoring overlapped NH3(ν, J)states for which no rotational structure was resolved still hadmaximum ET consistent with our measured D0. The NH3 REMPIspectra also support our D0, as the maximum J observed in eachvibronic band is consistent with a D0 around 1540 cm-1.
The D0 derived from an individual image fit is quite narrowlyconstrained by the structure. The finite width of observed peaksplaces a lower limit on our fitting uncertainty at (1 cm-1 andthe uncertainty can be as high as 6 cm-1, depending on thesignal-to-noise. The D0 values and uncertainties quoted abovefor each vibrational band of ammonia are weighted averagesfor all images fit in that band. The calibration constant used toconvert images from pixels to translational energy has anuncertainty of ∼5%. However, an error in these calibrationconstants would impact our ability to simultaneously fit peaksat different ET and is probably reflected in our fit uncertainties.The largest systematic uncertainties stem from the internalenergy of the dimer prior to excitation and the calibration ofour IR laser frequency. As discussed above, the uncertainty inEint(NH3-H2O) is estimated to be 5 cm-1. From our calibrations,we estimate the uncertainty in the IR frequency in this regionto be on the order of 1 cm-1. Taking a weighted average of allour data and combining random and systematic uncertainties,we arrive at a value of D0 ) 1538 ( 10 cm-1.
To our knowledge, the only previous experimental informa-tion about D0 was from the microwave-infrared double-resonance experiment of Fraser and Suenram,29 who observedno dissociation of the dimer and therefore placed a lower limiton the dissociation energy of 1021 cm-1. They suggested thatexcitation of ν2 in ammonia might lower the dissociation energyof the dimer. Although we cannot rule out some small effect,our data do not show any systematic variation in D0 with productν2 population outside our measurement uncertainties.
Our measured D0 can also be used as a benchmark to testthe accuracy of ab initio calculations. The most recent andsophisticated studies by Sadlej et al.18 and Lane et al.20 calculatedD0 of 3.990 kcal/mol (1396 cm-1) and 4.20 kcal/mol (1469cm-1), respectively. Both papers acknowledge that the calcula-tions typically give binding energies for van der Waalscomplexes that are too low by 10-15%, mainly due to anunderestimation of the dispersion component of the interactionenergy. Sadlej tried to recover some of this by recomputing atthe MP2 level in the larger aug-cc-pVQZ basis and correctingfor higher order correlation effects, as well as deformationenergies and zero-point corrections from aug-cc-pVTZ. Thisrecomputation leads to their “best” value of 4.149 kcal/mol(1450 cm-1). The calculated D0 from these two studies are thusquite close and lie about 6% below our measured D0. Theproximity of the calculations to our measurement may indicatethat dispersion is less important in the NH3-H2O bonding thanin more weakly bound complexes.
4.3. Fragments’ Rovibrational State Populations andPredissociation Mechanism. We turn now to a discussion ofthe VP mechanism of NH3-H2O, and in particular compare itto the linear NH3-acetylene dimer.34 Although the large numberof states generated in the dissociation of NH3-H2O for bothfragments precludes a state-to-state analysis, some informationcan be gleaned from general trends in our results. The largenumber of states is noteworthy in itself. The NH3 REMPI spectrashow considerable population in all energetically allowedrovibrational states of the ammonia umbrella mode (ν2), withthe population fairly evenly distributed between the vibrationallevels. This is in contrast to what was previously observed forthe NH3-acetylene complex, for which ammonia fragments
were predominantly formed in ν2 ) 1 and no ground-stateammonia fragments were observed. In addition, our simulationsof the transitions from ν2 ) 1+ and 2+ matched our observedspectra quite well assuming a Boltzmann distribution ofrotational states truncated at the maximum allowed rotationallevel. This is also in contrast to the NH3-acetylene case, forwhich the colder rotational temperatures (<150 K) suggest arestricted range of impact parameters accessed by the lineardimer. Although we could not measure directly the populationof ν2 ) 1- and 2-, in analogy with NH3-acetylene we expecttheir rotational distributions to be similar to the (+) components.
The imaging data provide information on the rovibrationalstate distributions in the water cofragment pair-correlated withspecific NH3(ν, J) states. The distributions shown in Figures7-9 have several noteworthy features. The first is again thelarge number of water states observed. Although the largedensity of water states prevents us from unambiguously assign-ing exact populations to individual JKaKc states, we can concludethat the entire range of energetically allowed rotational waterstates is populated. Had some KaKc levels been excluded, muchmore structure would have been observed in the images.
In general, assuming a smooth variation of rotational popula-tions, the distributions show a gradual increase in populationwith increasing internal energy of the water fragment. This isin accord with the momentum gap law that predicts a preferencefor rotational excitation over translational energy release, as longas the angular momentum “load” is not too large.34,35,50-54 Forexample, the lowest translational energy region in Figure 9 iscorrelated with JKaKc ) 963 and the highest J level of H2Opossible for any KaKc combination is J ) 11. The water JKaKc
states correlated with ammonia in excited umbrella levels areeven lower. Previous results for the H(D)Cl-acetylene systemshowed that the angular momentum load did not restrict therotational states of acetylene for J < 20.35 We therefore expectno angular momentum restrictions on the rotational levels ofwater, particularly considering the large range of impactparameters that can be accessed by the zero-point motion ofthe floppy NH3-H2O dimer. We also note that, although thewater state populations generally increase smoothly with waterinternal energy, at the highest allowed energies for each imagewe observe some significant state-to-state fluctuations. However,given the presence of background signal between peaks (seeFigure 7), we cannot exclude the possibility that these fluctua-tions result from contributions of overlapping NH3 transitions.
Referring to Ewing’s propensity rules that favor excitationof vibrational levels to minimize translational energy release,50,51
we find our results for NH3 in ν2 ) 0+ quite surprising. Forlow rotational levels of ground-state ammonia (J ) 0-5),population in the bending mode of the water cofragment isenergetically allowed (Figure 3), resulting in translational energyrelease of <350 cm-1 for the rotationless state of ammonia.Studies on other hydrogen-bonded dimers have shown evidenceof interaction between the bound OH stretch of water and thewater bending modes, facilitated perhaps by the intermolecularmodes.55-57 We have therefore expected a strong preference forpopulating this mode. However, as shown in Figure 9, there isno clear evidence for water bend excitation. In fact, even if thoselevels marked in Figure 9 as possibly belonging to H2O(010)were all in this state, their fractional population would still bequite low in comparison with those levels that must belong toH2O(000). The same is true for the image we took by monitoringNH3(J ) 3). This is all the more surprising given that productpairs in which both the ammonia and water are in their groundvibrational states can have translational energies as high as
Vibrational Predissociation of Ammonia-Water Dimer J. Phys. Chem. A, Vol. 113, No. 38, 2009 10181

∼1800 cm-1. In contrast, in the NH3-acetylene case themaximum observed translational energy release was <150 cm-1.Why the H2O(010) state is not populated significantly is notyet clear, especially since its energy is almost the same as twoquanta in the ammonia umbrella mode (see Figure 3). We alsosee no evidence for population of the NH3 asymmetric stretch(ν4) in the REMPI spectra, which we would expect to bepopulated if the distribution of states was statistical.
While there has not been a previous study of the predisso-ciation of NH3-H2O, the results of Fraser and Suenram29 offersome insights into possible mechanisms. Their investigationsof the ammonia symmetric bend absorption spectrum lead totwo interesting observations: (1) there are many more observedsub-bands than can be explained just by tunneling motions inthe dimer and (2) the ammonia bend in the dimer is blue-shiftedby about 70 cm-1 from that in free ammonia. They haveproposed that the extra sub-bands arise from coupling of theammonia bend to the low-frequency intermolecular modes.Blue-shifts of the NH3 bending mode in hydrogen-bondedcomplexes have previously been rationalized by a weakeningof the hydrogen bond upon bending excitation.58 Fraser andSuenram attribute this weakening to the observed decrease inthe electric dipole moment of free NH3 upon excitation to ν2.59
As discussed above, our data do not indicate a weakening;however, the extra sub-bands coupled with the blue-shift clearlysuggest a significant coupling between the hydrogen bond andthe ammonia symmetric bend.
On the basis of the available information, we can offer thefollowing scenario for VP following excitation of the boundOH stretch in NH3-H2O. The floppy nature of the dimer andrelatively strong hydrogen bond can facilitate more efficientenergy flow and dissociation from a range of impact parame-ters.34,35 This would explain the broad distribution of rotationallevels in the products, which is restricted only by energyconservation, and the more democratic distribution among theν2 levels in ammonia. However, to achieve VP, efficientcoupling to the intermolecular dissociation coordinate must takeplace, with the observed product states deriving predominantlyfrom channels for which couplings to the hydrogen-bonddissociation coordinate are strongest. The spectroscopic studiesshow that the symmetric bend of ammonia is coupled to theintermolecular modes and the hydrogen bond. If this couplingis significantly stronger than for the water bend, the ammoniafragments would tend to be vibrationally excited, even thoughthey are less favored by Ewing’s propensity rules than the waterbend. The way the system minimizes translational energy releasein this case is by populating preferentially the higher rotationallevels of water. Because the rotational constants of water arelarge, it takes only up to J ) 9 to minimize the momentumgap, an angular momentum load that is quite reasonable. In theabsence of a potential energy surface for the dimer, a moreconclusive interpretation cannot be offered at present.
5. Summary
The state-to-state VP of the hydrogen-bonded NH3-H2Odimer was studied following excitation of the bound OH stretch.VMI and REMPI were used to determine product energydistributions. Following vibrational excitation of the bound OHstretch fundamental, ammonia fragments were detected by 2 +1 REMPI via the B̃1E′′r X̃1A1′ transition. REMPI spectra showthat NH3 is produced with excitation of the symmetric bend (ν2
umbrella mode), as well as in the ground vibrational state. Eachband is quite congested, indicating population in a large numberof rotational states. For NH3 with ν2 excitation the rotational
energy extends to the highest allowed by conservation of energyand can be approximately described by a truncated Boltzmann-like distribution. The fragments’ c.m. translational energydistributions were determined from images of selected rotationallevels of ammonia with zero, one, or two quanta in ν2 and wereconverted to rotational state distributions of the water cofrag-ment. All the distributions could be fit well when using a dimerdissociation energy of D0 ) 1538 ( 10 cm-1. The rotationaldistributions in the water cofragment pair-correlated withspecific rovibrational states of ammonia were broad andencompass all the JKaKc states allowed by energy conservation.A detailed analysis of pair-correlated state distributions wascomplicated by the highly congested ammonia REMPI spectrumand the large number of water rotational states available, butthe data suggest that the water rotational populations increasewith decreasing translational energy. There is no evidence forammonia products in the asymmetric bend (ν4) or water productswith excitation of the bend (ν2). Apparently, the most efficientdissociation route involves coupling of states with ammoniasymmetric bend excitation to the hydrogen-bond coordinate. Theexcitation of water bend is not a major channel even thoughpopulation of the ground state of water leads to significanttranslational energy release. A more definitive mechanism mustawait dynamical calculations on the NH3-H2O potential energysurface.
We end by pointing out that the ammonia-water system hasattracted much recent interest in the astrophysical and astro-chemical communities because of its presence in icy bodies inthe solar system.7-11 Therefore, studies of energy flow and VPin mixed cyclic trimers as well as larger clusters would beenlightening.
Acknowledgment. This work is supported by the U.S.National Science Foundation. The authors thank Colin Westernfor his generous help in simulating the ammonia REMPIspectrum and Anthony J. McCaffery for stimulating discussionson the VP mechanism.
References and Notes
(1) Oudejans, L.; Miller, R. E. Annu. ReV. Phys. Chem. 2001, 52, 607.(2) Reisler, H. Annu. ReV. Phys. Chem. 2009, 60, 39.(3) Chan, J. P.; Giauque, W. F. J. Phys. Chem. 1964, 68, 3053.(4) Lemmon, R. M. Chem. ReV. 1970, 70, 95.(5) Cavazzoni, C.; Chiarotti, G. L.; Scandolo, S.; Tosatti, E.; Ber-
nasconi, M.; Parrinello, M. Science 1999, 283, 44.(6) Donaldson, D. J. J. Phys. Chem. A 1999, 103, 62.(7) Brown, M. E.; Calvin, W. M. Science 2000, 287, 107.(8) Cook, J. C.; Desch, S. J.; Roush, T. L.; Trujillo, C. A.; Geballe,
T. R. Astrophys. J. 2007, 663, 1406.(9) Moore, M. H.; Ferrante, R. F.; Hudson, R. L.; Stone, J. N. Icarus
2007, 190, 260.(10) Verbiscer, A. J.; Peterson, D. E.; Skrutskie, M. F.; Cushing, M.;
Helfenstein, P.; Nelson, M. J.; Smith, J. D.; Wilson, J. C. Icarus 2006,182, 211.
(11) Zheng, W.; Jewitt, D.; Kaiser, R. I. Astrophys. J. Suppl. Ser. 2009,181, 53.
(12) Moore, T. S.; Winmill, T. F. J. Chem. Soc. 1912, 101, 1635.(13) Dykstra, C. E.; Andrews, L. J. Chem. Phys. 1990, 92, 6043.(14) Janowski, T.; Jaszunski, M. Int. J. Quantum Chem. 2002, 90, 1083.(15) Kohler, G.; Janoschek, R. J. Phys. Chem. 1987, 91, 2051.(16) Langlet, J.; Caillet, J.; Berges, J.; Reinhardt, P. J. Chem. Phys. 2003,
118, 6157.(17) Latajka, Z.; Scheiner, S. J. Phys. Chem. 1990, 94, 217.(18) Sadlej, J.; Moszynski, R.; Dobrowolski, J. C.; Mazurek, A. P. J.
Phys. Chem. A 1999, 103, 8528.(19) Rzepkowska, J.; Uras, N.; Sadlej, J.; Buch, V. J. Phys. Chem. A
2002, 106, 1790.(20) Lane, J. R.; Vaida, V.; Kjaergaard, H. G. J. Chem. Phys. 2008,
128, 034302.(21) Yeo, G. A.; Ford, T. A. Can. J. Chem. 1991, 69, 632.(22) Huang, N.; MacKerell, A. D. J. Phys. Chem. A 2002, 106, 7820.
10182 J. Phys. Chem. A, Vol. 113, No. 38, 2009 Mollner et al.

(23) Rappe, A. K.; Bernstein, E. R. J. Phys. Chem. A 2000, 104, 6117.(24) Tuma, C.; Boese, A. D.; Handy, N. C. Phys. Chem. Chem. Phys.
1999, 1, 3939.(25) Engdahl, A.; Nelander, B. J. Chem. Phys. 1989, 91, 6604.(26) Nelander, B.; Nord, L. J. Phys. Chem. 1982, 86, 4375.(27) Yeo, G. A.; Ford, T. A. Spectrochim. Acta, Part A 1991, 47, 485.(28) Kuma, S.; Slipchenko, M. N.; Momose, T.; Vilesov, A. F. Chem.
Phys. Lett. 2007, 439, 265.(29) Fraser, G. T.; Suenram, R. D. J. Chem. Phys. 1992, 96, 7287.(30) Herbine, P.; Dyke, T. R. J. Chem. Phys. 1985, 83, 3768.(31) Slipchenko, M. N.; Kuyanov, K. E.; Sartakov, B. G.; Vilesov, A. F.
J. Chem. Phys. 2006, 124, 241101.(32) Stockman, P. A.; Bumgarner, R. E.; Suzuki, S.; Blake, G. A.
J. Chem. Phys. 1992, 96, 2496.(33) Li, G.; Parr, J.; Fedorov, I.; Reisler, H. Phys. Chem. Chem. Phys.
2006, 8, 2915.(34) Parr, J. A.; Li, G.; Fedorov, I.; McCaffery, A. J.; Reisler, H. J.
Phys. Chem. A 2007, 111, 7589.(35) Pritchard, M.; Parr, J.; Li, G.; Reisler, H.; McCaffery, A. J. Phys.
Chem. Chem. Phys. 2007, 9, 6241.(36) Ashfold, M. N. R.; Dixon, R. N.; Stickland, R. J.; Western, C. M.
Chem. Phys. Lett. 1987, 138, 201.(37) Western, C. M. PGOPHER, A Program for Simulating Rotational
Structure; University of Bristol: Bristol, U.K., 2007. http://pgopher.chm-.bris.ac.uk.
(38) Cottaz, C.; Kleiner, I.; Tarrago, G.; Brown, L. R.; Margolis, J. S.;Poynter, R. L.; Pickett, H. M.; Fouchet, T.; Drossart, P.; Lellouch, E. J.Mol. Spectrosc. 2000, 203, 285.
(39) Eppink, A. T. J. B.; Parker, D. H. ReV. Sci. Instrum. 1997, 68,3477.
(40) Dribinski, V.; Potter, A. B.; Fedorov, I.; Reisler, H. J. Chem. Phys.2004, 121, 12353.
(41) Dribinski, V.; Ossadtchi, A.; Mandelshtam, V. A.; Reisler, H. ReV.Sci. Instrum. 2002, 73, 2634.
(42) Demyanenko, A. V.; Dribinski, V.; Reisler, H.; Meyer, H.; Qian,C. X. W. J. Chem. Phys. 1999, 111, 7383.
(43) Liu, C. L.; Hsu, H. C.; Ni, C. K. Phys. Chem. Chem. Phys. 2005,7, 2151.
(44) Parker, D. H.; Eppink, A. T. J. B. J. Chem. Phys. 1997, 107, 2357.(45) Lanquetin, R.; Coudert, L. H.; Camy-Peyret, C. J. Mol. Spectrosc.
1999, 195, 54.(46) Judge, R. H.; Clouthier, D. J. Comput. Phys. Commun. 2001, 135,
293.(47) McCoy, A. B.; Fry, J. L.; Francisco, J. S.; Mollner, A. K.; Okumura,
M. J. Chem. Phys. 2005, 122, 104311.(48) Hilpert, G.; Fraser, G. T.; Pine, A. S. J. Chem. Phys. 1996, 105,
6183.(49) Paul, J. B.; Provencal, R. A.; Chapo, C.; Petterson, A.; Saykally,
R. J. J. Chem. Phys. 1998, 109, 10201.(50) Ewing, G. E. J. Chem. Phys. 1979, 71, 3143.(51) Ewing, G. E. J. Chem. Phys. 1980, 72, 2096.(52) Ewing, G. E. J. Phys. Chem. 1987, 91, 4662.(53) Osborne, M. A.; McCaffery, A. J. J. Chem. Phys. 1994, 101, 5604.(54) McCaffery, A. J. Phys. Chem. Chem. Phys. 2004, 6, 1637.(55) Nizkorodov, S. A.; Ziemkiewicz, M.; Nesbitt, D. J.; Knight, A. E.
J. Chem. Phys. 2005, 122, 194316.(56) Robertson, W. H.; Weddle, G. H.; Kelley, J. A.; Johnson, M. A. J.
Phys. Chem. A 2002, 106, 1205.(57) Roscioli, J. R.; Diken, E. G.; Johnson, M. A.; Horvath, S.; McCoy,
A. B. J. Phys. Chem. A 2006, 110, 4943.(58) Fraser, G. T.; Nelson, D. D.; Charo, A.; Klemperer, W. J. Chem.
Phys. 1985, 82, 2535.(59) Ueda, Y.; Iwahori, J. J. Mol. Spectrosc. 1986, 116, 191.
JP904566W
Vibrational Predissociation of Ammonia-Water Dimer J. Phys. Chem. A, Vol. 113, No. 38, 2009 10183