Embed Size (px)
DESCRIPTION
IMF - Barbados Sectoral Balance Sheet Mismatches and Macroeconomic Vulnerabilities
Citation preview
Barbados: Sectoral Balance Sheet Mismatches and Macroeconomic Vulnerabilities
Charles Amo-Yartey
WP/12/31
© 2012 International Monetary Fund WP/12/31
IMF Working Paper
Western Hemisphere Department
Barbados: Sectoral Balance Sheet Mismatches and Macroeconomic Vulnerabilities
Prepared by Charles Amo-Yartey*
Authorized for distribution by Luis Breuer
January 2012
Abstract
This paper uses the balance sheet approach to analyze macroeconomic vulnerabilities in Barbados between 2006 and 2009. It discusses the financial position of the economy and its main sectors and the sectors’ exposure to changes in exchange rates. The main finding of the analysis is that the balance sheet of the aggregate economy has been weakened by the recent deterioration in the balance sheet of the nonfinancial public sector. Macroeconomic vulnerabilities have increased in Barbados since 2006 due to the high public debt and the deterioration in the net financial position with nonresidents. The private sector, however, maintained a healthy position and seems resilient to shocks. The paper also finds the balance sheet of the nonfinancial public sector has deteriorated significantly reflecting weak fiscal performance. While the central government is highly vulnerable to exchange rate shock, debt rollover risks are likely to be limited since most of external liabilities are long term and most domestic liabilities are held by the National Insurance System.
Keywords: Net financial position, net foreign currency position, Barbados Author’s E-Mail Address: [email protected] JEL Classification Numbers: F30, F34, H63 _____________________ * I would like to thank Therese Turner-Jones, David Vegara and participant at the 2011 Central Bank of Barbados Annual Research Seminar and WHD Caribbean II divisional seminar for their comments and suggestions. The usual caveat for responsibility still applies.
This Working Paper should not be reported as representing the views of the IMF. The views expressed in this Working Paper are those of the author(s) and do not necessarily represent those of the IMF or IMF policy. Working Papers describe research in progress by the author(s) and are published to elicit comments and to further debate.
2
Contents Page
I. Introduction ............................................................................................................................3
II. The Balance Sheet Approach: A Look at the Literature .......................................................4 A. The Origin of the Balance Sheet Approach ..............................................................4 B. Understanding the Balance Sheet Approach .............................................................5
III. Macroeconomic Developments in Barbados and Balance Sheet Implications ....................6
IV. Balance Sheet Matrices for Barbados ..................................................................................8 A. The Data ....................................................................................................................8 B. Indicators of Vulnerability ......................................................................................10
V. Overview of Key Developments .........................................................................................10 A. The Aggregate Balance Sheet .................................................................................10
Gross Financial Assets .....................................................................................10 Net Financial Position ......................................................................................11 Net Foreign Currency Position ........................................................................11
B. Sectoral Balance Sheets ..........................................................................................12 The Central Bank of Barbados .........................................................................12 The Nonfinancial Public Sector .......................................................................12 The Financial System .......................................................................................14 The Nonfinancial Corporate Sector .................................................................15 The Other Domestic Residents Sector .............................................................16
C. Sensitivity to Exchange Rate Shocks ......................................................................17 D. Barbados’ Balance Sheet in International Perspective ...........................................18
VI. Summary and Conclusions ................................................................................................19 References ................................................................................................................................22 Tables 1. Intersectoral Assets and Liabilities in Percent of GDP, December 2006 ............................9 2. Intersectoral Assets and Liabilities in Percent of GDP, December 2009 ............................9 3. Net Foreign Currency Position Before and After Exchange Rate Shock ..........................18 Figures 1. Macroeconomic Developments, 2000–10 ...........................................................................7 2. Central Bank of Barbados: Indicators of Vulnerability (Percent of GDP) ........................12 3. The Non-Financial Public Sector: Indicators of Vulnerability (Percent of GDP) .............13 4. The Financial System: Indicators of Vulnerability (Percent of GDP) ...............................15 5. The Non-Financial Corporate Sector: Indicators of Vulnerability (Percent of GDP .........16 6. The Other Residents Sector: Indicators of Vulnerability (Percent of GDP) ......................17 Appendix 1 ...............................................................................................................................25
3
I. INTRODUCTION
Barbados has been severely affected by the global economic crisis, which has curbed tourism and offshore activity with broader impact on other sectors. The decline in economic activity has led to important changes in the balance sheets of the aggregate economy as a whole and of particular sectors. Depressed tourism receipts and high commodity prices led to a widening of the current account deficit and affected the economy’s net financial position with the rest of the world. The loosening of fiscal policy in response to the crisis has created a large underlying deficit adding to trend increases in the debt-to-GDP ratio. In addition, the slowdown of capital inflows, the slow pace of growth in the stock and real estate markets, and the high credit to government have affected the economy’s aggregate balance sheet, as well as those of its subsectors, with implications for its vulnerability to shocks.
This paper uses the Balance Sheet Approach (BSA) to analyze macroeconomic vulnerabilities in Barbados between 2006 and 2009. It highlights (i) the financial position of the economy and its subsectors, (ii) the financial links between sectors, (iii) sector exposure to market risk (change in exchange rates), and (iv) the possibility of transmission of payment difficulties between sectors as a result of financial linkages.
Several recent crises in emerging market countries (EMCs) originated in weaknesses in sectoral balance sheets. The Balance Sheet Approach to financial crises provides a framework for analyzing how balance sheet weaknesses build up. An analysis of the size and composition of the assets and liabilities of different sectors of the economy helps uncover weaknesses, including currency and maturity mismatches and capital structure mismatches. Uncovering weaknesses in sectoral balance sheets and links between sectors can shed light on the vulnerability of an economy to shocks.
The main finding of the analysis is that the balance sheet of the aggregate economy has been weakened by the recent deterioration in the balance sheet of the nonfinancial public sector. The private sector, however, seems to be healthy and resilient to shocks. The analysis also shows that new vulnerabilities have emerged in the economy especially the high level of public debt accumulated since 2006, a deterioration in the net financial position with the rest of the world, and the growing exposure of the financial system to the central government. The paper also finds that the recent high budget deficits have weakened the non-financial public sector’s balance sheet making it the most vulnerable sector with negative net financial and foreign currency positions. While the central government is highly vulnerable to exchange rate shock, debt rollover risks are likely to be limited since most of its external liabilities are long term and most of its domestic liabilities are held by the National Insurance Scheme and the domestic banking system.
4
The remainder of the paper is organized as follows. Section II briefly reviews the literature on the BSA. Section III describes macroeconomic developments in Barbados between 2006 and 2009. Sections IV and V analyze the balance sheet of the aggregate economy and of its subsector and examine the sensitivity of the economy’s balance sheet to exchange rate shocks. The section also compares the balance sheets of Barbados and Jamaica at the end of 2009. Section VI summarizes the findings of the analysis.
II. THE BALANCE SHEET APPROACH: A LOOK AT THE LITERATURE
A. The Origin of the Balance Sheet Approach
The BSA emerged as a useful framework in understanding financial crises after the earlier models proved unable to explain the crises of the 1990s. First generation model explained a currency crisis in macroeconomic terms, usually as a result of monetized fiscal deficits leading to reserve losses and eventually the abandonment of the of an exchange rate peg (Krugman, (1979), Flood and Garber (1984). The model also introduced additional factors that may help explain the dynamics of a financial crisis, such as current account imbalances and real exchange rate misalignments. The emphasis was on fundamentals and on the conception that a crisis is automatically triggered once reserves reach a critical level.
The second-generation crisis models suggest that a crisis could be triggered by an endogenous policy response when the authorities consider that the costs of keeping a pegged exchange rate outweigh the benefits. The models recognize the role of self-fulfilling speculative attacks in triggering crises (Obstfeld, 1986).
The Asian financial crisis confirmed the view that the private sector, rather than traditional fiscal generation fiscal imbalances could be at the core of a crisis. While the Asian financial crisis of the late 1990s had some features of a self-fulfilling panic (Sachs and Radelett, 1998), it brought to the forefront the role of balance sheet weaknesses in the financial and corporate sectors in causing financial crises. In particular, debt exposure and currency imbalances in the balance sheets of private entities can adversely affect market confidence and heighten an economy’s vulnerability to banking or a currency crisis.
The crisis also highlighted that currency crises are often associated with banking crises and that sharp and sudden movements of the capital account rather than current account imbalances were the main drivers. These models are based explicitly on the analysis of financial balance sheets. They point to additional weaknesses in the financial and corporate sectors as causes of currency crises and show that currency crises often bring about banking crises. For instance, the pre-crisis periods for Argentina and Thailand were characterized by significant maturity and currency mismatches. In both countries banks borrowed from nonresidents in foreign currency and matched their foreign currency borrowing by extending foreign currency-denominated loans to the nonfinancial corporate sector. Third generation crisis models, based on balance sheet analysis, were therefore developed to understand how

5
capital account movement can trigger currency movements and financial crises (Dornbusch, 2001).
B. Understanding the Balance Sheet Approach
Theoretically, financial crisis can originate in all of the three main sectors of the economy—the government, banks, or corporations. Experience with recent financial crises has shown that one of the main sources of financial crises is the financial balance sheet structure in emerging market countries. Even though there are substantial differences between emerging market countries in terms of their balance sheet structure, their overall vulnerability to crises is higher than that of advanced or low income countries. The Balance Sheet Approach (Allen et al., 2002) provides analytical and systematic methods for examining macroeconomic vulnerabilities, and whether such vulnerabilities can instigate or exacerbate financial crises and which policy options can be taken in each case. The approach analyses the size and composition of the assets and liabilities of a country’s aggregate financial balance sheet as well as the financial balance sheets of its most important sectors.
The approach is based on the presumption that the resilience of an economy to various shocks, including financial crises, depends partly on the structure of the country’s financial balance sheet. In this regard, a financial crisis typically emerges in cases where the demand for domestic financial assets plunges in one or more sectors. (Allen et al., 2002).
The BSA can provide insights into a country’s vulnerabilities. While the traditional analysis of financial crises relies on the examination of flow variables over a certain period of time, BSA focuses on examining stock variables on a country’s financial balance sheet and on the balance sheet of key sectors. In the BSA analysis, an economy is analyzed as a system of sectoral balance sheets, with a distinction being made between the public, financial, nonfinancial, and external sectors. Assessing mismatches in individual sectors’ balance sheets and linkages among sectors helps understand how shocks can affect the liquidity or solvency of one sector and be transmitted to other sectors, possibly endangering the financial health of the whole economy.
The sectors in the domestic economy have claims against each other and the rest of the world. When the domestic sector is consolidated to generate a country’s aggregate balance sheet, the assets and liabilities held by residents are netted out, and what remains is the external balance sheet vis-à-vis the rest of the world. The risk of problems in one sector spilling over into other healthy sectors is worsened in countries which have undergone capital account liberalization if external investors do not differentiate between sectors and only take into account country risk (Allen et al. 2002).
A country’s aggregate balance sheet can reveal the potential extent of its vulnerability to changes in external financial flows, but it is rarely suited for examining the causes behind
6
such changes. Sectoral balance sheet provides important information which is not readily visible in the aggregate financial balance sheet. One important example is foreign currency denominated debts between residents, which is netted out in the aggregate balance sheet. Weaknesses in a sectoral balance sheet can contribute to the development of a nationwide balance of payments crisis without even appearing on a country’s aggregate balance sheet.
There are, however, limitations to the BSA as an effective framework for risk analysis. Since the framework is static, the BSA should be complemented with flow variables for a fuller vulnerability assessment. Also, it does not include real assets and off-balance sheet liabilities, which may affect a sector’s vulnerability to crisis. Moreover, the BSA cannot provide a quantified forward–looking probability of default. Such assessments could be obtained from the contingent claim approach that integrates balance sheet information with market prices and uncertainty measures (Gapen et al., 2005).
III. MACROECONOMIC DEVELOPMENTS IN BARBADOS AND BALANCE SHEET
IMPLICATIONS
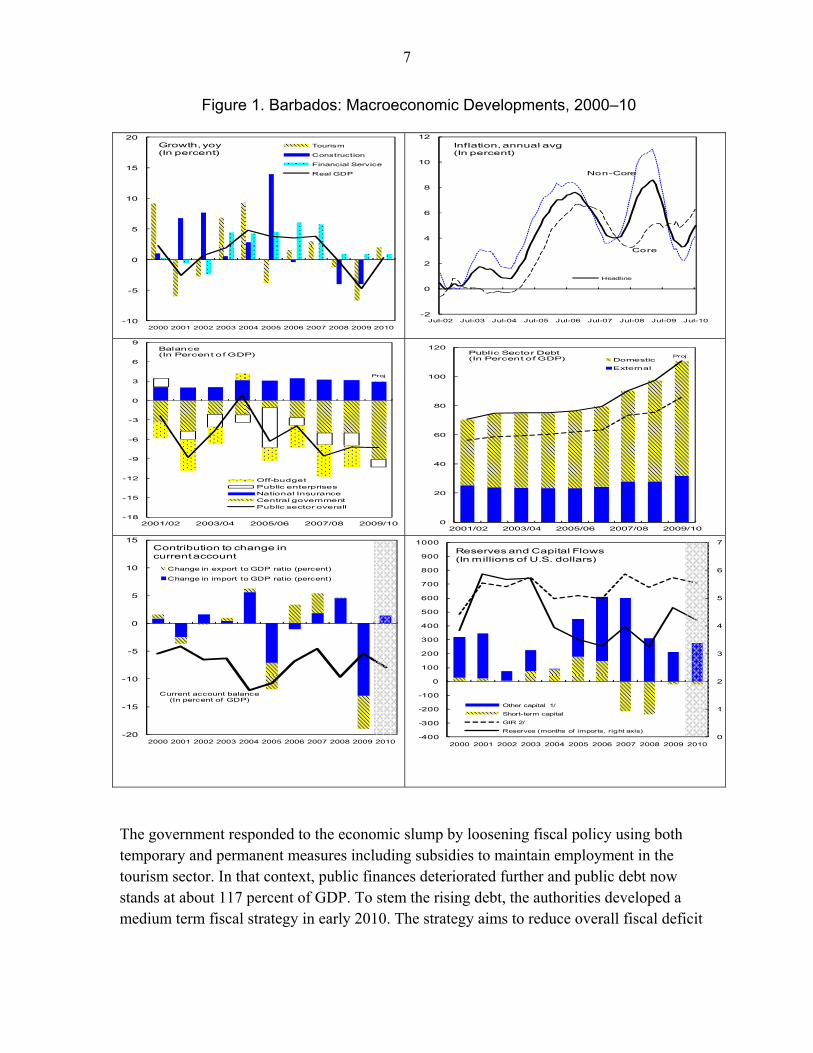
Barbados is a small open economy with a developing infrastructure boasting one of the highest levels of GDP per capita in the Caribbean region. Barbados is highly exposed to swings in external demand and the economy is dominated by services such as tourism, real estate and financial services, which account for about 75 percent of GDP and 80 percent of exports. Before the global financial crisis, economic growth was strong in tandem with tourism, averaging between 3-4 percent. The country enjoys an investment grade rating and has one of the highest S&P foreign currency sovereign credit ratings in the region.
Barbados has been severely affected by the global economic crisis. Tourism and offshore activities have been curbed with broader impact on other sectors especially financial services and real estate. As a result, economic activity is estimated to have contracted by a cumulative 5 percent between 2008 and 2009. The broad economic weakness has hurt the labor market with the unemployment rate increasing from 7.4 percent in 2007 to 10.5 percent in 2010.
The weakness in the external sector has put pressure on gross international reserves. Lower tourism receipts and high food and oil prices increased the current the account deficit to 9.6 percent of GDP in 2008. However, lower imports resulting from the recession outpaced a further fall in export revenues narrowing the current account deficit to 5.5 percent of GDP in 2009. International reserves, however, reached a comfortable 4 months of imports at end December 2010 having been boosted by the SDR allocation ($85 million), the placement of a US$120 million bond, and an additional borrowing of US$145 million in 2010. Foreign reserves would have halved in two years in the absence of the SDR allocation and foreign borrowing. The stronger foreign exchange reserves position, together with the improvement in other economic fundamentals, enabled the country to retain the investment grade rating of its debt.
7
Figure 1. Barbados: Macroeconomic Developments, 2000–10
The government responded to the economic slump by loosening fiscal policy using both temporary and permanent measures including subsidies to maintain employment in the tourism sector. In that context, public finances deteriorated further and public debt now stands at about 117 percent of GDP. To stem the rising debt, the authorities developed a medium term fiscal strategy in early 2010. The strategy aims to reduce overall fiscal deficit
-10
-5
0
5
10
15
20
2000 2001 2002 2003 2004 2005 2006 2007 2008 2009 2010
Growth, yoy(In percent)
Tourism
Construction
Financial Service
Real GDP
-2
0
2
4
6
8
10
12
Jul-02 Jul-03 Jul-04 Jul-05 Jul-06 Jul-07 Jul-08 Jul-09 Jul-10
Inflation, annual avg(In percent)
Headline
Core
Non-Core
-18
-15
-12
-9
-6
-3
0
3
6
9
2001/02 2003/04 2005/06 2007/08 2009/10
Balance(In Percent of GDP)
Off-budgetPublic enterprisesNational InsuranceCentral governmentPublic sector overall
Proj
0
20
40
60
80
100
120
2001/02 2003/04 2005/06 2007/08 2009/10
Public Sector Debt(In Percent of GDP) Domestic
External
Proj.
-20
-15
-10
-5
0
5
10
15
2000 2001 2002 2003 2004 2005 2006 2007 2008 2009 2010
Change in export to GDP ratio (percent)
Change in import to GDP ratio (percent)
Contribution to change in current account
Current account balance(In percent of GDP)
0
1
2
3
4
5
6
7
-400
-300
-200
-100
0
100
200
300
400
500
600
700
800
900
1000
2000 2001 2002 2003 2004 2005 2006 2007 2008 2009 2010
Reserves and Capital Flows(In millions of U.S. dollars)
Other capital 1/
Short-term capital
GIR 2/
Reserves (months of imports, right axis)
8
and balance the budget and reduce the debt-to-GDP ratio to 90.5 percent by 2014/15 while keeping growth at acceptable levels
The recent economic developments have altered sectoral financial positions and the relations between sectors. A significant increase in public sector indebtedness, due to higher fiscal deficits has been associated with greater exposure of banks to the sovereign. The liabilities of domestic residents to the rest of the world (ROW) have increased in line with the widening current account deficit. The impact of these changes on aggregate and sectoral balance sheets and on the economy’s sensitivity to shocks will be analyzed below.
IV. BALANCE SHEET MATRICES FOR BARBADOS
A. The Data
Mathisen and Pellechio (2006) outlined the major data sources for balance sheet analysis. These sources are: the Standard Report Forms (SRF) for monetary and financial data, the Quarterly External Debt Statistics (QEDS), the Joint External Debt Hub (JEDH), the Coordinated Portfolio Investment Survey (CPIS), and the International Investment Position (IIP).1
Balance sheet matrices for Barbados were constructed for 2006 –09 by the Statistics Department of the IMF, a period of both high and low economic growths with associated change in sectoral balances. Intersectoral claims and liabilities are displayed by maturity and currency. The economy is divided into six main sectors:
The Central Bank of Barbados (CBB);
The Nonfinancial Public Sector (NFPS) comprising the central government, the state and local governments, and the nonfinancial public enterprises;
The Financial Sector, grouping deposit taking institutions and other financial institutions (nonbanks);
The Nonfinancial Corporate Sector ;
Other Domestic Residents Sector (including households); and
Nonresidents (the ROW—rest of the world).
1 In addition, we have used information from the Central Bank of Barbados online statistics to obtain data on short-term public sector debt.
9
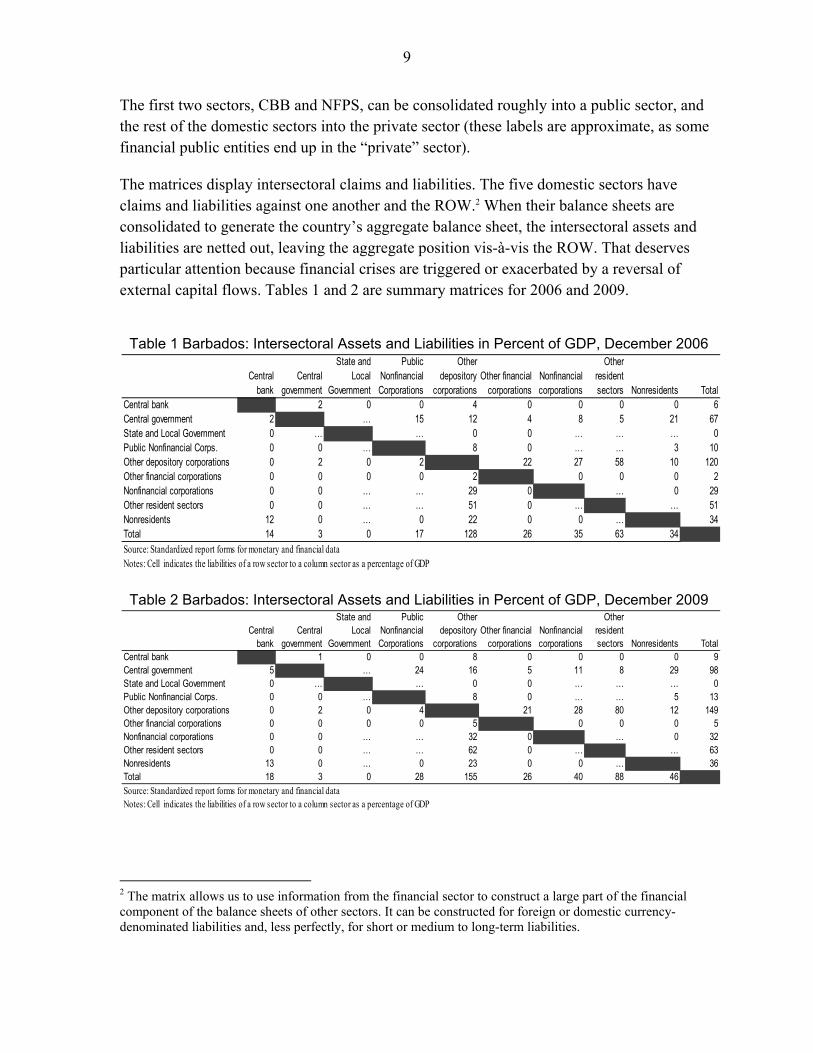
The first two sectors, CBB and NFPS, can be consolidated roughly into a public sector, and the rest of the domestic sectors into the private sector (these labels are approximate, as some financial public entities end up in the “private” sector).
The matrices display intersectoral claims and liabilities. The five domestic sectors have claims and liabilities against one another and the ROW.2 When their balance sheets are consolidated to generate the country’s aggregate balance sheet, the intersectoral assets and liabilities are netted out, leaving the aggregate position vis-à-vis the ROW. That deserves particular attention because financial crises are triggered or exacerbated by a reversal of external capital flows. Tables 1 and 2 are summary matrices for 2006 and 2009.
Table 1 Barbados: Intersectoral Assets and Liabilities in Percent of GDP, December 2006
Table 2 Barbados: Intersectoral Assets and Liabilities in Percent of GDP, December 2009
2 The matrix allows us to use information from the financial sector to construct a large part of the financial component of the balance sheets of other sectors. It can be constructed for foreign or domestic currency-denominated liabilities and, less perfectly, for short or medium to long-term liabilities.
Central bank
Central government
State and Local
Government
Public Nonfinancial Corporations
Other depository
corporationsOther financial
corporationsNonfinancial corporations
Other resident sectors Nonresidents Total
Central bank 2 0 0 4 0 0 0 0 6Central government 2 … 15 12 4 8 5 21 67State and Local Government 0 … … 0 0 … … … 0Public Nonfinancial Corps. 0 0 … 8 0 … … 3 10Other depository corporations 0 2 0 2 22 27 58 10 120Other financial corporations 0 0 0 0 2 0 0 0 2Nonfinancial corporations 0 0 … … 29 0 … 0 29Other resident sectors 0 0 … … 51 0 … … 51Nonresidents 12 0 … 0 22 0 0 … 34Total 14 3 0 17 128 26 35 63 34Source: Standardized report forms for monetary and financial dataNotes: Cell indicates the liabilities of a row sector to a column sector as a percentage of GDP
Central bank
Central government
State and Local
Government
Public Nonfinancial Corporations
Other depository
corporationsOther financial
corporationsNonfinancial corporations
Other resident sectors Nonresidents Total
Central bank 1 0 0 8 0 0 0 0 9Central government 5 … 24 16 5 11 8 29 98State and Local Government 0 … … 0 0 … … … 0Public Nonfinancial Corps. 0 0 … 8 0 … … 5 13Other depository corporations 0 2 0 4 21 28 80 12 149Other financial corporations 0 0 0 0 5 0 0 0 5Nonfinancial corporations 0 0 … … 32 0 … 0 32Other resident sectors 0 0 … … 62 0 … … 63Nonresidents 13 0 … 0 23 0 0 … 36Total 18 3 0 28 155 26 40 88 46Source: Standardized report forms for monetary and financial dataNotes: Cell indicates the liabilities of a row sector to a column sector as a percentage of GDP
10
B. Indicators of Vulnerability
Information contained in the balance sheet matrix can be used to assess mismatches in the size and structure of sectors’ financial assets and liabilities. The indicators used to gauge the vulnerabilities associated with different mismatches include the following (Lima et al, 2006):
Net financial position: total financial assets minus total financial liabilities. A large negative position can point to solvency problems, but in some cases it might simply be the counterpart of physical assets excluded from the analysis.
Net foreign currency position: foreign currency assets minus foreign currency liabilities. A large negative position indicates vulnerability to exchange rate depreciation.
Net short-term position: short-term assets minus short-term liabilities at original maturities. A large negative position implies vulnerability to rollover risk and interest rate increases; however, if debt has floating rates, interest rate risk is not tied to maturity.
Capital structure: equity liabilities minus debt liabilities. A large negative implies excessive reliance on debt financing.
V. OVERVIEW OF KEY DEVELOPMENTS
A. The Aggregate Balance Sheet
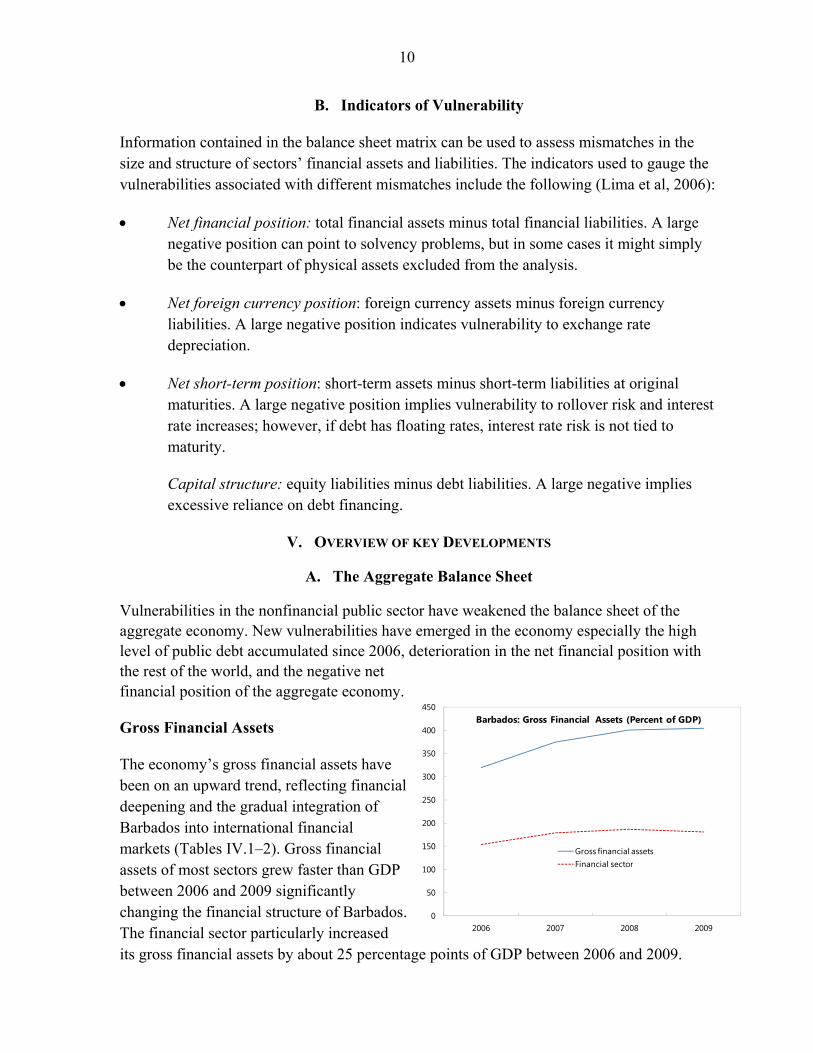
Vulnerabilities in the nonfinancial public sector have weakened the balance sheet of the aggregate economy. New vulnerabilities have emerged in the economy especially the high level of public debt accumulated since 2006, deterioration in the net financial position with the rest of the world, and the negative net financial position of the aggregate economy.
Gross Financial Assets The economy’s gross financial assets have been on an upward trend, reflecting financial deepening and the gradual integration of Barbados into international financial markets (Tables IV.1–2). Gross financial assets of most sectors grew faster than GDP between 2006 and 2009 significantly changing the financial structure of Barbados. The financial sector particularly increased its gross financial assets by about 25 percentage points of GDP between 2006 and 2009.
0
50
100
150
200
250
300
350
400
450
2006 2007 2008 2009
Barbados: Gross Financial Assets (Percent of GDP)
Gross financial assetsFinancial sector
11
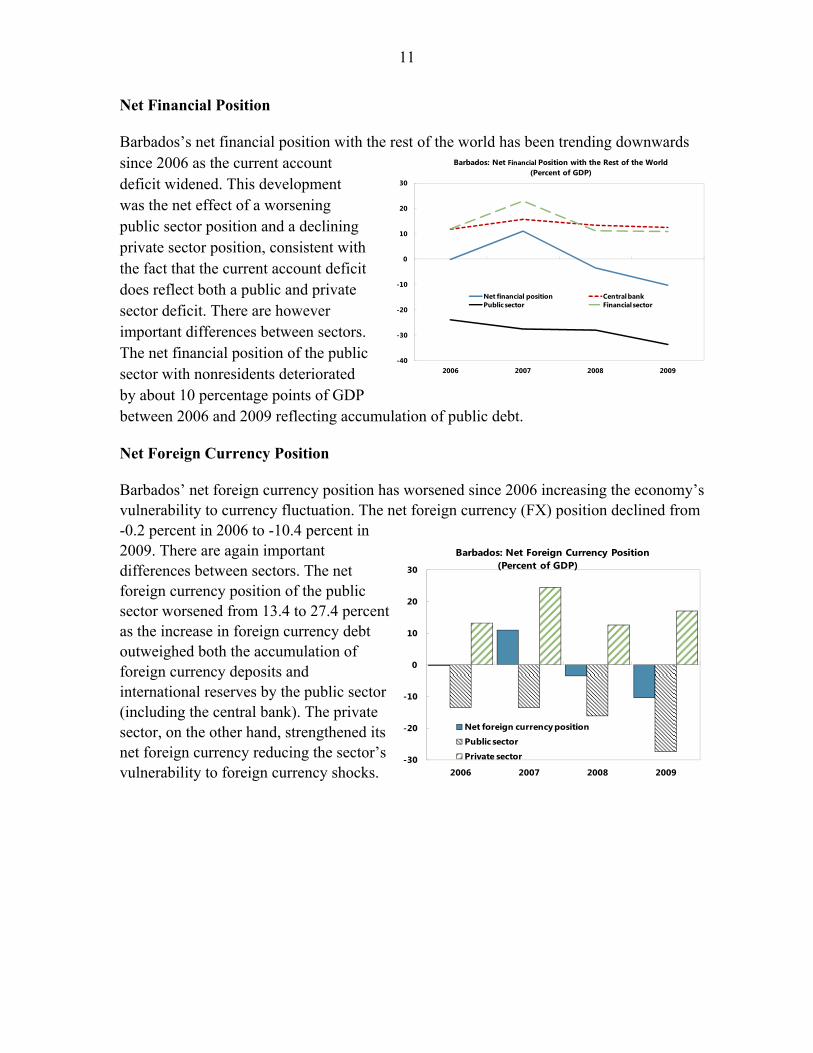
Net Financial Position Barbados’s net financial position with the rest of the world has been trending downwards since 2006 as the current account deficit widened. This development was the net effect of a worsening public sector position and a declining private sector position, consistent with the fact that the current account deficit does reflect both a public and private sector deficit. There are however important differences between sectors. The net financial position of the public sector with nonresidents deteriorated by about 10 percentage points of GDP between 2006 and 2009 reflecting accumulation of public debt.
Net Foreign Currency Position Barbados’ net foreign currency position has worsened since 2006 increasing the economy’s vulnerability to currency fluctuation. The net foreign currency (FX) position declined from -0.2 percent in 2006 to -10.4 percent in 2009. There are again important differences between sectors. The net foreign currency position of the public sector worsened from 13.4 to 27.4 percent as the increase in foreign currency debt outweighed both the accumulation of foreign currency deposits and international reserves by the public sector (including the central bank). The private sector, on the other hand, strengthened its net foreign currency reducing the sector’s vulnerability to foreign currency shocks.
-30
-20
-10
0
10
20
30
2006 2007 2008 2009
Barbados: Net Foreign Currency Position (Percent of GDP)
Net foreign currency position
Public sector
Private sector
-40
-30
-20
-10
0
10
20
30
2006 2007 2008 2009
Net financial position Central bankPublic sector Financial sector
Barbados: Net Financial Position with the Rest of the World (Percent of GDP)
12
B. Sectoral Balance Sheets
The Central Bank of Barbados
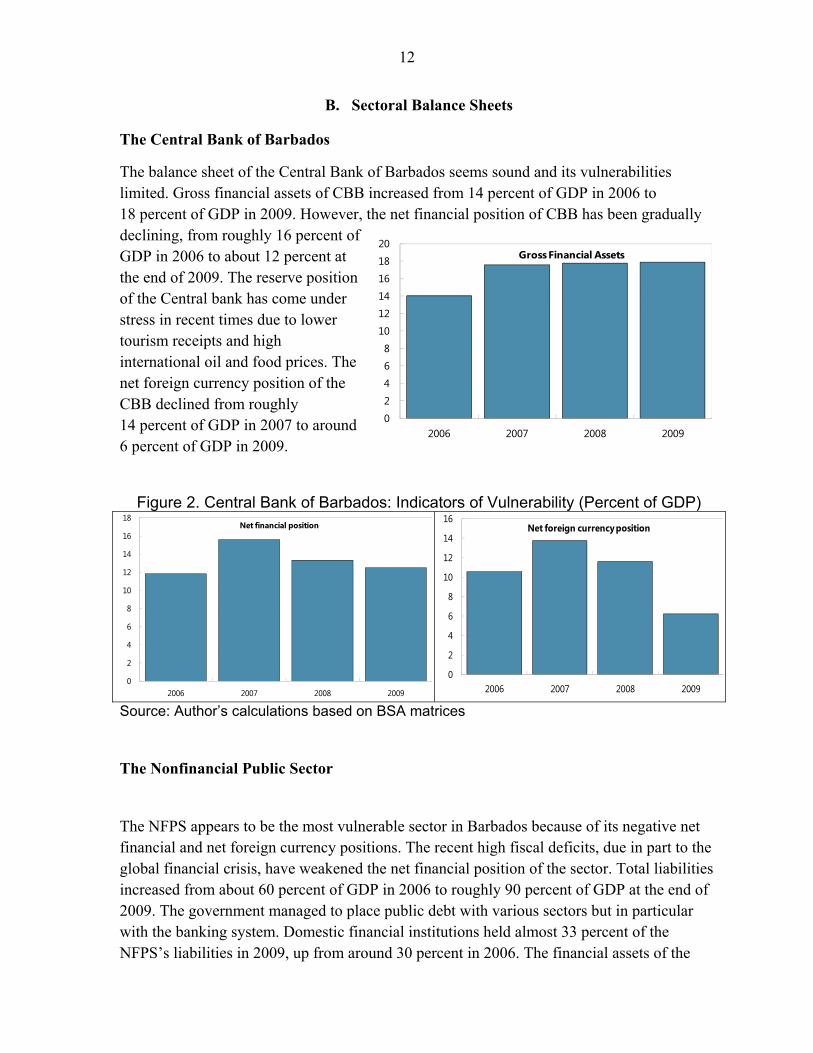
The balance sheet of the Central Bank of Barbados seems sound and its vulnerabilities limited. Gross financial assets of CBB increased from 14 percent of GDP in 2006 to 18 percent of GDP in 2009. However, the net financial position of CBB has been gradually declining, from roughly 16 percent of GDP in 2006 to about 12 percent at the end of 2009. The reserve position of the Central bank has come under stress in recent times due to lower tourism receipts and high international oil and food prices. The net foreign currency position of the CBB declined from roughly 14 percent of GDP in 2007 to around 6 percent of GDP in 2009.
Figure 2. Central Bank of Barbados: Indicators of Vulnerability (Percent of GDP)
Source: Author’s calculations based on BSA matrices
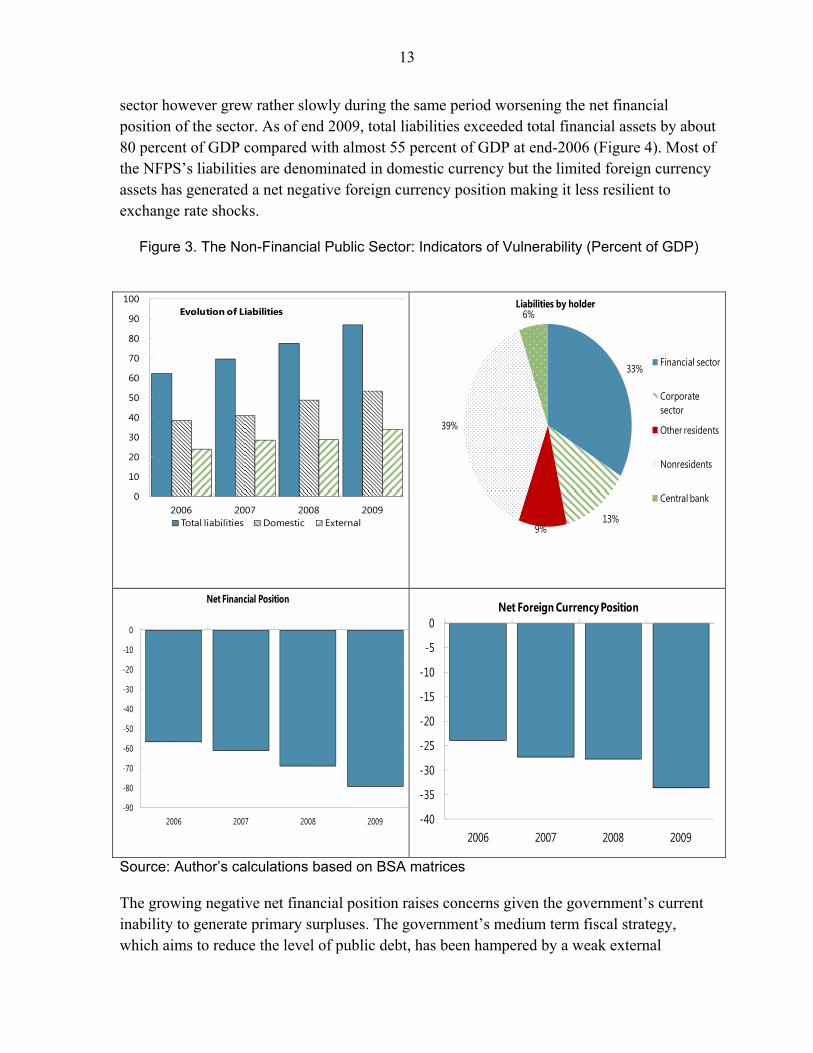
The Nonfinancial Public Sector The NFPS appears to be the most vulnerable sector in Barbados because of its negative net financial and net foreign currency positions. The recent high fiscal deficits, due in part to the global financial crisis, have weakened the net financial position of the sector. Total liabilities increased from about 60 percent of GDP in 2006 to roughly 90 percent of GDP at the end of 2009. The government managed to place public debt with various sectors but in particular with the banking system. Domestic financial institutions held almost 33 percent of the NFPS’s liabilities in 2009, up from around 30 percent in 2006. The financial assets of the
0
2
4
6
8
10
12
14
16
18
2006 2007 2008 2009
Net financial position
0
2
4
6
8
10
12
14
16
2006 2007 2008 2009
Net foreign currency position
0
2
4
6
8
10
12
14
16
18
20
2006 2007 2008 2009
Gross Financial Assets
13
sector however grew rather slowly during the same period worsening the net financial position of the sector. As of end 2009, total liabilities exceeded total financial assets by about 80 percent of GDP compared with almost 55 percent of GDP at end-2006 (Figure 4). Most of the NFPS’s liabilities are denominated in domestic currency but the limited foreign currency assets has generated a net negative foreign currency position making it less resilient to exchange rate shocks.
Figure 3. The Non-Financial Public Sector: Indicators of Vulnerability (Percent of GDP)
Source: Author’s calculations based on BSA matrices
The growing negative net financial position raises concerns given the government’s current inability to generate primary surpluses. The government’s medium term fiscal strategy, which aims to reduce the level of public debt, has been hampered by a weak external
0
10
20
30
40
50
60
70
80
90
100
2006 2007 2008 2009
Evolution of Liabilities
Total liabilities Domestic External
33%
13%9%
39%
6%Liabilities by holder
Financial sector
Corporate sector
Other residents
Nonresidents
Central bank
-90
-80
-70
-60
-50
-40
-30
-20
-10
0
2006 2007 2008 2009
Net Financial Position
-40
-35
-30
-25
-20
-15
-10
-5
0
2006 2007 2008 2009
Net Foreign Currency Position
14
environment. Debt sustainability analysis suggests that under current policies, debt ratios would be adversely affected by fiscal and revenue shocks. However, under the medium term fiscal strategy, the public debt outlook would not only improve but would also be more resilient to shocks. It is important to emphasize that the negative financial position does not seem to make the public sector vulnerable to sudden shifts in investor sentiment since NFPS debt is held by relatively stable investors, including the domestic financial system and the National Insurance Scheme. In addition, external debts are mostly long term and have a favorable amortization profile.
The Financial System
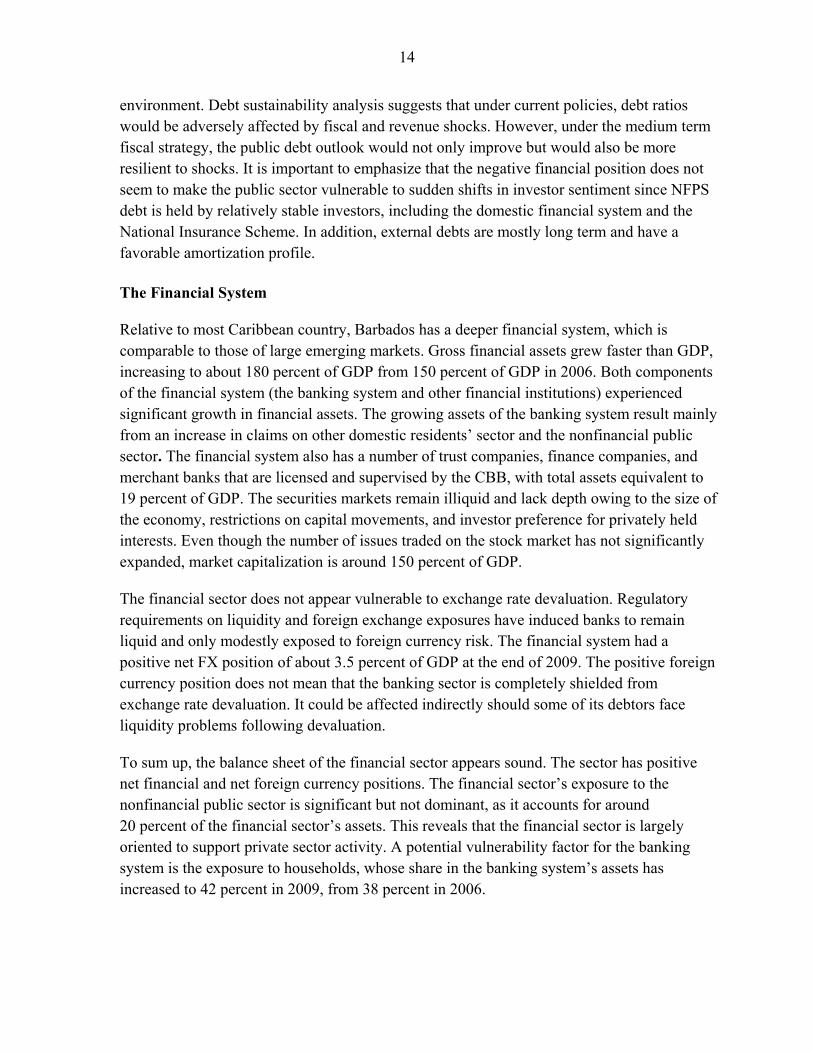
Relative to most Caribbean country, Barbados has a deeper financial system, which is comparable to those of large emerging markets. Gross financial assets grew faster than GDP, increasing to about 180 percent of GDP from 150 percent of GDP in 2006. Both components of the financial system (the banking system and other financial institutions) experienced significant growth in financial assets. The growing assets of the banking system result mainly from an increase in claims on other domestic residents’ sector and the nonfinancial public sector. The financial system also has a number of trust companies, finance companies, and merchant banks that are licensed and supervised by the CBB, with total assets equivalent to 19 percent of GDP. The securities markets remain illiquid and lack depth owing to the size of the economy, restrictions on capital movements, and investor preference for privately held interests. Even though the number of issues traded on the stock market has not significantly expanded, market capitalization is around 150 percent of GDP.
The financial sector does not appear vulnerable to exchange rate devaluation. Regulatory requirements on liquidity and foreign exchange exposures have induced banks to remain liquid and only modestly exposed to foreign currency risk. The financial system had a positive net FX position of about 3.5 percent of GDP at the end of 2009. The positive foreign currency position does not mean that the banking sector is completely shielded from exchange rate devaluation. It could be affected indirectly should some of its debtors face liquidity problems following devaluation.
To sum up, the balance sheet of the financial sector appears sound. The sector has positive net financial and net foreign currency positions. The financial sector’s exposure to the nonfinancial public sector is significant but not dominant, as it accounts for around 20 percent of the financial sector’s assets. This reveals that the financial sector is largely oriented to support private sector activity. A potential vulnerability factor for the banking system is the exposure to households, whose share in the banking system’s assets has increased to 42 percent in 2009, from 38 percent in 2006.
15
Figure 4. The Financial System: Indicators of Vulnerability (Percent of GDP)
Source: Author’s calculations based on BSA matrices
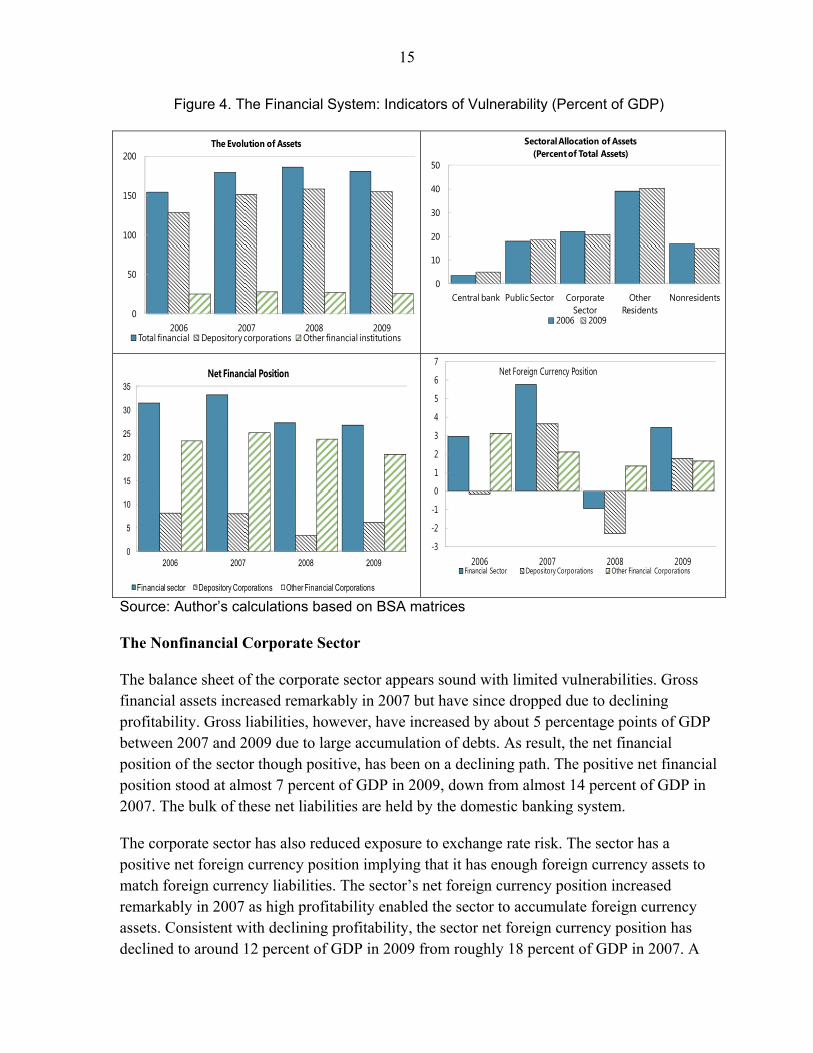
The Nonfinancial Corporate Sector The balance sheet of the corporate sector appears sound with limited vulnerabilities. Gross financial assets increased remarkably in 2007 but have since dropped due to declining profitability. Gross liabilities, however, have increased by about 5 percentage points of GDP between 2007 and 2009 due to large accumulation of debts. As result, the net financial position of the sector though positive, has been on a declining path. The positive net financial position stood at almost 7 percent of GDP in 2009, down from almost 14 percent of GDP in 2007. The bulk of these net liabilities are held by the domestic banking system.
The corporate sector has also reduced exposure to exchange rate risk. The sector has a positive net foreign currency position implying that it has enough foreign currency assets to match foreign currency liabilities. The sector’s net foreign currency position increased remarkably in 2007 as high profitability enabled the sector to accumulate foreign currency assets. Consistent with declining profitability, the sector net foreign currency position has declined to around 12 percent of GDP in 2009 from roughly 18 percent of GDP in 2007. A
0
50
100
150
200
2006 2007 2008 2009
The Evolution of Assets
Total financial Depository corporations Other financial institutions
0
10
20
30
40
50
Central bank Public Sector Corporate Sector
Other Residents
Nonresidents
Sectoral Allocation of Assets (Percent of Total Assets)
2006 2009
0
5
10
15
20
25
30
35
2006 2007 2008 2009
Net Financial Position
Financial sector Depository Corporations Other Financial Corporations
-3
-2
-1
0
1
2
3
4
5
6
7
2006 2007 2008 2009
Net Foreign Currency Position
Financial Sector Depository Corporations Other Financial Corporations
16
sensitivity analysis of the impact of 30 percent devaluation on the sector shows that the sector will significantly improve its financial position following devaluation. Reflecting low profits in recent years, the balance sheet of the nonfinancial corporate sector shows a deterioration in the capital structure as debt has increased by about 5 percentage points since 2008.
Figure 5. The Non-Financial Corporate Sector: Indicators of Vulnerability (Percent of GDP)
Source: Author’s calculations based on BSA matrices
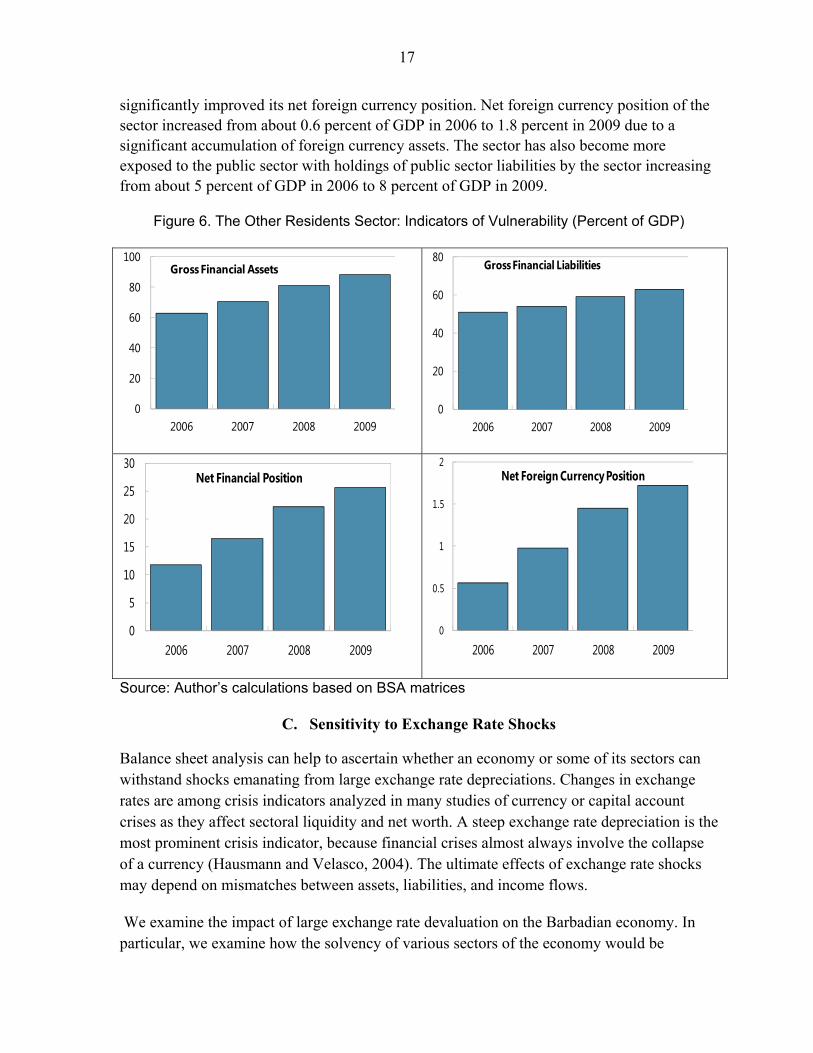
The Other Domestic Residents Sector Vulnerabilities in the other residents sector seem to be limited despite an increase in liabilities. Total liabilities increased from 50 percent of GDP in 2006 to roughly 65 percent of GDP in 2009 as households increased their debts with the banking system. However households improved their net financial position owing to accumulation of assets with the banking system making them less vulnerable to solvency problems. It important to emphasize that as the banking system passed some household savings on to cover the government’s long term financing needs, households’ indirect exposure to the sovereign increased. Foreign currency mismatches in the sector are limited as the sector has
0
10
20
30
40
50
2006 2007 2008 2009
Gross Financial Assets
26
27
28
29
30
31
32
33
2006 2007 2008 2009
Gross Liabilities
0
2
4
6
8
10
12
14
16
2006 2007 2008 2009
Net Financial Position
0
2
4
6
8
10
12
14
16
18
20
2006 2007 2008 2009
Net Foreign Currency Position
17
significantly improved its net foreign currency position. Net foreign currency position of the sector increased from about 0.6 percent of GDP in 2006 to 1.8 percent in 2009 due to a significant accumulation of foreign currency assets. The sector has also become more exposed to the public sector with holdings of public sector liabilities by the sector increasing from about 5 percent of GDP in 2006 to 8 percent of GDP in 2009.
Figure 6. The Other Residents Sector: Indicators of Vulnerability (Percent of GDP)
Source: Author’s calculations based on BSA matrices
C. Sensitivity to Exchange Rate Shocks
Balance sheet analysis can help to ascertain whether an economy or some of its sectors can withstand shocks emanating from large exchange rate depreciations. Changes in exchange rates are among crisis indicators analyzed in many studies of currency or capital account crises as they affect sectoral liquidity and net worth. A steep exchange rate depreciation is the most prominent crisis indicator, because financial crises almost always involve the collapse of a currency (Hausmann and Velasco, 2004). The ultimate effects of exchange rate shocks may depend on mismatches between assets, liabilities, and income flows.
We examine the impact of large exchange rate devaluation on the Barbadian economy. In particular, we examine how the solvency of various sectors of the economy would be
0
20
40
60
80
100
2006 2007 2008 2009
Gross Financial Assets
0
20
40
60
80
2006 2007 2008 2009
Gross Financial Liabilities
0
5
10
15
20
25
30
2006 2007 2008 2009
Net Financial Position
0
0.5
1
1.5
2
2006 2007 2008 2009
Net Foreign Currency Position
18
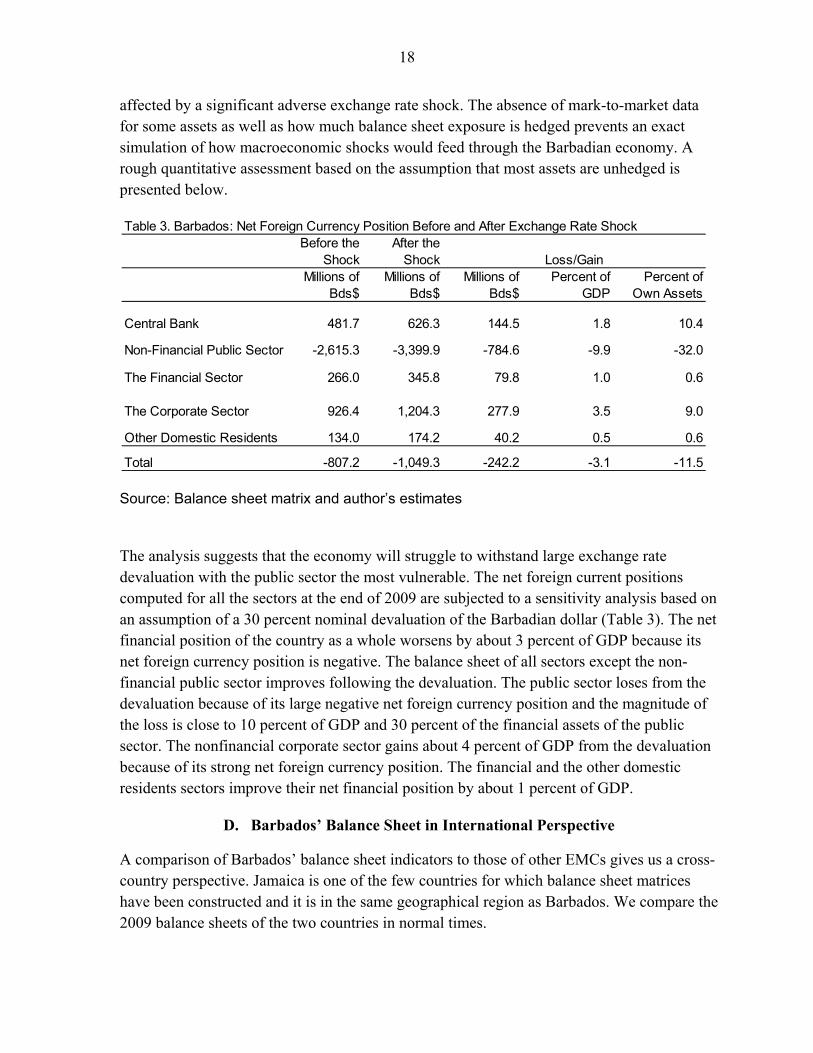
affected by a significant adverse exchange rate shock. The absence of mark-to-market data for some assets as well as how much balance sheet exposure is hedged prevents an exact simulation of how macroeconomic shocks would feed through the Barbadian economy. A rough quantitative assessment based on the assumption that most assets are unhedged is presented below.
Source: Balance sheet matrix and author’s estimates
The analysis suggests that the economy will struggle to withstand large exchange rate devaluation with the public sector the most vulnerable. The net foreign current positions computed for all the sectors at the end of 2009 are subjected to a sensitivity analysis based on an assumption of a 30 percent nominal devaluation of the Barbadian dollar (Table 3). The net financial position of the country as a whole worsens by about 3 percent of GDP because its net foreign currency position is negative. The balance sheet of all sectors except the non-financial public sector improves following the devaluation. The public sector loses from the devaluation because of its large negative net foreign currency position and the magnitude of the loss is close to 10 percent of GDP and 30 percent of the financial assets of the public sector. The nonfinancial corporate sector gains about 4 percent of GDP from the devaluation because of its strong net foreign currency position. The financial and the other domestic residents sectors improve their net financial position by about 1 percent of GDP.
D. Barbados’ Balance Sheet in International Perspective
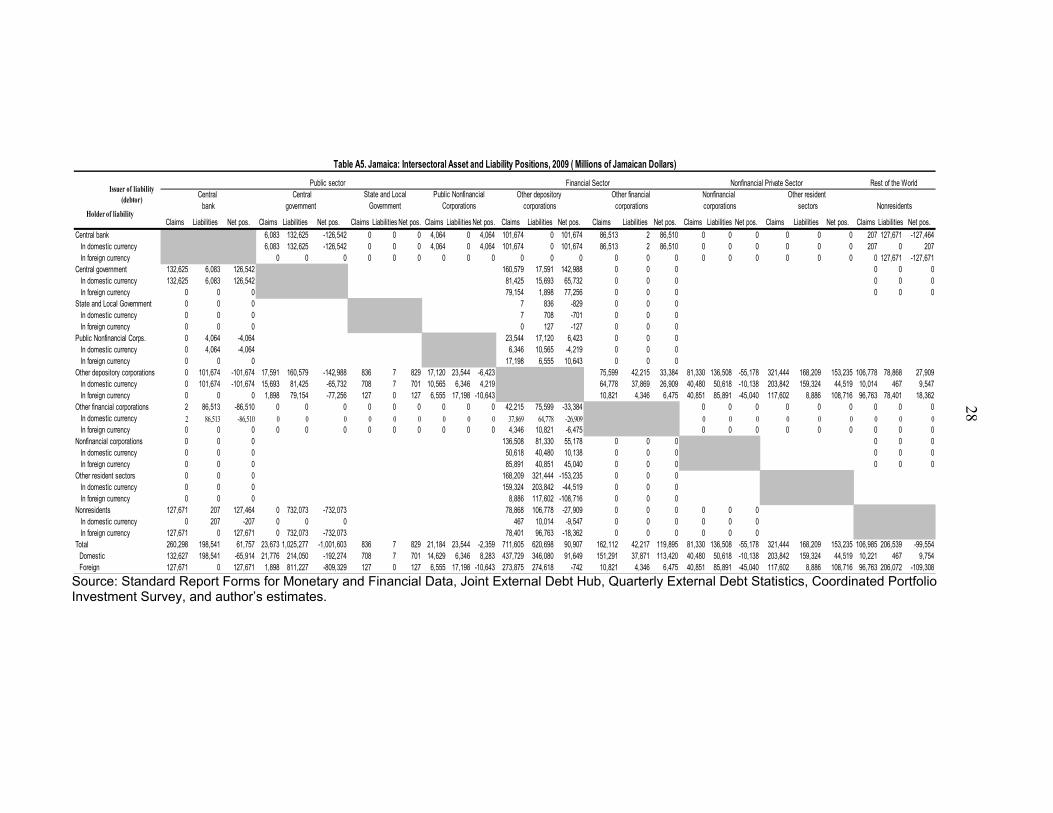
A comparison of Barbados’ balance sheet indicators to those of other EMCs gives us a cross-country perspective. Jamaica is one of the few countries for which balance sheet matrices have been constructed and it is in the same geographical region as Barbados. We compare the 2009 balance sheets of the two countries in normal times.
Table 3. Barbados: Net Foreign Currency Position Before and After Exchange Rate ShockBefore the
ShockAfter the
ShockMillions of
Bds$Millions of
Bds$Millions of
Bds$Percent of
GDPPercent of
Own Assets
Central Bank 481.7 626.3 144.5 1.8 10.4
Non-Financial Public Sector -2,615.3 -3,399.9 -784.6 -9.9 -32.0
The Financial Sector 266.0 345.8 79.8 1.0 0.6
The Corporate Sector 926.4 1,204.3 277.9 3.5 9.0
Other Domestic Residents 134.0 174.2 40.2 0.5 0.6
Total -807.2 -1,049.3 -242.2 -3.1 -11.5
Loss/Gain
19
The balance sheet information suggests that as of 2009 vulnerabilities were lower in Barbados than in Jamaica. Barbados’ gross financial assets stood at 400 percent of GDP compared with 148 percent for Jamaica, indicating that financial deepening is greater in Barbados. However, financial integration with the ROW measured as foreign assets and liabilities relative to GDP is greater in Jamaica than Barbados because of the high level of external debt in Jamaica (82 percent of GDP compared with 99 percent of GDP for Jamaica).
The following differences and similarities are also worth noting (Tables A4 and A5):
In both countries, the public sector is the most vulnerable sector because of the high levels of liabilities accumulated in recent times. However, the vulnerability appears smaller in Barbados with a net foreign currency position of 35 percent of GDP to Jamaica’s 95 percent of GDP.
Similarly, both countries have a negative net financial position with the rest of the world. However, Barbados’ net financial position with the ROW is lower (around 10 percent of GDP) than that of Jamaica (almost 60 percent).
As might be expected from the financial deepening, corporations in Barbados have more access to the financial sector than their peers in Jamaica. The financial sector’s claims on the nonfinancial corporate sector in 2009 were 32 percent of GDP in Barbados and 13 percent of GDP in Jamaica. In both countries, nonfinancial corporations have a negative net position against the financial sector.
In both countries, corporations rely less on nonresidents for funding and more on the domestic financial system.
The financial system’s liabilities to nonresidents are higher in Barbados (12 percent of GDP) than in Jamaica (10 percent).
The relatively strong balance sheets position of the financial and the non financial corporate sectors makes a crisis originating from the private sector less likely in Barbados. The financial and the corporate sectors and the economy in Barbados have a positive net foreign currency position limiting vulnerabilities from exchange rate changes. The low level of domestic foreign currency loans and deposits is also a plus in Barbados.
VI. SUMMARY AND CONCLUSIONS
The main finding of the analysis is that the balance sheet of the aggregate economy has been weakened by the recent deterioration in the balance sheet of the nonfinancial public sector. The balance sheet of private sector, however, seems to be healthy and resilient to shocks. This conclusion, based on our estimates of 2009 balance sheet matrices, would not be much altered if 2010 and 2011 matrices could be constructed. The rising current account deficit has led to a deterioration in the net financial position of the economy with respect to nonresidents. The result also shows that the country has a negative net foreign currency
20
mainly due to the accumulation of external liabilities by the public sector implying that the aggregate economy has insufficient foreign currency assets to cover foreign currency liabilities. That said, the private sector has a positive net foreign currency position and could withstand a large foreign exchange shock easily.
Reflecting weak fiscal performance, the balance sheet of the NFPS has deteriorated significantly. The net financial and foreign currency positions are negative, which might expose the sector to solvency and exchange rate risks. However, these risks are moderate, especially since the NFPS is a debtor mostly to domestic creditors and the largest share of public debt is denominated in domestic currency. The negative net financial position remains a major concern unless the government starts running primary surpluses. A devaluation of the Barbados dollar would hurt the public sector. A sovereign debt crisis would critically affect the banking system and the other domestic residents sector.
Vulnerabilities appear limited in the nonfinancial corporate sector and the household sector because of strong net financial and net foreign currency positions. The net financial position of the households improved due to accumulation of assets with the banking system. However, as banks passed some household savings to finance the public sector, households have increased their indirect exposure to the public sector. The corporate sector has also reduced exposure to exchange rate risk. The sector has a positive net foreign currency position as high profitability enabled the sector to accumulate foreign currency assets. A devaluation of the Barbados dollar would improve the balance sheets of the household and the nonfinancial corporate sectors.
The financial system does not present major vulnerabilities. The sector has a positive net foreign currency position implying that the balance sheet of the sector would improve following a devaluation of the Barbados dollar. The positive foreign currency position does not mean that the banking sector is completely shielded from an exchange rate devaluation. It could be affected indirectly should some of its debtors face liquidity problems associated with a devaluation. Increasing credit exposure to the nonfinancial private sector and households, bears watching, but financial health indicators are robust.
The analysis at the end of 2009 suggests the need to reduce macroeconomic vulnerabilities by:
Reducing the level of public debt both to decrease the vulnerability of the sector and to limit exposure to the financial system and the household sector. It is therefore essential to push ahead and aggressively implement the medium term fiscal strategy.
Continue to accumulate foreign reserves in both the central bank and the commercial banks while monitoring and containing reserve money growth.
21
Strengthen regulation and supervision to limit foreign currency mismatches in the financial sector and promote market based hedging mechanisms that would allow domestic sectors to manage foreign exchange exposures.
Promote the development of domestic securities markets to allow the other domestic residents sector and the financial system to diversify away from the non-financial public sector.
22
REFERENCES
Aghion Philipe, Phillipe Baccheta, and Abhijit Banerjee, 2000, “A Simple Model of Monetary Policy in an Economy with Credit Constraints,” European Economic Review, Vol. 45, pp. 1121–50.
__________, 2001, “A Corporate Balance Sheet Approach to Financial Crisis,” Journal of Economic Theory, Vol. 119 (1), pp 6–30.
Allen et al., 2002, “A Balance Sheet Approach to Financial Crisis,” IMF Working Paper 02/210, (Washington: International Monetary Fund).
Amo-Yartey Charles, and Nkusu Mwanza, 2007, Assessing Macroeconomic Vulnerabilities in South Africa: An Application of the Balance Sheet Approach, IMF Country Report, (Washington, International Monetary Fund).
Aron, Janine and John Muellbauer, 2006, “Housing Wealth, Credit Conditions and Consumption,” CSAE Working Paper 2006–08, (Oxford: Center for the Study of African Economies).
__________, and Johan Prinsloo, 2006, “Towards Official Balance Sheet Estimates for South Africa’s Household Sector,” CSAE Working Paper/2006–09, (Oxford: Center for the Study of African Economies).
Billmeier, Andreas. and Johan Mathisen, 2006, “Analyzing Balance Sheet Vulnerabilities in a Dollarized Economy: The Case of Georgia,” IMF Working Paper 06/173, (Washington: International Monetary Fund).
Bordo D. Michael and Christopher M. Meissner, 2005, “The Role of Foreign Currency Debt in Financial Crises: 1880–1913 vs. 1972–1997,” NBER Working Paper 11897, (Cambridge: National Bureau of Economic Research).
Calvo Guillermo, Alejandro Izquierdo, and Luis-Fernando Mejia, 2004, “On the Empirics of Sudden Stops: The Relevance of Balance Sheet Effects,” NBER Working Paper 10520, (Boston: National Bureau of Economic Research).
Cayazzo, Jorge and Jay Surti, 2004, “The Seychelles Banking System: Prospects and Vulnerabilities,” Seychelles—Selected Issues and Statistical Appendix, SM/04/433, 12/27/04 (Washington: International Monetary Fund).
Daseking, Christina, 2005, “Thailand: An Aggregate Balance Sheet Analysis,” Thailand—Selected Issues, IMF Country Report 04/1, pp.5–15 (Washington: International Monetary Fund).
Dornbusch, Rudiger, 2001, A Primer on Emerging Market Crises, available on the web at (http://www.mit.edu/~rudi/media/PDFs/crisesprimer.pdg)
23
Flood, Robert and Peter Garber, 1984, “Collapsing Exchange Rate Regimes: Some Linear Examples,” Journal of International Economics, Vol. 17, pp.1–13, (Gapen et al., 2005).
Halikias, Ioannis, 2005, “Assessing Ukraine’s Vulnerabilities from a Balance Sheet Perspective,” Ukraine—Selected Issues, IMF Country Report 05/20, pp. 75–85 (Washington, International Monetary Fund).
Hilaire, Alvin and Anna Ilyina, 2007, “External Debt and Balance-Sheet Vulnerabilities in Croatia, ” Croatia—Selected Issues, IMF Country Report 07/82, February, pp. 55–79 (Washington: International Monetary Fund).
Kaminsky, Graciela, 1999, “Currency and Banking Crises: The Early Warnings of Distress,” IMF Working Paper No. 99/178, (Washington: International Monetary Fund).
__________, and Carmen M. Reinhart, 1999, ‘The Twin Crises: The Causes of Banking and Balance-of-Payments Problems,” American Economic Review, Vol. 89, pp. 473–500
Keller, Christian, 2004, “Analyzing a Highly Dollarized Economy from a Balance Sheet Perspective,” Peru—Selected Issues, IMF Country Report 04/253 (Washington: International Monetary Fund).
Krugman, Paul, 1979, “A Model of Balance of Payments Crises,” Journal of Money, Credit and Banking, Vol. 11, pp.311–325.
Sole, Juan, Julian Di Giovanni, and Edward Gardner, 2006, “Balance Sheet Analysis of Lebanon’s Vulnerabilities,” Lebanon—Selected Issues, IMF Country Report 06/200, pp. 4–15 (Washington: International Monetary Fund).
Lagos, Martin, 2002, “The Argentine Banking Crisis 2001–2002,” Report prepared for the Argentine Bankers Association.
Lima et al. 2006, “Sectoral Balance Sheet Mismatches and Macroeconomic Vulnerabilities in Colombia, 1996–2003,” IMF Working Paper 06/5, (Washington DC: International Monetary Fund).
Mathisen, Johan, and Mariana Torres, 2005, “Balance Sheet Currency Mismatch and Liquidity Analysis,” Belize—Selected Issues, IMF Country Report 04/156, pp. 16–26 (Washington: International Monetary Fund).
__________, Anthony Pellechio, 2006, “Using the Balance Sheet Approach in Surveillance: Framework, Data Sources, and Data Availability,” IMF Working Paper 06/100, (Washington DC: International Monetary Fund).
Rosenberg et al. 2005, “Debt-Related Vulnerabilities and Financial Crises: An Application of the Balance Sheet Approach to Emerging Market Countries, Occasional Paper 240, (Washington DC: International Monetary Fund).
24
Roubini, Nouriel, 2001, “Should Argentina Dollarize or Float? The Pros and Cons of Alternative Exchange Rate Regimes and their Implications for Domestic and Foreign Debt Restructuring Reduction,” (unpublished, New York: Stern School of Business, New York University).
__________, Brad Setser, 2005, Bailouts or Bail-ins? Responding to Financial Crises in Emerging Economies, (Washington: Institute for International Economics).
Sachs, Jeffrey and Steven Radelett, 1998, “The Onset of the East Asian Financial Crisis,” NBER Working Paper No. 6680, (Boston: National Bureau of Economic Research).
Traa, Bob, 2003, “The Balance Sheet as an Indicator of Sustainable Fiscal Policies,” Ecuador—Selected Issues and Statistical Appendix, IMF Country Report 03/91, pp. 37–43 (Washington: International Monetary Fund).
25
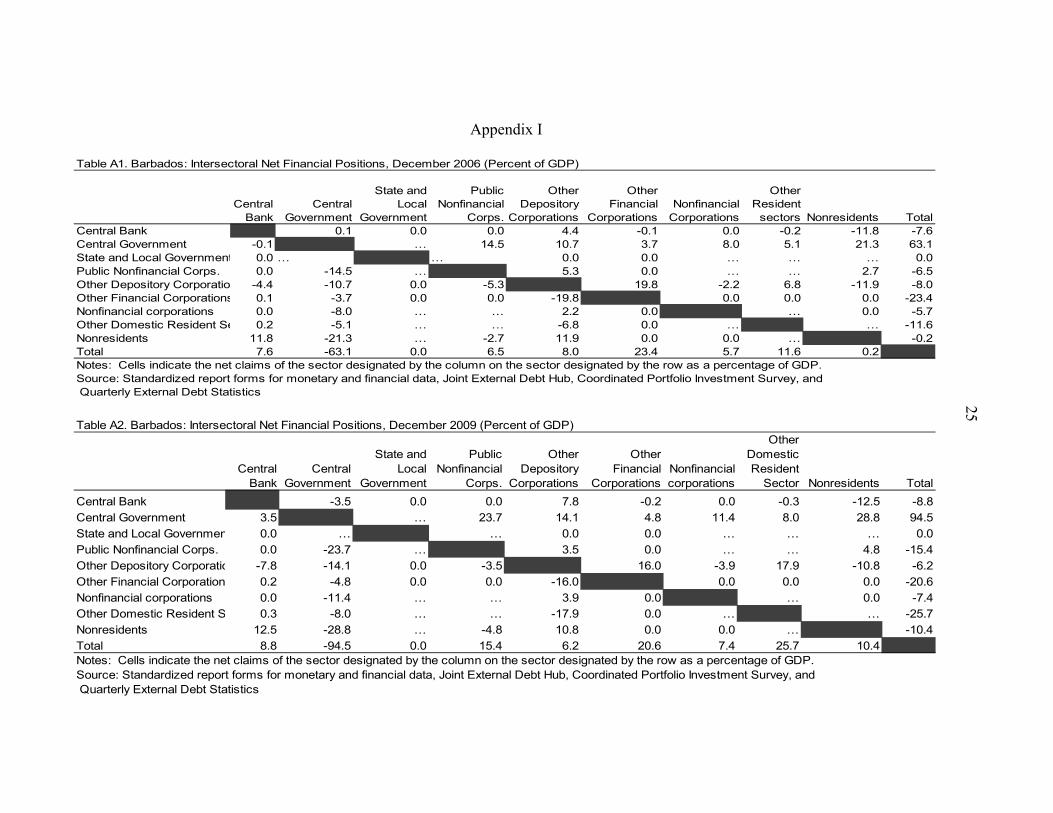
Appendix I
Table A1. Barbados: Intersectoral Net Financial Positions, December 2006 (Percent of GDP)
Central Bank
Central Government
State and Local
Government
Public Nonfinancial
Corps.
Other Depository
Corporations
Other Financial
CorporationsNonfinancial
Corporations
Other Resident
sectors Nonresidents TotalCentral Bank 0.1 0.0 0.0 4.4 -0.1 0.0 -0.2 -11.8 -7.6Central Government -0.1 … 14.5 10.7 3.7 8.0 5.1 21.3 63.1State and Local Government 0.0 … … 0.0 0.0 … … … 0.0Public Nonfinancial Corps. 0.0 -14.5 … 5.3 0.0 … … 2.7 -6.5Other Depository Corporatio -4.4 -10.7 0.0 -5.3 19.8 -2.2 6.8 -11.9 -8.0Other Financial Corporations 0.1 -3.7 0.0 0.0 -19.8 0.0 0.0 0.0 -23.4Nonfinancial corporations 0.0 -8.0 … … 2.2 0.0 … 0.0 -5.7Other Domestic Resident Se 0.2 -5.1 … … -6.8 0.0 … … -11.6Nonresidents 11.8 -21.3 … -2.7 11.9 0.0 0.0 … -0.2Total 7.6 -63.1 0.0 6.5 8.0 23.4 5.7 11.6 0.2Notes: Cells indicate the net claims of the sector designated by the column on the sector designated by the row as a percentage of GDP.Source: Standardized report forms for monetary and financial data, Joint External Debt Hub, Coordinated Portfolio Investment Survey, and Quarterly External Debt Statistics
Table A2. Barbados: Intersectoral Net Financial Positions, December 2009 (Percent of GDP)
Central Bank
Central Government
State and Local
Government
Public Nonfinancial
Corps.
Other Depository
Corporations
Other Financial
CorporationsNonfinancial corporations
Other Domestic Resident
Sector Nonresidents Total
Central Bank -3.5 0.0 0.0 7.8 -0.2 0.0 -0.3 -12.5 -8.8
Central Government 3.5 … 23.7 14.1 4.8 11.4 8.0 28.8 94.5
State and Local Governmen 0.0 … … 0.0 0.0 … … … 0.0
Public Nonfinancial Corps. 0.0 -23.7 … 3.5 0.0 … … 4.8 -15.4
Other Depository Corporatio -7.8 -14.1 0.0 -3.5 16.0 -3.9 17.9 -10.8 -6.2
Other Financial Corporation 0.2 -4.8 0.0 0.0 -16.0 0.0 0.0 0.0 -20.6
Nonfinancial corporations 0.0 -11.4 … … 3.9 0.0 … 0.0 -7.4Other Domestic Resident S 0.3 -8.0 … … -17.9 0.0 … … -25.7
Nonresidents 12.5 -28.8 … -4.8 10.8 0.0 0.0 … -10.4
Total 8.8 -94.5 0.0 15.4 6.2 20.6 7.4 25.7 10.4Notes: Cells indicate the net claims of the sector designated by the column on the sector designated by the row as a percentage of GDP.Source: Standardized report forms for monetary and financial data, Joint External Debt Hub, Coordinated Portfolio Investment Survey, and Quarterly External Debt Statistics
26
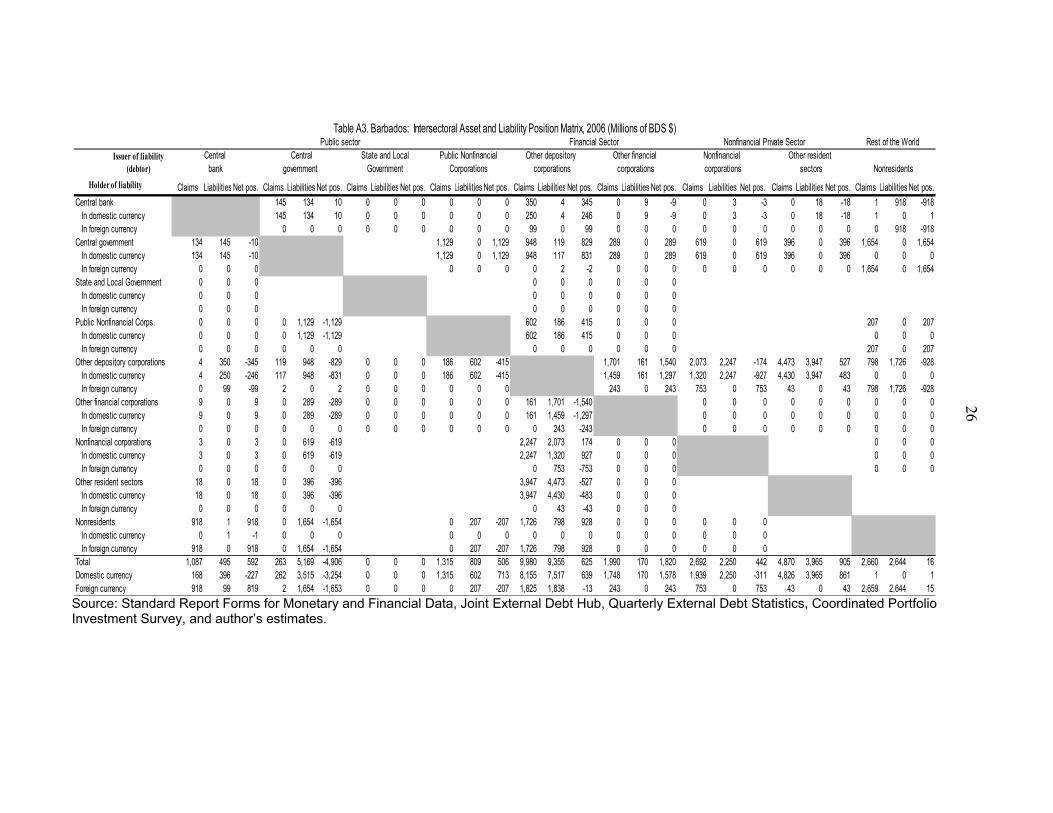
Source: Standard Report Forms for Monetary and Financial Data, Joint External Debt Hub, Quarterly External Debt Statistics, Coordinated Portfolio Investment Survey, and author’s estimates.
Financial Sector Nonfinancial Private Sector Rest of the World Central Central Other depository Other financial Nonfinancial Other resident
bank government corporations corporations corporations sectors Nonresidents
Claims Liabilities Net pos. Claims Liabilities Net pos. Claims Liabilities Net pos. Claims Liabilities Net pos. Claims Liabilities Net pos. Claims Liabilities Net pos. Claims Liabilities Net pos. Claims Liabilities Net pos. Claims Liabilities Net pos.
Central bank 145 134 10 0 0 0 0 0 0 350 4 345 0 9 -9 0 3 -3 0 18 -18 1 918 -918 In domestic currency 145 134 10 0 0 0 0 0 0 250 4 246 0 9 -9 0 3 -3 0 18 -18 1 0 1 In foreign currency 0 0 0 0 0 0 0 0 0 99 0 99 0 0 0 0 0 0 0 0 0 0 918 -918Central government 134 145 -10 1,129 0 1,129 948 119 829 289 0 289 619 0 619 396 0 396 1,654 0 1,654 In domestic currency 134 145 -10 1,129 0 1,129 948 117 831 289 0 289 619 0 619 396 0 396 0 0 0 In foreign currency 0 0 0 0 0 0 0 2 -2 0 0 0 0 0 0 0 0 0 1,654 0 1,654State and Local Government 0 0 0 0 0 0 0 0 0 In domestic currency 0 0 0 0 0 0 0 0 0 In foreign currency 0 0 0 0 0 0 0 0 0Public Nonfinancial Corps. 0 0 0 0 1,129 -1,129 602 186 415 0 0 0 207 0 207 In domestic currency 0 0 0 0 1,129 -1,129 602 186 415 0 0 0 0 0 0 In foreign currency 0 0 0 0 0 0 0 0 0 0 0 0 207 0 207Other depository corporations 4 350 -345 119 948 -829 0 0 0 186 602 -415 1,701 161 1,540 2,073 2,247 -174 4,473 3,947 527 798 1,726 -928 In domestic currency 4 250 -246 117 948 -831 0 0 0 186 602 -415 1,459 161 1,297 1,320 2,247 -927 4,430 3,947 483 0 0 0 In foreign currency 0 99 -99 2 0 2 0 0 0 0 0 0 243 0 243 753 0 753 43 0 43 798 1,726 -928Other financial corporations 9 0 9 0 289 -289 0 0 0 0 0 0 161 1,701 -1,540 0 0 0 0 0 0 0 0 0 In domestic currency 9 0 9 0 289 -289 0 0 0 0 0 0 161 1,459 -1,297 0 0 0 0 0 0 0 0 0 In foreign currency 0 0 0 0 0 0 0 0 0 0 0 0 0 243 -243 0 0 0 0 0 0 0 0 0Nonfinancial corporations 3 0 3 0 619 -619 2,247 2,073 174 0 0 0 0 0 0 In domestic currency 3 0 3 0 619 -619 2,247 1,320 927 0 0 0 0 0 0 In foreign currency 0 0 0 0 0 0 0 753 -753 0 0 0 0 0 0Other resident sectors 18 0 18 0 396 -396 3,947 4,473 -527 0 0 0 In domestic currency 18 0 18 0 396 -396 3,947 4,430 -483 0 0 0 In foreign currency 0 0 0 0 0 0 0 43 -43 0 0 0Nonresidents 918 1 918 0 1,654 -1,654 0 207 -207 1,726 798 928 0 0 0 0 0 0 In domestic currency 0 1 -1 0 0 0 0 0 0 0 0 0 0 0 0 0 0 0 In foreign currency 918 0 918 0 1,654 -1,654 0 207 -207 1,726 798 928 0 0 0 0 0 0Total 1,087 495 592 263 5,169 -4,906 0 0 0 1,315 809 506 9,980 9,355 625 1,990 170 1,820 2,692 2,250 442 4,870 3,965 905 2,660 2,644 16Domestic currency 168 396 -227 262 3,515 -3,254 0 0 0 1,315 602 713 8,155 7,517 639 1,748 170 1,578 1,939 2,250 -311 4,826 3,965 861 1 0 1Foreign currency 918 99 819 2 1,654 -1,653 0 0 0 0 207 -207 1,825 1,838 -13 243 0 243 753 0 753 43 0 43 2,659 2,644 15
Table A3. Barbados: Intersectoral Asset and Liability Position Matrix, 2006 (Millions of BDS $)
Government Corporations
Public sector State and Local Public Nonfinancial
Holder of liability
Issuer of liability (debtor)
27
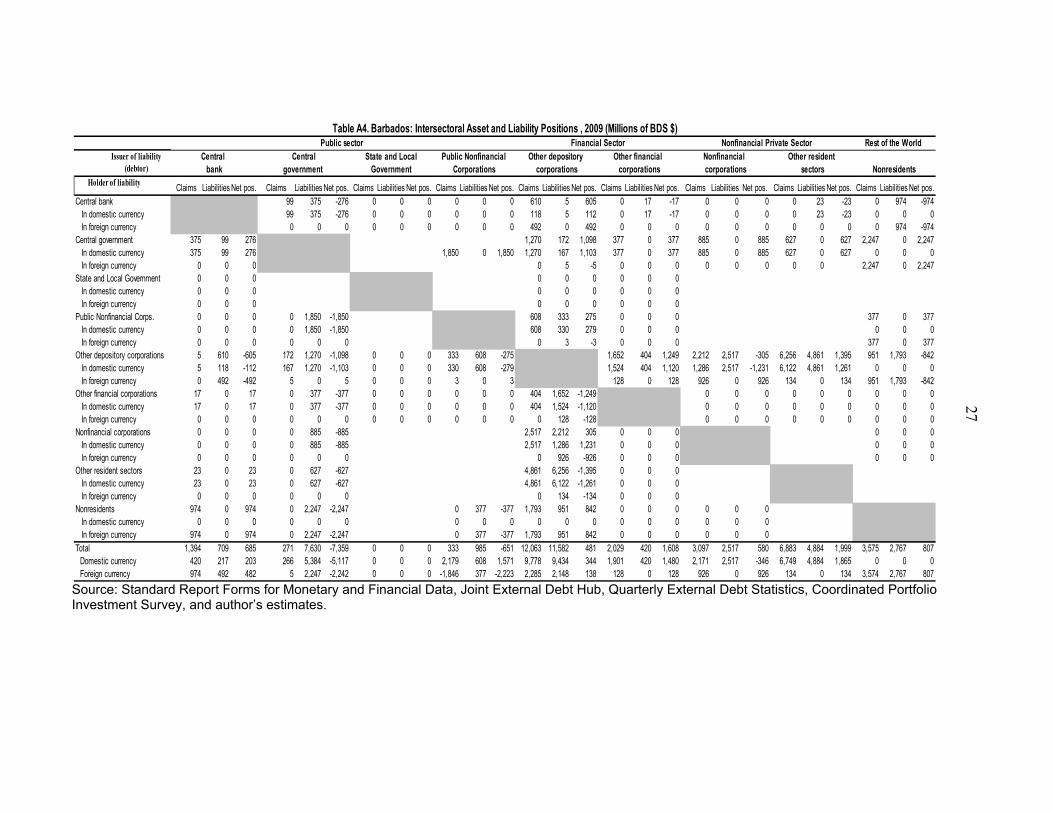
Source: Standard Report Forms for Monetary and Financial Data, Joint External Debt Hub, Quarterly External Debt Statistics, Coordinated Portfolio Investment Survey, and author’s estimates.
Table A4. Barbados: Intersectoral Asset and Liability Positions , 2009 (Millions of BDS $)Financial Sector Nonfinancial Private Sector Rest of the World
Central Central Other depository Other financial Nonfinancial Other residentbank government corporations corporations corporations sectors Nonresidents
Claims Liabilities Net pos. Claims Liabilities Net pos. Claims Liabilities Net pos. Claims Liabilities Net pos. Claims Liabilities Net pos. Claims Liabilities Net pos. Claims Liabilities Net pos. Claims Liabilities Net pos. Claims Liabilities Net pos.Central bank 99 375 -276 0 0 0 0 0 0 610 5 605 0 17 -17 0 0 0 0 23 -23 0 974 -974 In domestic currency 99 375 -276 0 0 0 0 0 0 118 5 112 0 17 -17 0 0 0 0 23 -23 0 0 0 In foreign currency 0 0 0 0 0 0 0 0 0 492 0 492 0 0 0 0 0 0 0 0 0 0 974 -974Central government 375 99 276 1,270 172 1,098 377 0 377 885 0 885 627 0 627 2,247 0 2,247 In domestic currency 375 99 276 1,850 0 1,850 1,270 167 1,103 377 0 377 885 0 885 627 0 627 0 0 0 In foreign currency 0 0 0 0 5 -5 0 0 0 0 0 0 0 0 2,247 0 2,247State and Local Government 0 0 0 0 0 0 0 0 0 In domestic currency 0 0 0 0 0 0 0 0 0 In foreign currency 0 0 0 0 0 0 0 0 0Public Nonfinancial Corps. 0 0 0 0 1,850 -1,850 608 333 275 0 0 0 377 0 377 In domestic currency 0 0 0 0 1,850 -1,850 608 330 279 0 0 0 0 0 0 In foreign currency 0 0 0 0 0 0 0 3 -3 0 0 0 377 0 377Other depository corporations 5 610 -605 172 1,270 -1,098 0 0 0 333 608 -275 1,652 404 1,249 2,212 2,517 -305 6,256 4,861 1,395 951 1,793 -842 In domestic currency 5 118 -112 167 1,270 -1,103 0 0 0 330 608 -279 1,524 404 1,120 1,286 2,517 -1,231 6,122 4,861 1,261 0 0 0 In foreign currency 0 492 -492 5 0 5 0 0 0 3 0 3 128 0 128 926 0 926 134 0 134 951 1,793 -842Other financial corporations 17 0 17 0 377 -377 0 0 0 0 0 0 404 1,652 -1,249 0 0 0 0 0 0 0 0 0 In domestic currency 17 0 17 0 377 -377 0 0 0 0 0 0 404 1,524 -1,120 0 0 0 0 0 0 0 0 0 In foreign currency 0 0 0 0 0 0 0 0 0 0 0 0 0 128 -128 0 0 0 0 0 0 0 0 0Nonfinancial corporations 0 0 0 0 885 -885 2,517 2,212 305 0 0 0 0 0 0 In domestic currency 0 0 0 0 885 -885 2,517 1,286 1,231 0 0 0 0 0 0 In foreign currency 0 0 0 0 0 0 0 926 -926 0 0 0 0 0 0Other resident sectors 23 0 23 0 627 -627 4,861 6,256 -1,395 0 0 0 In domestic currency 23 0 23 0 627 -627 4,861 6,122 -1,261 0 0 0 In foreign currency 0 0 0 0 0 0 0 134 -134 0 0 0Nonresidents 974 0 974 0 2,247 -2,247 0 377 -377 1,793 951 842 0 0 0 0 0 0 In domestic currency 0 0 0 0 0 0 0 0 0 0 0 0 0 0 0 0 0 0 In foreign currency 974 0 974 0 2,247 -2,247 0 377 -377 1,793 951 842 0 0 0 0 0 0Total 1,394 709 685 271 7,630 -7,359 0 0 0 333 985 -651 12,063 11,582 481 2,029 420 1,608 3,097 2,517 580 6,883 4,884 1,999 3,575 2,767 807
Domestic currency 420 217 203 266 5,384 -5,117 0 0 0 2,179 608 1,571 9,778 9,434 344 1,901 420 1,480 2,171 2,517 -346 6,749 4,884 1,865 0 0 0Foreign currency 974 492 482 5 2,247 -2,242 0 0 0 -1,846 377 -2,223 2,285 2,148 138 128 0 128 926 0 926 134 0 134 3,574 2,767 807
Government Corporations
Public sector State and Local Public Nonfinancial
Holder of liability
Issuer of liability (debtor)
28
Source: Standard Report Forms for Monetary and Financial Data, Joint External Debt Hub, Quarterly External Debt Statistics, Coordinated Portfolio Investment Survey, and author’s estimates.
Table A5. Jamaica: Intersectoral Asset and Liability Positions, 2009 ( Millions of Jamaican Dollars)Financial Sector Nonfinancial Private Sector Rest of the World
Central Central Other depository Other financial Nonfinancial Other residentbank government corporations corporations corporations sectors Nonresidents
Claims Liabilities Net pos. Claims Liabilities Net pos. Claims Liabilities Net pos. Claims Liabilities Net pos. Claims Liabilities Net pos. Claims Liabilities Net pos. Claims Liabilities Net pos. Claims Liabilities Net pos. Claims Liabilities Net pos.
Central bank 6,083 132,625 -126,542 0 0 0 4,064 0 4,064 101,674 0 101,674 86,513 2 86,510 0 0 0 0 0 0 207 127,671 -127,464 In domestic currency 6,083 132,625 -126,542 0 0 0 4,064 0 4,064 101,674 0 101,674 86,513 2 86,510 0 0 0 0 0 0 207 0 207 In foreign currency 0 0 0 0 0 0 0 0 0 0 0 0 0 0 0 0 0 0 0 0 0 0 127,671 -127,671Central government 132,625 6,083 126,542 160,579 17,591 142,988 0 0 0 0 0 0 In domestic currency 132,625 6,083 126,542 81,425 15,693 65,732 0 0 0 0 0 0 In foreign currency 0 0 0 79,154 1,898 77,256 0 0 0 0 0 0State and Local Government 0 0 0 7 836 -829 0 0 0 In domestic currency 0 0 0 7 708 -701 0 0 0 In foreign currency 0 0 0 0 127 -127 0 0 0Public Nonfinancial Corps. 0 4,064 -4,064 23,544 17,120 6,423 0 0 0 In domestic currency 0 4,064 -4,064 6,346 10,565 -4,219 0 0 0 In foreign currency 0 0 0 17,198 6,555 10,643 0 0 0Other depository corporations 0 101,674 -101,674 17,591 160,579 -142,988 836 7 829 17,120 23,544 -6,423 75,599 42,215 33,384 81,330 136,508 -55,178 321,444 168,209 153,235 106,778 78,868 27,909 In domestic currency 0 101,674 -101,674 15,693 81,425 -65,732 708 7 701 10,565 6,346 4,219 64,778 37,869 26,909 40,480 50,618 -10,138 203,842 159,324 44,519 10,014 467 9,547 In foreign currency 0 0 0 1,898 79,154 -77,256 127 0 127 6,555 17,198 -10,643 10,821 4,346 6,475 40,851 85,891 -45,040 117,602 8,886 108,716 96,763 78,401 18,362Other financial corporations 2 86,513 -86,510 0 0 0 0 0 0 0 0 0 42,215 75,599 -33,384 0 0 0 0 0 0 0 0 0 In domestic currency 2 86,513 -86,510 0 0 0 0 0 0 0 0 0 37,869 64,778 -26,909 0 0 0 0 0 0 0 0 0 In foreign currency 0 0 0 0 0 0 0 0 0 0 0 0 4,346 10,821 -6,475 0 0 0 0 0 0 0 0 0Nonfinancial corporations 0 0 0 136,508 81,330 55,178 0 0 0 0 0 0 In domestic currency 0 0 0 50,618 40,480 10,138 0 0 0 0 0 0 In foreign currency 0 0 0 85,891 40,851 45,040 0 0 0 0 0 0Other resident sectors 0 0 0 168,209 321,444 -153,235 0 0 0 In domestic currency 0 0 0 159,324 203,842 -44,519 0 0 0 In foreign currency 0 0 0 8,886 117,602 -108,716 0 0 0Nonresidents 127,671 207 127,464 0 732,073 -732,073 78,868 106,778 -27,909 0 0 0 0 0 0 In domestic currency 0 207 -207 0 0 0 467 10,014 -9,547 0 0 0 0 0 0 In foreign currency 127,671 0 127,671 0 732,073 -732,073 78,401 96,763 -18,362 0 0 0 0 0 0Total 260,298 198,541 61,757 23,673 1,025,277 -1,001,603 836 7 829 21,184 23,544 -2,359 711,605 620,698 90,907 162,112 42,217 119,895 81,330 136,508 -55,178 321,444 168,209 153,235 106,985 206,539 -99,554
Domestic 132,627 198,541 -65,914 21,776 214,050 -192,274 708 7 701 14,629 6,346 8,283 437,729 346,080 91,649 151,291 37,871 113,420 40,480 50,618 -10,138 203,842 159,324 44,519 10,221 467 9,754Foreign 127,671 0 127,671 1,898 811,227 -809,329 127 0 127 6,555 17,198 -10,643 273,875 274,618 -742 10,821 4,346 6,475 40,851 85,891 -45,040 117,602 8,886 108,716 96,763 206,072 -109,308
Public NonfinancialCorporations
Public sector State and Local
GovernmentHolder of liability
Issuer of liability (debtor)


![IB - Barbados International Finance & Business Magazine 2010 [Barbados]](https://img.pdfslide.net/doc/110x75/5553d3efb4c905c4048b4c4b/ib-barbados-international-finance-business-magazine-2010-barbados.jpg)