Embed Size (px)
Citation preview

©2013 International Monetary Fund
IMF Country Report No. 13/269
REPUBLIC OF MOLDOVA
POVERTY REDUCTION STRATEGY PAPER This paper was prepared by the government of the Republic of Moldova. The views expressed in this document are those of government of the Republic of Moldova and do not necessarily reflect the views of the Executive Board of the IMF.
The policy of publication of staff reports and other documents allows for the deletion of market-sensitive information.
Copies of this report are available to the public from
International Monetary Fund Publication Services 700 19th Street, N.W. Washington, D.C. 20431
Telephone: (202) 623-7430 Telefax: (202) 623-7201 E-mail: [email protected] Internet: http://www.imf.org
International Monetary Fund Washington, D.C.
August 2013
Moldova 2020
N A T I O N A L D E V E L O P M E N T S T R A T E G Y :
7 S O L U T I O N S F O R E C O N O M I C G R O W T H A N D
P O V E R T Y R E D U C T I O N
2
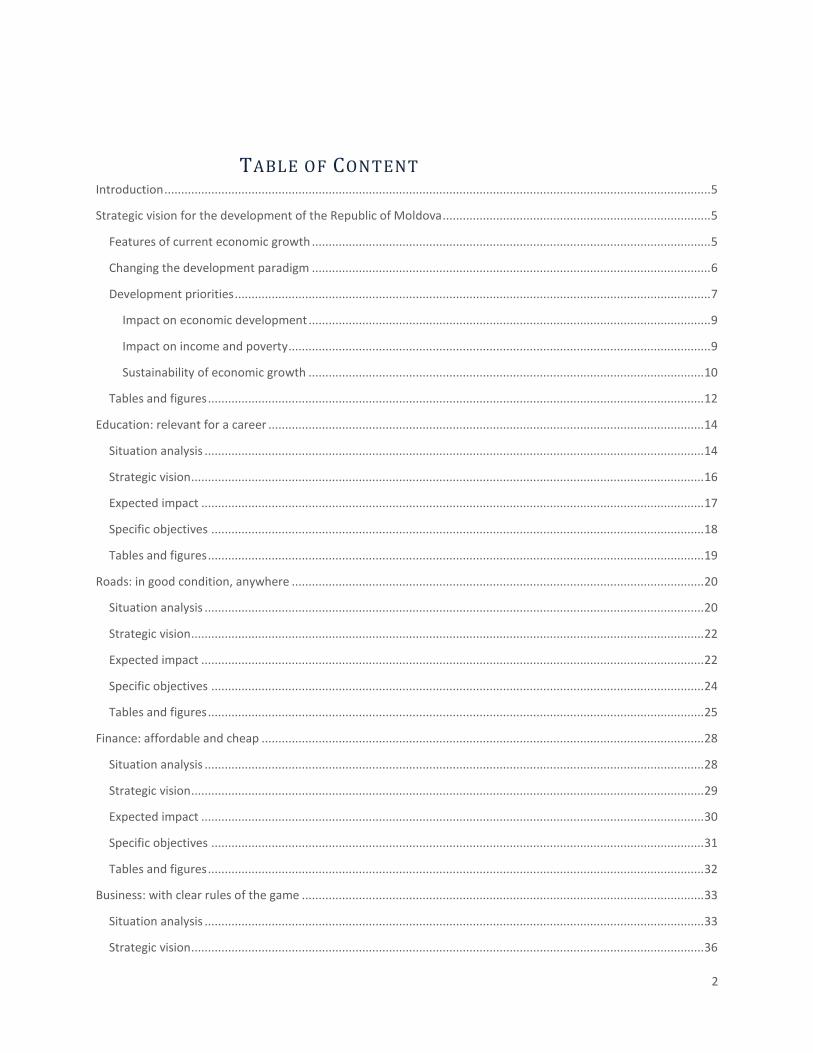
TABLE OF CONTENT Introduction ................................................................................................................................................................... 5
Strategic vision for the development of the Republic of Moldova ................................................................................ 5
Features of current economic growth ....................................................................................................................... 5
Changing the development paradigm ....................................................................................................................... 6
Development priorities .............................................................................................................................................. 7
Impact on economic development ........................................................................................................................ 9
Impact on income and poverty .............................................................................................................................. 9
Sustainability of economic growth ...................................................................................................................... 10
Tables and figures .................................................................................................................................................... 12
Education: relevant for a career .................................................................................................................................. 14
Situation analysis ..................................................................................................................................................... 14
Strategic vision ......................................................................................................................................................... 16
Expected impact ...................................................................................................................................................... 17
Specific objectives ................................................................................................................................................... 18
Tables and figures .................................................................................................................................................... 19
Roads: in good condition, anywhere ........................................................................................................................... 20
Situation analysis ..................................................................................................................................................... 20
Strategic vision ......................................................................................................................................................... 22
Expected impact ...................................................................................................................................................... 22
Specific objectives ................................................................................................................................................... 24
Tables and figures .................................................................................................................................................... 25
Finance: affordable and cheap .................................................................................................................................... 28
Situation analysis ..................................................................................................................................................... 28
Strategic vision ......................................................................................................................................................... 29
Expected impact ...................................................................................................................................................... 30
Specific objectives ................................................................................................................................................... 31
Tables and figures .................................................................................................................................................... 32
Business: with clear rules of the game ........................................................................................................................ 33
Situation analysis ..................................................................................................................................................... 33
Strategic vision ......................................................................................................................................................... 36
3
Expected impact ...................................................................................................................................................... 38
Specific objectives ................................................................................................................................................... 39
Tables and figures .................................................................................................................................................... 40
Energy: delivered safely, used efficiently .................................................................................................................... 43
Situation analysis ..................................................................................................................................................... 43
Strategic vision ......................................................................................................................................................... 45
Expected impact ...................................................................................................................................................... 46
Specific objectives ................................................................................................................................................... 47
Tables and figures .................................................................................................................................................... 48
Pension system: equitable and sustainable................................................................................................................. 52
Situation analysis ..................................................................................................................................................... 52
Strategic vision ......................................................................................................................................................... 56
Expected impact ...................................................................................................................................................... 57
Specific objectives ................................................................................................................................................... 58
Justice: responsible and incorruptible ......................................................................................................................... 59
Situation analysis ..................................................................................................................................................... 59
Strategic vision ......................................................................................................................................................... 62
Expected impact ...................................................................................................................................................... 63
Specific objectives ................................................................................................................................................... 63
Tables and figures .................................................................................................................................................... 64
Coordination of implementation, monitoring and evaluation .................................................................................... 66
Integrated cycle of planning, monitoring and evaluation ....................................................................................... 66
Operationalization process ...................................................................................................................................... 67
Interrelated aspects ................................................................................................................................................. 68
Implementation reports .......................................................................................................................................... 69
Institutional framework ........................................................................................................................................... 70
4
LIST OF TABLES AND FIGURES
Table 1. IMF estimates of GDP per capita at purchasing power parity in 2010 and 2016, USD .................................. 12
Table 2. Logistics Performance Index (LPI) for some countries in the region .............................................................. 26
Table 3. Estimates of means required to repair and maintain public roads................................................................ 27
Table 4. Republic of Moldova versus Georgia in the general Doing Business 2012 ranking ....................................... 41
Table 5. Indicators on energy resource consumption and energy intensity ............................................................... 50
Table 6. Dynamics of Termocom JSC debts ................................................................................................................. 50
Table 7. Dynamics of natural gas volume procured and delivered to consumers in Republic of Moldova................. 51
Table 8. Available technical potential of the main types of renewable energy sources (RES) .................................... 51
Table 9. Estimated economic impact of delays and postponements in courts ........................................................... 64
Figure 1. GDP annual growth forecast ......................................................................................................................... 12
Figure 2. GDP growth with and without implementation of development priorities, MDL million at 2000 prices .... 13
Figure 3. Reduction of poverty rate, % ........................................................................................................................ 13
Figure 4. Share of students enrolled in higher education versus secondary vocational education and general
specialized education .................................................................................................................................................. 19
Figure 5. Evolution of the condition of national roads during 1992-2010 .................................................................. 25
Figure 6. Funding in the road sector during 1990-2011, MDL million ......................................................................... 25
Figure 7. Statistics of road accidents for 1990-2010 ................................................................................................... 26
Figure 8. Forecast of evolution of the condition of national roads during 2011-2020 ................................................ 26
Figure 9. Risk premiums in countries in the region, percentage points ...................................................................... 32
Figure 10. Volume of stock transactions to GDP, % .................................................................................................... 32
Figure 11. Foreign direct investment flow, USD million .............................................................................................. 40
Figure 12. Number of enterprises in Republic of Moldova ......................................................................................... 40
Figure 13. Republic of Moldova versus Georgia in the Doing Business 2012 ranking ................................................. 42
Figure 14. Dynamics of electricity generation and procurement in Republic of Moldova (right bank of Nistru), KW
million .......................................................................................................................................................................... 48
Figure 15. Dynamics of losses recorded by electricity distributors in Republic of Moldova ....................................... 48
Figure 16. Dynamics of heating production in Republic of Moldova, GCal thousand ................................................. 49
Figure 17. Dynamics of heating losses in Republic of Moldova ................................................................................... 49
Figure 18. Victims of corruption, % population in bribe situations, 2008 ................................................................... 64
Figure 19. Share of cases solved in court of the total number of persons under accusation ..................................... 65
5
INTRODUCTION STRATEGIC VISION FOR THE DEVELOPMENT OF THE
REPUBLIC OF MOLDOVA
FEATURES OF CURRENT ECONOMIC GROWTH Economic growth and the poverty reduction trend is closely correlated in Republic of
Moldova with the flow of remittances and consumption generated by the latter.
Revenues from Moldovans’ work abroad have fuelled the disposable income of
households, thus leading to an increased aggregate demand for consumption.
Constrained by the limited capacity of domestic production, this demand was largely
met by imports of goods and services. The national public budget has benefited from
this, but the trade balance has turned into an alarming trade deficit.
Economic growth based on consumption and on remittances exposes the economy to a
number of vulnerabilities, but there is a greater danger associated with this model of
economic growth, i.e. that remittances, at one point in time, will start to decline.
Currently, migration breaks families of Moldovan citizens. This in itself is bad enough,
but following the evolution of migration in countries faced with this phenomenon, we
anticipate that Moldovan families will reunite. Unfortunately, if it will not be acted
firmly to create adequate working and living conditions in Moldova, migrant family
reunification will occur outside the country, which will trigger a decline in remittances.
Two conclusions emerge from the aforementioned:
first conclusion is that it will be difficult to maintain the pace of economic growth,
which, in the absence of a structural change of national economy, proves to be
unacceptable from the perspective of Republic of Moldova’s development agenda;
second conclusion refers to the actual change of the growth model, namely: the
need to replace the inertial growth model based on consumption fueled by
remittances in favor of a dynamic model based on investment and on development
of goods- and services-exporting industries.
In this context, the National Development Strategy "Moldova 2020" comes to present a
vision of cohesive long-term sustainable economic development based on a diagnostic
study of constraints to economic development. In this sense, it will consolidate and will
guide the sectoral approach characteristic for the governance program, the objectives of
which are outlined for the entire mandate period.
Also, before changing the development paradigm of Republic of Moldova’s economy,
we will continue to count on development partners’ support. Areas such as health,
culture, social protection, and environmental protection are crucial for the country’s
6
sustainable development. The focus of the National Development Strategy is to increase
the budget coverage of adequate policies in these sectors as a result of accelerated
economic development. Such a focus also requires the sustainability of foreign
assistance currently provided to the country.
CHANGING THE DEVELOPMENT PARADIGM Economic development, wherever it occurs, is based on 3 factors, namely accumulation
of capital, labor force and its productivity level, which includes and other parameters,
such as: technologies, efficient governance, skills, etc. The Government has made an
attempt to shape the historic and future development of Republic of Moldova in the
context of the National Development Strategy „Moldova 2020”.
An analysis of economic development factors in Republic of Moldova reveals a very
alarming conclusion - without a concerted effort to change the development paradigm,
the potential of growth over the next ten years is limited to a maximum of 4.5% to 5%
annually. Even this relatively moderate growth scenario is based on rigid assumptions,
that labor outflow will be stopped and remittances will remain at current levels at the
least, fact which is not guaranteed at all. Certainly, this increase is insufficient to ensure
a convergence trend with comparable countries, and even less with European
standards. According to the IMF estimates (Table 1), the Republic of Moldova is the
penultimate country, ranked in comparison with countries in the region, ahead only of
Kirgizstan in terms of GDP per capita at purchasing power parity. With an annual growth
rate of 5%, this position in the regional rankings will continue until 2016.
As per results of the analysis, growth in Republic of Moldova during 2000-2010 can be
firstly attributed to an increase in capital – productive stock of fixed capital. It had
increased on average by 8.2% annually, which is a pretty high rate, but still insufficient.
Secondly, GDP growth was also conditioned by an increase in productivity of labor and
capital (4.7% annually). Therefore, the nature of growth was more extensive rather than
intensive. Switching economic activity in the area of agricultural production,
characterized by low productivity, to the area of industry and services, where
productivity is higher, explains this relative performance. By contrast, labor dynamics
has adversely affected economic development. Migration trends that emerged during
this period have determined a lower rate of activity in the national economy, from 60%
down to 44%. Actual labor as a factor of production decreased during the last decade,
from 1.514 million to only 1.143 million in 2010 or, on average, by 2.8% annually. This
reduction undermines the positive influence of capital and productivity growth and, as a
result, erodes the recorded GDP growth. Therefore, given labor "erosion", the quite
positive statistics of the last decade in terms of capital and productivity growth were not
high enough to ensure a convergent growth path with the European average.
Overall, it took place a jobless economic growth, without a massive re-equipment of
production. In other words, the capital has increased, accompanied by a slightly
enhanced efficiency of production factor utilization, but at absolutely insufficient rates
to ensure sustainable economic development. But even modest growth rates of capital
7
and efficiency of factors of production recorded during 2000-2010 should not be
perceived as a guarantee for the next ten years. These have actually been achieved
under circumstances when the Government and entrepreneurs had a wide range of so-
called "easy targets" or reform and technological opportunities as a result of transition.
Any investment in fixed capital under any type of reforms narrows this field of
maneuvers. Once the “easy” reforms and structural adjustments have worn out their
beneficial effects, the development potential based on multi-factor productivity is
minimal. The physical volume of labor is in turn a very rigid economic variable that will
never meet elastically medium-term rational efforts of the Government to enhance it,
especially under circumstances of mobility offered by European integration.
A change in the development paradigm can only occur through a concerted effort by
both Government and society. This effort is meant to identify, as quickly as possible, and
address those gaps that still impede an economic development model focused on
raising investments in fixed capital and its increased utilization, including by increasing
labor force productivity.
As a way to increase the productive stock of capital and the knowledge regarding its use,
the economic development paradigm would imply attracting investment, developing
export industries, promoting a knowledge-based society, including strengthening
research and development activities, innovations and technological transfer geared
towards efficiency and competitiveness. Changing the development paradigm of the
Republic of Moldova will be achieved by ensuring equitable distribution of economic
development benefits for all strata of society. On the other hand, the speed, scale and
consistent approach to the broad spectrum of proposed reforms are also important. A
shift in paradigm cannot be achieved through a set of instant reforms only. Promoted
reforms will serve only as a first step in establishing a new working method and
approach towards issues by the Government and entire society. If we learn to work
together at this pace, Moldova will become a competitive country in Europe in terms of
its ability to reform and innovate, but economic development will accelerate to a rate
that will reduce, in the near future, the gap between our country and developed
European economies.
DEVELOPMENT PRIORITIES A diagnostic analysis of the constraints to economic development highlights the critical
issues, i.e. domains in terms of which Republic of Moldova is largely surpassed by
comparable countries. This approach1 has been applied successfully in several countries,
such as Brazil, Egypt, Bolivia, and Mongolia. Essentially, as long as the critical issues
remain unresolved, the investment potential of the national economy cannot be fully
realized. It is necessary to remove these investment-suppressing barriers as a matter of
priority in order to change the country's development paradigm.
On these lines, four critical issues were identified: education, roads, access to finance,
and business environment. Following a consultative process, the Government
1 “Growth Diagnostics” (2005), Ricardo Hausmann, Dani Rodrik, Andrés Velasco.
8
established major problems that, once solved, will contribute greatly to ensuring
economic growth and poverty reduction. Hence, the experience of an inefficient judicial
system endangers the development of all areas, affecting seriously both the business
environment in the country and the investment process. Other two priorities, solutions
to which can be found during the implementation timeframe of present Strategy and
which have direct impact on the poor, are: consumption of energy resources and
pension system. Health was identified as one of critical problems which leads to
reduction of labor force and to a decrease in labor productivity, but its solving is
possible by including health aspects in all long-term development priorities. As long-
term strategic objectives, the National Development Strategy "Moldova 2020" is
focused on the following development priorities:
1. Aligning the education system to labor market needs in order to enhance labor
productivity and increase employment in the economy;
2. Increasing public investment in the national and local road infrastructure, in order
to reduce transportation costs and increase the speed of access;
3. Reducing financing costs by increasing competition in the financial sector and
developing risk management tools;
4. Improving the business climate, promoting competition policies, streamlining the
regulatory framework and applying information technologies in public services for
businesses and citizens;
5. Reducing energy consumption by increasing energy efficiency and using renewable
energy sources;
6. Ensuring financial sustainability of the pension system in order to secure an
appropriate rate of wage replacement;
7. Increasing the quality and efficiency of justice and fighting corruption in order to
ensure an equitable access to public goods for all citizens.
The focus of this Strategy is to produce a social and economic impact on each of the
above-mentioned dimensions. The cumulative effect of solving the addressed problems
lies in removing the critical barriers that prevent the optimal use of resources. This
approach makes it possible to prioritize areas of state intervention and subject them to
a clearly defined objective of the Strategy: ensuring qualitative economic development
and, implicitly, poverty reduction.
The Republic of Moldova will undertake all the necessary efforts to ensure the transition
to a green economic development, which promotes sustainable development principles
and contributes to poverty reduction, including by ensuring a better governance in the
sustainable development domain, by integrating and strengthening environmental
protection aspects in all social-economic development domains of the country.
9
A determining factor in the successful accomplishment of identified priorities and
achievement of the main objective is the existence of efficient and modern state
institutions. Acceleration of institutional reforms and strengthening of capacity of public
authorities will address each identified priority. Increased quality of public services
through modernization and greater transparency and accessibility are inherent during
Strategy implementation process.
IMP ACT ON ECO NO MIC DEV ELO P MENT
GDP grew on average by 5.1% annually during 2000-2010. Certainly, some successful
years generated better growth rates (7.1% during 2000-2004, 5.2% during 2005-2008),
but there are crisis phenomena and the phenomenon of long economic waves, the
frequency of which can be estimated at around ten years. Indeed, regional and global
economic crises occurred in 1998 and 2008. High growth rates in the most favorable
years are, in fact, correction, recovery from the crisis, or crisis-preceding boom effects.
This Strategy’s economic growth forecast for 2012-2020 uses average rates of economic
growth. Certainly, higher annual rates will be registered by case, specifically over short
term, and lower annual rates will be registered during correction periods or eventual
crises.
The base case scenario, which regards a continuation of trends of the last decade,
implies that we develop as we did so far, with the same economic, social, political
phenomena, with rising remittances and the same pace of reforms. The base case
scenario estimates an average annual GDP growth of 4.7% during 2012-2020. But what
happens if we succeed in changing the paradigm of economic development?
The implementation of the present Strategy’s priorities, considering the direct and
quantifiable effects of each priority, supplements this annual growth rate by more than
1.2% annually, forming thus an alternative scenario. The annual supplement to the
additional GDP growth will emerge gradually, but will accelerate rapidly and sustainably,
from 1.1% (2015) to 2.1% (by 2020), continuing after the expiry of the used planning
schedule (Figure 1). The difference is small at a first glance, but in developed economies
an annual GDP growth difference of 2% is sometimes the difference between stagnation
and growth, or the difference between normal growth and economic boom.
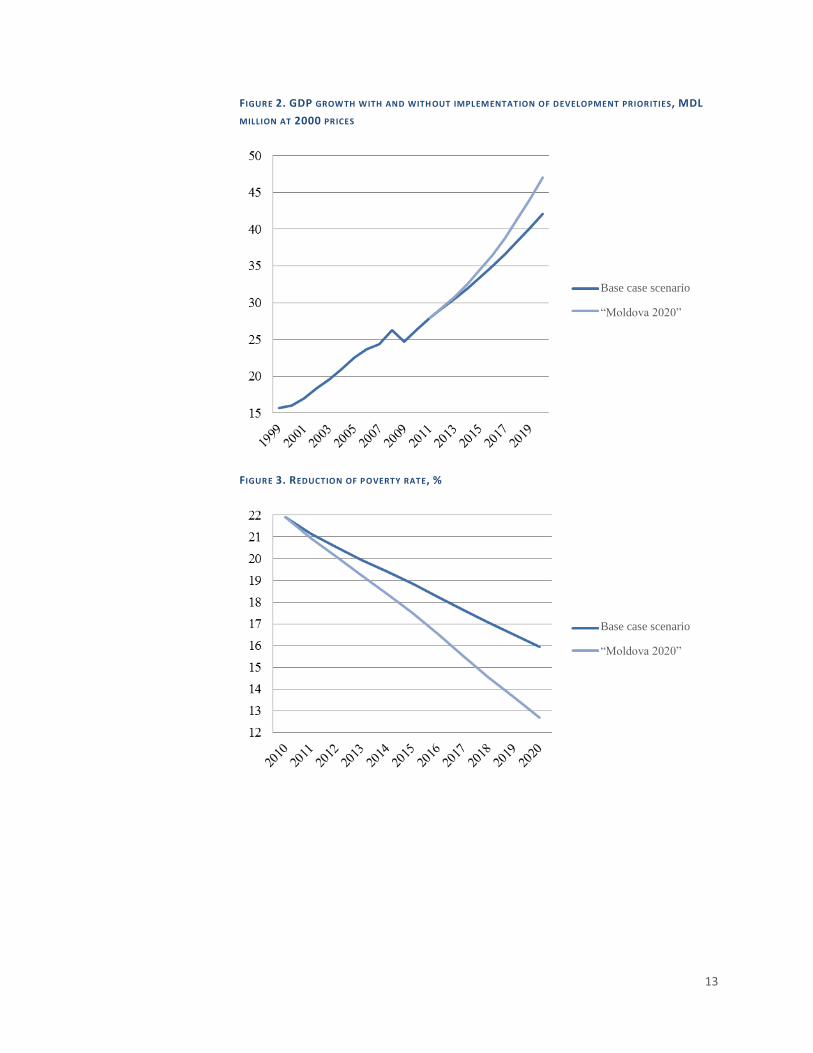
Hence, the alternative scenario assumes that, due to effects only, in 2020 the GDP will
be 12% higher compared to the base case scenario and, with each year beyond 2020,
this difference will grow significantly (Figure 2).
IMP ACT ON IN CO ME AN D POV ER TY
Along with the implementation of these priorities, the annual income per capita by 2020
will be on average 12% higher compared to the base case scenario and 79% higher
compared to 2011. Assuming at least a proportional distribution of welfare, we can
estimate the reduction effect from an average income increase.
There is an intrinsic relation between the poverty rate (share of population living below
the poverty line) and the economic growth rate, which can be expressed through the

10
elasticity coefficient. Thus, the coefficient was minus 0.7 during 2000-2010, which
means that each annual supplementary percentage of GDP growth reduces the poverty
rate that year by 0.7%. An estimation of the benefits of implementing these priorities
can be made by using the elasticity coefficient and the average GDP growth rates in the
base case scenario – 4.7% and in the scenario which assume the implementation of
seven priorities – 6.7% by 2020. In addition, the direct effect on poverty of pension
reform implementation is estimated at about 2%. It should be mentioned that these two
effects will cumulate.
In 2010, the poverty rate was 21.9%. If we use the poverty level (or line) of 2010, the
poverty rate will also be reduced in the base case scenario to approximately 16% by
2020. But, along with the implementation of priorities, it will be reduced significantly, to
12.7%, or by 3.3 percentage points over the base case scenario, which accounts for
149,000 people out of poverty (Figure 3).
SUST AIN ABI LITY O F ECONOMI C GROW TH
By contrast, it is worth noting that ensuring a qualitative economic growth through
elimination of critical constraints and poverty reduction has a short-term effect. Over
medium- and long-term, the main concern of authorities is to promote welfare – a
concept that incorporates various development aspects, among which public health,
personal security, access to culture, and, last but not least, clean environment.
It is known that, without a sustained effort, economic growth has a negative impact on
the environment as a result of greater industrial pollution and increased consumption.
Regulations that are designed to counter this effect are treated by businesses as an
excessive burden. However, at national policy level, the sustainable nature of economic
growth is equally important.
In this context, the Government’s strategic vision over medium and long term is the
reconciliation between the need for accelerated economic development and
environmental protection in conformity with European standards. This will materialize
through: (i) achievement of a rate of economic development that would allow an
increasing financing of environmental protection measures, and (ii) balanced regulation
of the business environment, both in terms of economic impact and environmental
impact.
Health also is an integral part of social welfare of the population, but good health
conditions facilitate economic development, competitiveness and productivity.
Improvement in the health of the population will have a decisive impact on economic
development and social prosperity only by achieving equity in health, by real progresses
in ensuring the right to health for all people and by making the entire society
accountable for health care measures that can contribute to human development, to
social and economic welfare. Awareness-raising activities on health determinants and
promotion of provisions on health issues in all policies will maximize results in health
domain.
11
Thus, health will presume that economic and social security, harmonious social and
interpersonal relationships, a safe and healthy working and living environment,
adequate quality of drinking water, air and soil, an adequate and reasonable nutrition
are necessary conditions, all of which being complemented with healthy lifestyle and
access to quality health services. Increasing health system efficiency will also contribute
to increased productivity, social inclusion and will reduce poverty, due to the positive
impact on reducing morbidity, premature mortality and increase healthy life
expectancy.

12
TABLES AND FIGURES
TABLE 1. IMF ESTIMATES OF GDP PER CAPITA AT PURCHASING POWER PARITY IN 2010 AND 2016,
USD
2010 2016
Albania 7 454 10 067
Armenia 5 110 6 712
Georgia 5 114 7 386 Kirgizstan 2 249 3 181
Macedonia 9 728 13 136 Moldova 3 083 4 424
Bulgaria 12 851 18 010
Romania 11 860 16 335
Ukraine 6 712 9 739
Estonia 18 519 25 145
Latvia 14 460 20 213
Lithuania 17 185 24 262
FIGURE 1. GDP ANNUAL GROWTH FORECAST
Base case scenario
“Moldova 2020”
13
FIGURE 2. GDP GROWTH WITH AND WITH OUT IMPLEMENTATION OF DEVELOPMENT PRIORITIES, MDL
MILLION AT 2000 PRICES
FIGURE 3. REDUCTION OF POVERTY RATE, %
Base case scenario
“Moldova 2020”
Base case scenario
“Moldova 2020”
14
EDUCATION: RELEVANT FOR A CAREER Human capital is one of the few resources that can offer to the Republic of Moldova a
comparative advantage. However, if labor is not specialized in fields required by
potential investors – job providers – human capital remains an untapped resource.
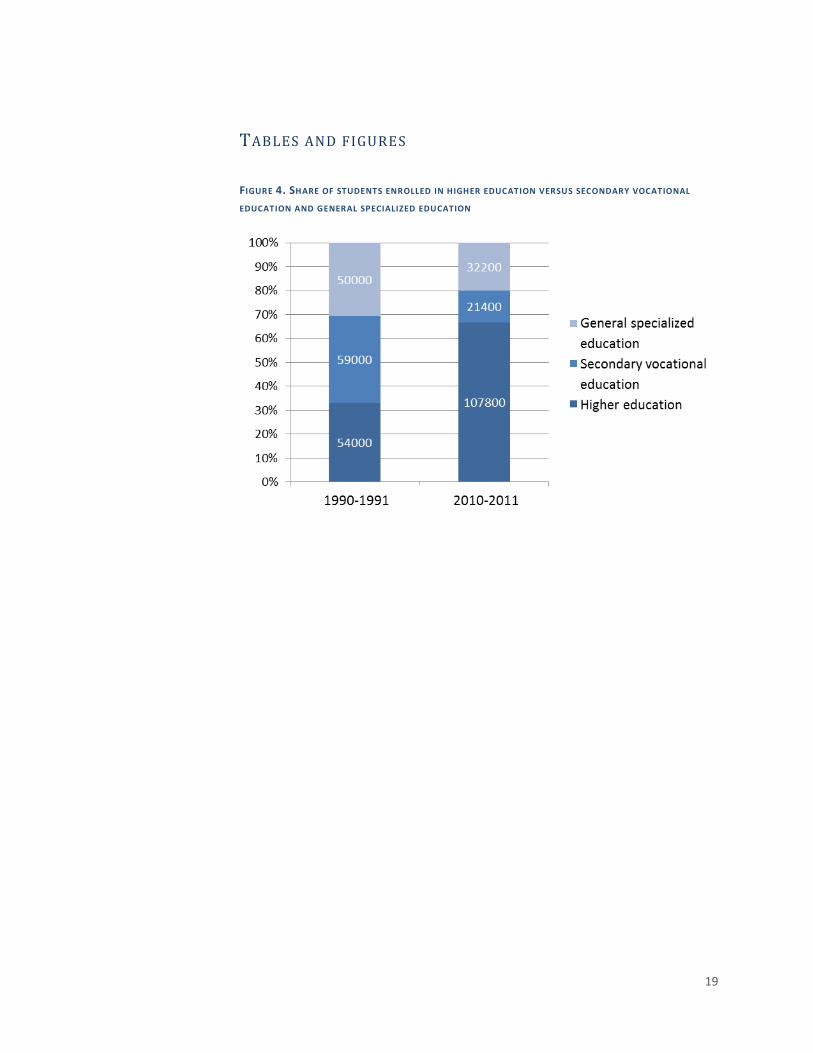
SITUATION ANALYSIS In recent years, an increasingly characteristic phenomenon for the education system in
Republic of Moldova is preference for higher education. The last two decades have been
marked by a doubled number of students enrolled in higher education to the detriment
of secondary vocational education and general specialized education (Figure 4). Overall,
university education is becoming increasingly accessible and age limitations were
excluded. Similarly, the high number of students in higher education compared to the
much smaller number of people in secondary vocational and general specialized
(vocational/technical) education shows that university education is a priority for
Moldovan citizens. The popularity of higher education is increasing, although 71.3% of
students are enrolled on a contractual basis and pay a tuition fee.
Spending on education in Republic of Moldova reached a record 9.2% of GDP (the
European average being 5.5% of GDP), without producing a significant economic and
social impact. In 2009, financial allocations per pupil in secondary vocational education
accounted for MDL 10,224, which is higher by 15% than in general specialized education
(MDL 8,709/student/year) and by 33.5% than in higher education (MDL
6,802/student/year) 2.
Although secondary vocational education is the most expensive,
the biggest problems appear on this particular segment. In 2010, according to
International Labor Organization methodology, the number of unemployed with
secondary vocational education was 22,800 people, or 24.8% of the total number of 92
thousand unemployed, being higher than the number of unemployed with higher
education (18.3 thousand), general specialized education (12 thousand), lyceum,
general secondary education (22 thousand) and secondary education (16.8 thousand),
recording the highest drop-out level (24.5%).
In terms of labor market in Republic of Moldova, 970 thousand people of 15-29 years
old or 27.2% of the total population were registered in 2010. The unemployment rate
among this age group is 13.9%, being 1.9 times higher than the nationwide
unemployment rate (7.4%). According to the National Bureau of Statistics data, only
22% of young people found a job immediately after graduation in 2010. A quarter left
their first jobs because of low wages, and 17.7% went to work abroad. Young people in
cities succeed in higher proportions to find a permanent job than those in rural areas
(75% versus 54%).
2 Vocational Education at a Crossroads: An analysis of policy decisions in the secondary and specialized education system, Sergiu Lipceanu, IDIS Viitorul, 2010.
15
Consequences are felt directly on the economic front. They show a relatively small
proportion of graduates employed as per qualification obtained in education
institutions, and the absence of monitoring mechanisms for their careers makes the
issue less visible. About 30% of graduates do not work according to professional
qualifications obtained in vocational schools, colleges and universities, which show the
necessity to diversify the educational routes by promoting the lifelong learning concept.
This phenomenon is deepened by the informational asymmetry between labor force
demand of potential employers and the wrong perception of students regarding
employing opportunities, which tends to perpetuate this phenomenon.
The business environment in Moldova, especially exporters, complains about low quality
of job candidates education and about lack of qualifications. 85% of companies mention
lack of qualified labor force3, with companies requiring a higher level of professionalism
and specific skills from workers. Most often, economic agents mention that they are
faced with a significant gap between their needs and professional skill mix of
vocational/technical education institutions’ graduates. The quality of curricula also
determines the reduced adaptability of young workers to company conditions. This
most often leads to an increased turnover of staff. On the one hand, the worker is
unsatisfied because he/she cannot meet the requirements and, on the other hand, the
employer does not receive the expected performance from the employed human
resources. It is also alarming that young workers do not show devotion to work, as
confirmed by 52.2% of respondent companies4.
The low productivity of young employees and poor quality of products/services form a
vicious circle, which in turn determines modest salaries. Non-competitive salaries are
another reason for lack of business attractiveness. For graduates of secondary
vocational education unemployment is more acute than for those who graduated from
general specialized or higher education facilities. Their share in the structure of
unemployment reached 28% in 2009. In this context, labor migration is an increasingly
pressing problem, which imposes a more efficient correlation between education
policies and migration and employment policies.
If the Government will not intervene, unwanted effects of the problem will deepen. This
situation, combined with unfavorable demographic forecasts and with the precarious
state of health, challenges the myth that Republic of Moldova has plenty of labor force,
which is skilled and cheap. Consequently, the labor market will face a deepening
substantial imbalance between supply and demand and shortage of skilled labor.
Attracting investment, given the lack of required human capital, will become
increasingly difficult, and the lines of emigrants will be further fuelled by fresh graduates
of the education system, with the purpose of both searching for a well-paid job and
materializing quality education without tapping the potential to create domestic jobs.
3 „Work relations in Republic of Moldova from companies’ perspective”, UNDP and Government of Belgium. 4 Idem.
16
Aligning the education system to the requirements of the labor market is imperative. A
perpetuation of this situation is a major risk for the education system because, with
extending opportunities to access education in Europe, potential students will prefer
other educational destinations.
STRATEGIC VISION The correlation between labor market demand and education supply will have a
significant impact on economic development. Modernization of the vocational
education system and improvement of continuous labor force training will allow citizens
to adapt to new labor market conditions. Partnerships between education and labor
market will lead to a generation of educational offerings that will meet the quantitative,
qualitative and structural labor force needs. This in turn will help reduce unemployment
and the flow of citizens who leave the country and the rate of population at risk of
poverty or social exclusion.
To the effect of achieving the strategic vision, education policy will be targeted to
ensure the quality of studies. Enacting new legislation on education, adjusted to the
European experience, will facilitate structural and institutional reform in the field, taking
into account the principle of efficiency and quality. Reform of research and innovation
system, by de-monopolization of its financing, by applying consistent and relevant rules
supporting excellence in education and in science, will boost the quality of career
education. Establishment of the National Agency for Higher Education and Research
Quality Assurance is crucial for evaluation and accreditation of institutional and
professional training/development programs for labor market specialists. The National
Framework for employment qualifications and standards will guide the educational
process towards development of competencies required on the labor market.
Meanwhile, labor forecasting capacity will be strengthened, with a focus on creating
lifetime professional training opportunities. Curricula will be geared towards
professionalization of research and innovation capacities, as well as towards their
development in universities.
The quality of academic processes will be ensured inclusively by redefining the assessing
principles and criteria of higher education institutions intellectual potential, by
restructuring teaching and research tasks, by refocusing institutional services, which will
be made available to students, in the benefit of accurate and more adapted choice of
educational routes by them. As a quality requirement toward the intellectual staff of an
institution will be the share of 75% of professors with teaching and research titles.
A precondition for increasing the quality of education is to eliminate corruption factors
in the education system. The optimal solution in this regard is to rely on market
mechanisms. In order to stimulate a real competition among higher education
institutions, the financing formula for universities will be modified, taking their
performance as a fundamental criterion, offering to them in return broader financial
autonomy.
17
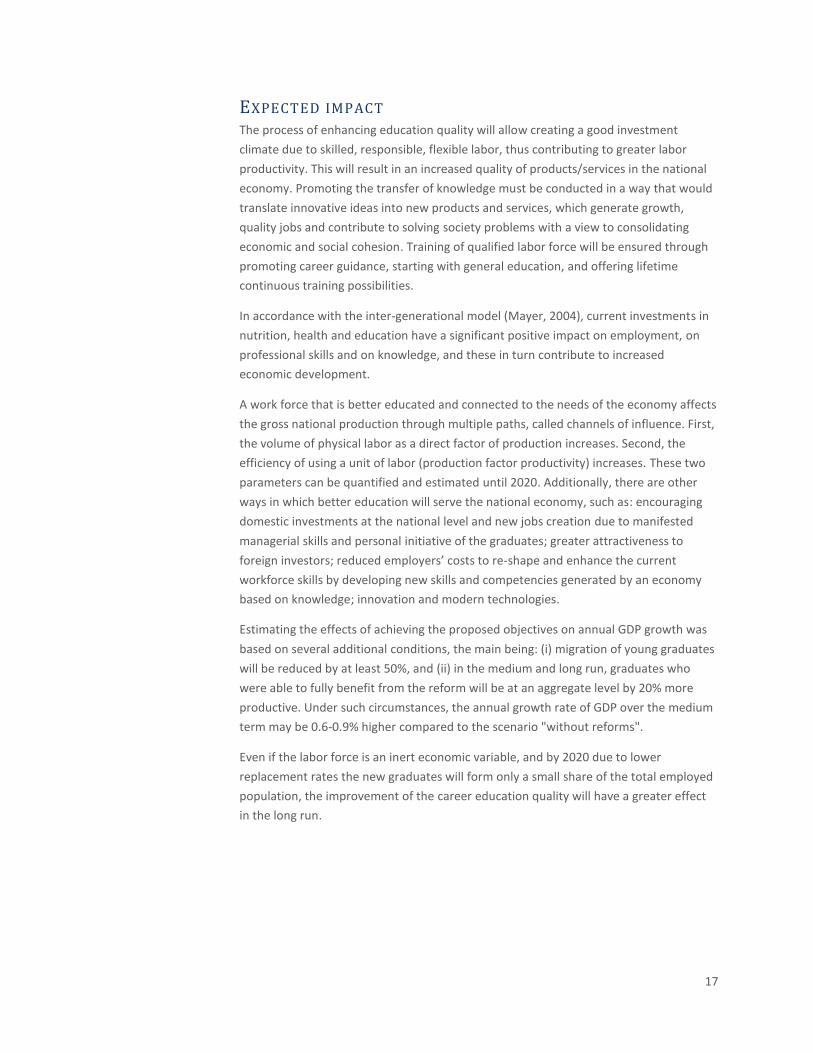
EXPECTED IMPACT The process of enhancing education quality will allow creating a good investment
climate due to skilled, responsible, flexible labor, thus contributing to greater labor
productivity. This will result in an increased quality of products/services in the national
economy. Promoting the transfer of knowledge must be conducted in a way that would
translate innovative ideas into new products and services, which generate growth,
quality jobs and contribute to solving society problems with a view to consolidating
economic and social cohesion. Training of qualified labor force will be ensured through
promoting career guidance, starting with general education, and offering lifetime
continuous training possibilities.
In accordance with the inter-generational model (Mayer, 2004), current investments in
nutrition, health and education have a significant positive impact on employment, on
professional skills and on knowledge, and these in turn contribute to increased
economic development.
A work force that is better educated and connected to the needs of the economy affects
the gross national production through multiple paths, called channels of influence. First,
the volume of physical labor as a direct factor of production increases. Second, the
efficiency of using a unit of labor (production factor productivity) increases. These two
parameters can be quantified and estimated until 2020. Additionally, there are other
ways in which better education will serve the national economy, such as: encouraging
domestic investments at the national level and new jobs creation due to manifested
managerial skills and personal initiative of the graduates; greater attractiveness to
foreign investors; reduced employers’ costs to re-shape and enhance the current
workforce skills by developing new skills and competencies generated by an economy
based on knowledge; innovation and modern technologies.
Estimating the effects of achieving the proposed objectives on annual GDP growth was
based on several additional conditions, the main being: (i) migration of young graduates
will be reduced by at least 50%, and (ii) in the medium and long run, graduates who
were able to fully benefit from the reform will be at an aggregate level by 20% more
productive. Under such circumstances, the annual growth rate of GDP over the medium
term may be 0.6-0.9% higher compared to the scenario "without reforms".
Even if the labor force is an inert economic variable, and by 2020 due to lower
replacement rates the new graduates will form only a small share of the total employed
population, the improvement of the career education quality will have a greater effect
in the long run.
18
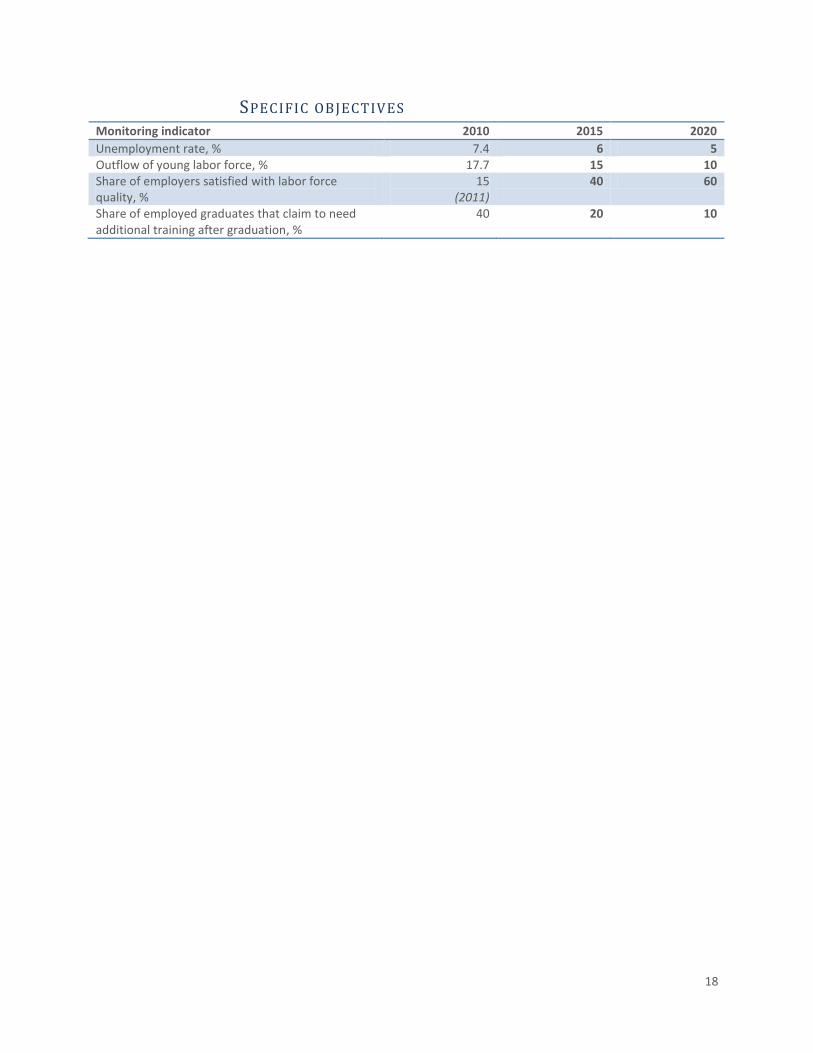
SPECIFIC OBJECTIVES Monitoring indicator 2010 2015 2020
Unemployment rate, % 7.4 6 5 Outflow of young labor force, % 17.7 15 10 Share of employers satisfied with labor force quality, %
15 (2011)
40 60
Share of employed graduates that claim to need additional training after graduation, %
40 20 10
19
TABLES AND FIGURES
FIGURE 4. SHARE OF STUDENTS ENROLLED IN HIGHER EDUCATION VERSUS SECONDARY VOCATIONAL
EDUCATION AND GENERAL SPECIALIZED EDUCATION
20
ROADS: IN GOOD CONDITION , ANYWHERE Transport costs of economic agents and road traffic safety are closely related to road
infrastructure quality. The poor condition of roads is seen as a major constraint
hindering economic development and requiring substantial public investment.
Moreover, an adequate road infrastructure is a precondition for a harmonious regional
development and access of population to public services. The prospect of establishing a
Deep and Comprehensive Free Trade Zone between Republic of Moldova and European
Union makes road infrastructure indispensable for the utilization of local producers’
export potential.
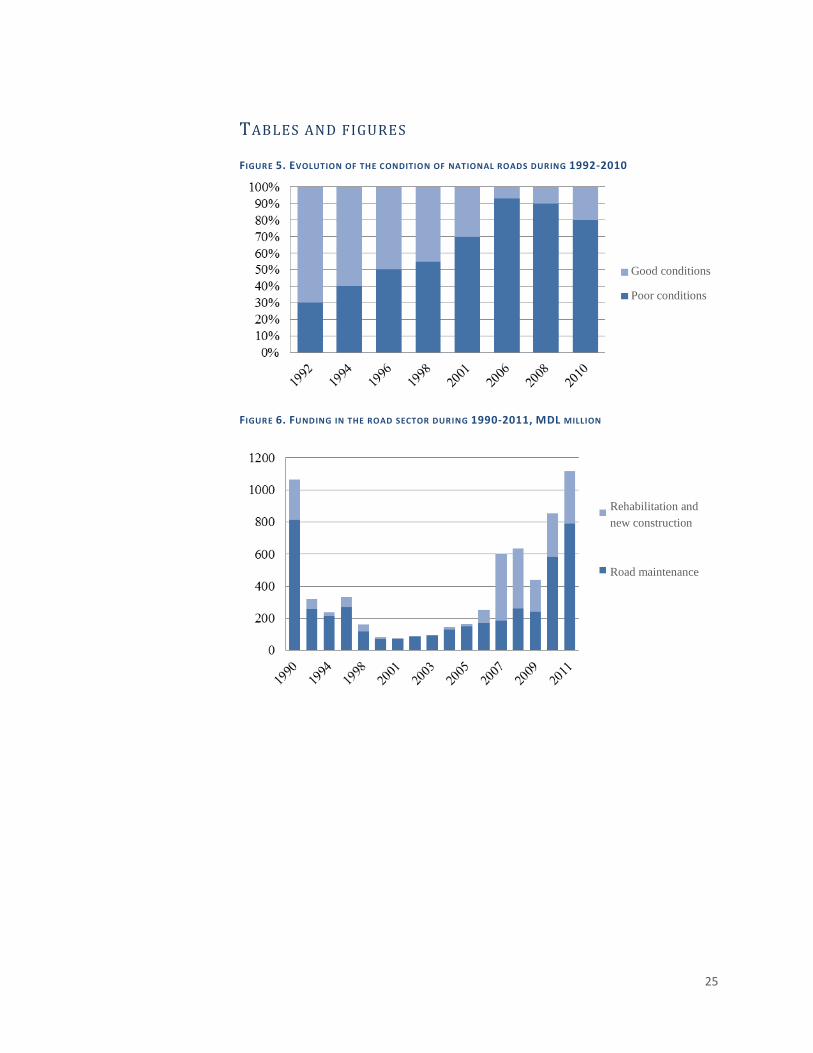
SITUATION ANALYSIS Republic of Moldova is affected by an intensive process of road degradation. About two
thirds of the length of national roads was in good condition in 1992, then less than half
of them were in good condition in 1998, and only 7% in 2006 (Figure 5). Although the
condition of local roads was less examined, a study of 1,500 km (out of 6,000 km) of
local roads conducted in 2006 found a bad and very bad condition of about 96% of their
length.
Intensive degradation of public roads in Republic of Moldova occurred because of
insufficient funding for maintenance and repairs (Figure 6). During 1998-2006, road
funding covered less than 10% of needs. Allocated funds allowed only the execution of
routine maintenance (winter maintenance, filling potholes, profiling, etc.). Because of
failure to conduct average and capital repairs, over 80% of road length exceeded the
established operating framework.
A relative improvement in the condition of roads has occurred in the years 2010-2011,
conditioned by increased contributions to the road fund (from MDL 241 million in 2009
up to MDL 788 million in 2011). However, these contributions are not sufficient to
restore the entire road network to an appropriate state.
The effects conditioned by insufficient funding of road maintenance and repair works
were exacerbated by systemic issues. Technical norms and standards used in roads are
outdated and do not match current requirements, and the institutional structure of the
road maintenance system is inefficient.
In Republic of Moldova (except the left-side region of Nistru) there are 39 road
maintenance companies, of which one is private, 35 are joint stock companies with
state participation, and three are state companies. The study conducted during the
development of the Land Transport Infrastructure Strategy for 2008-2017 demonstrated
the need to reform the road maintenance system in order to enhance the efficiency of
this transport. Administration costs exceed 25-30% of total spending, with a law-
prescribed ceiling of 14.5%. To the effect of making the road maintenance system more
efficient it is necessary to ensure a healthy competition and encourage new investment
21
in the field through transparent public procurement friendly to bids involving advanced
technologies, ensure transparency in the operation of specialized companies, their
privatization and merger, optimize the maintained road network length, and implement
a maintenance method through multi-annual contracts (3-5 years) and road
differentiation by level of required maintenance.
The adverse effects generated by the poor condition of roads in Republic of Moldova
have a significant negative impact on the country’s social-economic activity. One of the
factors offering the possibility to achieve sustainable economic development, examined
in the Global Competitiveness Report 2010-2011, published by the World Economic
Forum, i.e. „quality of infrastructure”, ranks Republic of Moldova 94th
out of 139
countries, the lowest being road quality infrastructure (139), followed by port
infrastructure (124), air infrastructure (109), and only railway infrastructure is ranked
higher (67).
The quality of transport infrastructure is largely perceived as an important component
of competitiveness and business environment in general and, as a consequence, is an
important factor in attracting investment and ensuring export competitiveness.
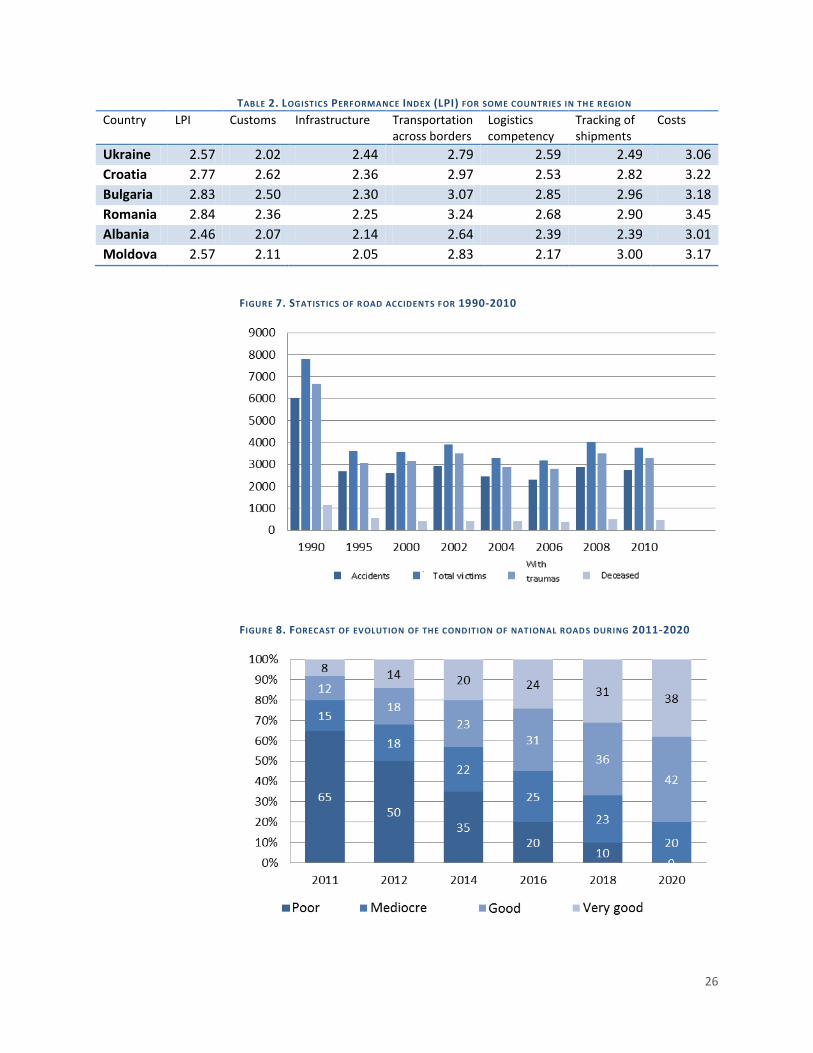
Compared to countries in the region, Republic of Moldova got the lowest positions in
the World Bank’s ranking on 2010 Logistics Performance, being ranked 104th
out of 155
countries, 132nd
for logistics competency, 124th
for customs procedures, and 123rd
for
infrastructure aspects (Table 2).
However, Moldova cannot fully capitalize on the economic and investment potential
because of poor roads that limit accessibility to objects of production, to markets and to
cultural and tourist centers. Moldova is often avoided because of these reasons as a
transit country for cargo and passengers.
Because of poor road network, households, especially those in rural areas, incur
significant additional costs to access social and administrative services and markets.
According to estimates, the unsatisfactory state of roads implies additional costs for
users of approximately MDL 2.5 billion annually.
The poor quality of roads also has a negative effect on road safety. The total number of
reported deaths per million vehicles is about 1,120 (6-9 times higher compared to
European Union countries) and the number of deaths per one million population is
about 120 (Figure 7).
The poor condition of roads has a negative environmental impact. Fuel consumption on
roads in bad shape condition increases by 20%, generating additional emissions of
harmful substances into the atmosphere. Besides, bad roads are an additional source of
noise and of vibration. Gravel roads cause formation of dust clouds, which negatively
influence the development of agricultural crops in the roads influence area.
22
STRATEGIC VISION The implementation of the new qualitative economic development model based on
exports, on investment and innovation will be accelerated by the development of both
road infrastructure and logistics sectors related to transport services.
Essentially, road infrastructure durability is contingent upon ensuring the necessary
minimum of financial resources for national and local road infrastructure maintenance,
but also upon substantial public investments in construction and rehabilitation of
national public roads, so as to have 80% of roads in good and very good condition by the
end of this Strategy due date (Figure 8).
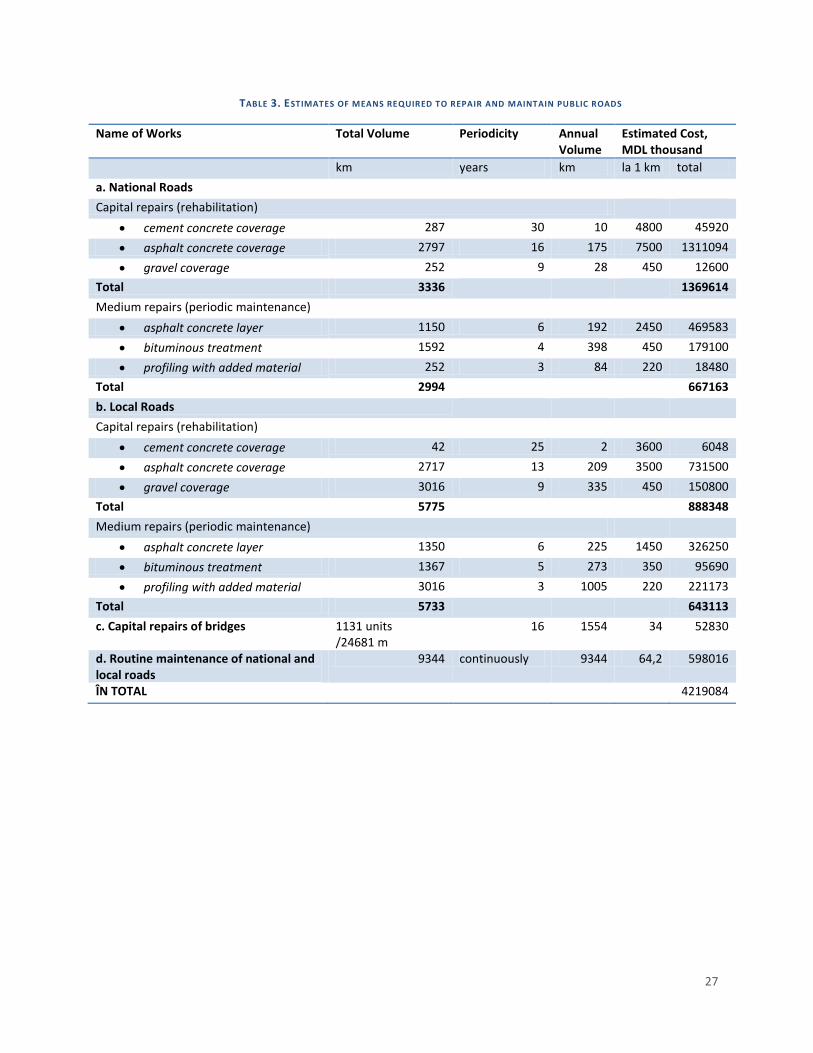
Estimates show that approximately MDL 4.2 billion is required annually for national and
local road maintenance and current repairs (Table 3). At the same time, a capital
reconstruction of over 400 km of roads was planned for 2011-2014 with funding from
external sources, reaching an amount of EUR 334 million. Thus, to the effect of attaining
the established objective by the end of this Strategy due date, it is necessary to mobilize
additional domestic and foreign funding of EUR 1.1 billion.
Measures beyond the mere allocation of public funding are required in order to
accomplish this vision. It is necessary to explore the public-private partnership potential
in the area of road infrastructure and logistics services related to transport and road
infrastructure services. The road network management is also followed closely by the
Government. A reduction of administrative costs to a standard prescribed by legislation
is a source of savings that can contribute to more adequate maintenance works. Hence,
a greater efficiency of the maintenance system will be achieved through an effective
competition based on: (i) transparent public procurement friendly to bids involving
advanced technologies; (ii) ensuring a more efficient control of work quality; (iii)
reorganization and modernization of road maintenance companies by the year 2013;
and (iv) implementation of the road maintenance method through multi-annual
contracts by the year 2015.
EXPECTED IMPACT Adequate road rehabilitation and maintenance in Republic of Moldova will have a
number of beneficial effects, contributing to the country’s economic development. With
a strategic location, Moldova plays an increasingly important role as a border country
between the European Union and Eastern Europe and could become a commercial hub
of transportation in the region, where roads will be rehabilitated and logistics costs will
be lower than in neighboring countries. Transport services can be developed but their
costs are very high in the absence of a quality road infrastructure.
It is important that in the future the design and development of road infrastructure be
done in line with social and economic needs of citizens. Given that Republic of Moldova
aims at increasing the dynamics of industrial and agricultural sector’s development, a
solid road infrastructure, functioning road transport and some multi-modal logistics
23
centers will facilitate significantly the access of farmers to local and foreign markets.
Rehabilitation of roads in the country by using advanced technologies will have an
impact on the labor market through both creating new jobs and involving more
adequate professional training. Last but not least, a modern road infrastructure will
contribute to the development of some sectors providing non-traditional services such
as tourism and logistics services. The imperative to implement environmental protection
measures will be taken into account while designing, constructing and operating the
roads, including by applying environmental impact assessment procedures, by
promoting construction and operational standards under climate change conditions, by
maintaining, restoring and expanding road plantations areas (green protective strips
along roads etc.).
Also, road infrastructure development has a beneficial social impact. The current state
of roads is a major impediment in rural population’s access to quality social services. For
example, school network optimization through establishment of hub schools is directly
posing the problem of access to these institutions. Auto transport services can be
developed, but their maintenance costs are very high in the absence of a well-
developed road infrastructure. Hence, road rehabilitation will increase the population’s
access to health services, especially to emergency and hospital services. In the context
of hospital reform and public hospital network restructuring based on the National
Master Plan for Hospitals, the distance between hospitals will increase and the state of
roads is crucial for the rapid access of patients to health facilities. Simultaneously,
transition to universal coverage and access to an efficient primary care, as the closest
nursing provider to the individuals and of good quality is a priority for the Republic of
Moldova. Thus, further road construction, urban and rural planning will be coordinated
closely with medical institutions planning (hospitals, primary care and emergency
institutions). Also, it is a fact that the inclusion of effective road safety measures in the
road construction helps to prevent personal injury and loss of human capital and
productivity as a result of road accidents. Building new, safer roads is also an
opportunity to promote a healthier lifestyle by creating conditions for physical activities
such as walking and cycling in public spaces.
Another important aspect is environmental protection. First, better roads reduce
significantly fuel consumption per each kilometer, thus reducing harmful gas emissions,
noise and other pollutants. Vehicles will require less consumable, such as oil and tires,
which are also a great pollutant. Last but not least, the road rehabilitation and
reconstruction process must be conducted in strict compliance with the requirements of
national legislation in the areas of environment and good international practices
(environmental impact assessment, action plans for environmental protection during
reconstruction, etc.).
Apart from these beneficial implications, better roads affect directly economic growth
and development through more channels. Both in the international practice and in the
Moldovan context, mathematical models are well-calibrated to appreciate exactly the
effect of one kilometer of road rehabilitated on expenditures, population and business
24
incomes, time saved, and accidents. The main benefits, displayed in descending order,
are:
reduced vehicle operating costs, including saved fuel and avoided repairs;
less time spent on roads, which can be further used for productive or recreational
purposes;
reduced number of accidents;
intensify additionally attracted traffic of goods and of passengers, including
international transit;
increased investments, regional development, extended tourism as a result of
enhancing country attractiveness, these representing tertiary, less distinguishable
effects.
The first of these is the most tangible benefit. Estimates suggest that MDL 2.5 billion is
wasted annually on additional repairs and on fuel on road segments planned for
rehabilitation. Starting with the assumption that at least a moderate part of saved
money can be invested for productive purposes, increasing thus the stock of fixed
capital, calculations suggest that over short and medium term regular annual GDP
growth will be additionally increased by 0.3% due to fuel savings and repairs avoiding
only. But the overall effect will be probably even greater.
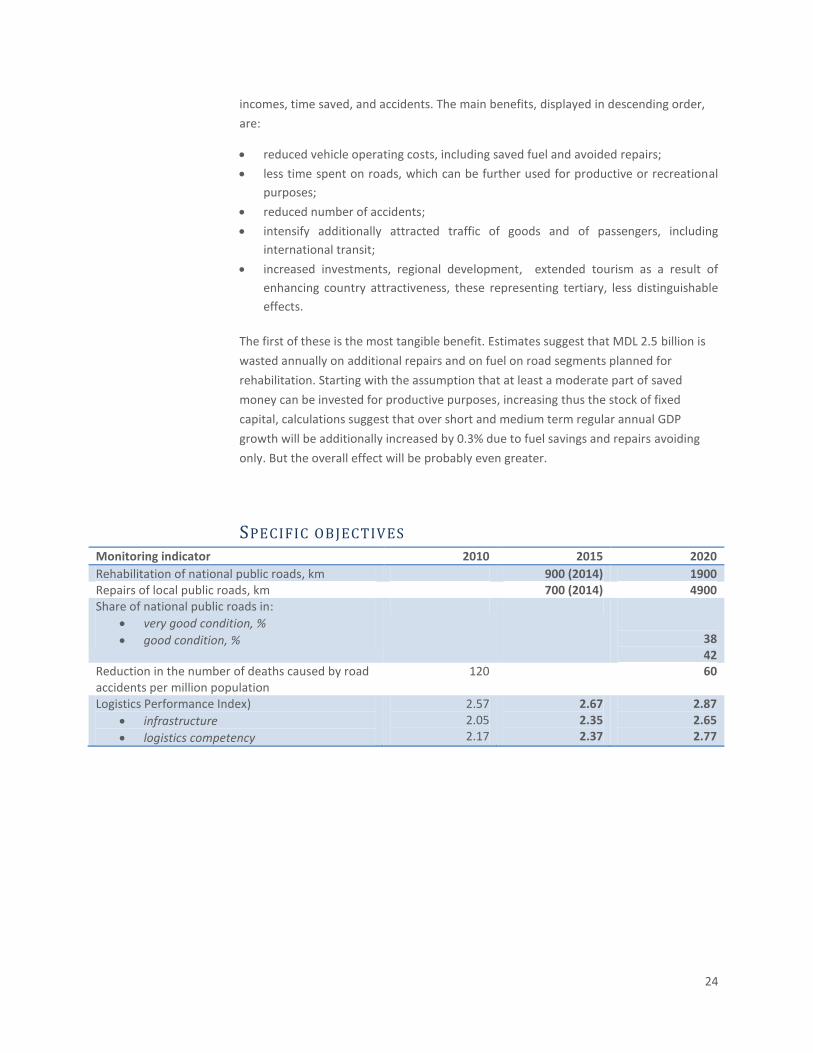
SPECIFIC OBJECTIVES
Monitoring indicator 2010 2015 2020
Rehabilitation of national public roads, km 900 (2014) 1900 Repairs of local public roads, km 700 (2014) 4900 Share of national public roads in:
very good condition, %
good condition, %
38 42
Reduction in the number of deaths caused by road accidents per million population
120 60
Logistics Performance Index)
infrastructure
logistics competency
2.57 2.05 2.17
2.67 2.35 2.37
2.87 2.65 2.77
25
TABLES AND FIGURES FIGURE 5. EVOLUTION OF THE CONDITION OF NATIONAL ROADS DURING 1992-2010
FIGURE 6. FUNDING IN THE ROAD SECTOR DURING 1990-2011, MDL MILLION
Good conditions
Poor conditions
Rehabilitation and
new construction
Road maintenance
26
TABLE 2. LOGISTICS PERFORMANCE INDEX (LPI) FOR SOME COUNTRIES IN TH E REGION
Country LPI Customs Infrastructure Transportation across borders
Logistics competency
Tracking of shipments
Costs
Ukraine 2.57 2.02 2.44 2.79 2.59 2.49 3.06
Croatia 2.77 2.62 2.36 2.97 2.53 2.82 3.22
Bulgaria 2.83 2.50 2.30 3.07 2.85 2.96 3.18
Romania 2.84 2.36 2.25 3.24 2.68 2.90 3.45
Albania 2.46 2.07 2.14 2.64 2.39 2.39 3.01
Moldova 2.57 2.11 2.05 2.83 2.17 3.00 3.17
FIGURE 7. STATISTICS OF ROAD ACCIDENTS FOR 1990-2010
FIGURE 8. FORECAST OF EVOLUTION OF THE CONDITION OF NATIONAL ROAD S DURING 2011-2020
27
TABLE 3. ESTIMATES OF MEANS REQUIRED TO REPAIR AND MAINTAIN PUBLIC ROADS
Name of Works Total Volume Periodicity Annual Volume
Estimated Cost, MDL thousand
km years km la 1 km total
a. National Roads
Capital repairs (rehabilitation)
cement concrete coverage 287 30 10 4800 45920
asphalt concrete coverage 2797 16 175 7500 1311094
gravel coverage 252 9 28 450 12600
Total 3336 1369614
Medium repairs (periodic maintenance)
asphalt concrete layer 1150 6 192 2450 469583
bituminous treatment 1592 4 398 450 179100
profiling with added material 252 3 84 220 18480
Total 2994 667163
b. Local Roads
Capital repairs (rehabilitation)
cement concrete coverage 42 25 2 3600 6048
asphalt concrete coverage 2717 13 209 3500 731500
gravel coverage 3016 9 335 450 150800
Total 5775 888348
Medium repairs (periodic maintenance)
asphalt concrete layer 1350 6 225 1450 326250
bituminous treatment 1367 5 273 350 95690
profiling with added material 3016 3 1005 220 221173
Total 5733 643113
c. Capital repairs of bridges 1131 units /24681 m
16 1554 34 52830
d. Routine maintenance of national and local roads
9344 continuously 9344 64,2 598016
ÎN TOTAL 4219084
28
FINANCE: AFFORDABLE AND CHEAP The financial system in Republic of Moldova is largely dominated by the banking sector.
This in turn proved to be sufficiently stable and held on relatively with no losses in the
global financial crisis of 2008-2009. Economic recession has affected the credibility of
economic agents, announcing the deterioration of the loan portfolio. Still, these were
short-term effects, the situation getting back to normal with the economic recovery.
Despite the stability of the banking sector, economic agents signal limited access to
finance, and the level of financial intermediation is among the lowest in the region.
SITUATION ANALYSIS The fundamental feature of the banking sector in Republic of Moldova is weak financial
intermediation. The average GDP share of banking loans during 2004-2010 accounted
for 31.5%, Republic of Moldova being surpasses by countries in Central and Eastern
Europe, except only Albania and Georgia. Leaders in the region – Latvia, Slovenia and
Estonia provide credits, the average GDP share of which varies between 80% and 115%5.
Although the situation is slightly better in terms of bank deposits as a share of GDP – the
main source of lending, however the Republic of Moldova, characterized by an average
GDP share of bank deposits of 32.9%, is ranked lower on this than countries such as
Lithuania, Serbia, Romania, Belarus, and Georgia, remaining below the region’s average.
Lack of confidence in banks by population and companies is the main obstacle
determining the relatively low rate of deposits as a share of GDP.
Hence, the main function of the banking system, namely concentration of citizens’
savings and their channeling towards those who need additional liquidity, is performed
deficiently.
Growth reserves for the lending volume to the real sector of economy, accompanied by
a higher savings rate, are gains from Moldovans’ work abroad. Empirical studies show
that about half of the work gains are transferred to Republic of Moldova as remittances.
Preference to place savings in foreign banks, also conditioned by the fact that the
amount of guaranteed deposits in EU countries is considerably higher, does not lead to
a full tapping of this potential. On the other hand, state policies targeting the channeling
of remittance funds towards small businesses (PARE 1 +1) were not supported by
sufficient financial means.
Another aspect relevant to the situation analysis in the banking/financial sector relates
to the use of available resources and risk management efficiency. On the one hand,
banks in Republic of Moldova have liquidity in excess of prudential norms prescribed by
international good practices. Hence, the average share of liquid reserves in total banking
assets was 27.3% during 2004-2009. In case of an efficient intermediation the liquidity
5 “Diagnostic of the Moldovan banking system in the context of signing the Deep and Comprehensive Free Trade Agreement with the EU”, Expert-Grup, 2011.
29
excess would determine banks to intensify lending efforts, which would imply a
reduction of the risk premium. In reality, economic agents in Republic of Moldova
invoke limited access to finance, indicating high interest rates as one of the biggest
problems encountered in their operation (14.2% of respondents to the questionnaire
that laid the foundation for the 2010-11 Global Competitiveness Report indicated access
to finance as the biggest obstacle to doing business6).
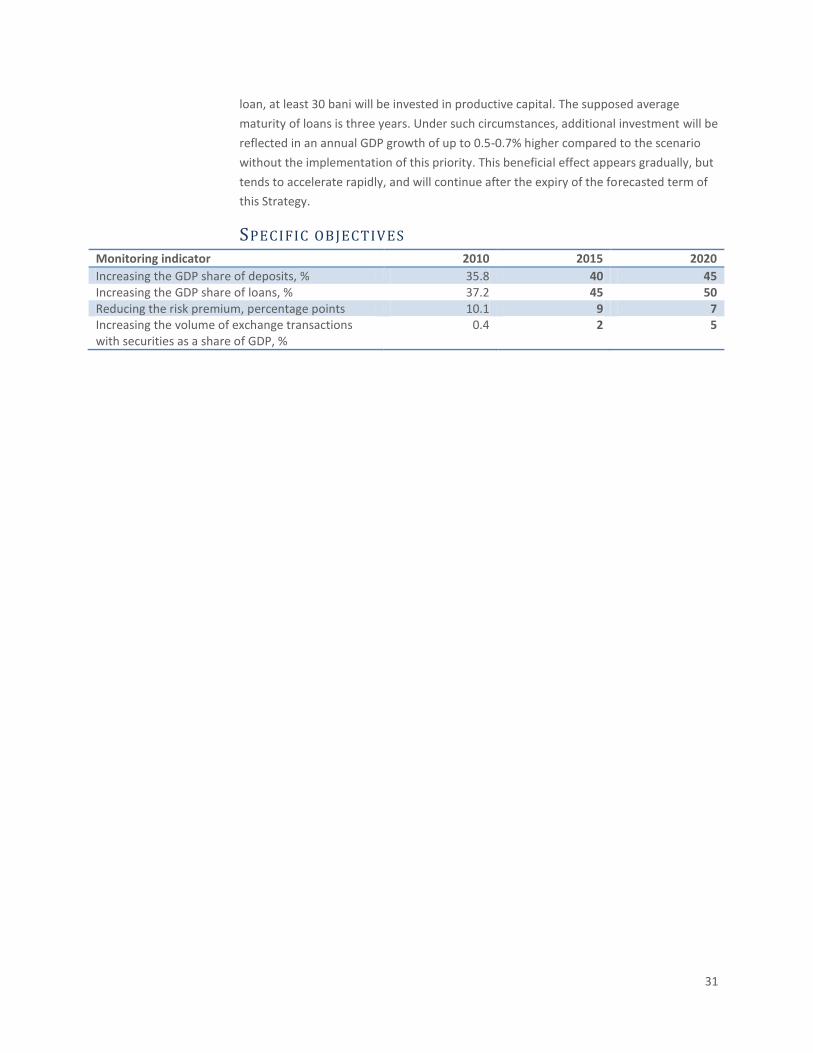
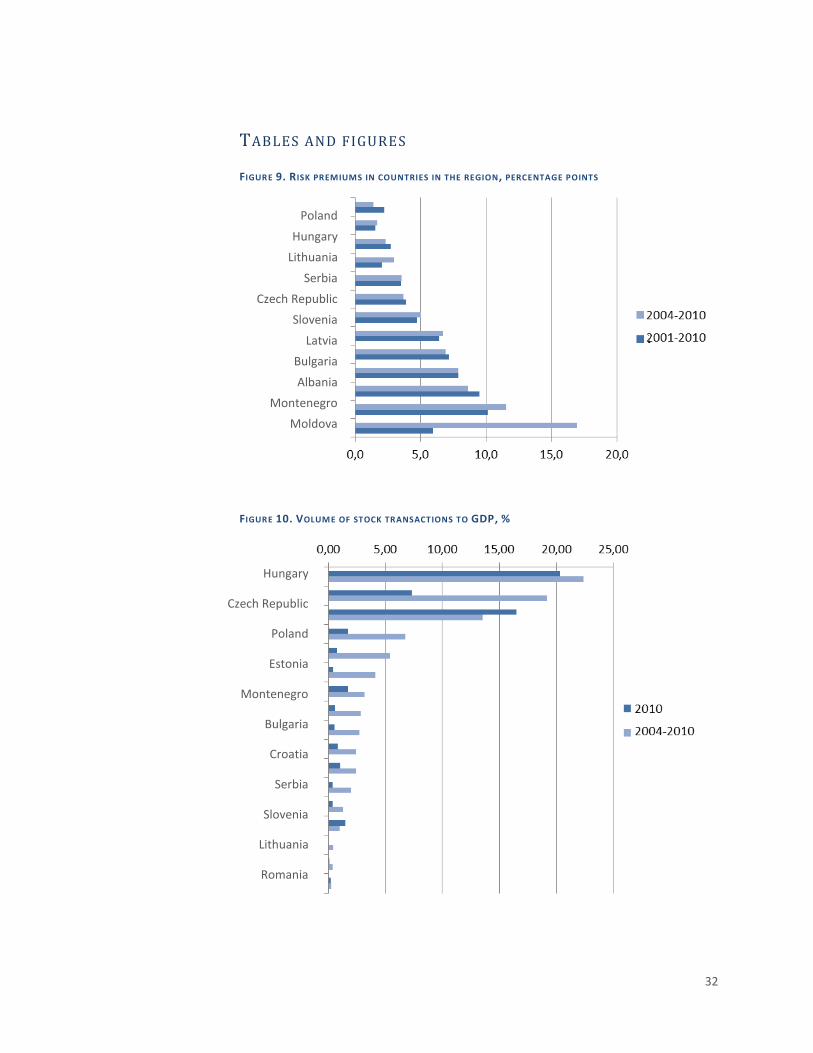
The same is confirmed by the risk premiums applied in Republic of Moldova, which are
the highest in the region7. The fact that risk premiums in Republic of Moldova
represented 8.6% during 2004-10 shows lack of confidence by commercial banks in
potential debtors and determines their preference for liquid assets.
The confidence crisis could be partially overcome by improving the information on
debtor credibility. A recent reform in this area aims at establishing in Republic of
Moldova credit history bureaus that collect information on timely loan payments, which
would allow commercial banks to adjust interest rates based on debtors’ profiles. As a
result of this reform’s implementation, Republic of Moldova jumped considerably in the
World Bank’s Doing Business 2012 ranking, from 96 to 408. At the same time, some
problems remain unsolved, i.e. rights over security if the debtor becomes insolvent.
The inefficient use of resources and inadequate risk management are conditioned by
lack of a true competition in the banking segment of the financial market and, generally,
lack of viable financing alternatives through the non-banking financial sector. At the end
of 2011, the assets of the largest five banks in Republic of Moldova as a share of total
banking sector assets accounted for 70.12%9. In 2011, although approximately 3/4 of
banks’ capital was represented by foreign investments, only four banks out of those 15
active banks in the Republic of Moldova were branches of Western banks. Another
factor reducing the efficiency of recourses utilization is the state’s share in the banking
capital of one of the largest five banks in Republic of Moldova.
Referring to the capital market, it is worth noting that the volume of securities traded
during 2004-2010 as a share of GDP is among the lowest in the region – 1.28%,
recording in the last years a downward trend. For purposes of comparison, the regional
average during this period was 5.32%, while the European Union average was 92.4%.
STRATEGIC VISION The strategic vision for increasing access to finance is based on the following pillars: (i)
developing financial intermediation; (ii) streamlining the costs of financial resources;
and (iii) streamlining the guarantee terms for credits and loans.
6 “The Global Competitiveness Report 2010-2011”, World Economic Forum, 2010 7 Risk premiums are expressed as the difference (in percentage points) between the interest rate on loans provided by banks and interest rate on state bonds. World Development Indicators, http://data.worldbank.org/indicator/FR.INR.RISK 8 Doing Business 2012, http://doingbusiness.org/data/exploreeconomies/moldova 9 Financial indicators for the banking system of Republic of Moldova, http://www.bnm.md

30
The objective of authorities for the year 2020 is to have a financial system channeling
efficiently financial resources to households which produce savings to businesses that
are looking for ways to finance their business ideas, creating a true competition in the
banking market to attract funds from depositors. Selling of the state’s share in the
banking capital and entrance of new strategic investors in the market will boost the
competition spirit and will optimize financing costs. It is also imperative to develop as
many options as possible to place the savings of the population outside the banking
system, which leads to the development of financial intermediation.
The reforms promoted in support of the business environment will be targeted towards
the optimal utilization of remittances to stimulate economic development, which will
maximize development advantages offered by migration. The confidence in the financial
system of households, including migrant workers, will be subject to increased
guaranteed amounts of deposits and effective monitoring of financial services. The
issuance of long-term securities accessible to migrant workers (such as Diaspora Bonds)
can be an efficient tool to use the remittance potential. Also, an important objective is
to improve the financial tools that are already applied, together with their
diversification, to the effect of supporting the re-equipment of industry and innovation
(business angels).
Mobilization of new funding through existing models and new innovative investment
schemes will generate changes in the consumption and production manner and will
increase export product competitiveness.
Adapting to good European practices of the financial market regulation and supervision
mechanism will increase its level of efficiency, will create favorable conditions to access
capital on the local financial market, which will generate an increased entrepreneurial
activity in the field and will boost the level of protection of consumer services offered on
the financial market.
Current weaknesses in collateral management will be removed, and hedging
instruments will be developed so that excessive liquidity in the financial system be
targeted in an effective way to crediting the real sector of national economy. Developing
risk management capabilities, including expanding information coverage through credit
history bureaus, will lead to lower risk premiums.
EXPECTED IMPACT Facilitating access to finance will lead to a significant increase in financing volumes
through the banking and non-banking sectors as a percentage of GDP (up to 50% by
2020). Achieving the planned level of growth of economy financing is in itself an
ambitious task, sensible to global economic and financial risks, as well as to local ones.
But, being reached, such an increase will have a direct impact on gross domestic
production and income by converting loans into new investment.
Assessing the impact that would have easier access to finance was based on the
assumption that, out of each modest additional MDL provided to the real sector as a
31
loan, at least 30 bani will be invested in productive capital. The supposed average
maturity of loans is three years. Under such circumstances, additional investment will be
reflected in an annual GDP growth of up to 0.5-0.7% higher compared to the scenario
without the implementation of this priority. This beneficial effect appears gradually, but
tends to accelerate rapidly, and will continue after the expiry of the forecasted term of
this Strategy.
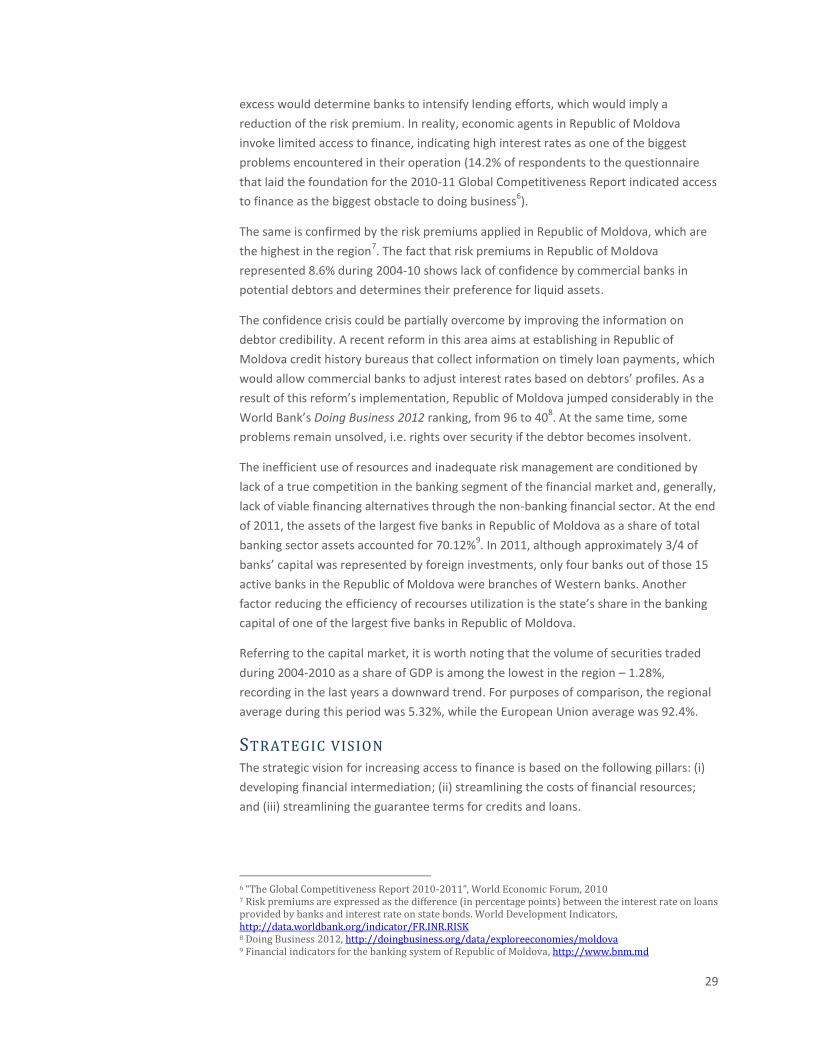
SPECIFIC OBJECTIVES Monitoring indicator 2010 2015 2020
Increasing the GDP share of deposits, % 35.8 40 45 Increasing the GDP share of loans, % 37.2 45 50 Reducing the risk premium, percentage points 10.1 9 7 Increasing the volume of exchange transactions with securities as a share of GDP, %
0.4 2 5
32
TABLES AND FIGURES FIGURE 9. R ISK PREMIUMS IN COUNTRIES IN THE REGION, PERCENTAGE POINTS
FIGURE 10. VOLUME OF STOCK TRANSACTIONS TO GDP, %
Poland
Hungary
Lithuania
Serbia
Czech Republic
Slovenia
Latvia
Bulgaria
Albania
Montenegro
Moldova
Romania
Georgia
Hungary
Czech Republic
Poland
Estonia
Montenegro
Bulgaria
Croatia
Serbia
Slovenia
Lithuania
Romania
Macedonia
Moldova
Ukraine
Georgia
Latvia
Slovakia
33
BUSINESS: WITH CLEAR RULES OF THE GAME An efficient market economy is characterized by the capacity to promote innovation
based on fair competition for resources and clients. Ultimately, the winners are
consumers that benefit from goods and services purchased for a fair price and a quality
commensurate with the price. A favorable business environment is attractive to foreign
investment and creation of new enterprises.
SITUATION ANALYSIS Foreign direct investment is mobilized by economic development prospects, as well as
by a series of external and domestic factors. Externally, the global economic expansion
favors investment from emerging countries, while domestically the implementation of
privatization programs is able to generate a targeted interest of potential investors. In
Republic of Moldova direct foreign investment has reached a maximum level of USD 713
million in 2008, having declined dramatically as a result of the world economic crisis. In
2010, the growth rates of foreign direct investment were recovered but not entirely
(Figure 6). Creation of new enterprises is also influenced by the country’s economic
prospects, albeit clear rules of the game have a determining role in taking a business
start-up decision. The number of enterprises increases annually in Republic of Moldova
by over 2,000 (figure 12). This growth could be intensified provided there are
regulations favorable to doing business.
The perception of investors and enterprises regarding business environment
attractiveness in Republic of Moldova is guided by international rankings.
Republic of Moldova’s ranking in the Doing Business 201210
survey of the
World Bank was 81st
out of 183 countries, being surpassed significantly by the
majority of countries in the region and in the CIS.
In the Global Competitiveness Index 2011-201211
Republic of Moldova ranked
93d out of 142 countries, also being surpassed by the majority of countries in
the region and in the CIS. According to the aggregate indicator “Institutions”,
which reflects the regulation framework under the Global Competitiveness
Index, the Republic of Moldova ranks 106th
. According to the same ranking,
entrepreneurs highlighted the following factors as being key problems to
businesses, in order of priority: (i) political instability; (ii) corruption; (iii) limited
access to finance; (iv) inefficient public administration; and (v) Government
instability.
Index of Economic Freedom 201112
is an important reference indicator
internationally, which evaluates the degree of state interference in economic
activity based on 10 sub-indicators: business freedom, trade freedom, fiscal
10 „Doing Business Survey 2012”, World Bank, http://doingbusiness.org/ 11 „Global Competitiveness Index 2011-2012”, World Economic Forum, http://www.weforum.org/reports 12 „Index of Economic Freedom 2011”, Heritage Foundation, http://www.heritage.org/
34
freedom, Government spending, monetary freedom, investment freedom,
financial freedom, property rights, freedom from corruption and labor
freedom. Republic of Moldova is ranked only 120th
on this indicator out of 179
countries.
Another indicator is the Logistics Performance Index, which shows the capacity
of countries to ensure the goods movement and to interconnect producers
with consumers and with international markets. Moldova ranked 104th
out of
155 countries in 2010. On the same indicator, the Republic of Moldova is
situated among the last in the rank: the 124th
in customs administration and
the 132nd
in the area of logistics competency and performance.
As a conclusion to the aforementioned, the business environment in Republic of
Moldova is characterized by unjustified financial costs and time, which exceed
essentially the levels in developed countries. Consequently, the country’s rate of
economic development is affected negatively and the investment and export potential
for added-value production is not fully utilized. The excessive administrative burden
creates barriers for starting, doing and closing businesses, being a de-motivating factor
in promoting fair competition geared towards productivity and innovation.
Indicated problems are encountered at all stages of the business cycle: (i) starting a
business; (ii) doing business, and (iii) closing a business.
ST A R T I N G A B U S I N E S S
Moldova ranks 88th
out of 183 countries in the international ranking „Doing
Business” 2012 on „Starting a business”.
The main problems at this stage of a company’s business cycle are the large
number of procedures and high costs associated with these. However, the
„Starting a business” indicator described above covers only the procedures
related to business registration. For many types of activities, before starting a
business, companies must get a number of permits (trade operating permits,
sanitary permits, veterinary permits, licenses, authorizations for anti-fire
protection etc.), the issuance procedures often being burdensome, non-
transparent and unclear, including time-consuming, costly and involving human
resources.
DO I N G B U S I N E S S
At the stage of doing business, entrepreneurs encounter a number of
mandatory conditions imposed for different types of activity and administrative
barriers and costs related to:
big number of state inspections;
frequency and manner of submission of compulsory reports and information;
tax payment manner and, respectively, time consumption ;
35
getting a huge number of permits for constructions, installations, equipment,
raw materials, products and services, including for imported and exported
ones;
burdensome and non-transparent formalities, procedures and rules in customs
administration and in ensuring customs declaration for import and for export of
goods and services;
non-familiarization by importing countries with conformity evaluation results,
conducted by national entities for exported goods.
An inventory of the list of permits, except those related to financial markets
(banking and non-banking), licenses and documents issued by local authorities,
conducted in 2011, revealed the existence of over 400 papers. Of these, only
272 papers were considered justified, which were included in the
Nomenclature of permits issued by authorities to individuals and businesses for
entrepreneurial practice13
. Permits other than the ones included in the
Nomenclature do not represent a legal norm. Also, it is important to mention
that several public authorities are mandated with control functions, performing
numerous inspection visits that bring significant costs and risks to the business
environment. A combination of these with the requirements and procedures
related to import-export operations, associated with high costs for goods’
border crossing, affects primarily investments in export-oriented businesses,
which are intense from technology and innovation perspectives, or which have
the highest potential for growth.
Aside from conformity requirements and administrative barriers, a critical
constraint to doing business is the low level of quality infrastructure
development, specifically of conformity assessment capacity, which affects
significantly the country’s export potential.
Ensuring a sustainable export-based economic growth requires a reduction in
the high costs associated with goods’ border crossing, service delivery and
mobility of persons related to these businesses. A better business
infrastructure, an efficient customs administration, targeted to facilitate trade
with goods and services represent priorities to ensure an economic
development based on business cost optimization and export promotion.
CL O S I N G A B U S I N E S S
Moldova ranks 91st
out of 183 countries in the international ranking „Doing
Business” 2012 on “Closing a business”. Problems at this chapter are associated
with the cost and with the length of insolvency procedures, as well as low asset
recovery rate by creditors.
13 Approved by Law regarding regulation through authorization of entrepreneurial activity No.160 of July 22, 2011

36
Generally, financial and time costs incurred by companies at different stages of the
business cycle are comparatively higher than average costs in the reforming countries
from the region, such as Georgia (Figure 13). The sequential implementation of the
regulatory reform, the unequivocal interpretation of regulatory acts corroborated in
conjunction with biased attitude towards entrepreneurs by public authorities and
institutions mandated with state control functions have diminished to some extent the
expected effects of reforms meant to improve the business environment.
Regulations that lead to an excessive increase in the administrative burden fall by their
nature under the following two categories:
Unjustified regulations, which generate administrative costs often exceeding public
benefits. Such regulations are the result of low competencies of public bodies or
institutional and personal interests. Interests relate to the preservation and
expansion of institutional functions that allow greater influence and importance,
and creation of favorable conditions for corruption and encouragement of
economic groups, generating thus unfair competition in the economy and inhibiting
innovational activities;
Ambiguous and contradictory regulations, which can be interpreted and applied in
a discretionary manner and, thus can lead consequently to the discretionary
enforcement of regulatory provisions, to a reduced regulation predictability and
transparency, to corruption and unfair competition.
Although a large number of regulations and of permits were reviewed and amended
during the reform, it has not answered fully the expectations in this regard. Thus,
compared to Georgia, which inherited from the Soviet period a similar regulatory
framework, Republic of Moldova failed to utilize sufficiently the potential for reduction
of administrative barriers (Table 4).
This situation reveals another major problem that lies in poor compliance by public
authorities to the principles of good regulation prescribed by previous reforms, such as
predictability and transparency in business activity regulation; material and procedural
regulation through legislative acts; regulatory impact assessment; equity in relationships
between state and businesses; tacit approval of starting and/or doing business; one-
stop shop, etc. This situation creates favorable grounds for corruption and regulatory
discrimination.
STRATEGIC VISION Republic of Moldova aims at improving the business environment so that by 2020 the
risks and costs associated with each stage of the business life cycle are lower compared
to countries in the region, this being governed by the principle of free competition. The
impact of improved business environment will be expressed through increased
investment and exports, higher number of reliable companies motivated to implement
innovations, capable of creating quality jobs, ensure high productivity and competitive
export-oriented production, which is supported by Republic of Moldova’s advancement
37
in the international rankings Doing Business, Global Competitiveness, Economic Freedom
and Logistics Performance, exceeding the average in the region.
Optimization of procedures and timeframe required for an economic agent to start, do
and close a business, by applying innovational approaches in business regulation, such
as digitization of public service delivery, and changing the focus from inspections to
counseling, with inspections being conducted based on the perceived risk principle, will
improve significantly the business environment and will also reduce useless
administrative costs and will ensure implicitly economic development. Aside from direct
stimulation of businesses, investment and foreign trade, optimization by means of
innovational approaches in public service delivery will create a foundation and
substantial boost for innovations and for new jobs, including in the private sector.
The reform solutions for the regulatory system will be efficient and sustainable if
supported by enforcement and implementation mechanisms. In this regard, work will be
done on involving more actively the private sector in initiating, developing and revising
regulations. Other important players in this process are the courts, which will have to
answer promptly and correctly to citizens’ and entrepreneurs’ signals of violations of
their rights by public institutions, particularly in relation to the timely issuance of
permits, ensure a transparent system for the submission of complaints regarding all
institutions involved in business regulation and foreign trade, non-involvement by public
institutions in business activity, if there are no obvious reasons, and recovery of damage
caused by these within a short period of time.
Competition is an essential factor in boosting the national economy, in improving the
business environment and raising its attractiveness for both launching new businesses
and their development. To ensure effective and fair competition, the Republic of
Moldova intends to develop and implement a national program in the field of
competition and state aid by undertaking the best European practices to prevent,
suppress and limit the anticompetitive activities of economic agents and of public
administration authorities.
Creation of new enterprises will be also encouraged through sharing of business success
stories, through support to entrepreneurial spirit, among women in particular, whose
share is currently only 27.5% among entrepreneurs. The existing mechanisms through
which small and medium enterprises benefit from trainings, as well as financial and
logistics support, will be expanded and diversified.
In addition, efforts will be concentrated to develop the quality infrastructure capacity
meant to facilitate exports and encourage implementation of advanced technologies in
local companies, including in agriculture, so that to ensure the consumption security.
Also, the implementation of reforms in the health regulation and administration domain
can optimally improve the productivity and efficiency in the Republic of Moldova.
The economic activity of companies has a direct environmental impact. At the same
time, rigid regulations addressing environmental protection impose certain compliance
costs for doing business. Although from the perspective of sustainable development
38
such costs are justified, there is a risk that the business environment perceives them as
excessive. In this regard, new regulations will address environmental impact assessment
so as to distribute evenly the administrative burden on economic entities without
distorting market mechanisms and without creating grounds for unfair competition.
Broadly, the quality of the business environment affects investment activity and
economic development through administrative and compliance costs and through risks
associated with the opacity of regulations and discretionary enforcement of sanctions.
Promoting intelligent regulation and a horizontal approach and establishing
interoperable standards in the field will create conditions to use all business
development opportunities.
EXPECTED IMPACT Eliminating regulatory constraints and unjustified costs would create grounds for a more
dynamic, intelligent and sustainable economic development, encouraging investment in
the productive sector of national economy, creating new products and broader access
to foreign markets.
Direct effects from regulatory framework improvement will be a reinvestment of
savings from the reduction in doing business and job creation costs. Savings from
reduction of administrative costs can be estimated relatively easily and are smaller than
the costs of compliance with regulatory provisions. Compared to these, savings from
reduction of compliance costs cannot be estimated with sufficient precision but can be
reckoned by increased trade volumes, including exports as a share of GDP, which have
an impact directly proportional with economic development and poverty reduction.
Indirect effects would be enhanced investor confidence in the business environment in
Republic of Moldova and, as a result, increased investment flows, including foreign.
Since local investors’ resources are limited, foreign investment could be a major factor
in changing the country’s development paradigm. Moreover, an improvement in the
business environment, aside from the quantitative impact on investment, will also
enhance their quality, with a particular bias towards businesses that are technology-
and innovation-intensive. Since this effect depends on several factors, including the
quality of business environment in Republic of Moldova compared to business
environment from other countries, it is not possible its quantification.
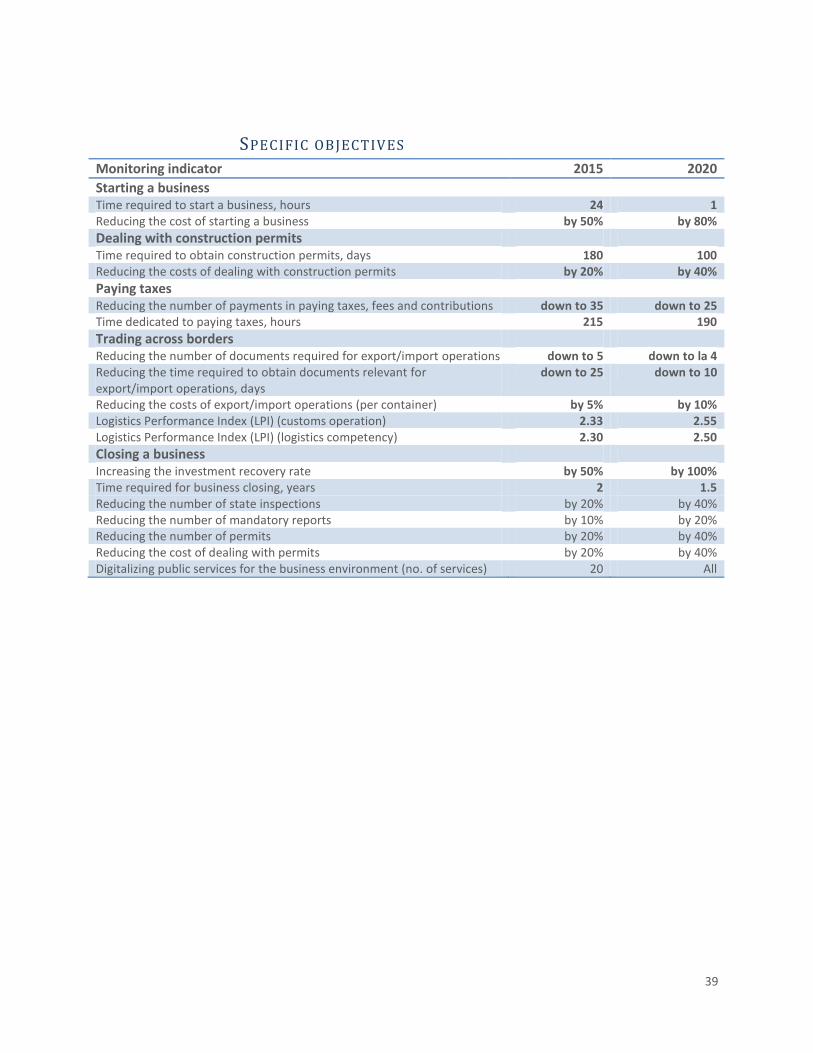
39
SPECIFIC OBJECTIVES Monitoring indicator 2015 2020
Starting a business Time required to start a business, hours 24 1 Reducing the cost of starting a business by 50% by 80%
Dealing with construction permits Time required to obtain construction permits, days 180 100 Reducing the costs of dealing with construction permits by 20% by 40%
Paying taxes Reducing the number of payments in paying taxes, fees and contributions down to 35 down to 25 Time dedicated to paying taxes, hours 215 190
Trading across borders Reducing the number of documents required for export/import operations down to 5 down to la 4 Reducing the time required to obtain documents relevant for export/import operations, days
down to 25 down to 10
Reducing the costs of export/import operations (per container) by 5% by 10% Logistics Performance Index (LPI) (customs operation) 2.33 2.55 Logistics Performance Index (LPI) (logistics competency) 2.30 2.50
Closing a business Increasing the investment recovery rate by 50% by 100% Time required for business closing, years 2 1.5 Reducing the number of state inspections by 20% by 40% Reducing the number of mandatory reports by 10% by 20% Reducing the number of permits by 20% by 40% Reducing the cost of dealing with permits by 20% by 40% Digitalizing public services for the business environment (no. of services) 20 All
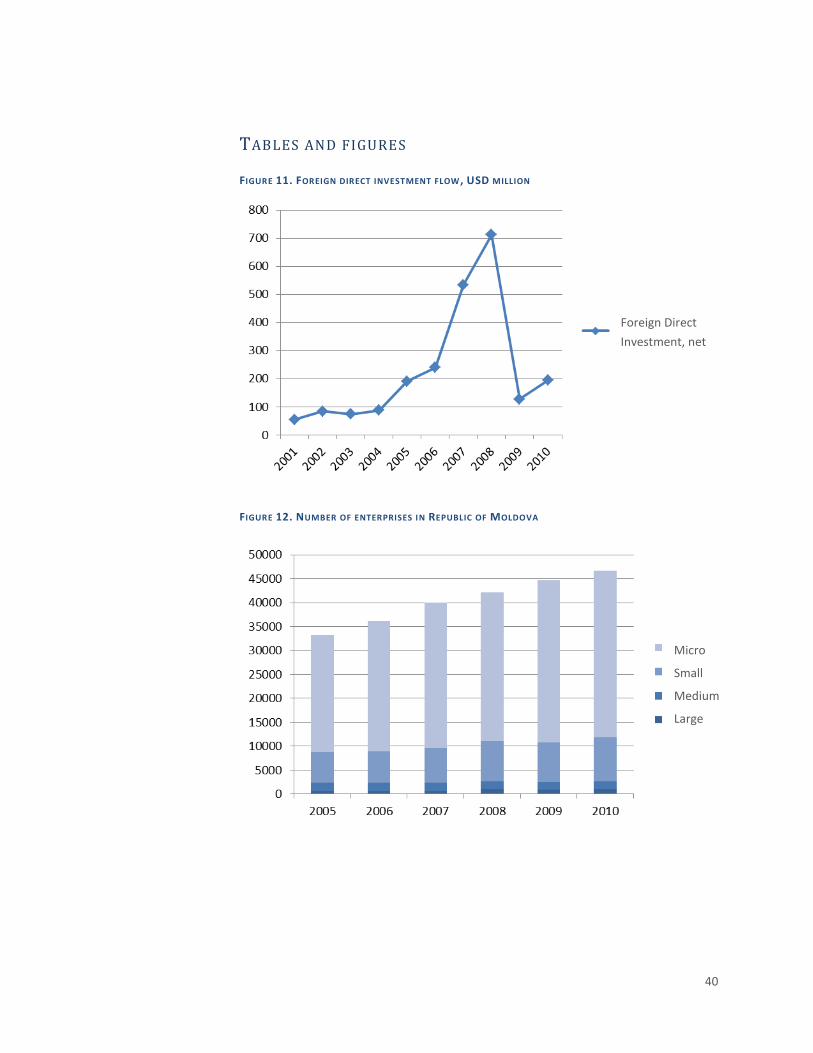
40
TABLES AND FIGURES
FIGURE 11. FOREIGN DIRECT INVESTMENT FLOW , USD MILLION
FIGURE 12. NUMBER OF ENTERPRISES IN REPUBLIC OF MOLDOVA
Foreign Direct
Investment, net
Micro
Small
Medium
Large
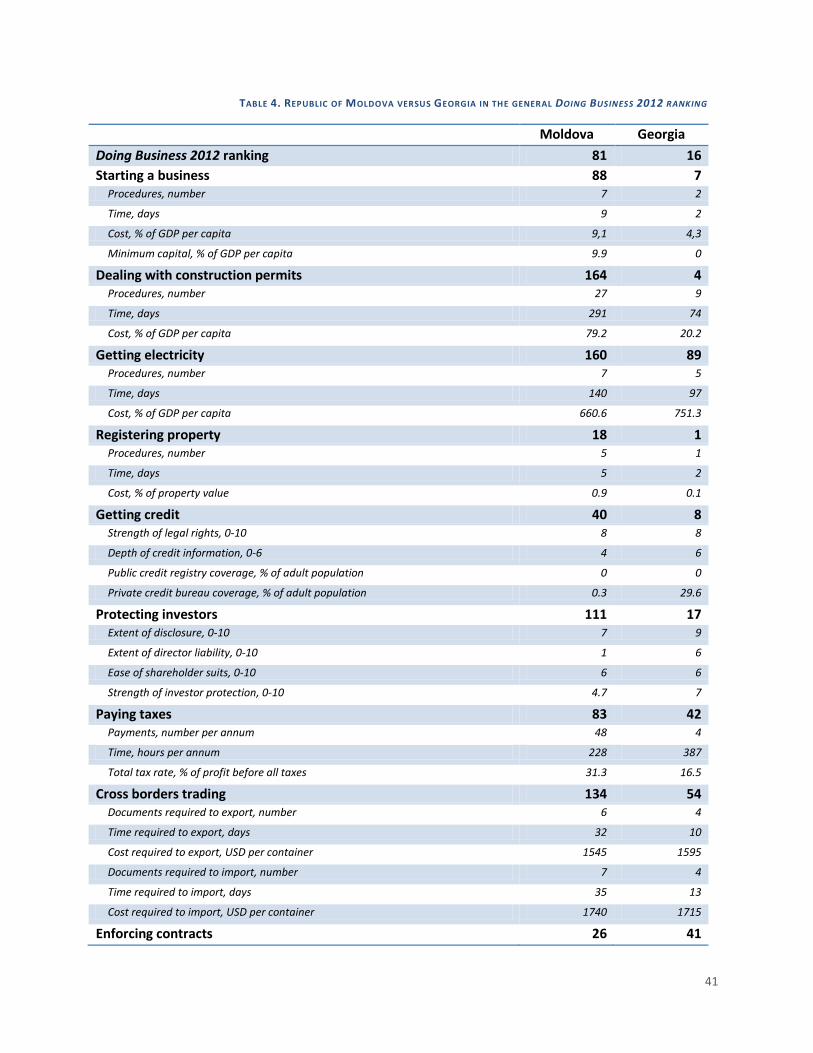
41
TABLE 4. REPUBLIC OF MOLDOVA VERSUS GEORGIA IN THE GENERAL DOING BUSINESS 2012 RANKING
Moldova Georgia
Doing Business 2012 ranking 81 16
Starting a business 88 7 Procedures, number 7 2
Time, days 9 2
Cost, % of GDP per capita 9,1 4,3
Minimum capital, % of GDP per capita 9.9 0
Dealing with construction permits 164 4 Procedures, number 27 9
Time, days 291 74
Cost, % of GDP per capita 79.2 20.2
Getting electricity 160 89 Procedures, number 7 5
Time, days 140 97
Cost, % of GDP per capita 660.6 751.3
Registering property 18 1 Procedures, number 5 1
Time, days 5 2
Cost, % of property value 0.9 0.1
Getting credit 40 8 Strength of legal rights, 0-10 8 8
Depth of credit information, 0-6 4 6
Public credit registry coverage, % of adult population 0 0
Private credit bureau coverage, % of adult population 0.3 29.6
Protecting investors 111 17 Extent of disclosure, 0-10 7 9
Extent of director liability, 0-10 1 6
Ease of shareholder suits, 0-10 6 6
Strength of investor protection, 0-10 4.7 7
Paying taxes 83 42 Payments, number per annum 48 4
Time, hours per annum 228 387
Total tax rate, % of profit before all taxes 31.3 16.5
Cross borders trading 134 54 Documents required to export, number 6 4
Time required to export, days 32 10
Cost required to export, USD per container 1545 1595
Documents required to import, number 7 4
Time required to import, days 35 13
Cost required to import, USD per container 1740 1715
Enforcing contracts 26 41
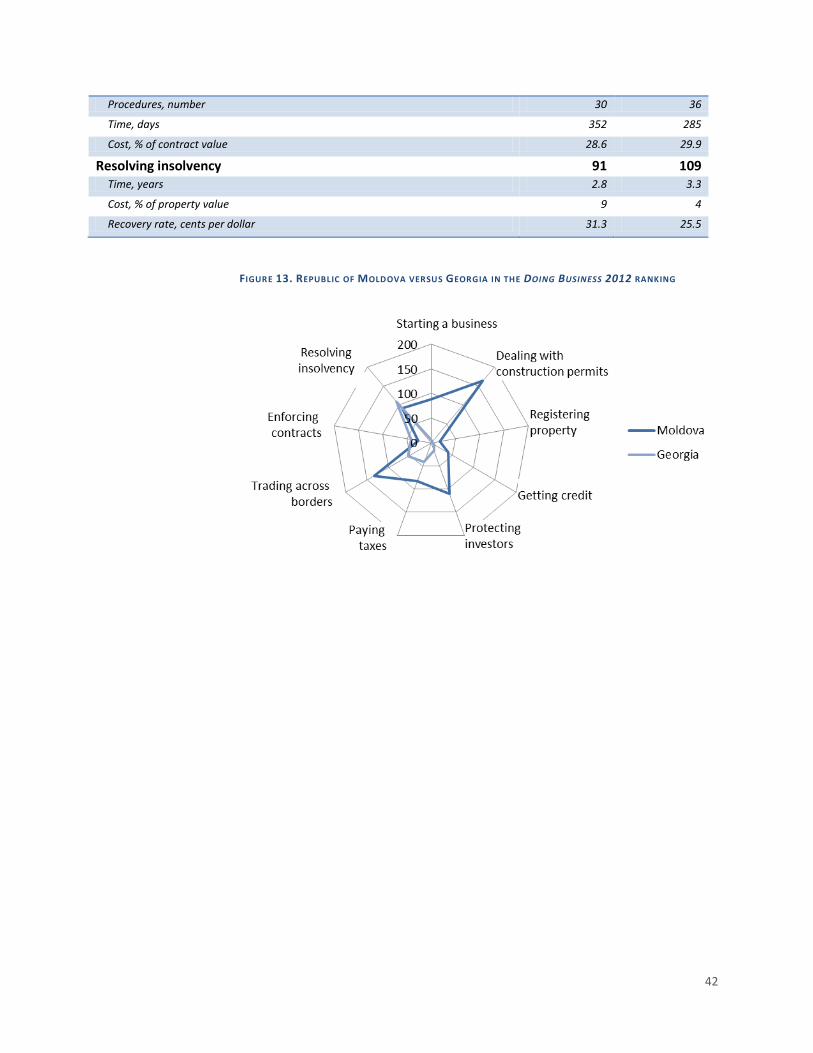
42
Procedures, number 30 36
Time, days 352 285
Cost, % of contract value 28.6 29.9
Resolving insolvency 91 109 Time, years 2.8 3.3
Cost, % of property value 9 4
Recovery rate, cents per dollar 31.3 25.5
FIGURE 13. REPUBLIC OF MOLDOVA VERSUS GEORGIA IN THE DOING BUSINESS 2012 RANKING
43
ENERGY: DELIVERED SAFELY , USED EFFICIENTLY Energy efficiency and security have a direct impact on economic development and
poverty reduction. At the moment, however, the energy system in Republic of Moldova
faces a number of problems. Energy infrastructure is in a state of advanced usage, and
prices of energy resources, which are 95% imported, are increasing. Power generation
capacities are insufficient on the right bank of Nistru. Similarly, there are insufficient
physical network interconnections with neighboring countries in the sectors of natural
gas and of electricity. Losses in the electricity and heating sectors are high, as well as the
debt to the natural gas supplier accumulated in the heating sector. Energy consumption
is inefficient and the use of renewable energy resources is limited (table 5).
SITUATION ANALYSIS Although a series of trends are common for all sectors, further are reflected the
particularities of the situation in electricity, heating, natural gas and renewable energy
resources sectors.
E L E CT R I C I T Y
The level of electricity production decreased by 15% in 2010 compared to 2001, the
largest share of electricity production belonging to the Central Heating-and-Power Plant
nr.2 (CHP-2) - 70-80%. Procurement of imported and of produced by the Moldovan
Thermo-Electrical Power Plant electricity is declining. Thus, in 2010, this indicator fell by
about 21% compared to 2009 and, respectively, by about 6% compared to 2001 (see
Figure 14). This shows the dependence on energy imports and procurement from one
supplier - the Moldovan Thermo-Electrical Power Plant, which affects our country's
energy security.
Also, albeit losses recorded by electricity distribution grids in Republic of Moldova are
declining, their level is higher level compared to developed countries (up to 10%), which
affects negatively the energy efficiency of Republic of Moldova (figure 14).
HE A T I N G
Production of heating is fluctuating (Figure 16). Thus, in 2010, production increased by
about 9% compared to 2009, but fell by 12.8% compared to 2001. The largest share of
heating is produced by the central heating-and-power plants – 60-65%. The reduction of
thermal load is conditioned, inter alia, by massive consumer disconnections from the
district heating system.
A serious problem of the heating sector in Republic of Moldova is the large historic debt
accumulated by the JSC “Termocom” to the central heating-and-power plants (table 6).
Following an analysis of the JSC “Termocom” debts, one can see that the greatest debts
are registered to the JSC “CHP-2”. The reviewed period recorded 2-fold increase of

44
debts, and their average payment rate was 40-60%. It should be noted that the debts of
the JSC “Termocom” to the JSC “CHP-1” are 3 times lower compared to the JSC “CHP-2”,
which is due to the different capacities of the plants. This is caused by increasing
population and economic agents’ arrears for heating and by non-adjustment of tariffs
on time.
Another deficiency of the heating sector is the high level of heat losses, which
accounted for 22% in 2010. This indicator registered in the period 2001-2010 a general
growth trend of about 7.2 percentage points (Figure 17).
Buildings consume most of the energy (40%) and contribute most to greenhouse gas
emissions. Buildings in the residential sector show the highest energy consumption (65%
of all buildings). Reduced energy performance of existing buildings also has a strong
social impact, affecting in particular the socially vulnerable population. The average
share of spending for heating ranges from 15% up to 50% of the total spending of a
household.
The experience of European countries and the local one gained as a result of
implementing projects meant to increase the energy efficiency of existing buildings
(building envelope renovation, upgrading heating systems, etc.) demonstrate that the
potential for reducing energy consumption in existing buildings is about 30-50% and
may even reach 70% in some cases.
N A T U R A L G A S
Republic of Moldova is dependent on natural gas imported from a single source. This
dependence enhances the vulnerability of national economy to natural gas price
increases.
Procurement of natural gas to Republic of Moldova is declining (table 7). Thus, in 2010,
natural gas procurements decreased by approximately 16.3% compared to 2005.
However, gas procurements in terms of value increased by approximately 2.7 times in
the reviewed period due to higher average import prices for natural gas. Similarly, the
volume of natural gas supplies fell as a natural expression, and in monetary terms these
registered an upward trend because of increased average prices of gas delivered. Higher
natural gas import prices have a negative impact on the economy and vulnerable
categories of the population.
R E N E W A B LE E N E R G Y R E S O U R CE S A N D E N E R G Y E F F I C I E N C Y
It is clear that ensuring energy efficiency and using of renewable energy sources in
Republic of Moldova is a strategic priority in the absence of energy resources and
growing dependence on imported energy resources.
Energy efficiency in Republic of Moldova is very low, about 3 times lower compared to
European countries, which leads to a substantial increase in the costs of energy
resources. The main constraints for energy efficiency growth in Republic of Moldova
are: i) high energy consumption leading to increased energy intensity; ii) increasing
45
energy prices, morally and physically outdated technology and equipment; and iii) lack
of knowledge and skills in the area of energy efficiency and use of renewable energy
resources (Table 8).
STRATEGIC VISION The Government aims to create by 2020 a competitive and efficient energy sector that
will provide consumers with quality energy resources, on affordable and reliable terms,
will respond to the challenges of energy price increases, dependency on imports of
energy resources, and energy sector impact on climate change. The strategic vision will
be accomplished based on the principle of competitiveness and liberalized energy
market.
The specific situation in the energy sector, with continuously growing consumer
requirements for quality and energy security, meeting the mutual obligations „energy
services provider – consumer”, have an overall significant impact on Republic of
Moldova’s sustainable development, on viable supply of energy and fuel to the country
and population, in adequate quantities and at reasonable prices. Hence, an active
energy policy and a well-developed and efficient legislative-regulatory framework will
contribute to changing the paradigm of economic development.
The strategic vision for the development of the energy sector is based on the following
pillars: (i) ensuring the country’s energy security, and (ii) increasing energy efficiency.
Strengthening the country’s energy security will be achieved through energy market
liberalization in compliance with provisions of the Energy Community Treaty, through
integration of the Republic of Moldova with the European energy market and
development of energy resources’ transport interconnections. Also, special emphasis
will be placed on optimizing the energy mix, on diversifying energy resources and on
creating new energy generation capacity.
Ensuring energy efficiency will materialize through: reduction of energy intensity in
residential, industrial, transport and agriculture sectors; modernization of the energy
system; implementation of efficient energy technologies; involvement of own energy
resources, including renewable ones, in the consumption balance. Major importance
will be given to raising public awareness regarding the need to save energy, including by
encouraging the population to buy utility services, construction materials, housing,
home appliances, and products with an impact on energy. Energy savings thus obtained
will also have a favorable environmental impact.
Also, innovations in all aspects of hospital sector modernization regarding energetic
assurance and raising energetic efficiency will be supported. The role and value of
building low-cost technologies for medical facilities operation will be most appreciated.
An emerging need will be to ensure low-cost biosafety and biorisk management, closely
connected with the introduction of environmental friendly technologies within medical
institutions, in accordance with modern European standards or with other modern
standards.
46
Attracted investments are essential in order to develop and modernize the energy
sector in line with the strategic vision. This implies: (i) creating and strengthening
mechanisms to attract and use efficiently funding for energy projects; (ii) use rationally
state investment and private investment in energy development projects; (iii)
developing an information base and a database for energy project funding.
To the effect of accomplishing the proposed strategic directions, the Government will
channel its efforts to: (i) strengthen sector reform, including by adopting new energy
legislation harmonized with EU requirements; (ii) implement measures promoting
energy efficiency; (iii) attract investment in the sector; (iv) strengthen institutional
capacity in this area.
EXPECTED IMPACT Development of the energy sector in line with the strategic vision will contribute to
materializing the concept of sustainable development of national economy. Envisaged
actions will boost the implementation of a new economic paradigm based on
„investment-exports” relying on the country’s industrial development process, will
result in a reduced poverty level as a consequence of increasing population access to
energy resources, as well as a reduction of dependency on imports of energy resources
and strengthened energy security.
Increasing energy efficiency will have a direct influence on many sectors of national
economy, especially those directly related to utilization of energy in production, as well
as to consumption in households and public institutions. Currently, the intermediate
production in the energy and transport sectors amounts over MDL 17 billion.
The planned gradual increase of energy efficiency by up to 10% would mean that more
goods could be produced with the same amount of energy, or that the same domestic
product could be obtained with less energy, which equals fewer costs. Annual savings by
2020 will account for approximately MDL 830 million in current prices.
These savings can be channeled towards new investment in different proportions,
depending on the sector. A modest estimate suggests that, as a result of new
investment, the annual GDP growth rate over medium and long term will be higher by at
least 0.2% compared to the base case scenario, only on account of savings achieved.
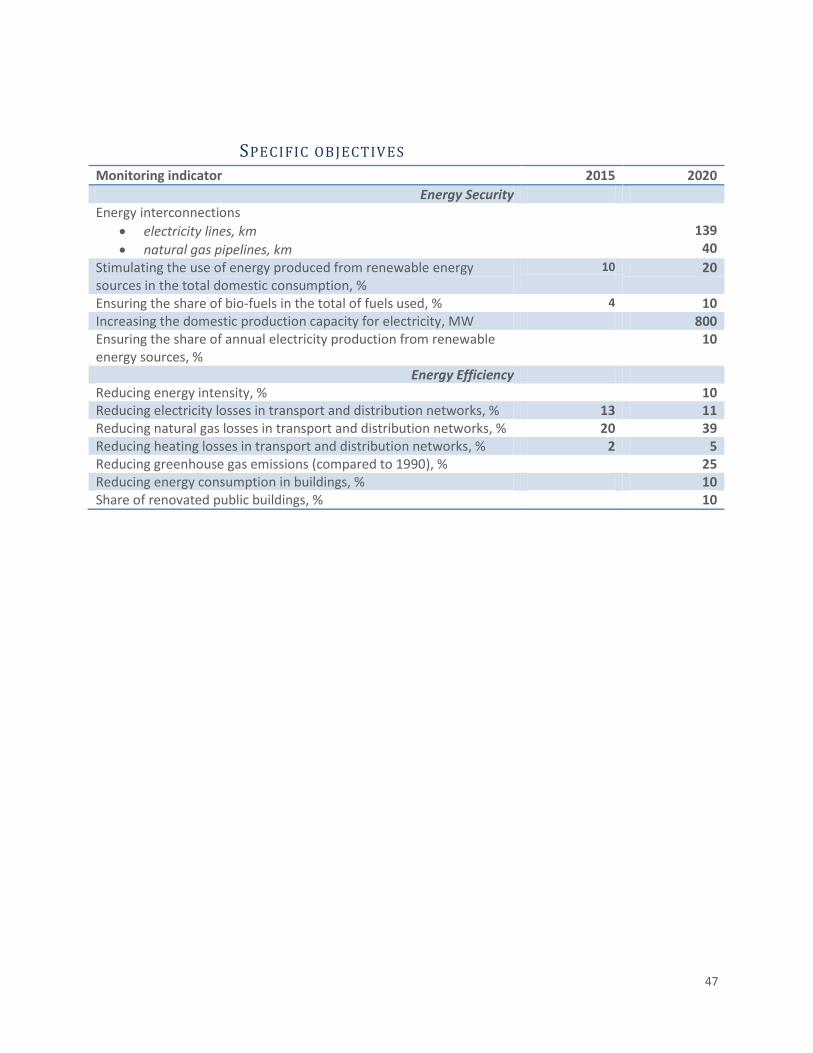
47
SPECIFIC OBJECTIVES
Monitoring indicator 2015 2020
Energy Security Energy interconnections
electricity lines, km
natural gas pipelines, km
139
40
Stimulating the use of energy produced from renewable energy sources in the total domestic consumption, %
10 20
Ensuring the share of bio-fuels in the total of fuels used, % 4 10 Increasing the domestic production capacity for electricity, MW 800 Ensuring the share of annual electricity production from renewable energy sources, %
10
Energy Efficiency
Reducing energy intensity, % 10 Reducing electricity losses in transport and distribution networks, % 13 11 Reducing natural gas losses in transport and distribution networks, % 20 39 Reducing heating losses in transport and distribution networks, % 2 5 Reducing greenhouse gas emissions (compared to 1990), % 25 Reducing energy consumption in buildings, % 10 Share of renovated public buildings, % 10
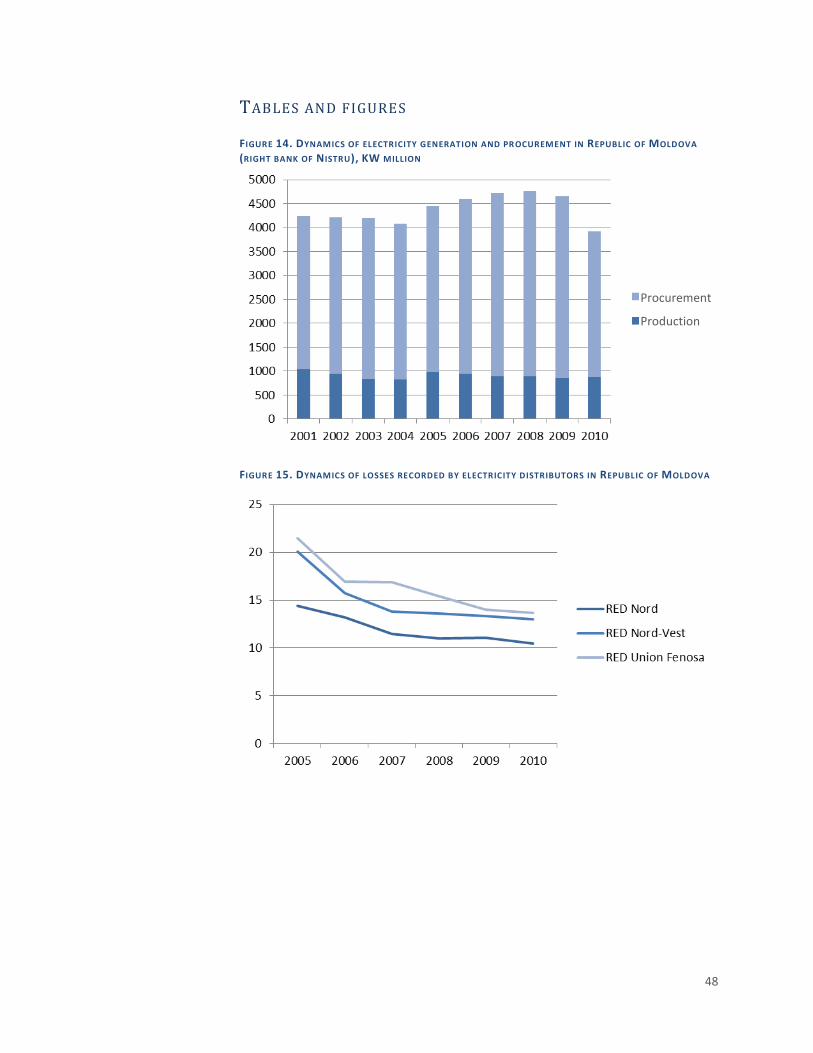
48
TABLES AND FIGURES
FIGURE 14. DYNAMICS OF ELECTRICITY GENERATION AND PR OCUREMENT IN REPUBLIC OF MOLDOVA
(RIGHT BANK OF NISTRU), KW MILLION
FIGURE 15. DYNAMICS OF LOSSES RECORDED BY ELECTRICITY DISTRIBUTORS IN REPUBLIC OF MOLDOVA
Procurement
Production

49
FIGURE 16. DYNAMICS OF HEATING PRODUCTION IN REPUBLIC OF MOLDOVA, GCAL THOUSAND
FIGURE 17. DYNAMICS OF HEATING LOSSES IN REPUBLIC OF MOLDOVA
Heating plants
CHPs
Losses, %
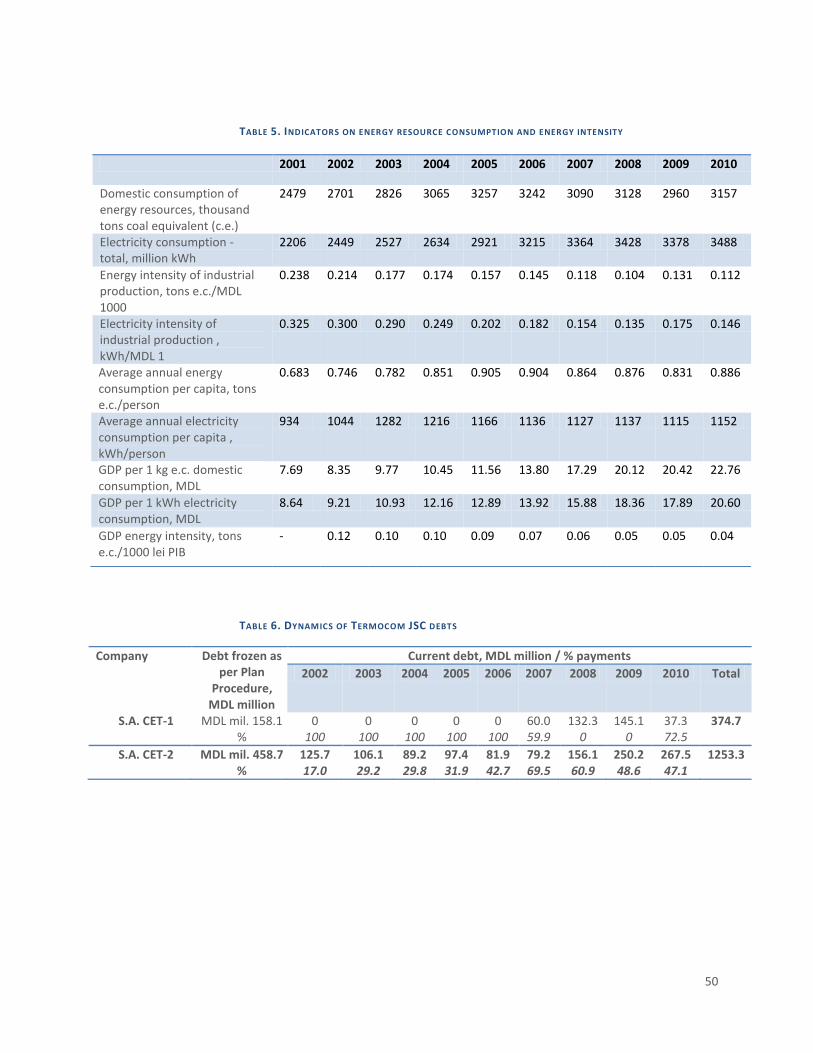
50
TABLE 5. INDICATORS ON ENERGY RESOURCE CONSUMPTION AND ENERGY INTENSITY
TABLE 6. DYNAMICS OF TERMOCOM JSC DEBTS
Company Debt frozen as per Plan
Procedure, MDL million
Current debt, MDL million / % payments
2002 2003 2004 2005 2006 2007 2008 2009 2010 Total
S.A. CET-1 MDL mil. 158.1 %
0 100
0 100
0 100
0 100
0 100
60.0 59.9
132.3 0
145.1 0
37.3 72.5
374.7
S.A. CET-2 MDL mil. 458.7 %
125.7 17.0
106.1 29.2
89.2 29.8
97.4 31.9
81.9 42.7
79.2 69.5
156.1 60.9
250.2 48.6
267.5 47.1
1253.3
2001 2002 2003 2004 2005 2006 2007 2008 2009 2010
Domestic consumption of energy resources, thousand tons coal equivalent (c.e.)
2479 2701 2826 3065 3257 3242 3090 3128 2960 3157
Electricity consumption - total, million kWh
2206 2449 2527 2634 2921 3215 3364 3428 3378 3488
Energy intensity of industrial production, tons e.c./MDL 1000
0.238 0.214 0.177 0.174 0.157 0.145 0.118 0.104 0.131 0.112
Electricity intensity of industrial production , kWh/MDL 1
0.325 0.300 0.290 0.249 0.202 0.182 0.154 0.135 0.175 0.146
Average annual energy consumption per capita, tons e.c./person
0.683 0.746 0.782 0.851 0.905 0.904 0.864 0.876 0.831 0.886
Average annual electricity consumption per capita , kWh/person
934 1044 1282 1216 1166 1136 1127 1137 1115 1152
GDP per 1 kg e.c. domestic consumption, MDL
7.69 8.35 9.77 10.45 11.56 13.80 17.29 20.12 20.42 22.76
GDP per 1 kWh electricity consumption, MDL
8.64 9.21 10.93 12.16 12.89 13.92 15.88 18.36 17.89 20.60
GDP energy intensity, tons e.c./1000 lei PIB
- 0.12 0.10 0.10 0.09 0.07 0.06 0.05 0.05 0.04
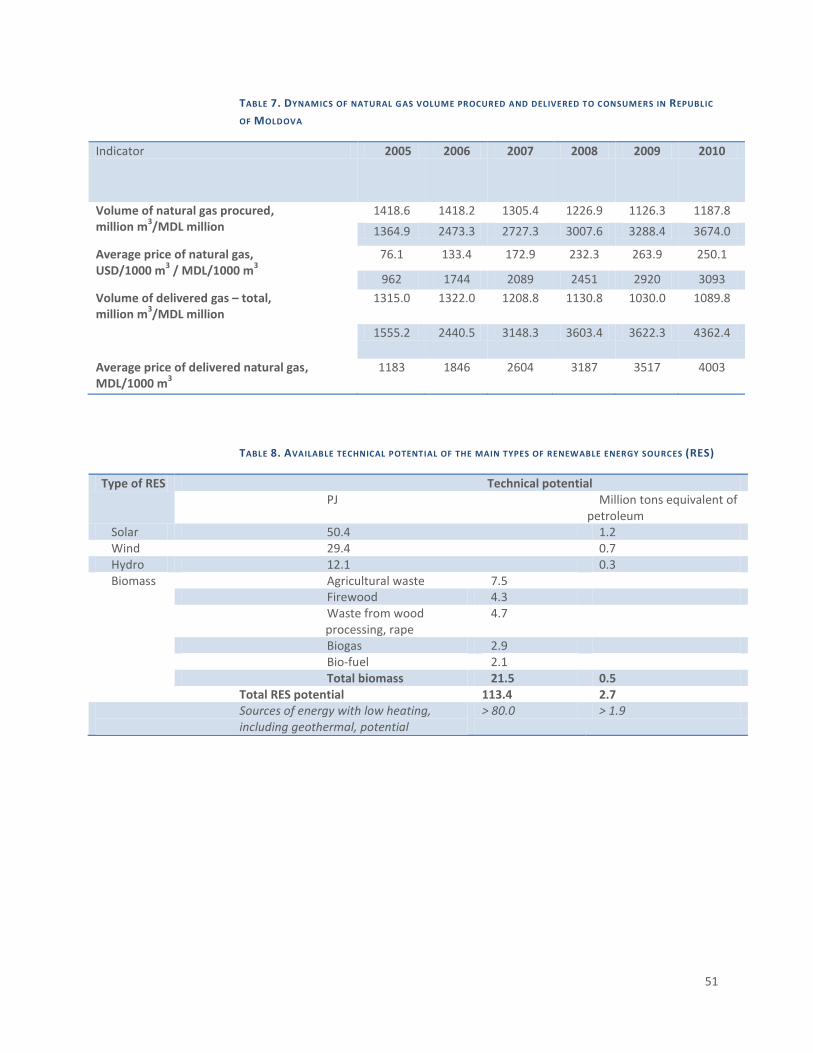
51
TABLE 7. DYNAMICS OF NATURAL GAS VOLUME PROCURED AND DELIVERED TO CONSUMERS IN REPUBLIC
OF MOLDOVA
Indicator 2005 2006 2007 2008 2009 2010
Volume of natural gas procured, million m
3/MDL million
1418.6 1418.2 1305.4 1226.9 1126.3 1187.8
1364.9 2473.3 2727.3 3007.6 3288.4 3674.0
Average price of natural gas, USD/1000 m
3 / MDL/1000 m
3 76.1 133.4 172.9 232.3 263.9 250.1
962 1744 2089 2451 2920 3093
Volume of delivered gas – total, million m
3/MDL million
1315.0 1322.0 1208.8 1130.8 1030.0 1089.8
1555.2 2440.5 3148.3 3603.4 3622.3 4362.4
Average price of delivered natural gas, MDL/1000 m
3 1183 1846 2604 3187 3517 4003
TABLE 8. AVAILABLE TECHNICAL POTENTIAL OF THE MAIN TYPES OF RENEWABLE ENERGY SOURCES (RES)
Type of RES Technical potential PJ Million tons equivalent of
petroleum Solar 50.4 1.2 Wind 29.4 0.7 Hydro 12.1 0.3 Biomass Agricultural waste 7.5
Firewood 4.3 Waste from wood processing, rape
4.7
Biogas 2.9 Bio-fuel 2.1 Total biomass 21.5 0.5
Total RES potential 113.4 2.7 Sources of energy with low heating, including geothermal, potential
> 80.0 > 1.9
52
PENSION SYSTEM: EQUITABLE AND SUSTAINABLE Ensuring an equitable pension system based on a wage replacement rate that ensures a
decent living for citizens is the main focus of this priority and the reason for having it in
the vision of the authorities of Republic of Moldova in 2020. At the same time, the fiscal
burden associated with the contributions to the state social insurance budget the gap
between pension amounts for different categories of pensioners, influence of
demographic trends – population migration and ageing – all of them have a sizeable
impact on national economy and on its development rates.
SITUATION ANALYSIS The public social insurance system is an integral part of the state social protection
system, with the main objective of providing cash benefits to insured persons who are
unable to obtain wage revenues due to certain risks (ageing, temporary or permanent
lack of working capacity, maternity, unemployment, etc.) and is based on the collection
of social insurance contributions from employers and from insured persons and
distribution of benefits to beneficiaries.
The pension system in Republic of Moldova operates based on the pay-as-you-go
scheme, which consumes 8.8% of GDP. In 2010, 69.6% of the working population was
contributing to the social security system, and pensions were paid for 84.7% of citizens
who have reached the retirement age, i.e. a total of 460,500 people, or 13% of the total
population. Thus, the pension system has a significant role in ensuring a decent
standard of living for the population. In 2011, expenditures for payment of pensions
were 67.8% of the total social security budget.
The pension system currently faces the following challenges:
SM A LL Q U A N T U M O F B E N E F I T S A N D LO W R E P LA CE M E N T R A T E
The quantum of the average pension for retirement age was only 70.6% of the
subsistence minimum for pensioners in 2010. Over 92% of the total retirement-age
pensioners received pension amounts lower than the subsistence minimum for
pensioners. The replacement rate or, in other words, the ratio between the average
retirement-age pension and average salary recorded in the economy, is only 28.2%,
while the European Code of Social Security establishes its recommended value at 40%.
Moreover, a modeling of the local pension system over long term shows that, under
current conditions of the system, the replacement rate will decline further to 23% in
2020, down to a low level of 14% around late 2040. Under these circumstances, the
pressure on state to increase pensions grows dramatically, which will lead to a
destabilization of the pension system. A reduction in the replacement rate is caused by
two factors: (i) pension indexation method and (ii) non-updating (non-indexation) of
income insured in the past to determine the initial pension.
53
The pension indexation coefficient is the average of annual growth of the consumer
price index and annual growth of the average wage for the previous year. CPI growth
usually records lower growth rates than the average wage, which leads to a reduction of
the replacement rate. This method of indexation is in line with international practices,
while the non-indexation of income insured in the past is a practice without precedent.
The amount of pensions in the local pension system is calculated differently for periods
before and after 1999. The pension part for the period of activity until 1999 is calculated
so that nominal wages are updated together with wage growth until the year preceding
the year of retirement. The pension part after 1999 is calculated based on the average
insured income without updates, based on wage/price evolution in this period. Non-
indexation of insured income reduces replacement rates, resulting in major differences
between pensioners. The unbalanced pension formula in itself creates differences
between pensioners whose pension amount was calculated “on old manner” and those
whose amount was calculated “on new manner”.
SM A LL N U M B E R O F C O N T R I B U T O R S A N D R E D U CT I O N O F T H E R A T I O B E T W E E N T H E
N U M B E R O F CO N T R I B U T O R S A N D P E N S I O N E R S
The coverage of the pension system and the number of insured persons is decreasing.
The number of active population fell during 2011-2010 from 1.6167 million to 1.2354
million, and the number of employed persons from 1,499,000 thousand to 1,143,400.
Thus, the number of taxpayers in the public social insurance system has fallen to about
860,000 in 2010. This is mainly due to population emigration. According to statistics,
311,000 people work outside Republic of Moldova. In this context, we could mention
the informal employment phenomenon. According to estimates, in the second quarter
of 2011 the number of informally employed people was 406,900 persons.
On the other hand, the number of pensioners of all categories has remained relatively
stable, falling by about 4.1% compared to 2001, accounting 627,100 persons on January
1, 2011. Thus, the ratio between active population and pensioners of all categories is
2:1, and the ratio between working population and pensioners is 1.8:1. It should be
noted in this context that it is necessary to maintain the ratio between number of
contributors and number of pensioners at around 4:1 - 5:1 for the stable operation of
the pay-as-you-go pension systems.
PO P U LA T I O N A G E I N G
Further development of the public pension system will worsen due to demographic
trends. The ratio of population aged over 60 years to the total population was 14.4% in
2010 compared to 13.6% in 2000. Among the persons 60 years of age and beyond
women prevail, with a share of 16.8% of the total population, the share of men being
11.8%. The ageing process is more pronounced in rural areas, where the share of the
elderly over 60 years is 15.2% of the total population compared to 13.2% in urban
areas. According to international practice, a population is considered "ageing" when the
ratio of elderly exceeds 12%.
54
According to the pessimistic scenarios of demographic projections, the number of
population could shrink by up to one million inhabitants by 2050. Simultaneously with
declining birth rates, working-age population (15-59 years) will decrease steadily
and population ageing will aggravate. Thus, by 2050, the share of working-age
population will decrease, depending on the scenario, by about 11 to 16 percentage
points from current indicators, from 69.2% down to 57.9%.
However, it is not the decrease in the number of population that is the most worrying
development, it’s the developments associated with the continuous decline of the age
structure, largely due to the process of population ageing. Compared to 2001, the share
of young population in 2010 was lower (corresponding to 0-15 years of age), from 24.8%
to 17.8% of the total population, and the share of population over 57/62 years of age
from 14.4% to 15.5% of the total number of population.
The share of people over the current retirement age will increase from 15.2% to 31.5%
in 2050. The increase in the share of elderly population will create an increasing
pressure on social insurance systems.
D I F F E R E N T R E T I R E M E N T A G E
The current pension system sets the retirement age at 57 years for women and 62 years
for men. The minimum insurance period, i.e. the mandatory payment of social insurance
contributions, is at least 15 years for a partial pension or at least 30 years for women
and 30.5 years for men for a full pension. According to current legislation,
the total number of work history required for an old-age pension will be extended to 35
years by 2020.
Compared to other countries in Central and Eastern Europe, the retirement age in
Republic of Moldova is at the lower limit for men and below the minimum limit
for women. On the other hand, life expectancy in Republic of Moldova is also
lower compared to those countries. However, most countries in Central and
Eastern Europe plan to increase the retirement age in the next ten years, specifically by
equalizing the retirement age for women and men. Life expectancy is higher for
women than men in all countries of Central and Eastern Europe, including Moldova.
Because of this reason, as well as fact that the retirement age in the Republic of
Moldova for women is lower than for men, we find significant differences in the national
retirement system between the number of women and of men benefitting from
pensions and between the size of their pensions. Thus, in 2010, the average number of
years worked registered for retirement pay was 32.5 years for women and 37.5 for men,
and the average old-age pension for women was MDL 797.1 and MDL 937.8 for men
because the size of the pension depends directly on the number of years
worked and the level of state social insurance contributions.
LO W LE V E L O F I N S U R E D I N C O M E O F CO N T R I B U T O R S
The size of the pension depends directly on the incomes of active and working
population through paid social insurance contributions. According to the National Social
55
Insurance House, the average monthly insured salary of people employed through
individual contracts was about MDL 2,133 in 2010. Another Moldovan reality is
provision of salaries under the table. Thus, reported wages of insured persons being
small, low level of pensions is a direct consequence of this fact.
At the same time, there are some discrepancies in relation to salaries by gender (in
2010, the average salary of women was 76% of men’s salary). In the end, existing salary
discrepancies contribute to a conservation of the low level of pension savings, which
influences further directly their quantum, which affects the welfare of women and of
men.
F I N A N CI A L N O N -S U S T A I N A B I L I T Y O F T H E P E N S I O N S Y S T E M
The social insurance system has been facing a budget deficit since 2005, which has
increased gradually from MDL 1.74 million to MDL 87.33 million in 2007. After a period
of three years, 2008 the state social insurance budget reports showed a surplus of MDL
47.7 million. However, the situation changed in 2009 and 2010, when the state social
insurance budget recorded again a budget deficit of MDL 25.55 million and MDL
213.3 million respectively. The deficit in previous years was covered from the balance of
funds on National Social Insurance House bank accounts. In 2009, the budget deficit was
covered from means in the reserve fund of the state social insurance budget and
partially from state budget means. Starting in 2010, the budget deficit is covered from
the state budget. Long-term modeling indicates that, if current conditions remain, the
system will register a deficit in the next ten years and a surplus in the long run. The
pension fund surplus in the long run is caused only by the considerable reduction of the
replacement rate.
UN F A I R R E D I S T R I B U T I O N O F F U N D S
Moldovan legislation stipulates privileged pension terms for certain categories of
citizens: judges, prosecutors, civil servants, MPs, members of government, locally
elected officials, and customs employees. The difference between these terms and
general conditions for old-age pensions consists in lower retirement age and lower
required number of years worked. The stated objective of such privileges is for the state
to reward the special merits of these categories. But in the transition process to a
market economy these principles lose their relevance. The average pension for
these categories, in the case of Government members, about 8 times higher than the
average old-age pension set under general terms, but in the case of civil servants - 2.3
times higher.
In order to respect the basic principles of the public social insurance system, currently
first steps are being undertaken to unify the pension system, which seek to ensure that
all contributors to the social insurance system benefit from the right to receive an old-
age pension based on general conditions. The total number of privileged pension
beneficiaries was 7,311 persons in 2010 or approximately 1.1% of the total number of
pension beneficiaries. The pension expenditure for these categories reached MDL
116.49 million or 2% of total expenditure for payment of pensions in 2010.
56
However, out of the total number of beneficiaries of social insurance and state
pensions, only about 152,400 are employed in the national economy. Current legislation
does not provide for a re-calculation of pensions for people who continue to work. So,
although they continue to pay social insurance contributions, this does not influence the
amount of their pension in any way, the means being used to cover other social risks,
such as benefits for temporary loss of working capacity.
LO W A T T R A CT I V E N E S S O F T H E P E N S I O N S Y S T E M
The social insurance system faces a credibility problem of population, mainly due to the
low level of pensions and insufficient information provided to the population on the
retirement system. As a result, people continue to avoid paying contributions based on
their real wages, which further jeopardizes the proper operation of the pension system.
UN D E R D E V E L O P E D O P T I O N A L P R I V A T E P E N S I O N F U N D S A N D N O N -E X I S T E N CE O F
M A N D A T O R Y P R I V A T E P E N S I O N F U N D S
The social insurance system is the only way to protect an individual in case of social
insurance risks, including for age limit. In 1999, Moldova adopted the legislative
framework on non-state pension funds, which represents the 3rd pillar of a multi-pillar
pension system or optional pension systems according to the World Bank’s
classification. However, the private pension system in Republic of Moldova is virtually
non-existent – two private pension funds are registered, but they do not have any
significant activity. The factors behind this stagnation are, on the one hand, lack of
interest shown by the population (low level of incomes that do not allow to allocate a
part of wages to these private funds) and, on the other hand, insufficient incentives for
employers and for individuals contributing to these funds. In addition, the legal
framework required for the operation of mandatory private pension funds, or second
pillar, is non-existent so far.
SO CI A L S E CU R I T Y G U A R A N T E E S F O R M I G R A N T W O R K E R S
Given the increase in labor mobility between countries and the migration of working-
age population, the optimization of social insurance systems has become an important
component of the social policy promoted by the state. The negative effects of migration
are long-term and usually are felt either when migrant workers and their families who
worked a period abroad are returning back or are displaced in other states, in both
cases these persons having no social insurance entitlements. Under these conditions,
migrant workers and their family members are often disadvantaged economically and
socially in comparison with the citizens of that country, being deprived of the right to
social security, including right to pension. Hence, the migration processes have led to
the urgent need to conclude bilateral social insurance agreements with the main host
countries for migrant workers.
STRATEGIC VISION A fair and sustainable pension system, ensuring a decent living after retirement to all
categories of population, men and women alike, is indispensable for social cohesion.
57
The current inadequate level of pensions in Republic of Moldova and its further
downward trend generate an alarming growth of pressure for ad hoc pension increases,
threatening the viability of the pension system and, implicitly, even the economic
development potential in the "without reforms" scenario.. The funding of any pension
increases from outside the pension system reduces the chances of success of other
reforms, including those of other development priorities. Thus, the pension reform will
primarily minimize the risk of these adverse effects.
The reform of the current pension system implies:
A. Modernization of the existing pay-as-you-go pension system (pillar 1) by:
adjusting the pension system to principles of organization and operation of the
public social insurance system and existing international standards;
improving the financial sustainability of the system by increasing and unifying
conditions regarding the contribution period and retirement age, and
accumulating financial means in the reserve fund of the state social insurance
budget;
ensuring a closer link between paid state social insurance contributions and
amount of pension set for insured persons;
undertaking complex measures to develop the labor market, increasing labor
remuneration and improving the demographic situation.
B. Reviewing timeliness for cumulative pension system implementation (pillar 2),
within which social insurance contributions are invested instead of being spent
immediately for payment of benefits to current pensioners. An opportunity
study will be developed by the end of 2015.
At the same time, the introduction of a cumulative pension system implies preparation
measures, including for the modernization of the existing pay-as-you-go pension system
(pillar 1) and development of the financial market.
EXPECTED IMPACT The reform of the pension system will contribute to a reduction in poverty rate.
Although poverty rate evolution is influenced by a multitude of factors, we can say that
a more rapid growth of the pension quantum due to pension system reform will reduce
the absolute poverty rate of pensioners in a higher proportion than under current
conditions of the pension system. Hence, the net impact of the reform estimates that by
2020 the share of pensioners below the absolute poverty line will decrease by 2 p.p.
over the scenario ”without reforms”.
At the same time, a sustainable and attractive pension system will have positive
repercussions on the national economy, reducing the extent of unwanted phenomena,
such as salaries paid under the table, shadow economy, etc.

58
SPECIFIC OBJECTIVES Monitoring indicator 2010 2015 2020 Minimum level of rate of replacement of salaries with pensions, % 25 Increasing the ratio between average retirement pension and subsistence minimum for pensioners, %
70.6 75 85
Reducing the absolute poverty rate of pensioners, % 28.1 26 23 Reducing the ratio between the number of retired pensioners with pensions under the subsistence minimum for pensioners and the total number of retired pensioners, %
92 89 84
Reducing the state social insurance budget deficit, % (compared to an average of 1% during 2006-2010)
0.5 0
Increasing the number of states that have concluded social security agreements with Republic of Moldova
4 8 12
59
JUSTICE: RESPONSIBLE AND INCO RRUPTIBLE Demand for justice is a priority for the country’s economic and social development. An
eloquent indicator that qualifies as alarming the situation in this sector is the increasing
trend in citizens’ lack of trust in justice. According to the Public Opinion Barometer, 2/3
of citizens do not trust the justice system and their number is increasing. This has
serious spillovers for the business environment, affecting implicitly economic
development prospects and country citizens, whose rights must be ultimately
safeguarded by the judiciary. Protection of human rights and fighting against corruption
are global commitments that are in the permanent focus of authorities. Also,
considering that the accomplishment of these commitments depends on a well-
functioning justice system, this Strategy is focused on the reform of the court system.
SITUATION ANALYSIS The perception of population regarding the performance of the judiciary is not a
favorable one. According to the International Survey of Enterprises, carried out by the
International Finance Corporation, only 31.9% of economic agents from Republic of
Moldova consider that courts are reasonable, impartial and incorrupt, as compared to
38.9% of economic agents from Eastern Europe.14
The same source specifies that about
70% of economic agents from Republic of Moldova do not believe that courts would
protect their property rights, and this affects negatively their intentions to invest.
In the same vein, the satisfaction level with court services related to the organization of
court trials reveals the following assessment: the courts got 3.91 points, courts of
appeal – 3.76, and the Supreme Court of Justice – 3.62 out of maximum 5 points15
.
Normally, the superior bodies should be more efficient in order to serve as an example
for the lower-level bodies, situation which is not registered at the moment in the
Republic of Moldova.
From a statistical point of view, things do not look better. The productivity and
efficiency of courts is falling: the number of remaining cases by the end of the year is
increasing by 20% for criminal cases, by 50% for civil cases and by 150% for economic
cases, while the total number of cases entering the system is decreasing (2009 versus
2007). In the same context, the number of judges increased from 380 in 2007 to 420 in
2009, but their monthly load decreased, accordingly, from 66.6 down to 58.6. The case
settlement rate - an international efficiency indicator used to measure courts’
performance, is also decreasing. The majority of unsolved cases is in economic courts (it
actually doubled from 2,000 in 2007 to 5,200 in 2009), thus implying greater attention
to changing the economic jurisdiction under the planned reform.
This situation has following causes:
14
http://www.enterprisesurveys.org/documents/EnterpriseSurveys/Reports/Moldova-2009.pdf 15 Decision of the Superior Council of Magistrates regarding the results of the survey on satisfaction level of the court services’ beneficiaries, no. 271/12 dated September 17, 2009. Survey funded by USAID.
60
PR O CE D U R E S A N D O P E R A T I O N A L E F F I C I E N CY
The delays and postponements of court procedures became a rule in courts, registering
an upward trend during 2006-2008. Thus, 61% of monitored court trials were postponed
by courts in Chisinau and 85% in the Southern-Eastern region of Republic of Moldova16
.
The postponed court trials imply damage for the economic agents and country
economy, expressed in lost gross national revenue due to absence from work of about
MDL 390 million annually (Table 9).
Only 60% of courts use audio-video recording technologies for court trials (although all
courts have been equipped with such devices) and about 25% publish court decisions on
their web pages. Hence, a study conducted, in June 2011, by the USAID Good
Governance Program found that 30 courts (of the total number of 52 courts) do not post
entirely court decisions and lists of court trials – which is important information for the
public.
Different court decisions continue to be issued for similar cases, thus disturbing business
environment security and generating unequal opportunities. Economic agents consider
the lack of judicial security and predictability, as well as that of public policies, a critical
constraint to development.
The issue of judicial unpredictability will get exacerbated along the advancement of the
EU legislation absorption process – commitment assumed in the context of European
integration, as shown by the experiences of other countries that have recently joined
the EU. The principles of market economy inspired by the EU law, substance of the free
exchange and internal market of the EU are not familiar to the professionals in the area,
thus affecting de facto implementation of the EU legislation.
The impact of judicial remedies’ duration and lack of uniformity for national
jurisprudence are reflected in the number of cases with systematic property rights’
breach solved by the European Court of Human Rights. Hence, during 1995-2010, 40%
of the total number of breaches found by the European Court of Human Rights refers to
property rights in Republic of Moldova.
IN T E G R I T Y O F T H E J U D I C I A R Y S Y S T E M
Disciplinary procedures in the judicial system are rather formal and with no visible
impact on its performance. During 2001-2008, a number of 44 disciplinary sanctions
were applied to judges. In 2010, disciplinary sanctions were applied to 10 judges.
Although a certain functioning of the disciplinary system may be attested, the number
of sanctions is immeasurable in relation to breaches reported by the national and
16 Report on OSCE Program on monitoring judiciary processes in the Republic of Moldova, 2009.

61
international reports in the area.17
A similar situation is perceived in relation to ethics
and discipline among all legal professions.
Corruption erodes the rule of law and affects the state’s reputation and trust. Over 20
thousand persons confessed that they bribed judges in 2009; every judge has requested
or accepted on average about 4 bribes per month18
. Approximately 40% of population
states that it is very likely for a person to solve a problem by bribing the judge.
A comparative analysis with other countries in the region, based on the relative number
of people that were asked for a bribe, ranked in 2008 the Republic of Moldova among
the countries with populations most vulnerable to corruption19
(Figure 1). The
corruptible nature of the judicial system is implicitly confirmed by the Justice
Independency Indicator determined by Freedom House at 4.5 (1 being the highest
independency level, 7- being the lowest one). In the same context, almost 30% of
practitioners attest to know situations when decisions were taken based on attempts of
direct and deliberate influence20
. At the same time, it is also alarming that 69% of judges
consider that their legal status does not ensure their independence, and 47% of judges
perceive performance indicators to be useful in ensuring the system’s independence.
One in five persons in Republic of Moldova admits that he/she was asked to offer a
bribe. 23% said they offered bribes in social activity areas: health, police, customs,
education, local public administration, and private sector. The role of justice in fighting
corruption is illustrated by the share of cases solved in court out of the total number of
persons under accusation21
(Figure 19).
Corruption affects severely the vulnerable segments. Being harshly influenced by the
economic crisis, people with small incomes are most dependent on public services and
least able to pay additional costs related to bribes and frauds. Affecting property rights,
corruption leaves investors without any compensation for assumed risks and increases
the uncertainty regarding potential dividends. Thus, their motivation to invest reduces,
being reflected in the country’s economic development.
PR O T E C T I O N O F H U M A N R I G H T S I N CR I M I N A L CO U R T A N D P R O T E CT I O N O F
V U LN E R A B LE P O P U LA T I O N
Observance of human rights, especially in criminal justice, remains to be an aspiration.
Detention conditions (re-socialization system, subculture, lack of jobs when getting out
of penitentiaries) generates an increasing number of relapses (60% in 2010), exposing
communities to insecurity and tax payers to triple costs, in cases when the claims
regarding detention conditions go to the European Court of Human Rights. At the same
17 E.g., reports of the OSCE Mission in the Republic of Moldova. Trial Monitoring Reports, 2006, 2007 and Final Report 2009. 18 Analytical Report on Victimization. Soros Foundation Moldova, 2010 19 “Human Development Report”, PNUD, 2010 20 “Judiciary Integrity and Resistance to Corruption”, Transparency International, 2010. 21 Evaluation Report, GRECO, 2010
62
time, according to experts’ opinion22
, the justice system services for vulnerable persons
(children, elderly, minorities, victims) needs systemic interventions.
The manner of collecting specific data on vulnerable groups and informing the decision
making process, promptness of reaction of authorities, including the judiciary,
specialization of interventions for vulnerable persons through specific training,
restorative role of justice – all these remain to be just recommendations. The situation
attested in the justice sector explains the extremely low reporting rate from women-
victims and, as a consequence, the small number of investigated cases, when one in
three women is subjected to domestic violence, and Moldovan women are more
susceptible than men to become victims of offences.
STRATEGIC VISION Justice to serve the citizen – this vision is shared by all actors in the area and represents
the qualitative change needed for the reform approach in the justice sector. As a result
of reforms to be implemented in the sector, justice seekers will benefit from impartial,
qualitative, accountable and timely justice, with zero tolerance to corruption, for the
country’s sustainable development, and the justice system will offer efficient remedies
for an inclusive economic development, for social justice and human security.
In the context of these priorities, the vision of authorities for 2020 is in line with the
specific objectives reflected in the Justice Sector Reform Strategy for 2011-2016:
strengthening the independence, accountability, impartiality, efficiency, and
transparency of the court system;
increasing the efficiency of the pre-judicial investigation process to the effect of
guaranteeing the observance of human rights, ensuring the security of each
person, and reducing the level of crime;
improving the institutional framework and processes that ensure an effective
access to justice: effective legal counseling, examination of cases and execution
of judicial decisions within a reasonable timeframe, modernization of the
statute of some legal professions related to the justice system;
promoting and implementing the principle of zero tolerance for corruption
phenomena in justice;
implementing certain measures, whereby the justice sector would contribute
to creating a favorable environment for sustainable economic development;
ensuring the effective observance of human rights in legal practices and
policies;
coordinating, establishing and delimitating responsibilities and tasks of main
actors in the justice sector, as well as ensuring cross-sectoral dialogue.
The plenary implementation of justice sector reform is crucial with a view to
implementing the vision of authorities. The broader horizon provided for by present
22 Victimization Study, Soros Foundation, 2010

63
Strategy assumes that the effects of this reform’s implementation will be felt by the
entire society.
EXPECTED IMPACT It is difficult to quantify the manner in which more efficient justice may influence
economic development, because it is composed of multiple individual benefits, which
complement each other and contribute to a generalized perception about justice, which
may favor or may disfavor investment. When referring only to a reduction in corruption,
very modest estimates for 2011 assess the volume of bribes paid from the enterprises’
revenues to be about MDL 390 million. The lower level of corruption would result in
investing a part of this money for productive purposes, thus generating an annual GDP
growth by at least 0.1%. Aside from the purely numerical effect on domestic investment,
the country’s attractiveness will increase for foreign investment and associated new
technologies, thus inducing important collateral effects.
The reduced number of postponed court trials will have similar effects on the costs
incurred by citizens and by business environment, as well as indirectly on the
investment climate and country’s attractiveness.
SPECIFIC OBJECTIVES
Monitoring indicators 2010 2015 2020 Share of citizens that show lack of trust in justice, % 67 60 40 Improved justice independence index Freedom House 4.5 4 3 Share of judicial cases examined with delays, % 60 30 10 Share of courts that observe norms and decisional transparency (publish court decisions and have audio-video records of court sessions), %
60 100 100
Share of litigations solved via alternative ways (extra-judicial) 0 10 25 Number of corruption victims, % 20 15 10 Share of economic agents which believe that courts are reasonable, impartial and non-corrupt, %
31.9 40 60
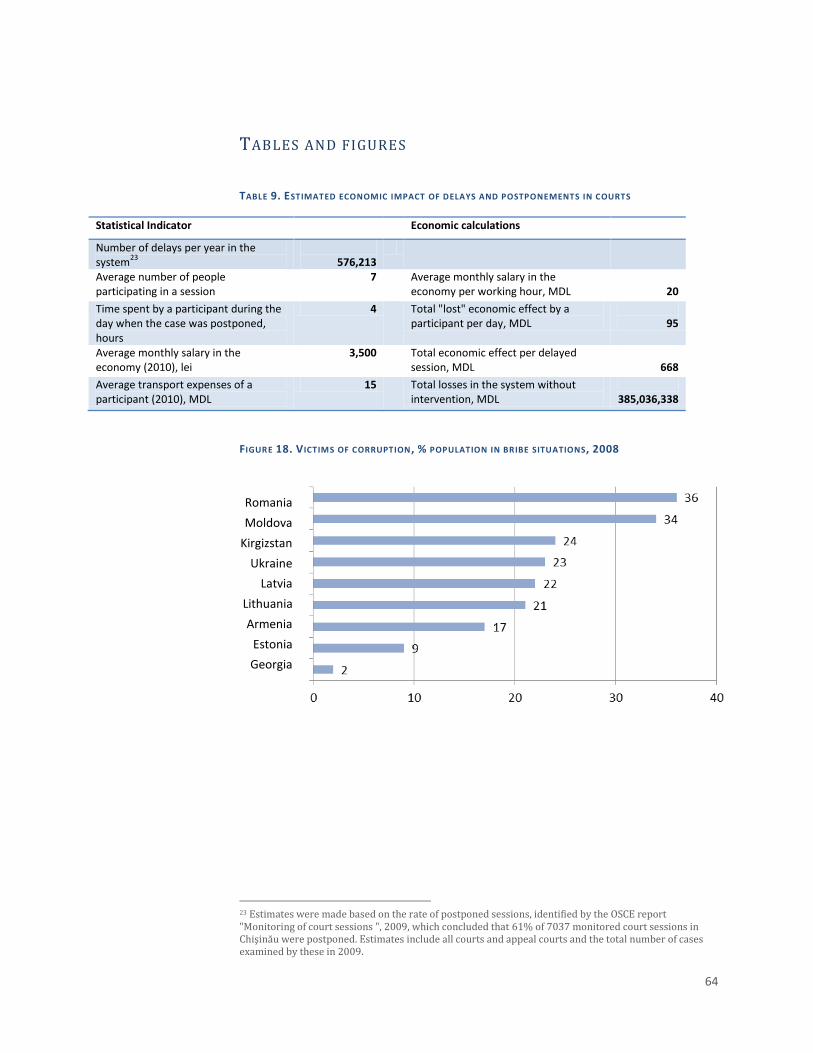
64
TABLES AND FIGURES
TABLE 9. ESTIMATED ECONOMIC IMPACT OF DELAYS AND POSTPONEMENTS IN COURTS
Statistical Indicator Economic calculations
Number of delays per year in the system
23
576,213
Average number of people participating in a session
7 Average monthly salary in the economy per working hour, MDL
20
Time spent by a participant during the day when the case was postponed, hours
4 Total "lost" economic effect by a participant per day, MDL
95
Average monthly salary in the economy (2010), lei
3,500 Total economic effect per delayed session, MDL
668
Average transport expenses of a participant (2010), MDL
15 Total losses in the system without intervention, MDL
385,036,338
FIGURE 18. V ICTIMS OF CORRUPTION, % POPULATION IN BRIBE SITUATIONS, 2008
23 Estimates were made based on the rate of postponed sessions, identified by the OSCE report "Monitoring of court sessions ", 2009, which concluded that 61% of 7037 monitored court sessions in Chişinău were postponed. Estimates include all courts and appeal courts and the total number of cases examined by these in 2009.
Romania
Moldova
Kirgizstan
Ukraine
Latvia
Lithuania
Armenia
Estonia
Georgia
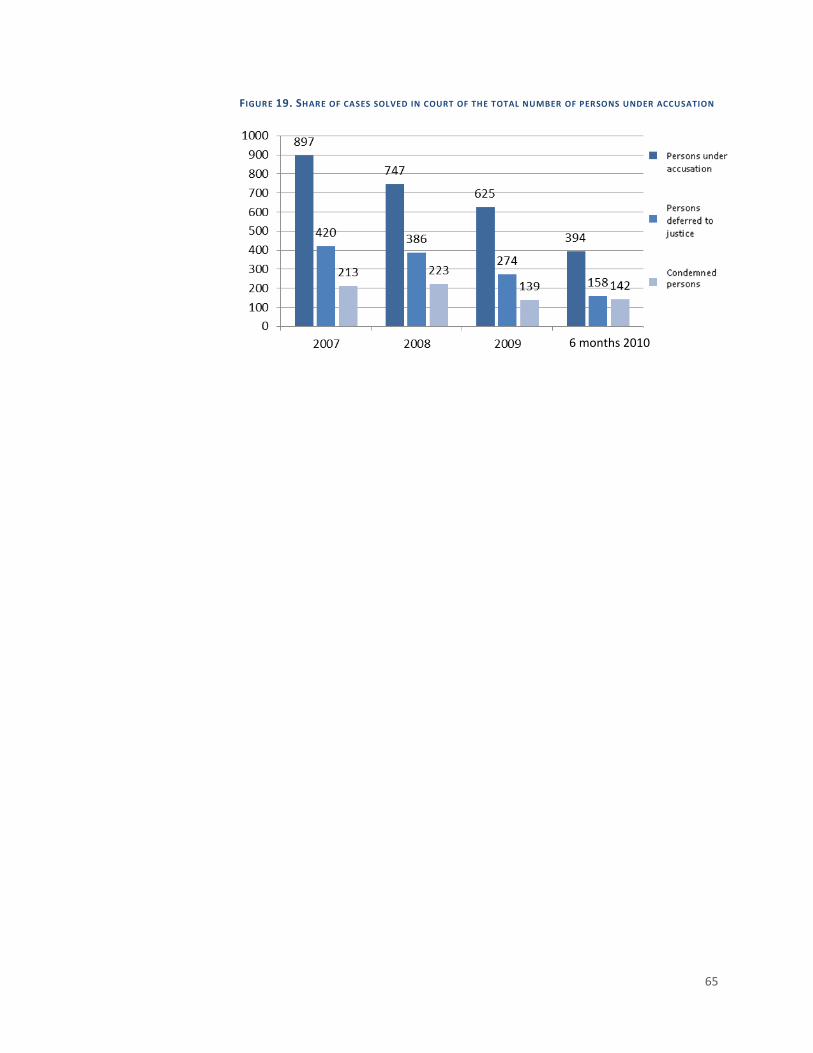
65
FIGURE 19. SHARE OF CASES SOLVED IN COURT OF THE TOTAL NUMBER OF PERSONS UNDER ACCUSATION
6 months 2010

66
COORDINATION OF IMPLEMENTATION , MONITORING
AND EVALUATION This strategy will lay the foundation for Republic of Moldova’s long-term development
and will ensure a platform for the management and coordination of reforms in seven
priority areas that, alongside the Government’s strategic documents and donor
initiatives, cover the activity of all ministries and autonomous administrative authorities.
Strategy coordination, monitoring and evaluation, as well as stakeholder functions are
described below.
INTEGRATED CYCLE OF PLANNING , MONITORING AND
EVALUATION Republic of Moldova passes through a dynamic development process, during which
development priorities are defined, with necessary actions planned for their
implementation. Further, after accomplishment of established actions, the evaluation
process of established tasks will be undertaken. Although the document envisages a
period of nine years, starting in 2012 until 2020, the planning, allocation of resources,
monitoring and reporting on accomplished actions will be performed annually. The
scheme below describes this cycle:
Planning and Prioritization Implementation, Monitoring & Reporting
Consolidated Action Plan
(Implementation)
Technical Assistance
(Implementation)
Annual Budget Programs
(Implementation)
Consolidated Action
Plan
Actions and sub-actions
MTBF
Financing
Quarterly and annual reporting on accomplished actions
Annual reporting based on indicators
Pri
ori
tie
s e
nvi
sage
d b
y cu
rre
nt
stra
tegy
Inte
rme
dia
te e
valu
atio
n r
ep
ort

67
Thus, according to the scheme above, the management system of the National
Development Strategy „Moldova 2020” will have the following main features:
The Strategy will be implemented through an update of the existing Consolidated
Action Plan, which includes in itself actions from the Government’s Activity Program
and other national and strategic planning documents. Consolidated Action Plan is a
single framework for planning, monitoring and reporting for all central public
administration institutions. Similarly, reporting on implementation of actions from
the National Development Strategy „Moldova 2020” will be conducted based on the
Consolidated Action Plan. To this effect, the State Chancellery has already
implemented an online monitoring system of the Consolidated Action Plan;
The annual planning and reporting cycle will not only allow a permanent monitoring
of Strategy implementation progress, but also the correction, when the case, of
planned measures and activities. This is important because the Strategy is a long-
term one, when changes can occur in the domestic and foreign environment, thus
requiring some adjustments, but also in the context of implementing current and
future European integration commitments, which have a direct link to Strategy
priorities;
The implementation of many actions in the strategy will be impossible without
amending the structure and level of funding. The Medium Term Budgetary
Framework (MTBF) will be the framework through which Strategy actions requiring
financing will be prioritized and financed. The general establishment of priorities in
the Medium Term Budgetary Framework, development of sectoral expenditure
plans and program-based budget planning – all these will have to take into account
the priorities envisaged by the National Development Strategy „Moldova 2020”.
These documents will be progress assessment tools, since the main Strategy
indicators will be reflected in program-based budgets and in sectoral expenditure
plans. It will be the responsibility of the Ministry of Finance in collaboration with
the State Chancellery to ensure this synchronization;
In order to know the Strategy implementation progress and to determine the
necessity to adjust some established actions, the State Chancellery will conduct a
mid-term evaluation of Strategy implementation. Depending on circumstances and
on progress achieved, such an evaluation could be holistic, to include for example
all seven priorities, or thematic – cover certain priorities or aspects. Such an
approach is in line with the monitoring and evaluation mechanism of the „Europe
2020” Strategy.
OPERATIONALIZATION PROCESS The ministerial subdivisions for analysis, monitoring and evaluation of public policies will
have an important role in the Strategy’s operationalization, ensuring that actions for its
implementation are integrated in the annual strategic planning cycle. The results of
activities were taken into account during the development, at the beginning of 2012, of
the Medium Term Budgetary Framework for 2013-2015. This process will be repeated
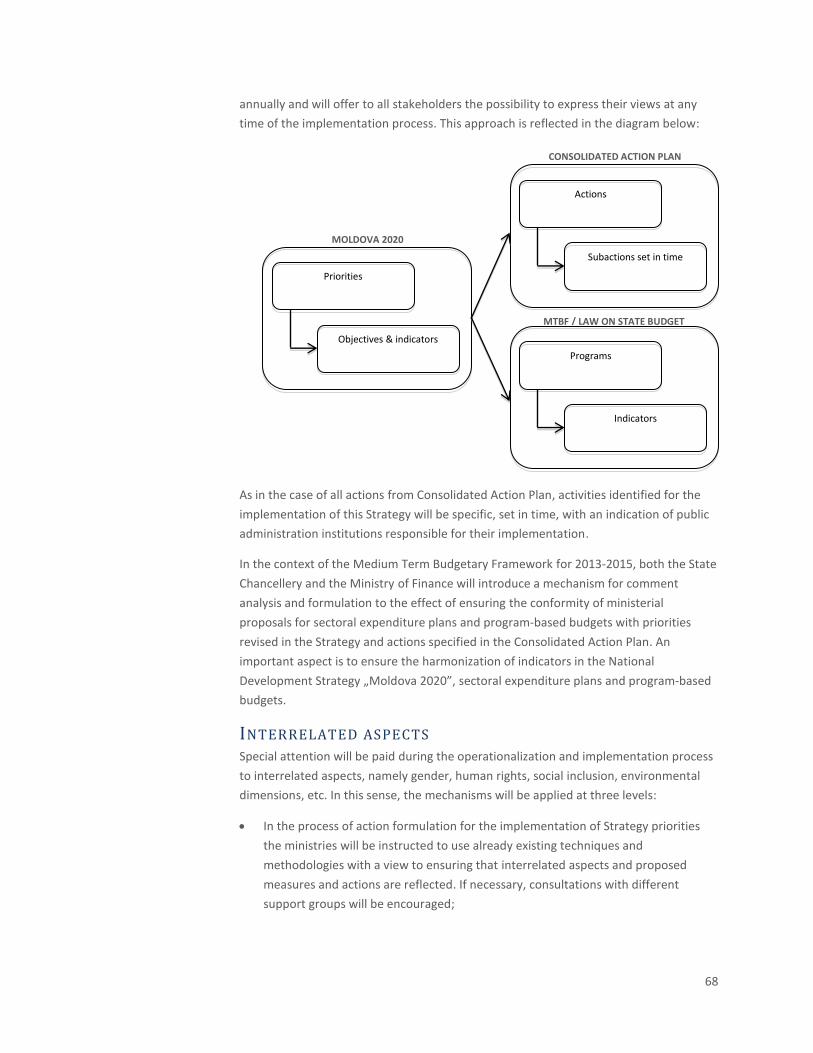
68
annually and will offer to all stakeholders the possibility to express their views at any
time of the implementation process. This approach is reflected in the diagram below:
As in the case of all actions from Consolidated Action Plan, activities identified for the
implementation of this Strategy will be specific, set in time, with an indication of public
administration institutions responsible for their implementation.
In the context of the Medium Term Budgetary Framework for 2013-2015, both the State
Chancellery and the Ministry of Finance will introduce a mechanism for comment
analysis and formulation to the effect of ensuring the conformity of ministerial
proposals for sectoral expenditure plans and program-based budgets with priorities
revised in the Strategy and actions specified in the Consolidated Action Plan. An
important aspect is to ensure the harmonization of indicators in the National
Development Strategy „Moldova 2020”, sectoral expenditure plans and program-based
budgets.
INTERRELATED ASPECTS Special attention will be paid during the operationalization and implementation process
to interrelated aspects, namely gender, human rights, social inclusion, environmental
dimensions, etc. In this sense, the mechanisms will be applied at three levels:
In the process of action formulation for the implementation of Strategy priorities
the ministries will be instructed to use already existing techniques and
methodologies with a view to ensuring that interrelated aspects and proposed
measures and actions are reflected. If necessary, consultations with different
support groups will be encouraged;
Priorities
Objectives & indicators
Actions
Subactions set in time
Programs
Indicators
MOLDOVA 2020
CONSOLIDATED ACTION PLAN
MTBF / LAW ON STATE BUDGET
69
The State Chancellery will facilitate the active use of the methodology for ex-ante
evaluation of public policy impact in the formulation of actions for Strategy
implementation. This methodology includes already the most relevant interrelated
aspects. At the same time, public policy proposals developed with ex-ante
methodology are useful instruments for the dialogue with the civil society;
Actions included for Strategy implementation will be directed not only at the
primary removal of the barriers that suppress investment activity, but also to
ensuring that these measures do not adversely affect many areas of public policy –
health care, environmental protection, employment, social protection etc., but, on
the contrary, to help maximize performance in these areas;
Upon submission of annual reports on implementation and in the intermediate
evaluation process in particular, the State Chancellery will ensure the integration of
interrelated aspects in reports.
IMPLEMENTATION REPORTS Consultations regarding implementation at Government, at Parliament, at donor
community, and at civil society levels will cross the entire Strategy implementation
process as a red line. Monitoring and evaluation reports developed in the process will
not only highlight the successful outcomes but will also identify challenges and
obstacles, suggesting corrective actions.
Hence, the reporting framework will not be static. The framework of indicators and
measurement techniques will evolve depending on how the analysis of each of those
seven priorities will evolve. These modifications will be considered regularly and will be
integrated in the general monitoring and reporting framework.
Strategy implementation will be accompanied by the development of reports specified
below:
Quarterly progress reports – based on an online Consolidated Action Plan
monitoring system managed by the State Chancellery. The ministries will submit
quarterly information regarding progress in implementation of Consolidated Action
Plan actions. Performance criteria for action accomplishment will be used to
observe progress, such as: initiated, under implementation, completed, completed
with delays, etc. Comparisons between ministries and priorities will also be
possible. If necessary, the State Chancellery will develop narrative reports with
presentations of main accomplishments and obstacles;
Annual implementation report – results of permanent (quarterly) monitoring will
be presented in the annual report on Strategy implementation. Compared to
quarterly reports that will reflect statistical data, the annual report will have an
analytic nature. It will serve as a base in planning the next Consolidated Action Plan
cycle and modeling the next Medium Term Budgetary Framework cycle. The reports
will also include comments regarding indicators of each of the seven priorities
envisaged in the Strategy;
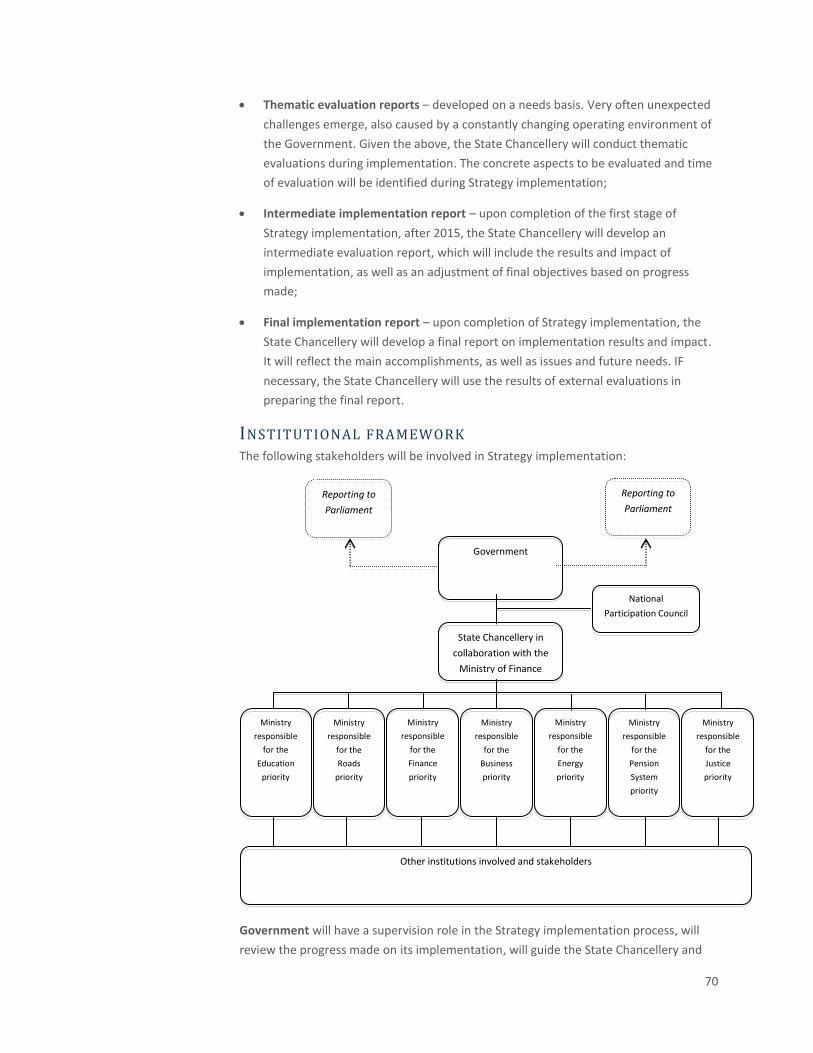
70
Thematic evaluation reports – developed on a needs basis. Very often unexpected
challenges emerge, also caused by a constantly changing operating environment of
the Government. Given the above, the State Chancellery will conduct thematic
evaluations during implementation. The concrete aspects to be evaluated and time
of evaluation will be identified during Strategy implementation;
Intermediate implementation report – upon completion of the first stage of
Strategy implementation, after 2015, the State Chancellery will develop an
intermediate evaluation report, which will include the results and impact of
implementation, as well as an adjustment of final objectives based on progress
made;
Final implementation report – upon completion of Strategy implementation, the
State Chancellery will develop a final report on implementation results and impact.
It will reflect the main accomplishments, as well as issues and future needs. IF
necessary, the State Chancellery will use the results of external evaluations in
preparing the final report.
INSTITUTIONAL FRAMEWORK The following stakeholders will be involved in Strategy implementation:
Government will have a supervision role in the Strategy implementation process, will
review the progress made on its implementation, will guide the State Chancellery and
Government
State Chancellery in
collaboration with the
Ministry of Finance
Ministry
responsible
for the
Business
priority
Ministry
responsible
for the
Energy
priority
Ministry
responsible
for the
Pension
System
priority
Ministry
responsible
for the
Justice
priority
Ministry
responsible
for the
Finance
priority
Ministry
responsible
for the
Roads
priority
Ministry
responsible
for the
Education
priority
Other institutions involved and stakeholders
Reporting to
Parliament
Reporting to
Parliament
National
Participation Council
71
line ministries, and will approve reports before submitting them to the Parliament and
stakeholders. The Government will ensure a maximum reflection of Strategy priorities in
the future financing framework.
State Chancellery is the main institution responsible for Strategy coordination,
monitoring and evaluation. It will ensure the translation of priorities envisaged in the
Strategy in the Consolidated Action Plan, regular submission by all line ministries and
other institutions of information for the online monitoring system, and timely
submission of progress reports to Parliament, Government, Strategic Planning
Committee and National Participation Council, as well as to external stakeholders.
Ministries responsible for priorities will ensure coordination and reporting in their
areas of competency. Ministries will ensure the coordination of actions for
accomplishment of priorities envisaged in the Consolidated Action Plan and their
comprehensive nature, as well as presentation of financing needs in sectoral
expenditure plans and in annual budgets of public authorities. Ministries will ensure that
information regarding implementation progress and needs for assistance is presented to
donor sector coordination groups.
Parliament will review the Strategy implementation evaluation reports. The purpose of
this reporting is to inform the legislative power of the progress made and existing issues.
A permanent interaction between Government and Parliament is essential, particularly
in the budget process.
National Participation Council is an important platform in Strategy implementation,
formed out of civil society representatives. It will also be consulted at the
implementation stage through a review of monitoring and evaluation reports and
through formulation of recommendations. Special importance will be attributed to the
opinions and contributions of organizations working in interrelated areas, such as
gender equality, human rights, environment protection and other.