Embed Size (px)
Citation preview
© 2013 International Monetary Fund
IMF Country Report No. 13/325
SINGAPORE FINANCIAL SYSTEM STABILITY ASSESSMENT
This Financial System Stability Assessment on Singapore was prepared by a staff team of the International Monetary Fund as background documentation for the periodic consultation with the member country. It is based on the information available at the time it was completed on October 24, 2013. The views expressed in this document are those of the staff team and do not necessarily reflect the views of the government of Singapore or the Executive Board of the IMF.
The publication policy for staff reports and other documents allows for the deletion of market-sensitive information.
Copies of this report are available to the public from
International Monetary Fund Publication Services
PO Box 92780 Washington, D.C. 20090 Telephone: (202) 623-7430 Fax: (202) 623-7201
E-mail: [email protected] Web: http://www.imf.org
Price: $18.00 per printed copy
International Monetary Fund Washington, D.C.
November 2013

SINGAPORE FINANCIAL SYSTEM STABILITY ASSESSMENT
Approved By Christopher Towe and Anoop Singh Prepared By Monetary and Capital Markets Department
This report is based on the work of the Financial Sector Assessment Program (FSAP) mission that visited Singapore in May 15–22 and July 25–August 7, 2013. The Article IV consultation mission took place June 26–July 8, 2013.
The Financial Sector Assessment Program (FSAP) team was led by Karl Habermeier
and comprised Liliana Schumacher (deputy mission chief), Jorge Chan-Lau, Ivan Guerra, Srobona Mitra, Antonio Pancorbo, Mustafa Saiyid, Tahsin Saadi Sedik, Nobuyasu Sugimoto, Constant Verkoren, and Froukelien Wendt (all MCM), Elif Arbatli and Ravi Balakrishnan (both APD), Dinah Knight (LEG), Gynedi Srinivas (World Bank), and Richard Britton, Jonathan Fiechter, Martin Kinsky, and Donald McIsaac (all external experts).
The mission met MAS Managing Director Ravi Menon, and other senior officials and staff of MAS, the Ministry of Finance, the Ministry of National Development, the Housing and Development Board, the Urban Redevelopment Authority, Singapore Exchange Limited (SGX), banks, other financial institutions, and professional bodies.
FSAPs assess the stability of the financial system as a whole and not that of individual institutions. They are intended to help countries identify key sources of systemic risk in the financial sector and implement policies to enhance its resilience to shocks and contagion. Certain categories of risk affecting financial institutions, such as operational or legal risks, or risks related to fraud, are not covered in FSAPs.
Singapore is deemed by the Fund to have a systemically important financial sector according to SM/10/235 (9/16/2010), and the stability assessment under this FSAP is part of bilateral surveillance under Article IV of the Fund’s Articles of Agreement.
This report was prepared by Karl Habermeier and members of the FSAP mission.
October 24, 2013

SINGAPORE
2 INTERNATIONAL MONETARY FUND
CONTENTS
GLOSSARY ________________________________________________________________________________________ 4
EXECUTIVE SUMMARY ___________________________________________________________________________ 6
FINANCIAL SYSTEM STRUCTURE AND RISKS __________________________________________________ 9
RESILIENCE TO RISKS ___________________________________________________________________________ 12
A. Banks—General ________________________________________________________________________________ 12
B. Banks—Interconnectedness ___________________________________________________________________ 13
C. Insurance ______________________________________________________________________________________ 15
D. Capital Market Intermediaries and Transactions ______________________________________________ 16
E. Financial Market Infrastructures _______________________________________________________________ 18
FINANCIAL OVERSIGHT ________________________________________________________________________ 19
A. Systemic Liquidity Risks and Management ____________________________________________________ 19
B. Macroprudential Oversight ____________________________________________________________________ 20
C. Microprudential Oversight _____________________________________________________________________ 23
CRISIS MANAGEMENT AND RESOLUTION ____________________________________________________ 25
A. Institutional Arrangements ____________________________________________________________________ 25
B. Toolkit _________________________________________________________________________________________ 26
C. Cross-Border Cooperation _____________________________________________________________________ 27 BOXES 1. Stress Test Scenarios for Banks ________________________________________________________________ 28 2. Supervision and Resolution of Foreign Branches ______________________________________________ 29 3. Stress Tests of the Insurance Sector ___________________________________________________________ 30 FIGURES 1. Systemically Important FMIs ___________________________________________________________________ 53 2. Financial Sector Structure ______________________________________________________________________ 54 3. Interbank Assets and Liabilities ________________________________________________________________ 55 4. Local Banks. Selected Financial Soundness Indicators _________________________________________ 56 5. Network Analysis. Effects of Credit and Funding Shock _______________________________________ 57 6. Insurance Companies. Selected Financial Soundness Indicators _______________________________ 58 7. Housing Market Structure and Developments _________________________________________________ 59
SINGAPORE
INTERNATIONAL MONETARY FUND 3
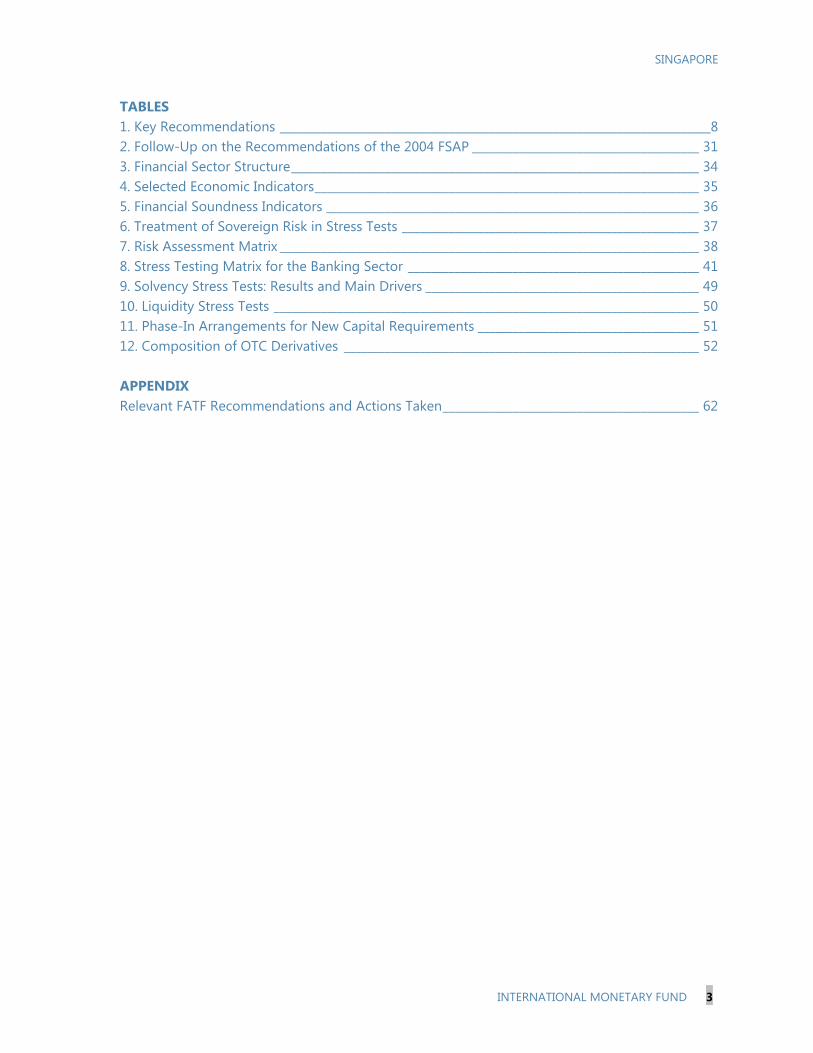
TABLES 1. Key Recommendations __________________________________________________________________________8 2. Follow-Up on the Recommendations of the 2004 FSAP _______________________________________ 31 3. Financial Sector Structure ______________________________________________________________________ 34 4. Selected Economic Indicators __________________________________________________________________ 35 5. Financial Soundness Indicators ________________________________________________________________ 36 6. Treatment of Sovereign Risk in Stress Tests ___________________________________________________ 37 7. Risk Assessment Matrix ________________________________________________________________________ 38 8. Stress Testing Matrix for the Banking Sector __________________________________________________ 41 9. Solvency Stress Tests: Results and Main Drivers _______________________________________________ 49 10. Liquidity Stress Tests _________________________________________________________________________ 50 11. Phase-In Arrangements for New Capital Requirements ______________________________________ 51 12. Composition of OTC Derivatives _____________________________________________________________ 52 APPENDIX Relevant FATF Recommendations and Actions Taken ____________________________________________ 62

SINGAPORE
4 INTERNATIONAL MONETARY FUND
Glossary AMR AUM CAR CBCA CCP CDP CME CRA CSD DBU DI DSR DTI ELA ETFs EU FAA FMIs FSAP FX G-SIFIs HDB IOSCO LTD LTV MAS MA Act MEPS+ MLA MoF NAV NPLs OTC RBC REITs RTGS SDIC SF SGS SIAS
Asset Maintenance Ratio Assets Under Management Capital Adequacy Ratio Cross-Border Collateral Arrangements Central Counterparty Central Depository (Pte) Limited Chicago Mercantile Exchange Casino Regulatory Authority Central Securities Depository Domestic Banking Unit Deposit Insurance Debt Servicing Ratio Debt to Income Ratio Emergency Liquidity Assistance Exchange-Traded Funds European Union Financial Advisers Act Financial Market Infrastructure Financial Sector Assessment Program Foreign Exchange Global Systemically Important Financial Institutions Housing Development Board International Organization of Securities Commission Loan-to-deposit ratio Loan-to-value ratio Monetary Authority of Singapore Monetary Authority of Singapore Act (as of April 18, 2013) MAS Electronic Payments System Minimum Liquid Assets Ministry of Finance Net Asset Value Nonperforming Loans Over-the-Counter Risk-Based Capital Real Estate Investment Trusts Real Time Gross Settlement System Singapore Deposit Insurance Corporation Standing Facility Singapore Government Securities Securities Investors Association of Singapore
SINGAPORE
INTERNATIONAL MONETARY FUND 5
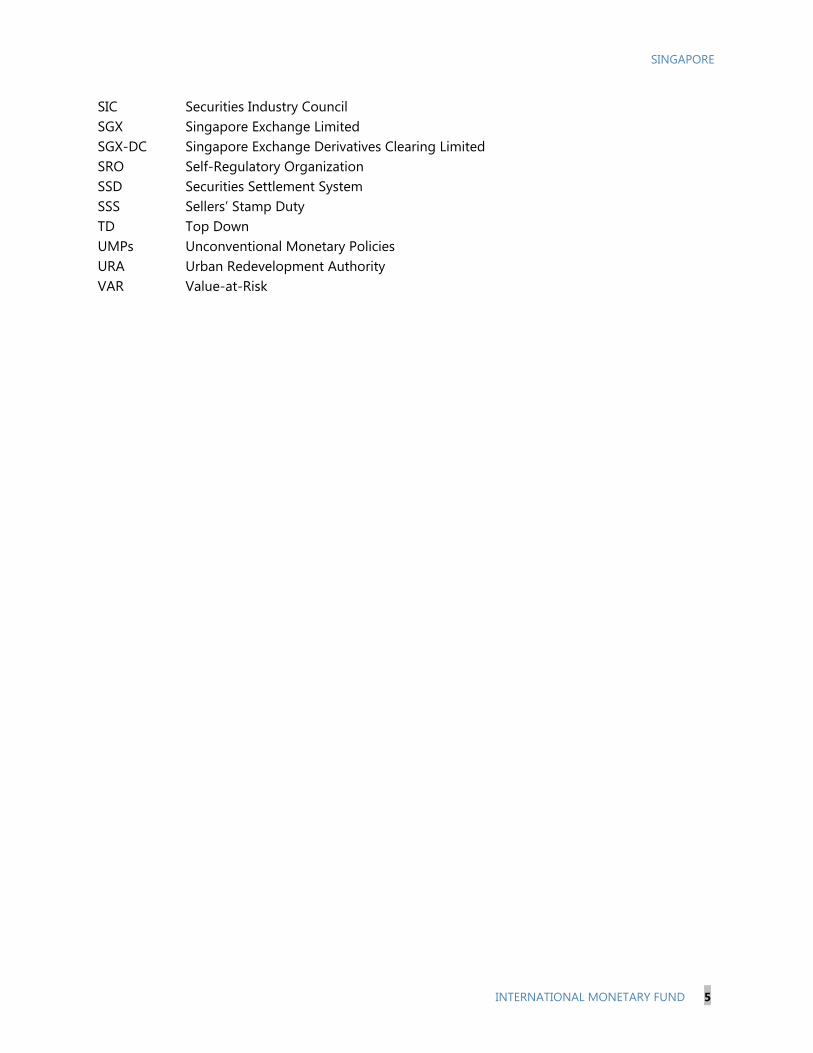
SIC SGX SGX-DC SRO SSD SSS TD UMPs URA VAR
Securities Industry Council Singapore Exchange Limited Singapore Exchange Derivatives Clearing Limited Self-Regulatory Organization Securities Settlement System Sellers’ Stamp Duty Top Down Unconventional Monetary Policies Urban Redevelopment Authority Value-at-Risk

SINGAPORE
6 INTERNATIONAL MONETARY FUND
EXECUTIVE SUMMARY The Singapore financial system is highly developed, and well regulated and supervised. Singapore is one of the world’s largest financial centers, built around a core of domestic and international banks, and also offers a wide range of non-bank services. The authorities have given strong emphasis to integrity and stability in finance and to compliance with international standards, and have addressed most recommendations made by the 2004 FSAP. Singapore’s current regulation and supervision are among the best globally. The Monetary Authority of Singapore (MAS) oversees the entire financial system, and has the analytical and operational capabilities to do so effectively. Singapore is exposed to a broad array of domestic and global risks, especially in light of its interconnectedness with other financial centers. The most pressing vulnerability appears to stem from the rapid growth of credit and real estate prices in recent years, but the financial system is also exposed to possible spillovers from a future tightening of U.S. monetary policy, an economic slowdown in China, or a deterioration of economic conditions in Europe. The team’s stress tests suggest that these risks are manageable. This reflects banks’ large capital and other cushions, and the decisive macroprudential actions taken by MAS to address the threat of a bubble in the housing sector. Moreover, MAS has sought to address potential spillovers from other major financial centers by converting large retail branches operating in the domestic market into domestically incorporated subsidiaries, and by pressing in international fora for greater sharing of supervisory information on global systemically important financial institutions (G-SIFIs). Looking forward, the analysis suggests the importance of continuing to monitor closely cross-border interbank liabilities, and also of continuing to adjust macroprudential measures in response to domestic housing market conditions. Bank regulation and supervision is of a high caliber, but there is still room for strengthening in several areas. The macroeconomic surveillance and supervisory functions in MAS are closely coordinated, allowing for an efficient and in-depth analysis of macro-financial linkages, with appropriate follow-up actions. Overall compliance with the supervisory standards assessed by the FSAP mission—banking, insurance, securities, and financial market infrastructures (notably for OTC derivatives)—was also very high compared with other major financial centers. However, there are areas where further attention is needed: Although the stress tests confirm that banks’ funding gaps appear manageable, liquidity
shortages in foreign currency could affect some banks under very adverse conditions, and MAS is encouraged to closely monitor LCR ratios on an individual foreign currency basis.
Steps could be taken to strengthen banks’ capitalization framework, with the implementation of the countercyclical capital buffer in line with the Basel III timelines, using triggers suitable to Singapore’s specific circumstances.

SINGAPORE
INTERNATIONAL MONETARY FUND 7
It would also be appropriate to step up onsite inspections of banks’ credit risk, notably in view of rising household and corporate leverage.
The structure of the MAS board, which includes several government ministers, was considered by assessors to be potentially inconsistent with full supervisory independence, and consideration should be given to addressing this situation.
The insurance sector has been stable, although some risks remain. Potential vulnerabilities stem from guaranteed returns under some policies; relatively high exposure to equities; and exposure to catastrophe risks arising from the rapid growth in the offshore sector. MAS is addressing these risks, including through strengthened risk management requirements and a review of valuation and capital adequacy rules. Capital markets do not appear to pose material threats to financial stability. However, MAS should continue intensive monitoring of the asset management industry, particularly the operations of hedge funds and prime brokers, in order to minimize reputational risks. Greater emphasis should be placed on detailed onsite inspections, particularly for higher risk entities. Arrangements for over-the-counter (OTC) derivatives clearing appear sound. SGX-DC is an efficient central counterparty (CCP) with effective risk management frameworks, and sufficient financial resources to cover even significant defaults. This said, global regulatory reforms of OTC derivatives clearing and reporting expose SGX-DC to legal risks owing to conflicts between domestic and foreign laws. MAS is encouraged to continue its efforts to mitigate those risks in close cooperation with foreign authorities. Care is also needed to ensure that increased competition does not weaken risk management by the industry. Crisis management and resolution arrangements are generally strong, but could be further enhanced. The necessary legal framework is in place, with tools and responsibilities clearly allocated among several public bodies, and robust arrangements for information sharing and coordination. However, the resolution framework needs to be reviewed and strengthened to enhance MAS’ operational independence to efficiently implement bank resolution. Arrangements for cooperation in cross-border resolution are broadly in line with international best practice, although some further enhancements are possible.
SINGAPORE
8 INTERNATIONAL MONETARY FUND
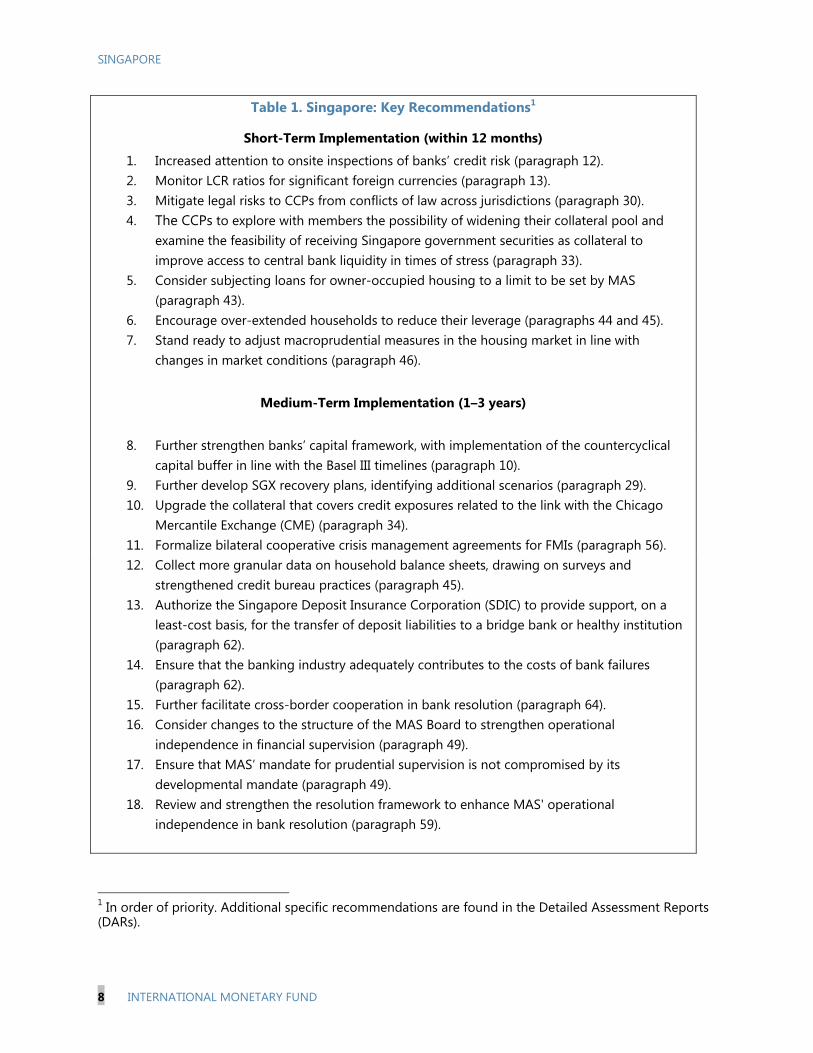
Table 1. Singapore: Key Recommendations1
Short-Term Implementation (within 12 months)
1. Increased attention to onsite inspections of banks’ credit risk (paragraph 12). 2. Monitor LCR ratios for significant foreign currencies (paragraph 13). 3. Mitigate legal risks to CCPs from conflicts of law across jurisdictions (paragraph 30). 4. The CCPs to explore with members the possibility of widening their collateral pool and
examine the feasibility of receiving Singapore government securities as collateral to improve access to central bank liquidity in times of stress (paragraph 33).
5. Consider subjecting loans for owner-occupied housing to a limit to be set by MAS (paragraph 43).
6. Encourage over-extended households to reduce their leverage (paragraphs 44 and 45). 7. Stand ready to adjust macroprudential measures in the housing market in line with
changes in market conditions (paragraph 46).
Medium-Term Implementation (1–3 years)
8. Further strengthen banks’ capital framework, with implementation of the countercyclical
capital buffer in line with the Basel III timelines (paragraph 10). 9. Further develop SGX recovery plans, identifying additional scenarios (paragraph 29). 10. Upgrade the collateral that covers credit exposures related to the link with the Chicago
Mercantile Exchange (CME) (paragraph 34). 11. Formalize bilateral cooperative crisis management agreements for FMIs (paragraph 56). 12. Collect more granular data on household balance sheets, drawing on surveys and
strengthened credit bureau practices (paragraph 45). 13. Authorize the Singapore Deposit Insurance Corporation (SDIC) to provide support, on a
least-cost basis, for the transfer of deposit liabilities to a bridge bank or healthy institution (paragraph 62).
14. Ensure that the banking industry adequately contributes to the costs of bank failures (paragraph 62).
15. Further facilitate cross-border cooperation in bank resolution (paragraph 64). 16. Consider changes to the structure of the MAS Board to strengthen operational
independence in financial supervision (paragraph 49). 17. Ensure that MAS’ mandate for prudential supervision is not compromised by its
developmental mandate (paragraph 49). 18. Review and strengthen the resolution framework to enhance MAS' operational
independence in bank resolution (paragraph 59).
1 In order of priority. Additional specific recommendations are found in the Detailed Assessment Reports (DARs).

SINGAPORE
INTERNATIONAL MONETARY FUND 9
FINANCIAL SYSTEM STRUCTURE AND RISKS 1. Singapore is one of the largest financial centers in the world. Apart from its large and diversified domestic banks, it hosts major international banks attracted by Singapore’s efficient market infrastructure and its well established reputation for the rule of law and effective supervision. As of 2012, Singapore was the third largest foreign exchange (FX) market in the world (offering deep and liquid markets for trading and hedging of G3 currencies, as well as emerging market currencies) and one of the largest trading centers for OTC derivatives in Asia, with interest and FX derivatives dominating activity. Equity and fixed income markets are at an earlier stage of development. Singapore has a well-developed payment, clearing, and settlement infrastructure, with several systemically important financial market infrastructures (FMIs) (Figure 1).
2. Singapore’s financial center has several distinctive features (Figure 2 and Table 3):
Predominance of banks over other types of financial institutions. While it has undergone major structural changes in recent years, Singapore’s financial sector remains dominated by banks. As of June 2013, there were 122 commercial banks operating in Singapore, of which five were local banks, one was a foreign subsidiary, while the rest were foreign branches.
A small number of systemically important domestic banks. The three largest local banks2 have grown to about 30 percent of banking system assets (equivalent to about 180 percent of GDP). They are strong in traditional lending intermediation in Singapore and in the region (through subsidiaries). About 35 percent of banks’ exposures and income originate in the region, outside Singapore.
Foreign bank branches rather than subsidiaries. Foreign banks represent about 65 percent of total banking assets. European and U.S. foreign banks have the largest presence followed by a smaller presence of regional banks.3 While some foreign bank branches have a significant presence in domestic retail and corporate lending (the so-called full and qualifying full banks, QFBs), others limit their activities to the provision of services to their domestic clients, or IT operations in Singapore with a regional focus.4
2 These banks are DBS Bank Limited, United Overseas Bank (UOB) Limited, and Overseas-Chinese Banking) Corp. (OCBC). Each of these banks owns nonbank subsidiaries. The three largest banking groups represent about 300 percent of GDP, with the assets of the largest group being larger than Singapore’s GDP. 3 Among foreign banks, the U.K. and the U.S. together represented about 21 percent of total assets, followed by the Japanese banks (7 percent). 4 There are four types of banks: Full, Qualifying Full Banks (QFBs), Wholesale, and Offshore. Full banks can conduct the whole range of banking business, including retail deposit taking. QFBs have key privileges regarding the number of places of business (up to 25). There are at present 10 QFBs. In June 2012, MAS announced changes to the QFB program by which QFBs with large retail presence will be required to locally incorporate their retail operation. In addition, QFBs that satisfy certain qualifying criteria and are assessed to be “significantly rooted” will be allowed to establish up to 50 places of business. Wholesale branches are allowed to take wholesale domestic funding but not retail. Purely off-shore branches are generally not allowed to accept Singapore dollar deposits from residents.

SINGAPORE
10 INTERNATIONAL MONETARY FUND
Universal banking licenses. Local banks and branches are allowed to undertake universal banking, and can offer a wide range of financial services, provided these are regulated by MAS. They are exempted from holding additional licenses, but are required to notify MAS when they wish to commence regulated nonbank securities and financial advisory activities, and to comply with the relevant regulations.
3. Other financial institutions include insurance companies, merchant banks, fund managers, market intermediaries, and financial advisors. The insurance sector is the second largest component of Singapore’s financial system. However, despite recent growth, its assets account for only about 6 percent of the total assets of the system (about 48 percent of GDP). The largest activity is life insurance, in particular policies issued to Singapore residents. There are also over 600 fund management firms5 with S$880 billion in assets under management (AUM),6 of which about 250 hedge funds managers with AUM of S$60 billion (about 250 percent and 17 percent of GDP, respectively). More than 80 percent of these assets come from sources outside Singapore, in particular from the region, attracted by its favorable tax and legal framework.7
4. Since the last FSAP, macroeconomic and financial performance has been strong.8 Real GDP growth and inflation averaged around 6 percent and 2½ percent respectively during 2004–11. The services sector has made the largest contribution to output and growth, accounting for about 60 percent of GDP and about 70 percent of growth. The financial system more than doubled in absolute terms, and now contributes around 12¼ percent to annual GDP (up from about 10 percent in 2004). Following a 9 percent decline in 2008 and early 2009, output recovered strongly and GDP is now significantly above the pre-crisis level. 2012 was a more difficult year for Singapore, however, owing to weak global demand and a tighter foreign worker policy, resulting in real growth of around 1¼ percent, with weak activity continuing into early 2013. The resident unemployment rate remains at a near historic low of 3 percent.
5. Despite the strength of the economy in recent years, some risks to financial stability have emerged:
Real estate prices are already above their 2008 peak, before the last market correction. Low interest rates have been a key factor in the current property boom. Since 2009, the authorities have responded by taking several rounds of measures aimed at containing housing demand and boosting supply (discussed further below).
5 This includes 155 registered and licensed fund managers and 517 exempt fund managers as at end-2012. The latter will be required to hold a license or be registered in the future, and the application process has commenced. 6 Including other financial institutions such as banks and insurance companies, total AUM is about S$1.63 trillion. 7 The Central Provident Fund is a social security savings plan for retirement whose assets represent about 9 percent of financial system assets (Table 3). It is administered by the Central Provident Fund Board, a statutory board under the Ministry of Manpower. 8 Table 2 summarizes the implementation of recommendations made by the 2004 FSAP.

SINGAPORE
INTERNATIONAL MONETARY FUND 11
Credit growth has averaged about 12 percent for the past five years, with credit growth in the three largest banks of 14¾ percent year on year in June 2013. Banks have very low nonperforming loans (NPLs) (just over 1 percent) and lower net interest margins than historically, and have strong incentives to boost lending. About 40 percent of the three largest banks’ loans are related to real estate, including 25 percent in mortgage loans (predominantly based on floating rates), and 15 percent in construction loans.
The rapid expansion of domestic banks’ activities in the region has helped diversify their balance sheets but also gives rise to additional credit and liquidity risks. Credit growth has been and continues to be fast in banks’ foreign subsidiaries and through cross-border lending. European banks have scaled back their involvement in the region, which has created opportunities for Singapore banks to increase their market share. As of June 2013, the three largest banks’ loans to Greater China increased by 13½ percent year-on-year, while credit in U.S. dollars has increased by 20½ percent.9
Singapore banks are predominantly deposit funded and meet Basel III’s liquidity coverage ratio (LCR) when all currencies are aggregated. On a consolidated basis, their LTDs are below 90 percent, although LTDs in some currencies are above 100 percent and growing. Most notably, U.S. dollar deposits have not kept pace with the growth in U.S. dollar loans. Reflecting regular supervisory engagement by MAS, the local banks have taken steps to improve their funding profiles, such as issuing commercial paper and medium-term notes in U.S. dollars, diversifying sources, and stepping up U.S. dollar deposit-taking efforts.
6. Looking ahead, additional macro-financial stability risks include the following:
Given continued weak global demand and the restructuring of the Singapore economy to boost productivity, growth will likely be below the pre-crisis trend. Economic growth in Singapore is forecast at 3½ percent in 2013 and 2014 (Table 4).
A disorderly exit from Unconventional Monetary Policies (UMPs) in advanced economies and Emerging Market (EM) capital flow reversals may expose Singapore to volatility and strains from asset repricing and liquidity pressures given Singapore’s large financial sector and its cross-border activities. Domestic interest rates are also likely to increase and affect the ability of mortgage borrowers to service their debts.
There are also downside risks to economic growth in the region. These would adversely affect the banking sector, including through their subsidiaries abroad.
9 The median debt to equity ratio of publicly listed corporates in Singapore and in the region lies in the 25–30 percent range. However, it has been on an upward trend recently, and in some countries (notably India) it is very high. According to the authorities, most lending in domestic banks’ foreign subsidiaries is to corporates of high creditworthiness. The authorities note that as of December 2012, domestic banks’ regional NPL ratios were in the 0.3-7 percent range.

SINGAPORE
12 INTERNATIONAL MONETARY FUND
7. These risks could be accentuated by the high degree of interconnectedness of Singapore’s financial system:
The predominance of foreign branches creates exposure to their parent banks (although sound parents would provide greater stability).
There is no clear separation between offshore and domestic financial transactions.
Cross-border interbank flows are large (Figure 3); and there is a growing negative net funding position of Singapore banks with respect to all major regions of the world.
Indeed, based on BIS locational data, the negative net funding gap appears to have increased significantly since the global financial crisis, with liabilities that are largely short-term. This intensive activity appears to reflect foreign banks’ use of Singapore as a center for liquidity management and the distribution of their products in the region. However, these claims could also point to the availability of cheap U.S. dollar funding.
8. Singapore has addressed most recommendations made by the 2004 FSAP (Table 2). These include: strengthening the macroprudential framework, completing the review of the regulatory minimum capital requirements for local banks, and enhancing the risk-based capital framework for insurers. There is still scope for greater independence of MAS.
RESILIENCE TO RISKS A. Banks—General
9. Financial soundness indicators for the big three domestic banks remained strong during the global and European crises. Singapore banks are among the highest rated in the world, with higher capital ratios and lower leverage than peer banks. Profitability is high and diversified. Asset quality is good and NPLs are low and well provisioned (Table 5 and Figure 4).
10. Stress tests suggest that banks are resilient to adverse macroeconomic scenarios. Their high capitalization could offset potential losses, including from large exposures to real estate. The scenarios described in Box 1 and Table 6 entail large declines in domestic and regional economic activity, falling asset prices, rising interest rates, and rapidly rising unemployment. Both the bottom up (BU) and top down (TD) stress tests conducted by MAS suggest that capitalization ratios would still remain above the domestic minimum regulatory capital ratio of 10 percent. Trading losses would be limited owing to the absence of significant proprietary trading and the fact that trading books mostly comprise domestic sovereign bonds.10 Credit losses, distributed between corporate loans and residential mortgages, would erode the capital base, while increased probabilities of
10 Losses from sovereign exposures are less than 1 percent of RWA. Interest rate risks are negligible due to the prevalence of floating rate loans (including mortgages).

SINGAPORE
INTERNATIONAL MONETARY FUND 13
default (PDs) would be reflected in an increase of risk-weighted assets, magnified by the initial low PD levels. All these factors would drive capitalization ratios down by almost one third. IMF TD solvency stress tests broadly confirm the results obtained by MAS, with balance sheet stress tests highlighting the resilience of domestic banks even if residential loan defaults were to reach the levels observed in the United States in the aftermath of the 2007-09 subprime crisis.
11. Despite banks’ overall resilience to credit risk, country concentrations require close monitoring. From a systemic perspective, exposures outside Singapore are heavily concentrated in the region. MAS is fully cognizant of the growing regional linkages, follows these exposures closely, and considers that they are within safe limits. Even so, regional exposures need to be monitored closely in view of the possibility of a sharp or prolonged regional slowdown. Furthermore, given the low level of NPLs, small increases in NPLs could quickly erode provision coverage.
12. More generally, MAS should give more attention to onsite inspections of banks’ credit risks. The philosophy of MAS is to place significant emphasis on holding bank management accountable for the quality of underwriting and credit quality. While bank management, bank risk management systems, and prudent internal risk cultures are the first line of defense against weak loan and asset portfolios, strong onsite inspections are a necessary complement.
13. Liquidity shortages in foreign currency could affect some banks. When consolidated across all currencies, the LCRs of most banks and foreign branches, calculated using the parameters recommended in Basel III, exceed 100 percent, but the coverage for U.S. dollar exposures is lower. Stress tests suggest that if banks’ ratings were downgraded by several notches, some banks would find it difficult to continue to close their U.S. dollar funding gaps using the FX swap market. Over a one-year horizon, banks could require as much as U.S. $50 billion (about one fifth of foreign reserves). Given the possibility that liquidity conditions could tighten globally once U.S. dollar interest rates begin to increase, this illustrates the potential for pressure on Singapore’s foreign exchange position.
B. Banks—Interconnectedness
14. Foreign banks in Singapore mainly operate as branches, which by definition are closely interconnected with their much larger parent institutions. While branching facilitates an efficient allocation of capital and liquidity within the overall bank, and may contribute to stability when the parent is sound, instability in the parent may give rise to risks for the country hosting the branch. Branches pose special challenges for supervision and resolution. MAS is aware of these risks and has taken measures to mitigate them (Box 2). MAS has also advocated in international groupings for greater sharing of supervisory information, including on the G-SIFIs active in Singapore.

SINGAPORE
14 INTERNATIONAL MONETARY FUND
15. The FSAP examined whether branches pose material threats to financial stability.11 It assessed the ability of branches to maintain sufficient assets vis-à-vis local liabilities through the Asset Maintenance Ratios (AMRs) imposed by MAS. It also assessed potential spillovers from direct and indirect exposures in the domestic and cross-border interbank markets.
16. Stress tests results indicate that under the adverse scenarios described in Box 1, the AMRs would remain above the regulatory minimum. This result reflects the high quality of eligible assets, which are unlikely to deteriorate significantly under macroeconomic stress. AMRs thus appear to provide considerable protection against the risk of runs motivated by uncertain recovery of local claims. However, AMRs do not cover all liabilities, notably interbank claims; and this is consistent with the priority MAS gives to protecting non-bank depositors. While AMRs are an important element in limiting the risks arising from branch operations, MAS fully understands the need to complement them with a strict licensing policy, monitoring of risk in parent banks, and international supervisory cooperation.
17. Currency mismatches expose branches to liquidity risk. The LCRs in U.S. dollars and other foreign currencies (such as the Malaysian ringgit and the Hong Kong dollar) for some banks are below 100 percent, suggesting branches may be funding domestic assets from foreign sources.
18. Spillover risks were assessed using complementary approaches: cross-border and domestic network modeling, and a market-based approach to spillovers based on consolidated bank group information.
The network approach analyzed cross-border interbank assets and liabilities. Since it lacked information on bank-by-bank exposures, it simulated the potential domino effects and losses suffered by the Singapore banking system in the event of default of other banking systems with exposures to the Singapore banking system. This analysis used bilateral BIS Locational Banking Statistics for 2012Q3. One benefit of the locational approach is that it focuses on unconsolidated cross border interbank flows (Figure 3), allowing it to assess triggers and consequences of potential market freezes, and country concentration risk. Two scenarios were considered: (i) a credit shock scenario, defined as a national banking system’s default on interbank exposures to other national banking systems; and (ii) a combined credit and funding shock scenario, in which the troubled national banking system is unable to renew a portion of its funding to other national banking systems.
The authorities also conducted a network analysis of the domestic interbank borrowing/lending and derivatives market, based on actual bilateral claims. It included the top three domestic banks and seven foreign banks, which together account for about 75 percent of the domestic interbank borrowing/lending and derivatives exposures.
11 In addition to the local banks, stress tests covered three branches and a locally-incorporated foreign subsidiary, all of which represent about 23 percent of total foreign bank assets.
SINGAPORE
INTERNATIONAL MONETARY FUND 15
The market-price based spillover analysis assessed the effects on domestic banks stemming from foreign parent banks under stress. It also explored which foreign financial systems/banks are more vulnerable to financial stress in Singapore. It used equity prices (returns) of the top three domestic banks and 36 foreign banks to gauge the direction of linkages during extreme negative movements in banks’ equity prices.
19. The network analysis suggests that Singapore is more vulnerable to cross-border interbank exposures than to domestic interbank exposures.
This is particularly the case for credit shocks originating in the U.K., although Japan, South Korea, and the U.S. are also significant triggers. When a funding shock is added, the results show that Germany and the U.S. would also have very large effects on Singapore (Figure 5), possibly reflecting the strong funding linkages with those countries. This vulnerability appears to arise indirectly through domino effects and only after large financial centers are affected. However, the prevalence of short term liabilities implies that the domino effects could progress very quickly.
The authorities’ domestic contagion analysis shows that there are limited network effects from foreign to local banks in the domestic interbank market. The risks of contagion within the network of the three local banks are very low. Foreign banks are more vulnerable to credit and funding shocks from the local banks.
20. The market-based spillover analysis shows that Singapore banks are sensitive to spillovers from other banks. On average, each Singapore bank receives spillovers from seven other banks from Singapore, from the region, and from around the world. The local banks are most vulnerable to spillovers from Swiss, U.K., and U.S. banks. Among other regional inward spillovers to Singapore, the Malayan and Thai banks are dominant.
C. Insurance
21. Insurance companies have proven to be highly resilient. For the insurance sector as a whole, regulatory capital buffers were sufficient to absorb not just losses from the global financial crisis, but also from natural disasters. Some indicators, such as net premiums and net investment income, suggest generally stable and robust profits in the life insurance business. The profitability of non-life insurers has been more volatile, as they have confronted several natural disasters in the recent past and in particular in 2011 (Figure 6).
22. Potential vulnerabilities remain, and are being addressed by MAS. These arise from the presence of guaranteed returns, relatively high exposure to equities, and exposure to catastrophe risks arising from rapid growth in the offshore non-life sector.
In life insurance, participating policies with a guarantee represent the dominant product. However, the guaranteed rate remains low (2 percent), and insurers have the capacity to absorb significant losses by reducing dividends or bonuses. Stress tests conducted by MAS included a

SINGAPORE
16 INTERNATIONAL MONETARY FUND
scenario that envisages a prolonged period of low interest rates. The results showed no significant adverse impact on life insurance companies based in Singapore.
The current asset allocation for some life insurance companies involves relatively high exposure to equities (about 20 percent of total non-linked assets for the industry as a whole). Stress tests performed at end-2012 (Box 3) indicated that a sharp reduction in equity prices lasting three years would oblige several companies to adopt remedial measures (such as reducing bonuses to policyholders and raising additional capital) in order to meet regulatory solvency requirements. MAS has implemented enterprise risk management (ERM) and requires investment policies to be approved by the Board. MAS is also reviewing risk-based capital requirements, to better capture the risk of volatility in equities.
Recent rapid growth in the offshore non-life sector may pose risks. The non-life sector has been exposed to catastrophe risks as a result of the offshore regional business written out of Singapore. For example, flooding in Thailand resulted in significant insured losses. In response, companies have reviewed their reinsurance arrangements, and the policy terms and conditions have been tightened. MAS is considering adding catastrophe risk charges to its solvency test formula by designing a standardized catastrophe scenario.
D. Capital Market Intermediaries and Transactions
23. Funds managed by asset managers, including hedge funds, have limited linkages with banks in Singapore and are unlikely to pose a systemic risk. Excluding insurance companies, nonbank deposits are relatively small at 1½ percent of local banks’ liabilities, and nonbank loans are only 0.6 percent of banks’ assets. Derivatives exposure with banks in terms of notional value is also low, at 0.3 percent of banks’ derivative transactions. Guarantees provided by banks and investments of banks in the nonbank financial sector are insignificant. Linkages with banks in Singapore are small inter alia because assets are mainly held in custody accounts with foreign banks outside Singapore. The Singapore asset management industry mainly serves as a conduit for funds that originate outside Singapore (more than 80 percent of the total), which are largely invested elsewhere (nearly 86 percent of the total). While investor funds mainly originate outside of the Asia Pacific region, they are invested primarily in the Asia Pacific region. The failure of a large asset manager is unlikely to pose systemic risk, but it could carry reputational risk for the Singapore financial sector.
24. The recent move by MAS to extend licensing or registration requirements to all locally-domiciled asset managers, including managers of hedge funds, is a welcome development. As of Q3 2012, MAS has required all locally-domiciled asset managers, including hedge funds managers, to either hold a capital markets license or be registered. Asset management firms operating under the repealed exempt fund management regime, of which there were 517 at end-2012, had to apply for registration or for a license. Although some hedge funds have expressed

SINGAPORE
INTERNATIONAL MONETARY FUND 17
concerns about more intrusive regulation, it is unlikely to lead them to relocate to other global financial centers, since requirements are being tightened elsewhere as well.12
25. Most Singapore managed `hedge funds appear focused on relatively simple equity trading strategies with low leverage.13 There are about 250 hedge fund managers with more than S$60 billion in assets. Most, nearly 80 percent, of the strategies pursued by managers belong to the equity long-short approach, in which leverage is typically below two times NAV and exposures tend to be similar to long-only equity strategies. The remaining 20 percent is split equally between strategies that seek to exploit arbitrage opportunities, predominantly in the fixed income market; and those that take directional bets in a variety of asset markets. The latter, described variously as tactical or macro strategies, often employ significant leverage to boost returns, and often take concentrated bets in equity, fixed income, commodity, and currency markets. The volatility of historical returns of Singapore-managed macro hedge funds is similar to that of the S&P 500. The leverage of all hedge funds managed in Singapore, including off-balance sheet exposure, is below three times net asset value (NAV), with the exception of one fund that is levered nearly 17 times NAV. MAS is monitoring the hedge fund sector closely.
26. There is limited activity in the market for securities lending in Singapore, and collateral rehypothecation is not an issue at present. This market appears to be dominated by hedge funds and some local banks, while broker-dealers and traditional asset managers are largely absent. Although market participants will provide funding in exchange for a broad range of collateral, including cash, high-quality government securities and equities, hedge funds report using cash collateral because of significant haircuts on non-cash securities. Rehypothecation of collateral, though possible, is uncommon and there are clear rules for segregation of customer assets. While there is a requirement in place to limit rehypothecation to the size of customer assets, there appears to be no legal limit on the number of times collateral may be rehypothecated. There appear to be no systemic risks from these activities at present.
27. Real Estate Investment Trusts (REITs), Exchange-Traded Funds (ETFs), and structured finance vehicles do not appear to pose systemic risks. REITS, which have a market capitalization of approximately S$51 billion ($40 billion), are now subject to a number of safeguards in the wake of a funding crisis triggered by the collapse of Lehman.14 While real estate assets remain diversified across several regional markets as before, REITs have taken steps post-Lehman to better manage their loan maturity and leverage levels. Funding sources have also been diversified. Other investment products such as ETFs, structured finance vehicles, and money market funds, with
12 In the US, for instance, Dodd Frank now requires registration of hedge funds and reporting; in the U.K. and Hong Kong, hedge fund regulation and surveillance is being similarly tightened. 13 Leverage is defined as total borrowing divided by NAV. Total borrowing includes that embedded in financial instruments, such as exchange traded and OTC derivatives. The borrowing embedded in financial instruments is represented by their total gross notional amount less initial margin posted. 14 REITs are investment firms that issue capital instruments, including debt and equity, for the purpose of allocating capital to real estate and deriving both current income and capital gains from sales of assets.

SINGAPORE
18 INTERNATIONAL MONETARY FUND
combined assets under management of just over ¼ percent of the financial system, are presently too small to pose systemic risks. For speculative investment products available to retail investors, such as contracts-for-differences (CFDs) and levered FX (LFX), MAS has proposed new regulation to limit leverage, to protect and recover investor funds in case of dealer insolvency, and to enhance risk disclosure. While these products are available to retail investors, low trading volumes (below 5 percent of stocks) suggest that they pose no systemic risk.
E. Financial Market Infrastructures
28. Singapore has a well developed payment, clearing, and settlement infrastructure. Systemically important payment systems include the large value payment system MEPS+ and securities and derivatives clearing and settlement systems operated by the Singapore Exchange (SGX). Two financial CCPs are (i) the Central Depository (Pte) Limited (CDP) that clears equities and corporate debt securities; and (ii) the Singapore Exchange Derivatives Clearing Limited (SGX-DC) that clears exchange traded and OTC derivatives. CDP’s value of transactions processed was equivalent to 94 percent of GDP in 2012. Worldwide, SGX- DC is the eighth largest clearer in exchange traded equity index futures. Singapore is also one of the largest trading centers for OTC derivatives in Asia (just under S$9 trillion in the notional value of outstanding contracts). Its systemic importance is expected to increase with the implementation of the G20 reforms, notably the mandatory clearing of all standardized OTC derivatives.
29. CDP and SGX-DC are assessed as sound and efficient CCPs with effective risk management frameworks. Both CCPs comply with relevant international standards. They are subject to SGX’s comprehensive and transparent risk management framework comprising clear policies, sound governance arrangements and operational systems, and default and business continuity procedures that are regularly tested. The CCPs apply a comprehensive credit risk management framework and both maintain sufficient financial resources to cover the default of the clearing member and its affiliates with the largest exposure, as well as the default of the two financially weakest clearing members. However, SGX’s recovery plans should be enhanced in line with ongoing international policy developments to ensure the continuation of critical operations in extreme circumstances.
30. Global OTC derivatives reforms expose SGX-DC to legal risk owing to conflicts between domestic and foreign laws. MAS is encouraged to continue its efforts to mitigate these risks in close cooperation with foreign authorities. OTC derivatives reforms in the U.S. and the EU, enacted primarily through Title VII of the Dodd-Frank Act and the European Market Infrastructure Regulation (EMIR) respectively, have extra-territorial implications for SGX-DC as well as for market participants, and these will need to be addressed.
31. Competition with foreign CCPs may rise in the coming years, especially for clearing OTC derivatives. The mandatory clearing obligation will shift bilateral clearing among banks to CCPs, increasing potential clearing volumes. Competition may lead to reduced clearing-related fees and improved clearing services. However, as collateral is costly, CCPs may face market pressures to reduce collateral requirements as well. SGX and MAS are encouraged to continue compliance with

SINGAPORE
INTERNATIONAL MONETARY FUND 19
international standards in this area and not compromise on CCP risk management. This does not preclude searching for efficiencies in the risk management framework.
32. For CDP, the possibility of separating the functions of CCP and central security depository (CSD) into two distinct legal entities under the existing holding company structure could be explored in line with international best practices. CDP provides two services with a distinct risk profile. As a CSD, CDP bears no risk as it does not permit any overdraft or debit balances in the securities accounts, whereas as a CCP it concentrates risk, becoming the counterparty to every novated trade. CDP’s own resources including capital are not clearly separated and earmarked between its CSD and CCP functionalities. In times of crisis, this could adversely impact the discharge of both roles. It is recommended that CDP review its legal structure to facilitate the potential application of its recovery and resolution framework.
33. The CCPs are encouraged to explore with members the possibility of widening their collateral pool. It could examine the feasibility of taking Singapore government securities as collateral to improve access to central bank liquidity in times of stress. A standing facility is provided by MAS, which allows the CCPs to repo Singapore government securities and collateral for overnight SGD funding. To enable the use of MAS’ standing facilities on an immediate basis (rather than converting its deposits into securities), they should make efforts to receive a part of the collateral in the form of Singapore government securities instead of cash.
34. Although risks related to the link with the Chicago Mercantile Exchange (CME) are assessed to be low, risk management procedures should be upgraded to be fully compliant with the Principles for Financial Markets Infrastructures (PFMI). The letter of credit (used for daily credit exposures of SGD-DC to CME) should be covered by collateral or replaced in full by highly liquid assets with low credit risk. The SGX-DC clearing fund cannot be used to cover potential losses related to this link, as this reduces the resources that the CCP holds to address the risks related to the potential default of clearing members.
FINANCIAL OVERSIGHT 35. MAS plays a central role in the development, management, and oversight of the financial system in Singapore. By law, MAS has the following objectives: maintaining price stability conducive to sustainable economic growth; fostering a sound and reputable financial center and promoting financial stability; ensuring the prudent and efficient management of Singapore's official foreign reserves; and growing Singapore as an internationally competitive financial center. MAS conducts monetary and exchange rate policy, acts as the integrated supervisor of the financial sector (including systemically important FMIs and macroprudential policies), and is the resolution authority for financial institutions.
A. Systemic Liquidity Risks and Management
36. Monetary policy aims to achieve “price stability conducive to obtaining sustainable growth of the economy.” This objective is achieved by managing the exchange rate using a

SINGAPORE
20 INTERNATIONAL MONETARY FUND
basket-band crawl (BBC) approach. MAS intervenes in the foreign exchange market when necessary, and domestic market operations are aimed at managing systemic liquidity.15 Banks are required to maintain minimum cash balances (Box 2) and minimum liquid assets (the latter will be replaced by the Basel III LCR requirement in January 2015). To inject and withdraw liquidity into and from the banking system, MAS uses four instruments.16 The liquidity management system is complemented by an intra-day liquidity facility and standing credit and deposit facilities.
37. Following the global financial crisis, the authorities have implemented a range of measures to enhance systemic liquidity management. MAS entered into a precautionary US$30 billion currency swap agreement with the U.S. Fed in 2008;17 signed the Chiang Mai Initiative Multilateralization Agreement; kept a higher level of Singapore dollar liquidity in the banking system; expanded the standing facility (SF) to include all MEPS+ participants;18 accepted AAA-rated S$ debt securities issued by supranationals, sovereigns, and sovereign guaranteed companies as collateral in the SF; and entered into cross-border collateral arrangements (CBCA) with other central banks to accept well rated foreign currencies and government debt securities as collateral in the SF, significantly increasing the pool of available collateral.19 However, as noted above, foreign currency liquidity, in particular U.S. dollars, is a potential vulnerability during periods of stress; and MAS will want to continue to work with banks to address this issue.
38. MAS is empowered to provide emergency liquidity assistance (ELA) to solvent financial institutions. Such lending would involve an expanded pool of collateral with appropriate haircuts, if it determines that such action is necessary to safeguard financial stability. However, any supply of ELA would be on a case-by-case basis. Given moral hazard concerns, the criteria and conditions for ELA are not published.
B. Macroprudential Oversight
39. MAS is the macroprudential authority in Singapore. The current Chairman of MAS is also the Deputy Prime Minister and Minister of Finance. The Chairman of MAS presides over the Board-level Chairman’s Meeting (CM), which is ultimately vested with responsibilities for both microprudential and macroprudential policies. At the level of the CM, the MAS holds meetings with the Ministry of Finance to discuss emerging macroeconomic and financial stability issues and to seek
15 To manage the exchange rate regime, MAS intervenes in the foreign exchange market using spot or forward transactions. Therefore, it is expected that MAS will provide the foreign currency liquidity needed to maintain the exchange rate within the target band. This perception has been internalized by banks in their management of foreign currency liquidity. 16 These four instruments are: FX swaps or reverse swaps; SGS repos or reverse repos; clean lending or borrowing; and, since April 2011, MAS bills. 17 The swap line expired in February 2010. Currently, MAS has a S$60billion/CNY300billion swap line with PBC. 18 This measure effectively quadrupled the number of market participants with direct access to the standing facility. 19 As of August 2013, MAS has entered into CBCAs with Bank Negara Malaysia, Bank of Thailand, Bank of England, Banque de France, Bundesbank, De Nederlandsche Bank, the Federal Reserve, and Bank of Japan.

SINGAPORE
INTERNATIONAL MONETARY FUND 21
agreement on policies that can have broad fiscal ramifications. The CM, in its macroprudential policy role, is supported by the MAS Management Financial Stability Committee (MFSC), which is chaired by the Managing Director of MAS and includes other MAS senior managers. It is at the level of the MFSC that policies aimed at the stability of the overall financial sector, asset prices, and consumer prices are coordinated. It is also at this level that MAS collaborates with relevant external agencies in affected sectors—for example, the Urban Redevelopment Authority (URA), the Housing Development Board (HDB), and Ministry of Finance (MOF)—on housing related policies such as the imposition of stamp duties on house purchases or sales). The MFSC receives inputs from MAS staff in financial supervision departments, drawing both on bottom-up assessment of risks in individual financial institutions and on a top-down assessment of the system as a whole.
40. The macroprudential framework focuses on the financial system as a whole and on links with the real economy. While MAS actively manages the exchange rate to address inflation and growth, macroprudential policies target potential financial system vulnerabilities arising from capital flows, credit growth, and asset prices. Two key elements of the approach are (i) surveillance of systemic financial risk; and (ii) the design and calibration of policy instruments. In order to identify systemic risks, MAS analyzes developments in the global and domestic financial systems and traces their transmission channels and potential impact on macroeconomic and financial stability. In the design of policy instruments, MAS seeks to target the specific risk factor or transmission channel. Calibration of instruments is based on simulations of impact, and also on cross-country and past experience. Recent macroprudential measures have been focused on the housing market.
Macroprudential oversight of the housing market20
41. Singapore’s real estate market is dominated by public housing, which accounts for about 76 percent of the total housing stock. The government allocates land and provides loans to the HDB to build apartments, which are sold to qualified Singapore citizens at subsidized prices. These programs have helped increase the proportion of the population that owns real estate to about 90 percent. To further foster stability in public housing, the authorities have reduced debt service to income limits and restricted the use of Central Provident Fund (CPF) resources. These measures are expected to restrain price pressures in the resale market going forward.
42. Macroprudential measures for housing were tightened incrementally, and in a targeted fashion, also in view of uncertainty about their transmission. Instruments used included loan-to-value limits, loan tenure rules, stamp duties, property taxes, debt-service-to-income limits, minimum cash down payments, and supply measures.21 The measures have largely targeted the more speculative segments of the market, but since a significant share of private housing accounts is owned by foreigners and permanent residents, some measures have targeted
20 Macroprudential supervision of the (private and public) housing market is conducted through an inter-agency task force that includes MAS, MOF, Ministry of National Developments, HDB and URA. 21 Details of the measures are provided in the Staff Report on the 2013 Article IV consultation discussions.
SINGAPORE
22 INTERNATIONAL MONETARY FUND
this segment. Other measures more broadly seek to protect housing loan quality.22 Work is also underway to ensure that the credit bureau has a more complete picture of each borrower’s debt.23
43. There are also lending limits for banks, but these do not fully address concentration risks. A macroprudential limit on banks’ real estate exposure is set at 35 percent of total non-bank assets,24 but in practice has not been a binding constraint (the average current ratio is only 16 percent) since owner-occupied properties, which are typically of lower risk, are not included. Including owner-occupied housing loans would increase the average real estate exposures to 26 percent of total nonbank assets. Revising the approach to concentration in order to include owner-occupied properties, with greater discretion for MAS in its calibration, would help to limit concentration risk from real estate.
44. Macroprudential measures have been effective in addressing riskier lending practices and moderating price appreciation, but the adequacy of these measures will only be fully tested over time.
Data on new loans show declining loan-to-value ratios, and an increase in the share of borrowers with single mortgages.
Housing price inflation has also moderated recently, and housing affordability metrics remain contained.
However, loan growth to the housing sector remains elevated, and household debt has increased over the last three years, by about 7 percentage points of GDP, and reached 76 percent at end 2012.25
These outcomes, taken together, provide a rationale for the authorities’ cautious macroprudential approach.
45. Although households appear to have strong buffers, higher interest rates could cause stress. In aggregate, households have significant liquid assets, can draw on their CPF savings, and have substantial home equity: loan to value (LTV) ratios are below 80 percent for 90 percent of
22 These include lowering LTVs on first mortgages to 80 percent, limits on loan tenures, and a limit on households’ TDSR, which was introduced in June 2013. The TDSR limits total debt service to income, including all other debt obligations of the borrower, to no more than 60 percent. 23 Currently, the credit bureau has information on whether a borrower has other outstanding debt but not on the actual outstanding amounts. 24 Non-bank assets are assets other than claims on banks. 25 Total housing loans, which comprise loans by financial institutions and HDB, have been growing at an average rate of 11 percent in recent years, with loans from financial institutions growing by about 18 percent. Household debt to GDP in Singapore is among the highest in the region, but is much lower than in other high income countries such as the U.S. and the U.K. The ratio of household liabilities to assets has also increased, to about 16 percent, but remains within the historical range.

SINGAPORE
INTERNATIONAL MONETARY FUND 23
loans. Nevertheless, the lack of granular data on household balance sheets, including on the distribution of assets, makes it difficult to assess the extent to which some households are overextended. With nearly 70 percent of housing loans at variable rates, most of which reset every six months, the transmission from higher interest rates to higher debt servicing costs would likely occur swiftly. According to a MAS survey, if interest rates rose to 3.5 percent (about 200 basis points above current levels), the debt servicing costs of some 5–10 percent of households would rise above 60 percent of income. A July 2013 MAS press release appropriately warned of risks from over-levered households. Further outreach and education along these lines would be helpful.
46. Looking ahead, the authorities should stand ready to recalibrate macroprudential tools in line with changes in market conditions. To address further pressures in the housing market, the authorities should continue to adjust their macroprudential policies using a targeted approach. While the recent focus has been on curbing excessive house price appreciation, the authorities should remain vigilant against risks arising from exit from UMPs in the U.S. or other advanced economies and stand ready to adjust macroprudential policies in light of changes in the macroeconomic environment and housing market developments.
47. While macroprudential policies have mainly targeted housing, measures have also been taken in other fields. These include car loans, credit cards, and other unsecured consumer credit facilities. To address rising car loan tenures and rising price pressures on certificate of entitlement (COE) permits, MAS introduced a tenure limit (five years) and an LTV requirement on car loans, which were effective in reducing prices. In 2012, MAS also issued a consultation paper to engage financial institutions on the responsible use of credit cards and other unsecured credit facilities. The proposed set of revisions to the rules on unsecured credit complements the recent total debt servicing ratio (TDSR) measure, as it recommends that banks consider other liabilities of the borrower and restricts the extension of new credit to overextended borrowers. Enhancements to consumer data by the credit bureau would also improve the effectiveness of such measures.
C. Microprudential Oversight
48. MAS has very high supervisory standards and a tradition of conservative prudential guidelines. Its effectiveness stem from its role as the single supervisor for all financial intermediaries and financial markets infrastructures, coupled with a risk-based supervisory approach and supervisory intensity linked to the systemic importance of financial institutions.26 Overall compliance with all supervisory standards assessed by the FSAP mission was very high compared with other major financial centers.
49. One area that bears further consideration is the governance structure of MAS and its dual mandate, which may raise the potential for conflicts. At present, out of nine Board
26 MAS has developed a risk assessment methodology for all financial institutions called Common Risk Assessment Framework and Techniques (CRAFT) that influences the frequency of inspections and filing requirements.

SINGAPORE
24 INTERNATIONAL MONETARY FUND
members, six are cabinet members (including the MAS Chairman who also serves as Minister of Finance and Deputy Prime Minister) or hold high government-related positions. Moreover, MAS has been assigned a dual mandate for prudential supervision and financial sector development. While no signs were found that the independence of MAS or its prudential supervision had been compromised by these arrangements, it would seem appropriate to revisit them to avoid the risk of possible conflicts in the future.
Banks
50. MAS capital requirements for banks are higher than those established by Basel III, and their adoption has been frontloaded (Table 11). The new requirements have been in effect since January 2013, and except for the capital conservation buffer, which follows the same phase-in schedule as Basel III, the minimum common equity capital ratio and the minimum Tier 1 capital requirements for 2013 in Singapore meet Basel requirements for January 2015.
51. Following Basel III, the LCR will be introduced in January 2015. The minimum requirement will start at 60 percent, rising in equal annual steps to reach 100 percent in January 2019, and Singapore banks appear well positioned to meet these requirements.27
52. Singapore shows a very high level of compliance with the Basel Core Principles (BCPs). MAS has built up a strong and experienced supervisory staff that has put in place an effective supervisory and regulatory framework, reflecting government support for an effective and well-resourced MAS.
Insurance
53. Insurance supervision has been significantly strengthened since the initial FSAP in 2004. The updated regulatory framework and supervisory practices show a high level of observance of the Insurance Core Principles (ICPs). For example: risk-based capital (RBC) has been adopted as the solvency standard for life and general insurance companies; work has begun on the development of an updated version to be known as RBC II; MAS has imposed additional capital requirements for certain companies with a higher risk profile; stress testing is a routine part of supervision; and new enterprise risk management requirements have been introduced and will be implemented from January 1, 2014.
Capital markets
54. There is a clear legal framework for capital market activities. Regulated activities include asset/portfolio management, investment advisory services, property fund management, and other activities like securities dealing and futures trading, leveraged foreign exchange trading, and
27 At present, MAS requires banks to hold liquid assets equivalent to 16 percent of qualifying liabilities. Supervisors can impose higher or lower requirements based on the bank’s risk profile and the reliability of its liquidity management system.

SINGAPORE
INTERNATIONAL MONETARY FUND 25
advising on corporate finance. Major regulatory reforms in process envisage extending securities regulation to cover OTC derivatives, and revisions to the regulatory capital framework to enhance risk sensitivity of the risk-based capital regime for securities market participants, in tandem with Basel III developments.
55. Compliance with the IOSCO principles is generally high. Enforcement is effective, and there is sufficient information sharing and cooperation between MAS and foreign agencies. Shareholder protection in regard to participation in corporate decision making could be strengthened in order to fully meet IOSCO standards (this holds for unlisted public companies and overseas shareholders in listed companies). MAS effectively regulates collective investment schemes and market intermediaries, and it keeps a close watch on all sectors of this market, including hedge funds. Self-regulation by exchanges remains an integral part of the regulatory framework and is subject to effective supervision. Most intermediaries retain capital in excess of minimum requirements.
Financial markets infrastructures
56. FMIs in Singapore are subject to effective regulation, supervision and oversight. The legal framework provides MAS with sufficient powers to obtain timely information and induce change. MAS supervision of CCPs and securities settlement systems is guided by the Securities and Futures Act and its accompanying regulations. MAS and the Commodity Futures Trading Commission have a memorandum of understanding covering information sharing agreements on the link between SGX-DC and the CME, but this memorandum does not cover cooperation in crisis scenarios. There have thus been significant improvements since the 2004 FSAP.
Anti-Money Laundering and Combating the Financing of Terrorism (AML/CFT)
57. The authorities have committed to an assessment of compliance with international standards for Anti-Money Laundering and Combating the Financing of Terrorism (AML/CFT) in the first half of 2015. This assessment will fall outside the timeframe required by IMF Board decisions. The delay is explained by the fact that FATF will only start the new round of assessments of all its members in early 2014, and by capacity constraints within FATF. The Appendix describes the key findings of Singapore’s last assessment and the progress made by the authorities in addressing the main deficiencies identified in 2007.
CRISIS MANAGEMENT AND RESOLUTION A. Institutional Arrangements
58. Responsibilities in the area of crisis management and resolution have been clearly allocated among several public bodies and are supported by robust information sharing and coordination arrangements:
SINGAPORE
26 INTERNATIONAL MONETARY FUND
MAS, as the prudential supervisor, resolution authority, and lender of last resort fulfills a central role in the crisis management and resolution framework. MAS has broad powers to share information with other relevant authorities, subject to confidentiality safeguards.
The Singapore Deposit Insurance Corporation (SDIC), established in January 2006, administers the deposit insurance scheme in Singapore.28 SDIC has a paybox mandate and no supervisory or resolution functions. There is a memorandum of understanding between MAS and the SDIC.
The Ministry of Finance (MoF) involvement in bank resolution and crisis management is a last resort, when there are no viable private sector solutions for dealing with the failure of systemically important financial institutions, or when public resources are at risk.
59. The allocation of certain resolution tools to the Minister-in-charge may compromise the operational independence of MAS in resolution matters. 29 MAS is a “statutory board” that is accountable to a designated Minister (Minister-in-Charge), who in turn is accountable to Parliament for the actions taken by MAS. Some resolution tools (transfer of business, transfer of shares, and restructuring of capital) are entrusted directly to the Minister-in-Charge. While the Minister-in-Charge has the responsibility to act in the interests of MAS’ objectives, including financial stability, it is conceivable that these arrangements could delay resolution actions or result in the Minister taking a different position from the MAS.
B. Toolkit
60. The legal and policy framework for dealing with distressed banks is well-constructed. MAS’ supervisory approach is intrusive and emphasizes prompt intervention. The powers to resolve banks (and branches of foreign banks) are generally robust; and arrangements for providing emergency liquidity assistance are in place. The authorities have explicit powers to assume control of a distressed bank (or branch of a foreign bank), and to transfer assets and liabilities to a healthy bank, a bridge bank, or an asset management company. They can also transfer shares of a bank to another financial institution or restructure its share capital.
61. Since the resolution framework has never been used, preparedness will be particularly important. The preparation of recovery and resolution plans is progressing at a pace consistent with other jurisdictions with significant financial sectors. MAS has required all systemically important banks in Singapore, including foreign branches, to prepare and submit recovery plans, and to provide information relevant to the preparation of resolution plans.
28 The SDIC expects to reach its target level (30 bps of covered deposits) by 2020, which is considered adequate for Singapore. The SDIC also administers the Policy Owners’ Protection Scheme. 29 Under the current government, the positions of the minister-in-charge of MAS, the chairman of MAS, minister of finance, and deputy prime minister are all held by the same person.

SINGAPORE
INTERNATIONAL MONETARY FUND 27
62. There is scope to enhance the toolkit further to enhance its credibility and reduce moral hazard. SDIC is relatively well-positioned for a depositor payout, with robust payout procedures and a line of credit from MAS to provide a funding backstop. To prevent disruptions in banking services that could pose systemic risks and to conserve SDIC’s resources, consideration should be given to widening the use of deposit insurance funds to allow for funding in connection with the transfer of insured deposits to a healthy institution. In cases where ordinary resolution mechanisms may fall short—for instance, with respect to the failure of a systemically important bank—resolution funding arrangements should be available that reinforce the role of industry, rather than the government and taxpayers, in bearing the costs of bank failures.
C. Cross-Border Cooperation
63. Reflecting the importance of foreign banks in Singapore, MAS coordinates closely on crisis management and resolution with other jurisdictions. There are no legal impediments for MAS to share information, subject to confidentiality safeguards, with foreign supervisors and resolution authorities. MAS engages with foreign supervisors on a continuous basis, including in the preparation of resolution plans for the global systemically important banks that are active in Singapore.
64. The preference accorded by Singapore to domestic depositors may, however, undermine the scope for coordinated responses in the event of stress. The Singapore resolution regime does not accord any preference to deposit liabilities held at foreign branches of local banks, which could encourage ring-fencing measures in host jurisdictions and discourage cooperative approaches (see the Key Attributes of Effective Resolution Regimes, issued by the Financial Stability Board in October 2011). However, MAS has publicly committed to consider the impact of its resolution actions on financial stability in other jurisdictions and to work with foreign resolution authorities wherever possible towards a coordinated resolution.

SINGAPORE
28 INTERNATIONAL MONETARY FUND
Macroeconomic Scenario Assumptions(Changes in percent, unless indicated otherwise)
2013 2014 2015 2016 2017GDP growth
Baseline 2.9 3.9 3.9 3.8 3.7Severe 1 -4.4 4.9 4.7 3.9 3.7Severe 2 -2.5 -1.8 -1.7 6.1 6
Unemployment RateBaseline 3 3.1 3.4 3.7 3.9Severe 1 4.2 5.8 6.2 6.2 6Severe 2 4 6.3 9.3 10.5 9.8
Property Prices Baseline 5 5 0 0 5Severe 1 -30 -10 5 5 5Severe 2 -20 -15 -25 0 5
Exchange Rates (SGD/USD)Baseline 2 2 2 2 2Severe 1 -20 -10 10 5 2Severe 2 -15 -5 -10 5 2
Commodity Prices (Energy and Petrochemicals)Baseline 2 2 2 2 2Severe 1 -70 35 35 10 5Severe 2 -40 -5 -5 5 10
Domestic Interest Rates (bps change)Baseline 5 5 10 10 10Severe 1 150 -75 -75 10 10Severe 2 100 50 50 10 10
Equity PricesBaseline 5 5 5 5 5Severe 1 -40 -15 -10 10 15Severe 2 -20 -20 -15 0 10
Sources: Authorities and IMF staff estimates
Box 1. Stress Test Scenarios for Banks
The macro stress tests assessed banks’ performance under a baseline and two adverse five-year macroeconomic scenarios. The baseline scenario is aligned with the October 2012 World Economic Outlook. The two adverse macroeconomic scenarios were generated using MAS’ macroeconomic model for Singapore, its main trading partners, and countries to which Singapore banks and fully operational branches have exposures,1 supplemented by forecasts of asset market parameters.
The first adverse scenario is a short-lived V-shaped recession. GDP growth in Singapore declines to -4.4 percent in 2013 but recovers rapidly toward its potential. The shape of recovery is consistent with those of the five previous recessions (1964, 1985, 1998, 2001, and 2009), which lasted only one year and were followed by very strong recoveries. However in terms of GDP decline (equivalent to two Asian crises), the shock is unprecedented in Singapore and equivalent to a deviation from the baseline of about two standard deviations.2
The second adverse scenario is a more protracted one, lasting three years. GDP growth in Singapore declines to-2.5 percent in 2013, -1.8 percent in 2014, and -1.7 percent in 2015.This implies a cumulative deviation from the baseline of about four standard deviations for 2013–15. Again, this scenario is unprecedented in Singapore. Under this scenario, domestic interest rates increase by 200 bps in the 201315 period.
MAS simulated paths for other variables, including growth in five key sectors in Singapore, unemployment in Singapore and four other countries, property prices in Singapore and five other relevant countries, 14 bilateral exchange rates, commodity prices, key interest rates, and sovereign yields3 and swap rate curves (11 maturities) in Singapore dollars, U.S. dollars, and euros.
A single shock in the G-RAM cannot produce such adverse scenarios.4 The scenarios thus combine several shocks: a strong intensification of the euro area crisis, together with a marked slowdown in China and in other EMs (see RAM).
______________________________________ 1These are: Malaysia, Thailand, Indonesia, India, S. Korea, Taiwan, China, Hong Kong, Australia, Japan, U.S., eurozone, and U.K. 2Standard deviation is calculated using yearly growth over the last five decades. 3 Sovereign haircuts to be used under the adverse scenarios are included in Table 6. 4 For example, the G-RAM assumes that the intensification of the Euro area crisis shock would reduce the world growth by 1.22 percentage points from the baseline in 2013. Using the elasticity of 1.8, this implies 2.2 percentage point deviation from the baseline in Singapore or a growth rate of 0.7 percent. The first scenario assumes a deviation of 7.3 percentage points from the baseline.
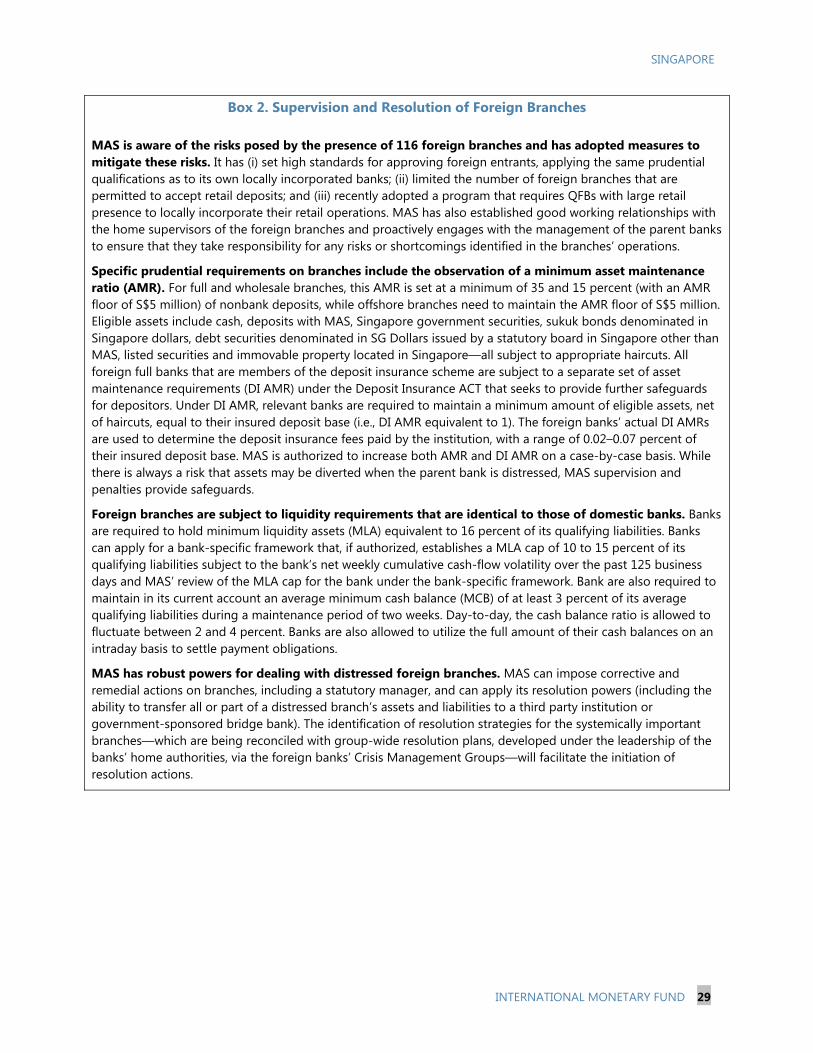
SINGAPORE
INTERNATIONAL MONETARY FUND 29
Box 2. Supervision and Resolution of Foreign Branches
MAS is aware of the risks posed by the presence of 116 foreign branches and has adopted measures to mitigate these risks. It has (i) set high standards for approving foreign entrants, applying the same prudential qualifications as to its own locally incorporated banks; (ii) limited the number of foreign branches that are permitted to accept retail deposits; and (iii) recently adopted a program that requires QFBs with large retail presence to locally incorporate their retail operations. MAS has also established good working relationships with the home supervisors of the foreign branches and proactively engages with the management of the parent banks to ensure that they take responsibility for any risks or shortcomings identified in the branches’ operations.
Specific prudential requirements on branches include the observation of a minimum asset maintenance ratio (AMR). For full and wholesale branches, this AMR is set at a minimum of 35 and 15 percent (with an AMR floor of S$5 million) of nonbank deposits, while offshore branches need to maintain the AMR floor of S$5 million. Eligible assets include cash, deposits with MAS, Singapore government securities, sukuk bonds denominated in Singapore dollars, debt securities denominated in SG Dollars issued by a statutory board in Singapore other than MAS, listed securities and immovable property located in Singapore—all subject to appropriate haircuts. All foreign full banks that are members of the deposit insurance scheme are subject to a separate set of asset maintenance requirements (DI AMR) under the Deposit Insurance ACT that seeks to provide further safeguards for depositors. Under DI AMR, relevant banks are required to maintain a minimum amount of eligible assets, net of haircuts, equal to their insured deposit base (i.e., DI AMR equivalent to 1). The foreign banks’ actual DI AMRs are used to determine the deposit insurance fees paid by the institution, with a range of 0.02–0.07 percent of their insured deposit base. MAS is authorized to increase both AMR and DI AMR on a case-by-case basis. While there is always a risk that assets may be diverted when the parent bank is distressed, MAS supervision and penalties provide safeguards.
Foreign branches are subject to liquidity requirements that are identical to those of domestic banks. Banks are required to hold minimum liquidity assets (MLA) equivalent to 16 percent of its qualifying liabilities. Banks can apply for a bank-specific framework that, if authorized, establishes a MLA cap of 10 to 15 percent of its qualifying liabilities subject to the bank’s net weekly cumulative cash-flow volatility over the past 125 business days and MAS’ review of the MLA cap for the bank under the bank-specific framework. Bank are also required to maintain in its current account an average minimum cash balance (MCB) of at least 3 percent of its average qualifying liabilities during a maintenance period of two weeks. Day-to-day, the cash balance ratio is allowed to fluctuate between 2 and 4 percent. Banks are also allowed to utilize the full amount of their cash balances on an intraday basis to settle payment obligations.
MAS has robust powers for dealing with distressed foreign branches. MAS can impose corrective and remedial actions on branches, including a statutory manager, and can apply its resolution powers (including the ability to transfer all or part of a distressed branch’s assets and liabilities to a third party institution or government-sponsored bridge bank). The identification of resolution strategies for the systemically important branches—which are being reconciled with group-wide resolution plans, developed under the leadership of the banks’ home authorities, via the foreign banks’ Crisis Management Groups—will facilitate the initiation of resolution actions.

SINGAPORE
30 INTERNATIONAL MONETARY FUND
Box 3. Stress Tests of the Insurance Sector
MAS requires all licensed direct insurance companies to perform stress tests as part of annual regulatory filings. Scenarios are prescribed by MAS, but companies must also construct a stress-to-failure scenario. The macroeconomic scenario prescribed by MAS implies that some life insurers would need to reduce the amounts set aside for bonus distributions to their policyholders and, in a few cases, raise more capital. MAS also assesses the capacity of companies to withstand “insurance-related” shocks. A flu epidemic would cause a few life insurers to fall below the statutory minimum capital requirement; and the default of a reinsurance company would have a severe impact on some insurers.
For the FSAP, MAS prescribed the scenarios shown below. These were applied to the four largest life insurance companies, which account for 80 percent of the total insurance fund assets in Singapore. The financial situation of each company under the various scenarios was then compared with a hurdle rate of 100 percent of the statutory minimum capital requirements.
Over a one-year risk horizon, no company fell below the 100 percent hurdle rate, although the results for two companies indicated that they would be heavily impacted by the scenarios. Over a three-year risk horizon, two of the four companies found that their available capital would fall below the minimum specified by the formula if no remedial action were taken in the interval.
Stress Test Scenarios for Insurance Companies1 2013 2014 2015 Equity (percent change of index) -20 to -30 -15 to -20 -15 to -20 Property prices (percent change of index) + 5 to -20 -10 to -20 -10 to -25 Foreign exchange rate +5 to -35 +15 to-15 +15 to -10 Yield curve (bps) +100 to +150 +40 to 0 +40 to 0 Credit spread (bps) Singapore 200 30 25 Investment grade 200 25 25 Non-investment grade 300 75 75
Source: MAS. 1 The stress tests involve setting a series of parameters to shock different aspects of the portfolio. There are detailed parameters for each shock. For example, a stress in 2013 equity prices is computed based on the profile of the portfolio—Singapore exposures (-20 percent), Other Developed Markets exposures (-20 percent) and Emerging Markets exposures (-30 percent).

SINGAPORE
INTERNATIONAL MONETARY FUND 31
Table 2. Singapore: Follow Up on the Recommendations of the 2004 FSAP1
Key Policy
Recommendations Action Taken
1. Macro-prudential monitoring
Further strengthen MAS’ monitoring of: (i) the risks arising from new financial products; (ii) cross-border financial flows (including flows in the ADM and particularly transactions between branches and head offices) to detect potential strains in the offshore banking market; (iii) household and corporate sector balance sheets to assess the resilience of the private sector; and (iv) market and counter-party risks of derivatives activities by financial institutions.
MAS’ Macroeconomic Surveillance Department conducts surveillance of the financial system to identify emerging trends and potential vulnerabilities. It works closely with MAS' supervisory, financial policy, economic policy and markets departments to ensure that macroprudential, microprudential, monetary policy and markets perspectives are all brought to bear on financial stability issues. The above-mentioned departments meet at least once a quarter through a forum called Management Financial Stability Committee (FSC) (FSM) chaired by the MD of MAS. MAS started publishing an annual financial stability review in December 2004.
MAS has supplemented its monitoring of the corporate sector by monitoring higher-frequency data on listed firms (which account for over 90 percent of total corporate assets) and conducting an annual survey of banks' loans to small and medium sized enterprises (SMEs). MAS has also developed its own estimate of the aggregated household balance sheet and stepped up monitoring of indicators for housing loans and credit card borrowing. MAS has been collecting and assessing data on banks' market risk exposures and key counterparties, and conducting more analyses of cross-border financial flows, for example, exposure to and funding from the eurozone. From time to time, departments deliver presentations on new financial products which they come across in the course of their inspection of financial institutions and the risks associated with these products, e.g., structured trade finance. MAS also engages actively with the industry on new products or structures that require regulatory approval or guidance on regulatory treatment, such as permitted structures for capital instruments.
1 Singapore has addressed most of the recommendations made in 2004. MAS continues to review the implementation of recommendations made on the compliance with the Code on Transparency in Monetary Policy, and this is usually discussed with Fund staff in the context of Article IV missions. There is still scope for greater independence of MAS.
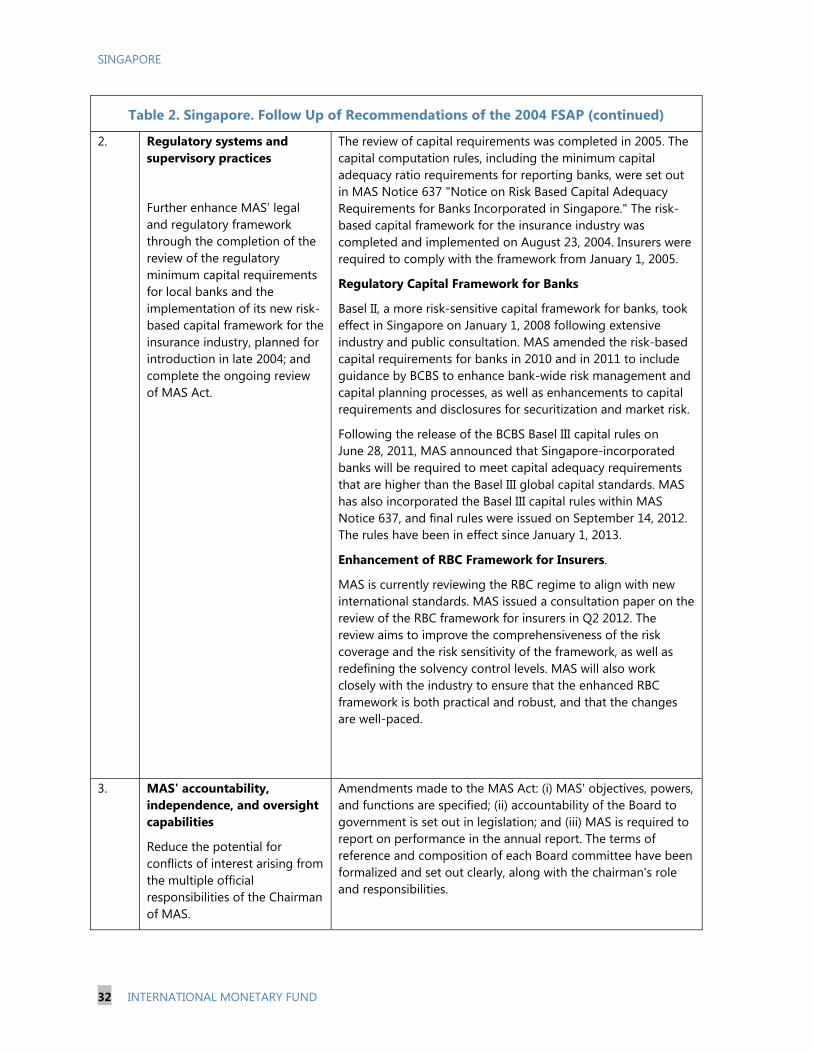
SINGAPORE
32 INTERNATIONAL MONETARY FUND
Table 2. Singapore. Follow Up of Recommendations of the 2004 FSAP (continued)
2. Regulatory systems and supervisory practices
Further enhance MAS’ legal and regulatory framework through the completion of the review of the regulatory minimum capital requirements for local banks and the implementation of its new risk-based capital framework for the insurance industry, planned for introduction in late 2004; and complete the ongoing review of MAS Act.
The review of capital requirements was completed in 2005. The capital computation rules, including the minimum capital adequacy ratio requirements for reporting banks, were set out in MAS Notice 637 "Notice on Risk Based Capital Adequacy Requirements for Banks Incorporated in Singapore." The risk-based capital framework for the insurance industry was completed and implemented on August 23, 2004. Insurers were required to comply with the framework from January 1, 2005.
Regulatory Capital Framework for Banks
Basel II, a more risk-sensitive capital framework for banks, took effect in Singapore on January 1, 2008 following extensive industry and public consultation. MAS amended the risk-based capital requirements for banks in 2010 and in 2011 to include guidance by BCBS to enhance bank-wide risk management and capital planning processes, as well as enhancements to capital requirements and disclosures for securitization and market risk.
Following the release of the BCBS Basel III capital rules on June 28, 2011, MAS announced that Singapore-incorporated banks will be required to meet capital adequacy requirements that are higher than the Basel III global capital standards. MAS has also incorporated the Basel III capital rules within MAS Notice 637, and final rules were issued on September 14, 2012. The rules have been in effect since January 1, 2013.
Enhancement of RBC Framework for Insurers.
MAS is currently reviewing the RBC regime to align with new international standards. MAS issued a consultation paper on the review of the RBC framework for insurers in Q2 2012. The review aims to improve the comprehensiveness of the risk coverage and the risk sensitivity of the framework, as well as redefining the solvency control levels. MAS will also work closely with the industry to ensure that the enhanced RBC framework is both practical and robust, and that the changes are well-paced.
3. MAS' accountability, independence, and oversight capabilities
Reduce the potential for conflicts of interest arising from the multiple official responsibilities of the Chairman of MAS.
Amendments made to the MAS Act: (i) MAS' objectives, powers, and functions are specified; (ii) accountability of the Board to government is set out in legislation; and (iii) MAS is required to report on performance in the annual report. The terms of reference and composition of each Board committee have been formalized and set out clearly, along with the chairman's role and responsibilities.

SINGAPORE
INTERNATIONAL MONETARY FUND 33
Table 2. Singapore: Follow Up of Recommendations of the 2004 FSAP (concluded)
4. Monetary and financial policy transparency
Provide more information on how supervisory actions are taken in line with the risk-based supervisory framework and disclose more information to improve the public’s ability to assess supervisory performance.
MAS has enhanced disclosure on its supervision of financial institutions in its annual financial stability review and through the publication of monographs on “Objectives and Principles of Financial Supervision in Singapore (2004),” and “MAS’ Roles and Responsibilities in Relation to the Securities Clearing and Settlement Systems in Singapore (2004).”
To provide information on how supervisory actions are taken in line with the risk-based supervisory framework, MAS has published monographs on “MAS' Framework for Impact and Risk Assessment of Financial Institutions (2007); “Tenets of Effective Regulation (2010);” and "Supervision of Financial Market Infrastructures" (2013).”
5. Anti-money laundering and combating the financing of terrorism Improve the effectiveness of cross-border mutual legal assistance
In April 2006, the Mutual Assistance in Criminal Matters Act was amended to enable Singapore to provide mutual legal assistance, without the need for a bilateral treaty, as long as the requesting country provides a reciprocity undertaking. The amendment has helped Singapore authorities to accede to more mutual legal assistance requests and FATF’s mutual evaluation conducted in 2007 noted that there was a clear and efficient process for mutual legal assistance (FATF Mutual Evaluation Report of Singapore, February 2008).
The FATF Evaluation was based on the FATF 40+9 Recommendations (and used the 2004 AML/CFT methodology). Singapore obtained 43 Compliant and Largely Compliant ratings. The FATF report is available on the FATF website (www.fatf-gafi-org). In addition, Singapore consented to the publication of the Executive Summary of the report as an IMF/World Bank ROSC (IMF Country report No 09/66). In February 2011, in view of the progress made to strengthen its AML/CFT regime, the FATF moved Singapore from annual regular follow up reporting to biennial reporting. The latest follow-up report noted further progress but also identified deficiencies remaining relating to identifying beneficial owners of companies created in Singapore.

Table 3. Singapore: Financial Sector Structure
2005 2006 2007 2008 2009 2010 2011 2012
NumberTotal
Assets Share NumberTotal
Assets Share NumberTotal
Assets Share NumberTotal
Assets Share NumberTotal
Assets Share NumberTotal
Assets Share NumberTotal
Assets Share NumberTotal
Assets Share
Commercial banks 110 1,262.4 77.8 108 1,363.7 79.3 112 1,651.1 80.5 113 1,749.3 81.8 119 1,658.4 79.3 120 1,766.1 78.6 121 1,892.4 79.0 123 1,956.3 77.8 Local Banks 5 313.6 19.3 5 354.7 20.6 6 416.1 20.3 6 454.6 21.2 6 468.0 22.4 6 538.9 24.0 6 592.7 24.7 6 615.5 24.5 Foreign Banks 105 948.8 58.4 103 1,008.9 58.7 106 1,235.0 60.2 107 1,294.7 60.5 113 1,190.4 56.9 114 1,227.1 54.6 115 1,299.8 54.3 117 1,340.8 53.3 Qualifying Full Banks 6 215.0 13.2 6 210.4 12.2 6 227.8 11.1 7 260.2 12.2 7 234.9 11.2 8 291.7 13.0 8 325.5 13.6 10 372.7 14.8 Other Full Banks 18 150.5 9.3 18 209.9 12.2 18 232.0 11.3 18 296.9 13.9 18 281.2 13.4 18 305.1 13.6 18 342.1 14.3 17 341.2 13.6 Offshore Banks 46 209.5 12.9 44 182.7 10.6 42 201.7 9.8 40 201.8 9.4 42 174.3 8.3 38 145.7 6.5 39 135.1 5.6 37 145.3 5.8 Wholesale Banks 35 373.8 23.0 35 405.9 23.6 40 573.5 28.0 42 535.8 25.0 46 500.0 23.9 50 484.6 21.6 50 497.1 20.8 53 481.6 19.2
Merchant Banks 47 64.8 4.0 49 78.0 4.5 50 89.1 4.3 50 72.6 3.4 47 76.4 3.6 46 89.8 4.0 47 87.9 3.7 42 92.4 3.7
Finance Companies 3 9.4 0.6 3 10.1 0.6 3 12.8 0.6 3 12.6 0.6 3 11.7 0.6 3 11.5 0.5 3 12.2 0.5 3 15.0 0.6
Insurance Companies 144 97.4 6.0 146 107.8 6.3 147 122.1 6.0 154 110.3 5.2 154 130.3 6.2 150 142.6 6.3 156 152.4 6.4 159 165.6 6.6 Direct Insurers 57 89.9 5.5 58 100.1 5.8 60 113.1 5.5 62 100.6 4.7 64 119.3 5.7 63 130.5 5.8 66 135.7 5.7 70 149.2 5.9 Life Insurers 8 10.9 0.7 11 12.6 0.7 12 36.6 1.8 13 34.6 1.6 13 40.2 1.9 11 37.2 1.7 12 59.3 2.5 14 66.0 2.6 General Insurers 42 5.2 0.3 41 5.7 0.3 43 6.3 0.3 44 6.6 0.3 46 7.1 0.3 46 7.9 0.4 48 12.0 0.5 51 11.4 0.5 Composite Insurers 7 73.8 4.5 6 81.8 4.8 5 70.2 3.4 5 59.4 2.8 5 72.0 3.4 6 85.4 3.8 6 64.4 2.7 5 71.8 2.9 Reinsurers 27 5.5 0.3 28 6.0 0.3 25 7.1 0.3 28 7.8 0.4 27 8.8 0.4 27 9.6 0.4 29 13.9 0.6 28 13.4 0.5 Captive insurers 60 2.0 0.1 60 1.7 0.1 62 1.9 0.1 64 1.9 0.1 63 2.2 0.1 60 2.5 0.1 61 2.8 0.1 61 3.0 0.1
Insurance Brokers 62 0.7 0.0 63 0.8 0.0 64 1.0 0.0 66 1.1 0.1 63 1.1 0.1 63 1.2 0.1 65 1.5 0.1 69 1.8 0.1
Central Provident Fund 1 121.6 7.5 1 127.7 7.4 1 138.5 6.8 1 153.4 7.2 1 169.1 8.1 1 188.2 8.4 1 210.0 8.8 1 232.7 9.3
Holders of CMS license 172 66.9 4.1 179 31.5 1.8 203 35.0 1.7 224 39.8 1.9 223 44.5 2.1 251 46.4 2.1 251 37.6 1.6 273 49.3 2.0 Dealing in securities 41 55.5 3.4 42 18.0 1.0 51 20.6 1.0 53 20.8 1.0 56 28.2 1.3 58 31.9 1.4 58 29.5 1.2 57 34.6 1.4 SGX-ST members 22 9.6 0.6 21 15.8 0.9 22 17.0 0.8 23 15.2 0.7 21 19.0 0.9 24 20.8 0.9 26 19.2 0.8 24 21.0 0.8 SGX-ST non-members 19 45.9 2.8 21 2.2 0.1 29 3.6 0.2 30 5.6 0.3 35 9.2 0.4 34 11.1 0.5 32 10.3 0.4 33 13.5 0.5 Trading in Futures Contracts 21 7.2 0.4 20 9.3 0.5 21 9.8 0.5 24 11.6 0.5 21 9.2 0.4 22 7.7 0.3 20 7.9 0.3 18 7.2 0.3 Fund Management 83 3.7 0.2 89 3.2 0.2 100 4.3 0.2 107 6.8 0.3 104 6.4 0.3 112 5.3 0.2 111 7.6 0.3 132 5.6 0.2 Others 1/ 27 0.5 0.0 28 1.0 0.1 31 0.3 0.0 40 0.6 0.0 42 0.7 0.0 59 1.4 0.1 62 1.7 0.1 66 2.0 0.1
Holders of Financial Advisers' Licenses 59 0.1 0.0 65 0.3 0.0 69 0.4 0.0 71 0.3 0.0 70 0.3 0.0 68 0.3 0.0 65 0.3 0.0 62 0.3 0.0
Licensed Trust Companies 2/ 24 0.1 0.0 35 0.2 0.0 38 0.2 0.0 40 0.2 0.0 48 0.3 0.0 50 0.3 0.0 51 0.3 0.0
Total 598 1,623.4 100.0 638 1,720.0 100.0 684 2,050.2 100.0 720 2,139.6 100.0 720 2,092.0 100.0 750 2,246.3 100.0 759 2,394.6 100.0 783 2,513.8 100.0
Source: MAS. 1/ Other CMS licensees comprise companies conducting the following main regulated activity: REITs management, advising on corporate financing, leveraged forex trading, providing custodial services and securities financing. 2/ Trust Companies Act was only effected in 2006. As such, 2005 columns are not applicable.
(in billions of Singapore dollars)
SING
APORE
34 IN
TERNATIO
NAL M
ON
ETARY FUN
D
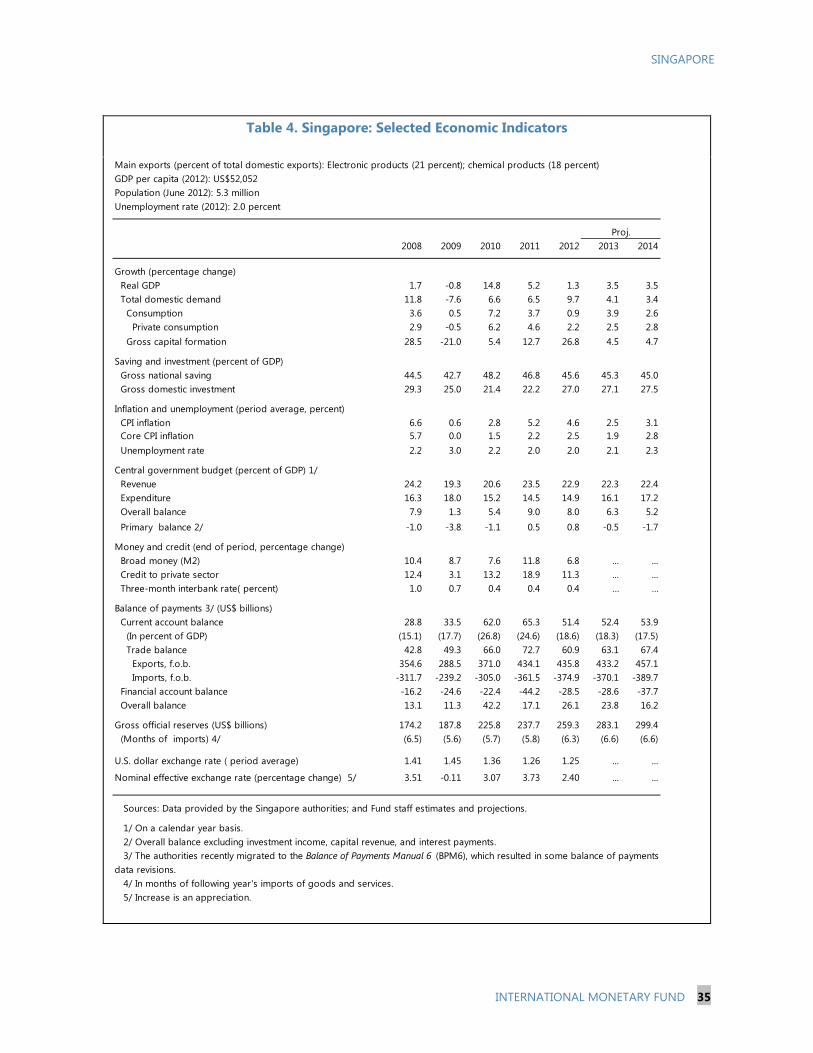
SINGAPORE
INTERNATIONAL MONETARY FUND 35
Table 4. Singapore: Selected Economic Indicators
Main exports (percent of total domestic exports): Electronic products (21 percent); chemical products (18 percent)
Population (June 2012): 5.3 million Unemployment rate (2012): 2.0 percent
2008 2009 2010 2011 2012 2013 2014
Growth (percentage change) Real GDP 1.7 -0.8 14.8 5.2 1.3 3.5 3.5 Total domestic demand 11.8 -7.6 6.6 6.5 9.7 4.1 3.4 Consumption 3.6 0.5 7.2 3.7 0.9 3.9 2.6 Private consumption 2.9 -0.5 6.2 4.6 2.2 2.5 2.8 Gross capital formation 28.5 -21.0 5.4 12.7 26.8 4.5 4.7
Saving and investment (percent of GDP) Gross national saving 44.5 42.7 48.2 46.8 45.6 45.3 45.0 Gross domestic investment 29.3 25.0 21.4 22.2 27.0 27.1 27.5
Inflation and unemployment (period average, percent) CPI inflation 6.6 0.6 2.8 5.2 4.6 2.5 3.1 Core CPI inflation 5.7 0.0 1.5 2.2 2.5 1.9 2.8 Unemployment rate 2.2 3.0 2.2 2.0 2.0 2.1 2.3
Central government budget (percent of GDP) 1/ Revenue 24.2 19.3 20.6 23.5 22.9 22.3 22.4 Expenditure 16.3 18.0 15.2 14.5 14.9 16.1 17.2 Overall balance 7.9 1.3 5.4 9.0 8.0 6.3 5.2 Primary balance 2/ -1.0 -3.8 -1.1 0.5 0.8 -0.5 -1.7
Money and credit (end of period, percentage change) Broad money (M2) 10.4 8.7 7.6 11.8 6.8 ... ... Credit to private sector 12.4 3.1 13.2 18.9 11.3 ... ... Three-month interbank rate( percent) 1.0 0.7 0.4 0.4 0.4 … …
Balance of payments 3/ (US$ billions) Current account balance 28.8 33.5 62.0 65.3 51.4 52.4 53.9 (In percent of GDP) (15.1) (17.7) (26.8) (24.6) (18.6) (18.3) (17.5) Trade balance 42.8 49.3 66.0 72.7 60.9 63.1 67.4 Exports, f.o.b. 354.6 288.5 371.0 434.1 435.8 433.2 457.1 Imports, f.o.b. -311.7 -239.2 -305.0 -361.5 -374.9 -370.1 -389.7 Financial account balance -16.2 -24.6 -22.4 -44.2 -28.5 -28.6 -37.7 Overall balance 13.1 11.3 42.2 17.1 26.1 23.8 16.2
Gross official reserves (US$ billions) 174.2 187.8 225.8 237.7 259.3 283.1 299.4 (Months of imports) 4/ (6.5) (5.6) (5.7) (5.8) (6.3) (6.6) (6.6)
U.S. dollar exchange rate ( period average) 1.41 1.45 1.36 1.26 1.25 ... ...
Nominal effective exchange rate (percentage change) 5/ 3.51 -0.11 3.07 3.73 2.40 ... ...
Sources: Data provided by the Singapore authorities; and Fund staff estimates and projections.
1/ On a calendar year basis. 2/ Overall balance excluding investment income, capital revenue, and interest payments.
data revisions. 4/ In months of following year's imports of goods and services. 5/ Increase is an appreciation.
3/ The authorities recently migrated to the Balance of Payments Manual 6 (BPM6), which resulted in some balance of payments
GDP per capita (2012): US$52,052
Proj.

SINGAPORE
36 INTERNATIONAL MONETARY FUND
Table 5. Singapore: Financial Soundness Indicators (Local Banks’ Global Operations)
2009 2010 2011 2012 Q1 2013
Regulatory Capital to Risk-Weighted Assets 17.3 18.6 16.0 18.1 16.9
Regulatory Tier I Capital to Risk-Weighted Assets
14.1 15.5 13.5 14.9 14.2
Shareholders’ Funds to Total Asset 1/ 9.9 9.5 8.7 9.2 8.9
Non-Bank NPLs to Non-Bank Loans 2.4 1.6 1.2 1.2 1.1
Total Provisions to Non-Bank NPLs 90.8 110.9 125.5 128.3 133.7
Specific Provisions to Non-Bank NPLs 40.0 40.5 39.3 41.8 39.9
Bank Loans 14.1 12.2 13.3 12.7 13.6
Non-Bank loans 85.9 87.8 86.7 87.3 86.4
Manufacturing 8.3 8.1 8.1 7.9 8.9
Building & Construction 12.4 12.0 12.1 12.6 12.9
Housing 22.2 23.2 20.7 22.0 21.3
Professionals & Private Individuals 8.7 8.6 8.3 8.8 8.6
Non-Bank Financial Institutions 11.2 11.7 10.7 10.7 8.9
ROA (Simple Average) 1.1 1.2 1.0 1.1 1.1
ROE (Simple Average) 10.8 12.2 11.1 12.0 11.8
Net Interest Margin (Simple Average) 2.2 2.0 1.9 1.8 1.7
Non-Interest Income to Total Income 34.9 40.6 37.3 43.6 42.6
Liquid DBU Assets to Total DBU Assets 10.3 9.3 9.9 9.7 9.9
Liquid DBU Assets to Total DBU Liabilities 11.2 10.1 10.7 10.5 10.7
Source: MAS
1/ Figures include assets of Great Eastern Holdings.2/ Liquidity indicators are for Singapore's banking system.
Liquidity (percent)2/
Capital Adequacy (percent)
Asset Quality (percent)
Loan concentration (percent of total loans)
Of which to (percent of total loans):
Profitability (percent)

Table 6. Singapore: Treatment of Sovereign Risk in Stress Tests
Source: staff estimates.
Country
Using 90th
percentile of
historical daily
distribution of changes in
govt bond yields
Using 95th
percentile of
historical daily
distribution of changes in
govt bond yields
Using 99th
percentile of
historical daily distribution
of changes in govt bond
yields
Using largest peak-to-
trough yield movements
in the 2008 global
financial crisis and the
Eurozone debt crisis
Equivalent haircut for a 5-
year bond
Singapore 0.05 0.08 0.14 1.60 8.00
USA 0.08 0.10 0.16 2.05 10.00
Eurozone AAA-rated 0.06 0.09 0.15 2.35 12.00
S. Korea 0.06 0.09 0.17 2.36 12.00
China 0.02 0.04 0.10 1.08 5.00
India 0.06 0.09 0.19 1.18 6.00
Hong Kong 0.06 0.09 0.16 2.09 10.00
Indonesia 0.08 0.14 0.50 6.45 32.00
Malaysia 0.02 0.04 0.10 2.18 11.00
Thailand 0.04 0.06 0.12 2.08 10.00
Phil ippines 0.05 0.16 0.55 3.30 17.00
Japan 0.03 0.04 0.06 0.64 3.00
UK 0.07 0.09 0.15 2.68 13.00
Australia 0.09 0.13 0.20 2.28 11.00
Greece 0.14 0.24 0.61 8.37 42.00
Ireland 0.11 0.20 0.51 14.59 73.00
Italy 0.08 0.13 0.24 4.19 21.00
Portugal 0.12 0.16 0.30 12.67 63.00
Spain 0.08 0.12 0.25 4.40 22.00
Historical percentiles of changes in yie lds used in other FSAPs Singapore FSAP
in percent
SING
APORE
INTERN
ATION
AL MO
NETARY FU
ND
37
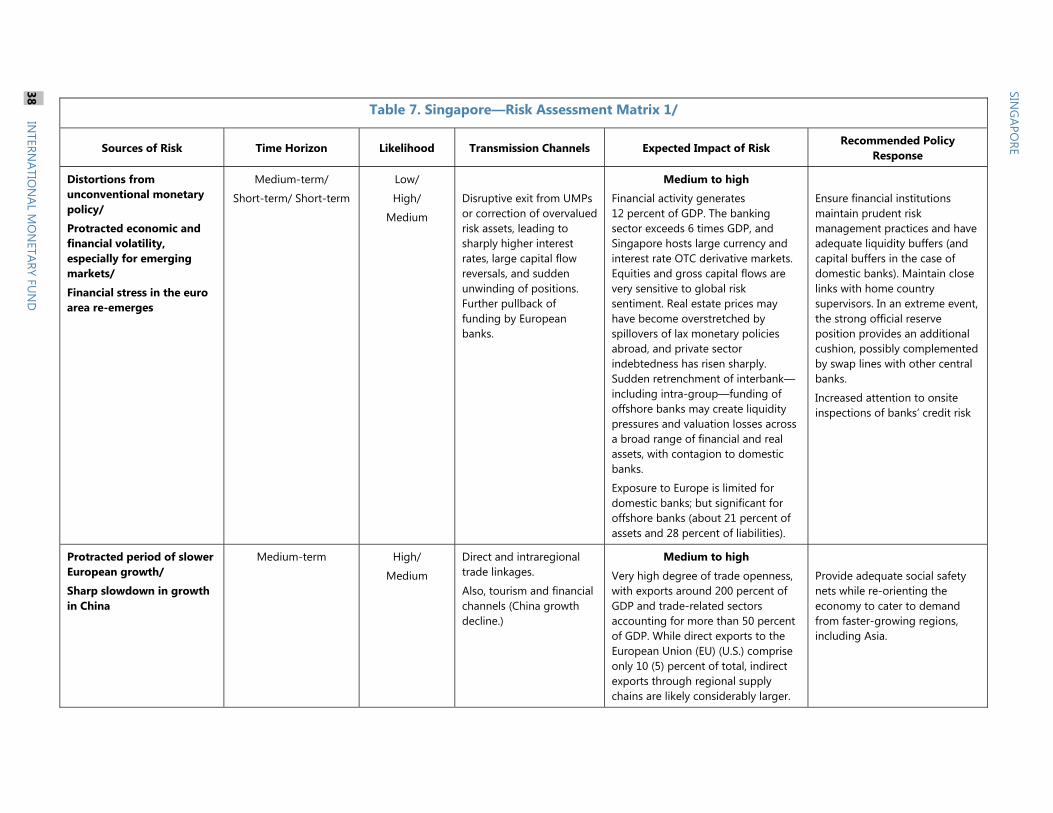
Table 7. Singapore—Risk Assessment Matrix 1/
Sources of Risk Time Horizon Likelihood Transmission Channels Expected Impact of Risk Recommended Policy
Response
Distortions from unconventional monetary policy/
Protracted economic and financial volatility, especially for emerging markets/
Financial stress in the euro area re-emerges
Medium-term/
Short-term/ Short-term
Low/
High/
Medium
Disruptive exit from UMPs or correction of overvalued risk assets, leading to sharply higher interest rates, large capital flow reversals, and sudden unwinding of positions. Further pullback of funding by European banks.
Medium to high
Financial activity generates 12 percent of GDP. The banking sector exceeds 6 times GDP, and Singapore hosts large currency and interest rate OTC derivative markets. Equities and gross capital flows are very sensitive to global risk sentiment. Real estate prices may have become overstretched by spillovers of lax monetary policies abroad, and private sector indebtedness has risen sharply. Sudden retrenchment of interbank—including intragroup—funding of offshore banks may create liquidity pressures and valuation losses across a broad range of financial and real assets, with contagion to domestic banks.
Exposure to Europe is limited for domestic banks; but significant for offshore banks (about 21 percent of assets and 28 percent of liabilities).
Ensure financial institutions maintain prudent risk management practices and have adequate liquidity buffers (and capital buffers in the case of domestic banks). Maintain close links with home country supervisors. In an extreme event, the strong official reserve position provides an additional cushion, possibly complemented by swap lines with other central banks.
Increased attention to onsite inspections of banks’ credit risk
Protracted period of slower European growth/
Sharp slowdown in growth in China
Medium-term High/
Medium
Direct and intraregional trade linkages.
Also, tourism and financial channels (China growth decline.)
Medium to high
Very high degree of trade openness, with exports around 200 percent of GDP and traderelated sectors accounting for more than 50 percent of GDP. While direct exports to the European Union (EU) (U.S.) comprise only 10 (5) percent of total, indirect exports through regional supply chains are likely considerably larger.
Provide adequate social safety nets while reorienting the economy to cater to demand from faster-growing regions, including Asia.
SING
APORE
38 IN
TERNATIO
NAL M
ON
ETARY FUN
D

Table 7. Singapore—Risk Assessment Matrix (continued)
China is a key link in the regional supply chain, but Singapore’s exports are not very sensitive to Chinese domestic demand. China is the second largest source of tourists. Domestic banks’ lending to Chinese corporates has grown, but amounts are relatively modest.
Failure of a foreign parent bank
Medium-term Low
The parent banks owing the largest branches (HSBC, Citibank and Standard Chartered) appear solvent. However, given that there are 116 foreign branches, it is difficult to generalize that this risk is low in all cases.
Low to Medium
Spill-over risks are high: Branches of foreign banks are closely connected with the domestic banking system. Foreign banks represent about 50 percent of total Domestic Banking Unit (DBU) assets.
Further facilitate cross-border cooperation in bank resolution.
A fall in real estate prices of about 55 percent in 3 years
ShortMedium term High
Real estate prices are already past their 2008 peak before the last market correction. The authorities have been very active in implementing corrective measures.
Medium to High
About 40 percent of bank loans are to the housing, building and construction sectors.
Consider subjecting loans for owner-occupied housing to a limit to be set by MAS. Encourage over-extended households to reduce their leverage. Stand ready to adjust macroprudential measures in the housing market in line with changes in market conditions.
SING
APORE
INTERN
ATION
ALM
ON
ETARYFU
ND
39
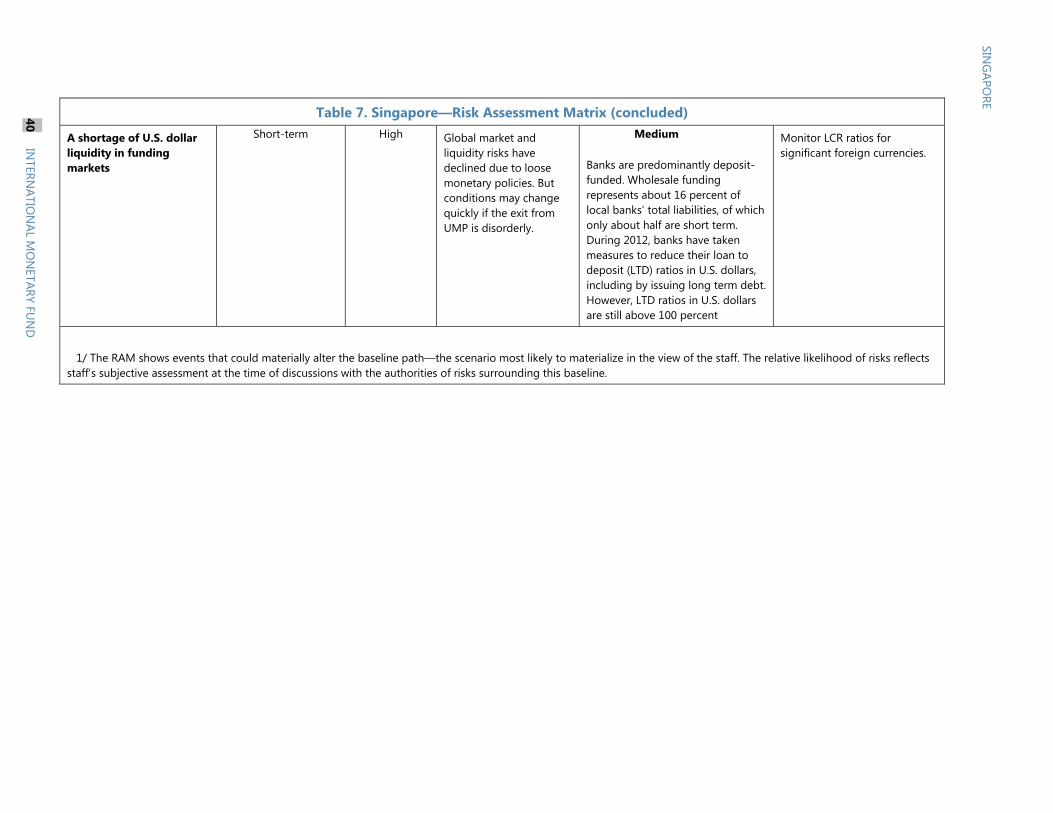
Table 7. Singapore—Risk Assessment Matrix (concluded)
A shortage of U.S. dollar liquidity in funding markets
Short-term High
Global market and liquidity risks have declined due to loose monetary policies. But conditions may change quickly if the exit from UMP is disorderly.
Medium
Banks are predominantly deposit-funded. Wholesale funding represents about 16 percent of local banks’ total liabilities, of which only about half are short term. During 2012, banks have taken measures to reduce their loan to deposit (LTD) ratios in U.S. dollars, including by issuing long term debt. However, LTD ratios in U.S. dollars are still above 100 percent
Monitor LCR ratios for significant foreign currencies.
1/ The RAM shows events that could materially alter the baseline path—the scenario most likely to materialize in the view of the staff. The relative likelihood of risks reflects staff’s subjective assessment at the time of discussions with the authorities of risks surrounding this baseline.
SING
APORE 40
INTERN
ATION
AL MO
NETARY FU
ND
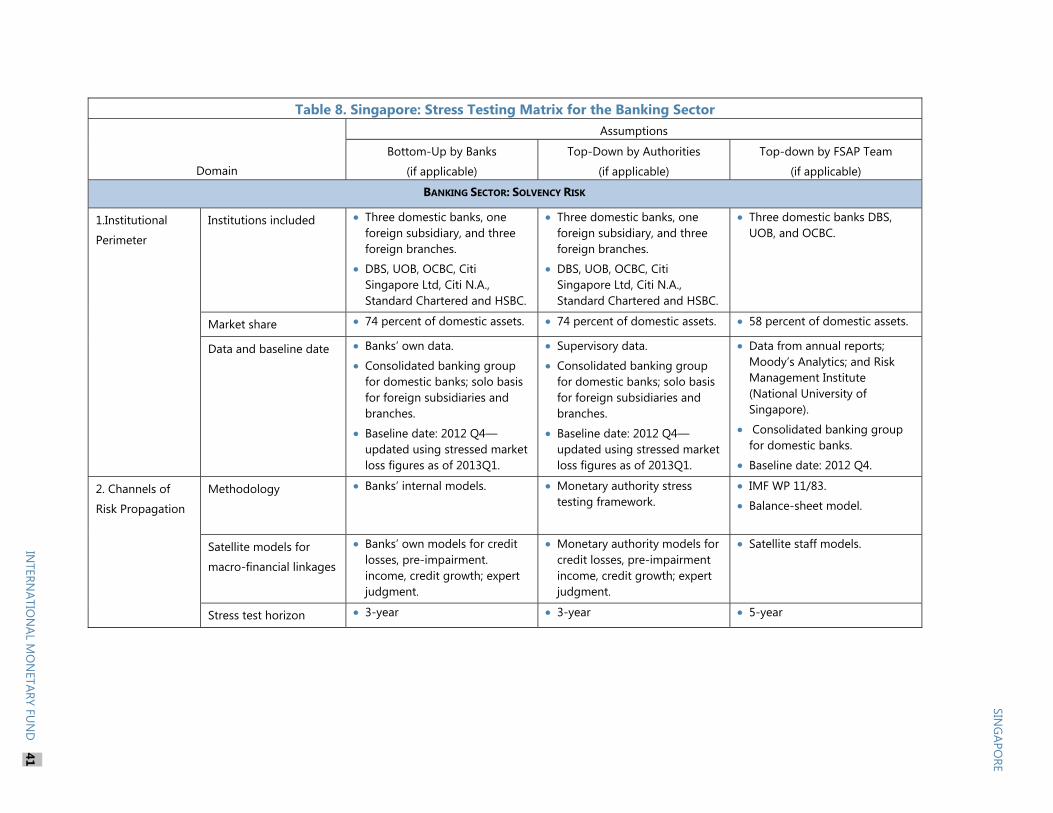
Table 8. Singapore: Stress Testing Matrix for the Banking Sector
Domain
Assumptions
Bottom-Up by Banks
(if applicable)
Top-Down by Authorities
(if applicable)
Top-down by FSAP Team
(if applicable)
BANKING SECTOR: SOLVENCY RISK
1.Institutional
Perimeter
Institutions included Three domestic banks, one foreign subsidiary, and three foreign branches.
DBS, UOB, OCBC, Citi Singapore Ltd, Citi N.A., Standard Chartered and HSBC.
Three domestic banks, one foreign subsidiary, and three foreign branches.
DBS, UOB, OCBC, Citi Singapore Ltd, Citi N.A., Standard Chartered and HSBC.
Three domestic banks DBS, UOB, and OCBC.
Market share 74 percent of domestic assets. 74 percent of domestic assets. 58 percent of domestic assets.
Data and baseline date Banks’ own data.
Consolidated banking group for domestic banks; solo basis for foreign subsidiaries and branches.
Baseline date: 2012 Q4—updated using stressed market loss figures as of 2013Q1.
Supervisory data.
Consolidated banking group for domestic banks; solo basis for foreign subsidiaries and branches.
Baseline date: 2012 Q4—updated using stressed market loss figures as of 2013Q1.
Data from annual reports; Moody’s Analytics; and Risk Management Institute (National University of Singapore).
Consolidated banking group for domestic banks.
Baseline date: 2012 Q4.
2. Channels of
Risk Propagation
Methodology Banks’ internal models. Monetary authority stress testing framework.
IMF WP 11/83.
Balance-sheet model.
Satellite models for
macro-financial linkages
Banks’ own models for credit losses, pre-impairment. income, credit growth; expert judgment.
Monetary authority models for credit losses, pre-impairment income, credit growth; expert judgment.
Satellite staff models.
Stress test horizon 3-year 3-year 5-year
SING
APORE
INTERN
ATION
AL MO
NETARY FU
ND
41
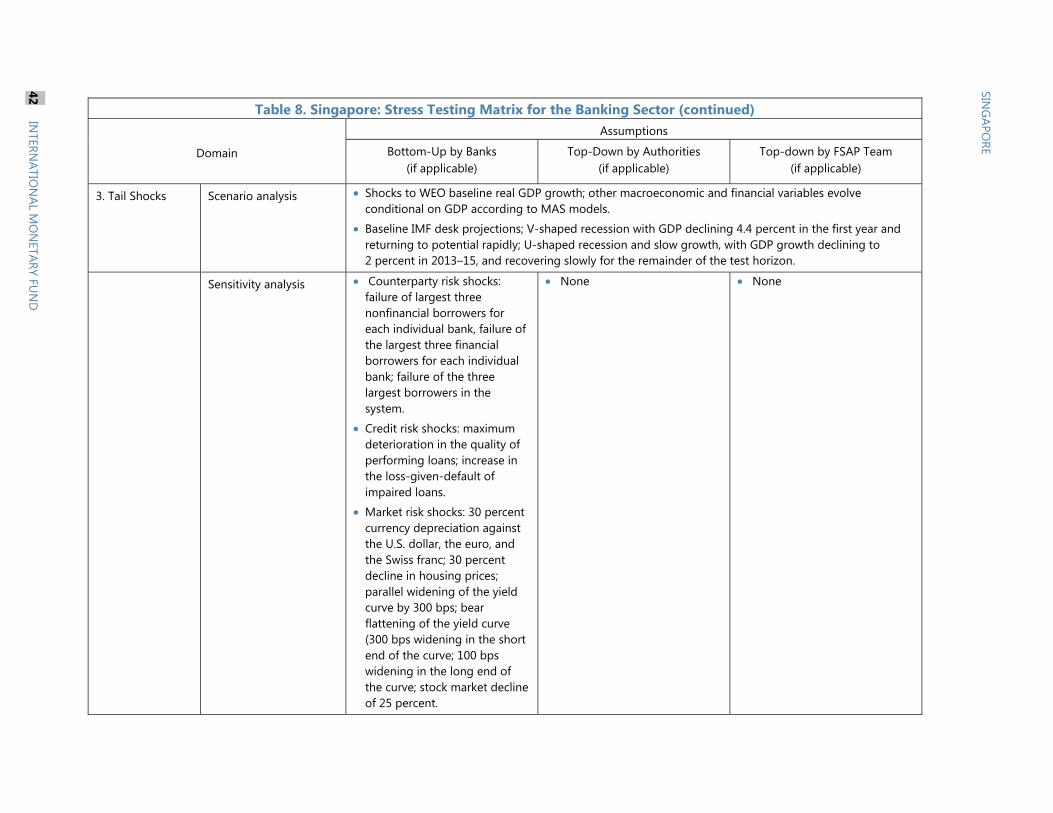
Table 8. Singapore: Stress Testing Matrix for the Banking Sector (continued)
Domain
Assumptions
Bottom-Up by Banks (if applicable)
Top-Down by Authorities (if applicable)
Top-down by FSAP Team (if applicable)
3. Tail Shocks Scenario analysis Shocks to WEO baseline real GDP growth; other macroeconomic and financial variables evolve conditional on GDP according to MAS models.
Baseline IMF desk projections; V-shaped recession with GDP declining 4.4 percent in the first year and returning to potential rapidly; U-shaped recession and slow growth, with GDP growth declining to 2 percent in 2013–15, and recovering slowly for the remainder of the test horizon.
Sensitivity analysis
Counterparty risk shocks: failure of largest three nonfinancial borrowers for each individual bank, failure of the largest three financial borrowers for each individual bank; failure of the three largest borrowers in the system.
Credit risk shocks: maximum deterioration in the quality of performing loans; increase in the loss-given-default of impaired loans.
Market risk shocks: 30 percent currency depreciation against the U.S. dollar, the euro, and the Swiss franc; 30 percent decline in housing prices; parallel widening of the yield curve by 300 bps; bear flattening of the yield curve (300 bps widening in the short end of the curve; 100 bps widening in the long end of the curve; stock market decline of 25 percent.
None
None
SING
APORE
42 IN
TERNATIO
NAL M
ON
ETARY FUN
D

Table 8. Singapore: Stress Testing Matrix for the Banking Sector (continued)
Domain
Assumptions
Bottom-Up by Banks (if applicable)
Top-Down by Authorities (if applicable)
Top-down by FSAP Team (if applicable)
4. Risks and Buffers
Risks/factors assessed (how each element is derived, assumptions)
Credit losses based on banks’ own satellite models and/or expert judgment.
Profit based on banks’ own satellite models and/or expert judgment.
Trading income based on banks’ own satellite models; same valuation methodology applied to assets in the trading book and those available for sale in the banking book.
Losses on sovereign bond holdings based on peak-to-trough sovereign yield movements experienced in the 2008 global financial crisis and the Eurozone debt crisis.
Funding costs based on banks’ own asset/liability management models; all short-term debt and outstanding floating rate debt funded at the new funding rate.
Credit losses based on authorities’ satellite models.
Profits based on authorities’ satellite model.
Trading income based on banks’ own satellite model.
Funding costs based on authorities’ satellite model.
Credit losses based on staff projections of PDs (point-in-time) and assuming a constant LGD (point in time) and IMF TD model.
Net income based on staff’s satellite model.
SING
APORE
INTERN
ATION
AL MO
NETARY FU
ND
43
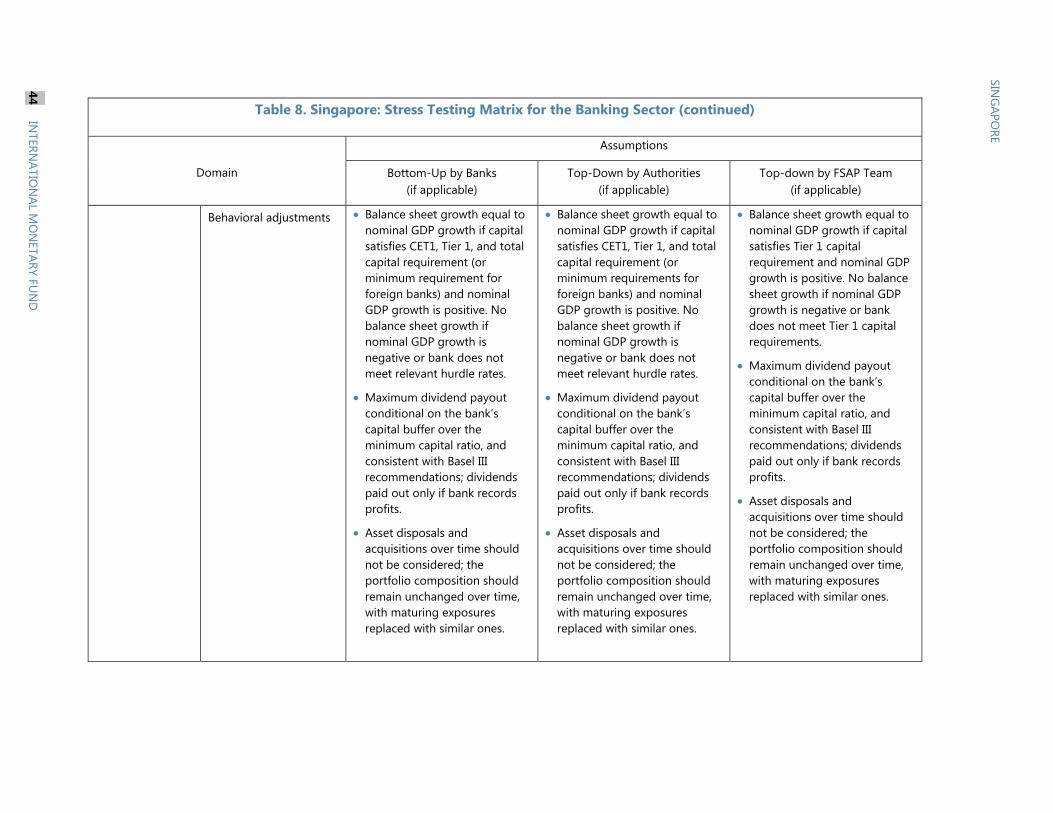
Table 8. Singapore: Stress Testing Matrix for the Banking Sector (continued)
Domain
Assumptions
Bottom-Up by Banks (if applicable)
Top-Down by Authorities (if applicable)
Top-down by FSAP Team (if applicable)
Behavioral adjustments
Balance sheet growth equal to nominal GDP growth if capital satisfies CET1, Tier 1, and total capital requirement (or minimum requirement for foreign banks) and nominal GDP growth is positive. No balance sheet growth if nominal GDP growth is negative or bank does not meet relevant hurdle rates.
Maximum dividend payout conditional on the bank’s capital buffer over the minimum capital ratio, and consistent with Basel III recommendations; dividends paid out only if bank records profits.
Asset disposals and acquisitions over time should not be considered; the portfolio composition should remain unchanged over time, with maturing exposures replaced with similar ones.
Balance sheet growth equal to nominal GDP growth if capital satisfies CET1, Tier 1, and total capital requirement (or minimum requirements for foreign banks) and nominal GDP growth is positive. No balance sheet growth if nominal GDP growth is negative or bank does not meet relevant hurdle rates.
Maximum dividend payout conditional on the bank’s capital buffer over the minimum capital ratio, and consistent with Basel III recommendations; dividends paid out only if bank records profits.
Asset disposals and acquisitions over time should not be considered; the portfolio composition should remain unchanged over time, with maturing exposures replaced with similar ones.
Balance sheet growth equal to nominal GDP growth if capital satisfies Tier 1 capital requirement and nominal GDP growth is positive. No balance sheet growth if nominal GDP growth is negative or bank does not meet Tier 1 capital requirements.
Maximum dividend payout conditional on the bank’s capital buffer over the minimum capital ratio, and consistent with Basel III recommendations; dividends paid out only if bank records profits.
Asset disposals and acquisitions over time should not be considered; the portfolio composition should remain unchanged over time, with maturing exposures replaced with similar ones.
SING
APORE
44 IN
TERNATIO
NAL M
ON
ETARY FUN
D

Table 8. Singapore: Stress Testing Matrix for the Banking Sector (continued)
Domain
Assumptions
Bottom-Up by Banks (if applicable)
Top-Down by Authorities (if applicable)
Top-down by FSAP Team (if applicable)
5. Regulatory and
Market-Based
Standards and
Parameters
Calibration of risk
parameters
PDs and LGDs point-in-time for both credit losses and stressed RWA calculations according to banks’ own models.
Correlations in market risks according to banks’ own models.
PDs and LGDs point-in-time for both credit losses and stressed RWA calculations according to central bank models.
PDs and LGDs point-in-time for both credit losses and stressed RWA calculations; RWA adjustments based on Basel methodology.
Regulatory/accounting
and market-based
standards
Hurdle rate: Basel III schedule, local regulatory requirements and impact measure for foreign banks.
Hurdle rate: Basel III schedule, local regulatory requirements and impact measure for foreign banks.
Hurdle rate: Basel II, Basel III schedulee, and local regulatory requirements.
Capital metrics: Basel III, local regulatory requirements, and impact measures for foreign banks).
CET1, T1, and total CAR.
Capital metrics: Basel III, local regulatory requirements), and impact measure for foreign banks.
CET1, T1, and total CAR.
Capital metrics: : Basel II, Basel III, and local regulatory requirements).
CAR
Changes in RWAs. Changes in RWAs.
Changes in RWAs.
6. Reporting
Format for Results
Output presentation CAR by bank. CAR by bank.
Capital shortfall, system wide, aggregated by authorities.
CAR by bank.
Capital shortfall, system wide.
SING
APORE
INTERN
ATION
AL MO
NETARY FU
ND
45

Table 8. Singapore: Stress Testing Matrix for the Banking Sector (continued)
Domain
Assumptions
Bottom-Up by Banks (if applicable)
Top-Down by Authorities (if applicable)
Top-down by FSAP Team (if applicable)
BANKING SECTOR: LIQUIDITY RISK
1. Institutional Perimeter
Institutions included Three domestic banks, one foreign subsidiary and three foreign branches.
Three domestic banks, one foreign subsidiary and three foreign branches.
N.A.
Market share 74 percent of total sector assets.
74 percent of domestic assets N.A.
Data and baseline date Banks’ own data.
Consolidated banking group for domestic banks; solo basis for foreign subsidiaries and branches.
Banks’ own data.
Consolidated banking group for domestic banks; solo basis for foreign subsidiaries and branches.
N.A.
2. Channels of Risk Propagation
Methodology
Cash-flow mismatch analysis.
Basel III framework for liquidity risk measurement.
N.A.
3.Risks and Buffers
Risks Funding liquidity shock.
Market liquidity shock, affecting haircuts.
Funding liquidity shock.
Market liquidity shock, affecting haircuts.
N.A.
Buffers Counterbalancing capacity provided by liquid assets.
Minimum liquid assets reserves.
Monetary authority facilities.
Counterbalancing capacity provided by liquid assets.
MAS liquidity facilities.
N.A.
SING
APORE
46 IN
TERNATIO
NAL M
ON
ETARY FUN
D

Table 8. Singapore: Stress Testing Matrix for the Banking Sector (continued)
Domain
Assumptions
Bottom-Up by Banks (if applicable)
Top-Down by Authorities (if applicable)
Top-down by FSAP Team (if applicable)
4. Tail Shocks Size of the shock Bank run and dry up of wholesale funding markets, taking into account haircuts to liquid assets.
Idiosyncratic and market-wide shock as described in the Basel LCR rules.
N.A.
5. Regulatory and Market-Based Standards and Parameters
Regulatory standards
Hurdle metrics: liquidity funding gap.
Basel III ratios: LCR, liquidity funding gaps.
Definition of liquidity, e.g., interpretation of Basel III, local regulatory requirements.
N.A.
6. Reporting Format for Results
Output presentation Liquidity gap by bank and by currency, and consolidated across currencies.
LCR based on the January 2013 finalized rules by bank and by currency and consolidated across currencies.
N.A.
BANKING SECTOR: CONTAGION RISK 1.Institutional Perimeter
Institutions included NA 10 banks SGP banking sector (domestic, foreign subsidiaries and branches).
Market share NA 75 percent of domestic interbank borrowing/lending and derivatives exposures
100 percent
Data and baseline date NA Supervisory data, confidential.
Unconsolidated.
Including derivatives valued at adverse scenario prices.
Performed twice: as of Dec 31, 2012 and then updated as of Mar 31, 2013 (by mid-June).
BIS locational statistics, bilateral exposures, confidential.
Banking sector level, unconsolidated.
2012 Q4.
SING
APORE
INTERN
ATION
AL MO
NETARY FU
ND
47

Table 8. Singapore: Stress Testing Matrix for the Banking Sector (concluded)
Domain
Assumptions
Bottom-Up by Banks (if applicable)
Top-Down by Authorities (if applicable)
Top-down by FSAP Team (if applicable)
2. Channels of Risk Propagation
Methodology NA Domestic interbank contagion simulating both pure credit and combined credit and funding shocks scenarios
Cross border Network Analysis (Sole-Espinosa, 2010)
Cross-border banking sector-banking sector balance sheet exposures.
3. Tail shocks Size of the shock NA Pure contagion: default of institutions market closure.
First round plus subsequent round effects.
Pure contagion: default of banking sector, market closure, retrenchment of cross-border claims.
First round plus subsequent round effects.
4. Reporting Format for Results
Output presentation NA Percent of capital base loss, by bank.
Capital shortfall, system-wide by country.
Country that SGP is most exposed/vulnerable to.
SING
APORE
48 IN
TERNATIO
NAL M
ON
ETARY FUN
D

Table 9. Singapore: Solvency Stress Tests: Results and Main Drivers
(In percent unless indicated otherwise) 2012 2013 2014 2015 2016 2017 2013 2014 2015 2016 2017 2013 2014 2015 2016 2017
Current
Bottom-up, MAS
Total capital ratio 1/Minimum 14.3 15.0 14.3 13.5 n.a. n.a. 10.7 11.2 11.4 n.a. n.a. 12.3 12.1 10.1 n.a. n.a.Maximum 27.9 26.5 25.2 23.9 n.a. n.a. 19.5 25.5 25.6 n.a. n.a. 19.2 19.5 20.2 n.a. n.a.
Asset maintenance ratio 2/Minimum 55.7 53.6 53.6 53.6 n.a. n.a. 51.8 51.0 51.4 n.a. n.a. 52.9 51.8 50.0 n.a. n.a.Maximum 64.5 63.8 62.6 61.1 n.a. n.a. 63.4 61.6 59.1 n.a. n.a. 63.6 61.8 59.1 n.a. n.a.
Top-down, MAS
Total capital ratio 1/Minimum 14.3 15.3 15.9 16.6 n.a. n.a. 11.8 10.4 13.2 n.a. n.a. 13.0 11.4 11.0 n.a. n.a.Maximum 27.9 36.4 39.2 42.3 n.a. n.a. 21.5 22.9 36.3 n.a. n.a. 27.3 23.3 25.1 n.a. n.a.
Top-down balance-sheet, FSAP team
Total capital ratio 3/Minimum 15.7 15.5 15.9 15.8 15.8 15.8 10.4 15.7 16.6 15.9 16.6 13.0 12.8 11.9 13.4 13.8Maximum 19.5 20.2 20.7 20.7 20.8 21.1 13.1 20.6 21.8 20.6 21.6 17.1 16.7 15.2 17.0 17.6
Top-down market-based, FSAP team
Total capital ratio 3/Minimum 15.7 11.9 12.3 12.3 12.2 12.2 8.9 12.6 12.5 12.3 12.2 9.7 10.0 10.1 13.0 13.0Maximum 19.5 17.8 18.1 18.1 18.1 18.1 15.2 18.5 18.4 18.1 18.1 15.9 16.2 16.2 18.9 18.8
Risk Drivers 4/
Bottom-up, MASNet profit (before losses) - 1.9 1.8 1.9 n.a. n.a. 1.6 1.6 1.5 n.a. n.a. 1.7 1.7 1.5 n.a. n.a.Credit losses - -0.2 -0.2 -0.2 n.a. n.a. -0.7 -0.8 -0.4 n.a. n.a. -0.6 -0.7 -0.9 n.a. n.a.Overall losses due to market risk - 0.0 0.0 0.0 n.a. n.a. -0.5 -0.4 -0.4 n.a. n.a. -0.4 -0.4 -0.3 n.a. n.a.
of which: sovereign risk - - - - - - -0.2 -0.2 -0.2 n.a. n.a. -0.2 -0.2 -0.1 n.a. n.a.Change in RWA, yoy (in percent) - 7.8 7.5 7.2 n.a. n.a. 25.1 10.4 -3.6 n.a. n.a. 17.7 11.7 11.2 n.a. n.a.
Top-down, MASNet profit (before losses) - 2.5 2.6 2.7 n.a. n.a. 2.1 1.9 1.4 n.a. n.a. 2.2 2.0 1.5 n.a. n.a.Credit losses - -1.0 -0.5 -0.4 n.a. n.a. -2.1 -1.1 0.5 n.a. n.a. -1.8 -1.2 -0.9 n.a. n.a.Overall losses due to market risk - 0.0 0.0 0.0 n.a. n.a. -0.2 -0.1 -0.2 n.a. n.a. -0.1 -0.1 -0.1 n.a. n.a.Change in RWA, yoy (in percent) - 3.2 -0.6 0.3 n.a. n.a. 23.1 9.6 -15.4 n.a. n.a. 11.6 13.1 6.8 n.a. n.a.
Top-down, balance sheet, FSAP teamNet profit (before losses) - 2.0 2.0 1.9 1.9 1.8 1.3 1.9 1.9 1.7 1.7 1.6 1.5 1.3 1.3 1.3Credit losses - -0.4 -0.4 -0.4 -0.5 -0.5 -1.0 -0.6 -0.6 -0.6 -0.6 -0.6 -0.8 -1.0 -1.0 -1.1Change in RWA, yoy (in percent) - 10.9 6.3 9.2 8.8 7.6 58.0 -30.4 1.3 12.1 1.7 27.8 6.9 10.4 -8.6 -0.9
Losses, in percent of GDP
Bottom-up, MASCredit losses - -0.3 -0.3 -0.2 n.a. n.a. -1.4 -1.5 -0.8 n.a. n.a. -1.0 -1.4 -2.1 n.a. n.a.Overall losses due to market risk - 0.0 0.0 0.0 n.a. n.a. -0.9 -0.9 -0.9 n.a. n.a. -0.7 -0.7 -0.8 n.a. n.a.
of which: sovereign risk - 0.0 0.0 0.0 n.a. n.a. -0.4 -0.4 -0.4 n.a. n.a. -0.3 -0.3 -0.3 n.a. n.a.
Top-down, MASCredit losses -1.4 -0.6 -0.5 n.a. n.a. -3.9 -2.1 0.7 n.a. n.a. -2.9 -2.2 -1.8 n.a. n.a.Overall losses due to market risk 0.0 0.0 0.0 n.a. n.a. -0.3 -0.3 -0.3 n.a. n.a. -0.2 -0.2 -0.3 n.a. n.a.
Top-down, balance sheet, FSAP teamCredit losses -0.6 -0.6 -0.6 -0.7 -0.8 -2.4 -0.9 -0.9 -1.1 -1.1 -1.2 -1.6 -2.4 -2.3 -2.4
Source: Staff calculations. 1/ Calculated for four locally incorporated banks and three foreign branches. 2/ Calculated for three foreign branches. 3/ Calculated for three domestic banks, covering about 80 percent of domestic banking assets. 4/ Calculated for three domestic banks, in percent of RWAs.
Baseline Stress Scenario 1 Stress Scenario 2
SING
APORE
INTERN
ATION
AL MO
NETARY FU
ND
49

Table 10. Singapore: Liquidity Stress Tests 1/
Maximum Minimum Median
Basel III parameters
Consolidated 259 57 121Singaporean dollars 523 90 144U.S. dollars 212 1 20Other foreign currency 353 0 27
Basel III parameters
Consolidated 132 89 101Singaporean dollars 144 62 99U.S. dollars 224 53 88Other foreign currency 1999 26 94
Source: MAS and staff calculations.
1/ Calculated for four banks and three foreign branches.
A. Liquidity coverage ratio
B. Stable funding ratio
SING
APORE
50 IN
TERNATIO
NAL M
ON
ETARY FUN
D
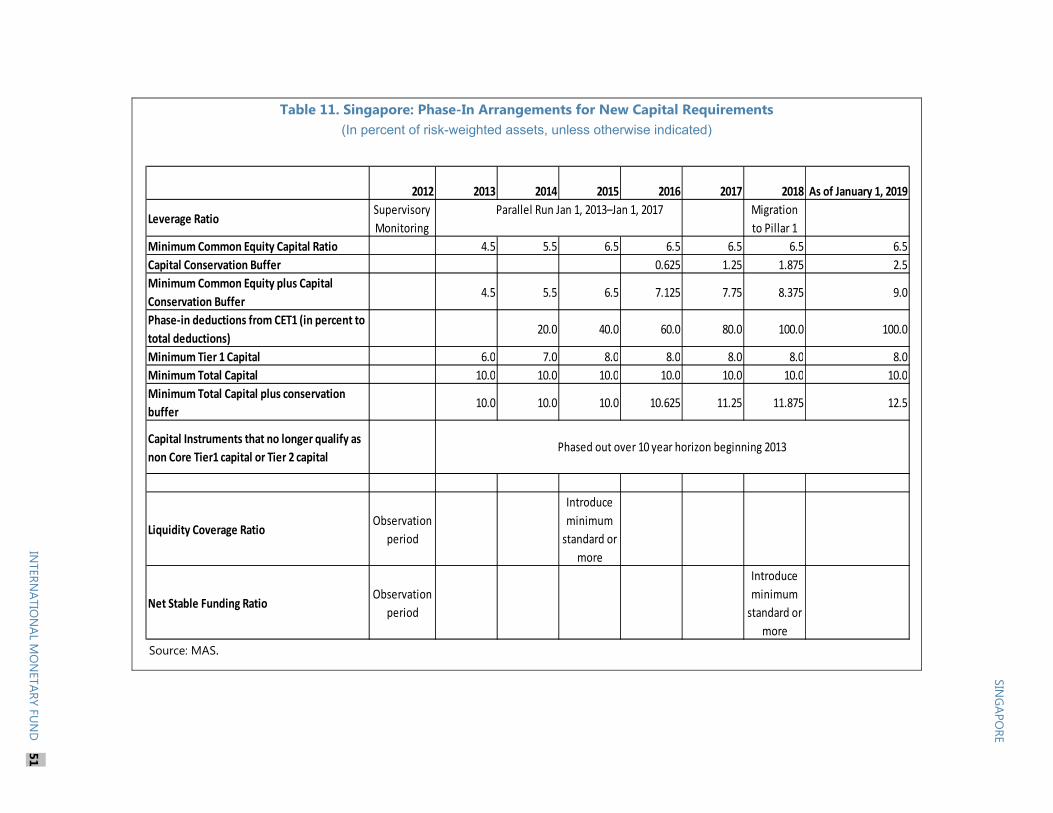
Table 11. Singapore: Phase-In Arrangements for New Capital Requirements (In percent of risk-weighted assets, unless otherwise indicated)
Source: MAS.
2012 2013 2014 2015 2016 2017 2018 As of January 1, 2019
Leverage RatioSupervisory
Monitoring
Migration
to Pillar 1
Minimum Common Equity Capital Ratio 4.5 5.5 6.5 6.5 6.5 6.5 6.5
Capital Conservation Buffer 0.625 1.25 1.875 2.5
Minimum Common Equity plus Capital Conservation Buffer
4.5 5.5 6.5 7.125 7.75 8.375 9.0
Phase-in deductions from CET1 (in percent to total deductions)
20.0 40.0 60.0 80.0 100.0 100.0
Minimum Tier 1 Capital 6.0 7.0 8.0 8.0 8.0 8.0 8.0
Minimum Total Capital 10.0 10.0 10.0 10.0 10.0 10.0 10.0
Minimum Total Capital plus conservation buffer
10.0 10.0 10.0 10.625 11.25 11.875 12.5
Capital Instruments that no longer qualify as non Core Tier1 capital or Tier 2 capital
Liquidity Coverage RatioObservation
period
Introduce
minimum
standard or
more
Net Stable Funding RatioObservation
period
Introduce
minimum
standard or
more
Parallel Run Jan 1, 2013–Jan 1, 2017
Phased out over 10 year horizon beginning 2013
SING
APORE
INTERN
ATION
AL MO
NETARY FU
ND
51

SINGAPORE
52 INTERNATIONAL MONETARY FUND
Table 12. Singapore: Composition of OTC Derivatives
(In percent)
Future/Forwards Options Swaps Total
Interest Rates 2.4 2.3 50.9 55.6 FX 20.2 4.6 16.4 41.2
Credit 0.0 0.0 2.2 2.2 Equity 0.0 0.5 0.1 0.6 Others 0.0 0.2 0.1 0.4 Total 22.7 7.6 69.7 100.0
Source: MAS (April 2012).

SINGAPORE
INTERNATIONAL MONETARY FUND 53
Figure 1. Singapore: Systemically Important FMIs
Source: IMF staff estimates.
Notes:
MAS operates the New MAS Electronic Payment System (MEPS+), which is the real time gross settlement (RTGS) system for interbank large value payments and the securities settlement system (SSS) for Singapore Government Securities. In addition, MAS is the central securities depository (CSD) for Singapore Government Securities
Corporate securities are settled in the Central Depository Pte Limited (CDP), which is the CSD and SSS for equities and corporate debt securities. The CDP also offers a CCP for all stocks, bonds, and other corporate securities traded on the Singapore Exchange (SGX). The CDP also operates DCSS, which is a securities settlement system for corporate bonds traded on the OTC market. The value of transactions in DCSS is low.
A second CCP in Singapore is offered by the Singapore Exchange Derivatives Clearing Limited, SGX-DC (AsiaClear), which clears exchange traded and OTC derivatives. Both the CDP and the SGX-DC are wholly owned subsidiaries of the SGX.

SINGAPORE
54 INTERNATIONAL MONETARY FUND
Figure 2. Singapore: Financial Sector StructureSingapore’s financial center is dominated by banks; the three local banks represent around twice GDP
Foreign banks operate through branches which represent around 60 percent of total bank assets
Local banks have expanded in the region through subsidiaries and branches.
…and enjoy revenue diversification due to the universal banking approach to licensing
Qualified Full Branches have a significant domestic presence. (Assets in billions of Singapore dollars)
But in general, the largest branches do not account for a significant proportion of parents’ operation (In percent)
Singapore GDP, Dec 2011Other banks with less than SGP 10B in Assets
ROYAL BANK OF SCOTLAND N.V., THEBANK OF CHINA LIMITED
SUMITOMO MITSUI TRUST BANK LIMITEDRABOBANK INTERNATIONAL
DNB BANK ASAHSBC PRIVATE BANK (SUISSE) SA
BARCLAYS BANK PLCBANK OF AMERICA, NATIONAL ASSOCIATION
BANK OF NOVA SCOTIA, THEBNP PARIBAS
MALAYAN BANKING BERHADING BANK N.V.
JPMORGAN CHASE BANK, N.A.MIZUHO CORPORATE BANK, LTD
CITIBANK SINGAPORE LIMITEDAUSTRALIA & NEW ZEALAND BANKING GROUP LIMITED
SUMITOMO MITSUI BANKING CORPORATIONCREDIT SUISSE AG
BANK OF TOKYO-MITSUBISHI UFJ, LTD, THEHONGKONG AND SHANGHAI BANKING CORPORATION …
UBS AGDEUTSCHE BANK AKTIENGESELLSCHAFT
CITIBANK N.A.STANDARD CHARTERED BANK
UNITED OVERSEAS BANK LIMITEDOVERSEA-CHINESE BANKING CORPORATION LIMITED
DBS BANK LTD
0 100 200 300 400SGD billionsSource: MAS
QFBOther FullWholesaleOffshore
Local
0
3
6
9
DBS OCBC UOB
Billio
ns o
f S$
Retail BankingCorporate BankingTreasuryInsuranceOther
Source:Bloomberg
2011 2012
Standard Chartered Bank
Assets / Parent's Assets 4.8 4.7
Loans / Parent's Loans 8.5 8.3
Income / Parent's Income 6.6
Citibank NA
Assets / Parent's Assets 4.10 4.17
Loans / Parent's Loans 9.21 8.96
Income / Parent's Income 2.89
Hong Kong & Shanghai Banking Corporation
Assets / Parent's Assets 1.9 1.9
Loans / Parent's Loans 3.8 4.0
Income / Parent's Income 1.9
Source: MAS, Bloomberg
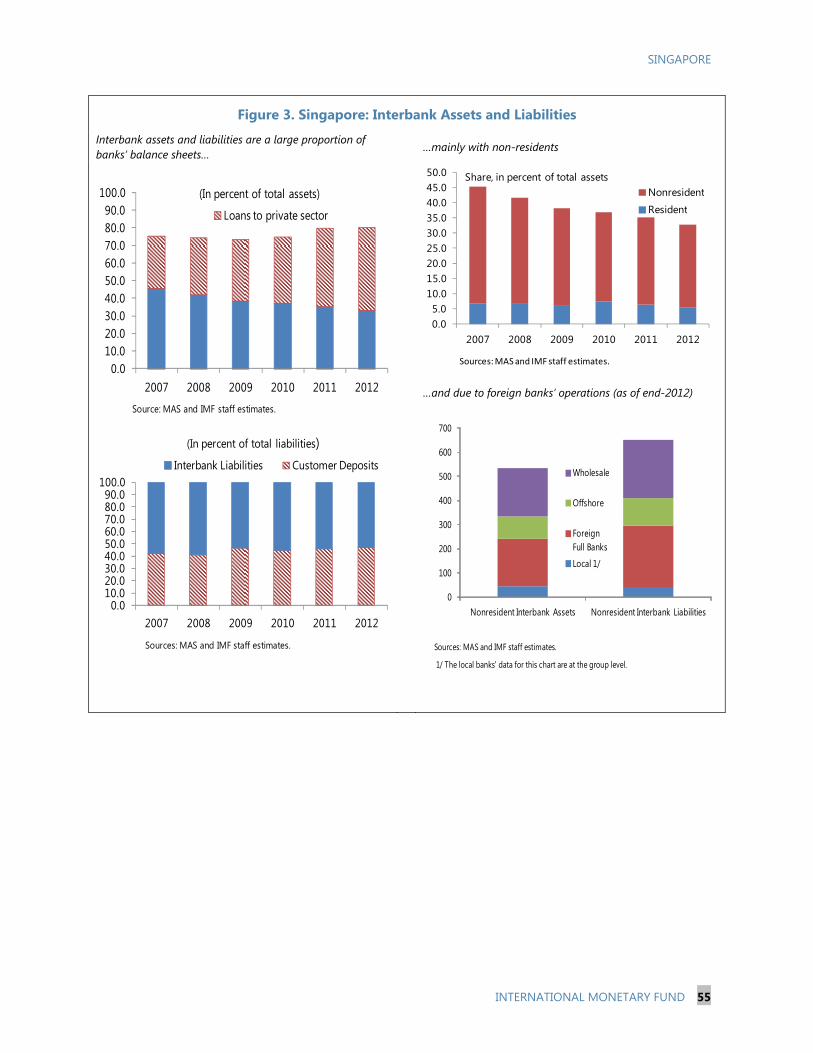
SINGAPORE
INTERNATIONAL MONETARY FUND 55
Figure 3. Singapore: Interbank Assets and Liabilities
Interbank assets and liabilities are a large proportion of banks’ balance sheets…
…mainly with non-residents
…and due to foreign banks’ operations (as of end-2012)
0.010.020.030.040.050.060.070.080.090.0
100.0
2007 2008 2009 2010 2011 2012
Loans to private sector
(In percent of total assets)
Source: MAS and IMF staff estimates.
0.010.020.030.040.050.060.070.080.090.0
100.0
2007 2008 2009 2010 2011 2012
Interbank Liabilities Customer Deposits
(In percent of total liabilities)
Sources: MAS and IMF staff estimates.
0.05.0
10.015.020.025.030.035.040.045.050.0
2007 2008 2009 2010 2011 2012
Nonresident
Resident
Share, in percent of total assets
Sources: MAS and IMF staff estimates.
Sources: MAS and IMF staff estimates.
1/ The local banks' data for this chart are at the group level.
0
100
200
300
400
500
600
700
Nonresident Interbank Assets Nonresident Interbank Liabilities
Wholesale
Offshore
Foreign Full Banks
Local 1/

SINGAPORE
56 INTERNATIONAL MONETARY FUND
Figure 4. Singapore: Local Banks. Selected Financial Soundness Indicators Singapore’s local banks have higher capital ratios than peer banks…
… lower leverage
However, loan growth has been high when compared with peers….
…including in foreign currency
Local banks are exposed to similar source of systemic risks, due to a similar pattern for regional expansion…
…and concentration in sectors related to real estate prices is high.
0
2
4
6
8
10
12
14
16
18Tier 1 Ratio, March 2013
Source: Bloomberg.
Singapore Banks
Peer Banks
0
10
20
30
40
50 Financial Leverage, March 2013
Source: Bloomberg.
SingaporeBanks
Peer Banks
0
2
4
6
8
10
12
14
16
18 Annualized Loan Growth, March 2013
Source: Bloomberg.
Peer Banks
SingaporeBanks
-10
0
10
20
30
2007 2008 2009 2010 2011 2012 2013Q1
SGP Banks: Annualized Loan Growth
DBS GROUP HLDGS OCBC BANK UNITED OVERSEAS
Source: Bloomberg.
0
100
200
300
400
500
600
Billi
ons
of S
GD
Cross Border Loans, Main 3 Banks,June 2013
Others
Greater ChinaIndonesia
Thailand
Malaysia
Hong KongSingapore
Source: Company reports.
0
100
200
300
400
500
600
Billi
ons
of
SGD
Loans by Industry, Main 3 Banks,June 2013
Others
Individuals
General commerce
Financial institutions
Manufacturing
Housing loans
Building and Const.
Transport & Comm
Primary sectors
Source: Company reports.

SINGAPORE
INTERNATIONAL MONETARY FUND 57
Figure 5. Singapore: Network Analysis. Effects of Credit and Funding Shock (In percent of pre-shock capital)
Inward Spillovers: Loss in Singapore Banking System Capital due to Distress in Other Banking Systems
Outward Spillovers: Loss in Other Banking System Capital due to Distress in Singapore Banking System
Sources: BIS Banking Statistics and IMF staff estimates.
0102030405060708090
100
Ger
man
yU
nite
d Ki
ngdo
mU
nite
d St
ates
Japa
nFr
ance
Sout
h Ko
rea
Hon
g Ko
ng S
ARSw
itzer
land
Indi
aN
ethe
rland
sCh
ina
Mal
aysi
aAu
stra
liaIn
done
sia
Thai
land
Luxe
mbo
urg
Nor
way
Cana
daPh
ilipp
ines
Baha
mas
Pana
ma
Belg
ium
Kuw
ait
Aust
riaIre
land
Bahr
ain
Spai
nM
acao
SAR
Russ
iaIta
lyG
reec
e
0
10
20
30
40
50
60
70
80
90
100
Mac
ao S
ARH
ong
Kong
SAR
Baha
mas
Uni
ted
Stat
esSw
itzer
land
Pana
ma
Luxe
mbo
urg
Mal
aysi
aJa
pan
Uni
ted
King
dom
Belg
ium
Net
herla
nds
Cana
daSo
uth
Kore
aIn
done
sia
Fran
ceBa
hrai
nG
erm
any
Kuw
ait
Aust
ralia
Indi
aPh
ilipp
ines
Nor
way
Chin
aTh
aila
ndAu
stria
Irela
ndSp
ain
Russ
iaIta
lyG
reec
e

SINGAPORE
58 INTERNATIONAL MONETARY FUND
Figure 6. Singapore: Insurance Companies. Selected Financial Soundness Indicators
Capital ratios of insurance companies showed high resilience over the GFC. Most impact was absorbed by returns that fell significantly in 2008 due to a fall in asset prices but quickly recovered.
Capital Adequacy Ratios Return on Investment
Direct Life Insurers: New Business Premiums Direct General Insurers: Gross Premiums
Asset Share by Product Asset Composition (Life Non-Linked)
Source: MAS.
0.0
50.0
100.0
150.0
200.0
250.0
300.0
350.0
2006 Q
320
07 Q3
2008 Q
320
09 Q3
2010 Q
320
11 Q3
2012 Q
3
Capital Adequacy Ratios Direct Life Insurers
Capital Adequacy Ratios Direct General Insurers
-15%
-10%
-5%
0%
5%
10%
15%
2007 2008 2009 2010 2011
Life (Non-Linked)
General Insurance (SIF)
-100.0
-50.0
0.0
50.0
100.0
150.0
0.0
500.0
1,000.0
1,500.0
2,000.0
2,500.0
3,000.0
3,500.0
2006
Q4
Q3
Q2
2009
Q4
Q3
Q2
2012
Q4
S$ million Investment-linked
S$ million Non investment-linked
-20.0
-10.0
0.0
10.0
20.0
30.0
40.0
50.0
60.0
0.0
200.0
400.0
600.0
800.0
1,000.0
1,200.0
1,400.0
1,600.0
2006
Q3
2007
Q3
2008
Q3
2009
Q3
2010
Q3
2011
Q3
2012
Q3
S$ million OIF
S$ million SIF
% YoY growth - SIF (RHS)
% YoY growth - OIF (RHS)

SINGAPORE
INTERNATIONAL MONETARY FUND 59
Figure 7. Singapore: Housing Market Structure and Developments Public housing is roughly 80 percent of total housing stock Transactions are more stable in the public re-sale market.
Public and private property prices diverged during the GFC, with real public housing prices surpassing the Asian crisis levels...
Credit to GDP increased significantly since 2010, driven in part by real estate related loans….
Household leverage is rising but remains below historical median…
Bank loans make up roughly 80 percent of all housing loans…
0
200000
400000
600000
800000
1000000
1200000
140000019
8719
8819
8919
9019
9119
9219
9319
9419
9519
9619
9719
9819
9920
0020
0120
0220
0320
0420
0520
0620
0720
0820
0920
1020
1120
12
# of
hou
sing
units
Public PrivateSources: CEIC, MAS.
0
5000
10000
15000
20000
25000
30000
Sep-
2001
Mar
-200
2
Sep-
2002
Mar
-200
3
Sep-
2003
Mar
-200
4
Sep-
2004
Mar
-200
5
Sep-
2005
Mar
-200
6
Sep-
2006
Mar
-200
7
Sep-
2007
Mar
-200
8
Sep-
2008
Mar
-200
9
Sep-
2009
Mar
-201
0
Sep-
2010
Mar
-201
1
Sep-
2011
Mar
-201
2
Sep-
2012
num
ber o
f tra
nsac
tions
Public PrivateSources: CEIC, URA.
0
50
100
150
200
250
300
350
400
450
Mar
-197
5
Jul-1
976
Nov
-197
7
Mar
-197
9
Jul-1
980
Nov
-198
1
Mar
-198
3
Jul-1
984
Nov
-198
5
Mar
-198
7
Jul-1
988
Nov
-198
9
Mar
-199
1
Jul-1
992
Nov
-199
3
Mar
-199
5
Jul-1
996
Nov
-199
7
Mar
-199
9
Jul-2
000
Nov
-200
1
Mar
-200
3
Jul-2
004
Nov
-200
5
Mar
-200
7
Jul-2
008
Nov
-200
9
Mar
-201
1
Jul-2
012
Price
Inde
x (1
990Q
1=10
0)
Recession
Private-Landed
Private-Non Landed
Public- Resale
Private
Sources: CEIC and IMF staff calculations.
0
5
10
15
20
25
Q1-
1995
Q3-
1995
Q1-
1996
Q3-
1996
Q1-
1997
Q3-
1997
Q1-
1998
Q3-
1998
Q1-
1999
Q3-
1999
Q1-
2000
Q3-
2000
Q1-
2001
Q3-
2001
Q1-
2002
Q3-
2002
Q1-
2003
Q3-
2003
Q1-
2004
Q3-
2004
Q1-
2005
Q3-
2005
Q1-
2006
Q3-
2006
Q1-
2007
Q3-
2007
Q1-
2008
Q3-
2008
Q1-
2009
Q3-
2009
Q1-
2010
Q3-
2010
Q1-
2011
Q3-
2011
Q1-
2012
Q3-
2012
Q1-
2013
perc
ent
Household Debt/Assets
Historical Median
Source: Singstat and IMF staff calcultions.
0
20
40
60
80
100
120
140
160
Mar
-200
4
Jul-2
004
Nov
-200
4
Mar
-200
5
Jul-2
005
Nov
-200
5
Mar
-200
6
Jul-2
006
Nov
-200
6
Mar
-200
7
Jul-2
007
Nov
-200
7
Mar
-200
8
Jul-2
008
Nov
-200
8
Mar
-200
9
Jul-2
009
Nov
-200
9
Mar
-201
0
Jul-2
010
Nov
-201
0
Mar
-201
1
Jul-2
011
Nov
-201
1
Mar
-201
2
Jul-2
012
Nov
-201
2
Mar
-201
3
% o
f GD
P
Housing Loans (DBU) Other Consumer Loans (DBU)Other Loans to Businesses (DBU) Building and Construction (DBU)Credit to the Private Sector (DBU)Source: CEIC.
0
50000
100000
150000
200000
250000
Mar
-199
5
Dec
-199
5
Sep-
1996
Jun-
1997
Mar
-199
8
Dec
-199
8
Sep-
1999
Jun-
2000
Mar
-200
1
Dec
-200
1
Sep-
2002
Jun-
2003
Mar
-200
4
Dec
-200
4
Sep-
2005
Jun-
2006
Mar
-200
7
Dec
-200
7
Sep-
2008
Jun-
2009
Mar
-201
0
Dec
-201
0
Sep-
2011
Jun-
2012
SGD
, mill
ions
DBU Housing Loans ACU Housing Loans
Finance Companies HDB Loans
Source: CEIC.

SINGAPORE
60 INTERNATIONAL MONETARY FUND
Figure 7. Singapore: Housing Market Structure and Developments (continued)
More than 40 percent of total DBU non-bank loans are related to housing sector….
Exposure to housing sector in the top three domestic banks is also significant at 36-42 percent of non-bank loans….
70 percent of loans have LtV ratios of less than 70 percent….
Most vulnerability indicators except credit growth have subsided since 2010
Share of foreign purchasers declined due to the additional stamp duty.
The public re-sale prices remained resilient and housing affordability has declined.
0
10
20
30
40
50
60
Jan-
1991
Jan-
1992
Jan-
1993
Jan-
1994
Jan-
1995
Jan-
1996
Jan-
1997
Jan-
1998
Jan-
1999
Jan-
2000
Jan-
2001
Jan-
2002
Jan-
2003
Jan-
2004
Jan-
2005
Jan-
2006
Jan-
2007
Jan-
2008
Jan-
2009
Jan-
2010
Jan-
2011
Jan-
2012
Jan-
2013
perc
ent
Share of Total Loans - DBU (Housing)
Share of Total Loans - DBU (Building and Construction)Source: CEIC.
0
5
10
15
20
25
30
35
40
45
DBS OCBC UOB
perc
ent
of n
on-b
ank
loan
s
Housing Building and constructionSource: Bank statements.
-
10.0
20.0
30.0
40.0
50.0
60.0
70.0
80.0
90.0
100.0
-
10.0
20.0
30.0
40.0
50.0
60.0
70.0
80.0
90.0
100.0
Jun-
04
Oct
-04
Feb-
05
Jun-
05
Oct
-05
Feb-
06
Jun-
06
Oct
-06
Feb-
07
Jun-
07
Oct
-07
Feb-
08
Jun-
08
Oct
-08
Feb-
09
Jun-
09
Oct
-09
Feb-
10
Jun-
10
Oct
-10
Feb-
11
Jun-
11
Oct
-11
Feb-
12
Jun-
12
Oct
-12
Feb-
13
Perc
ent o
f mor
tgaa
ges,
LTV
(in
per
cent
)
Less than 0.7 Between 0.7 - 0.8 Between 0.8 - 0.9
Between 0.9 - 1.0 Exceeding 1.0 LTV Limit (First Mortgage)Source: MAS.
0
2
4
6
8
10
12
14
16
18
20
2005Q1 2006Q1 2007Q1 2008Q1 2009Q1 2010Q1 2011Q1 2012Q1 2013Q1
perc
en
t o
f p
riva
te p
rop
erty
tra
nsa
ctio
ns Foreign buyers
Sources: Realis Transaction Database, URA.
-1
-0.5
0
0.5
1
1.5
2
2.5
3
Real Price Growth (2 year average)
Transactions as percent of housing stock (Avg. past 4
quarters)
Share of Foreigners (Avg. past 4 quarters)
Share of subsale (Avg. past 4 quarters)
Change in Housing Related Loans (% of GDP) (2 year
average)
Price to Income (2 year average)
Jun-96
Jun-00
Mar-08
Dec-11
Dec-10
Mar-13Sources: CEIC, URA, IMF Staff calculations.

SINGAPORE
INTERNATIONAL MONETARY FUND 61
Figure 7. Singapore: Housing Market Structure and Developments (concluded)
Authorities have stepped up the use of macroprudential measures starting in 2009, as prices have started to rise…
0
50
100
150
200
250
-5
0
5
10
15
20
25
30
35
40
Jan-
96
Jan-
97
Jan-
98
Jan-
99
Jan-
00
Jan-
01
Jan-
02
Jan-
03
Jan-
04
Jan-
05
Jan-
06
Jan-
07
Jan-
08
Jan-
09
Jan-
10
Jan-
11
Jan-
12
Jan-
13
Prop
erty
pric
e In
dex
Num
ber o
f mea
sure
s (+
tigh
teni
ng)
Seller's stamp dutyBuyer's stamp dutyOther taxesMaximum tenureMinimum cash down paymentForeigner's Can Borrow in SGP$LTVTotal Debt Service RatioProperty Price Index (right scale)
Source: IMF staff calculations.
Note: The figure shows the cumulative number of changes in the macroprudential framework under different instruments, where an increase (decrease) means tightening (loosening). A change in macroprudential measures includes a) revising an existing measure (e.g., lowering the LTV for the first mortgage loan from 90 to 80) and b) the introduction of a new measure (e,g., the additional buyers’ stamp duty on non-residents and non-individual buyers or introducing a higher LTV for the second mortgage).

SING
APORE
62 IN
TERNATIO
NAL M
ON
ETARY FUN
D
Appendix. Singapore: Relevant FATF Recommendations and Actions Taken
FATF
Recommendations
FATF Assessors’ Recommended Action
Plans
Follow-up Actions Taken by Singapore a. Recommendation 1 – Criminalizing of Money Laundering
PC Demonstrate effective implementation of the ML offense; particularly in relation to third party money laundering activity, and the laundering of proceeds generated by foreign predicate offenses.
Ensure that sanctions are more effectively applied to both natural and legal persons convicted of money laundering. Amend the third party ML offenses, sections 46(2) and 47(2) of the CDSA, to remove the additional purpose elements for the offense of concealment or disguise, and provide for the additional alternative purpose element for the offense of conversion or transfer.
Improving Effectiveness—Enforcement According to the authorities, Singapore enforces its AML/CFT laws by actively investigating any leads to uncover possible ML/TF offenses and, where an offense is established, ensuring that the perpetrators are prosecuted. Accordingly, the number money laundering convictions has increased over the years.
Table 1. No. of ML prosecutions/convictions (by persons) and breakdown by self or third party laundering1
2007 2008 2009 2010 2011 Jan–Sept 2012
Total no. of ML convictions 12 24 26 18 33 49 Total number of ML prosecutions
17 23 26 14 44 47
Method
Self laundering convictions 10 5 122/ 823 214/ 10 Third Party laundering convictions
2 19 162/ 113/ 154/ 38
1/The figures shown from 2011 include ML prosecutions/convictions under both the CDSA and Moneylenders Act. In 2011 and in January to September 2012, the number of ML convictions (and prosecutions) under the Moneylenders Act were 7 (and 12) and 33 (and 26), respectively. 2/ Two persons were charged with both self laundering and third-party laundering. 3/ One person was charged with both self laundering and third-party laundering. 4/ Three persons were charged with both self laundering and third-party laundering.
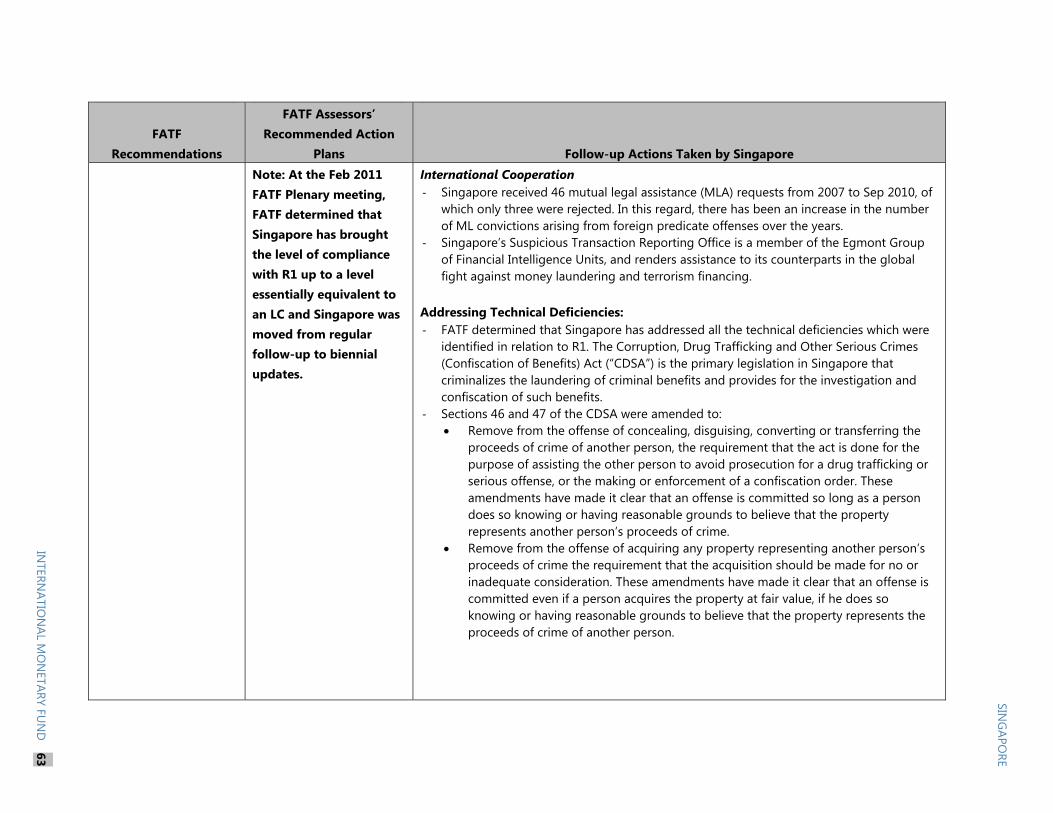
SING
APORE
INTERN
ATION
AL MO
NETARY FU
ND
63
FATF
Recommendations
FATF Assessors’ Recommended Action
Plans
Follow-up Actions Taken by Singapore Note: At the Feb 2011 FATF Plenary meeting, FATF determined that Singapore has brought the level of compliance with R1 up to a level essentially equivalent to an LC and Singapore was moved from regular follow-up to biennial updates.
International Cooperation - Singapore received 46 mutual legal assistance (MLA) requests from 2007 to Sep 2010, of
which only three were rejected. In this regard, there has been an increase in the number of ML convictions arising from foreign predicate offenses over the years.
- Singapore’s Suspicious Transaction Reporting Office is a member of the Egmont Group of Financial Intelligence Units, and renders assistance to its counterparts in the global fight against money laundering and terrorism financing.
Addressing Technical Deficiencies: - FATF determined that Singapore has addressed all the technical deficiencies which were
identified in relation to R1. The Corruption, Drug Trafficking and Other Serious Crimes (Confiscation of Benefits) Act (“CDSA”) is the primary legislation in Singapore that criminalizes the laundering of criminal benefits and provides for the investigation and confiscation of such benefits.
- Sections 46 and 47 of the CDSA were amended to: Remove from the offense of concealing, disguising, converting or transferring the
proceeds of crime of another person, the requirement that the act is done for the purpose of assisting the other person to avoid prosecution for a drug trafficking or serious offense, or the making or enforcement of a confiscation order. These amendments have made it clear that an offense is committed so long as a person does so knowing or having reasonable grounds to believe that the property represents another person’s proceeds of crime.
Remove from the offense of acquiring any property representing another person’s proceeds of crime the requirement that the acquisition should be made for no or inadequate consideration. These amendments have made it clear that an offense is committed even if a person acquires the property at fair value, if he does so knowing or having reasonable grounds to believe that the property represents the proceeds of crime of another person.

SING
APORE
64 IN
TERNATIO
NAL M
ON
ETARY FUN
D
FATF
Recommendations
FATF Assessors’ Recommended Action
Plans
Follow-up Actions Taken by Singapore Other Technical Improvements: Review of Legislation - Eight offenses30 were added to the Second Schedule of the CDSA in February 2011,
bringing the total number of such offenses to 417. In line with the revised FATF Recommendations, serious tax crimes were also designated as money laundering predicate offenses on July 1, 2013.
- As part of the review, an amendment to the CDSA was also undertaken in March 2012 to make it clear that the reporting of suspicious transactions under section 39 covers attempted transactions. In particular, a new section 39(1A) clarifies that the requirement to make a suspicious transaction report under section 39(1) applies regardless whether the transaction was completed.
b. Recommendations 12, 16 and 24—Designated Non-Financial Businesses and Professions
NC/PC Adopt AML/CFT measures for real estate agents, dealers in precious metals and dealers in precious stones, accountants, and trust and
Real estate - A new statutory board—the Council for Estate Agencies (CEA), was established in Oct
2010 under the Estate Agents Act 2010 with the purpose of strengthening regulatory oversight of the real estate sector. CEA's principal functions are to license estate agents (referring to the estate agencies) and register salespersons (referring to the property agents). Accordingly, an enhanced regulatory framework which covers areas including qualifications and training requirements and an enforcement framework was introduced
30 These offenses were:
Section 5(1) and (3) of the Employment of Foreign Manpower Act—Employment of foreign employee without a valid work pass, or in contravention of a condition of his work pass;
Section 22(1)(a), (d), (e), and (f) of the Employment of Foreign Manpower Act—Contravention of a condition of a work pass, making false statement or
giving false information to the Controller of Work Passes or an employment inspector, dealing in, forging or unlawfully altering a work pass, or using or
having in possession a forged or unlawfully altered work pass or a work pass issued to another;
Section 5 of the Hostage-Taking Act 2010 —Failure to disclose information relating to hostage-taking offense; and Section 57(1)(d) of the Immigration Act—Harboring offenders of Immigration Act or Regulations.

SING
APORE
INTERN
ATION
AL MO
NETARY FU
ND
65
FATF
Recommendations
FATF Assessors’ Recommended Action
Plans
Follow-up Actions Taken by Singapore company service providers (other than trust companies which are regulated as FIs) and ensure that these sectors are subject to an effective AML/CFT oversight mechanism.
In relation to lawyers: Ensure that all of the basic obligations are contained in law and regulation. Enhance the CDD obligations by implementing requirements, particularly relating to beneficial ownership and control, enhanced CDD and ongoing monitoring of clients .who are PEPs, and the use of third parties/introducers, as well as record-keeping and strengthen monitoring of their compliance with requirements.
by the CEA in Nov 2010. - Amendments to the Code of Practice for Estate Agents will be made to enhance record
keeping requirements for the industry. Specifically, estate agents will be required to retain the originals or keep copies of documents such as estate agency, sale and purchase, option to purchase and lease agreements for at least five years. The amendments are targeted for implementation in 1H 2013.
- CEA will be issuing a set of guidelines in 2H 2013 to remind estate agents and salespersons of the need to comply with Singapore’s legislation and regulations concerning the prevention of ML and countering FT. The guidelines will raise awareness and also remind estate agents and salespersons of their obligations under Section 39 of the CDSA to lodge suspicious transaction reports (STR) with the Suspicious Transaction Reporting Office (STRO). CEA will also conduct outreach sessions to remind the industry on the legislation and regulations.
Company Service Providers - Accounting and Corporate Regulatory Authority (ACRA), the central registration
authority in Singapore for business entities, is currently working with the Attorney-General’s Chambers to finalize the proposed regulations for CSPs which will include, amongst others, the requirement to identity beneficial owner of legal entities and record keeping requirements. The proposed regulations will also make explicit that CSPs will continue to be subjected to suspicious transaction reporting requirements. The new regulations are expected to be in force by 2014.
Lawyers - Following the ME onsite visit in 2007, the Council issued a revised “Council’s Practice
Direction No. 1 of 2008: Prevention of Money Laundering and the Funding of Terrorist Activities”12, to provide enhanced guidance to lawyers and law practices on the application of the ML/TF rules as stated in the LP Amendment Rules and to set out directions on AML/CFT procedures in general. These include, amongst others, the duty to report suspicious transactions, detailed CDD requirements, when and how RBA can be applied in the context of KYC procedures. The FATF noted in its follow up report that it remains a technical deficiency that the requirements to identify beneficial owners and
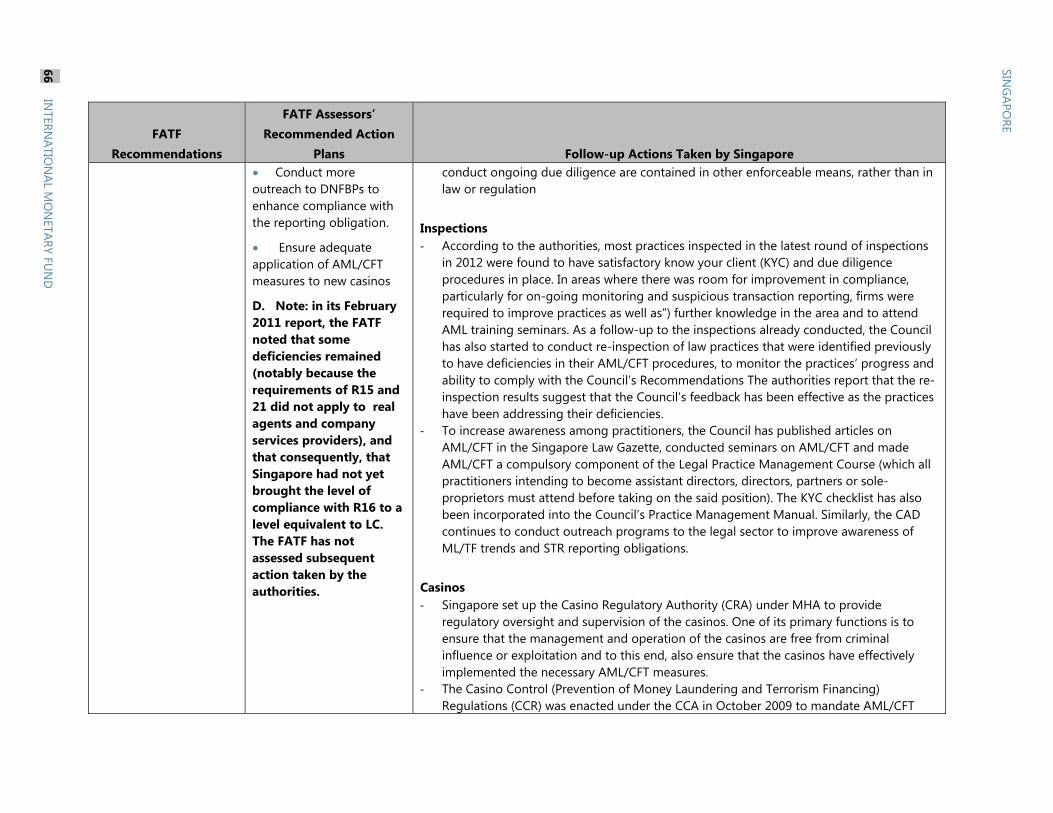
SING
APORE
66 IN
TERNATIO
NAL M
ON
ETARY FUN
D
FATF
Recommendations
FATF Assessors’ Recommended Action
Plans
Follow-up Actions Taken by Singapore Conduct more outreach to DNFBPs to enhance compliance with the reporting obligation.
Ensure adequate application of AML/CFT measures to new casinos
D. Note: in its February 2011 report, the FATF noted that some deficiencies remained (notably because the requirements of R15 and 21 did not apply to real agents and company services providers), and that consequently, that Singapore had not yet brought the level of compliance with R16 to a level equivalent to LC. The FATF has not assessed subsequent action taken by the authorities.
conduct ongoing due diligence are contained in other enforceable means, rather than in law or regulation
Inspections - According to the authorities, most practices inspected in the latest round of inspections
in 2012 were found to have satisfactory know your client (KYC) and due diligence procedures in place. In areas where there was room for improvement in compliance, particularly for on-going monitoring and suspicious transaction reporting, firms were required to improve practices as well as”) further knowledge in the area and to attend AML training seminars. As a follow-up to the inspections already conducted, the Council has also started to conduct re-inspection of law practices that were identified previously to have deficiencies in their AML/CFT procedures, to monitor the practices’ progress and ability to comply with the Council’s Recommendations The authorities report that the re-inspection results suggest that the Council’s feedback has been effective as the practices have been addressing their deficiencies.
- To increase awareness among practitioners, the Council has published articles on AML/CFT in the Singapore Law Gazette, conducted seminars on AML/CFT and made AML/CFT a compulsory component of the Legal Practice Management Course (which all practitioners intending to become assistant directors, directors, partners or sole-proprietors must attend before taking on the said position). The KYC checklist has also been incorporated into the Council’s Practice Management Manual. Similarly, the CAD continues to conduct outreach programs to the legal sector to improve awareness of ML/TF trends and STR reporting obligations.
Casinos - Singapore set up the Casino Regulatory Authority (CRA) under MHA to provide
regulatory oversight and supervision of the casinos. One of its primary functions is to ensure that the management and operation of the casinos are free from criminal influence or exploitation and to this end, also ensure that the casinos have effectively implemented the necessary AML/CFT measures.
- The Casino Control (Prevention of Money Laundering and Terrorism Financing) Regulations (CCR) was enacted under the CCA in October 2009 to mandate AML/CFT

SING
APORE
INTERN
ATION
AL MO
NETARY FU
ND
67
FATF
Recommendations
FATF Assessors’ Recommended Action
Plans
Follow-up Actions Taken by Singapore measures for casinos. These requirements include, for example, mandatory reporting for cash transactions of S$10,000 or more, mandatory reporting of suspicious transactions, implementation of Know Your Customer and Customer Due Diligence (CDD) measures and record-keeping for transactions of S$5,000 and above. The maximum amount of financial penalty for CDD breaches is a sum not exceeding 10 percent of the casino operator’s annual gross gaming revenue for serious breaches.
Inspections and Infringements - From January to September 2012, CRA conducted a full scope inspection on both casino
operators on 16 areas of casino operations, with AML/CFT being one such area. The CRA reported that the inspection established that both casino operators have implemented the internal controls required to fulfill their regulatory obligations. Where areas of non-compliances were noted, the casino operators have apparently taken steps to improve its systems and processes to better comply with the regulatory requirements
- Since the casinos began operations, enforcement agencies have not detected any major infringement of the AML/CFT provisions of the CCA by the Casino Operators. There has been one conviction of a person for money laundering in a casino under the CDSA thus far.
c. Recommendations 33 and 34—Transparency of legal persons and arrangements.
PC Broaden the requirements on beneficial ownership so that information on ownership/control is readily available in a timely manner.
Broaden the requirements on beneficial ownership so that
Companies - There are proposed regulation of CSPs (see section above) which will require CSPs to
look through to the beneficial owner. This should enhance the transparency of legal persons will be greatly enhanced. The new FATF requirements will be factored into the drafting of the proposed regulations.
Trusts - Section 3 of the Singapore Trust Companies Act requires that any person carrying on
any trust business or holding themselves out as carrying on any trust business in Singapore must be licensed as a trust company. Licensing and customer due diligence requirements apply to any persons offering trust business in Singapore, regardless of

SING
APORE
68 IN
TERNATIO
NAL M
ON
ETARY FUN
D
FATF
Recommendations
FATF Assessors’ Recommended Action
Plans
Follow-up Actions Taken by Singapore information on ownership/control for all trusts (not just those administered by trust companies) is readily available in a timely manner.
Note: in its February 2011 report, the FATF noted that Singapore had not taken sufficient action to bring the level of compliance with R33 and 34 to a level equivalent to LC. The FATF has not assessed subsequent action taken by the authorities.
whether such persons are of residential or non-residential status; or whether the assets settled in the trust are located within or outside Singapore. Licensing exemptions are available in limited and specific circumstances, but exempt entities are still required to comply with CDD requirements.
- CDD requirements are mandated by the Monetary Authority of Singapore Anti-Money Laundering and Countering the Financing of Terrorists Notices, and apply to all licensed trust companies and regulated financial institutions. These CDD measures require the respective institutions to conduct identification and verification checks on all trust relevant parties, which include settlors, trustees, beneficiaries and beneficial owners. Compliance with the Monetary Authority of Singapore’s Anti-Money Laundering and Countering the Financing of Terrorists Notices is supported by onsite and offsite supervision.