Embed Size (px)
Citation preview
© 2015 International Monetary Fund
IMF Country Report No. 15/319
PAPUA NEW GUINEA SELECTED ISSUES
This Selected Issues paper on Papua New Guinea was prepared by a staff team of the
International Monetary Fund as background documentation for the periodic consultation
with the member country. It is based on the information available at the time it was
completed on October 16, 2015.
Copies of this report are available to the public from
International Monetary Fund Publication Services
PO Box 92780 Washington, D.C. 20090
Telephone: (202) 623-7430 Fax: (202) 623-7201
E-mail: [email protected] Web: http://www.imf.org
Price: $18.00 per printed copy
International Monetary Fund
Washington, D.C.
November 2015

PAPUA NEW GUINEA SELECTED ISSUES
Approved By Asia and Pacific Department
Prepared By Shelvin Karan (IMF Resident Representative’s Office for Pacific Islands, Fiji), Kazuaki Washimi (APD), Henry Mooney (FIN), Yurendra Basnett (ADB), and Chandana Kularatne (World Bank).
FINANCIAL INCLUSION AND ACCESS—SUPPORTING INCLUSIVE GROWTH _________ 3
A. Introduction _____________________________________________________________________________ 3
B. Financial Sector Development and Access in PNG ______________________________________ 3
C. Country Specific Barriers to Financial Inclusion _________________________________________ 7
References _______________________________________________________________________________ 12 FIGURES 1. Financial Sector Depth and Development _______________________________________________ 4
2. Mobile Banking Accounts _______________________________________________________________ 6
3. Reasons for Not Having a Bank Account ________________________________________________ 7
4A. Cross-Country Bank Profitablity—Return on Equity ___________________________________ 8
4B. Cross-Country Costs of Banking Services—Interest Rate Spreads _____________________ 8
5. Urban Population ________________________________________________________________________ 9 TABLES 1. PNG Financial Sector Overview __________________________________________________________ 5
2. Financial Access Indicators ______________________________________________________________ 6
EVOLUTION OF PNG'S FX REGIME _____________________________________________________ 13
A. Introduction ___________________________________________________________________________ 13
B. Developments in PNG’s FX Market ____________________________________________________ 13
C. Benefits and Drawbacks of Alternative FX Market Mechanisms _______________________ 16
D. Conclusions ___________________________________________________________________________ 20
References _______________________________________________________________________________ 22
CONTENTS
October 15, 2015

PAPUA NEW GUINEA
2 INTERNATIONAL MONETARY FUND
FIGURES 1. Exchange Rate and Reserves __________________________________________________________ 14
2. Capital and Financial Account _________________________________________________________ 14
3. Excess Reserves ________________________________________________________________________ 14
4. Change in BPNG's Assets ______________________________________________________________ 14
5. Volume of FX Trading _________________________________________________________________ 15
6. Mapping of Foreign Exchange Market Mechanisms to Exchange Rate Regimes ______ 17
7. Spot Market Options—Considerations _______________________________________________ 20
STRUCTURAL REFORMS FOR SUSTAINABLE AND INCLUSIVE DEVELOPMENT IN
PNG ______________________________________________________________________________________ 23
A. Introduction ___________________________________________________________________________ 23
B. Evaluating PNG’s Asset Base __________________________________________________________ 25
C. Possible Strategy for Structural Reforms ______________________________________________ 28
D. ADB, IMF, and World Bank Support for Structural Reforms ___________________________ 29
E. Summary ______________________________________________________________________________ 30
References _______________________________________________________________________________ 31 FIGURES 1. Composition of the PNG Economy, 2014 ______________________________________________ 23
2. Subsoil Assets per Capita, 2005 _______________________________________________________ 25
3. Internet and Mobile Phone Subscriptions, 2012 _______________________________________ 26
4. Water and Sanitation Access, 2012 ____________________________________________________ 26
5. Life Expectancy at Birth and Human Development Index _____________________________ 27
6. Institutional Strength, 2014____________________________________________________________ 28
7. Ease of Doing Business, 2015 __________________________________________________________ 28

PAPUA NEW GUINEA
INTERNATIONAL MONETARY FUND 3
FINANCIAL INCLUSION AND ACCESS—SUPPORTING INCLUSIVE GROWTH1 A. Introduction
1. Recent research suggests strong positive linkages between financial sector development, access to financial services, and economic development outcomes. For example, evidence presented in the World Bank’s 2014 Global Financial Development Report found that financial inclusion (FI)—typically defined as the proportion of individuals and firms that use financial services—is important for development and poverty reduction, and that the poor stand to benefit considerably from the use of basic payments, savings, and insurance services. Similarly, for firms, particularly small and newly-established enterprises, access to financial services is associated with stronger innovation, job creation, and growth performance. Other research also finds a strong positive relationship between financial inclusion and income equality. In this context, FI-supporting policies are becoming increasingly recognized as key pillars of sound, effective, and comprehensive strategies aimed at accelerating inclusive economic development.
2. This note provides an overview of financial access and inclusion indicators, related causal factors, and both current and possible reform priorities for PNG. Section B presents indicators of financial market depth, development, and access for PNG and compares PNG’s performance against that of other countries in the region, at similar levels of development, and beyond. Section C provides an overview of country-specific challenges facing PNG related to FI that helps to explain its performance, as well as possible reform priorities in the near term, and discusses the government’s current initiatives aimed at promoting financial sector development and inclusion and their preliminary results.
B. Financial Sector Development and Access in PNG
3. While comparing favorably with low-income countries, PNG’s financial sector is shallow relative to many other middle-income income countries in the region. While any assessment of financial sector development will depend on the selected metric, PNG’s ratio of domestic private credit2 to GDP of 35 percent in 2013—a common indicator of financial sector depth3—was well below the average for East Asia and Pacific developing countries (124 percent), Pacific Island Small States4 (63 percent), other Middle Income Countries5 (87 percent), and many
1 Prepared by Henry Mooney. 2 Domestic private credit includes resources provided to the private sector by financial corporations, such as through loans, purchases of non-equity securities, trade credits, and other accounts receivable that establish a claim. 3 See IMF, “Financial Sector Assessment—A Handbook,” for a broad discussion of related concepts and measures. 4 The Pacific Island Small States grouping (Fiji, Kiribati, Marshall Islands, Federated States of Micronesia, Palau, Samoa, Solomon Islands, Tonga, Tuvalu, and Vanuatu) does not include PNG, and is provided as a comparator. 5 Middle-income economies are those in which 2014 GNI per capita was between US$1,046 and US$12,735 in 2014. PNG’s per capita GNI (Atlas method) of US$2,020 falls towards the lower end of this category.

PAPUA NEW GUINEA
4 INTERNATIONAL MONETARY FUND
other comparable countries (see Figure 1). Similarly, it ranks well below the average for Sub-Saharan African countries (48 percent), a region where considerable policy efforts and progress towards increasing financial access have been observed in recent years.
Figure 1. Financial Sector Depth and Development (2013)
Note: Sample limited to countries and regional averages with GDP per capita of less than US$10,000.
Sources: World Bank, World Development Indicators Database and staff calculations. 4. Other financial sector development and access indicators are also weak, including those related to the size and composition, breadth, and diversity of the financial services sector, as well as physical access to services. In the case of PNG, while there has been modest progress in establishing microfinance institutions6 in recent years (from 1 in 2005 to 4 in 2013), the breadth of deposit-taking entities remains limited. There were only 4 full-service commercial banks operating in PNG at end-2013, with 79 full branches. The number of credit unions, cooperatives, and other depository corporations did not increase substantially between 2005 and 2013. There were also a total of 371 automated teller machines (ATMs) serving a population of about 7.3 million (see
6 Microfinance institutions are those institutions whose primary business model involves taking deposits (included in the national definition of broad money) and lending to self-employed or informally employed poor, micro-entrepreneurs, and small businesses, often using specialized methodologies such as group lending.
Lebanon (98.6%)Suriname (27.0%)
Romania (41.4%)
Grenada (74.9%)Colombia (50.0%)Azerbaijan (25.5%)
Iraq (6.4%)Peru (31.6%)
Iran (52.2%)
Algeria (47.6%) Jamaica (29.6%)Jordan (72.3%)
Fiji (81.4%)
Samoa (40.4%)Tonga (29.7%)
Indonesia (39.9%) Vanuatu (68.7%)Micronesia (19.7%)
West Bank & Gaza (7.2%) Philippines (35.8%)
Honduras (55.4%)PNG (34.6%)
Vietnam (96.8%)Solomon Isl. (35.6%)
India (51.9%)Chad (6.1%)
Nepal (58.1%)Togo (32.2%)
DR Congo (5.7%) Low Income Ave. (19%)
Sub-Saharan Africa Ave. (48%)
Pacific Island Small States Ave. (63%)
Middle Income Ave. (87%)
E. Asia & Pacific Developing Countries Ave. (124%)
‐
1,000
2,000
3,000
4,000
5,000
6,000
7,000
8,000
9,000
10,000
0 20 40 60 80 100 120
GD
P P
er
Cap
ita
(cu
rre
nt
US$
)
Domestic Credit to Private Sector (%GDP)
PAPUA NEW GUINEA
INTERNATIONAL MONETARY FUND 5
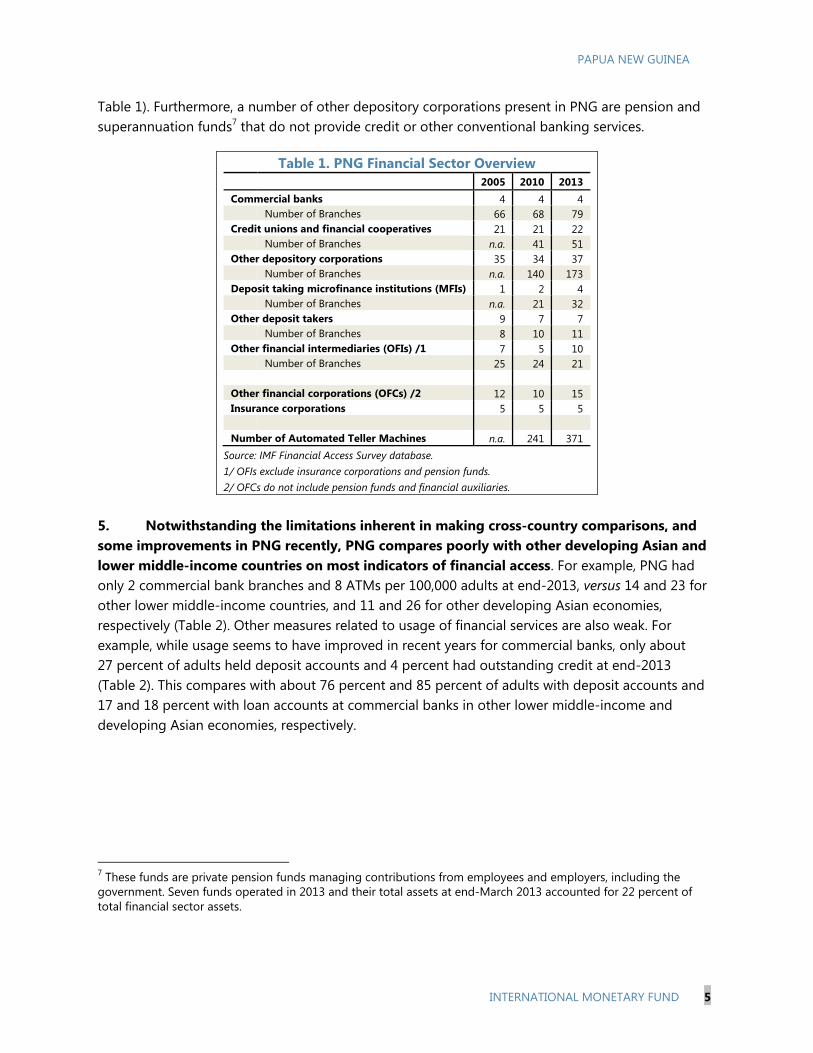
Table 1). Furthermore, a number of other depository corporations present in PNG are pension and superannuation funds7 that do not provide credit or other conventional banking services.
5. Notwithstanding the limitations inherent in making cross-country comparisons, and some improvements in PNG recently, PNG compares poorly with other developing Asian and lower middle-income countries on most indicators of financial access. For example, PNG had only 2 commercial bank branches and 8 ATMs per 100,000 adults at end-2013, versus 14 and 23 for other lower middle-income countries, and 11 and 26 for other developing Asian economies, respectively (Table 2). Other measures related to usage of financial services are also weak. For example, while usage seems to have improved in recent years for commercial banks, only about 27 percent of adults held deposit accounts and 4 percent had outstanding credit at end-2013 (Table 2). This compares with about 76 percent and 85 percent of adults with deposit accounts and 17 and 18 percent with loan accounts at commercial banks in other lower middle-income and developing Asian economies, respectively.
7 These funds are private pension funds managing contributions from employees and employers, including the government. Seven funds operated in 2013 and their total assets at end-March 2013 accounted for 22 percent of total financial sector assets.
Table 1. PNG Financial Sector Overview 2005 2010 2013 Commercial banks 4 4 4 Number of Branches 66 68 79 Credit unions and financial cooperatives 21 21 22 Number of Branches n.a. 41 51 Other depository corporations 35 34 37 Number of Branches n.a. 140 173 Deposit taking microfinance institutions (MFIs) 1 2 4 Number of Branches n.a. 21 32 Other deposit takers 9 7 7 Number of Branches 8 10 11 Other financial intermediaries (OFIs) /1 7 5 10 Number of Branches 25 24 21 Other financial corporations (OFCs) /2 12 10 15 Insurance corporations 5 5 5 Number of Automated Teller Machines n.a. 241 371
Source: IMF Financial Access Survey database. 1/ OFIs exclude insurance corporations and pension funds. 2/ OFCs do not include pension funds and financial auxiliaries.

PAPUA NEW GUINEA
6 INTERNATIONAL MONETARY FUND
6. Despite relatively poor performance in the areas discussed above, PNG has made comparatively strong progress with respect to mobile banking. While statistics regarding mobile banking usage reflect people already participating in the system, these data suggest that this sector shows promise for reaching those outside the formal system in the future. In 2012, PNG displayed a relatively high number of mobile banking accounts per adult compared to other countries in the Pacific—9.4 percent versus 31 percent in Samoa, 4 percent in Fiji, and none in either Solomon Islands or Vanuatu (Figure 2). Compared to a broader dataset available for 75 other countries in 2014, PNG’s mobile banking usage remains relatively strong—e.g., while 58 percent of Kenyan and an average of 12 percent of Sub-Saharan African adults use mobile banking, the middle income average was only 2 percent.
Table 2. Financial Access Indicators
Papua New Guinea
Lower Middle Income
Countries
Developing Asia
2005 2010 2013 2013 2013
Branches Commercial bank branches per 100,000 adults 1.9 1.7 1.9 13.9 11.1 Commercial bank branches per 1,000 km2 0.2 0.2 0.2 n.a. n.a. ATMs per 100,000 adults n.a. 5.8 8.4 23.1 25.9 ATMs per 1,000 km2 n.a. 0.5 0.8 n.a. n.a. Credit union and cooperatives per 100,000 adults n.a. 1.5 1.7 n.a. n.a. Credit union and cooperatives per 1,000 km2 n.a. 0.1 0.2 n.a. n.a. All MFI branches per 1,000 km2 n.a. 0.1 0.1 n.a. n.a. Savings (per 1,000 adults) Deposit accounts with commercial banks 155.3 177.8 268.7 757.4 850.3 Deposit accounts with credit unions and cooperatives n.a. 63.2 57.0 n.a. n.a. Credit (per 1,000 adults) Loan accounts with commercial banks 28.3 23.4 41.0 165.4 178.4 Loan accounts with credit unions and cooperatives 15.7 20.4 14.4 n.a. n.a.
Source: IMF Financial Access Survey database.
Figure 2. Mobile Banking Accounts (percent of adults reporting, 2012* and 2014)
Notes: Data for Fiji, PNG, Samoa, Solomon Islands, and Vanuatu (*) from 2012 Alliance for Financial Inclusion data. All 75 other countries from 2014 World Bank Global Financial Inclusion database (over 15 years of age).
PNG* (9.4%)
-
10
20
30
40
50
60
70

PAPUA NEW GUINEA
INTERNATIONAL MONETARY FUND 7
C. Country Specific Barriers to Financial Inclusion
7. The World Bank’s 2014 Financial Development Report provided an extensive analysis of financial development, access, and inclusion issues. This analysis identified seven major reasons why people from both developed and developing countries do not own formal bank accounts, based on a cross-country survey of 70,000 unbanked individuals across regions. The survey found that a lack of financial resources, high costs of opening and maintaining accounts, a lack of accessibility of financial service providers, and a lack of required documentation, were among the most common reasons for remaining outside of the formal financial system (Figure 3). Many of the impediments to financial inclusion identified from the cross-country survey are directly relevant to PNG.
8. PNG is at the lower end of the middle-income country spectrum, so the most common survey response—a lack of financial resources—is certainly a factor influencing the level of FI. Furthermore, per capita income levels in PNG are somewhat misleading because the income distribution is highly skewed. Information on the income distribution is somewhat dated for PNG given infrequent surveys, but the last publicly-available comparable cross-country data from 1996 shows that PNG had a Gini index coefficient8 of 519, and a share of national income held by the richest 20 percent of the population of over 56 percent.10 This ranked PNG as the country with the 7th most unequal income distribution of those for which data are available in that year. In this context, while the positive relationship between poverty, inequality, and a lack of formal participation in the financial system has been well established,11 increasing per capita income and improving the wealth distribution is a slow process that involves the full spectrum of public policies over long horizons.
8 The Gini index measures the extent to which the distribution of income deviates from a perfectly equal distribution—an index of 0 represents perfect equality, while an index of 100 implies perfect inequality. 9 For comparison purposes, the highest Gini coefficient index reported by the World Bank for 2012 was Brazil at 53. 10 For comparison purposes, the highest comparable income share reported by the World Bank for 2012 was Colombia at 58 percent. 11 For example, see “Financial inclusion, rather than size, is the key to tackling income inequality.” (BBVA Research Paper, Feb. 2015). This study finds that FI contributes significantly to reducing income inequality, although the size of the financial sector per se is not an important factor. https://www.bbvaresearch.com/wp-content/uploads/2015/02/WP_Financial-Inclusion-Income-Inequality4.pdf
Figure 3. Reasons for Not Having a Bank Account
Source: World Bank Financial Development Report 2014. Note: Respondents could choose more than one reason.
5
13
18
20
23
25
30
0 5 10 15 20 25 30 35
Religious Reasons
Lack of Trust
Lack of Documentation
Not Accessible
Too Expensive
Family Member has Account
Not Enough Money
Adults Without an Account (%)

PAPUA NEW GUINEA
8 INTERNATIONAL MONETARY FUND
9. Other commonly-reported barriers to financial inclusion are areas where focused reforms have the potential to generate improvements over shorter horizons. First, the small number of financial intermediaries in PNG (e.g., only 4 full-service commercial banks) may suggest limited competition. While such a determination would require a detailed analysis of regulatory and other issues beyond the scope of this paper, banking in PNG is clearly highly profitable and financial services display relatively high costs. In this context, banks’ return on equity (ROE) is a useful indicator of competition. By this measure, PNG hosts one of the most profitable banking sectors in the world, with a average ROE of 35 percent in 2011, ranking it in the 98th percentile out of 177 countries for which cross-country data were available, or the 4th highest across all income groups and regions (Figure 4.A).
Figure 4.A. Cross-Country Bank Profitablity—Return on Equity (percent, 2011)
Source: World Bank Financial Development and Structure Data. 177 countries (countries with positive ROEs shown).
Figure 4.B. Cross-Country Costs of Banking Services—Interest Rate Spreads (percent, 2014)
Sources: World Bank Development Indicators data and author’s calculations. 115 countries for which data was available.
10. Another useful indicator of both the cost of accessing credit and savings incentives facing consumers is the spread between deposit and lending rates. In 2014, banks in PNG
PNG (34.8%)
0
5
10
15
20
25
30
35
40
45
PNG (9.1%)
0
5
10
15
20
25
30
35
40
45
50

PAPUA NEW GUINEA
INTERNATIONAL MONETARY FUND 9
operated with an average interest rate spread of 9 percent, which places it in the 79th percentile of the 115 countries for which information is available (Figure 4.B). Spreads in PNG are considerably higher than the average for all other Middle Income countries (6 percent) and East Asian and Pacific countries (5 percent). While a number of factors can influence outcomes in these areas including sector depth, bank funding and business models, risk-related considerations, etc., the profitability and costs associated with basic banking services are very high in PNG. This likely reflects high costs of doing business for banks, and may also reflect a lack of competition, both of which pose significant challenges for increasing financial inclusion.
11. Another challenge reported by respondents to the World Bank financial access survey that is relevant to PNG relates to the accessibility of financial services. This has been cited as having particular relevance for PNG by both banks and the authorities.12 As discussed in Section B, the scarcity of banks, bank branches, and access points (ATMs) relative to population size suggest that a lack of access is a crucial impediment to FI in PNG. This lack of accessible financial services is at least partly driven by the low level of urbanization and the fact that rural areas are often vast, sparsely populated, poorly connected by roads or other means to urban centers, and often lack basic services such as electricity. PNG is in fact the 3rd least urbanized country out of 216 for which data were available in 2014, with only about 13 percent of the total population residing in urban areas (Figure 5). These geographic and demographic factors together contribute to the relatively high costs to banks of establishing and maintaining a presence in rural areas.
Figure 5. Urban Population (percent of total population, 2014)
Sources: World Bank Development Indicators database and author’s calculations. 216 countries with available data.
12. Burdensome documentation requirements were also reported by respondents to the World Bank survey as a major impediment to FI. Banks in PNG report that compliance with regulations related to customer registration and monitoring—commonly referred to as ‘Know Your
12 This was cited in discussions with BPNG, regional governments, commercial banks, and representatives of the private sector during the 2015 Article IV consultation mission.
PNG (13%)
0
20
40
60
80
100

PAPUA NEW GUINEA
10 INTERNATIONAL MONETARY FUND
Customer’ (KYC) rules—imposed by domestic regulations and international standard setters such as the Financial Action Task Force (FATF), have led to increasing documentation and relationship-management requirements. These requirements have discouraged both banks and customers—who may not have the needed documents, formal addresses, etc.—from opening new accounts or maintaining previously existing ones. Banks have noted that these requirements have significantly increased the costs associated with account opening and servicing. For small and often rural depositors, associated costs to banks often exceed potential returns.
13. Other barriers to the utilization of financial services are also evident in PNG. First, lack of financial awareness and basic education are closely associated with low levels of financial access and inclusion. In this regard, PNG scores poorly on most comparable indicators of educational achievement. In 2010, only about 44 percent of the adult population (over 15 years) had received formal primary education (World Bank). This owes in part to the challenges enumerated above (low levels of urbanization, low population density in rural areas, and a lack of basic services outside of cities). Second, other related structural factors create hurdles for those who may wish to establish formal bank accounts and access credit from financial institutions. One important barrier in this regard is the customary land ownership system, whereby the vast majority of private land in PNG—about 97 percent—is legally owned by tribal groups,13 and therefore cannot be pledged by any individual or family as collateral against a loan or other form of credit. Similarly, the potential legal complexities associated with enforcing such forms of communal collateral involving many stakeholders discourage would-be creditors from accepting this form of pledge. Third, as cited in the World Bank financial access survey, religious and cultural influences are likely to have some impact on financial behavior in PNG.
14. In sum, PNG suffers from a number of barriers to improving financial access and inclusion associated with both its level of economic development and country-specific factors. While the level of economic and financial sector development, per capita national income and its distribution are clearly barriers to inclusion, these are challenges that can only be addressed through implementing a comprehensive program of macroeconomic and financial sector reforms over long horizons. Other country-specific factors, policies, and market failures also constitute important barriers to financial inclusion, many of which can be addressed by focused policies and initiatives with potential to produce appreciable results over shorter horizons. In line with the challenges outlined above, such initiatives could include:
Stimulating Competition for Financial Services: Measures aimed at reducing regulatory and other potential barriers to competition for financial services in the local market would need to be implemented without compromising financial stability or prudential standards.
13 Land ownership is mainly governed by traditional law. About 3 percent of the land in PNG is outside of this system, and this is almost entirely owned by the National Government (http://www.pngembassy.org/infrastructure.html).

PAPUA NEW GUINEA
INTERNATIONAL MONETARY FUND 11
Reducing Costs: Policies or initiatives aimed at addressing geographic, infrastructure-related, and cost of servicing hurdles to financial access would be particularly well suited to PNG. A growing number of countries across the world have had notable success leveraging wireless and mobile technology to overcome related challenges, and PNG’s progress thus far is encouraging.
Simplifying Regulations: Adjustments to KYC and other regulatory hurdles for rural customers or those with small balances would also help to reduce costs to consumers, encourage service provision, and overcome documentation challenges.
Financial Education: Initiatives aimed at improving financial education, particularly for rural or undereducated populations, would help to encourage the unbanked to seek out financial services and to diversify the services that they wish to take advantage of from banks.
15. While a formal assessment of the results of the 2014-15 NFIFLS will only be finalized and made public in 2016, early indications suggest considerable progress toward its formal objectives. BPNG reports that over half of the one million targeted unbanked low-income individuals had been reached by financial services by July 2015, 32 percent of whom were women. Furthermore, major strides had been made towards expanding access via the licensing of 5 new micro-banks, as well as the rapid proliferation of micro-insurance products. For instance, over 150,000 new policies were issued since the industry began operating. BPNG also made progress with enhancements of regulation and improving domestic clearing and settlement infrastructure aimed at facilitating telecommunications and financial service providers’ entry into the mobile banking arena.
16. Looking forward, BPNG aims to finalize its stocktaking of progress with the strategy during the last quarter of 2015, and work with development partners to develop successor strategies and related initiatives. In addition to pursuing the useful objectives set out under the current NFIFLS, future strategies could include new initiatives aimed at reducing the costs of basic services (deposit accounts, loans, and simple foreign exchange products and services) by reducing barriers facing new entrants to the commercial banking sector, in order to promote competition. Any successor strategy should also maintain a focus on regulatory and other measures aimed at encouraging faster and broader proliferation of mobile banking and insurance products, which have proven highly effective in other low- and middle-income countries across the world. Mobile banking services are also particularly well suited to the specific geographic and demographic challenges facing PNG and could serve as a catalyst for both new customers and the entry of new financial service providers by overcoming costly infrastructure requirements. The authorities should also continue to draw on research, resources, and cross-country experience available from development partner agencies that are increasingly playing a role in promoting and disseminating best practices concerning policy design and implementation.

PAPUA NEW GUINEA
12 INTERNATIONAL MONETARY FUND
References
Andrianaivo, Mihasonirina and Kangni Kpodar, 2011, “ICT, Financial Inclusion, and Growth: Evidence from African Countries”, IMF Working Paper, WP/11/73, (International Monetary Fund, Washington D.C.)
Bank of Papua New Guinea, 2014, “National Financial Inclusion and Financial Literacy Strategy 2014-2015”, (Bank of Papua New Guinea, Port Moresby)
García-Herrero, Alicia and David Martínez Turégano, 2015, “Financial inclusion, rather than size, is the key to tackling income inequality”, Working Paper no. 15/05, (BBVA Research)
International Monetary Fund, 2008, “Financial Sector Assessment: A Handbook”, (International Monetary Fund, Washington D.C.)
World Bank, 2012, “The Foundations of Financial Inclusion—Understanding Ownership and Use of Formal Accounts”, (World Bank, Washington D.C.)
World Bank, 2014, “Global Financial Development Report—Financial Inclusion”, (World Bank, Washington D.C.)
World Bank, 2015, “The Global FINDEX Database—Measuring Financial Inclusion Around the World”, (World Bank, Washington D.C.)

PAPUA NEW GUINEA
INTERNATIONAL MONETARY FUND 13
EVOLUTION OF PNG'S FX REGIME1 A. Introduction
1. The exchange rate in PNG has been heavily affected by capital inflows related to a large LNG project in recent years. The kina appreciated vis-à-vis the U.S. dollar by about 30 percent between 2008 and 2011 due to large capital inflows related to the LNG project construction phase and depreciated by around 25 percent from 2012 to end September 2015, following the winding down of the construction boom (Figure 1). The real effective exchange rate of the kina has appreciated by 55 percent from 2008 to end September 2015 reflecting PNG’s higher inflation relative to its trading partners, despite the recent depreciation in nominal terms.
2. BPNG has made extensive efforts to mitigate excessive volatility in the kina. It has actively intervened in the FX market to fill a structural shortage of FX, while trying to maintain a floating exchange rate regime. In June 2014, BPNG introduced a trading band of 150 basis points with a view to narrowing the dispersion of the exchange rate used by commercial banks in their transactions with customers, leading to a large appreciation of the kina market rate, in spite of underlying fundamentals. However, the restricted range of USD/kina movement resulted in a change in the IMF’s de facto exchange rate regime classification, from floating to a crawl-like arrangement.
3. This paper aims to describe the costs and benefits of alternative FX market participation options that BPNG may wish to consider as it selects how best to reform PNG’s FX market. The following section presents recent developments in the FX market and the changes in the FX regime over the last several years, followed by a review of international experiences with FX allocation mechanisms and their associated benefits and drawbacks.
B. Developments in PNG’s FX Market
4. The current FX market in PNG is characterized by few suppliers, a structural shortage of FX, and a one-sided market.2 FX inflows mainly comprise mineral and LNG tax receipts and income from foreign investment. The main sources of BPNG’s foreign exchange are also mineral and LNG tax receipts and royalties. FX sales by BPNG have accounted for the major portion of FX market supply for the last couple of years. There are no FX surrender requirements but starting March 2015 resident exporters are required to repatriate FX proceeds in excess of their foreign liabilities within three months.3 Commercial banks are encouraged by BPNG to clear some of their in-house flows by matching exporter and importer trades but there have been no banks with positive net FX balances 1 Prepared by Henry Mooney and Kazuaki Washimi. We would like to thank Chikako Baba, Ricardo Cervantes and Judit Vadasz for their helpful background work, inputs, and comments. 2 Staff is currently assessing PNG’s FX system for potential exchange restrictions and multiple currency practices. 3 For further information on the March 2015 FX directive, please see http://www.bankpng.gov.pg/announcement/foreign-exchange-control-directives/. Accounts established under project development agreements such as the LNG PNG project are exempt from this requirement.

PAPUA NEW GUINEA
14 INTERNATIONAL MONETARY FUND
00.511.522.533.544.55
80
90
100
110
120
130
140
2006
2007
2008
2009
2010
2011
2012
2013
2014
2015
(2010=100)
Introductionof trading band
Figure 1. Exchange Rate and Reserves
Sources: Country authorities; and IMF staff estimates.
(In US$ billion)
International reserves (RHS)
USD/kina(market rate)
-4
-2
0
2
4
6
8
1012
2006
2007
2008
2009
2010
2011
2012
2013
2014
2015
Private capital flows
Others (other investment)
(In US$ billion)
Figure 2. Capital and Financial Account
0
1
2
3
4
5
6
2008 2009 2010 2011 2012 2013 2014 2015
Reserve money
of which: Excess reserves
(In K billion)Figure 3. Excess Reserves
Sources: Country authorities; and IMF staff estimates.
-2.5
-1.5
-0.5
0.5
1.5
2.5
3.5
2008 2009 2010 2011 2012 2013 2014
Net Foreign AssetsNet Domestic AssetsChange in Assets
(In K billion, change from the previous year)
Figure 4. Change in BPNG's Assets
that could be traded with other banks in recent years. Foreign currency exposure limits for banks are 15 percent of capital for all currencies combined and 10 percent of capital for a single currency. BPNG has applied a number of regulations to the FX market, as described below.
5. FX inflows from FDI in the massive LNG project led to a sharp appreciation of the USD/kina rate, with gross foreign reserves rising from around $2 billion to $4.5 billion, from 2008-11. During this period, FX supply was abundant due to inflows associated with the PNG LNG project construction phase and strong commodity prices (Figure 2). With the completion of the construction phase in 2013, gross reserves fell to around $2.5 billion in mid-2014 (Figure 1), leading to downward pressure on the USD/kina rate and volatility in the FX market with large bid/ask spreads charged by banks, and the FX market dominated by a few large banks. Foreign reserves amounted to US$2.0 billion at end September 2015.
6. Large, partially sterilized FX inflows in 2009-12, followed by large fiscal deficits since 2012,4 led to a buildup of excess liquidity. The increase in excess banking system reserves is
4 The fiscal deficits were largely financed by commercial banks’ purchase of government securities, and the central bank did not fully offset the increase in the money supply through open market operations.

PAPUA NEW GUINEA
INTERNATIONAL MONETARY FUND 15
associated with the insufficient sterilization of FX inflows and fiscal expansion of the past three years (Figure 3 and 4). Excess liquidity has also reflected the practice of transferring unused funds stemming from poor project implementation into trust accounts towards the end of the fiscal year. These trust accounts are held in commercial banks and complicate monetary policy.
7. Despite pressures, the official (interbank) USD/kina rate was held constant from October 2013 to early June 2014. However, BPNG’s net FX sales in the interbank market were insufficient to meet the demand of authorized dealers (mostly banks). As a result, official and market rates diverged, especially after 2013, as authorized dealers sold the available FX at heavily depreciated rates to their customers to meet demand. At the same time, the spreads in the retail market widened sharply. 8. In June 2014, BPNG imposed a narrow FX trading band to bring the market rates closer to the official rate, leading to an immediate 17 percent appreciation in the USD/kina market rate. The trading band is linked to the official rate, so that prices were not permitted to deviate by more than 75 points on either side of this reference rate. The band is fixed each trading day with the opening price5 used as a reference rate for the day. Following the introduction of the trading band, the USD/kina rate has depreciated by 16 percent thus far. Despite the depreciation, the FX market remains short as reflected in the long queues for FX reported by banks. In March 2015, BPNG issued the aforementioned FX directive that restricts trading outside of the official interbank FX market. In addition to a three month FX repatriation requirement for resident exporters, this includes requirements that authorized dealers close any offshore foreign currency accounts that do not have BPNG approval and convert the balances to kina, and signaled an upcoming audit of offshore foreign currency accounts, after which no new offshore foreign currency accounts would be approved.
9. Meanwhile, the average daily FX turnover has been on a declining trend. The average daily FX auction volume (including BPNG’s activities) has declined somewhat over time, albeit with fluctuations, and amounted to approximately K 130 million at end August 2015 (Figure 5).
5 The opening price is determined by the previous day’s closing price; or a bid higher than the previous day’s closing price; or an offer lower than the previous day’s closing price.
60
80
100
120
140
160
180
200Ju
n-12
Sep-
12
Dec
-12
Mar
-13
Jun-
13
Sep-
13
Dec
-13
Mar
-14
Jun-
14
Sep-
14
Dec
-14
Mar
-15
Jun-
15
Average Daily Volume
Trend line
(In K million)Figure 5. Volume of FX Trading
Sources: Country authorities; and IMF staff estimates.

PAPUA NEW GUINEA
16 INTERNATIONAL MONETARY FUND
10. The FX market in PNG has evolved over the past few years. At present, the interbank market is brokered by the central bank, which acts as the market maker. While banks can satisfy some of their clients’ FX needs internally, banks in general do not exhibit the type of positive FX balances required for continuous interbank trading, and BPNG interventions are the main source of FX in the interbank market. BPNG collects all bids and offers from six qualified participants,6 operates a trading platform (i.e., a Reuters screen) for bid and offer prices, and following an order matching process among the qualifying participants, sells FX to counterparties selected at its discretion at the ‘live market price’ (defined as the highest bid displayed at the time of the transaction on the Reuters trading screen).
C. Benefits and Drawbacks of Alternative FX Market Mechanisms
Common FX Market Mechanisms and Regime Types
11. Most IMF members report spot FX market structures that involve some form of direct central bank participation and/or active interbank markets. In 2013, PNG was classified in the IMF’s Annual Report on Exchange Rate Arrangements and Exchange Restrictions (AREAER) as displaying a de facto7 floating exchange rate regime,8 with an interbank spot FX market, and no central bank operated FX mechanism. PNG has since been reclassified as a de facto crawl-like arrangement9 effective April 2014 as a result of the restricted range of exchange rate movement, while the central bank’s current role and form of participation in the FX market has not yet been classified for AREAER purposes.
12. Across IMF members, the most commonly-reported forms of central bank operated and market-driven FX market mechanisms include: (i) FX standing facilities; (ii) auctions; (iii) FX allocation mechanisms; (iv) the use of fixing sessions; and (v) interbank markets. Figure 6 presents the results of an analysis of FX market structures reported to the Fund that maps both central bank operated and market-driven mechanisms to de facto exchange rate regimes, as reported by the 2014 AREAER exercise (2013 data). The specific characteristics, requirements, and compatibility of each mechanism with the 10 exchange rate regime types defined by the IMF are discussed below.
6 The set of authorized dealers includes the four commercial banks—ANZ Bank PNG, Bank South Pacific, Westpac Bank PNG, May Bank PNG—as well as First Investment Finance Limited and Moni Plus Limited. 7 The AREAER’s ‘de facto’ exchange rate arrangement classification is based on an empirical analysis linked to established criteria, while the ‘de jure’ exchange rate arrangement is reported by authorities. 8 A floating exchange rate is largely market determined, without an ascertainable or predictable path for the rate. FX market intervention may be either direct or indirect, and serve to moderate the rate of change and prevent undue fluctuations in the rate, but policies targeting a specific level of the exchange rate are incompatible with floating. 9 Classification as a crawl-like arrangement requires an exchange rate to remain within a margin of 2 percent relative to a statistically identified trend for six months or more, and the arrangement is not considered floating.

PAPUA NEW GUINEA
INTERNATIONAL MONETARY FUND 17
Figure 6. Mapping of Foreign Exchange Market Mechanisms to Exchange Rate Regimes
(data for 2013)
Note: Color scale reflects a mechanism’s (row) frequency of occurrence by regime type (column)—red being the highest, yellow the mid-rage, and blue the lowest frequency by row. Source: This table is based on the author’s analysis of data and information drawn from the 2014 IMF AREAER database. The sample includes 191 countries for which data were available.
Central Bank Operated Mechanisms (as classified by the AREAER)10
i. Standing Facilities (75): allow market participants to trade (buy or sell) FX with the central bank at predetermined exchange rates, and are usually instrumental in maintaining hard pegs and other more rigid intermediate arrangements. In this context, the credibility of such a facility depends to a large extent on the availability of international reserves to back the facility, particularly in the face of speculation. In 2013, standing facilities were in operation for all currency boards (12), nearly all conventional pegs (43 out of 44), as well as some other forms intermediate and residual arrangements.
ii. FX Auctions (32): organized by the central bank for designated market participants can take the form of multiple-price auctions (all successful bidders pay the price they offer), or single-price auctions (all successful bidders pay the same price, which is the market-clearing/cut-off price). One-way auctions require a strong ex ante commitment to transparency and either a pledge to support a fixed price target (as with managed regimes) by satisfying the market with reserves until the price target is achieved, or to allowing participants to determine the market-clearing
10 The definitions and descriptions of FX mechanisms classified by the AREAER draw from the 2014 Report, as well as other sources and the analysis described in Figure 6.
Residual
No Separate
Legal Tender
Currency
Board
Conventional
Peg
Stabilized
ArrangementCrawling Peg
Crawl-like
Arrangement
Pegged ER
w/in
Horizontal
Bands
Other
Managed
Arrangement
Floating Free Floating
(13) (12) (44) (21) (2) (15) (1) (18) (36) (29)
FX Standing
Facility (75) 0 12 43 9 2 2 1 5 1 0
FX Auction (32) 0 0 1 6 0 4 0 4 16 1
FX
Allocation
System
(27) 0 0 16 6 0 1 0 3 1 0
Fixing
Sessions(6) 0 0 0 0 0 1 0 3 2 0
Interbank
Market(161) 6 5 35 18 2 14 1 16 36 28
Market Driven Mechanisms
Hard Pegs Intermediate Regimes (Soft Pegs) Floating Regimes
2013 De Facto
Regime / Spot
Market Mechanism
(sum totals)
Operated by Central Bank

PAPUA NEW GUINEA
18 INTERNATIONAL MONETARY FUND
rate under a fixed volume structure. 11 Any attempt to fix both the price and volume of FX in an auction would distort the exchange rate, and is likely to encourage participants to transact in parallel markets, potentially creating a multiple currency practice. The frequency of auctions depends mainly on the amount or availability of FX to be auctioned and on the role the auction plays in the FX market. In 2013, these were most commonly used by countries with floating exchange rate regimes (16), as well as in the context of intermediate regimes (e.g., stabilized arrangements (6)) often for intervention, intermediation, and/or market development.
iii. FX Allocation Systems (27): involve the redistribution of FX inflows by the central bank to market participants for specific international transactions (e.g., strategic imports such as oil or food) when international reserves are scarce. In an allocation system, participants often transact directly with the central bank, and commercial banks may buy FX primarily for their clients’ qualifying transactions. These arrangements are often associated with FX rationing and can give rise to exchange restrictions such as those that run counter to an IMF member’s obligations under Article VIII (Sections 2, 3, and 4) of the Articles of Agreement.12 They were most common for conventional pegs (16) and stabilized arrangements (6) in 2013.
iv. FX Fixing Sessions (6): are most often organized by central banks operating in countries at an early stage of market development, with shallow markets, and/or with few or inexperienced participants in order to help establish a reference exchange rate. During fixing sessions, the central bank often actively participates in price formation by selling or buying during the session to achieve a certain exchange rate target. The price determined at the fixing session is often used for FX transactions outside the session and/or for accounting and valuation purposes. These were not common in 2013, and were primarily employed in the context of residual arrangements (3) and floating regimes (2).
Market-Driven Mechanisms
v. Interbank Markets (161): are operated by private banks and other market participants, and could be found in most countries in 2013 (161 of 191). The main types of interbank markets reported by Fund members in 2013 include over-the-counter markets, brokerage arrangements, and market-making arrangements. In order to function properly and efficiently, there needs to be an adequate and continuous supply of FX flowing into and through the banking system. However, interbank markets tend only to operate without the simultaneous presence of some form of central bank operated mechanism(s) in the context of free floating arrangements (28 out of 29), or where there is no separate currency (6 out of 6). In these cases, the exchange rate will be uniquely determined by the market, and while this is beneficial in terms of its ability to
11 For flexible exchange rate regimes, in cases where reserves are scarce, and when objectives include supporting market development via price discovery, fixed volume formats are most appropriate. For pegged or stabilized regimes, fixed price formats are required. 12 Obligations under the IMF’s Article VIII include: Section 2—avoidance of restrictions on current payments; Section 3—avoiding discriminatory currency practices; and Section 4—ensuring the convertibility of foreign-held balances.

PAPUA NEW GUINEA
INTERNATIONAL MONETARY FUND 19
insulate reserves, allow the exchange rate to operate as a shock absorber, and encourage participants to transact on the expectation of two-way price movements, it also exposes countries to the potential for exchange rate volatility and overshooting, especially if introduced when the exchange rate is overvalued. Such a system can also allow participants with market power to extract rents if not accompanied by supplemental regulations such as trading bands.
Reform Considerations
13. The choice of FX market mechanism(s) must be consistent with the exchange rate regime and supporting macroeconomic policies. While free floating exchange rate regimes are consistent with FX market structures involving only interbank markets, most other regime types tend to be accompanied by some form of central bank operated mechanism(s) in order to facilitate FX intervention, intermediation, and/or market development. The choice of FX market structure and mechanisms must be supported by an appropriate macroeconomic policy framework. If exchange rate pressures are persistent and driven primarily by policy distortions (e.g., expansionary fiscal policies, external imbalances, exchange rate manipulation, abundant liquidity, etc.), monetary and fiscal policy settings must be adjusted to ensure a well functioning FX market.
14. When macroeconomic policies are appropriate, but exchange rates are distorted by the level of market development or rigidities, then well-chosen FX market mechanisms can help improve outcomes. In many countries, the depth, structure, or operation of the financial system can compromise FX price discovery and lead to distortions. There are many drivers of such distortions, including poorly-functioning payment and settlement infrastructure slowing transactions between private parties; a lack of FX supply or intermediaries distorting demand and allocation; and/or intermediaries that are inefficient or can exercise market power leading to high costs and wide spreads. Distortions may also be driven by ineffective monetary policy instruments that prevent central banks from effectively signaling or implementing policies. Some form of central bank participation in the market can help to reduce the impact of related distortions by, for example, settling FX transactions with financial institutions via their accounts with the central bank thus bypassing weak settlement systems; taking over the role of the primary FX market intermediary (i.e., making markets); and/or establishing fair and efficient bidding and/or pricing rules via auctions, etc. In such cases, a shift away, for example, from a purely market-driven interbank system may improve efficiency and support broader policy goals.
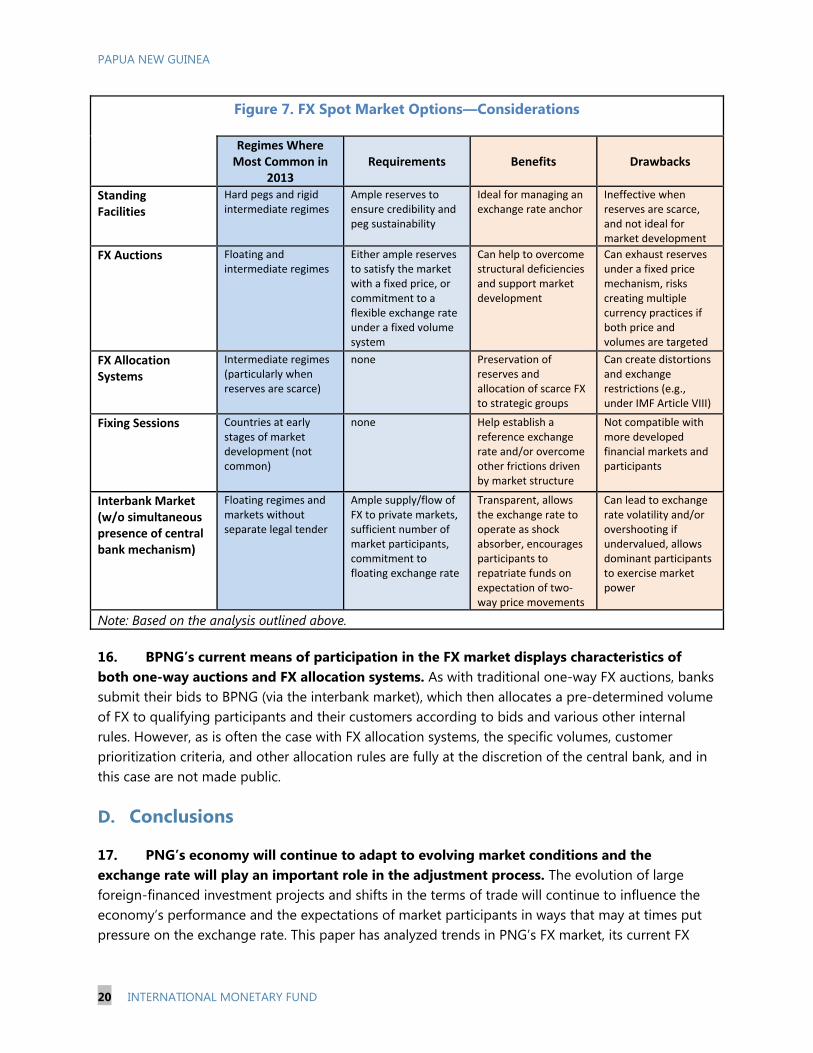
15. Some key requirements and considerations for the choice of FX market participation mechanisms based the analysis presented above are presented in Figure 7.
PAPUA NEW GUINEA
20 INTERNATIONAL MONETARY FUND
Figure 7. FX Spot Market Options—Considerations
Regimes Where Most Common in
2013 Requirements Benefits Drawbacks
Standing Facilities
Hard pegs and rigid intermediate regimes
Ample reserves to ensure credibility and peg sustainability
Ideal for managing an exchange rate anchor
Ineffective when reserves are scarce, and not ideal for market development
FX Auctions Floating and intermediate regimes
Either ample reserves to satisfy the market with a fixed price, or commitment to a flexible exchange rate under a fixed volume system
Can help to overcome structural deficiencies and support market development
Can exhaust reserves under a fixed price mechanism, risks creating multiple currency practices if both price and volumes are targeted
FX Allocation Systems
Intermediate regimes (particularly when reserves are scarce)
none Preservation of reserves and allocation of scarce FX to strategic groups
Can create distortions and exchange restrictions (e.g., under IMF Article VIII)
Fixing Sessions Countries at early stages of market development (not common)
none Help establish a reference exchange rate and/or overcome other frictions driven by market structure
Not compatible with more developed financial markets and participants
Interbank Market (w/o simultaneous presence of central bank mechanism)
Floating regimes and markets without separate legal tender
Ample supply/flow of FX to private markets, sufficient number of market participants, commitment to floating exchange rate
Transparent, allows the exchange rate to operate as shock absorber, encourages participants to repatriate funds on expectation of two-way price movements
Can lead to exchange rate volatility and/or overshooting if undervalued, allows dominant participants to exercise market power
Note: Based on the analysis outlined above.
16. BPNG’s current means of participation in the FX market displays characteristics of both one-way auctions and FX allocation systems. As with traditional one-way FX auctions, banks submit their bids to BPNG (via the interbank market), which then allocates a pre-determined volume of FX to qualifying participants and their customers according to bids and various other internal rules. However, as is often the case with FX allocation systems, the specific volumes, customer prioritization criteria, and other allocation rules are fully at the discretion of the central bank, and in this case are not made public.
D. Conclusions
17. PNG’s economy will continue to adapt to evolving market conditions and the exchange rate will play an important role in the adjustment process. The evolution of large foreign-financed investment projects and shifts in the terms of trade will continue to influence the economy’s performance and the expectations of market participants in ways that may at times put pressure on the exchange rate. This paper has analyzed trends in PNG’s FX market, its current FX
PAPUA NEW GUINEA
INTERNATIONAL MONETARY FUND 21
market structure, and the potential benefits and drawbacks of various alternative FX market structures and mechanisms, which may help guide BPNG as it considers ways to improve the efficiency and operation of its FX market. Given a suitable macroeconomic policy framework, the choice and design of central bank managed FX market mechanism(s) can help to improve transparency, predictability, market confidence, and efficiency.
18. Selecting the best way to reform PNG’s FX market involves trading off costs and benefits, and a commitment to supportive macroeconomic policies. While FX allocation systems are best suited to safeguarding scarce FX and may help to maintain exchange rate stability in the short run, these mechanisms are often accompanied by FX rationing and may create costly distortions and exchange restrictions. A fixed exchange rate can be implemented using a fixed-price auction, but this requires an adequate supply of foreign reserves. The allocation of scarce FX can be done efficiently through a one-sided fixed volume auction, but this requires a willingness to let the exchange rate adjust fully to clear the market. Scarce FX can alternatively be allocated through an interbank FX market, provided the market functions efficiently, but again this requires a willingness to let the exchange rate adjust fully to clear the market.
19. Given the need to safeguard reserves, FX demand conditions, the commodity-intensive economy, and BPNG’s status as the dominant supplier of FX, one-way fixed-volume auctions could serve as a viable alternative. If allowed to operate freely, one-way auctions would have the advantage of providing greater transparency and predictability with respect to pricing, sales volumes, and allocation than the current mechanism for central bank intervention. Similarly, it would allow the central bank to target intervention volumes explicitly based on objectives for international reserves. Interbank markets could continue to operate in tandem with auctions, and once FX supply and demand conditions are sufficiently conducive, the central bank could calibrate its participation in auctions in ways that best support private FX trading and market development. It should, however, be stressed that sustainable FX market structures must be underpinned by suitable fiscal and monetary policies, without which distortions will reemerge regardless of the chosen mechanisms.

PAPUA NEW GUINEA
22 INTERNATIONAL MONETARY FUND
References
Canales-Kriljenko, Jorge Iván, 2004, “Foreign Exchange Market Organization in Selected Developing and Transition Economies: Evidence from a Survey,” IMF Working Paper, WP/04/4, (International Monetary Fund, Washington D.C.)
Habermeier, Karl and Annamaria Kokenyne, Romain Veyrune, and Harald Anderson, 2009, “Revised System for the Classification of Exchange Rate Arrangements,” IMF Working Paper, WP 09/2011, (International Monetary Fund, Washington D.C.)
International Monetary Fund, 2014, “Annual Report on Exchange Arrangements and Exchange Restrictions 2014,” (International Monetary Fund, Washington D.C.)
International Monetary Fund, Annual Report on Exchange Arrangements and Exchange Restrictions (AREAER) Online Database (http://www.elibrary-areaer.imf.org/Areaer/Pages/ChapterQuery.aspx)

PAPUA NEW GUINEA
INTERNATIONAL MONETARY FUND 23
STRUCTURAL REFORMS FOR SUSTAINABLE AND INCLUSIVE DEVELOPMENT IN PNG1 A. Introduction
1. PNG is one of the most diverse and resource rich countries in the world and the government has a comprehensive set of development plans for promoting overall growth by harnessing these resources. Its vast and varied geography includes mountains, tropical forests, grasslands, rivers, deltas, islands, and atolls leading to a wide variety of assets such as minerals, petrochemicals, forests, fisheries, agricultural resources as well as local customs and knowledge. With a population of around 7.5 million2 and 848 languages (Lewis, Simmons, & Fennig, 2015), it is also one of the world’s most culturally diverse nations. The government’s development plans, the Vision 2050, the Development Strategic Plan 2030 and the associated Medium Term Development Plans (MTDP) focus on maximizing growth from extractive industries in an environmentally sustainable manner and developing PNG’s human capital, and renewable resources such as agriculture, in an inclusive way.
2. Extractive industries have been the main driver of growth in the recent past and continue to account for an increasing share of exports and output. Completion of the US$19 billion ExxonMobil liquefied natural gas (LNG) project has changed the structure of the economy. Mining and petrochemicals now comprise almost a quarter of GDP, almost the same as the primary sectors combined, and around 75 percent of exports. Other major sectors include construction, wholesale and retail trade, and manufacturing. Anecdotal evidence also suggests the presence of a large informal economy centered mainly on betel nut trade.
3. PNG has made a number of strides in macroeconomic performance in the past decade and a half. PNG’s macroeconomic fundamentals improved drastically from 2000 onwards and the economy has experienced uninterrupted positive growth since 2002, averaging 5.7 percent from
1 Prepared by Yurendra Basnett (ADB), Shelvin Karan (IMF Resident Representative’s Office for Pacific Islands, Fiji), and Chandana Kularatne (World Bank). 2 World Bank, World Development Indicators, July 2015.
Agriculture, Forestry & Fisheries
25%
Mining, Petroleum &
Gas23%
Construction17%
Manufacturing7%
Wholesale & Retail Trade
9%
Others19%
Figure 1. Composition of the PNG Economy, 2014(Percent of GDP)
Sources: Country authorities; and IMF staff calculations.

PAPUA NEW GUINEA
24 INTERNATIONAL MONETARY FUND
2002-14. In the same period there has been notable progress in urban infrastructure, real estate, and private sector development supported by higher demand siphoned from the construction of the LNG plant and priority spending by government on key infrastructure.
4. However, PNG still has a considerable level of poverty and suffers from poor development outcomes. While data on poverty levels is somewhat sketchy and outdated, analysis of household income and expenditure survey (HIES) data reveal that almost 40 percent of the population lived below the national poverty line in 2009. Other studies, however, suggest no major decline in poverty levels between 1996 and 2009/10 (Gibson, 2014). An earlier study based upon 2004 data estimated that around 37.5 percent of Papua New Guineans lived on less than US$1 a day (Chandy, 2009). Major reasons for the poor development outcomes include relatively recent exposure to a cash economy and modern health and education; dispersed population; limited government capacity; and capital-intensive and extractive industry driven growth (UNDP, 2014).
5. In addition, PNG has a young and growing population that is predominantly rural and mostly engaged in the informal sector. Most of the population (around 87 percent) lives in the rural areas and is engaged in informal subsistence and semi-subsistence agriculture. Population growth has averaged around 2.3 percent over the last decade (2005-14), with around 38 percent below the age of 15, and 59 percent between the ages of 15 and 64. The relatively young population creates challenges in meeting educational and employment demands while the high overall population growth is of concern for natural resource sustainability and political stability due to pressure on land and water resources.
6. In response to these challenges, the PNG government has shifted its focus to building a more sustainable economy by developing PNG’s renewable natural resources such as agriculture, while continuing to rely on the extractive industries in a sustainable manner. In 2014, the government launched the National Strategy for Sustainable Development, and subsequently the MTDP2 2016-17, which focuses on creating an enabling environment for economic growth while ensuring proper management and use of PNG’s strategic assets to create equitable and sustainable growth.
7. This paper aims to evaluate PNG’s asset base and suggest broad areas where structural reforms are needed for sustainable and inclusive development as well as current assistance by multilateral organizations. Section B provides an evaluation of PNG’s asset base—natural resources, physical capital, and human capital—while Section C outlines a broad strategy for possible structural reforms. Section D offers a brief update on efforts by the ADB, IMF, and World Bank to support reforms in these areas followed by a summary of the key findings in Section E.

PAPUA NEW GUINEA
INTERNATIONAL MONETARY FUND 25
B. Evaluating PNG’s Asset Base
Natural Resources
8. PNG is one of the best naturally endowed countries in the world. Its major natural resources include petrochemicals and miner al deposits such as gold, copper, and nickel, as well as other non-mineral renewable resources such as fisheries, forests, and agricultural products such as coffee, cocoa, and palm oil. PNG ranks 32nd in subsoil wealth per capita globally, far ahead of peer countries in the region such as Fiji and Vanuatu.
9. However, PNG’s minerals sector is still underdeveloped and there is a lot of untapped mineral and petroleum potential. There have been large gaps between the commencements of major mining projects and there are numerous mining and petroleum projects currently in the pipeline at various stages of development. In 2014, petrochemical and mining revenues made up only 12 percent of government revenue and the sector’s share of total employment was around 7 percent. The government also provides substantial tax benefits and concessions to mining and petroleum companies which limit fiscal revenue from the sector.
10. While PNG is dependent on its natural resources for growth and development, limited mobilization of customary land creates challenges in utilizing and extracting natural resources. Almost 97 percent of land in PNG is held under customary tenure. An ineffective leasing system and ownership disputes make acquiring land difficult for both commercial and residential purposes, thereby hindering development (UNESCAP, 2015). Importantly, communally owned land cannot be used as collateral and is therefore an impediment to financial access, a major barrier to the development of micro and small enterprises.
Physical Capital
11. PNG’s huge infrastructure gap impedes economic development and adds to the high cost structure of the economy. In 2014, PNG was ranked 126th out of 160 countries based on the World Bank’s Logistics Performance Index, lower than peer countries in the region such as Fiji and Solomon Islands. PNG’s road transport infrastructure is fragmented and sub-standard and it has one of the lowest road densities in the world. Most roads are poorly maintained with many communities not connected to any road network. Apart from the rough terrain, inadequate and inefficient government spending on road infrastructure and maintenance has exacerbated the problem. Air and water transport services are also underdeveloped and suffer from high costs, delays, and concerns regarding safety standards.
0 50,000 100,000 150,000 200,000 250,000
Kuwait (1)
Brunei Darussalam (2)
Trinidad & Tobago (8)
Australia (12)
Malaysia (18)
New Zealand (27)
Papua New Guinea (32)
Indonesia (43)
Fiji (66)
Vanuatu (152)
Figure 2. Subsoil Assets per Capita*, 2005(In US$)
Source: World Bank, World Development Indicators.
* Rankings in brackets

PAPUA NEW GUINEA
26 INTERNATIONAL MONETARY FUND
12. Despite having large energy resources, PNG suffers from low access to electricity. In 2012, only 18 percent of the population had access to electricity, with access levels much lower or nonexistent in rural areas. Costs are also high due to use of diesel and other fuel for around 40 percent of generation, as hydropower only provides around 37 percent of total generation. System reliability is a concern and blackouts and rationing are common, leading many to employ their own backup generators, including major mines that are off the grid. Government has an ambitious target to increase access to 70 percent of the population by 2030 which will require increases in supply by above 7 percent annually (ANZ, 2015).
13. Internet and telecommunications infrastructure and access levels are constantly improving but still lag behind progress in other South Asian and Pacific economies. In 2013, PNG’s access levels for internet and mobile phones were 6.5 and 41 per 100 people, respectively (see also the Selected Issues Paper on financial inclusion). The introduction of competition into the mobile phone market has led to wider coverage, lower prices, and a wider variety of services. It also raises the possibility of using information and communication technology for banking, commerce, and delivery of government services. However, the United Nations (UN) still ranked PNG 188th out of 193 countries in 2014 on the E-government development index, compared to Fiji and Tonga which were ranked 85th and 98th, respectively.
14. Access to clean water and improved sanitation has deteriorated and remains critically low. The latest studies report that only 40 percent of the population has access to clean water, while 19 percent has access to improved sanitation, both deteriorating from 1990 levels (WHO/UNICEF JMP, 2015). However, there is a huge disparity between urban and rural areas, with challenges more pronounced in the latter, where 90 percent of those without access live. Key impediments include a weak framework for service delivery due to insufficient government spending, weak monitoring and tracking of expenditure, and inadequate technicians and managers. The financing gap is enormous, with around US$123 million needed each year for the government to meet its target of 70 percent access to clean water and improved sanitation by 2030, which is less ambitious than the MDG target (PNG Government, 2013).
0
20
40
60
80
100
120
East
Asi
a &
Pac
ific
(dev
elop
ing
only
)
Fiji
Paci
fic is
land
sm
all
stat
es
Papu
a N
ew G
uine
a
Sam
oa
Solo
mon
Isla
nds
Vanu
atu
Tong
a
Internet Users Mobile Phone Subscriptions
Figure 3. Internet and Mobile Phone Subscriptions, 2012(Per 100 people)
Source: World Bank, World Development Indicators.
0
20
40
60
80
100
120
East
Asi
a &
Pac
ific
(dev
elop
ing
only
)
Fiji
Paci
fic is
land
sm
all
stat
es
Papu
a N
ew G
uine
a
Sam
oa
Solo
mon
Isla
nds
Tong
a
Vanu
atu
Access to Improved Sanitation Access to Improved Water Source
Figure 4. Water and Sanitation Access, 2012(Percent of population)
Source: World Bank, World Development Indicators.

PAPUA NEW GUINEA
INTERNATIONAL MONETARY FUND 27
Human Capital
15. PNG ranks low based on the Human Development Index and lags behind peers on many health indicators. PNG was ranked 157th out of 187 countries based on the UN’s 2014 Human Development Index, lower than Zimbabwe and Myanmar, and its ranking deteriorated compared to the previous year. Life expectancy at birth is 62.4 years, slightly above the average of 61.5 years for least developed countries but much lower than 69.8 years in Fiji and 73.2 years in Samoa. The major challenges include rapid population growth, limited access to health services, high maternal mortality, shortage of medicine, and risks of both communicable and non-communicable diseases (World Health Organization, 2014). These outcomes reflect a combination of historically low spending on health and poor health care service delivery.
16. While access to basic education has improved, challenges remain in improving the quality of education. PNG is ranked very low on the global scale on education as its adult literacy rate and school enrollments are much lower than the averages for Africa, Asia, and Oceania. Mean years of schooling in PNG is only 3.9, compared to 9.9 in Fiji and 10.3 in Samoa. The government has made a number of strides in improving access to education, such as increased spending on education through the Tuition Fee-Free Policy, and the reintroduction of a national scholarship program that has boosted enrollments rates and removed some of the burden of paying for education from poorer families. However, these programs have not been sufficiently supported by improved school infrastructure especially in the rural areas, increased numbers of teachers, improved teacher training, and updated curriculum to ensure that the quality of education does not deteriorate. Individual schools may also lack proper governance structures to ensure that the tuition subsidies by government are spent efficiently and effectively.
17. Gender equality is a major concern in PNG and one of the impediments to inclusive development. In 2013, PNG was ranked 135th out of 151 countries on the UN’s Gender Inequality Index, which measures equal opportunities in the areas of reproductive health, empowerment, and economic activity. PNG’s ranking was lower than the averages for East Asia and the Pacific as well as Sub-Saharan Africa. While most forms of gender disparity are the result of PNG’s various traditional forms of gender relations, other reasons include unequal access to education, health care, and business opportunities; inadequate institutional responses for preventative measures such as national initiatives designed to promote women’s equality and advancement; and wide social acceptance of violence against women (UNDP, 2014).
406080100120140160180
01020304050607080
Bang
lade
sh Fiji
Mya
nmar
Papu
a N
ew G
uine
a
Sam
oa
Solo
mon
Isla
nds
Tong
a
Vanu
atu
Zim
babw
e
Life Expectancy at Birth (2013) Human Development Index (2014, RHS)
Figure 5. Life Expectancy at Birth and Human Development Index(In Years)
Sources: World Bank, World Development Indicators; and United Nations.

PAPUA NEW GUINEA
28 INTERNATIONAL MONETARY FUND
Institutions
18. PNG has limited institutional capacity to formulate and implement policies for sustainable and inclusive development effectively.3 According to the World Bank’s Policy and Institutional Assessment Score, PNG scores low on policies for social inclusion and public sector management and institutions. A Weak States Index constructed in 2008 found PNG to be the 40th lowest out of 141 countries based on a composite index of economic, political, security, and social welfare indicators (Rice & Stewart, 2008).
19. The business environment in PNG ranks low compared to other countries in the region based on ease of doing business surveys. A 2012 survey revealed that the ease of doing business in PNG is impeded largely by a combination of high crime and security costs; poor government-business relations and supporting institutions; poor infrastructure and utility services; political uncertainty; and corruption. Businesses have also identified a high concern for stability of rules, regulations and policies, and the excessive cost of compliance with new regulation, which can place a disproportionately large burden on small and medium sized enterprises (ADB and INA, 2012). PNG has also continued to score low compared to the region in the World Bank’s Ease of Doing Business indicators, with very low rankings for enforcing contracts, obtaining credit, dealing with construction permits, and starting a business.
C. Possible Strategy for Structural Reforms
20. PNG’s structural reform agenda would benefit from an overarching focus on strengthening the quality and capacity of its institutions. Institutional strengthening would assist in maximizing the benefits from PNG’s assets and help create sustainable and inclusive development. The threes aspects of institutions that are critical to promoting shared prosperity in resource-rich economies such as PNG are: (i) implementation of prudent macroeconomic policies that lead to economic diversification and increases in the productivity of non-mineral 3 Institutions can be considered a fourth asset that helps develop, manage, and harness opportunities from other assets and use the benefits for sustainable and inclusive development.
1
2
3
4
5Economic management
Structural Polices
Policies for social inclusion/equity
Public Sector management and
Institutions
Papua New Guinea Resource rich Sub-Saharan Africa countriesSamoa Solomon IslandsIDA
Figure 6. Institutional Strength, 2014(Ranking, 1= Low to 6= High)
Source: World Bank, Country Policy and Institutional Assessment Score, June 2015.
50 55 60 65 70
Samoa (67)
Tonga (69)
Fiji (81)
East Asia & Pacific (92)
Palau (113)
Papua New Guinea (133)
Kiribati (134)
Figure 7. Ease of Doing Business*, 2015(Score 0-100)
Source: World Bank, Doing Business 2015.
* Rankings in brackets

PAPUA NEW GUINEA
INTERNATIONAL MONETARY FUND 29
sectors such as agriculture; (ii) effective and efficient delivery of public services such as health, education, and infrastructure; and (iii) promoting competition and improving the regulatory environment in support of competition.
21. Reforms to enhance the capacity and quality of public service delivery are critical in PNG. The poor development outcomes in education, health, infrastructure, and law and order can be traced back to weak public delivery mechanisms and systems. Therefore, reforms aimed at improving cash management, budget execution, and transparency and accountability of public expenditure are necessary to strengthen overall public financial management. Similarly, public institutions and state owned enterprises tasked with planning and execution of public services would be bolstered through adequate funding, commercialization, introducing competition, appropriate legislation and improvements to the quantity and quality of human capital. In addition, improvements in law and order would help unlock PNG’s untapped potential in tourism given its geographical and cultural diversity.
22. Improving the leasing of customary land and enhancing competition and the regulatory framework are paramount for improving the business environment. Secure and long term land leases and stability in rules, regulations, and policies affecting businesses are essential for private sector growth. At the same time, regulations that create a disproportionate burden on small and medium sized enterprises should be avoided while uncompetitive practices need to be curbed through efficient monitoring and grievance systems and bolstering of the authority and capacity of the Independent Consumer and Competition Commission. Promoting and encouraging greater competition in the financial services sector would also assist in improving access to finance and support the overall development agenda.
D. ADB, IMF, and World Bank Support for Structural Reforms
23. The ADB’s focus in PNG is mainly on the transport and energy sectors. The engagement strategy is geared toward converting PNG’s resource wealth into inclusive and environmentally sustainable growth, in line with the government’s development agenda. As such, the ADB Country Partnership Strategy 2016-20 is focused on a small number of large, high-impact activities that provide for knowledge transfer and capacity development, and with the overall goals of environmental sustainability, private sector development, effective gender mainstreaming, knowledge management, and partnerships. With total indicative resources of US$637 million for 2016-20, apart from core areas of transport and energy, other areas of engagement will include health, water, and urban infrastructure, as well as public sector management. The indicative non-lending program for 2016–18 totals US$3.2 million, of which US$1.5 million is for project preparatory technical assistance.
24. The IMF’s support for structural reforms is centered on capacity development. This is largely through technical assistance provided by Pacific Financial Technical Assistance Centre in coordination with other IMF departments and donors. In the recent past, technical assistance and training for PNG’s authorities have mainly been in the areas of public financial management; economic and financial statistics; tax administration and policy; and macroeconomic analysis.

PAPUA NEW GUINEA
30 INTERNATIONAL MONETARY FUND
25. The World Bank is currently supporting the development of the country’s natural resources, human and physical capital, and the institutional structure in various sectors. The Productive Partnerships in Agriculture Project aims to strengthen coordination in the agricultural sector by facilitating links between farmers and agribusiness through productive partnerships in the cocoa and coffee sector, helping to improve market access, technologies, and services. Similarly, the Rural Service Delivery and Local Governance Program aims to improve access, quality, and delivery of basic public services by strengthening capacity and project management in local governments. The Road Maintenance and Rehabilitation Project aims to rehabilitate national and provincial roads while simultaneously strengthening the capacity of the authorities.
E. Summary
26. The extractive industries will continue to dominate PNG’s economic landscape but are insufficient to ensure sustainable and inclusive development. Past experience, including stubbornly high poverty rates and unbalanced development, suggest that the extractive industries have not created substantial and long-lasting spillover benefits to other sectors of the PNG economy.
27. Limited institutional capacity and governance issues have impeded the structural reforms needed to harness the full benefits from PNG’s natural resource endowments. Key structural reforms include overall strengthening of PNG’s institutions to ensure effective leasing arrangements of customary land; adequate and efficient government spending on health, education and infrastructure; strengthened public financial management practices including monitoring and tracking of expenditures; improved financial access (see Selected Issues Paper on financial inclusion); and improved statistics. The ADB, IMF, and World Bank are supporting the PNG authorities’ efforts to tackle these impediments to inclusive growth.

PAPUA NEW GUINEA
INTERNATIONAL MONETARY FUND 31
References
Asian Development Bank (ADB) and Institute of National Affairs (INA) (2012). The Challenges of Doing Business in Papua New Guinea. Manila: Asian Development Bank.
ANZ (2015). Powering PNG Into the Asian Century. ANZ Insight.
Chandy, L. (2009). Linking Growth and Poverty Reduction in Papua New Guinea. Sydney: Lowly Institute for International Policy.
Gibson, J. (2014). Two Decades of Poverty in Papua New Guinea. PNG Update. Port Moresby: University of Waikato.
Gill, I. et al. (2014). Diversified Development: Making the Most of Natural Resources in Eurasia. ECA Regional Flagship Report Washington, DC: The World Bank.
Lewis, P., Simmons, G., & Fennig, C. (2015). Languages of the World, Eighteenth Edition. Dallas: SIL International.
Paul M. Lewis, G. S. (2015). Ethnologue: Languages of the World, Eighteenth Edition. Dallas.
PNG Government (2013). Water Supply and Sanitation in Papua New Guinea.
Rice, S., & Stewart, P. (2008). Index of State Weakness in the Developing World. Washington DC: The Brookings Institution.
United Nations Development Programme (UNDP) (2014). 2014 National Human Development Report. Port Moresby: UNDP.
United Nations Economic and Social Comission of Asia and the Pacific (2015). Economic and Social Survey of Asia and the Pacific.
World Health Organization (WHO) United Nations Children's Fund (UNICEF) Joint Monitoring Fund (2015). Estimates on the Use of Water Resources and Sanitation Facilities.
World Bank (2010). Sustaining Recovery and Dynamism for Sustained Development. New York: United Nations.
World Health Organization (2014). Papua New Guinea Country Cooperation Strategy at A Glance.