Embed Size (px)
Citation preview
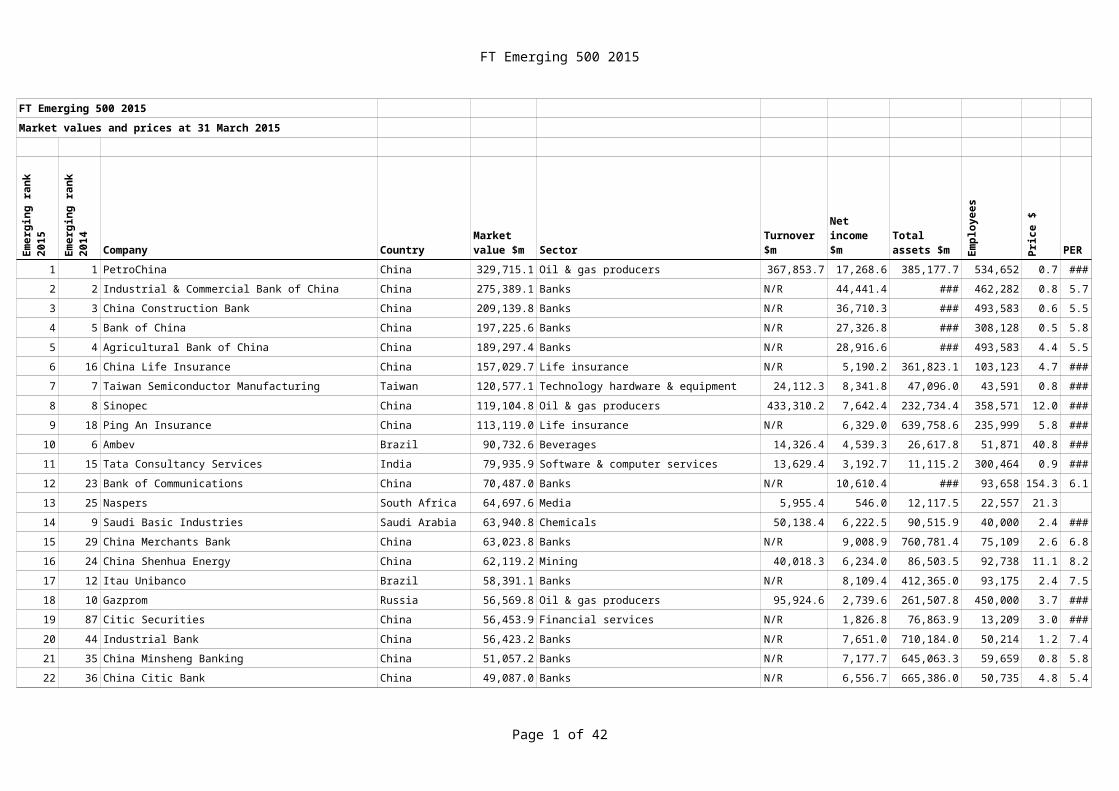
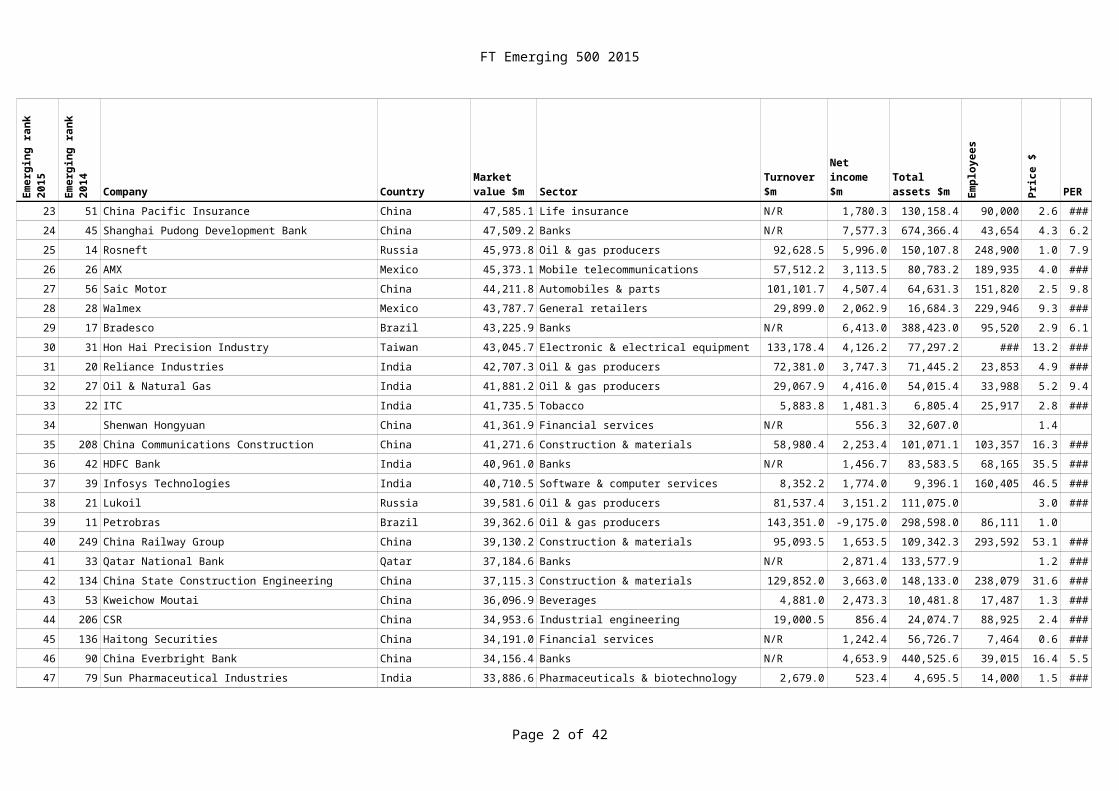
FT Emerging 500 2015
Page 1 of 36
FT Emerging 500 2015Market values and prices at 31 March 2015
Company Country Sector Turnover $m Empl
oyee
s
1 1 PetroChina China 329,715.1 Oil & gas producers 367,853.7 17,268.6 385,177.7 534,6522 2 Industrial & Commercial Bank of China China 275,389.1 Banks N/R 44,441.4 3,316,892.5 462,2823 3 China Construction Bank China 209,139.8 Banks N/R 36,710.3 2,691,627.3 493,583
4 5 Bank of China China 197,225.6 Banks N/R 27,326.8 2,453,420.0 308,1285 4 Agricultural Bank of China China 189,297.4 Banks N/R 28,916.6 2,561,243.9 493,583
6 16 China Life Insurance China 157,029.7 Life insurance N/R 5,190.2 361,823.1 103,123
7 7 Taiwan Semiconductor Manufacturing Taiwan 120,577.1 Technology hardware & equipment 24,112.3 8,341.8 47,096.0 43,5918 8 Sinopec China 119,104.8 Oil & gas producers 433,310.2 7,642.4 232,734.4 358,571
9 18 Ping An Insurance China 113,119.0 Life insurance N/R 6,329.0 639,758.6 235,99910 6 Ambev Brazil 90,732.6 Beverages 14,326.4 4,539.3 26,617.8 51,87111 15 Tata Consultancy Services India 79,935.9 Software & computer services 13,629.4 3,192.7 11,115.2 300,464
12 23 Bank of Communications China 70,487.0 Banks N/R 10,610.4 1,007,420.5 93,65813 25 Naspers South Africa 64,697.6 Media 5,955.4 546.0 12,117.5 22,557
14 9 Saudi Basic Industries Saudi Arabia 63,940.8 Chemicals 50,138.4 6,222.5 90,515.9 40,000
15 29 China Merchants Bank China 63,023.8 Banks N/R 9,008.9 760,781.4 75,10916 24 China Shenhua Energy China 62,119.2 Mining 40,018.3 6,234.0 86,503.5 92,73817 12 Itau Unibanco Brazil 58,391.1 Banks N/R 8,109.4 412,365.0 93,175
18 10 Gazprom Russia 56,569.8 Oil & gas producers 95,924.6 2,739.6 261,507.8 450,00019 87 Citic Securities China 56,453.9 Financial services N/R 1,826.8 76,863.9 13,209
20 44 Industrial Bank China 56,423.2 Banks N/R 7,651.0 710,184.0 50,21421 35 China Minsheng Banking China 51,057.2 Banks N/R 7,177.7 645,063.3 59,65922 36 China Citic Bank China 49,087.0 Banks N/R 6,556.7 665,386.0 50,735
23 51 China Pacific Insurance China 47,585.1 Life insurance N/R 1,780.3 130,158.4 90,00024 45 Shanghai Pudong Development Bank China 47,509.2 Banks N/R 7,577.3 674,366.4 43,654
25 14 Rosneft Russia 45,973.8 Oil & gas producers 92,628.5 5,996.0 150,107.8 248,900
26 26 AMX Mexico 45,373.1 Mobile telecommunications 57,512.2 3,113.5 80,783.2 189,935
Emer
ging
rank
20
15
Emer
ging
rank
20
14 Market value $m
Net income $m
Total assets $m
FT Emerging 500 2015
Page 2 of 36
Company Country Sector Turnover $m Empl
oyee
s
Emer
ging
rank
20
15
Emer
ging
rank
20
14 Market value $m
Net income $m
Total assets $m
27 56 Saic Motor China 44,211.8 Automobiles & parts 101,101.7 4,507.4 64,631.3 151,820
28 28 Walmex Mexico 43,787.7 General retailers 29,899.0 2,062.9 16,684.3 229,94629 17 Bradesco Brazil 43,225.9 Banks N/R 6,413.0 388,423.0 95,520
30 31 Hon Hai Precision Industry Taiwan 43,045.7 Electronic & electrical equipment 133,178.4 4,126.2 77,297.2 1,290,00031 20 Reliance Industries India 42,707.3 Oil & gas producers 72,381.0 3,747.3 71,445.2 23,85332 27 Oil & Natural Gas India 41,881.2 Oil & gas producers 29,067.9 4,416.0 54,015.4 33,988
33 22 ITC India 41,735.5 Tobacco 5,883.8 1,481.3 6,805.4 25,91734 Shenwan Hongyuan China 41,361.9 Financial services N/R 556.3 32,607.0
35 208 China Communications Construction China 41,271.6 Construction & materials 58,980.4 2,253.4 101,071.1 103,357
36 42 HDFC Bank India 40,961.0 Banks N/R 1,456.7 83,583.5 68,16537 39 Infosys Technologies India 40,710.5 Software & computer services 8,352.2 1,774.0 9,396.1 160,405
38 21 Lukoil Russia 39,581.6 Oil & gas producers 81,537.4 3,151.2 111,075.039 11 Petrobras Brazil 39,362.6 Oil & gas producers 143,351.0 -9,175.0 298,598.0 86,11140 249 China Railway Group China 39,130.2 Construction & materials 95,093.5 1,653.5 109,342.3 293,592
41 33 Qatar National Bank Qatar 37,184.6 Banks N/R 2,871.4 133,577.942 134 China State Construction Engineering China 37,115.3 Construction & materials 129,852.0 3,663.0 148,133.0 238,079
43 53 Kweichow Moutai China 36,096.9 Beverages 4,881.0 2,473.3 10,481.8 17,487
44 206 CSR China 34,953.6 Industrial engineering 19,000.5 856.4 24,074.7 88,92545 136 Haitong Securities China 34,191.0 Financial services N/R 1,242.4 56,726.7 7,46446 90 China Everbright Bank China 34,156.4 Banks N/R 4,653.9 440,525.6 39,015
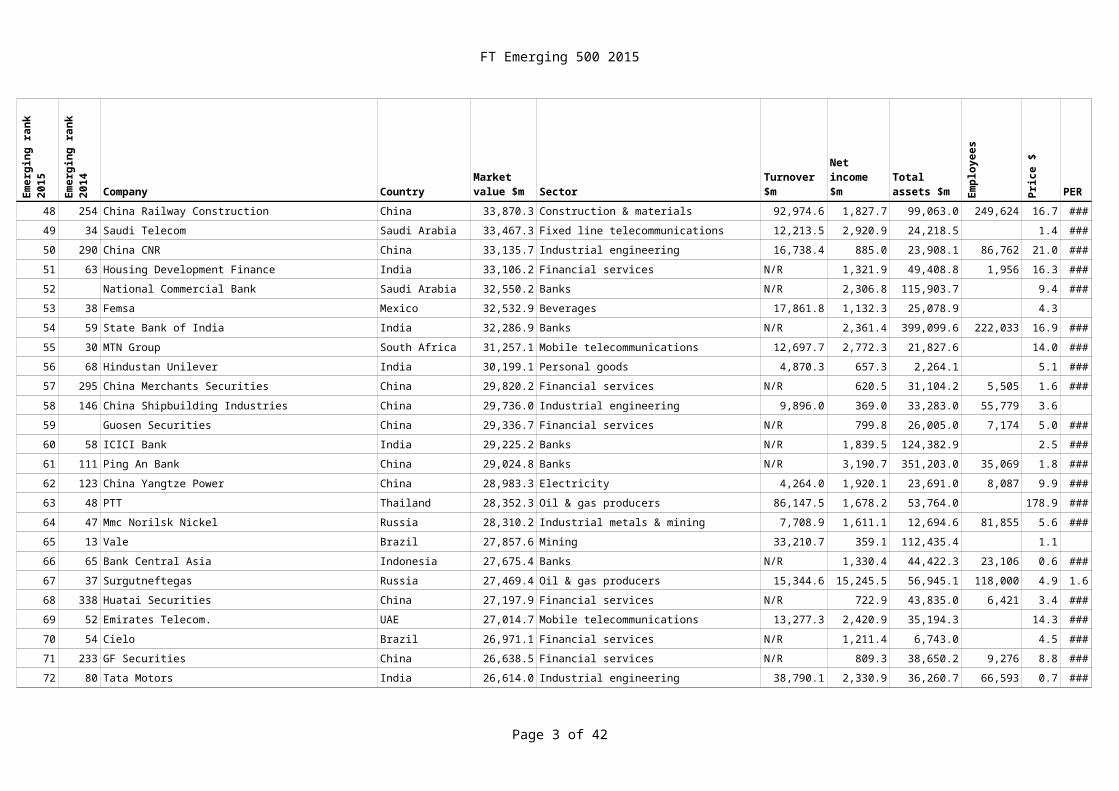
47 79 Sun Pharmaceutical Industries India 33,886.6 Pharmaceuticals & biotechnology 2,679.0 523.4 4,695.5 14,00048 254 China Railway Construction China 33,870.3 Construction & materials 92,974.6 1,827.7 99,063.0 249,624
49 34 Saudi Telecom Saudi Arabia 33,467.3 Fixed line telecommunications 12,213.5 2,920.9 24,218.550 290 China CNR China 33,135.7 Industrial engineering 16,738.4 885.0 23,908.1 86,76251 63 Housing Development Finance India 33,106.2 Financial services N/R 1,321.9 49,408.8 1,956
52 National Commercial Bank Saudi Arabia 32,550.2 Banks N/R 2,306.8 115,903.753 38 Femsa Mexico 32,532.9 Beverages 17,861.8 1,132.3 25,078.9
54 59 State Bank of India India 32,286.9 Banks N/R 2,361.4 399,099.6 222,033
55 30 MTN Group South Africa 31,257.1 Mobile telecommunications 12,697.7 2,772.3 21,827.6
FT Emerging 500 2015
Page 3 of 36
Company Country Sector Turnover $m Empl
oyee
s
Emer
ging
rank
20
15
Emer
ging
rank
20
14 Market value $m
Net income $m
Total assets $m
56 68 Hindustan Unilever India 30,199.1 Personal goods 4,870.3 657.3 2,264.1
57 295 China Merchants Securities China 29,820.2 Financial services N/R 620.5 31,104.2 5,50558 146 China Shipbuilding Industries China 29,736.0 Industrial engineering 9,896.0 369.0 33,283.0 55,779
59 Guosen Securities China 29,336.7 Financial services N/R 799.8 26,005.0 7,17460 58 ICICI Bank India 29,225.2 Banks N/R 1,839.5 124,382.961 111 Ping An Bank China 29,024.8 Banks N/R 3,190.7 351,203.0 35,069
62 123 China Yangtze Power China 28,983.3 Electricity 4,264.0 1,920.1 23,691.0 8,08763 48 PTT Thailand 28,352.3 Oil & gas producers 86,147.5 1,678.2 53,764.0
64 47 Mmc Norilsk Nickel Russia 28,310.2 Industrial metals & mining 7,708.9 1,611.1 12,694.6 81,855
65 13 Vale Brazil 27,857.6 Mining 33,210.7 359.1 112,435.466 65 Bank Central Asia Indonesia 27,675.4 Banks N/R 1,330.4 44,422.3 23,106
67 37 Surgutneftegas Russia 27,469.4 Oil & gas producers 15,344.6 15,245.5 56,945.1 118,00068 338 Huatai Securities China 27,197.9 Financial services N/R 722.9 43,835.0 6,42169 52 Emirates Telecom. UAE 27,014.7 Mobile telecommunications 13,277.3 2,420.9 35,194.3
70 54 Cielo Brazil 26,971.1 Financial services N/R 1,211.4 6,743.071 233 GF Securities China 26,638.5 Financial services N/R 809.3 38,650.2 9,276
72 80 Tata Motors India 26,614.0 Industrial engineering 38,790.1 2,330.9 36,260.7 66,593
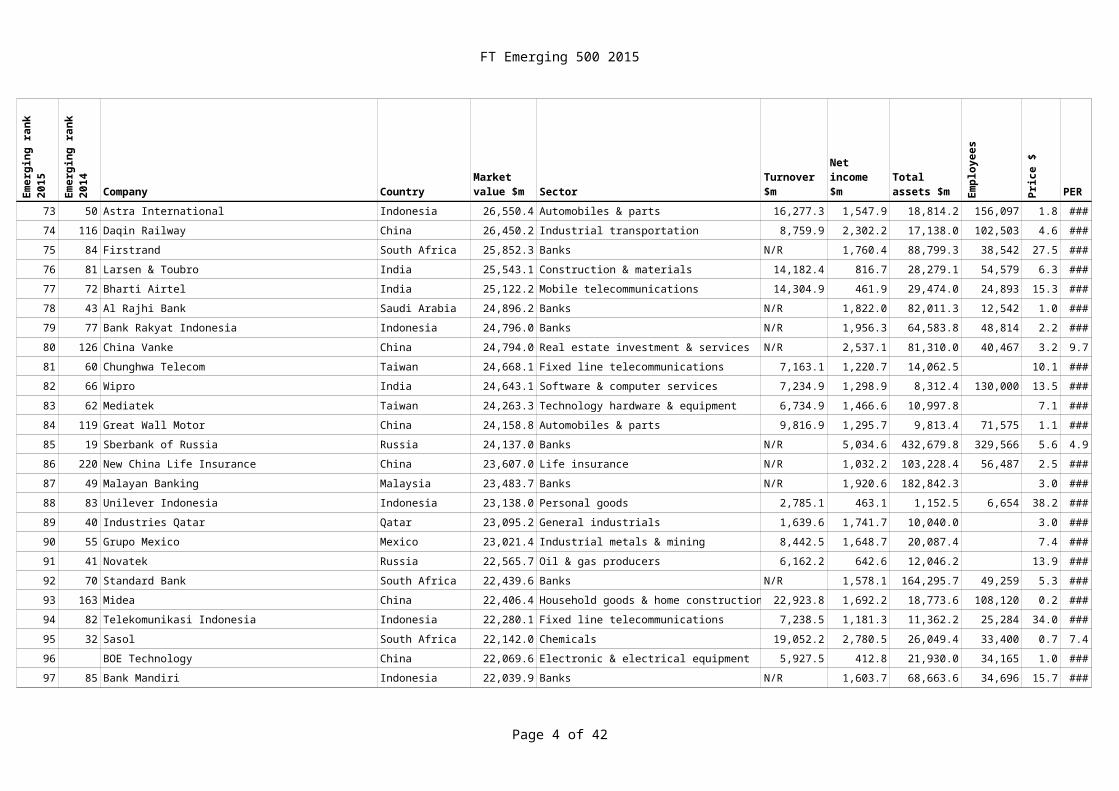
73 50 Astra International Indonesia 26,550.4 Automobiles & parts 16,277.3 1,547.9 18,814.2 156,09774 116 Daqin Railway China 26,450.2 Industrial transportation 8,759.9 2,302.2 17,138.0 102,50375 84 Firstrand South Africa 25,852.3 Banks N/R 1,760.4 88,799.3 38,542
76 81 Larsen & Toubro India 25,543.1 Construction & materials 14,182.4 816.7 28,279.1 54,57977 72 Bharti Airtel India 25,122.2 Mobile telecommunications 14,304.9 461.9 29,474.0 24,893
78 43 Al Rajhi Bank Saudi Arabia 24,896.2 Banks N/R 1,822.0 82,011.3 12,54279 77 Bank Rakyat Indonesia Indonesia 24,796.0 Banks N/R 1,956.3 64,583.8 48,81480 126 China Vanke China 24,794.0 Real estate investment & services N/R 2,537.1 81,310.0 40,467
81 60 Chunghwa Telecom Taiwan 24,668.1 Fixed line telecommunications 7,163.1 1,220.7 14,062.582 66 Wipro India 24,643.1 Software & computer services 7,234.9 1,298.9 8,312.4 130,000
83 62 Mediatek Taiwan 24,263.3 Technology hardware & equipment 6,734.9 1,466.6 10,997.8
84 119 Great Wall Motor China 24,158.8 Automobiles & parts 9,816.9 1,295.7 9,813.4 71,575
FT Emerging 500 2015
Page 4 of 36
Company Country Sector Turnover $m Empl
oyee
s
Emer
ging
rank
20
15
Emer
ging
rank
20
14 Market value $m
Net income $m
Total assets $m
85 19 Sberbank of Russia Russia 24,137.0 Banks N/R 5,034.6 432,679.8 329,566
86 220 New China Life Insurance China 23,607.0 Life insurance N/R 1,032.2 103,228.4 56,48787 49 Malayan Banking Malaysia 23,483.7 Banks N/R 1,920.6 182,842.3
88 83 Unilever Indonesia Indonesia 23,138.0 Personal goods 2,785.1 463.1 1,152.5 6,65489 40 Industries Qatar Qatar 23,095.2 General industrials 1,639.6 1,741.7 10,040.090 55 Grupo Mexico Mexico 23,021.4 Industrial metals & mining 8,442.5 1,648.7 20,087.4
91 41 Novatek Russia 22,565.7 Oil & gas producers 6,162.2 642.6 12,046.292 70 Standard Bank South Africa 22,439.6 Banks N/R 1,578.1 164,295.7 49,259
93 163 Midea China 22,406.4 Household goods & home construction 22,923.8 1,692.2 18,773.6 108,120
94 82 Telekomunikasi Indonesia Indonesia 22,280.1 Fixed line telecommunications 7,238.5 1,181.3 11,362.2 25,28495 32 Sasol South Africa 22,142.0 Chemicals 19,052.2 2,780.5 26,049.4 33,400
96 BOE Technology China 22,069.6 Electronic & electrical equipment 5,927.5 412.8 21,930.0 34,16597 85 Bank Mandiri Indonesia 22,039.9 Banks N/R 1,603.7 68,663.6 34,69698 113 HCL Technologies India 22,021.7 Software & computer services 5,351.9 1,083.8 4,855.9 73,528
99 76 Tenaga Nasional Malaysia 21,882.6 Electricity 13,576.3 2,051.7 35,104.9100 74 Advanced Info Ser. Thailand 21,654.0 Mobile telecommunications 4,538.1 1,095.1 3,796.0
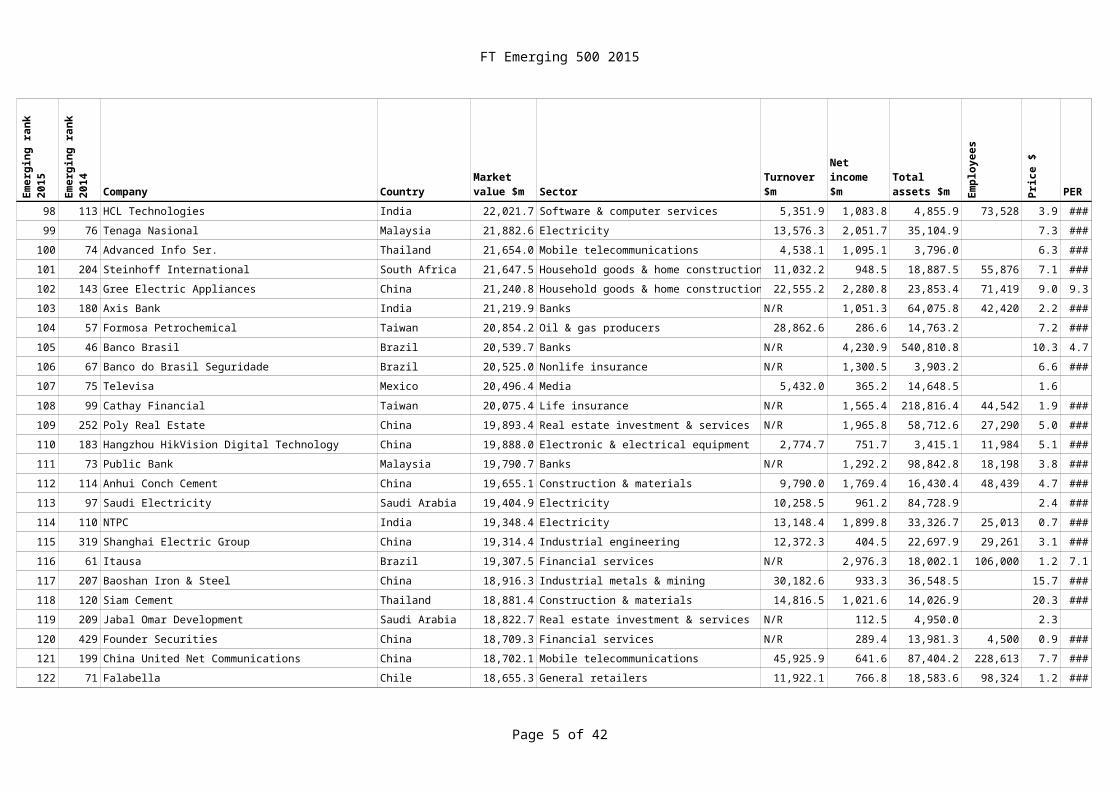
101 204 Steinhoff International South Africa 21,647.5 Household goods & home construction 11,032.2 948.5 18,887.5 55,876
102 143 Gree Electric Appliances China 21,240.8 Household goods & home construction 22,555.2 2,280.8 23,853.4 71,419103 180 Axis Bank India 21,219.9 Banks N/R 1,051.3 64,075.8 42,420104 57 Formosa Petrochemical Taiwan 20,854.2 Oil & gas producers 28,862.6 286.6 14,763.2
105 46 Banco Brasil Brazil 20,539.7 Banks N/R 4,230.9 540,810.8106 67 Banco do Brasil Seguridade Brazil 20,525.0 Nonlife insurance N/R 1,300.5 3,903.2
107 75 Televisa Mexico 20,496.4 Media 5,432.0 365.2 14,648.5108 99 Cathay Financial Taiwan 20,075.4 Life insurance N/R 1,565.4 218,816.4 44,542109 252 Poly Real Estate China 19,893.4 Real estate investment & services N/R 1,965.8 58,712.6 27,290
110 183 Hangzhou HikVision Digital Technology China 19,888.0 Electronic & electrical equipment 2,774.7 751.7 3,415.1 11,984111 73 Public Bank Malaysia 19,790.7 Banks N/R 1,292.2 98,842.8 18,198
112 114 Anhui Conch Cement China 19,655.1 Construction & materials 9,790.0 1,769.4 16,430.4 48,439
113 97 Saudi Electricity Saudi Arabia 19,404.9 Electricity 10,258.5 961.2 84,728.9
FT Emerging 500 2015
Page 5 of 36
Company Country Sector Turnover $m Empl
oyee
s
Emer
ging
rank
20
15
Emer
ging
rank
20
14 Market value $m
Net income $m
Total assets $m
114 110 NTPC India 19,348.4 Electricity 13,148.4 1,899.8 33,326.7 25,013
115 319 Shanghai Electric Group China 19,314.4 Industrial engineering 12,372.3 404.5 22,697.9 29,261116 61 Itausa Brazil 19,307.5 Financial services N/R 2,976.3 18,002.1 106,000
117 207 Baoshan Iron & Steel China 18,916.3 Industrial metals & mining 30,182.6 933.3 36,548.5118 120 Siam Cement Thailand 18,881.4 Construction & materials 14,816.5 1,021.6 14,026.9119 209 Jabal Omar Development Saudi Arabia 18,822.7 Real estate investment & services N/R 112.5 4,950.0
120 429 Founder Securities China 18,709.3 Financial services N/R 289.4 13,981.3 4,500121 199 China United Net Communications China 18,702.1 Mobile telecommunications 45,925.9 641.6 87,404.2 228,613
122 71 Falabella Chile 18,655.3 General retailers 11,922.1 766.8 18,583.6 98,324
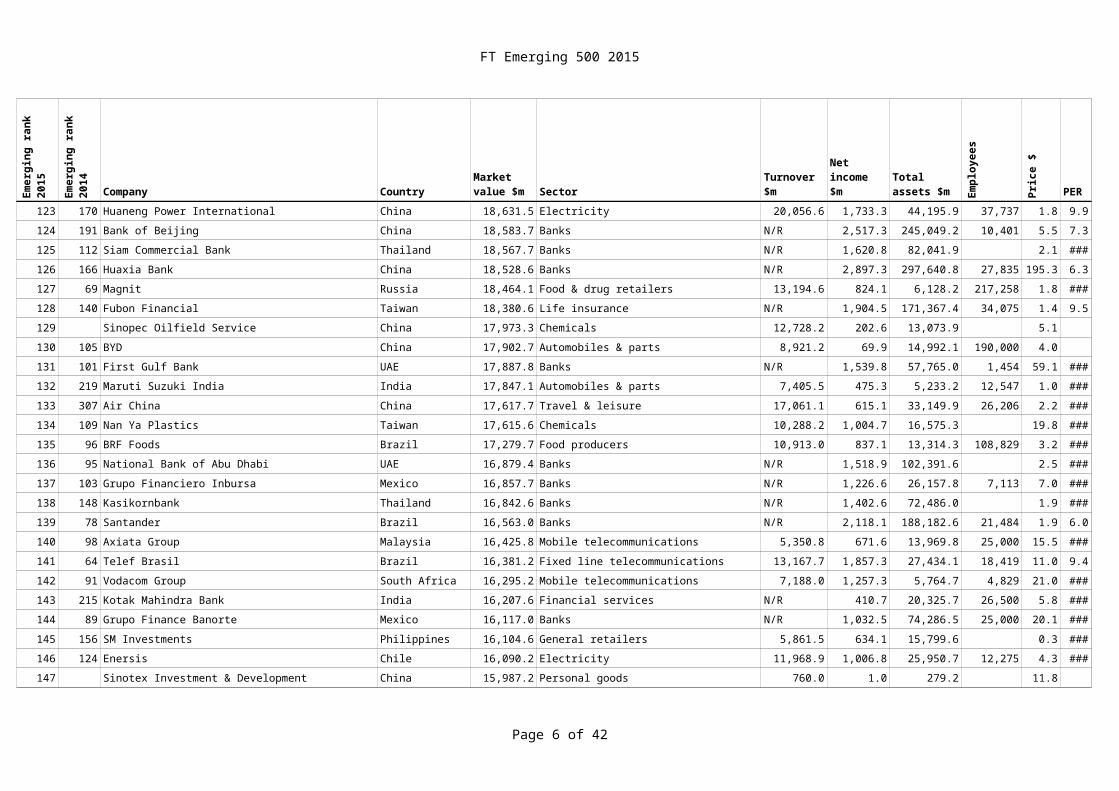
123 170 Huaneng Power International China 18,631.5 Electricity 20,056.6 1,733.3 44,195.9 37,737124 191 Bank of Beijing China 18,583.7 Banks N/R 2,517.3 245,049.2 10,401
125 112 Siam Commercial Bank Thailand 18,567.7 Banks N/R 1,620.8 82,041.9126 166 Huaxia Bank China 18,528.6 Banks N/R 2,897.3 297,640.8 27,835127 69 Magnit Russia 18,464.1 Food & drug retailers 13,194.6 824.1 6,128.2 217,258
128 140 Fubon Financial Taiwan 18,380.6 Life insurance N/R 1,904.5 171,367.4 34,075129 Sinopec Oilfield Service China 17,973.3 Chemicals 12,728.2 202.6 13,073.9
130 105 BYD China 17,902.7 Automobiles & parts 8,921.2 69.9 14,992.1 190,000
131 101 First Gulf Bank UAE 17,887.8 Banks N/R 1,539.8 57,765.0 1,454132 219 Maruti Suzuki India India 17,847.1 Automobiles & parts 7,405.5 475.3 5,233.2 12,547133 307 Air China China 17,617.7 Travel & leisure 17,061.1 615.1 33,149.9 26,206
134 109 Nan Ya Plastics Taiwan 17,615.6 Chemicals 10,288.2 1,004.7 16,575.3135 96 BRF Foods Brazil 17,279.7 Food producers 10,913.0 837.1 13,314.3 108,829
136 95 National Bank of Abu Dhabi UAE 16,879.4 Banks N/R 1,518.9 102,391.6137 103 Grupo Financiero Inbursa Mexico 16,857.7 Banks N/R 1,226.6 26,157.8 7,113138 148 Kasikornbank Thailand 16,842.6 Banks N/R 1,402.6 72,486.0
139 78 Santander Brazil 16,563.0 Banks N/R 2,118.1 188,182.6 21,484140 98 Axiata Group Malaysia 16,425.8 Mobile telecommunications 5,350.8 671.6 13,969.8 25,000
141 64 Telef Brasil Brazil 16,381.2 Fixed line telecommunications 13,167.7 1,857.3 27,434.1 18,419
142 91 Vodacom Group South Africa 16,295.2 Mobile telecommunications 7,188.0 1,257.3 5,764.7 4,829
FT Emerging 500 2015
Page 6 of 36
Company Country Sector Turnover $m Empl
oyee
s
Emer
ging
rank
20
15
Emer
ging
rank
20
14 Market value $m
Net income $m
Total assets $m
143 215 Kotak Mahindra Bank India 16,207.6 Financial services N/R 410.7 20,325.7 26,500
144 89 Grupo Finance Banorte Mexico 16,117.0 Banks N/R 1,032.5 74,286.5 25,000145 156 SM Investments Philippines 16,104.6 General retailers 5,861.5 634.1 15,799.6
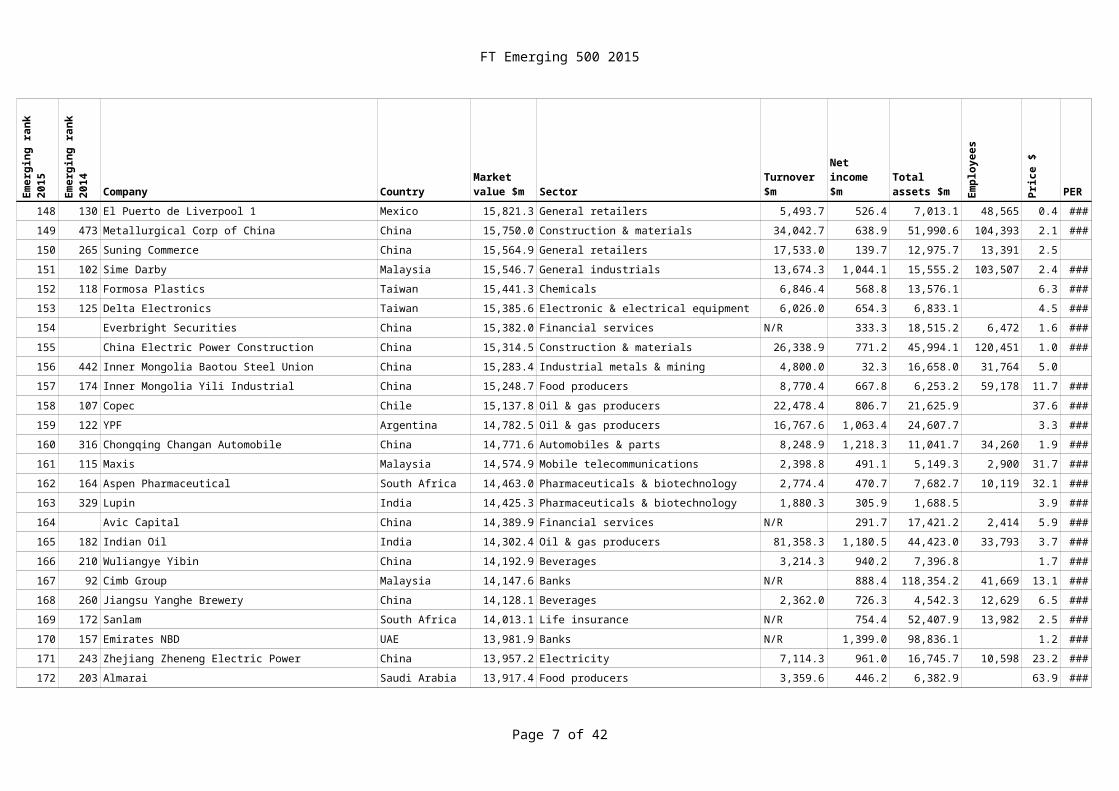
146 124 Enersis Chile 16,090.2 Electricity 11,968.9 1,006.8 25,950.7 12,275147 Sinotex Investment & Development China 15,987.2 Personal goods 760.0 1.0 279.2148 130 El Puerto de Liverpool 1 Mexico 15,821.3 General retailers 5,493.7 526.4 7,013.1 48,565
149 473 Metallurgical Corp of China China 15,750.0 Construction & materials 34,042.7 638.9 51,990.6 104,393150 265 Suning Commerce China 15,564.9 General retailers 17,533.0 139.7 12,975.7 13,391
151 102 Sime Darby Malaysia 15,546.7 General industrials 13,674.3 1,044.1 15,555.2 103,507
152 118 Formosa Plastics Taiwan 15,441.3 Chemicals 6,846.4 568.8 13,576.1153 125 Delta Electronics Taiwan 15,385.6 Electronic & electrical equipment 6,026.0 654.3 6,833.1
154 Everbright Securities China 15,382.0 Financial services N/R 333.3 18,515.2 6,472155 China Electric Power Construction China 15,314.5 Construction & materials 26,338.9 771.2 45,994.1 120,451156 442 Inner Mongolia Baotou Steel Union China 15,283.4 Industrial metals & mining 4,800.0 32.3 16,658.0 31,764
157 174 Inner Mongolia Yili Industrial China 15,248.7 Food producers 8,770.4 667.8 6,253.2 59,178158 107 Copec Chile 15,137.8 Oil & gas producers 22,478.4 806.7 21,625.9
159 122 YPF Argentina 14,782.5 Oil & gas producers 16,767.6 1,063.4 24,607.7
160 316 Chongqing Changan Automobile China 14,771.6 Automobiles & parts 8,248.9 1,218.3 11,041.7 34,260161 115 Maxis Malaysia 14,574.9 Mobile telecommunications 2,398.8 491.1 5,149.3 2,900162 164 Aspen Pharmaceutical South Africa 14,463.0 Pharmaceuticals & biotechnology 2,774.4 470.7 7,682.7 10,119
163 329 Lupin India 14,425.3 Pharmaceuticals & biotechnology 1,880.3 305.9 1,688.5164 Avic Capital China 14,389.9 Financial services N/R 291.7 17,421.2 2,414
165 182 Indian Oil India 14,302.4 Oil & gas producers 81,358.3 1,180.5 44,423.0 33,793166 210 Wuliangye Yibin China 14,192.9 Beverages 3,214.3 940.2 7,396.8167 92 Cimb Group Malaysia 14,147.6 Banks N/R 888.4 118,354.2 41,669
168 260 Jiangsu Yanghe Brewery China 14,128.1 Beverages 2,362.0 726.3 4,542.3 12,629169 172 Sanlam South Africa 14,013.1 Life insurance N/R 754.4 52,407.9 13,982
170 157 Emirates NBD UAE 13,981.9 Banks N/R 1,399.0 98,836.1
171 243 Zhejiang Zheneng Electric Power China 13,957.2 Electricity 7,114.3 961.0 16,745.7 10,598
FT Emerging 500 2015
Page 7 of 36
Company Country Sector Turnover $m Empl
oyee
s
Emer
ging
rank
20
15
Emer
ging
rank
20
14 Market value $m
Net income $m
Total assets $m
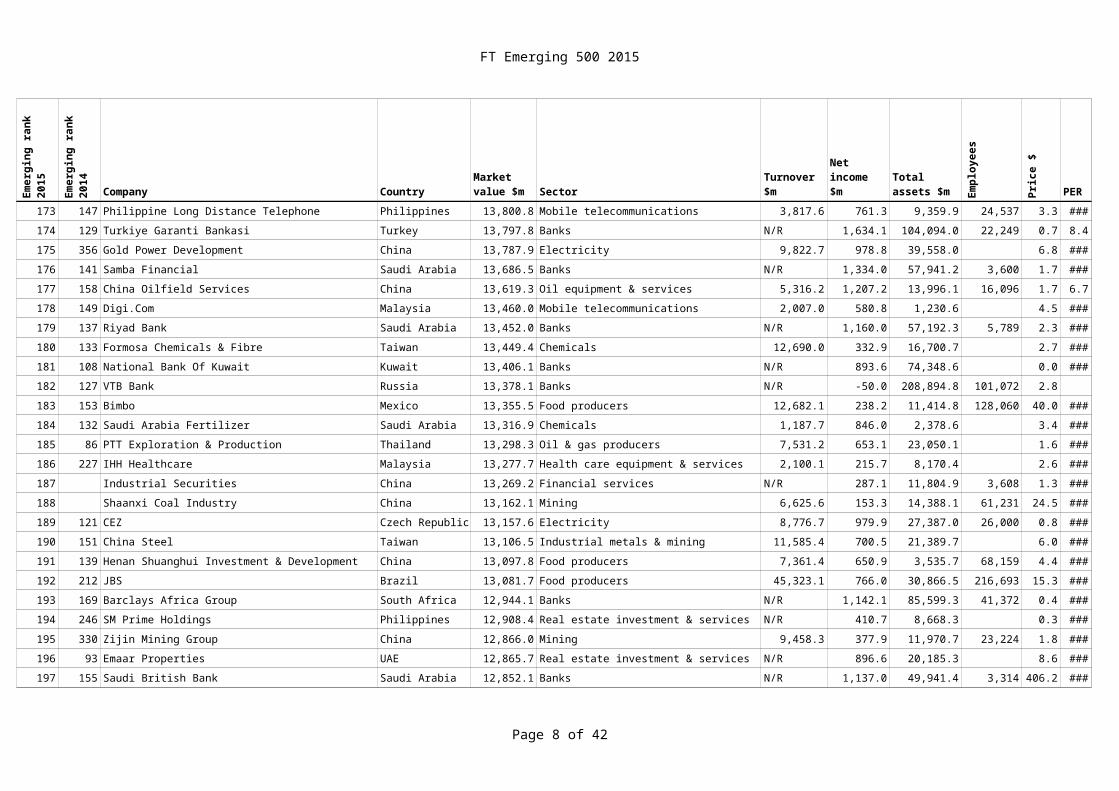
172 203 Almarai Saudi Arabia 13,917.4 Food producers 3,359.6 446.2 6,382.9
173 147 Philippine Long Distance Telephone Philippines 13,800.8 Mobile telecommunications 3,817.6 761.3 9,359.9 24,537174 129 Turkiye Garanti Bankasi Turkey 13,797.8 Banks N/R 1,634.1 104,094.0 22,249
175 356 Gold Power Development China 13,787.9 Electricity 9,822.7 978.8 39,558.0176 141 Samba Financial Saudi Arabia 13,686.5 Banks N/R 1,334.0 57,941.2 3,600177 158 China Oilfield Services China 13,619.3 Oil equipment & services 5,316.2 1,207.2 13,996.1 16,096
178 149 Digi.Com Malaysia 13,460.0 Mobile telecommunications 2,007.0 580.8 1,230.6179 137 Riyad Bank Saudi Arabia 13,452.0 Banks N/R 1,160.0 57,192.3 5,789
180 133 Formosa Chemicals & Fibre Taiwan 13,449.4 Chemicals 12,690.0 332.9 16,700.7
181 108 National Bank Of Kuwait Kuwait 13,406.1 Banks N/R 893.6 74,348.6182 127 VTB Bank Russia 13,378.1 Banks N/R -50.0 208,894.8 101,072
183 153 Bimbo Mexico 13,355.5 Food producers 12,682.1 238.2 11,414.8 128,060184 132 Saudi Arabia Fertilizer Saudi Arabia 13,316.9 Chemicals 1,187.7 846.0 2,378.6185 86 PTT Exploration & Production Thailand 13,298.3 Oil & gas producers 7,531.2 653.1 23,050.1
186 227 IHH Healthcare Malaysia 13,277.7 Health care equipment & services 2,100.1 215.7 8,170.4187 Industrial Securities China 13,269.2 Financial services N/R 287.1 11,804.9 3,608
188 Shaanxi Coal Industry China 13,162.1 Mining 6,625.6 153.3 14,388.1 61,231
189 121 CEZ Czech Republic 13,157.6 Electricity 8,776.7 979.9 27,387.0 26,000190 151 China Steel Taiwan 13,106.5 Industrial metals & mining 11,585.4 700.5 21,389.7191 139 Henan Shuanghui Investment & Development China 13,097.8 Food producers 7,361.4 650.9 3,535.7 68,159
192 212 JBS Brazil 13,081.7 Food producers 45,323.1 766.0 30,866.5 216,693193 169 Barclays Africa Group South Africa 12,944.1 Banks N/R 1,142.1 85,599.3 41,372
194 246 SM Prime Holdings Philippines 12,908.4 Real estate investment & services N/R 410.7 8,668.3195 330 Zijin Mining Group China 12,866.0 Mining 9,458.3 377.9 11,970.7 23,224196 93 Emaar Properties UAE 12,865.7 Real estate investment & services N/R 896.6 20,185.3
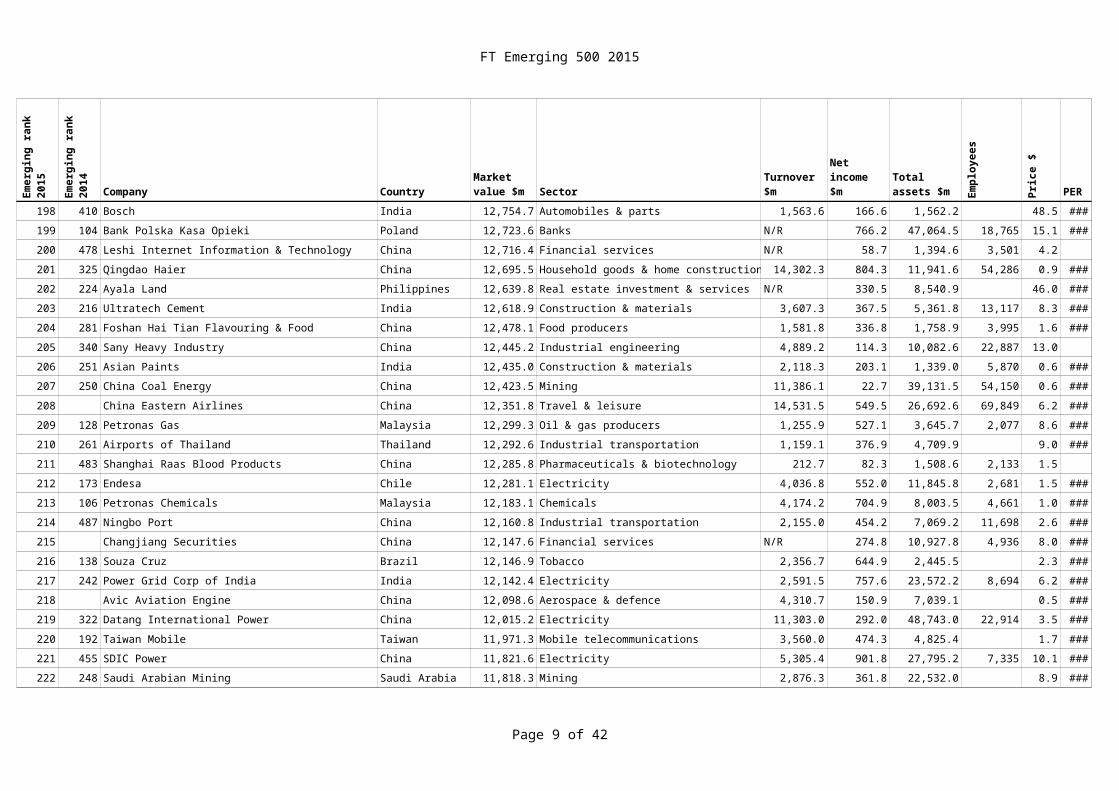
197 155 Saudi British Bank Saudi Arabia 12,852.1 Banks N/R 1,137.0 49,941.4 3,314198 410 Bosch India 12,754.7 Automobiles & parts 1,563.6 166.6 1,562.2
199 104 Bank Polska Kasa Opieki Poland 12,723.6 Banks N/R 766.2 47,064.5 18,765
200 478 Leshi Internet Information & Technology China 12,716.4 Financial services N/R 58.7 1,394.6 3,501
FT Emerging 500 2015
Page 8 of 36
Company Country Sector Turnover $m Empl
oyee
s
Emer
ging
rank
20
15
Emer
ging
rank
20
14 Market value $m
Net income $m
Total assets $m
201 325 Qingdao Haier China 12,695.5 Household goods & home construction 14,302.3 804.3 11,941.6 54,286
202 224 Ayala Land Philippines 12,639.8 Real estate investment & services N/R 330.5 8,540.9203 216 Ultratech Cement India 12,618.9 Construction & materials 3,607.3 367.5 5,361.8 13,117
204 281 Foshan Hai Tian Flavouring & Food China 12,478.1 Food producers 1,581.8 336.8 1,758.9 3,995205 340 Sany Heavy Industry China 12,445.2 Industrial engineering 4,889.2 114.3 10,082.6 22,887206 251 Asian Paints India 12,435.0 Construction & materials 2,118.3 203.1 1,339.0 5,870
207 250 China Coal Energy China 12,423.5 Mining 11,386.1 22.7 39,131.5 54,150208 China Eastern Airlines China 12,351.8 Travel & leisure 14,531.5 549.5 26,692.6 69,849
209 128 Petronas Gas Malaysia 12,299.3 Oil & gas producers 1,255.9 527.1 3,645.7 2,077
210 261 Airports of Thailand Thailand 12,292.6 Industrial transportation 1,159.1 376.9 4,709.9211 483 Shanghai Raas Blood Products China 12,285.8 Pharmaceuticals & biotechnology 212.7 82.3 1,508.6 2,133
212 173 Endesa Chile 12,281.1 Electricity 4,036.8 552.0 11,845.8 2,681213 106 Petronas Chemicals Malaysia 12,183.1 Chemicals 4,174.2 704.9 8,003.5 4,661214 487 Ningbo Port China 12,160.8 Industrial transportation 2,155.0 454.2 7,069.2 11,698
215 Changjiang Securities China 12,147.6 Financial services N/R 274.8 10,927.8 4,936216 138 Souza Cruz Brazil 12,146.9 Tobacco 2,356.7 644.9 2,445.5
217 242 Power Grid Corp of India India 12,142.4 Electricity 2,591.5 757.6 23,572.2 8,694
218 Avic Aviation Engine China 12,098.6 Aerospace & defence 4,310.7 150.9 7,039.1219 322 Datang International Power China 12,015.2 Electricity 11,303.0 292.0 48,743.0 22,914220 192 Taiwan Mobile Taiwan 11,971.3 Mobile telecommunications 3,560.0 474.3 4,825.4
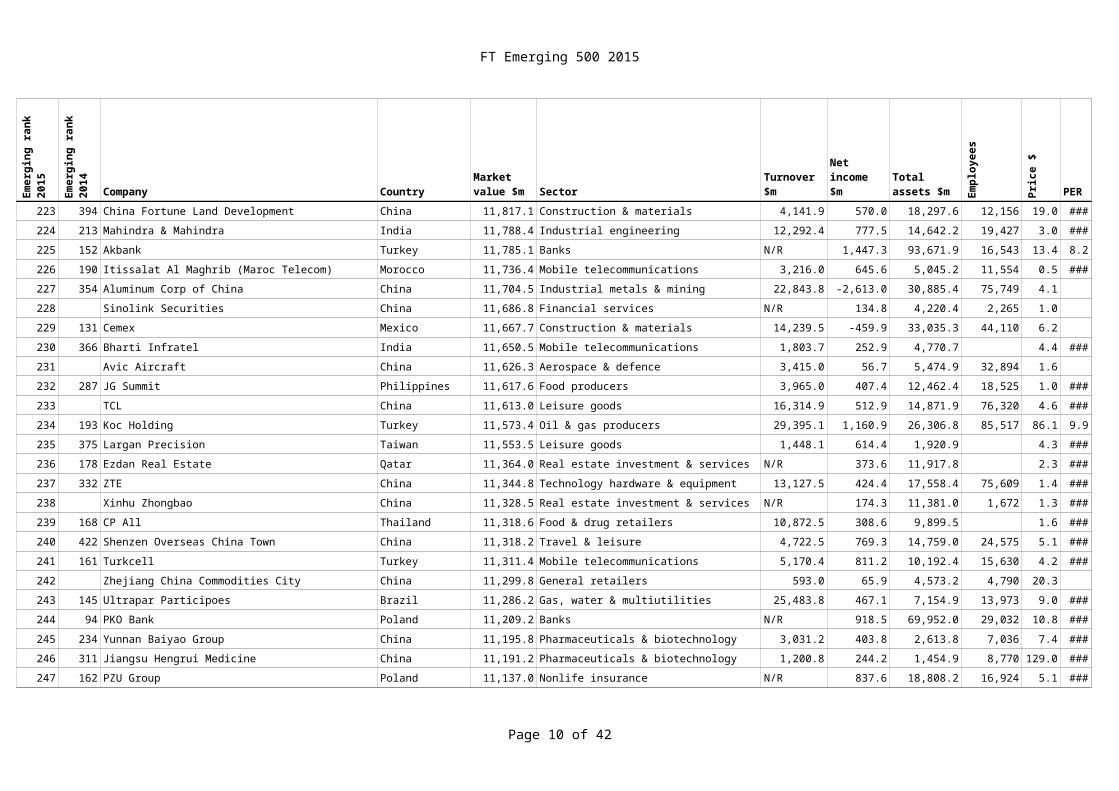
221 455 SDIC Power China 11,821.6 Electricity 5,305.4 901.8 27,795.2 7,335222 248 Saudi Arabian Mining Saudi Arabia 11,818.3 Mining 2,876.3 361.8 22,532.0
223 394 China Fortune Land Development China 11,817.1 Construction & materials 4,141.9 570.0 18,297.6 12,156224 213 Mahindra & Mahindra India 11,788.4 Industrial engineering 12,292.4 777.5 14,642.2 19,427225 152 Akbank Turkey 11,785.1 Banks N/R 1,447.3 93,671.9 16,543
226 190 Itissalat Al Maghrib (Maroc Telecom) Morocco 11,736.4 Mobile telecommunications 3,216.0 645.6 5,045.2 11,554227 354 Aluminum Corp of China China 11,704.5 Industrial metals & mining 22,843.8 -2,613.0 30,885.4 75,749
228 Sinolink Securities China 11,686.8 Financial services N/R 134.8 4,220.4 2,265
229 131 Cemex Mexico 11,667.7 Construction & materials 14,239.5 -459.9 33,035.3 44,110
FT Emerging 500 2015
Page 9 of 36
Company Country Sector Turnover $m Empl
oyee
s
Emer
ging
rank
20
15
Emer
ging
rank
20
14 Market value $m
Net income $m
Total assets $m
230 366 Bharti Infratel India 11,650.5 Mobile telecommunications 1,803.7 252.9 4,770.7
231 Avic Aircraft China 11,626.3 Aerospace & defence 3,415.0 56.7 5,474.9 32,894232 287 JG Summit Philippines 11,617.6 Food producers 3,965.0 407.4 12,462.4 18,525
233 TCL China 11,613.0 Leisure goods 16,314.9 512.9 14,871.9 76,320234 193 Koc Holding Turkey 11,573.4 Oil & gas producers 29,395.1 1,160.9 26,306.8 85,517235 375 Largan Precision Taiwan 11,553.5 Leisure goods 1,448.1 614.4 1,920.9
236 178 Ezdan Real Estate Qatar 11,364.0 Real estate investment & services N/R 373.6 11,917.8237 332 ZTE China 11,344.8 Technology hardware & equipment 13,127.5 424.4 17,558.4 75,609
238 Xinhu Zhongbao China 11,328.5 Real estate investment & services N/R 174.3 11,381.0 1,672
239 168 CP All Thailand 11,318.6 Food & drug retailers 10,872.5 308.6 9,899.5240 422 Shenzen Overseas China Town China 11,318.2 Travel & leisure 4,722.5 769.3 14,759.0 24,575
241 161 Turkcell Turkey 11,311.4 Mobile telecommunications 5,170.4 811.2 10,192.4 15,630242 Zhejiang China Commodities City China 11,299.8 General retailers 593.0 65.9 4,573.2 4,790243 145 Ultrapar Participoes Brazil 11,286.2 Gas, water & multiutilities 25,483.8 467.1 7,154.9 13,973
244 94 PKO Bank Poland 11,209.2 Banks N/R 918.5 69,952.0 29,032245 234 Yunnan Baiyao Group China 11,195.8 Pharmaceuticals & biotechnology 3,031.2 403.8 2,613.8 7,036
246 311 Jiangsu Hengrui Medicine China 11,191.2 Pharmaceuticals & biotechnology 1,200.8 244.2 1,454.9 8,770
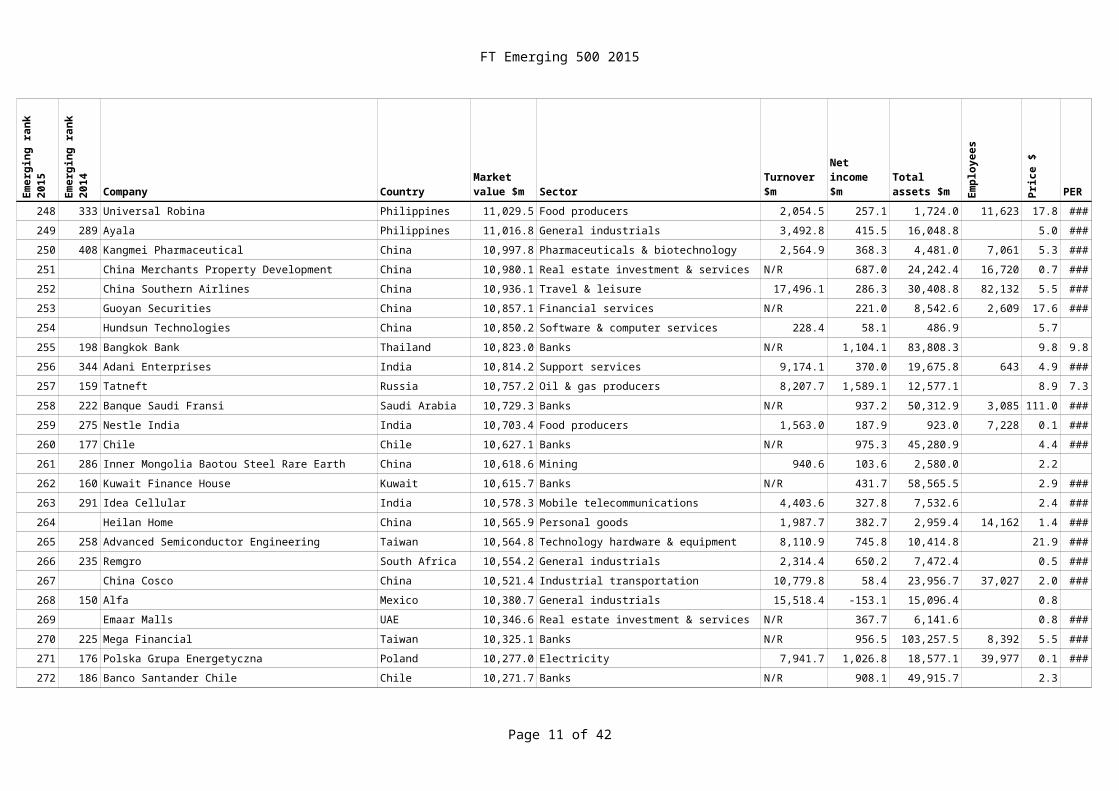
247 162 PZU Group Poland 11,137.0 Nonlife insurance N/R 837.6 18,808.2 16,924248 333 Universal Robina Philippines 11,029.5 Food producers 2,054.5 257.1 1,724.0 11,623249 289 Ayala Philippines 11,016.8 General industrials 3,492.8 415.5 16,048.8
250 408 Kangmei Pharmaceutical China 10,997.8 Pharmaceuticals & biotechnology 2,564.9 368.3 4,481.0 7,061251 China Merchants Property Development China 10,980.1 Real estate investment & services N/R 687.0 24,242.4 16,720
252 China Southern Airlines China 10,936.1 Travel & leisure 17,496.1 286.3 30,408.8 82,132253 Guoyan Securities China 10,857.1 Financial services N/R 221.0 8,542.6 2,609254 Hundsun Technologies China 10,850.2 Software & computer services 228.4 58.1 486.9
255 198 Bangkok Bank Thailand 10,823.0 Banks N/R 1,104.1 83,808.3256 344 Adani Enterprises India 10,814.2 Support services 9,174.1 370.0 19,675.8 643
257 159 Tatneft Russia 10,757.2 Oil & gas producers 8,207.7 1,589.1 12,577.1
258 222 Banque Saudi Fransi Saudi Arabia 10,729.3 Banks N/R 937.2 50,312.9 3,085
FT Emerging 500 2015
Page 10 of 36
Company Country Sector Turnover $m Empl
oyee
s
Emer
ging
rank
20
15
Emer
ging
rank
20
14 Market value $m
Net income $m
Total assets $m
259 275 Nestle India India 10,703.4 Food producers 1,563.0 187.9 923.0 7,228
260 177 Chile Chile 10,627.1 Banks N/R 975.3 45,280.9261 286 Inner Mongolia Baotou Steel Rare Earth China 10,618.6 Mining 940.6 103.6 2,580.0
262 160 Kuwait Finance House Kuwait 10,615.7 Banks N/R 431.7 58,565.5263 291 Idea Cellular India 10,578.3 Mobile telecommunications 4,403.6 327.8 7,532.6264 Heilan Home China 10,565.9 Personal goods 1,987.7 382.7 2,959.4 14,162
265 258 Advanced Semiconductor Engineering Taiwan 10,564.8 Technology hardware & equipment 8,110.9 745.8 10,414.8266 235 Remgro South Africa 10,554.2 General industrials 2,314.4 650.2 7,472.4
267 China Cosco China 10,521.4 Industrial transportation 10,779.8 58.4 23,956.7 37,027
268 150 Alfa Mexico 10,380.7 General industrials 15,518.4 -153.1 15,096.4269 Emaar Malls UAE 10,346.6 Real estate investment & services N/R 367.7 6,141.6
270 225 Mega Financial Taiwan 10,325.1 Banks N/R 956.5 103,257.5 8,392271 176 Polska Grupa Energetyczna Poland 10,277.0 Electricity 7,941.7 1,026.8 18,577.1 39,977272 186 Banco Santander Chile Chile 10,271.7 Banks N/R 908.1 49,915.7
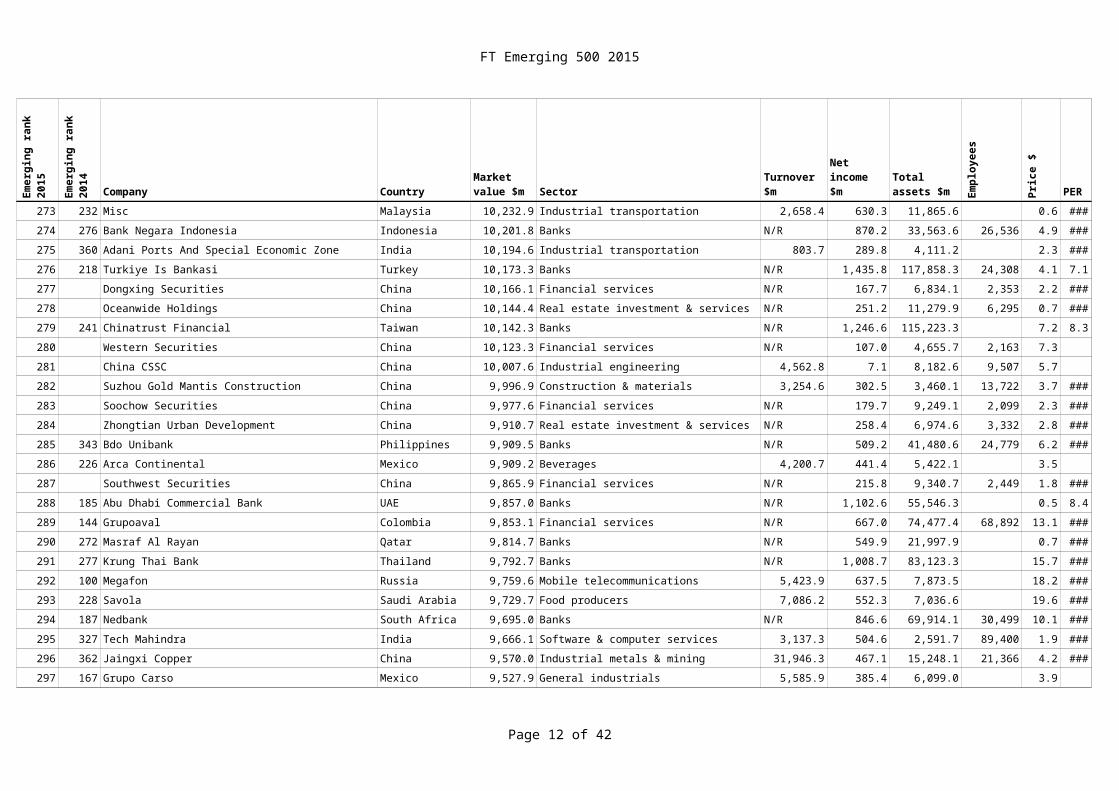
273 232 Misc Malaysia 10,232.9 Industrial transportation 2,658.4 630.3 11,865.6274 276 Bank Negara Indonesia Indonesia 10,201.8 Banks N/R 870.2 33,563.6 26,536
275 360 Adani Ports And Special Economic Zone India 10,194.6 Industrial transportation 803.7 289.8 4,111.2
276 218 Turkiye Is Bankasi Turkey 10,173.3 Banks N/R 1,435.8 117,858.3 24,308277 Dongxing Securities China 10,166.1 Financial services N/R 167.7 6,834.1 2,353278 Oceanwide Holdings China 10,144.4 Real estate investment & services N/R 251.2 11,279.9 6,295
279 241 Chinatrust Financial Taiwan 10,142.3 Banks N/R 1,246.6 115,223.3280 Western Securities China 10,123.3 Financial services N/R 107.0 4,655.7 2,163
281 China CSSC China 10,007.6 Industrial engineering 4,562.8 7.1 8,182.6 9,507282 Suzhou Gold Mantis Construction China 9,996.9 Construction & materials 3,254.6 302.5 3,460.1 13,722283 Soochow Securities China 9,977.6 Financial services N/R 179.7 9,249.1 2,099
284 Zhongtian Urban Development China 9,910.7 Real estate investment & services N/R 258.4 6,974.6 3,332285 343 Bdo Unibank Philippines 9,909.5 Banks N/R 509.2 41,480.6 24,779
286 226 Arca Continental Mexico 9,909.2 Beverages 4,200.7 441.4 5,422.1
287 Southwest Securities China 9,865.9 Financial services N/R 215.8 9,340.7 2,449
FT Emerging 500 2015
Page 11 of 36
Company Country Sector Turnover $m Empl
oyee
s
Emer
ging
rank
20
15
Emer
ging
rank
20
14 Market value $m
Net income $m
Total assets $m
288 185 Abu Dhabi Commercial Bank UAE 9,857.0 Banks N/R 1,102.6 55,546.3
289 144 Grupoaval Colombia 9,853.1 Financial services N/R 667.0 74,477.4 68,892290 272 Masraf Al Rayan Qatar 9,814.7 Banks N/R 549.9 21,997.9
291 277 Krung Thai Bank Thailand 9,792.7 Banks N/R 1,008.7 83,123.3292 100 Megafon Russia 9,759.6 Mobile telecommunications 5,423.9 637.5 7,873.5293 228 Savola Saudi Arabia 9,729.7 Food producers 7,086.2 552.3 7,036.6
294 187 Nedbank South Africa 9,695.0 Banks N/R 846.6 69,914.1 30,499295 327 Tech Mahindra India 9,666.1 Software & computer services 3,137.3 504.6 2,591.7 89,400
296 362 Jaingxi Copper China 9,570.0 Industrial metals & mining 31,946.3 467.1 15,248.1 21,366
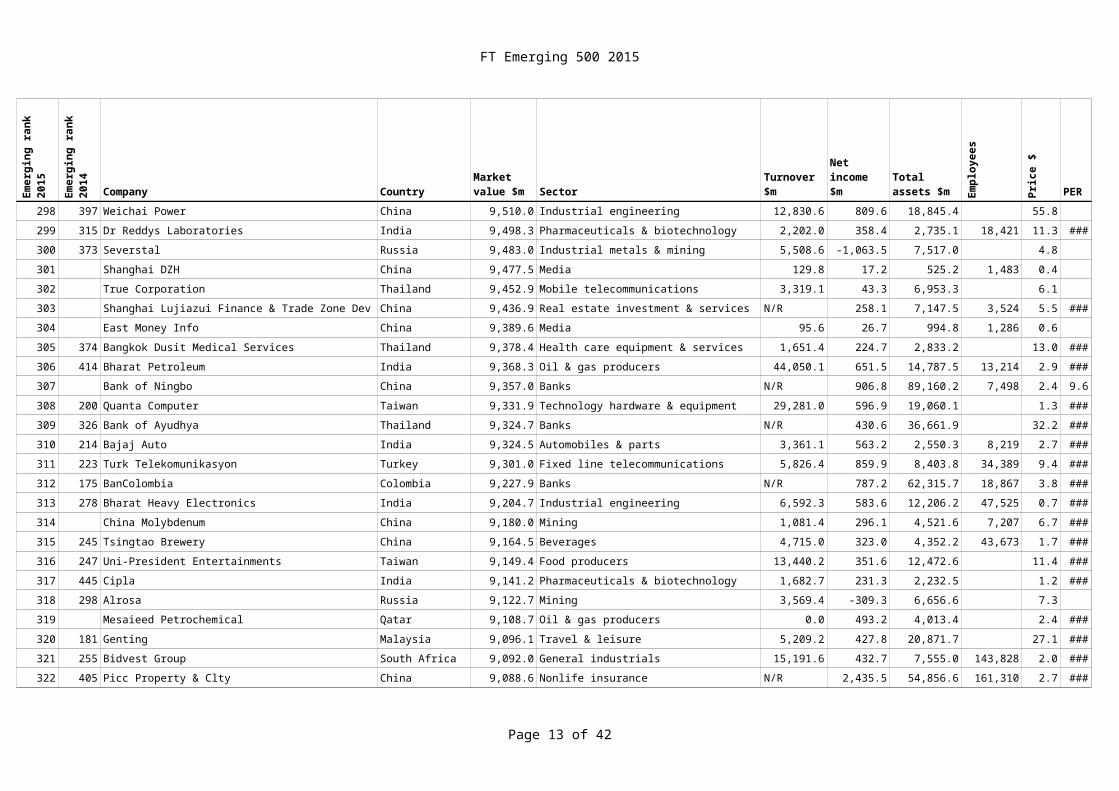
297 167 Grupo Carso Mexico 9,527.9 General industrials 5,585.9 385.4 6,099.0298 397 Weichai Power China 9,510.0 Industrial engineering 12,830.6 809.6 18,845.4
299 315 Dr Reddys Laboratories India 9,498.3 Pharmaceuticals & biotechnology 2,202.0 358.4 2,735.1 18,421300 373 Severstal Russia 9,483.0 Industrial metals & mining 5,508.6 -1,063.5 7,517.0301 Shanghai DZH China 9,477.5 Media 129.8 17.2 525.2 1,483
302 True Corporation Thailand 9,452.9 Mobile telecommunications 3,319.1 43.3 6,953.3303 Shanghai Lujiazui Finance & Trade Zone Dev China 9,436.9 Real estate investment & services N/R 258.1 7,147.5 3,524
304 East Money Info China 9,389.6 Media 95.6 26.7 994.8 1,286
305 374 Bangkok Dusit Medical Services Thailand 9,378.4 Health care equipment & services 1,651.4 224.7 2,833.2306 414 Bharat Petroleum India 9,368.3 Oil & gas producers 44,050.1 651.5 14,787.5 13,214307 Bank of Ningbo China 9,357.0 Banks N/R 906.8 89,160.2 7,498
308 200 Quanta Computer Taiwan 9,331.9 Technology hardware & equipment 29,281.0 596.9 19,060.1309 326 Bank of Ayudhya Thailand 9,324.7 Banks N/R 430.6 36,661.9
310 214 Bajaj Auto India 9,324.5 Automobiles & parts 3,361.1 563.2 2,550.3 8,219311 223 Turk Telekomunikasyon Turkey 9,301.0 Fixed line telecommunications 5,826.4 859.9 8,403.8 34,389312 175 BanColombia Colombia 9,227.9 Banks N/R 787.2 62,315.7 18,867
313 278 Bharat Heavy Electronics India 9,204.7 Industrial engineering 6,592.3 583.6 12,206.2 47,525314 China Molybdenum China 9,180.0 Mining 1,081.4 296.1 4,521.6 7,207
315 245 Tsingtao Brewery China 9,164.5 Beverages 4,715.0 323.0 4,352.2 43,673
316 247 Uni-President Entertainments Taiwan 9,149.4 Food producers 13,440.2 351.6 12,472.6
FT Emerging 500 2015
Page 12 of 36
Company Country Sector Turnover $m Empl
oyee
s
Emer
ging
rank
20
15
Emer
ging
rank
20
14 Market value $m
Net income $m
Total assets $m
317 445 Cipla India 9,141.2 Pharmaceuticals & biotechnology 1,682.7 231.3 2,232.5
318 298 Alrosa Russia 9,122.7 Mining 3,569.4 -309.3 6,656.6319 Mesaieed Petrochemical Qatar 9,108.7 Oil & gas producers 0.0 493.2 4,013.4
320 181 Genting Malaysia 9,096.1 Travel & leisure 5,209.2 427.8 20,871.7321 255 Bidvest Group South Africa 9,092.0 General industrials 15,191.6 432.7 7,555.0 143,828322 405 Picc Property & Clty China 9,088.6 Nonlife insurance N/R 2,435.5 54,856.6 161,310
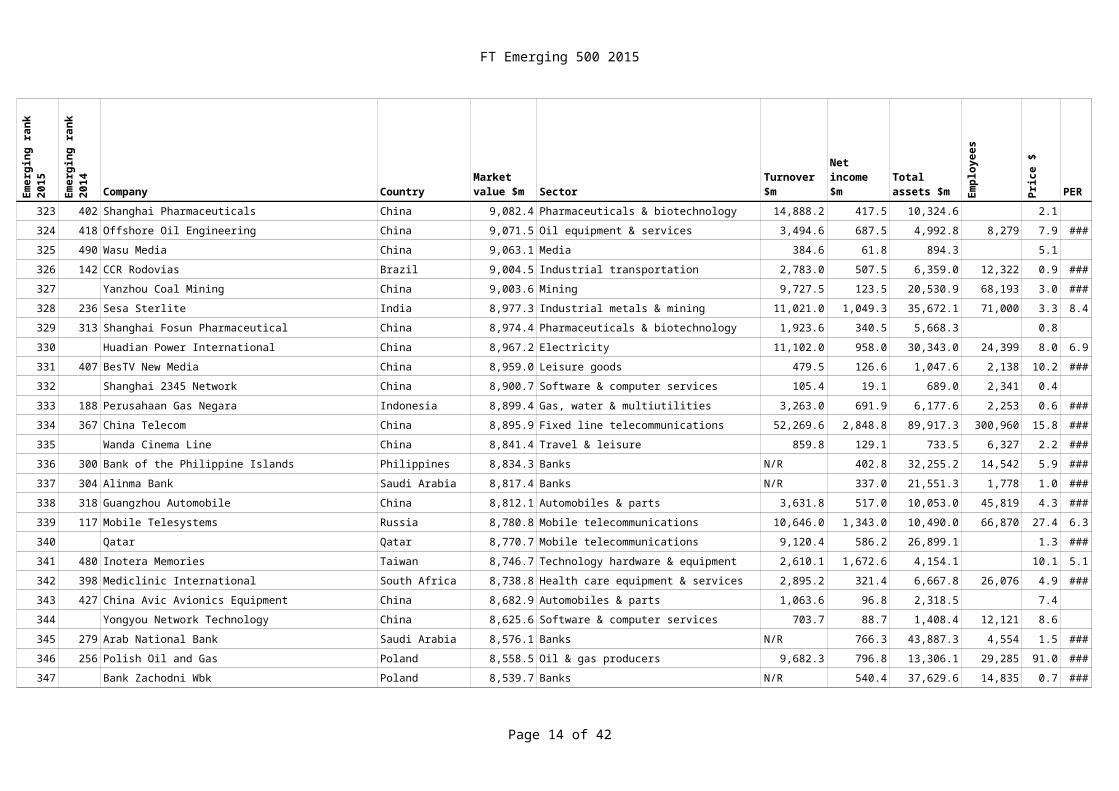
323 402 Shanghai Pharmaceuticals China 9,082.4 Pharmaceuticals & biotechnology 14,888.2 417.5 10,324.6324 418 Offshore Oil Engineering China 9,071.5 Oil equipment & services 3,494.6 687.5 4,992.8 8,279
325 490 Wasu Media China 9,063.1 Media 384.6 61.8 894.3
326 142 CCR Rodovias Brazil 9,004.5 Industrial transportation 2,783.0 507.5 6,359.0 12,322327 Yanzhou Coal Mining China 9,003.6 Mining 9,727.5 123.5 20,530.9 68,193
328 236 Sesa Sterlite India 8,977.3 Industrial metals & mining 11,021.0 1,049.3 35,672.1 71,000329 313 Shanghai Fosun Pharmaceutical China 8,974.4 Pharmaceuticals & biotechnology 1,923.6 340.5 5,668.3330 Huadian Power International China 8,967.2 Electricity 11,102.0 958.0 30,343.0 24,399
331 407 BesTV New Media China 8,959.0 Leisure goods 479.5 126.6 1,047.6 2,138332 Shanghai 2345 Network China 8,900.7 Software & computer services 105.4 19.1 689.0 2,341
333 188 Perusahaan Gas Negara Indonesia 8,899.4 Gas, water & multiutilities 3,263.0 691.9 6,177.6 2,253
334 367 China Telecom China 8,895.9 Fixed line telecommunications 52,269.6 2,848.8 89,917.3 300,960335 Wanda Cinema Line China 8,841.4 Travel & leisure 859.8 129.1 733.5 6,327336 300 Bank of the Philippine Islands Philippines 8,834.3 Banks N/R 402.8 32,255.2 14,542
337 304 Alinma Bank Saudi Arabia 8,817.4 Banks N/R 337.0 21,551.3 1,778338 318 Guangzhou Automobile China 8,812.1 Automobiles & parts 3,631.8 517.0 10,053.0 45,819
339 117 Mobile Telesystems Russia 8,780.8 Mobile telecommunications 10,646.0 1,343.0 10,490.0 66,870340 Qatar Qatar 8,770.7 Mobile telecommunications 9,120.4 586.2 26,899.1341 480 Inotera Memories Taiwan 8,746.7 Technology hardware & equipment 2,610.1 1,672.6 4,154.1
342 398 Mediclinic International South Africa 8,738.8 Health care equipment & services 2,895.2 321.4 6,667.8 26,076343 427 China Avic Avionics Equipment China 8,682.9 Automobiles & parts 1,063.6 96.8 2,318.5
344 Yongyou Network Technology China 8,625.6 Software & computer services 703.7 88.7 1,408.4 12,121
345 279 Arab National Bank Saudi Arabia 8,576.1 Banks N/R 766.3 43,887.3 4,554
FT Emerging 500 2015
Page 13 of 36
Company Country Sector Turnover $m Empl
oyee
s
Emer
ging
rank
20
15
Emer
ging
rank
20
14 Market value $m
Net income $m
Total assets $m
346 256 Polish Oil and Gas Poland 8,558.5 Oil & gas producers 9,682.3 796.8 13,306.1 29,285
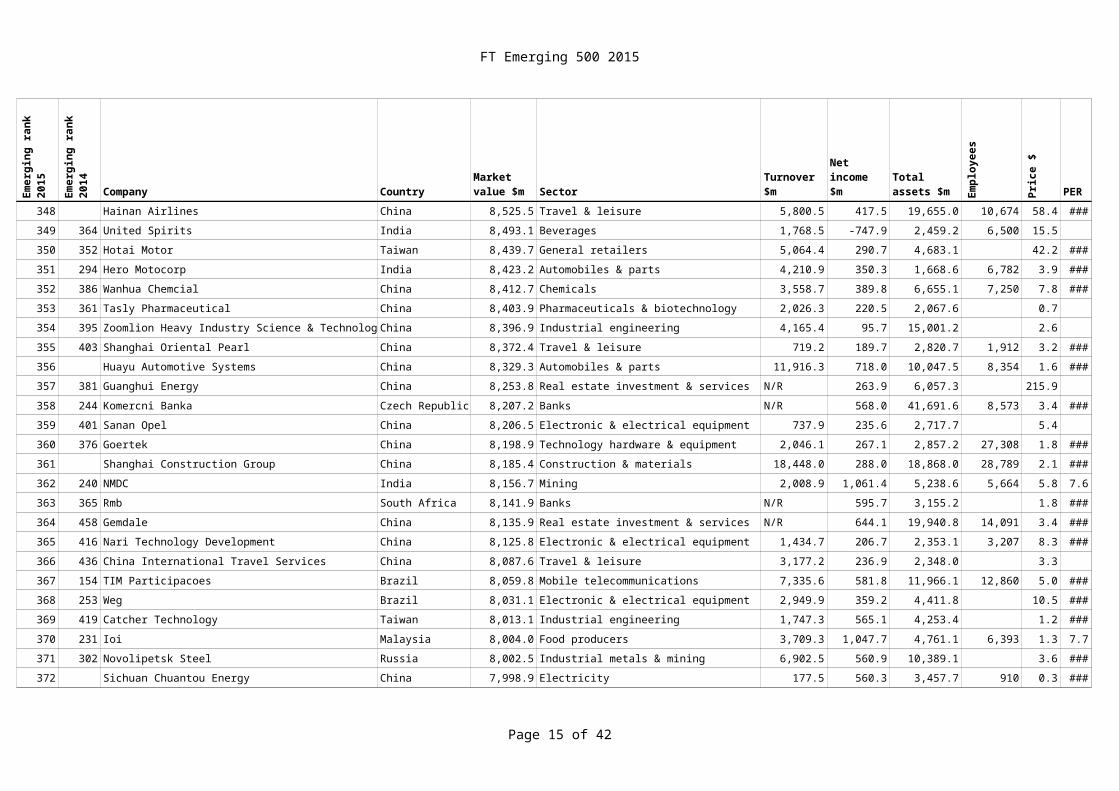
347 Bank Zachodni Wbk Poland 8,539.7 Banks N/R 540.4 37,629.6 14,835348 Hainan Airlines China 8,525.5 Travel & leisure 5,800.5 417.5 19,655.0 10,674
349 364 United Spirits India 8,493.1 Beverages 1,768.5 -747.9 2,459.2 6,500350 352 Hotai Motor Taiwan 8,439.7 General retailers 5,064.4 290.7 4,683.1351 294 Hero Motocorp India 8,423.2 Automobiles & parts 4,210.9 350.3 1,668.6 6,782
352 386 Wanhua Chemcial China 8,412.7 Chemicals 3,558.7 389.8 6,655.1 7,250353 361 Tasly Pharmaceutical China 8,403.9 Pharmaceuticals & biotechnology 2,026.3 220.5 2,067.6
354 395 Zoomlion Heavy Industry Science & Technology China 8,396.9 Industrial engineering 4,165.4 95.7 15,001.2
355 403 Shanghai Oriental Pearl China 8,372.4 Travel & leisure 719.2 189.7 2,820.7 1,912356 Huayu Automotive Systems China 8,329.3 Automobiles & parts 11,916.3 718.0 10,047.5 8,354
357 381 Guanghui Energy China 8,253.8 Real estate investment & services N/R 263.9 6,057.3358 244 Komercni Banka Czech Republic 8,207.2 Banks N/R 568.0 41,691.6 8,573359 401 Sanan Opel China 8,206.5 Electronic & electrical equipment 737.9 235.6 2,717.7
360 376 Goertek China 8,198.9 Technology hardware & equipment 2,046.1 267.1 2,857.2 27,308361 Shanghai Construction Group China 8,185.4 Construction & materials 18,448.0 288.0 18,868.0 28,789
362 240 NMDC India 8,156.7 Mining 2,008.9 1,061.4 5,238.6 5,664
363 365 Rmb South Africa 8,141.9 Banks N/R 595.7 3,155.2364 458 Gemdale China 8,135.9 Real estate investment & services N/R 644.1 19,940.8 14,091365 416 Nari Technology Development China 8,125.8 Electronic & electrical equipment 1,434.7 206.7 2,353.1 3,207
366 436 China International Travel Services China 8,087.6 Travel & leisure 3,177.2 236.9 2,348.0367 154 TIM Participacoes Brazil 8,059.8 Mobile telecommunications 7,335.6 581.8 11,966.1 12,860
368 253 Weg Brazil 8,031.1 Electronic & electrical equipment 2,949.9 359.2 4,411.8369 419 Catcher Technology Taiwan 8,013.1 Industrial engineering 1,747.3 565.1 4,253.4370 231 Ioi Malaysia 8,004.0 Food producers 3,709.3 1,047.7 4,761.1 6,393
371 302 Novolipetsk Steel Russia 8,002.5 Industrial metals & mining 6,902.5 560.9 10,389.1372 Sichuan Chuantou Energy China 7,998.9 Electricity 177.5 560.3 3,457.7 910
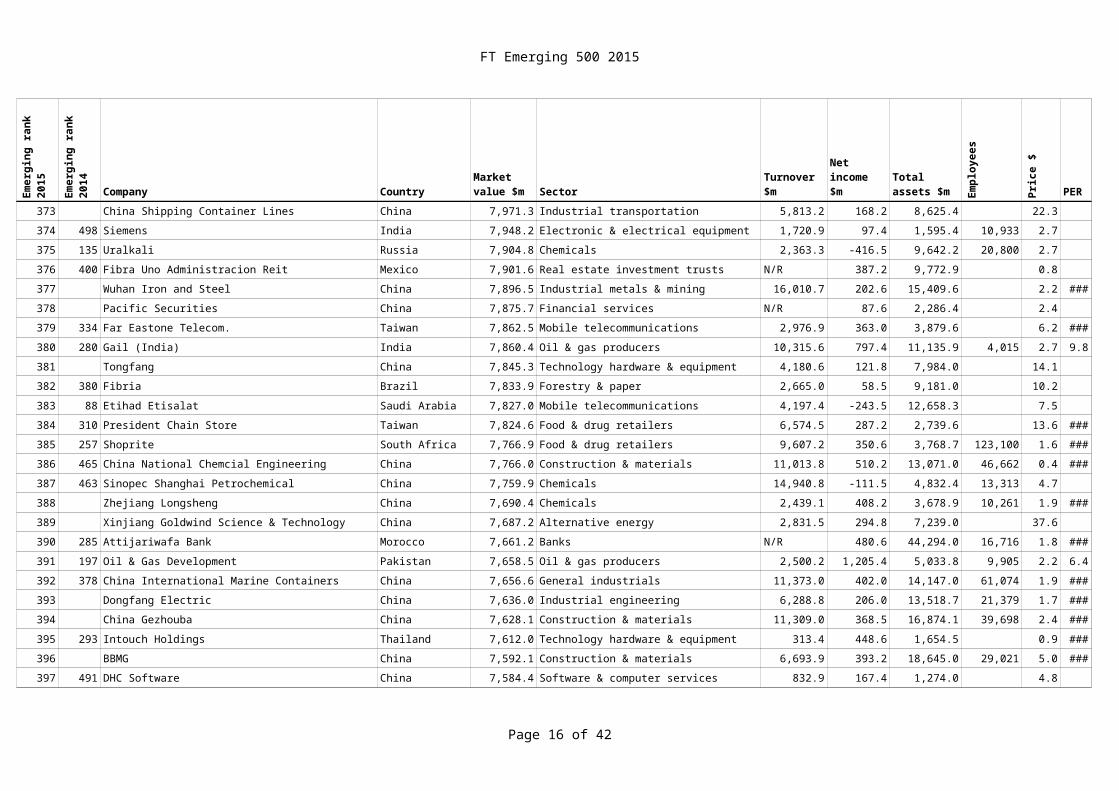
373 China Shipping Container Lines China 7,971.3 Industrial transportation 5,813.2 168.2 8,625.4
374 498 Siemens India 7,948.2 Electronic & electrical equipment 1,720.9 97.4 1,595.4 10,933
FT Emerging 500 2015
Page 14 of 36
Company Country Sector Turnover $m Empl
oyee
s
Emer
ging
rank
20
15
Emer
ging
rank
20
14 Market value $m
Net income $m
Total assets $m
375 135 Uralkali Russia 7,904.8 Chemicals 2,363.3 -416.5 9,642.2 20,800
376 400 Fibra Uno Administracion Reit Mexico 7,901.6 Real estate investment trusts N/R 387.2 9,772.9377 Wuhan Iron and Steel China 7,896.5 Industrial metals & mining 16,010.7 202.6 15,409.6
378 Pacific Securities China 7,875.7 Financial services N/R 87.6 2,286.4379 334 Far Eastone Telecom. Taiwan 7,862.5 Mobile telecommunications 2,976.9 363.0 3,879.6380 280 Gail (India) India 7,860.4 Oil & gas producers 10,315.6 797.4 11,135.9 4,015
381 Tongfang China 7,845.3 Technology hardware & equipment 4,180.6 121.8 7,984.0382 380 Fibria Brazil 7,833.9 Forestry & paper 2,665.0 58.5 9,181.0
383 88 Etihad Etisalat Saudi Arabia 7,827.0 Mobile telecommunications 4,197.4 -243.5 12,658.3
384 310 President Chain Store Taiwan 7,824.6 Food & drug retailers 6,574.5 287.2 2,739.6385 257 Shoprite South Africa 7,766.9 Food & drug retailers 9,607.2 350.6 3,768.7 123,100
386 465 China National Chemcial Engineering China 7,766.0 Construction & materials 11,013.8 510.2 13,071.0 46,662387 463 Sinopec Shanghai Petrochemical China 7,759.9 Chemicals 14,940.8 -111.5 4,832.4 13,313388 Zhejiang Longsheng China 7,690.4 Chemicals 2,439.1 408.2 3,678.9 10,261
389 Xinjiang Goldwind Science & Technology China 7,687.2 Alternative energy 2,831.5 294.8 7,239.0390 285 Attijariwafa Bank Morocco 7,661.2 Banks N/R 480.6 44,294.0 16,716
391 197 Oil & Gas Development Pakistan 7,658.5 Oil & gas producers 2,500.2 1,205.4 5,033.8 9,905
392 378 China International Marine Containers China 7,656.6 General industrials 11,373.0 402.0 14,147.0 61,074393 Dongfang Electric China 7,636.0 Industrial engineering 6,288.8 206.0 13,518.7 21,379394 China Gezhouba China 7,628.1 Construction & materials 11,309.0 368.5 16,874.1 39,698
395 293 Intouch Holdings Thailand 7,612.0 Technology hardware & equipment 313.4 448.6 1,654.5396 BBMG China 7,592.1 Construction & materials 6,693.9 393.2 18,645.0 29,021
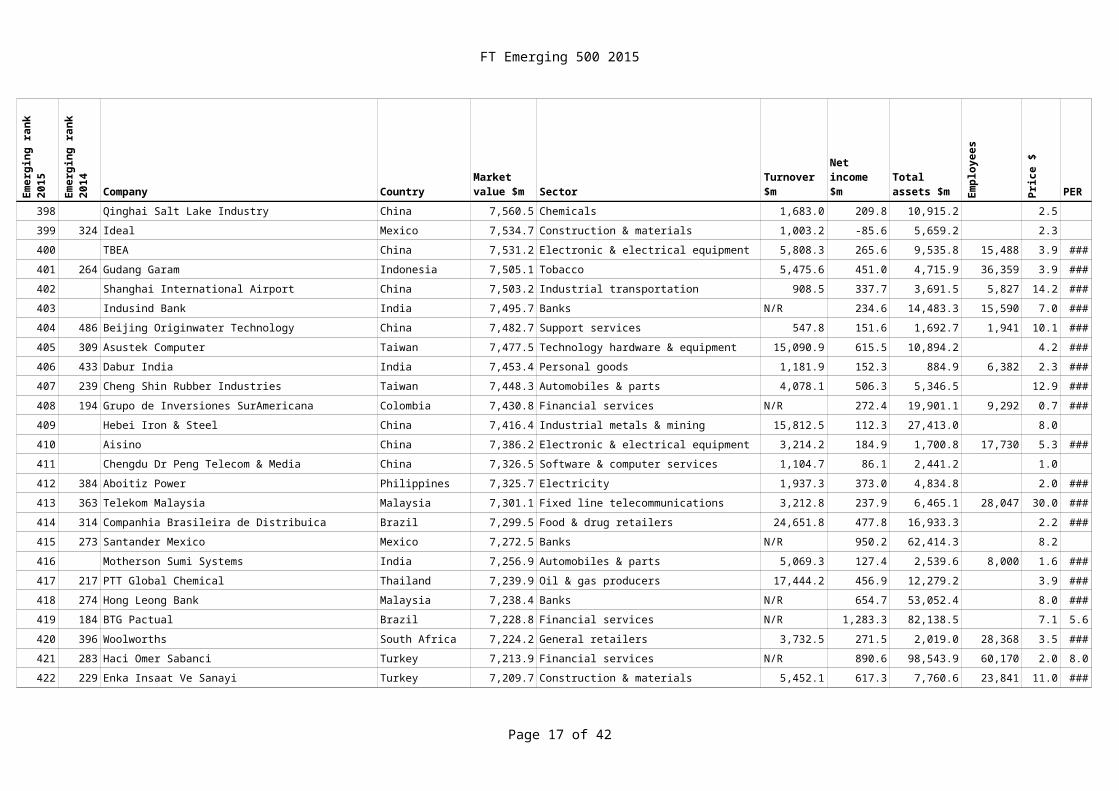
397 491 DHC Software China 7,584.4 Software & computer services 832.9 167.4 1,274.0398 Qinghai Salt Lake Industry China 7,560.5 Chemicals 1,683.0 209.8 10,915.2399 324 Ideal Mexico 7,534.7 Construction & materials 1,003.2 -85.6 5,659.2
400 TBEA China 7,531.2 Electronic & electrical equipment 5,808.3 265.6 9,535.8 15,488401 264 Gudang Garam Indonesia 7,505.1 Tobacco 5,475.6 451.0 4,715.9 36,359
402 Shanghai International Airport China 7,503.2 Industrial transportation 908.5 337.7 3,691.5 5,827
403 Indusind Bank India 7,495.7 Banks N/R 234.6 14,483.3 15,590
FT Emerging 500 2015
Page 15 of 36
Company Country Sector Turnover $m Empl
oyee
s
Emer
ging
rank
20
15
Emer
ging
rank
20
14 Market value $m
Net income $m
Total assets $m
404 486 Beijing Originwater Technology China 7,482.7 Support services 547.8 151.6 1,692.7 1,941
405 309 Asustek Computer Taiwan 7,477.5 Technology hardware & equipment 15,090.9 615.5 10,894.2406 433 Dabur India India 7,453.4 Personal goods 1,181.9 152.3 884.9 6,382
407 239 Cheng Shin Rubber Industries Taiwan 7,448.3 Automobiles & parts 4,078.1 506.3 5,346.5408 194 Grupo de Inversiones SurAmericana Colombia 7,430.8 Financial services N/R 272.4 19,901.1 9,292409 Hebei Iron & Steel China 7,416.4 Industrial metals & mining 15,812.5 112.3 27,413.0
410 Aisino China 7,386.2 Electronic & electrical equipment 3,214.2 184.9 1,700.8 17,730411 Chengdu Dr Peng Telecom & Media China 7,326.5 Software & computer services 1,104.7 86.1 2,441.2
412 384 Aboitiz Power Philippines 7,325.7 Electricity 1,937.3 373.0 4,834.8
413 363 Telekom Malaysia Malaysia 7,301.1 Fixed line telecommunications 3,212.8 237.9 6,465.1 28,047414 314 Companhia Brasileira de Distribuica Brazil 7,299.5 Food & drug retailers 24,651.8 477.8 16,933.3
415 273 Santander Mexico Mexico 7,272.5 Banks N/R 950.2 62,414.3416 Motherson Sumi Systems India 7,256.9 Automobiles & parts 5,069.3 127.4 2,539.6 8,000417 217 PTT Global Chemical Thailand 7,239.9 Oil & gas producers 17,444.2 456.9 12,279.2
418 274 Hong Leong Bank Malaysia 7,238.4 Banks N/R 654.7 53,052.4419 184 BTG Pactual Brazil 7,228.8 Financial services N/R 1,283.3 82,138.5
420 396 Woolworths South Africa 7,224.2 General retailers 3,732.5 271.5 2,019.0 28,368
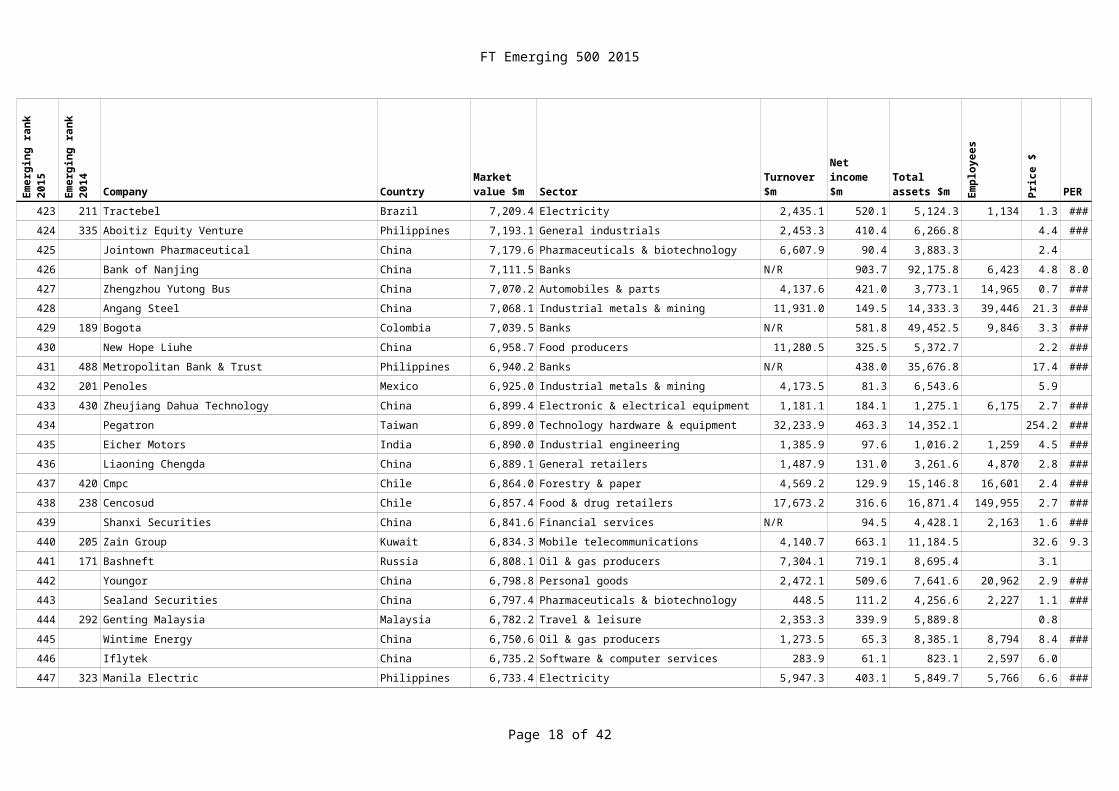
421 283 Haci Omer Sabanci Turkey 7,213.9 Financial services N/R 890.6 98,543.9 60,170422 229 Enka Insaat Ve Sanayi Turkey 7,209.7 Construction & materials 5,452.1 617.3 7,760.6 23,841423 211 Tractebel Brazil 7,209.4 Electricity 2,435.1 520.1 5,124.3 1,134
424 335 Aboitiz Equity Venture Philippines 7,193.1 General industrials 2,453.3 410.4 6,266.8425 Jointown Pharmaceutical China 7,179.6 Pharmaceuticals & biotechnology 6,607.9 90.4 3,883.3
426 Bank of Nanjing China 7,111.5 Banks N/R 903.7 92,175.8 6,423427 Zhengzhou Yutong Bus China 7,070.2 Automobiles & parts 4,137.6 421.0 3,773.1 14,965428 Angang Steel China 7,068.1 Industrial metals & mining 11,931.0 149.5 14,333.3 39,446
429 189 Bogota Colombia 7,039.5 Banks N/R 581.8 49,452.5 9,846430 New Hope Liuhe China 6,958.7 Food producers 11,280.5 325.5 5,372.7
431 488 Metropolitan Bank & Trust Philippines 6,940.2 Banks N/R 438.0 35,676.8
432 201 Penoles Mexico 6,925.0 Industrial metals & mining 4,173.5 81.3 6,543.6
FT Emerging 500 2015
Page 16 of 36
Company Country Sector Turnover $m Empl
oyee
s
Emer
ging
rank
20
15
Emer
ging
rank
20
14 Market value $m
Net income $m
Total assets $m
433 430 Zheujiang Dahua Technology China 6,899.4 Electronic & electrical equipment 1,181.1 184.1 1,275.1 6,175
434 Pegatron Taiwan 6,899.0 Technology hardware & equipment 32,233.9 463.3 14,352.1435 Eicher Motors India 6,890.0 Industrial engineering 1,385.9 97.6 1,016.2 1,259
436 Liaoning Chengda China 6,889.1 General retailers 1,487.9 131.0 3,261.6 4,870437 420 Cmpc Chile 6,864.0 Forestry & paper 4,569.2 129.9 15,146.8 16,601438 238 Cencosud Chile 6,857.4 Food & drug retailers 17,673.2 316.6 16,871.4 149,955
439 Shanxi Securities China 6,841.6 Financial services N/R 94.5 4,428.1 2,163440 205 Zain Group Kuwait 6,834.3 Mobile telecommunications 4,140.7 663.1 11,184.5
441 171 Bashneft Russia 6,808.1 Oil & gas producers 7,304.1 719.1 8,695.4
442 Youngor China 6,798.8 Personal goods 2,472.1 509.6 7,641.6 20,962443 Sealand Securities China 6,797.4 Pharmaceuticals & biotechnology 448.5 111.2 4,256.6 2,227
444 292 Genting Malaysia Malaysia 6,782.2 Travel & leisure 2,353.3 339.9 5,889.8445 Wintime Energy China 6,750.6 Oil & gas producers 1,273.5 65.3 8,385.1 8,794446 Iflytek China 6,735.2 Software & computer services 283.9 61.1 823.1 2,597
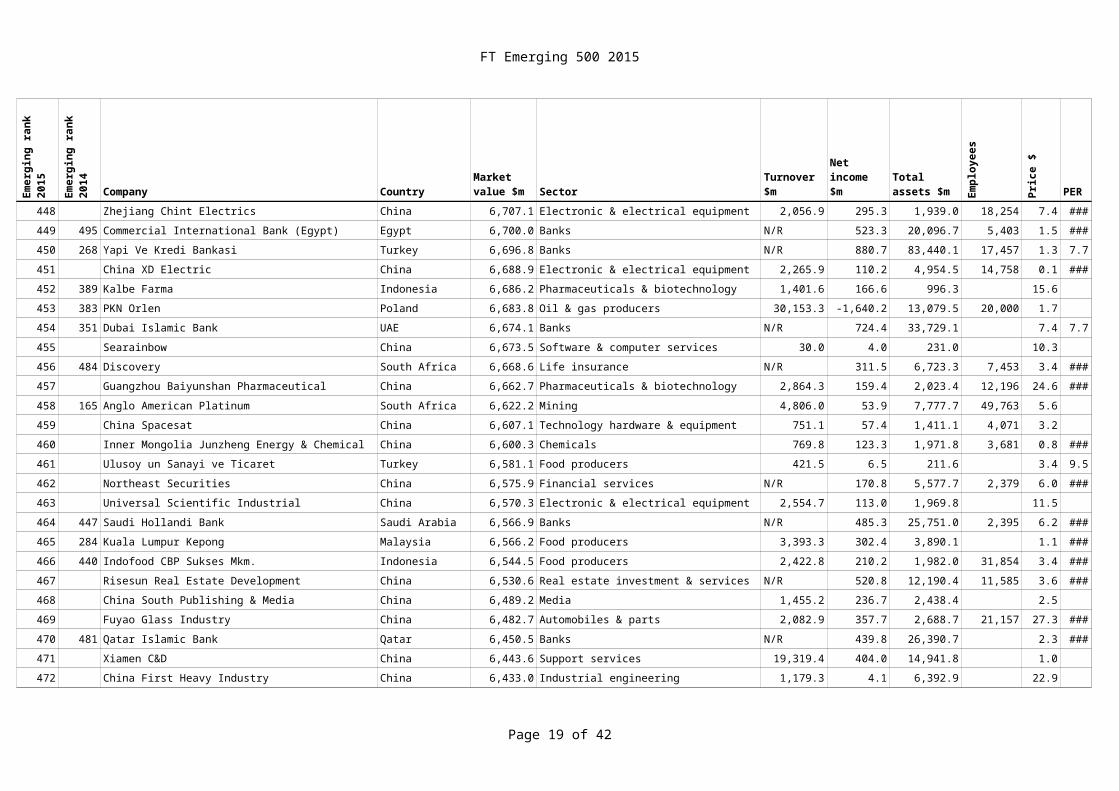
447 323 Manila Electric Philippines 6,733.4 Electricity 5,947.3 403.1 5,849.7 5,766448 Zhejiang Chint Electrics China 6,707.1 Electronic & electrical equipment 2,056.9 295.3 1,939.0 18,254
449 495 Commercial International Bank (Egypt) Egypt 6,700.0 Banks N/R 523.3 20,096.7 5,403
450 268 Yapi Ve Kredi Bankasi Turkey 6,696.8 Banks N/R 880.7 83,440.1 17,457451 China XD Electric China 6,688.9 Electronic & electrical equipment 2,265.9 110.2 4,954.5 14,758452 389 Kalbe Farma Indonesia 6,686.2 Pharmaceuticals & biotechnology 1,401.6 166.6 996.3
453 383 PKN Orlen Poland 6,683.8 Oil & gas producers 30,153.3 -1,640.2 13,079.5 20,000454 351 Dubai Islamic Bank UAE 6,674.1 Banks N/R 724.4 33,729.1
455 Searainbow China 6,673.5 Software & computer services 30.0 4.0 231.0456 484 Discovery South Africa 6,668.6 Life insurance N/R 311.5 6,723.3 7,453457 Guangzhou Baiyunshan Pharmaceutical China 6,662.7 Pharmaceuticals & biotechnology 2,864.3 159.4 2,023.4 12,196
458 165 Anglo American Platinum South Africa 6,622.2 Mining 4,806.0 53.9 7,777.7 49,763459 China Spacesat China 6,607.1 Technology hardware & equipment 751.1 57.4 1,411.1 4,071
460 Inner Mongolia Junzheng Energy & Chemical China 6,600.3 Chemicals 769.8 123.3 1,971.8 3,681
461 Ulusoy un Sanayi ve Ticaret Turkey 6,581.1 Food producers 421.5 6.5 211.6
FT Emerging 500 2015
Page 17 of 36
Company Country Sector Turnover $m Empl
oyee
s
Emer
ging
rank
20
15
Emer
ging
rank
20
14 Market value $m
Net income $m
Total assets $m
462 Northeast Securities China 6,575.9 Financial services N/R 170.8 5,577.7 2,379
463 Universal Scientific Industrial China 6,570.3 Electronic & electrical equipment 2,554.7 113.0 1,969.8464 447 Saudi Hollandi Bank Saudi Arabia 6,566.9 Banks N/R 485.3 25,751.0 2,395
465 284 Kuala Lumpur Kepong Malaysia 6,566.2 Food producers 3,393.3 302.4 3,890.1466 440 Indofood CBP Sukses Mkm. Indonesia 6,544.5 Food producers 2,422.8 210.2 1,982.0 31,854467 Risesun Real Estate Development China 6,530.6 Real estate investment & services N/R 520.8 12,190.4 11,585
468 China South Publishing & Media China 6,489.2 Media 1,455.2 236.7 2,438.4469 Fuyao Glass Industry China 6,482.7 Automobiles & parts 2,082.9 357.7 2,688.7 21,157
470 481 Qatar Islamic Bank Qatar 6,450.5 Banks N/R 439.8 26,390.7
471 Xiamen C&D China 6,443.6 Support services 19,319.4 404.0 14,941.8472 China First Heavy Industry China 6,433.0 Industrial engineering 1,179.3 4.1 6,392.9
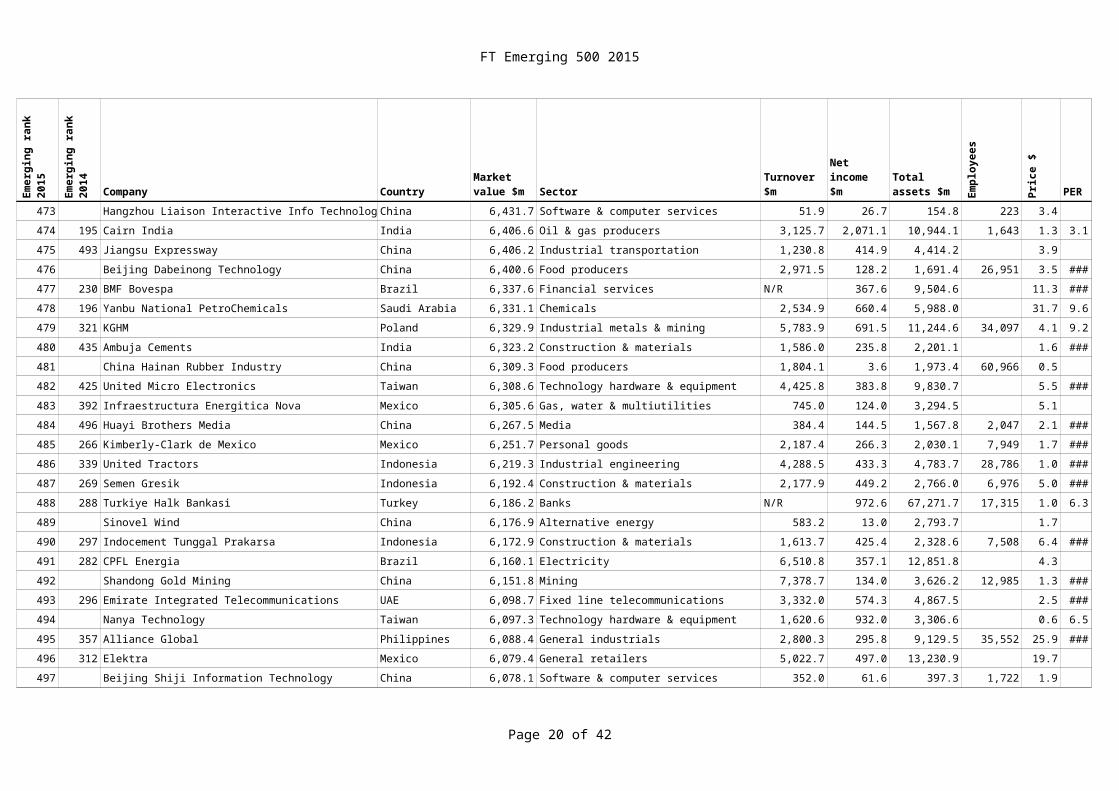
473 Hangzhou Liaison Interactive Info Technology China 6,431.7 Software & computer services 51.9 26.7 154.8 223474 195 Cairn India India 6,406.6 Oil & gas producers 3,125.7 2,071.1 10,944.1 1,643475 493 Jiangsu Expressway China 6,406.2 Industrial transportation 1,230.8 414.9 4,414.2
476 Beijing Dabeinong Technology China 6,400.6 Food producers 2,971.5 128.2 1,691.4 26,951477 230 BMF Bovespa Brazil 6,337.6 Financial services N/R 367.6 9,504.6
478 196 Yanbu National PetroChemicals Saudi Arabia 6,331.1 Chemicals 2,534.9 660.4 5,988.0
479 321 KGHM Poland 6,329.9 Industrial metals & mining 5,783.9 691.5 11,244.6 34,097480 435 Ambuja Cements India 6,323.2 Construction & materials 1,586.0 235.8 2,201.1481 China Hainan Rubber Industry China 6,309.3 Food producers 1,804.1 3.6 1,973.4 60,966
482 425 United Micro Electronics Taiwan 6,308.6 Technology hardware & equipment 4,425.8 383.8 9,830.7483 392 Infraestructura Energitica Nova Mexico 6,305.6 Gas, water & multiutilities 745.0 124.0 3,294.5
484 496 Huayi Brothers Media China 6,267.5 Media 384.4 144.5 1,567.8 2,047485 266 Kimberly-Clark de Mexico Mexico 6,251.7 Personal goods 2,187.4 266.3 2,030.1 7,949486 339 United Tractors Indonesia 6,219.3 Industrial engineering 4,288.5 433.3 4,783.7 28,786
487 269 Semen Gresik Indonesia 6,192.4 Construction & materials 2,177.9 449.2 2,766.0 6,976488 288 Turkiye Halk Bankasi Turkey 6,186.2 Banks N/R 972.6 67,271.7 17,315
489 Sinovel Wind China 6,176.9 Alternative energy 583.2 13.0 2,793.7
490 297 Indocement Tunggal Prakarsa Indonesia 6,172.9 Construction & materials 1,613.7 425.4 2,328.6 7,508
FT Emerging 500 2015
Page 18 of 36
Company Country Sector Turnover $m Empl
oyee
s
Emer
ging
rank
20
15
Emer
ging
rank
20
14 Market value $m
Net income $m
Total assets $m
491 282 CPFL Energia Brazil 6,160.1 Electricity 6,510.8 357.1 12,851.8
492 Shandong Gold Mining China 6,151.8 Mining 7,378.7 134.0 3,626.2 12,985493 296 Emirate Integrated Telecommunications UAE 6,098.7 Fixed line telecommunications 3,332.0 574.3 4,867.5
494 Nanya Technology Taiwan 6,097.3 Technology hardware & equipment 1,620.6 932.0 3,306.6495 357 Alliance Global Philippines 6,088.4 General industrials 2,800.3 295.8 9,129.5 35,552496 312 Elektra Mexico 6,079.4 General retailers 5,022.7 497.0 13,230.9
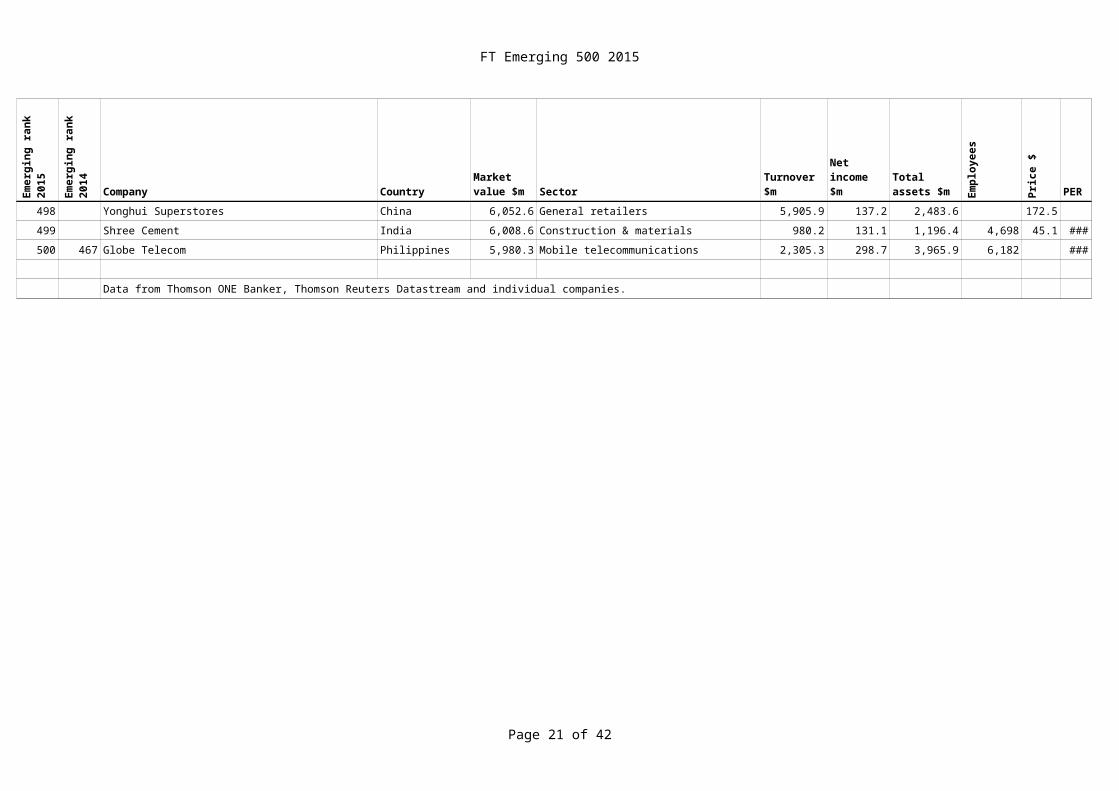
497 Beijing Shiji Information Technology China 6,078.1 Software & computer services 352.0 61.6 397.3 1,722498 Yonghui Superstores China 6,052.6 General retailers 5,905.9 137.2 2,483.6
499 Shree Cement India 6,008.6 Construction & materials 980.2 131.1 1,196.4 4,698
500 467 Globe Telecom Philippines 5,980.3 Mobile telecommunications 2,305.3 298.7 3,965.9 6,182
Data from Thomson ONE Banker, Thomson Reuters Datastream and individual companies.
FT Emerging 500 2015
Page 19 of 36
Pric
e $
PER Div
iden
d yi
eld
(%)
Year end0.7 12.3 3.6 12/31/20140.8 5.7 5.4 12/31/20140.6 5.5 6.0 12/31/2014
0.5 5.8 5.2 12/31/20144.4 5.5 6.1 12/31/2014
4.7 24.3 1.4 12/31/2014
0.8 14.5 3.0 12/31/201412.0 11.4 3.8 12/31/2014
5.8 15.0 1.0 12/31/201440.8 19.9 2.8 12/31/20140.9 24.9 1.3 3/31/2014
154.3 6.1 4.7 12/31/201421.3 0.3 3/31/2014
2.4 10.3 6.9 12/31/2014
2.6 6.8 4.5 12/31/201411.1 8.2 4.7 12/31/20142.4 7.5 3.2 12/31/2014
3.7 19.9 12/31/20143.0 24.7 1.3 12/31/2014
1.2 7.4 3.0 12/31/20140.8 5.8 2.5 12/31/20144.8 5.4 12/31/2014
2.6 23.8 1.7 12/31/20144.3 6.2 4.7 12/31/2014
1.0 7.9 3.2 12/31/2014
4.0 20.6 1.9 12/31/2014
FT Emerging 500 2015
Page 20 of 36
Pric
e $
PER Div
iden
d yi
eld
(%)
Year end2.5 9.8 5.2 12/31/2014
9.3 25.0 3.6 12/31/20142.9 6.1 5.8 12/31/2014
13.2 10.5 12/31/20144.9 10.3 1.2 3/31/20145.2 9.4 3.3 3/31/2014
2.8 27.4 1.9 3/31/20141.4 12/31/2014
16.3 10.1 2.1 12/31/2014
35.5 26.8 0.7 3/31/201446.5 22.7 0.7 3/31/2014
3.0 11.5 5.5 12/31/20141.0 12/31/2014
53.1 12.8 1.0 12/31/2014
1.2 13.0 3.9 12/31/201431.6 10.3 2.4 12/31/2014
1.3 14.6 2.2 12/31/2014
2.4 22.0 12/31/20140.6 18.7 1.6 12/31/2014
16.4 5.5 5.4 12/31/2014
1.5 65.4 0.2 3/31/201416.7 10.0 1.3 12/31/2014
1.4 11.5 5.6 12/31/201421.0 18.0 12/31/201416.3 24.7 1.1 3/31/2014
9.4 13.8 1.0 12/31/20144.3 1.6 12/31/2014
16.9 12.6 0.2 3/31/2014
14.0 11.2 6.4 12/31/2014
FT Emerging 500 2015
Page 21 of 36
Pric
e $
PER Div
iden
d yi
eld
(%)
Year end5.1 45.0 1.6 3/31/2014
1.6 46.6 1.4 12/31/20143.6 0.6 12/31/2014
5.0 32.5 0.8 12/31/20142.5 15.8 0.4 3/31/20141.8 11.0 0.8 12/31/2014
9.9 14.7 3.4 12/31/2014178.9 16.8 3.3 12/31/2014
5.6 18.2 13.3 12/31/2014
1.1 12.7 12/31/20140.6 22.6 0.9 12/31/2014
4.9 1.6 12/31/20143.4 37.4 1.6 12/31/2014
14.3 12.2 4.7 12/31/2014
4.5 19.3 1.2 12/31/20148.8 32.1 0.7 12/31/2014
0.7 12.2 0.3 3/31/2014
1.8 16.5 3.0 12/31/20144.6 11.9 4.5 12/31/2014
27.5 14.4 3.5 6/30/2014
6.3 30.9 0.9 3/31/201415.3 52.3 1.0 3/31/2014
1.0 13.7 3.1 12/31/20142.2 12.8 2.0 12/31/20143.2 9.7 3.6 12/31/2014
10.1 19.9 4.7 12/31/201413.5 19.0 1.3 3/31/2014
7.1 14.2 5.2 12/31/2014
1.1 16.4 12/31/2014
FT Emerging 500 2015
Page 22 of 36
Pric
e $
PER Div
iden
d yi
eld
(%)
Year end5.6 4.9 0.9 12/31/2014
2.5 16.9 0.5 12/31/20143.0 12.0 6.4 12/31/2014
38.2 50.5 12/31/20143.0 13.3 5.0 12/31/20147.4 12.3 2.4 12/31/2014
13.9 35.4 2.3 12/31/20145.3 14.2 3.7 12/31/2014
0.2 13.3 3.0 12/31/2014
34.0 22.0 4.5 12/31/20140.7 7.4 5.9 6/30/2014
1.0 65.0 12/31/201415.7 13.6 2.1 12/31/20143.9 20.4 0.3 6/30/2014
7.3 10.8 2.3 8/31/20146.3 19.7 4.9 12/31/2014
7.1 13.1 2.2 6/30/2014
9.0 9.3 6.8 12/31/20142.2 19.9 0.1 3/31/20147.2 73.0 1.4 12/31/2014
10.3 4.7 8.5 12/31/20146.6 15.8 5.1 12/31/2014
1.6 12/31/20141.9 13.3 3.8 12/31/20145.0 10.3 1.6 12/31/2014
5.1 26.1 1.2 12/31/20143.8 14.6 2.9 12/31/2014
4.7 11.5 2.6 12/31/2014
2.4 20.3 4.1 12/31/2014

FT Emerging 500 2015
Page 23 of 36
Pric
e $
PER Div
iden
d yi
eld
(%)
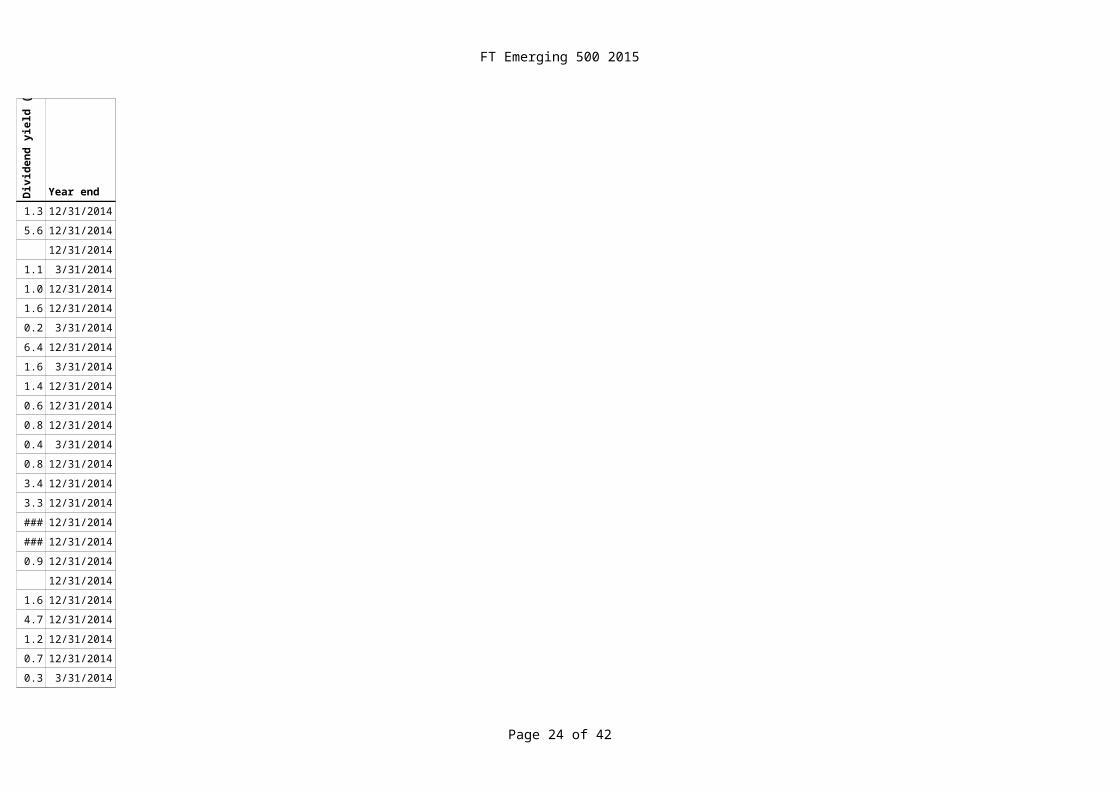
Year end0.7 10.2 4.3 3/31/2014
3.1 22.0 1.5 12/31/20141.2 7.1 4.5 12/31/2014
15.7 19.2 12/31/201420.3 18.5 2.4 12/31/20142.3 10/24/2014
0.9 56.8 12/31/20147.7 29.3 1.1 12/31/2014
1.2 24.7 1.6 12/31/2014
1.8 9.9 5.1 12/31/20145.5 7.3 2.3 12/31/2014
2.1 11.4 3.3 12/31/2014195.3 6.3 3.4 12/31/2014
1.8 23.2 3.1 12/31/2014
1.4 9.5 5.0 12/31/20145.1 12/31/2014
4.0 12/31/2014
59.1 10.2 4.5 12/31/20141.0 37.4 0.3 3/31/20142.2 20.4 1.0 12/31/2014
19.8 17.1 3.2 12/31/20143.2 20.6 1.8 12/31/2014
2.5 11.2 0.3 12/31/20147.0 12.7 1.2 12/31/20141.9 11.9 1.7 12/31/2014
1.9 6.0 4.2 12/31/201415.5 23.9 3.1 12/31/2014
11.0 9.4 10.9 12/31/2014
21.0 12.7 7.1 3/31/2014
FT Emerging 500 2015
Page 24 of 36
Pric
e $
PER Div
iden
d yi
eld
(%)
Year end5.8 38.9 0.0 3/31/2014
20.1 72.6 1.2 12/31/20140.3 25.2 1.2 12/31/2014
4.3 16.5 3.0 12/31/201411.8 12/31/20140.4 26.8 0.4 12/31/2014
2.1 12.3 2.7 12/31/20142.5 0.5 12/31/2014
2.4 14.7 4.4 6/30/2014
6.3 27.0 2.1 12/31/20144.5 23.4 3.3 12/31/2014
1.6 45.0 0.2 12/31/20141.0 20.0 1.3 12/31/20145.0 12/31/2014
11.7 22.6 2.6 12/31/201437.6 18.8 2.2 12/31/2014
3.3 13.9 0.4 12/31/2014
1.9 12.6 1.2 12/31/201431.7 27.7 4.6 12/31/201432.1 30.8 0.6 6/30/2014
3.9 46.5 0.3 3/31/20145.9 48.3 0.8 12/31/2014
3.7 12.0 2.5 3/31/20141.7 15.0 2.7 12/31/2014
13.1 15.3 2.4 12/31/2014
6.5 19.6 2.4 12/31/20142.5 17.0 2.9 12/31/2014
1.2 10.1 4.0 12/31/2014
23.2 14.8 3.4 12/31/2014
FT Emerging 500 2015
Page 25 of 36
Pric
e $
PER Div
iden
d yi
eld
(%)
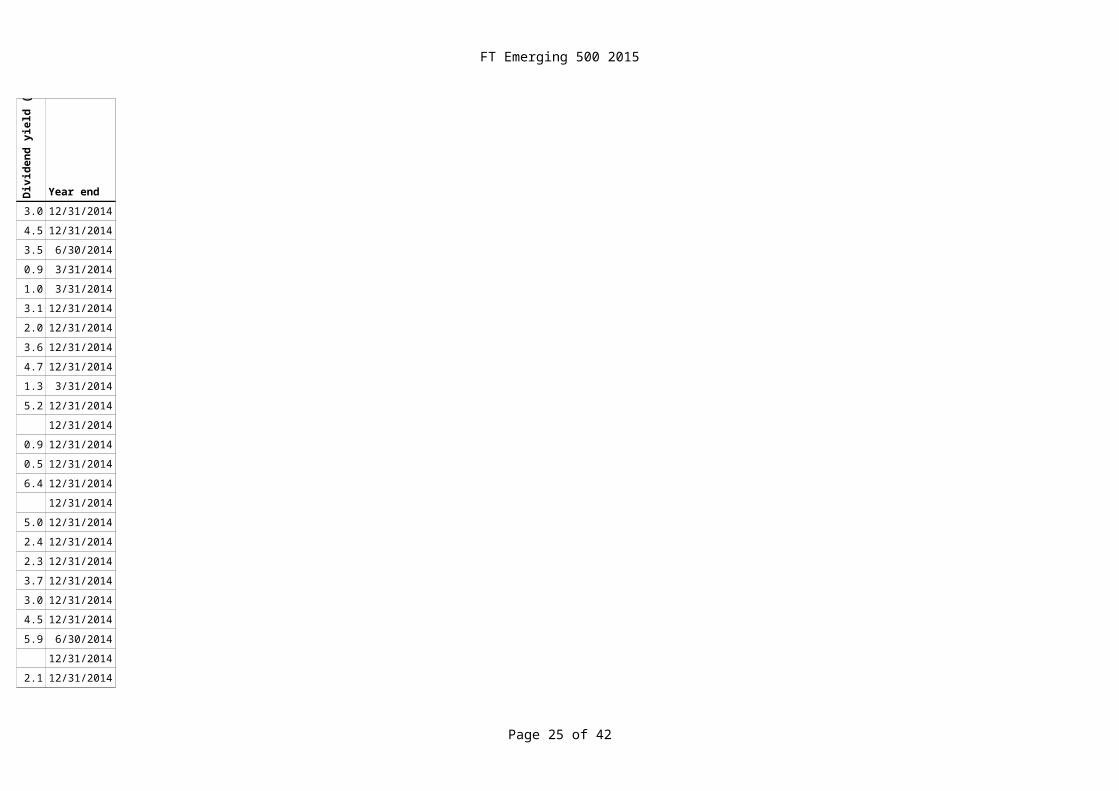
Year end63.9 30.9 1.2 12/31/2014
3.3 18.2 4.6 12/31/20140.7 8.4 1.8 12/31/2014
6.8 11.7 2.9 12/31/20141.7 10.2 1.9 12/31/20141.7 6.7 4.8 12/31/2014
4.5 24.3 4.1 12/31/20142.3 11.5 4.2 12/31/2014
2.7 38.2 1.7 12/31/2014
0.0 14.8 3.4 12/31/20142.8 12/31/2014
40.0 47.3 12/31/20143.4 19.7 3.0 12/31/20141.6 20.9 4.2 12/31/2014
2.6 54.1 0.6 12/31/20141.3 42.5 0.4 12/31/2014
24.5 66.0 12/31/2014
0.8 13.4 12/31/20146.0 16.6 9.6 12/31/20144.4 19.8 3.9 12/31/2014
15.3 16.4 1.4 12/31/20140.4 11.3 5.2 12/31/2014
0.3 44.7 12/31/20141.8 15.9 3.2 12/31/20148.6 13.8 2.2 12/31/2014
406.2 11.3 1.4 12/31/201448.5 74.1 12/31/2014
15.1 16.7 5.8 12/31/2014
4.2 0.1 12/31/2014
FT Emerging 500 2015
Page 26 of 36
Pric
e $
PER Div
iden
d yi
eld
(%)
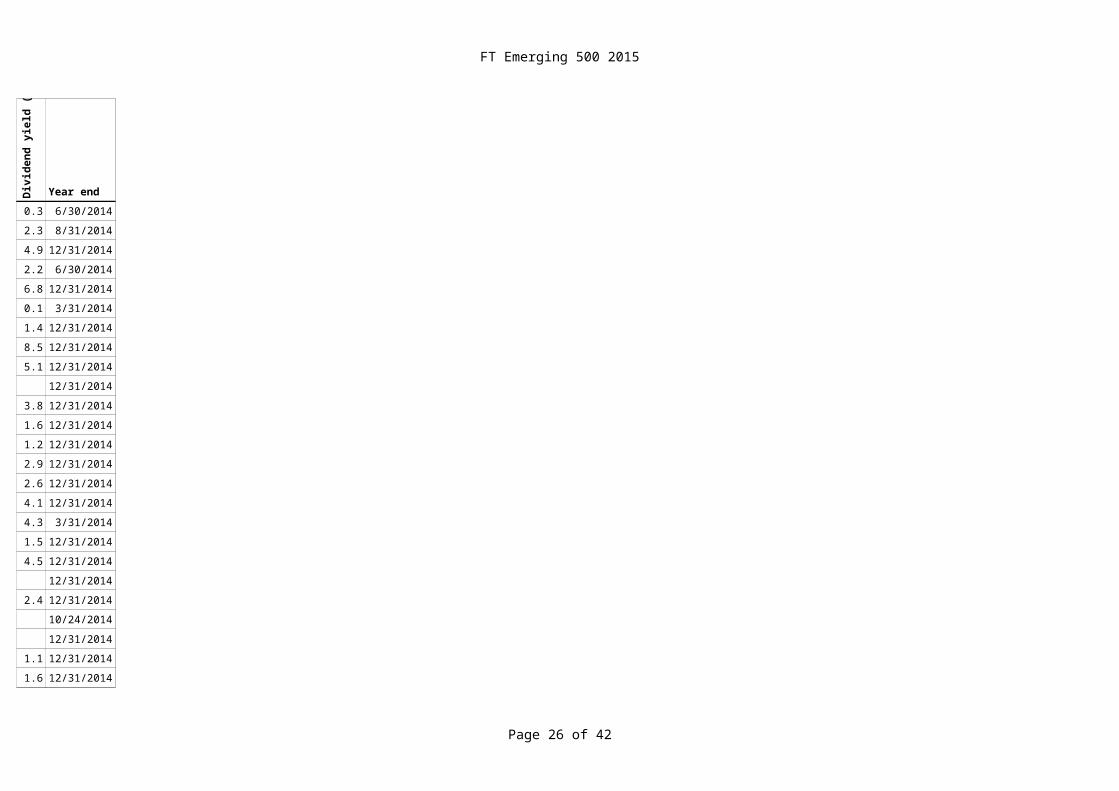
Year end0.9 14.9 1.9 12/31/2014
46.0 43.1 1.2 12/31/20148.3 34.1 0.3 3/31/2014
1.6 63.8 0.5 12/31/201413.0 0.6 12/31/20140.6 61.7 0.7 3/31/2014
0.6 27.6 12/31/20146.2 15.9 12/31/2014
8.6 23.0 2.6 12/31/2014
9.0 33.1 1.2 9/30/20141.5 0.2 12/31/2014
1.5 21.4 2.0 12/31/20141.0 16.9 3.3 12/31/20142.6 23.8 1.1 12/31/2014
8.0 42.7 0.8 12/31/20142.3 18.9 4.8 12/31/2014
6.2 14.5 1.7 3/31/2014
0.5 77.6 0.3 12/31/20143.5 25.6 3.9 12/31/20141.7 19.4 5.1 12/31/2014
10.1 13.4 2.9 12/31/20148.9 27.3 12/31/2014
19.0 40.6 0.3 12/31/20143.0 14.4 1.2 3/31/2014
13.4 8.2 2.0 12/31/2014
0.5 18.3 5.7 12/31/20144.1 12/31/2014
1.0 12/31/2014
6.2 12/31/2014
FT Emerging 500 2015
Page 27 of 36
Pric
e $
PER Div
iden
d yi
eld
(%)
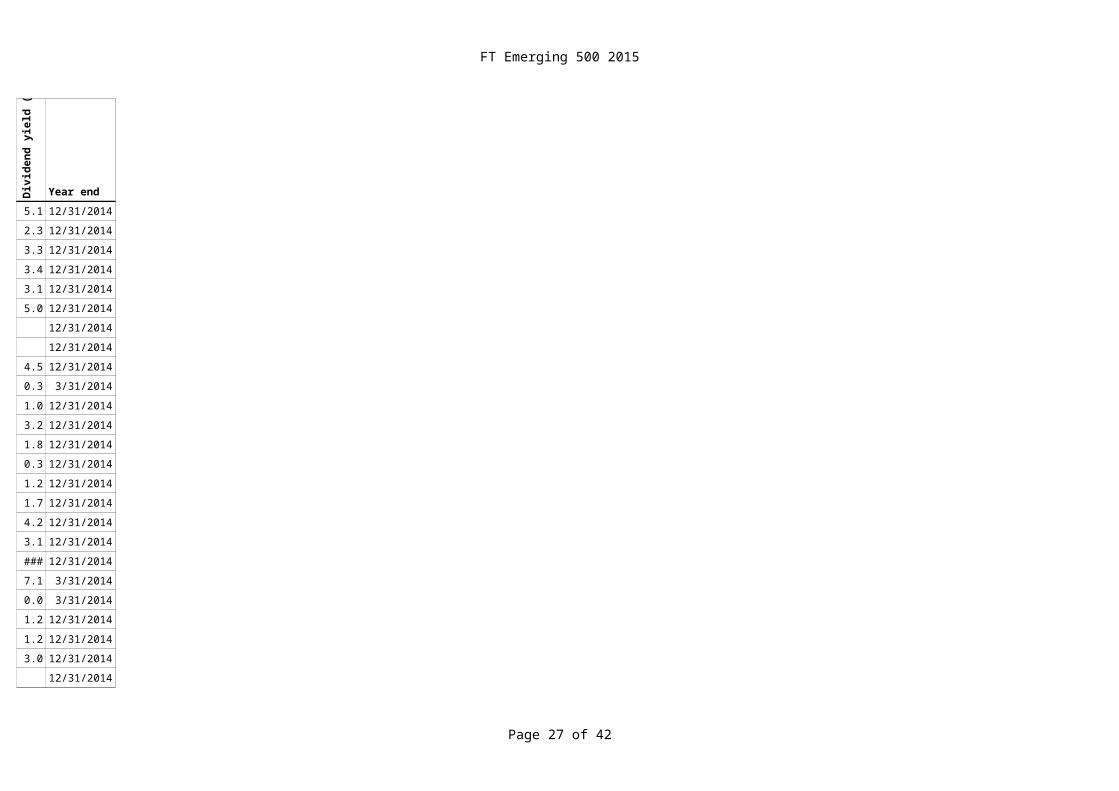
Year end4.4 47.3 1.3 3/31/2014
1.6 0.5 12/31/20141.0 27.0 12/31/2014
4.6 15.8 1.1 12/31/201486.1 9.9 1.8 12/31/20144.3 18.8 1.9 12/31/2014
2.3 30.6 2.6 12/31/20141.4 19.1 1.3 12/31/2014
1.3 46.3 0.7 12/31/2014
1.6 42.0 1.6 12/31/20145.1 14.2 0.6 12/31/2014
4.2 13.9 14.8 12/31/201420.3 0.5 12/31/20149.0 23.6 2.6 12/31/2014
10.8 12.3 12/31/20147.4 27.6 0.7 12/31/2014
129.0 46.5 0.3 12/31/2014
5.1 13.3 12/31/201417.8 42.1 0.6 9/30/20145.0 26.5 0.6 12/31/2014
5.3 29.4 1.0 12/31/20140.7 19.7 0.9 12/31/2014
5.5 23.4 1.4 12/31/201417.6 50.3 0.4 12/31/20145.7 12/31/2014
9.8 9.8 3.5 12/31/20144.9 28.9 0.2 3/31/2014
8.9 7.3 3.6 12/31/2014
111.0 11.4 2.8 12/31/2014

FT Emerging 500 2015
Page 28 of 36
Pric
e $
PER Div
iden
d yi
eld
(%)
Year end0.1 56.9 0.9 12/31/2014
4.4 11.0 9.1 12/31/20142.2 12/31/2014
2.9 24.8 1.8 12/31/20142.4 29.4 0.3 3/31/20141.4 26.1 2.6 12/31/2014
21.9 13.5 4.4 12/31/20140.5 17.3 1.7 6/30/2014
2.0 52.6 12/31/2014
0.8 1.5 12/31/20140.8 26.7 12/31/2014
5.5 10.4 4.8 12/31/20140.1 10.0 12/31/20142.3 12/31/2014
0.6 16.4 1.3 12/31/20144.9 11.0 1.8 12/31/2014
2.3 35.1 0.4 3/31/2014
4.1 7.1 3.1 12/31/20142.2 50.8 12/31/20140.7 37.2 0.9 12/31/2014
7.2 8.3 4.5 12/31/20147.3 0.3 12/31/2014
5.7 12/31/20143.7 33.4 0.4 12/31/20142.3 46.3 0.5 12/31/2014
2.8 38.5 0.4 12/31/20146.2 19.8 1.1 12/31/2014
3.5 2.0 12/31/2014
1.8 43.8 0.9 12/31/2014

FT Emerging 500 2015
Page 29 of 36
Pric
e $
PER Div
iden
d yi
eld
(%)
Year end0.5 8.4 6.3 12/31/2014
13.1 15.0 4.4 12/31/20140.7 17.9 3.7 12/31/2014
15.7 10.0 4.3 12/31/201418.2 14.8 1.7 12/31/201419.6 17.7 3.3 12/31/2014
10.1 10.8 4.5 12/31/20141.9 18.3 0.2 3/31/2014
4.2 14.3 1.6 12/31/2014
3.9 1.4 12/31/201455.8 1.0 12/31/2014
11.3 26.3 0.5 3/31/20144.8 10.5 12/31/20140.4 12/31/2014
6.1 12/31/20145.5 43.2 1.2 12/31/2014
0.6 12/31/2014
13.0 61.0 1.6 12/31/20142.9 14.2 2.2 3/31/20142.4 9.6 2.4 12/31/2014
1.3 15.1 5.4 12/31/201432.2 18.1 1.6 12/31/2014
2.7 16.4 2.6 3/31/20149.4 10.6 8.3 12/31/20143.8 11.5 3.7 12/31/2014
0.7 15.7 1.3 3/31/20146.7 11.8 4.2 12/31/2014
1.7 27.9 1.0 12/31/2014
11.4 27.8 2.4 12/31/2014
FT Emerging 500 2015
Page 30 of 36
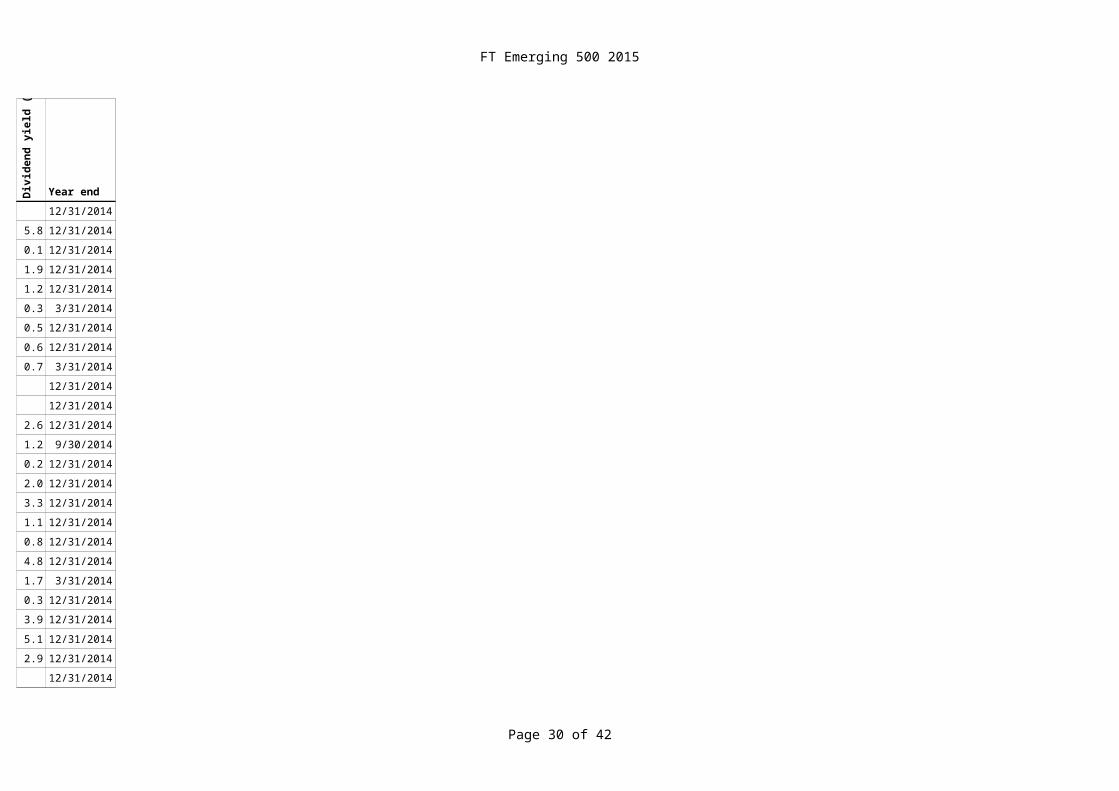
Pric
e $
PER Div
iden
d yi
eld
(%)
Year end1.2 39.2 0.3 3/31/2014
7.3 1.6 12/31/20142.4 18.6 4.1 12/31/2014
27.1 20.3 0.4 12/31/20142.0 19.8 2.8 6/30/20142.7 11.6 2.0 12/31/2014
2.1 1.9 12/31/20147.9 12.8 2.0 12/31/2014
5.1 12/31/2014
0.9 17.6 5.9 12/31/20143.0 28.5 12/31/2014
3.3 8.4 1.7 3/31/20140.8 1.5 12/31/20148.0 6.9 4.8 12/31/2014
10.2 73.1 0.2 12/31/20140.4 12/31/2014
0.6 12.3 2.7 12/31/2014
15.8 16.0 3.1 12/31/20142.2 60.7 0.8 12/31/20145.9 22.5 1.8 12/31/2014
1.0 25.6 2.2 12/31/20144.3 12.0 3.1 12/31/2014
27.4 6.3 15.8 12/31/20141.3 15.0 4.0 12/31/2014
10.1 5.1 12/31/2014
4.9 25.2 0.9 3/31/20147.4 12/31/2014
8.6 0.4 12/31/2014
1.5 11.1 1.7 12/31/2014
FT Emerging 500 2015
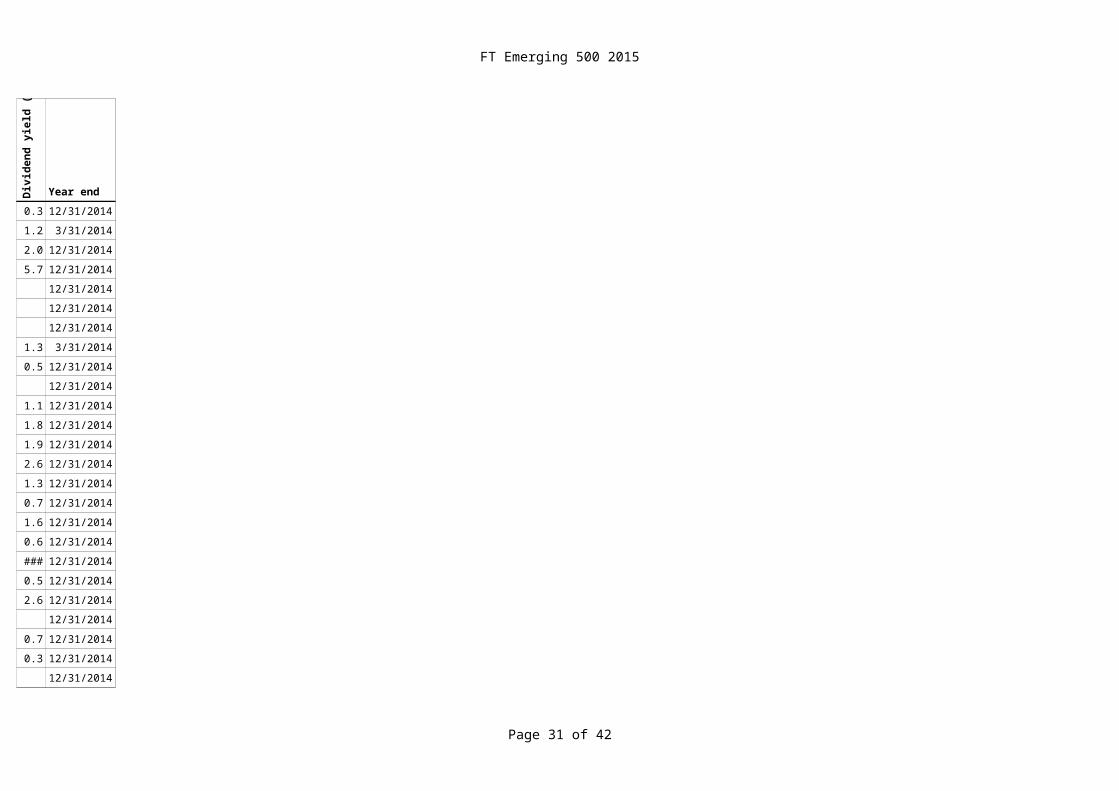
Page 31 of 36
Pric
e $
PER Div
iden
d yi
eld
(%)
Year end91.0 11.2 4.1 12/31/2014
0.7 16.2 12/31/201458.4 23.3 1.4 12/31/2014
15.5 3/31/201442.2 29.2 2.1 12/31/20143.9 24.0 2.6 3/31/2014
7.8 21.6 1.3 12/31/20140.7 0.8 12/31/2014
2.6 1.4 12/31/2014
3.2 43.8 0.4 12/31/20141.6 11.5 2.5 12/31/2014
215.9 8.2 12/31/20143.4 14.4 6.3 12/31/20145.4 0.9 12/31/2014
1.8 29.8 0.4 12/31/20142.1 29.8 1.1 12/31/2014
5.8 7.6 6.8 3/31/2014
1.8 13.7 3.6 6/30/20143.4 12.9 1.1 12/31/20148.3 37.2 0.9 12/31/2014
3.3 0.8 12/31/20145.0 13.9 1.8 12/31/2014
10.5 22.6 1.2 12/31/20141.2 14.2 1.8 12/31/20141.3 7.7 4.8 6/30/2014
3.6 10.3 5.2 12/31/20140.3 13.4 1.4 12/31/2014
22.3 12/31/2014
2.7 0.4 9/30/2014
FT Emerging 500 2015
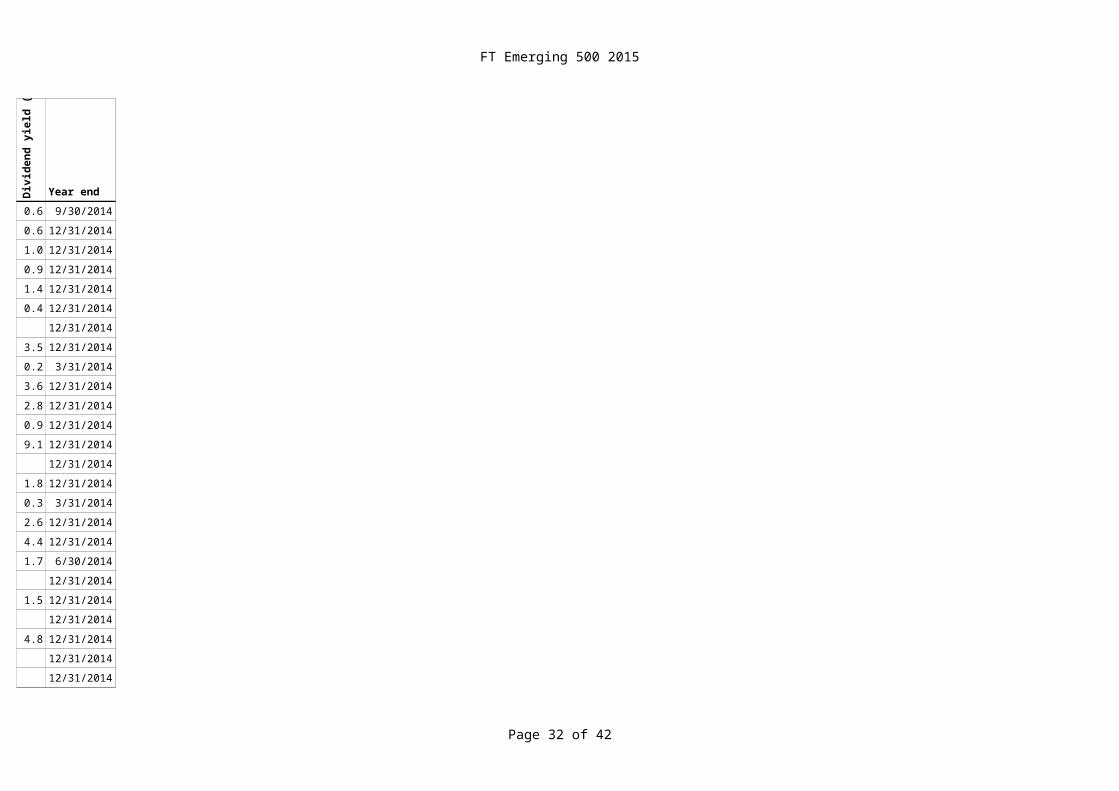
Page 32 of 36
Pric
e $
PER Div
iden
d yi
eld
(%)
Year end2.7 12/31/2014
0.8 4.5 12/31/20142.2 39.0 1.3 12/31/2014
2.4 12/31/20146.2 21.9 5.0 12/31/20142.7 9.8 2.7 3/31/2014
14.1 0.4 12/31/201410.2 0.7 12/31/2014
7.5 6.6 12/31/2014
13.6 26.9 2.9 12/31/20141.6 20.5 2.4 6/30/2014
0.4 15.7 1.3 12/31/20144.7 12/31/20141.9 17.5 1.7 12/31/2014
37.6 3.2 12/31/20141.8 15.9 2.9 12/31/2014
2.2 6.4 15.7 12/31/2014
1.9 14.5 2.3 12/31/20141.7 19.3 0.5 12/31/20142.4 20.8 1.2 12/31/2014
0.9 16.9 5.9 12/31/20145.0 11.5 1.1 12/31/2014
4.8 0.4 12/31/20142.5 0.2 12/31/20142.3 12/31/2014
3.9 29.0 1.3 12/31/20143.9 17.0 12/31/2014
14.2 21.6 1.5 12/31/2014
7.0 31.5 0.4 3/31/2014
FT Emerging 500 2015
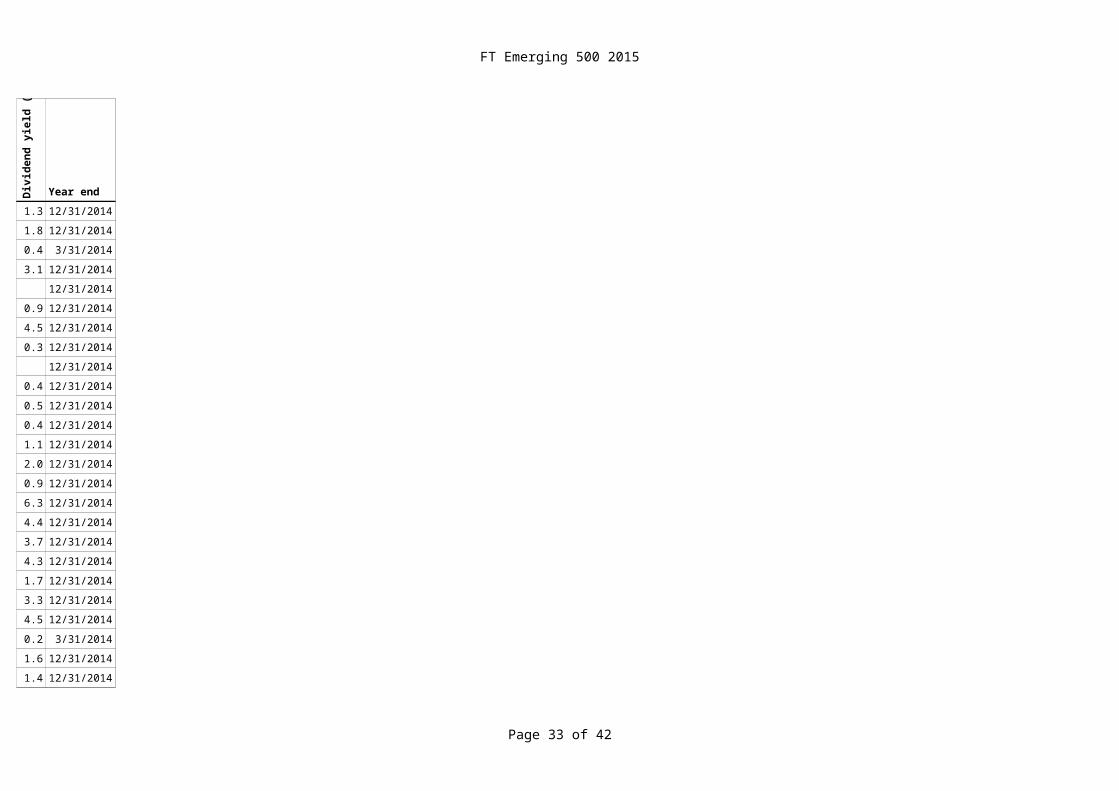
Page 33 of 36
Pric
e $
PER Div
iden
d yi
eld
(%)
Year end10.1 49.9 0.3 12/31/2014
4.2 12.1 5.4 12/31/20142.3 47.1 0.7 3/31/2014
12.9 14.4 3.9 12/31/20140.7 26.9 1.4 12/31/20148.0 12/31/2014
5.3 40.0 1.3 12/31/20141.0 0.4 12/31/2014
2.0 19.9 4.0 12/31/2014
30.0 28.0 3.6 12/31/20142.2 16.6 1.5 12/31/2014
8.2 1.4 12/31/20141.6 54.9 0.5 3/31/20143.9 16.1 4.3 12/31/2014
8.0 10.4 3.4 6/30/20147.1 5.6 4.4 12/31/2014
3.5 21.5 3.0 6/29/2014
2.0 8.0 1.1 12/31/201411.0 13.3 3.0 12/31/20141.3 13.8 6.4 12/31/2014
4.4 18.5 1.5 12/31/20142.4 12/31/2014
4.8 8.0 12/31/20140.7 16.5 3.3 12/31/2014
21.3 36.8 1.4 12/31/2014
3.3 11.6 4.9 12/31/20142.2 18.6 12/31/2014
17.4 13.6 0.9 12/31/2014
5.9 1.3 12/31/2014
FT Emerging 500 2015
Page 34 of 36
Pric
e $
PER Div
iden
d yi
eld
(%)
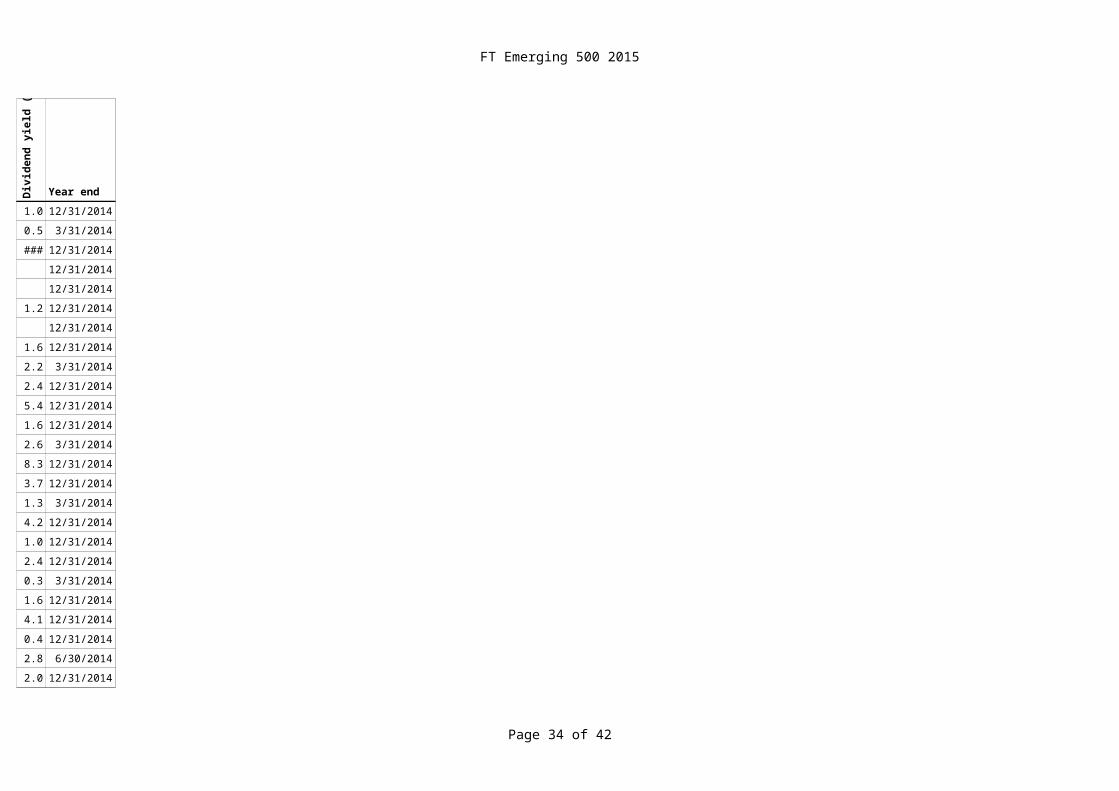
Year end2.7 36.9 0.3 12/31/2014
254.2 13.6 4.8 12/31/20144.5 70.6 0.3 12/31/2014
2.8 50.0 0.7 12/31/20142.4 55.0 0.7 12/31/20142.7 21.5 1.3 12/31/2014
1.6 68.0 0.4 12/31/201432.6 9.3 8.9 12/31/2014
3.1 12/31/2014
2.9 13.3 2.6 12/31/20141.1 58.8 0.7 12/31/2014
0.8 1.8 12/31/20148.4 39.0 12/31/20146.0 0.1 12/31/2014
6.6 16.6 1.3 12/31/20147.4 22.9 2.0 12/31/2014
1.5 12.7 2.3 12/31/2014
1.3 7.7 2.6 12/31/20140.1 65.0 1.5 12/31/2014
15.6 12/31/2014
1.7 2.9 12/31/20147.4 7.7 6.5 12/31/2014
10.3 12/31/20143.4 19.4 1.4 6/30/2014
24.6 28.7 1.2 12/31/2014
5.6 12/31/20143.2 0.2 12/31/2014
0.8 53.7 0.3 12/31/2014
3.4 9.5 12/31/2014
FT Emerging 500 2015
Page 35 of 36
Pric
e $
PER Div
iden
d yi
eld
(%)
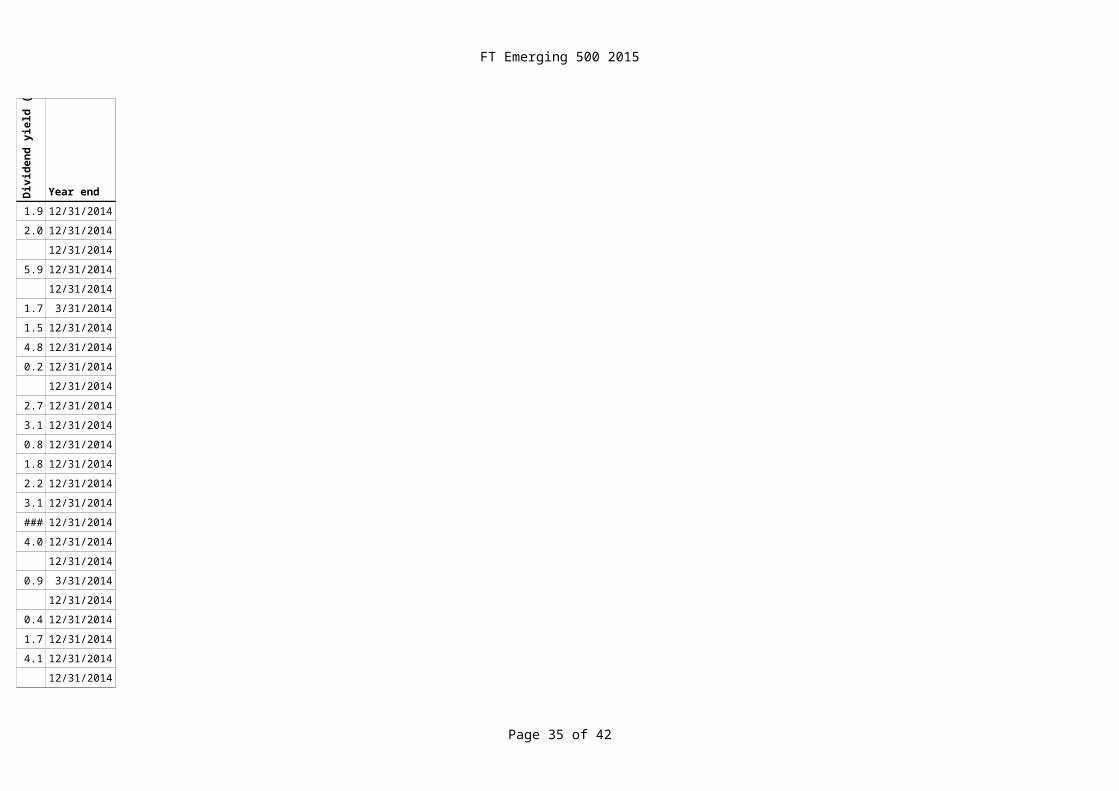
Year end6.0 37.3 0.3 12/31/2014
11.5 0.5 12/31/20146.2 13.5 1.7 12/31/2014
1.1 22.0 2.8 9/30/20143.4 28.0 12/31/20143.6 12.7 0.9 12/31/2014
2.5 1.1 12/31/201427.3 13.6 4.9 12/31/2014
2.3 14.7 4.3 12/31/2014
1.0 2.6 12/31/201422.9 12/31/2014
3.4 0.0 12/31/20141.3 3.1 6.1 3/31/20143.9 4.5 12/31/2014
3.5 48.8 0.5 12/31/201411.3 17.5 4.6 12/31/2014
31.7 9.6 7.1 12/31/2014
4.1 9.2 3.6 12/31/20141.6 27.2 2.0 12/31/20140.5 12/31/2014
5.5 16.7 4.0 12/31/20145.1 12/31/2014
2.1 42.1 3.2 12/31/20141.7 23.3 5.2 12/31/20141.0 13.9 3.6 12/31/2014
5.0 13.0 2.9 12/31/20141.0 6.3 1.6 12/31/2014
1.7 12/31/2014
6.4 14.0 12/31/2014

FT Emerging 500 2015
Page 36 of 36
Pric
e $
PER Div
iden
d yi
eld
(%)
Year end4.3 12/31/2014
1.3 48.0 0.5 12/31/20142.5 10.2 6.8 12/31/2014
0.6 6.5 2.8 12/31/201425.9 19.8 1.7 12/31/201419.7 0.6 12/31/2014
1.9 0.1 12/31/2014172.5 1.1 12/31/2014
45.1 45.9 0.3 6/30/2014
20.0 3.7 12/31/2014