Embed Size (px)
DESCRIPTION
Immigrant Entrepreneurship in the United States and Massachusetts: data and evidence. Julio O. De Castro Lewis Family distinguished professor of global management Babson College. Why study immigration?. For research Under researched area Important area of understanding for business - PowerPoint PPT Presentation
Citation preview
Immigrant Entrepreneurship in the United States and
Massachusetts: data and evidence
Julio O. De CastroLewis Family distinguished professor of global
management
Babson College
Why study immigration?– For research
• Under researched area• Important area of understanding for business
– Personally• Fits with my research interest on examining the
breadth of entrepreneurial behavior– Entrepreneurship in family, micro enterprises and gender– Entrepreneurship and product piracy– Entrepreneurship and informal businesses: characteristics
of informal businesses that become growth ventures

Finally,
– Immigration: a key global societal conversation.
• For those seeking the benefits of immigration– Germany discusses opening the immigration
process for immigrants with professional degrees
• For those discussing the costs of immigration, mostly to the societies that they migrate too.
Surprisingly:– Very little research on the business
implications of immigration• Unanticipated, given the preponderance of US
based research in social sciences and that the US defines itself as a country of Immigrants
– Some research on economic impact of immigration, (Hill, 1971; Borjas, 1990-99; Lalonde, 1997; Chiswick,2005)
– And a wealth of sociology research on immigration and its effects (e.g. Portes et al)
• But very little research on the entrepreneurial and business aspects of immigrants and immigration
In management research:
• Concentration on the examination of the impact of executive migration– Expatriate work (e.g. Stewart, Black, etc)– Influence of migration on executive labor
markets (e.g. Hill)
In entrepreneurship research:• Research in immigrant impact on the variation of
entrepreneurial rates (Shane, 1996)• Research on transnational entrepreneurship
(again, our impulse as researchers to rename everything). ETP special issue (Sequeira et al , 2005; Chen and Tan, 2005; Drori, Honing and Wight, 2005)
– First approximation to the systematic examination of characteristics of immigrant entrepreneurs
• Characteristics of immigrant entrepreneurship in different countries:
– Stone and Stubbs (2007), the Netherlands, Levie (2007), the UK, Light and Israelowitz (2005) Israel and the US
• Thus a lack of research on the characteristics of entrepreneurship in immigrant populations
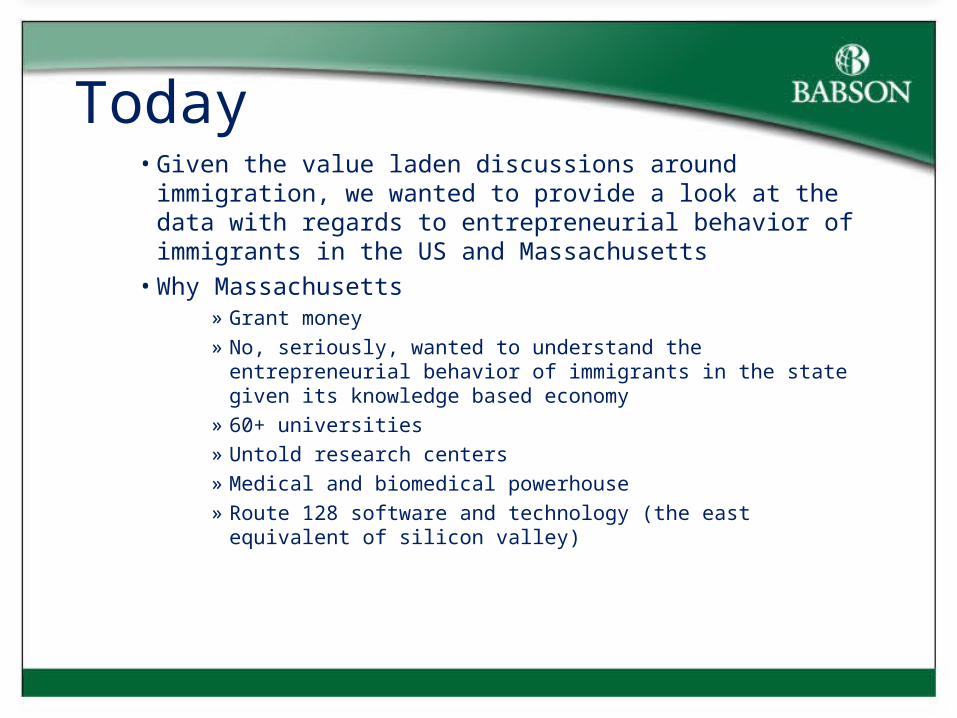
Today• Given the value laden discussions around immigration, we
wanted to provide a look at the data with regards to entrepreneurial behavior of immigrants in the US and Massachusetts
• Why Massachusetts» Grant money» No, seriously, wanted to understand the entrepreneurial
behavior of immigrants in the state given its knowledge based economy
» 60+ universities» Untold research centers» Medical and biomedical powerhouse» Route 128 software and technology (the east equivalent of
silicon valley)
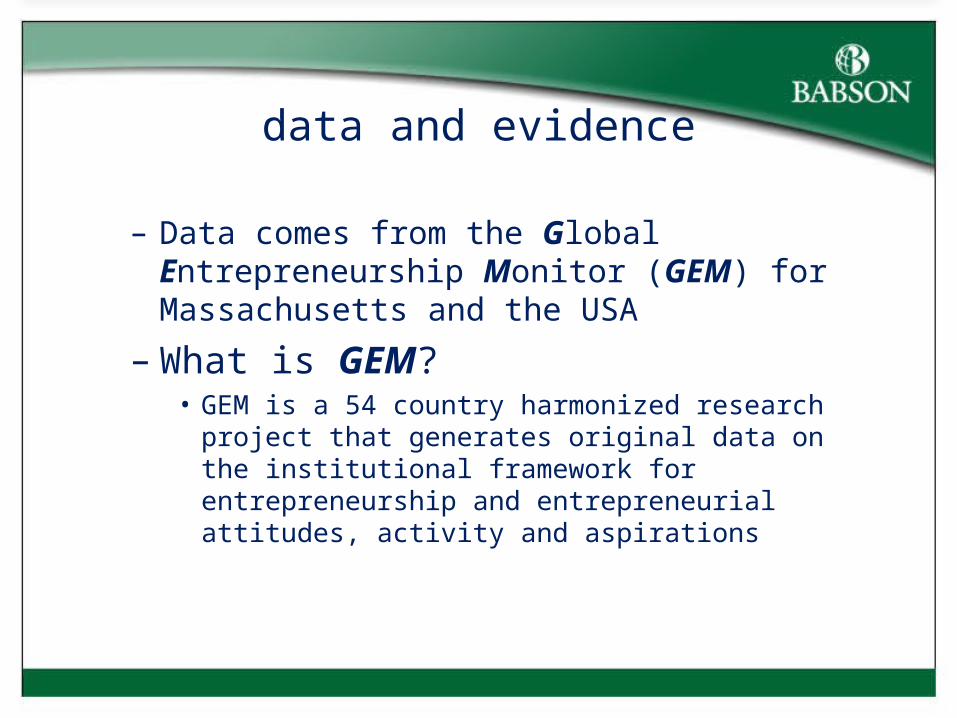
data and evidence
– Data comes from the Global Entrepreneurship Monitor (GEM) for Massachusetts and the USA
– What is GEM?• GEM is a 54 country harmonized research project that
generates original data on the institutional framework for entrepreneurship and entrepreneurial attitudes, activity and aspirations
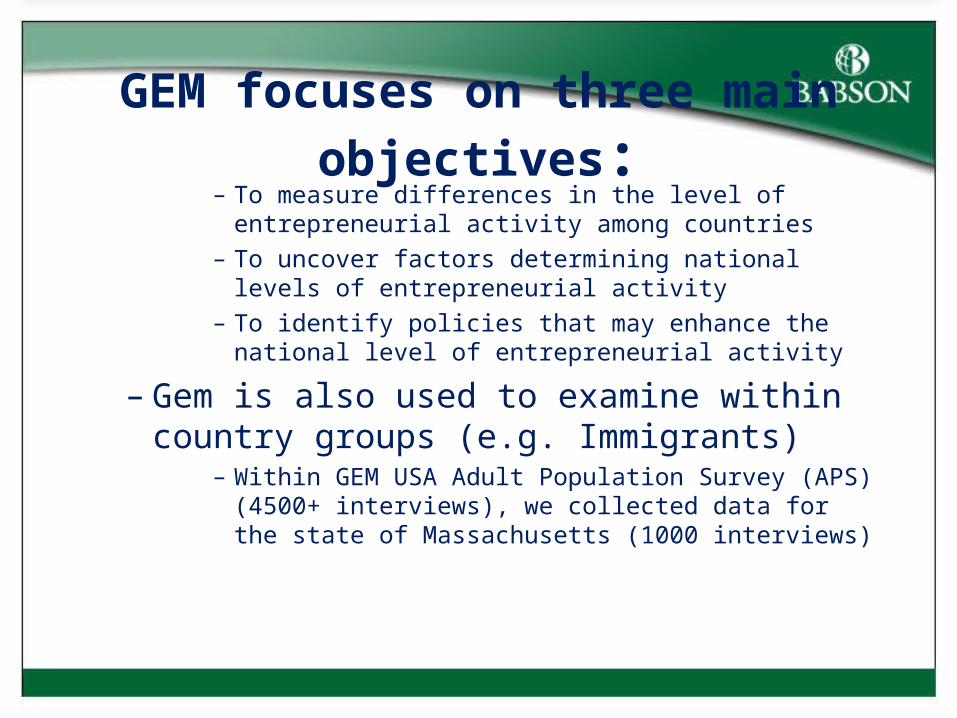
GEM focuses on three main
objectives: – To measure differences in the level of
entrepreneurial activity among countries – To uncover factors determining national levels of
entrepreneurial activity – To identify policies that may enhance the national
level of entrepreneurial activity
– Gem is also used to examine within country groups (e.g. Immigrants)
– Within GEM USA Adult Population Survey (APS) (4500+ interviews), we collected data for the state of Massachusetts (1000 interviews)
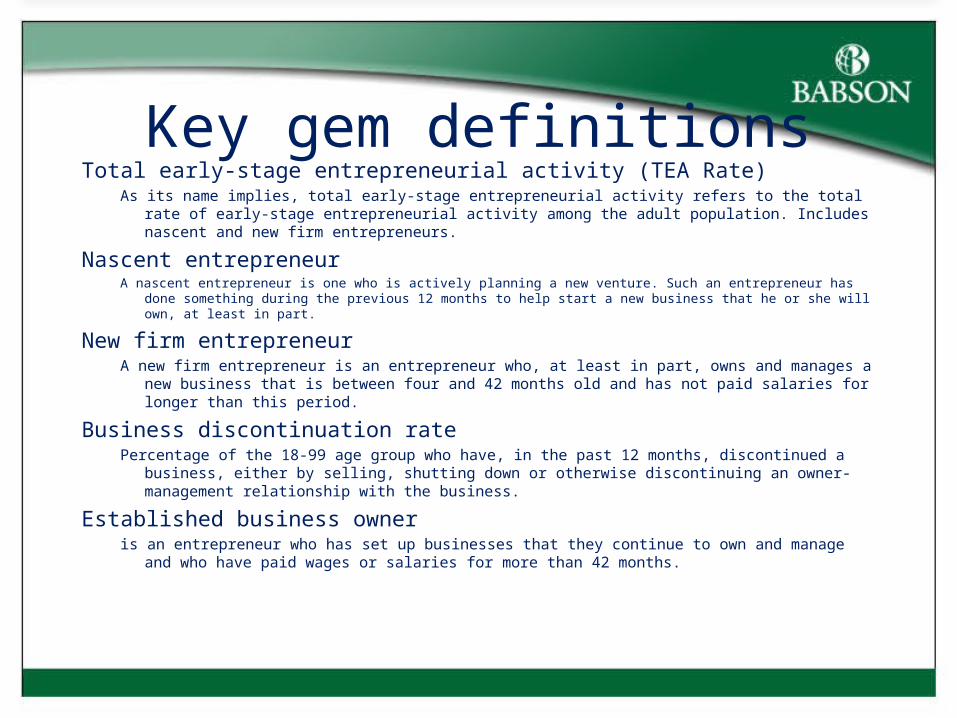
Key gem definitionsTotal early-stage entrepreneurial activity (TEA Rate)
As its name implies, total early-stage entrepreneurial activity refers to the total rate of early-stage entrepreneurial activity among the adult population. Includes nascent and new firm entrepreneurs.
Nascent entrepreneur A nascent entrepreneur is one who is actively planning a new venture. Such an entrepreneur has done something
during the previous 12 months to help start a new business that he or she will own, at least in part.
New firm entrepreneur A new firm entrepreneur is an entrepreneur who, at least in part, owns and manages a new business
that is between four and 42 months old and has not paid salaries for longer than this period.
Business discontinuation rate Percentage of the 18-99 age group who have, in the past 12 months, discontinued a business, either
by selling, shutting down or otherwise discontinuing an owner-management relationship with the business.
Established business owner is an entrepreneur who has set up businesses that they continue to own and manage and who have
paid wages or salaries for more than 42 months.
Three comparisons:
• US immigrants vs non immigrants
• Mass Immigrants vs non immigrants
• Mass Immigrants vs US immigrants
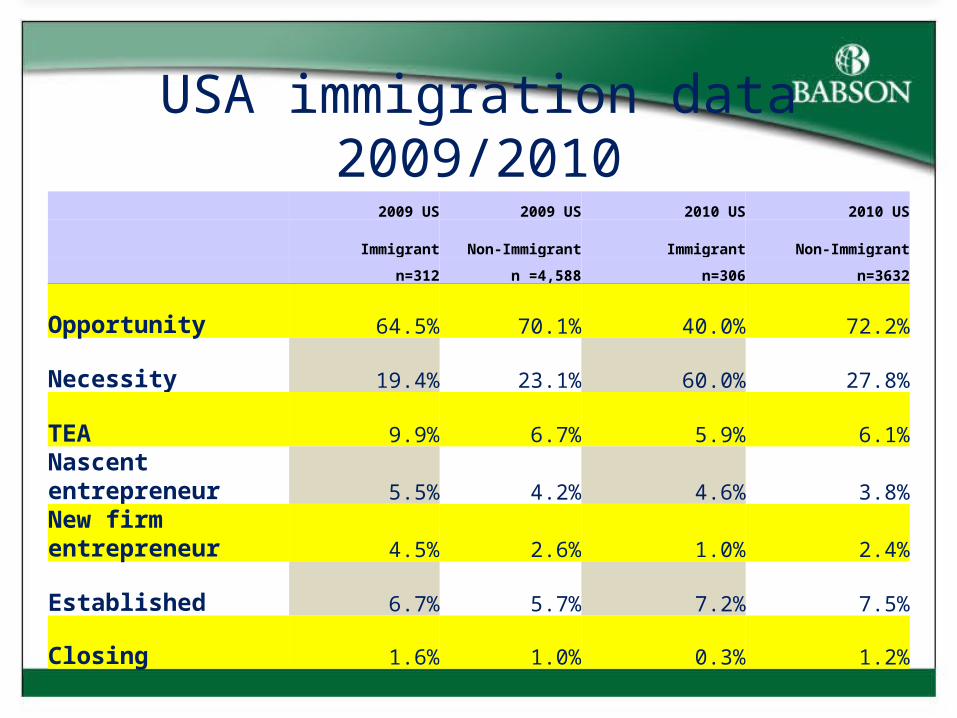
USA immigration data 2009/2010 2009 US 2009 US 2010 US 2010 US
Immigrant Non-Immigrant Immigrant Non-Immigrant
n=312 n =4,588 n=306 n=3632
Opportunity 64.5% 70.1% 40.0% 72.2%
Necessity 19.4% 23.1% 60.0% 27.8%
TEA 9.9% 6.7% 5.9% 6.1%
Nascent entrepreneur 5.5% 4.2% 4.6% 3.8%
New firm entrepreneur 4.5% 2.6% 1.0% 2.4%
Established 6.7% 5.7% 7.2% 7.5%
Closing 1.6% 1.0% 0.3% 1.2%
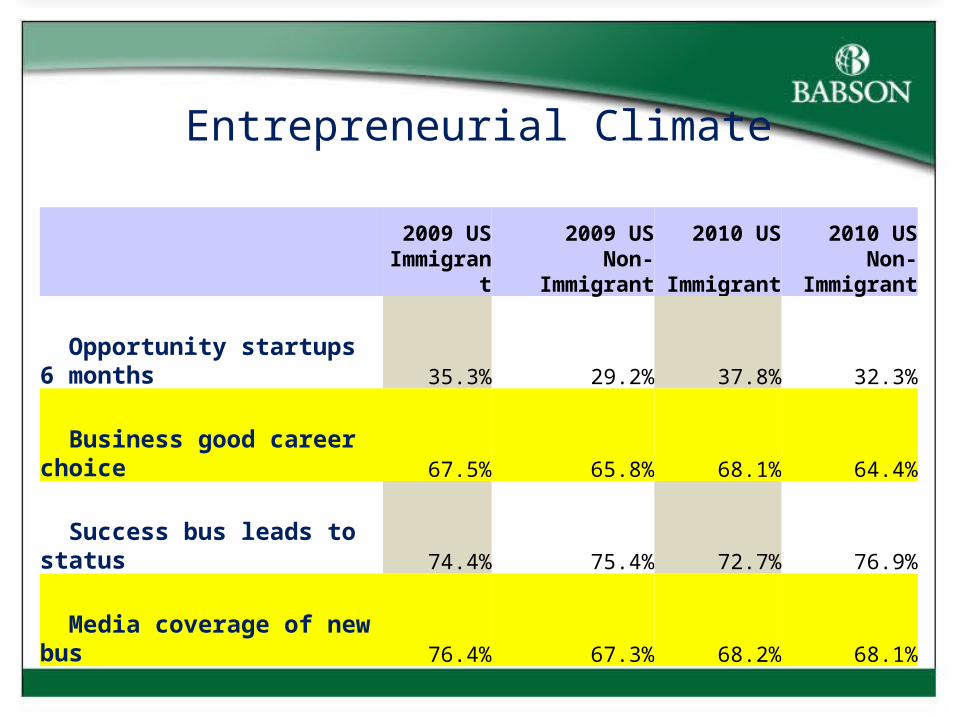
Entrepreneurial Climate
2009 US 2009 US 2010 US 2010 US
Immigrant Non-Immigrant ImmigrantNon-Immigrant
Opportunity startups 6 months 35.3% 29.2% 37.8% 32.3%
Business good career choice 67.5% 65.8% 68.1% 64.4%
Success bus leads to status 74.4% 75.4% 72.7% 76.9%
Media coverage of new bus 76.4% 67.3% 68.2% 68.1%
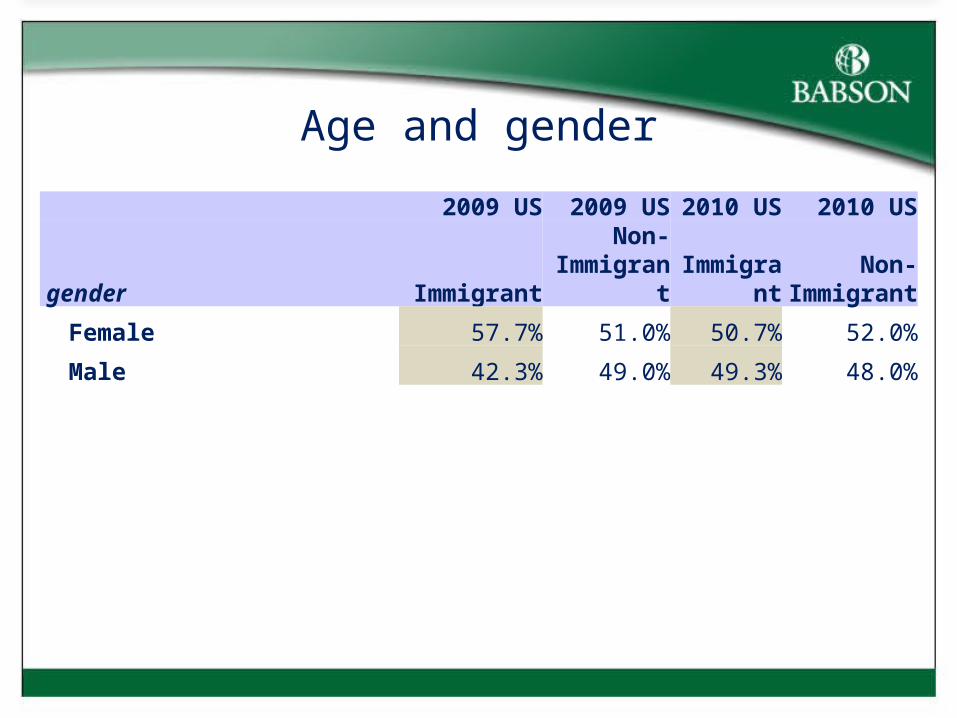
Age and gender
2009 US 2009 US 2010 US 2010 US
gender ImmigrantNon-
Immigrant ImmigrantNon-
Immigrant
Female 57.7% 51.0% 50.7% 52.0%
Male 42.3% 49.0% 49.3% 48.0%
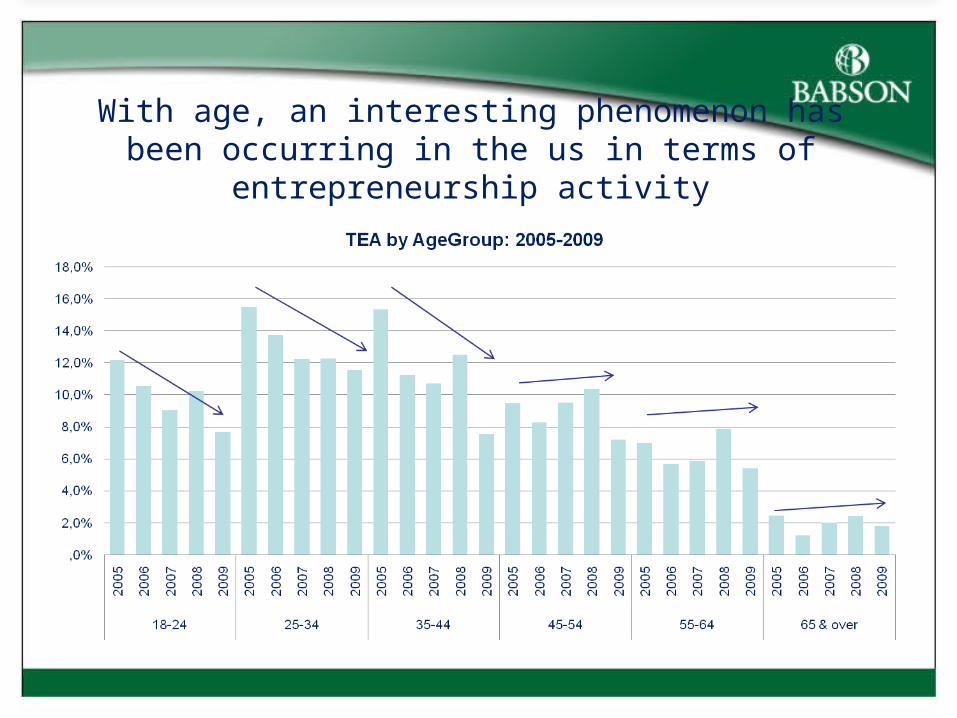
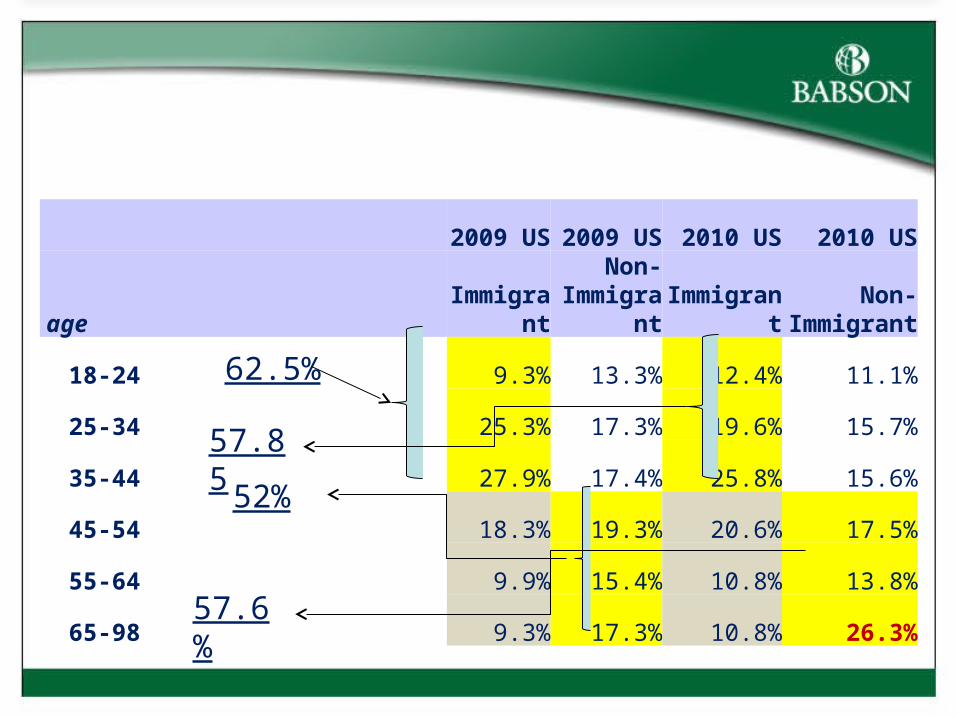
With age, an interesting phenomenon has been occurring in the us in terms of entrepreneurship activity
2009 US 2009 US 2010 US 2010 US
ageImmigran
tNon-
Immigrant ImmigrantNon-
Immigrant
18-24 9.3% 13.3% 12.4% 11.1%
25-34 25.3% 17.3% 19.6% 15.7%
35-44 27.9% 17.4% 25.8% 15.6%
45-54 18.3% 19.3% 20.6% 17.5%
55-64 9.9% 15.4% 10.8% 13.8%
65-98 9.3% 17.3% 10.8% 26.3%
62.5%
52%
57.85
57.6%
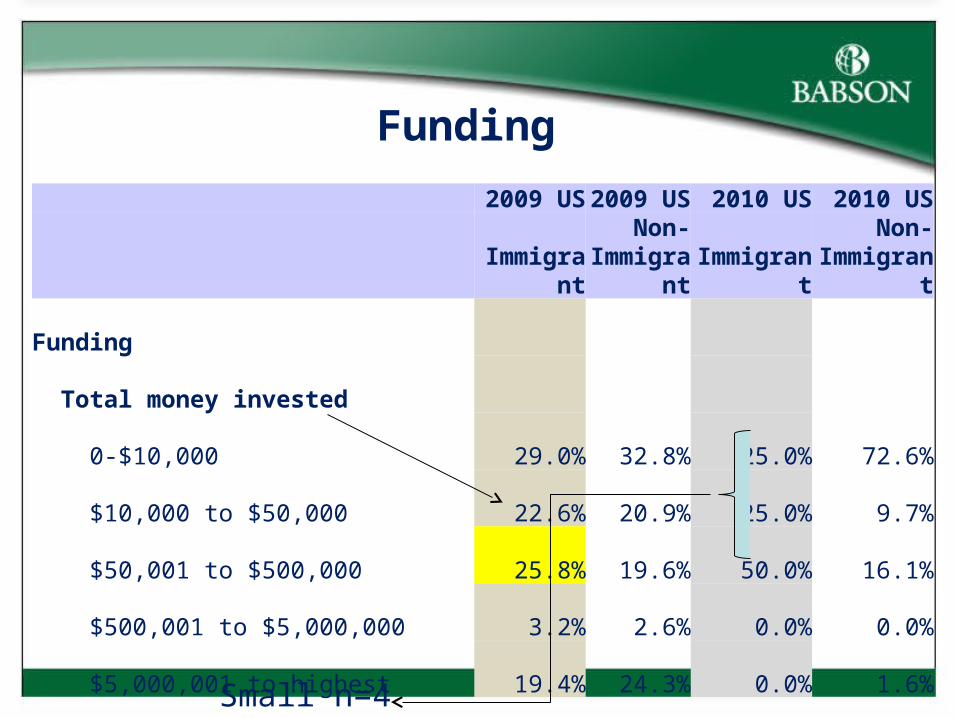
Funding
2009 US 2009 US 2010 US 2010 US
ImmigrantNon-
Immigrant ImmigrantNon-
Immigrant
Funding
Total money invested
0-$10,000 29.0% 32.8% 25.0% 72.6%
$10,000 to $50,000 22.6% 20.9% 25.0% 9.7%
$50,001 to $500,000 25.8% 19.6% 50.0% 16.1%
$500,001 to $5,000,000 3.2% 2.6% 0.0% 0.0%
$5,000,001 to highest 19.4% 24.3% 0.0% 1.6%
Small n=4
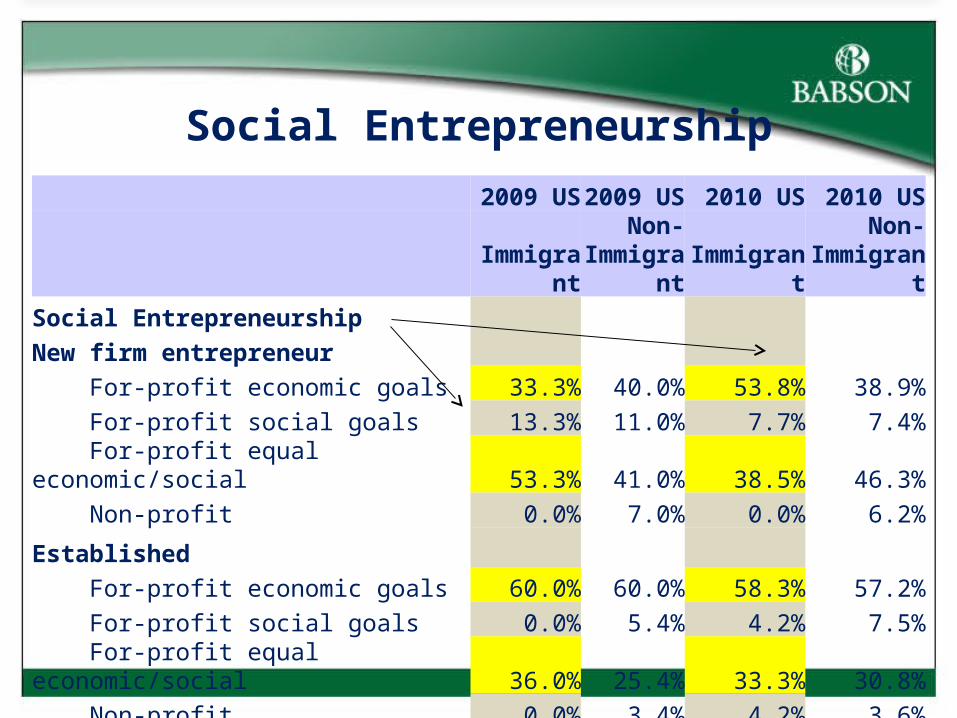
Social Entrepreneurship
2009 US 2009 US 2010 US 2010 US
ImmigrantNon-
Immigrant ImmigrantNon-
ImmigrantSocial Entrepreneurship New firm entrepreneur For-profit economic goals 33.3% 40.0% 53.8% 38.9% For-profit social goals 13.3% 11.0% 7.7% 7.4% For-profit equal economic/social 53.3% 41.0% 38.5% 46.3% Non-profit 0.0% 7.0% 0.0% 6.2%
Established For-profit economic goals 60.0% 60.0% 58.3% 57.2% For-profit social goals 0.0% 5.4% 4.2% 7.5% For-profit equal economic/social 36.0% 25.4% 33.3% 30.8% Non-profit 0.0% 3.4% 4.2% 3.6%
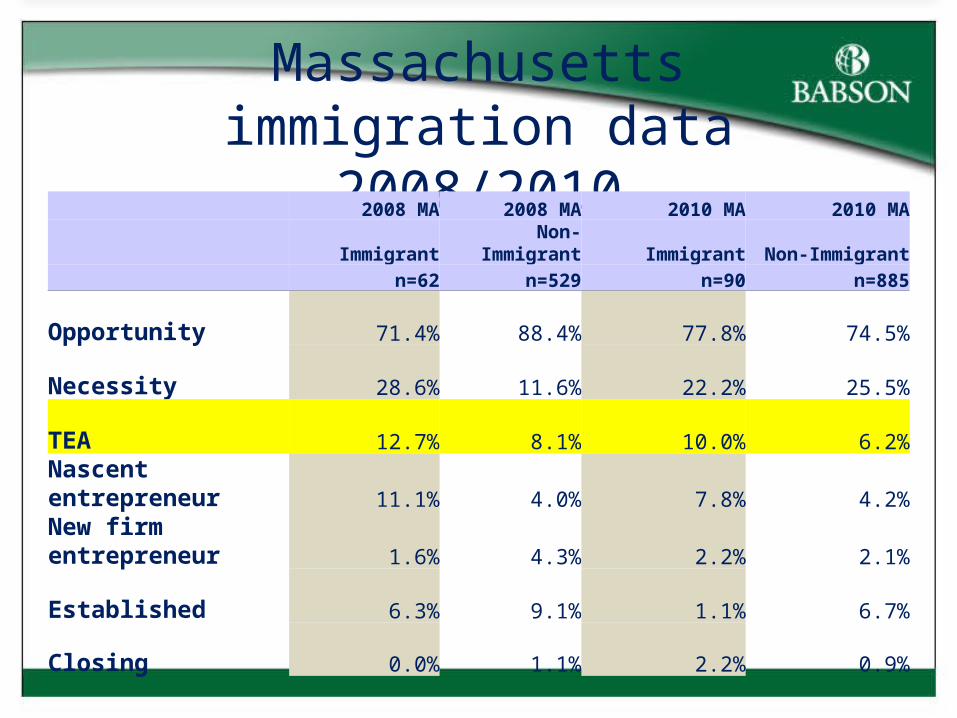
Massachusetts immigration data 2008/2010
2008 MA 2008 MA 2010 MA 2010 MA
Immigrant Non-Immigrant Immigrant Non-Immigrant n=62 n=529 n=90 n=885
Opportunity 71.4% 88.4% 77.8% 74.5%
Necessity 28.6% 11.6% 22.2% 25.5%
TEA 12.7% 8.1% 10.0% 6.2%
Nascent entrepreneur 11.1% 4.0% 7.8% 4.2%
New firm entrepreneur 1.6% 4.3% 2.2% 2.1%
Established 6.3% 9.1% 1.1% 6.7%
Closing 0.0% 1.1% 2.2% 0.9%
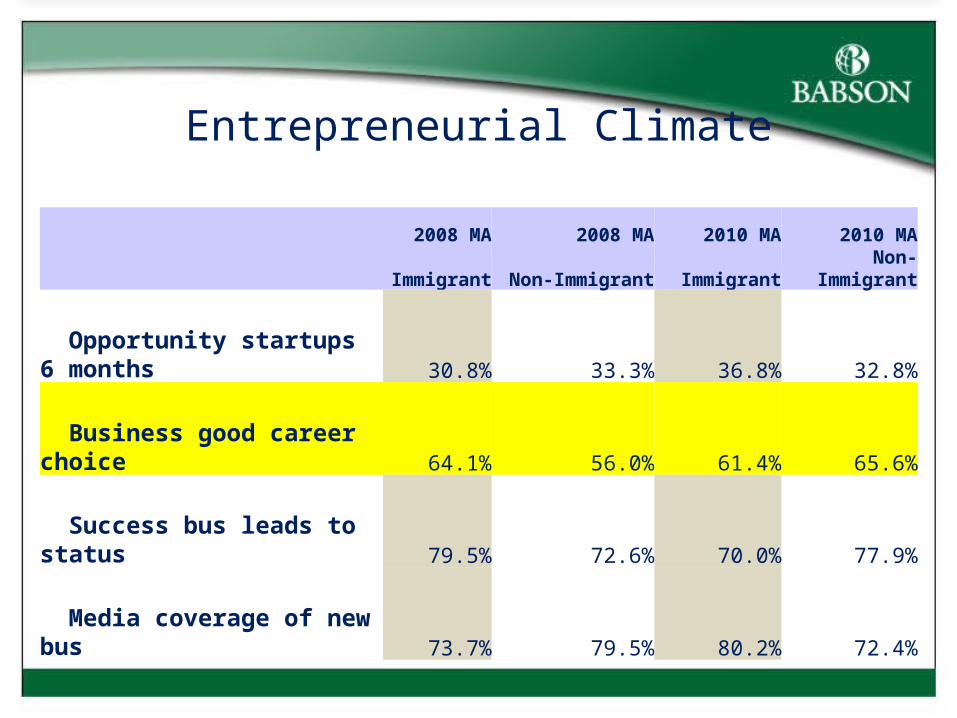
Entrepreneurial Climate
2008 MA 2008 MA 2010 MA 2010 MA
Immigrant Non-Immigrant Immigrant Non-Immigrant
Opportunity startups 6 months 30.8% 33.3% 36.8% 32.8%
Business good career choice 64.1% 56.0% 61.4% 65.6%
Success bus leads to status 79.5% 72.6% 70.0% 77.9%
Media coverage of new bus 73.7% 79.5% 80.2% 72.4%
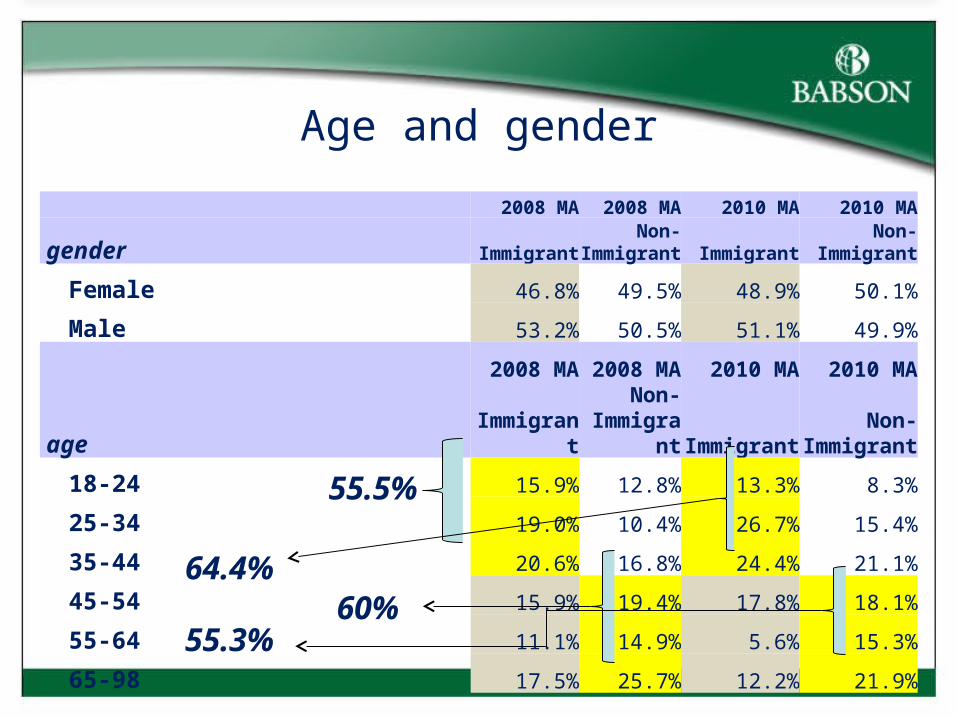
Age and gender
2008 MA 2008 MA 2010 MA 2010 MA
gender ImmigrantNon-
Immigrant ImmigrantNon-
Immigrant
Female 46.8% 49.5% 48.9% 50.1%
Male 53.2% 50.5% 51.1% 49.9%
2008 MA 2008 MA 2010 MA 2010 MA
age ImmigrantNon-
Immigrant ImmigrantNon-
Immigrant
18-24 15.9% 12.8% 13.3% 8.3%
25-34 19.0% 10.4% 26.7% 15.4%
35-44 20.6% 16.8% 24.4% 21.1%
45-54 15.9% 19.4% 17.8% 18.1%
55-64 11.1% 14.9% 5.6% 15.3%
65-98 17.5% 25.7% 12.2% 21.9%
55.5%
60%64.4%
55.3%
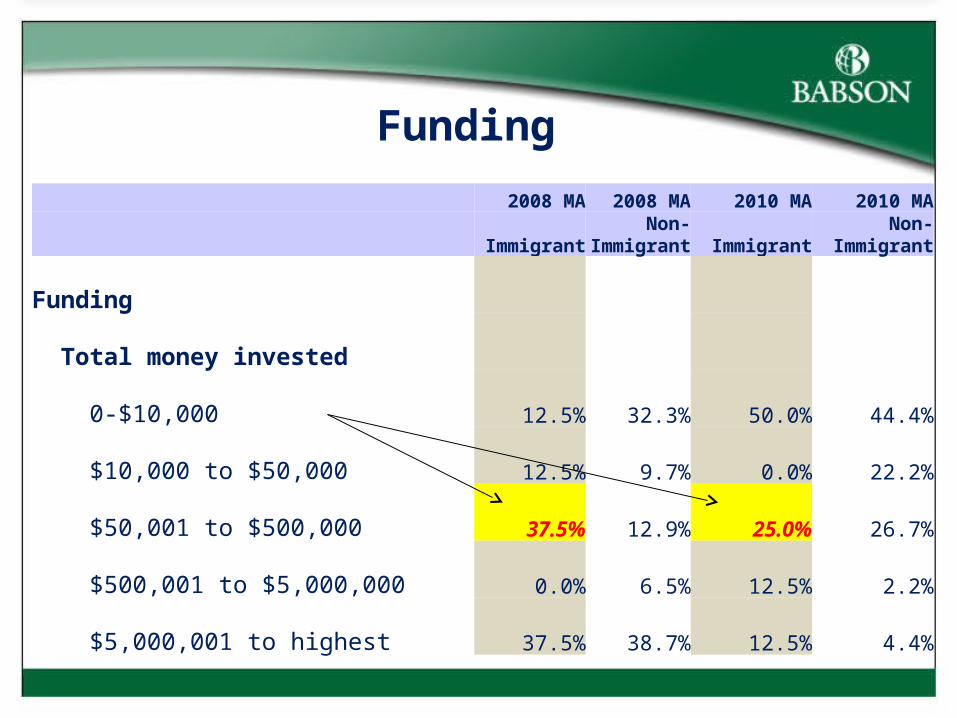
Funding
2008 MA 2008 MA 2010 MA 2010 MA
ImmigrantNon-
Immigrant Immigrant Non-Immigrant
Funding
Total money invested
0-$10,000 12.5% 32.3% 50.0% 44.4%
$10,000 to $50,000 12.5% 9.7% 0.0% 22.2%
$50,001 to $500,000 37.5% 12.9% 25.0% 26.7%
$500,001 to $5,000,000 0.0% 6.5% 12.5% 2.2%
$5,000,001 to highest 37.5% 38.7% 12.5% 4.4%
Social Entrepreneurship
2008 MA 2008 MA 2010 MA 2010 MA
ImmigrantNon-
Immigrant ImmigrantNon-Immigrant
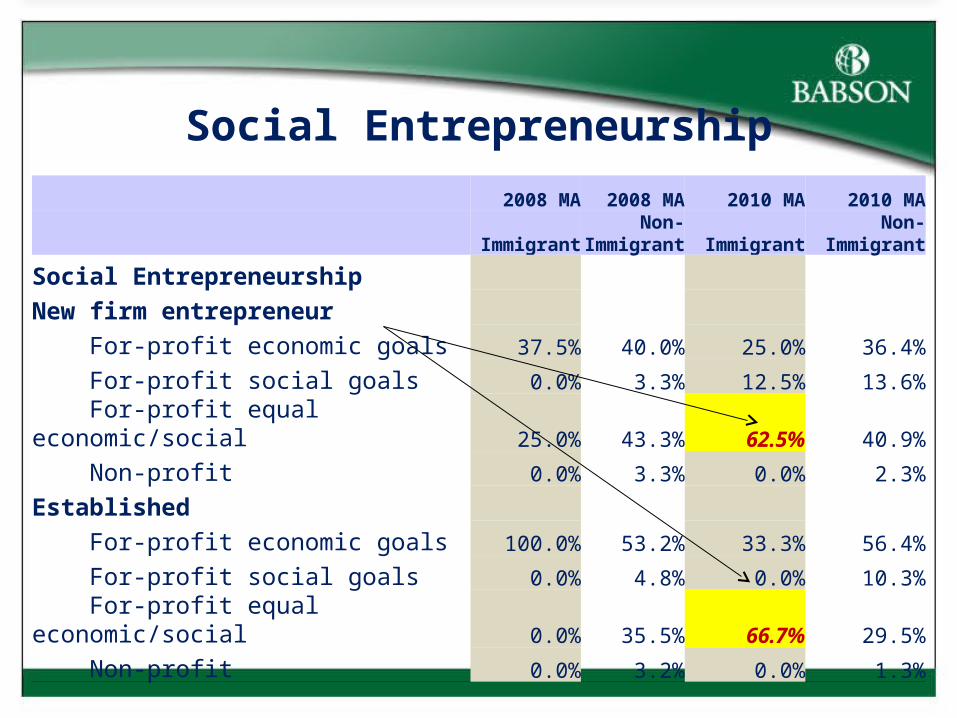
Social Entrepreneurship
New firm entrepreneur
For-profit economic goals 37.5% 40.0% 25.0% 36.4%
For-profit social goals 0.0% 3.3% 12.5% 13.6%
For-profit equal economic/social 25.0% 43.3% 62.5% 40.9%
Non-profit 0.0% 3.3% 0.0% 2.3%
Established
For-profit economic goals 100.0% 53.2% 33.3% 56.4%
For-profit social goals 0.0% 4.8% 0.0% 10.3%
For-profit equal economic/social 0.0% 35.5% 66.7% 29.5%
Non-profit 0.0% 3.2% 0.0% 1.3%
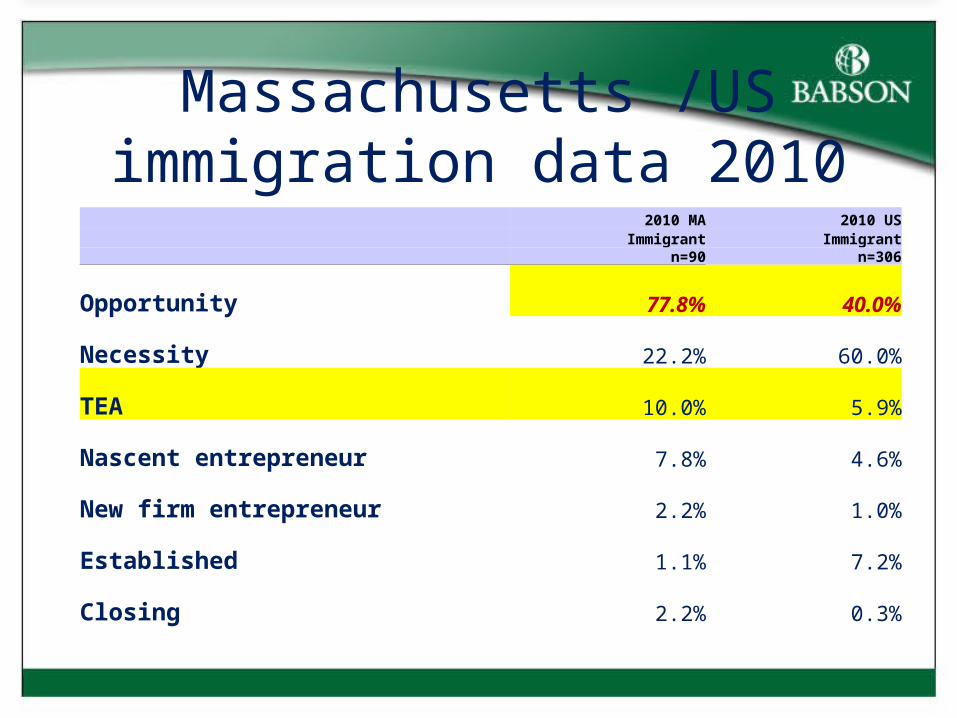
Massachusetts /US immigration data 2010
2010 MA 2010 US Immigrant Immigrant n=90 n=306
Opportunity 77.8% 40.0%
Necessity 22.2% 60.0%
TEA 10.0% 5.9%
Nascent entrepreneur 7.8% 4.6%
New firm entrepreneur 2.2% 1.0%
Established 1.1% 7.2%
Closing 2.2% 0.3%
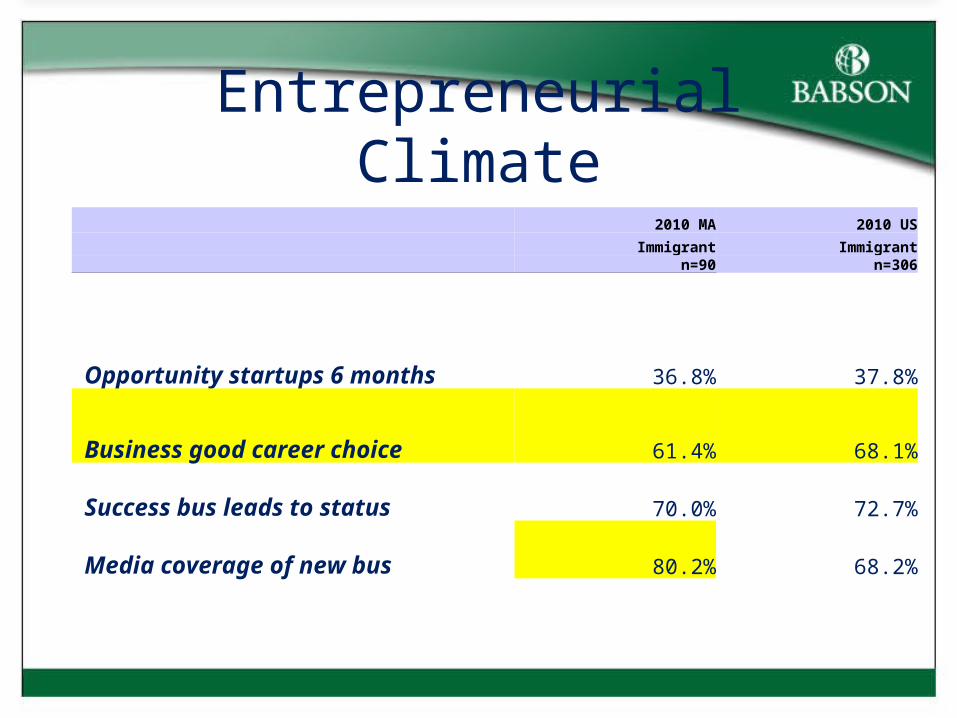
Entrepreneurial Climate
2010 MA 2010 US
Immigrant Immigrant n=90 n=306
Opportunity startups 6 months 36.8% 37.8%
Business good career choice 61.4% 68.1%
Success bus leads to status 70.0% 72.7%
Media coverage of new bus 80.2% 68.2%
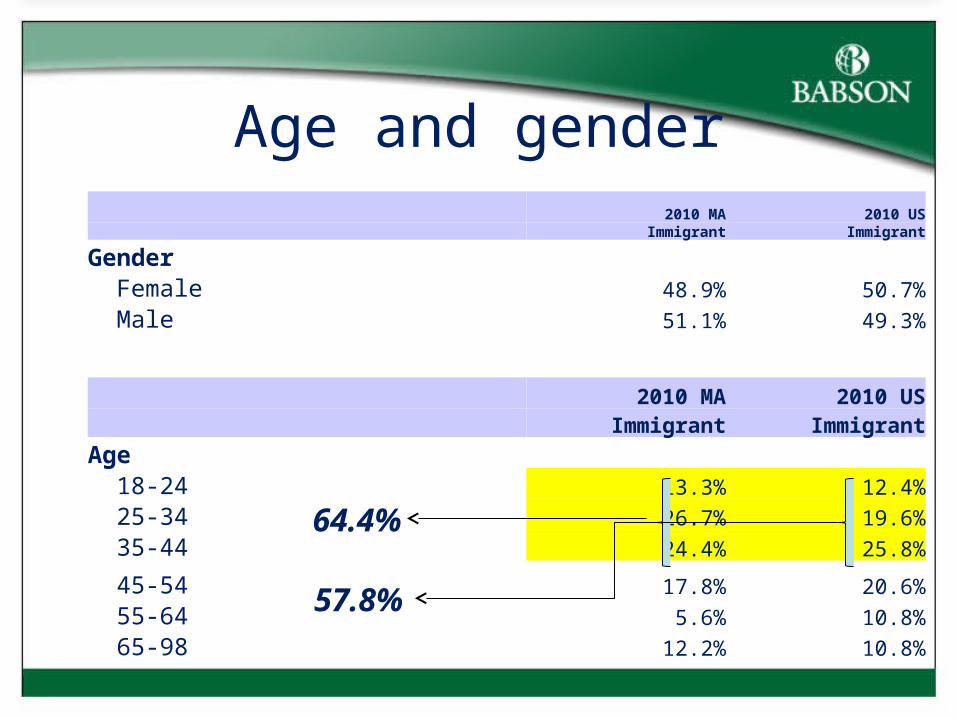
Age and gender 2010 MA 2010 US Immigrant Immigrant
Gender Female 48.9% 50.7% Male 51.1% 49.3%
2010 MA 2010 US Immigrant ImmigrantAge 18-24 13.3% 12.4% 25-34 26.7% 19.6% 35-44 24.4% 25.8%
45-54 17.8% 20.6% 55-64 5.6% 10.8% 65-98 12.2% 10.8%
64.4%
57.8%
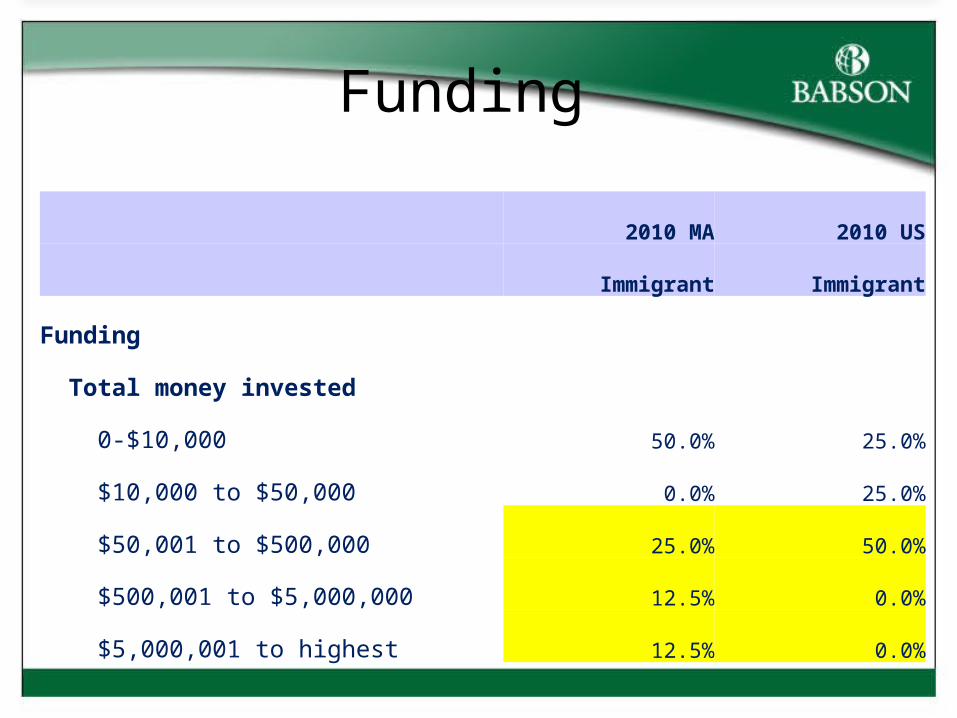
Funding
2010 MA 2010 US
Immigrant Immigrant
Funding
Total money invested
0-$10,000 50.0% 25.0%
$10,000 to $50,000 0.0% 25.0%
$50,001 to $500,000 25.0% 50.0%
$500,001 to $5,000,000 12.5% 0.0%
$5,000,001 to highest 12.5% 0.0%
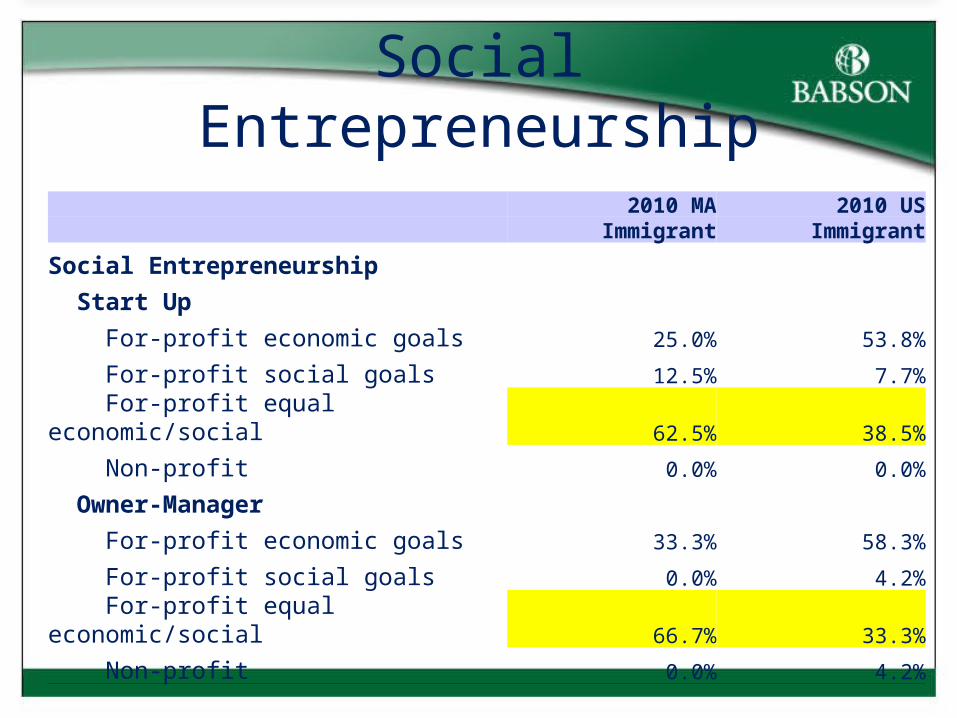
Social Entrepreneurship
2010 MA 2010 US Immigrant Immigrant
Social Entrepreneurship Start Up For-profit economic goals 25.0% 53.8%
For-profit social goals 12.5% 7.7%
For-profit equal economic/social 62.5% 38.5%
Non-profit 0.0% 0.0%
Owner-Manager For-profit economic goals 33.3% 58.3%
For-profit social goals 0.0% 4.2%
For-profit equal economic/social 66.7% 33.3%
Non-profit 0.0% 4.2%
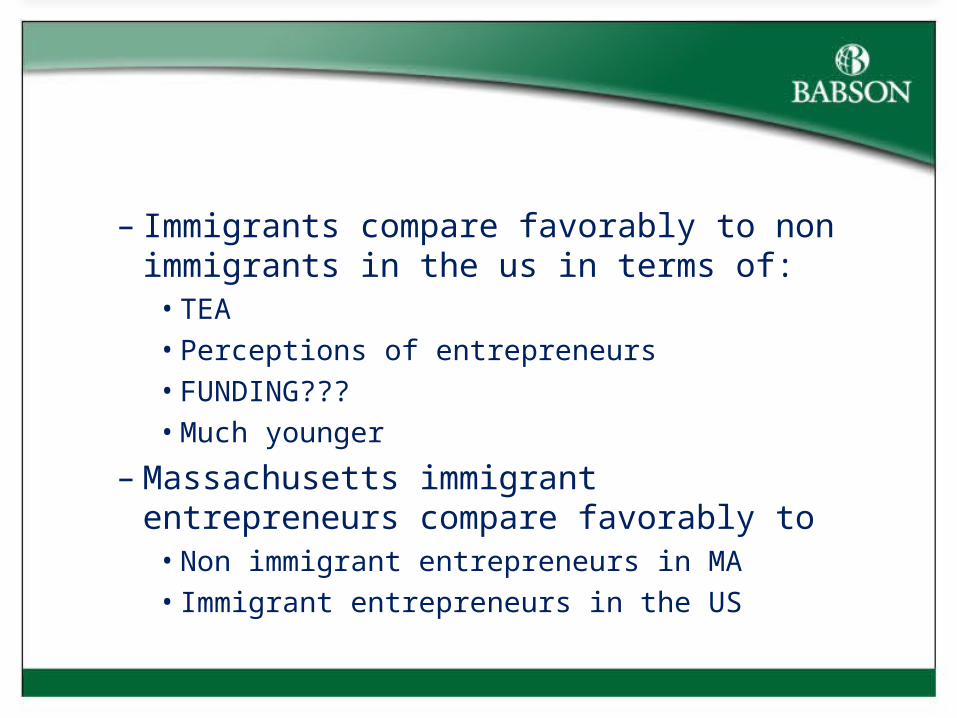
– Immigrants compare favorably to non immigrants in the us in terms of:
• TEA• Perceptions of entrepreneurs• FUNDING???• Much younger
– Massachusetts immigrant entrepreneurs compare favorably to
• Non immigrant entrepreneurs in MA• Immigrant entrepreneurs in the US
• Immigrants clearly contributing to wealth and entrepreneurial activity in the US and in Massachusetts